Matador, TX
Matador Map
Matador Overview
747
TOTAL POPULATION
414
MALE POPULATION
333
FEMALE POPULATION
124.32
MALES / 100 FEMALES
80.43
FEMALES / 100 MALES
37.8
MEDIAN AGE
3.5
AVG FAMILY SIZE
2.7
AVG HOUSEHOLD SIZE
$28,710
PER CAPITA INCOME
$71,908
AVG FAMILY INCOME
$70,132
AVG HOUSEHOLD INCOME
18.3%
WAGE / INCOME GAP [ % ]
81.7¢/ $1
WAGE / INCOME GAP [ $ ]
0.34
INEQUALITY / GINI INDEX
361
LABOR FORCE [ PEOPLE ]
61.6%
PERCENT IN LABOR FORCE
5.0%
UNEMPLOYMENT RATE
Matador Zip Codes
Matador Area Codes
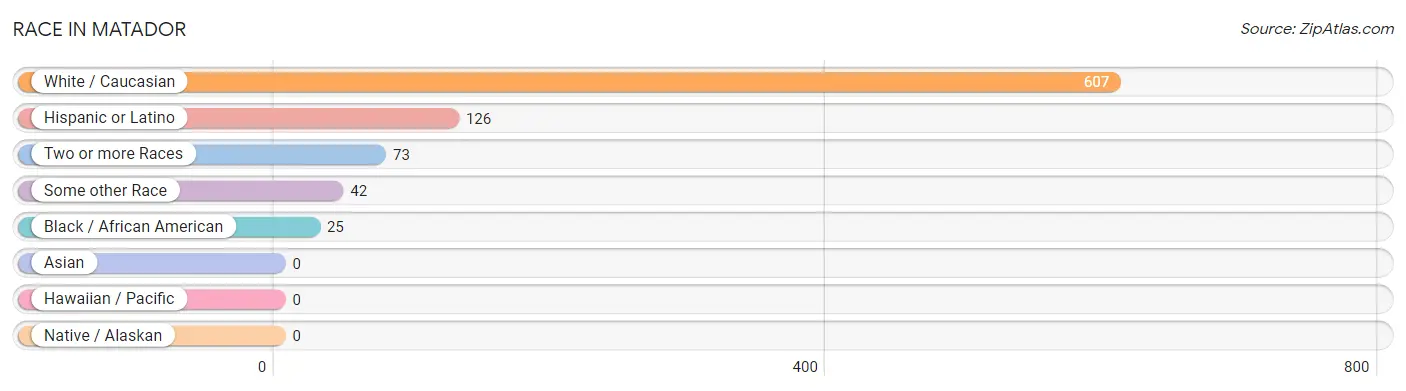
Race in Matador
The most populous races in Matador are White / Caucasian (607 | 81.3%), Hispanic or Latino (126 | 16.9%), and Two or more Races (73 | 9.8%).
| Race | # Population | % Population |
| Asian | 0 | 0.0% |
| Black / African American | 25 | 3.4% |
| Hawaiian / Pacific | 0 | 0.0% |
| Hispanic or Latino | 126 | 16.9% |
| Native / Alaskan | 0 | 0.0% |
| White / Caucasian | 607 | 81.3% |
| Two or more Races | 73 | 9.8% |
| Some other Race | 42 | 5.6% |
| Total | 747 | 100.0% |
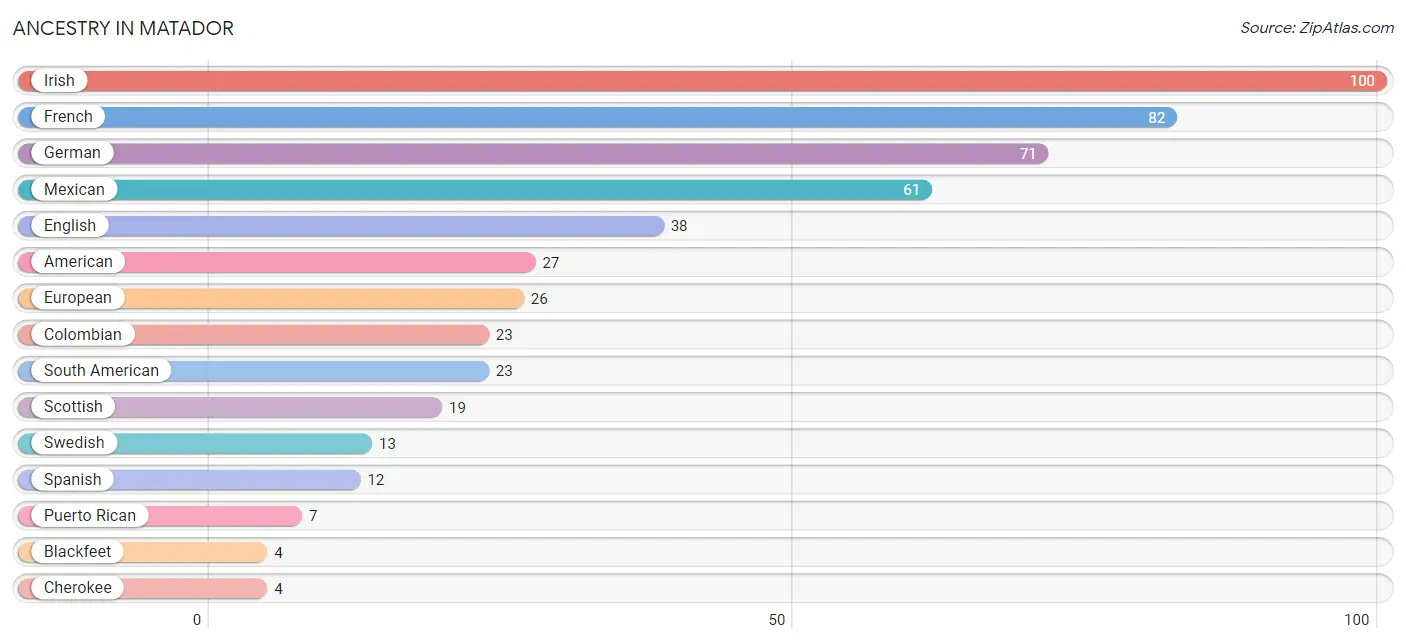
Ancestry in Matador
The most populous ancestries reported in Matador are Irish (100 | 13.4%), French (82 | 11.0%), German (71 | 9.5%), Mexican (61 | 8.2%), and English (38 | 5.1%), together accounting for 47.1% of all Matador residents.
| Ancestry | # Population | % Population |
| American | 27 | 3.6% |
| Apache | 3 | 0.4% |
| Blackfeet | 4 | 0.5% |
| Cherokee | 4 | 0.5% |
| Colombian | 23 | 3.1% |
| English | 38 | 5.1% |
| European | 26 | 3.5% |
| French | 82 | 11.0% |
| German | 71 | 9.5% |
| Irish | 100 | 13.4% |
| Mexican | 61 | 8.2% |
| Puerto Rican | 7 | 0.9% |
| Scottish | 19 | 2.5% |
| South American | 23 | 3.1% |
| Spanish | 12 | 1.6% |
| Swedish | 13 | 1.7% | View All 16 Rows |
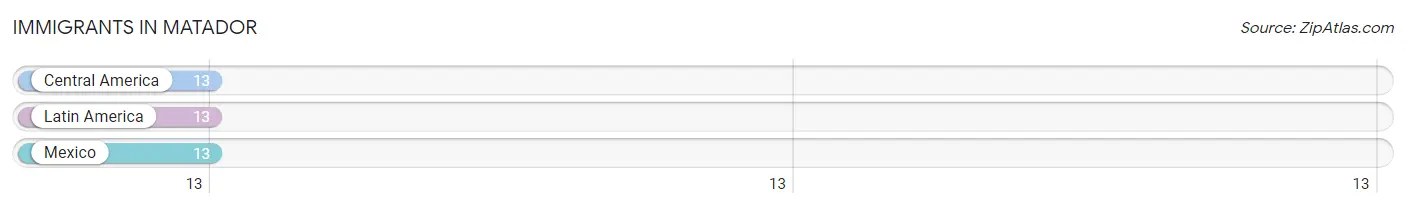
Immigrants in Matador
The most numerous immigrant groups reported in Matador came from Central America (13 | 1.7%), Latin America (13 | 1.7%), and Mexico (13 | 1.7%), together accounting for 5.2% of all Matador residents.
| Immigration Origin | # Population | % Population |
| Central America | 13 | 1.7% |
| Latin America | 13 | 1.7% |
| Mexico | 13 | 1.7% | View All 3 Rows |
Sex and Age in Matador
Sex and Age in Matador
The most populous age groups in Matador are 25 to 29 Years (49 | 11.8%) for men and 25 to 29 Years (53 | 15.9%) for women.
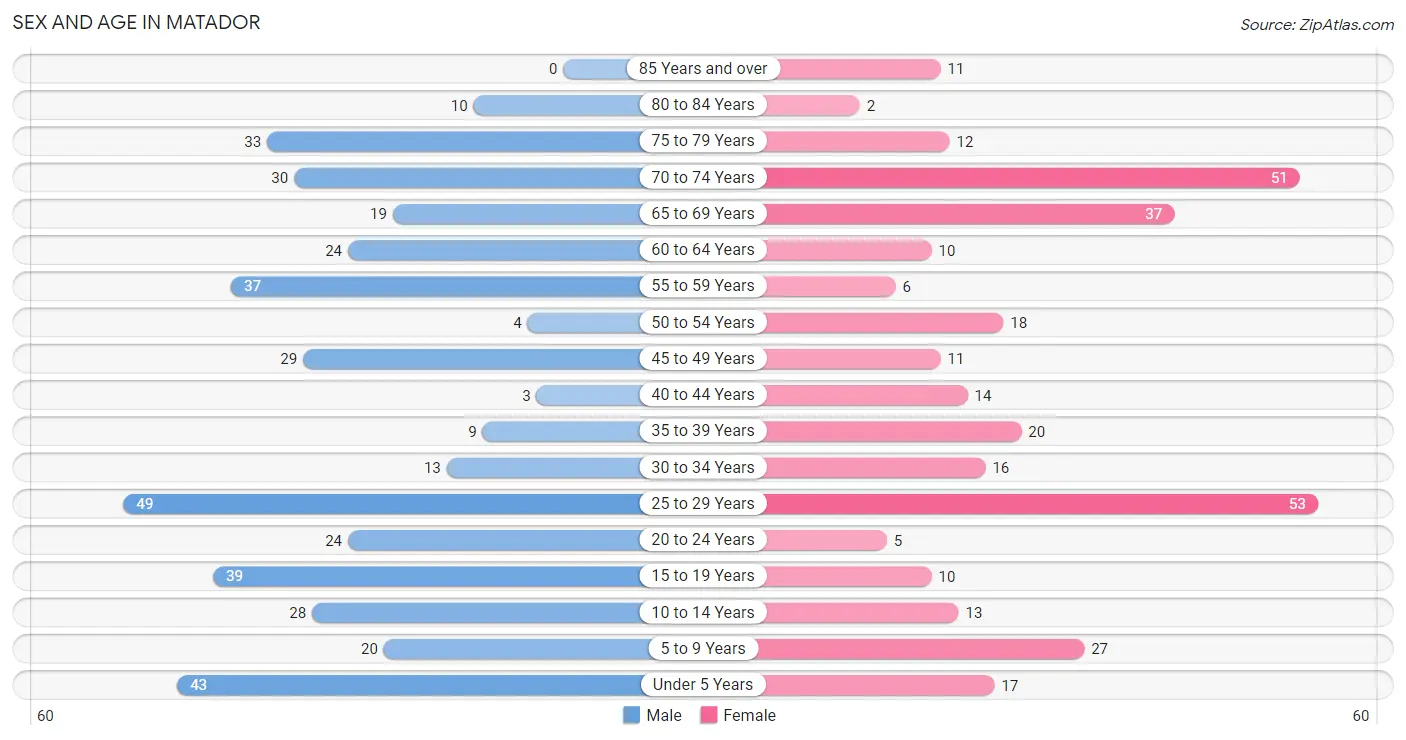
| Age Bracket | Male | Female |
| Under 5 Years | 43 (10.4%) | 17 (5.1%) |
| 5 to 9 Years | 20 (4.8%) | 27 (8.1%) |
| 10 to 14 Years | 28 (6.8%) | 13 (3.9%) |
| 15 to 19 Years | 39 (9.4%) | 10 (3.0%) |
| 20 to 24 Years | 24 (5.8%) | 5 (1.5%) |
| 25 to 29 Years | 49 (11.8%) | 53 (15.9%) |
| 30 to 34 Years | 13 (3.1%) | 16 (4.8%) |
| 35 to 39 Years | 9 (2.2%) | 20 (6.0%) |
| 40 to 44 Years | 3 (0.7%) | 14 (4.2%) |
| 45 to 49 Years | 29 (7.0%) | 11 (3.3%) |
| 50 to 54 Years | 4 (1.0%) | 18 (5.4%) |
| 55 to 59 Years | 37 (8.9%) | 6 (1.8%) |
| 60 to 64 Years | 24 (5.8%) | 10 (3.0%) |
| 65 to 69 Years | 19 (4.6%) | 37 (11.1%) |
| 70 to 74 Years | 30 (7.2%) | 51 (15.3%) |
| 75 to 79 Years | 33 (8.0%) | 12 (3.6%) |
| 80 to 84 Years | 10 (2.4%) | 2 (0.6%) |
| 85 Years and over | 0 (0.0%) | 11 (3.3%) |
| Total | 414 (100.0%) | 333 (100.0%) |
Families and Households in Matador
Median Family Size in Matador
The median family size in Matador is 3.46 persons per family, with single male/father families (4 | 2.2%) accounting for the largest median family size of 11.25 persons per family. On the other hand, married-couple families (147 | 82.1%) represent the smallest median family size with 2.94 persons per family.
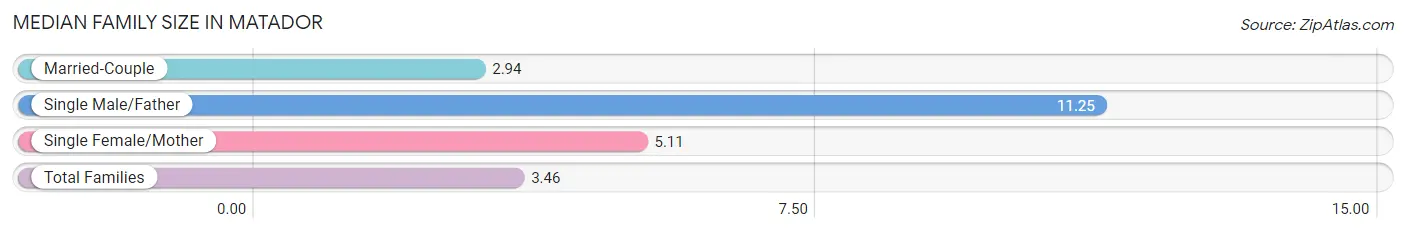
| Family Type | # Families | Family Size |
| Married-Couple | 147 (82.1%) | 2.94 |
| Single Male/Father | 4 (2.2%) | 11.25 |
| Single Female/Mother | 28 (15.6%) | 5.11 |
| Total Families | 179 (100.0%) | 3.46 |
Median Household Size in Matador
The median household size in Matador is 2.73 persons per household, with single male/father households (4 | 1.5%) accounting for the largest median household size of 11.25 persons per household. non-family households (95 | 34.7%) represent the smallest median household size with 1.34 persons per household.
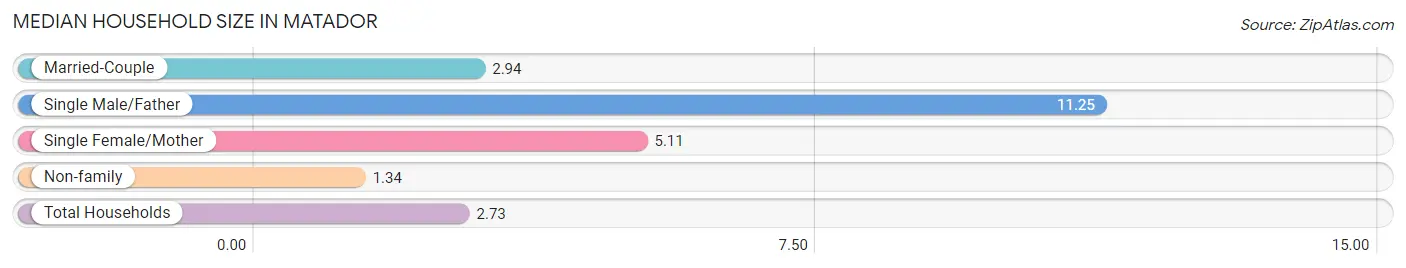
| Household Type | # Households | Household Size |
| Married-Couple | 147 (53.6%) | 2.94 |
| Single Male/Father | 4 (1.5%) | 11.25 |
| Single Female/Mother | 28 (10.2%) | 5.11 |
| Non-family | 95 (34.7%) | 1.34 |
| Total Households | 274 (100.0%) | 2.73 |
Household Size by Marriage Status in Matador
Out of a total of 274 households in Matador, 179 (65.3%) are family households, while 95 (34.7%) are nonfamily households. The most numerous type of family households are 2-person households, comprising 114, and the most common type of nonfamily households are 1-person households, comprising 59.
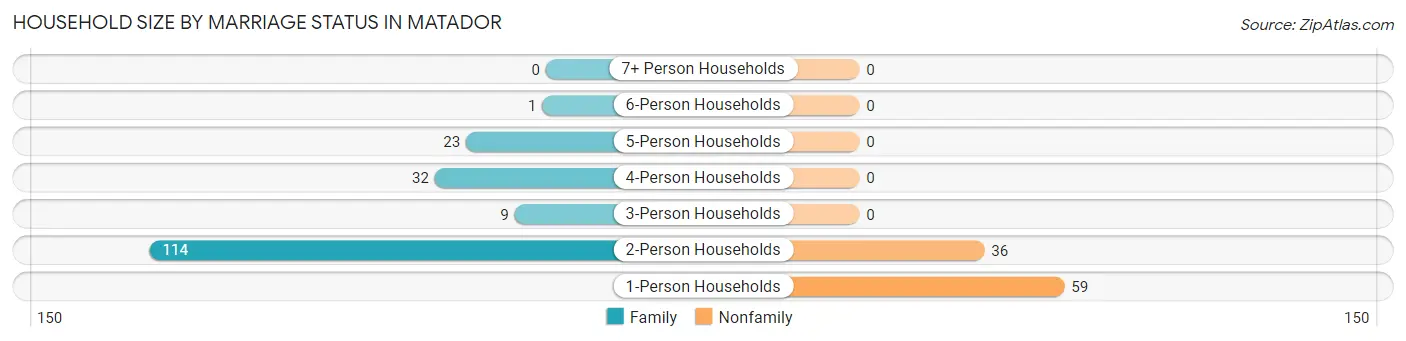
| Household Size | Family Households | Nonfamily Households |
| 1-Person Households | - | 59 (21.5%) |
| 2-Person Households | 114 (41.6%) | 36 (13.1%) |
| 3-Person Households | 9 (3.3%) | 0 (0.0%) |
| 4-Person Households | 32 (11.7%) | 0 (0.0%) |
| 5-Person Households | 23 (8.4%) | 0 (0.0%) |
| 6-Person Households | 1 (0.4%) | 0 (0.0%) |
| 7+ Person Households | 0 (0.0%) | 0 (0.0%) |
| Total | 179 (65.3%) | 95 (34.7%) |
Female Fertility in Matador
Fertility by Age in Matador
Average fertility rate in Matador is 85.0 births per 1,000 women. Women in the age bracket of 20 to 34 years have the highest fertility rate with 149.0 births per 1,000 women. Women in the age bracket of 20 to 34 years acount for 100.0% of all women with births.
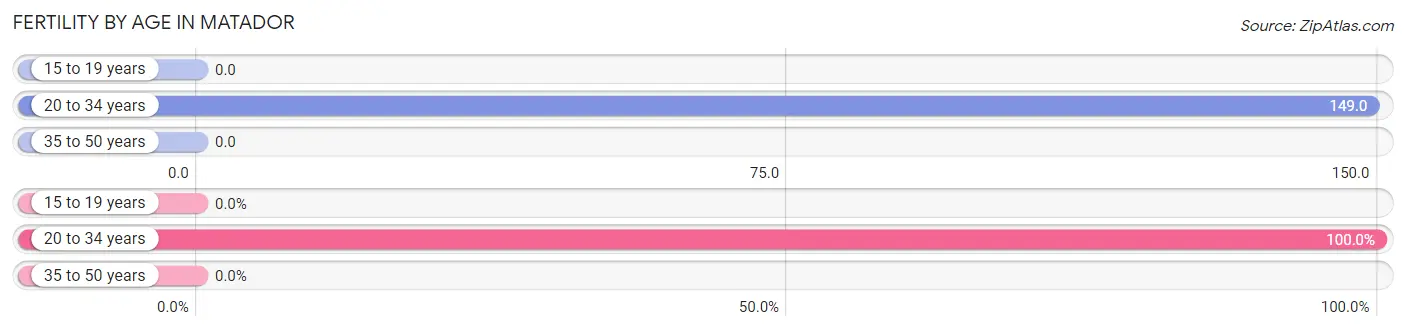
| Age Bracket | Women with Births | Births / 1,000 Women |
| 15 to 19 years | 0 (0.0%) | 0.0 |
| 20 to 34 years | 11 (100.0%) | 149.0 |
| 35 to 50 years | 0 (0.0%) | 0.0 |
| Total | 11 (100.0%) | 85.0 |
Fertility by Age by Marriage Status in Matador
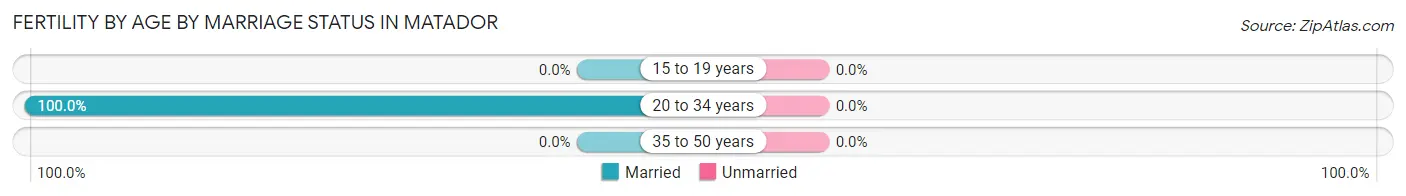
| Age Bracket | Married | Unmarried |
| 15 to 19 years | 0 (0.0%) | 0 (0.0%) |
| 20 to 34 years | 11 (100.0%) | 0 (0.0%) |
| 35 to 50 years | 0 (0.0%) | 0 (0.0%) |
| Total | 11 (100.0%) | 0 (0.0%) |
Fertility by Education in Matador
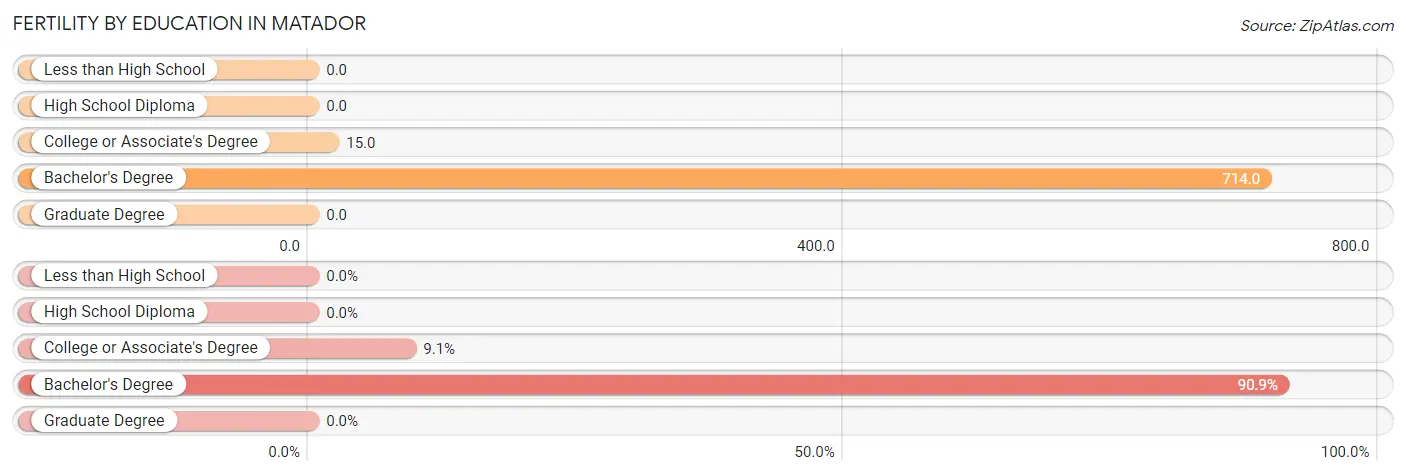
| Educational Attainment | Women with Births | Births / 1,000 Women |
| Less than High School | 0 (0.0%) | 0.0 |
| High School Diploma | 0 (0.0%) | 0.0 |
| College or Associate's Degree | 1 (9.1%) | 15.0 |
| Bachelor's Degree | 10 (90.9%) | 714.0 |
| Graduate Degree | 0 (0.0%) | 0.0 |
| Total | 11 (100.0%) | 85.0 |
Fertility by Education by Marriage Status in Matador
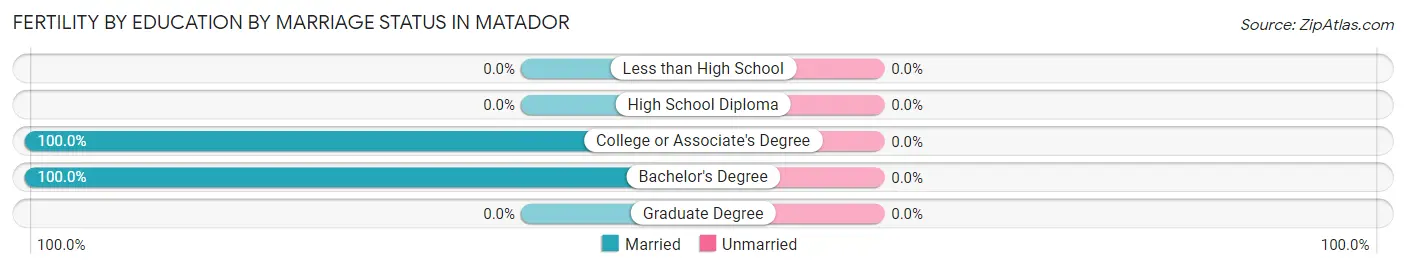
| Educational Attainment | Married | Unmarried |
| Less than High School | 0 (0.0%) | 0 (0.0%) |
| High School Diploma | 0 (0.0%) | 0 (0.0%) |
| College or Associate's Degree | 1 (100.0%) | 0 (0.0%) |
| Bachelor's Degree | 10 (100.0%) | 0 (0.0%) |
| Graduate Degree | 0 (0.0%) | 0 (0.0%) |
| Total | 11 (100.0%) | 0 (0.0%) |
Income in Matador
Income Overview in Matador
Per Capita Income in Matador is $28,710, while median incomes of families and households are $71,908 and $70,132 respectively.
| Characteristic | Number | Measure |
| Per Capita Income | 747 | $28,710 |
| Median Family Income | 179 | $71,908 |
| Mean Family Income | 179 | $85,108 |
| Median Household Income | 274 | $70,132 |
| Mean Household Income | 274 | $75,258 |
| Income Deficit | 179 | $0 |
| Wage / Income Gap (%) | 747 | 18.27% |
| Wage / Income Gap ($) | 747 | 81.73¢ per $1 |
| Gini / Inequality Index | 747 | 0.34 |
Earnings by Sex in Matador
Average Earnings in Matador are $29,021, $32,500 for men and $26,563 for women, a difference of 18.3%.
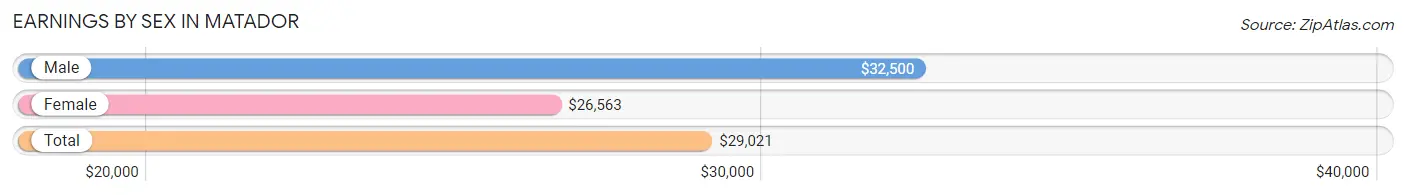
| Sex | Number | Average Earnings |
| Male | 236 (58.9%) | $32,500 |
| Female | 165 (41.1%) | $26,563 |
| Total | 401 (100.0%) | $29,021 |
Earnings by Sex by Income Bracket in Matador
The most common earnings brackets in Matador are $25,000 to $29,999 for men (44 | 18.6%) and $55,000 to $64,999 for women (34 | 20.6%).
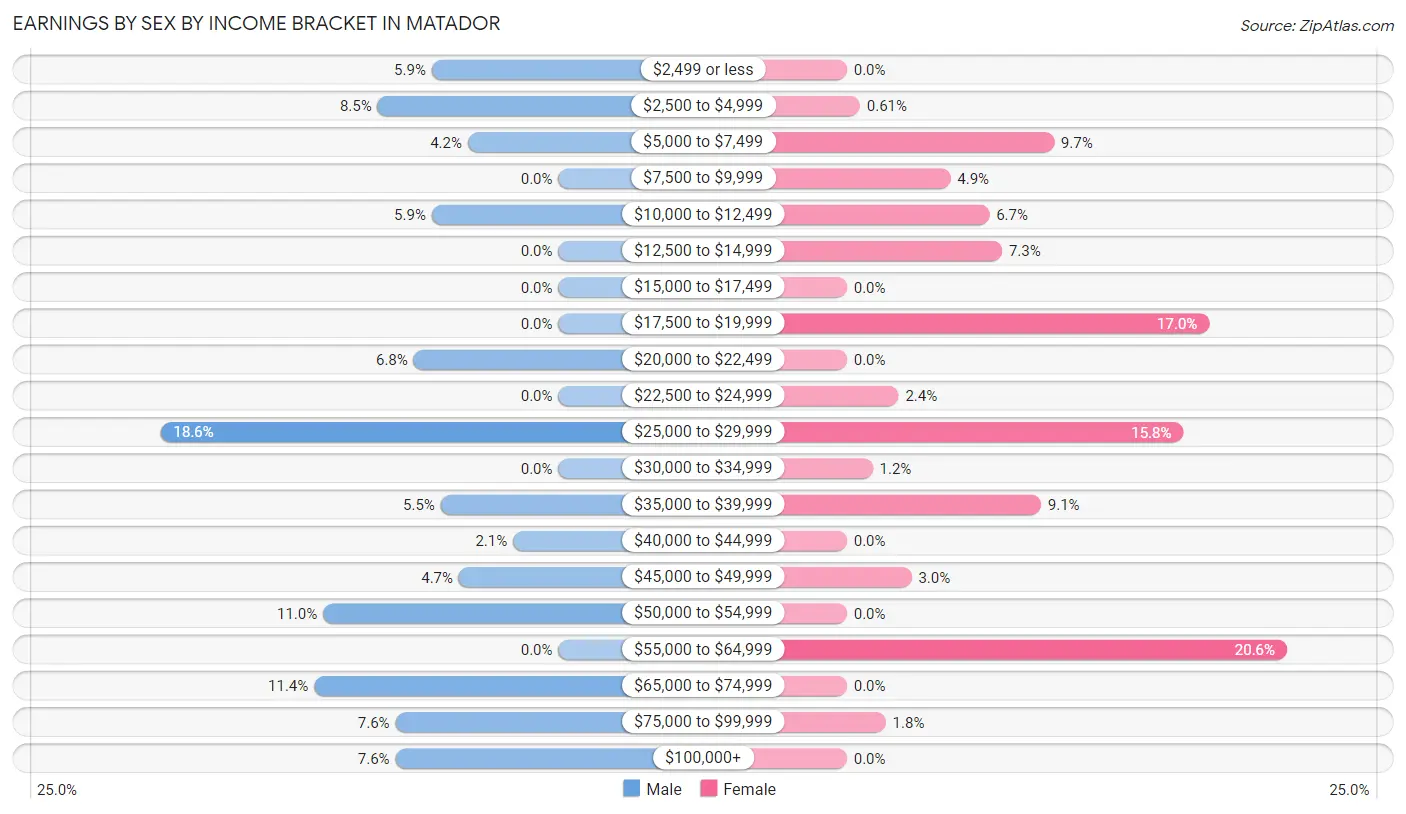
| Income | Male | Female |
| $2,499 or less | 14 (5.9%) | 0 (0.0%) |
| $2,500 to $4,999 | 20 (8.5%) | 1 (0.6%) |
| $5,000 to $7,499 | 10 (4.2%) | 16 (9.7%) |
| $7,500 to $9,999 | 0 (0.0%) | 8 (4.9%) |
| $10,000 to $12,499 | 14 (5.9%) | 11 (6.7%) |
| $12,500 to $14,999 | 0 (0.0%) | 12 (7.3%) |
| $15,000 to $17,499 | 0 (0.0%) | 0 (0.0%) |
| $17,500 to $19,999 | 0 (0.0%) | 28 (17.0%) |
| $20,000 to $22,499 | 16 (6.8%) | 0 (0.0%) |
| $22,500 to $24,999 | 0 (0.0%) | 4 (2.4%) |
| $25,000 to $29,999 | 44 (18.6%) | 26 (15.8%) |
| $30,000 to $34,999 | 0 (0.0%) | 2 (1.2%) |
| $35,000 to $39,999 | 13 (5.5%) | 15 (9.1%) |
| $40,000 to $44,999 | 5 (2.1%) | 0 (0.0%) |
| $45,000 to $49,999 | 11 (4.7%) | 5 (3.0%) |
| $50,000 to $54,999 | 26 (11.0%) | 0 (0.0%) |
| $55,000 to $64,999 | 0 (0.0%) | 34 (20.6%) |
| $65,000 to $74,999 | 27 (11.4%) | 0 (0.0%) |
| $75,000 to $99,999 | 18 (7.6%) | 3 (1.8%) |
| $100,000+ | 18 (7.6%) | 0 (0.0%) |
| Total | 236 (100.0%) | 165 (100.0%) |
Earnings by Sex by Educational Attainment in Matador
Average earnings in Matador are $37,308 for men and $27,670 for women, a difference of 25.8%. Men with an educational attainment of graduate degree enjoy the highest average annual earnings of $54,722, while those with college or associate's degree education earn the least with $28,787. Women with an educational attainment of high school diploma earn the most with the average annual earnings of $23,750, while those with high school diploma education have the smallest earnings of $23,750.
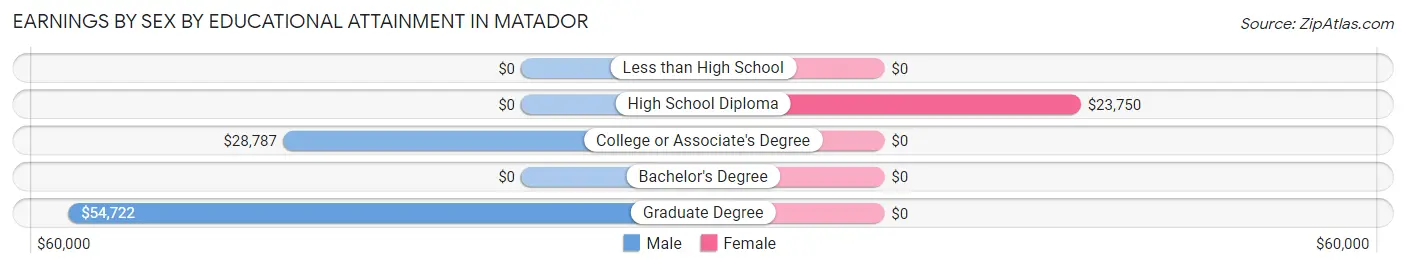
| Educational Attainment | Male Income | Female Income |
| Less than High School | - | - |
| High School Diploma | - | - |
| College or Associate's Degree | $28,787 | $0 |
| Bachelor's Degree | - | - |
| Graduate Degree | $54,722 | $0 |
| Total | $37,308 | $27,670 |
Family Income in Matador
Family Income Brackets in Matador
According to the Matador family income data, there are 80 families falling into the $50,000 to $74,999 income range, which is the most common income bracket and makes up 44.7% of all families.
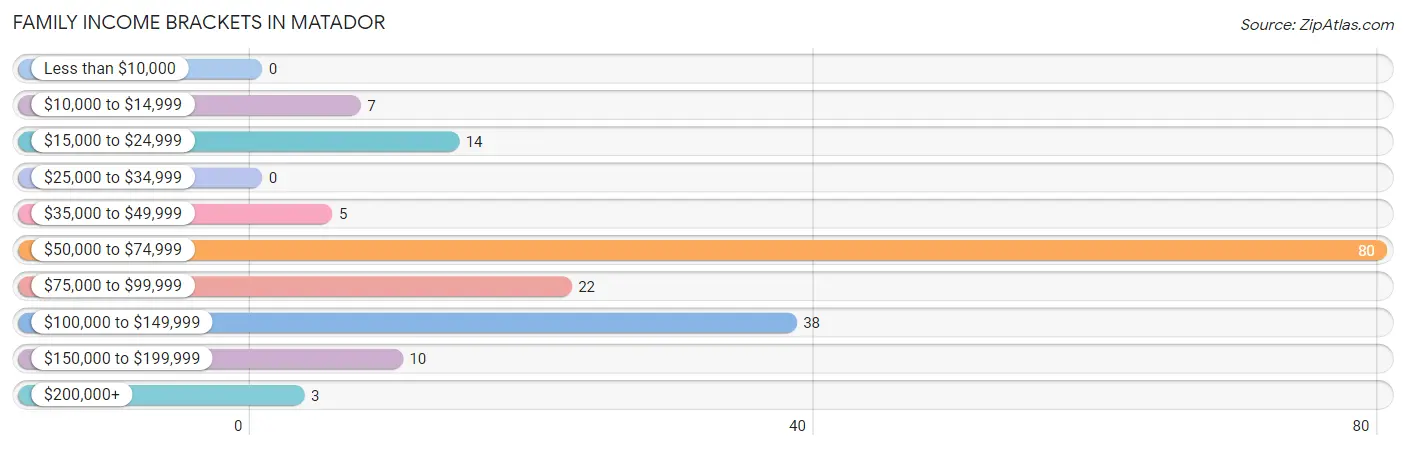
| Income Bracket | # Families | % Families |
| Less than $10,000 | 0 | 0.0% |
| $10,000 to $14,999 | 7 | 3.9% |
| $15,000 to $24,999 | 14 | 7.8% |
| $25,000 to $34,999 | 0 | 0.0% |
| $35,000 to $49,999 | 5 | 2.8% |
| $50,000 to $74,999 | 80 | 44.7% |
| $75,000 to $99,999 | 22 | 12.3% |
| $100,000 to $149,999 | 38 | 21.2% |
| $150,000 to $199,999 | 10 | 5.6% |
| $200,000+ | 3 | 1.7% |
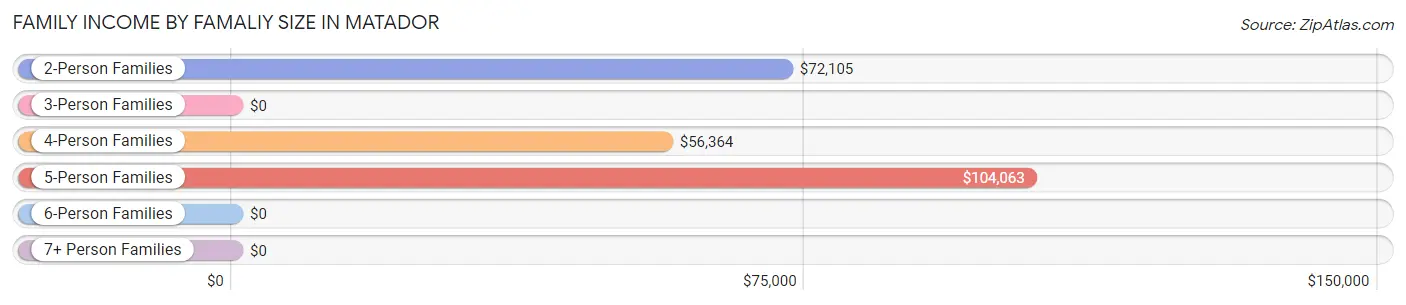
Family Income by Famaliy Size in Matador
5-person families (23 | 12.9%) account for the highest median family income in Matador with $104,063 per family, while 2-person families (114 | 63.7%) have the highest median income of $36,052 per family member.
| Income Bracket | # Families | Median Income |
| 2-Person Families | 114 (63.7%) | $72,105 |
| 3-Person Families | 9 (5.0%) | $0 |
| 4-Person Families | 32 (17.9%) | $56,364 |
| 5-Person Families | 23 (12.9%) | $104,063 |
| 6-Person Families | 1 (0.6%) | $0 |
| 7+ Person Families | 0 (0.0%) | $0 |
| Total | 179 (100.0%) | $71,908 |
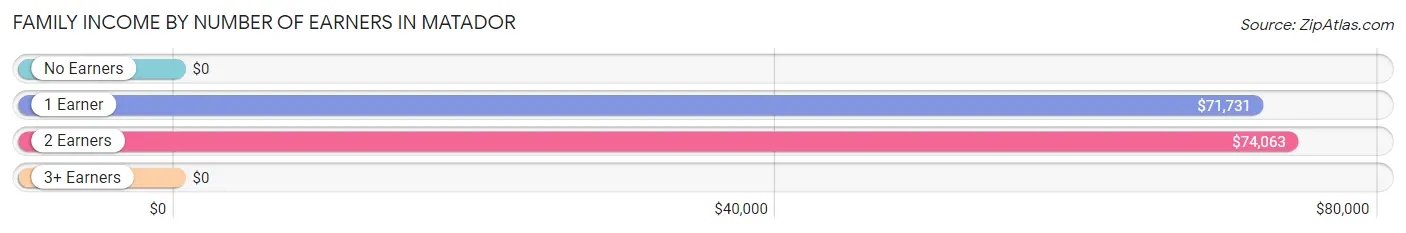
Family Income by Number of Earners in Matador
| Number of Earners | # Families | Median Income |
| No Earners | 20 (11.2%) | $0 |
| 1 Earner | 64 (35.7%) | $71,731 |
| 2 Earners | 91 (50.8%) | $74,063 |
| 3+ Earners | 4 (2.2%) | $0 |
| Total | 179 (100.0%) | $71,908 |
Household Income in Matador
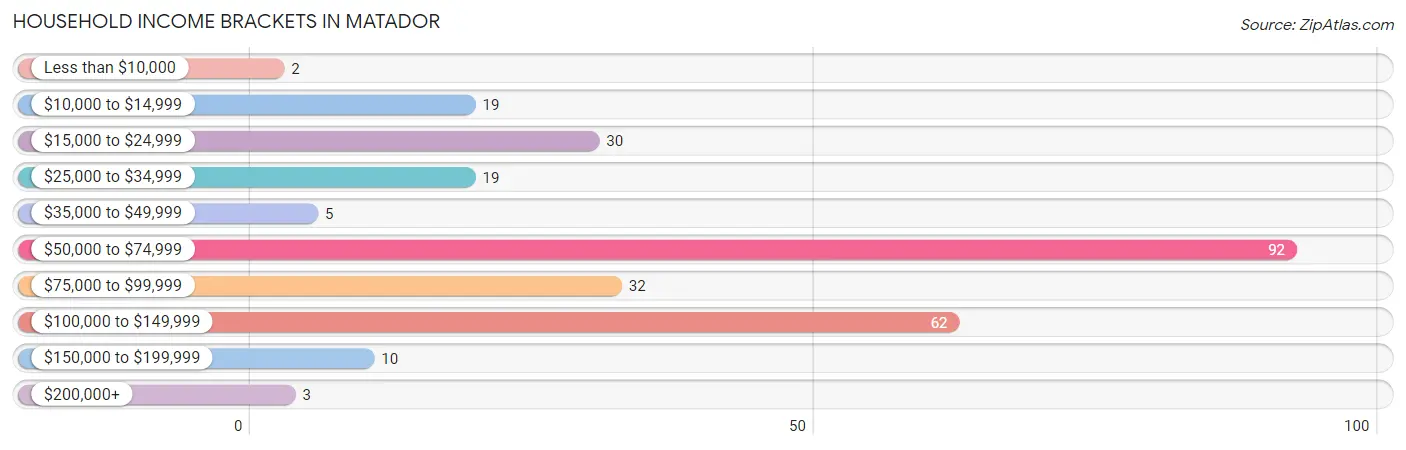
Household Income Brackets in Matador
With 92 households falling in the category, the $50,000 to $74,999 income range is the most frequent in Matador, accounting for 33.6% of all households. In contrast, only 2 households (0.7%) fall into the less than $10,000 income bracket, making it the least populous group.
| Income Bracket | # Households | % Households |
| Less than $10,000 | 2 | 0.7% |
| $10,000 to $14,999 | 19 | 6.9% |
| $15,000 to $24,999 | 30 | 10.9% |
| $25,000 to $34,999 | 19 | 6.9% |
| $35,000 to $49,999 | 5 | 1.8% |
| $50,000 to $74,999 | 92 | 33.6% |
| $75,000 to $99,999 | 32 | 11.7% |
| $100,000 to $149,999 | 62 | 22.6% |
| $150,000 to $199,999 | 10 | 3.6% |
| $200,000+ | 3 | 1.1% |
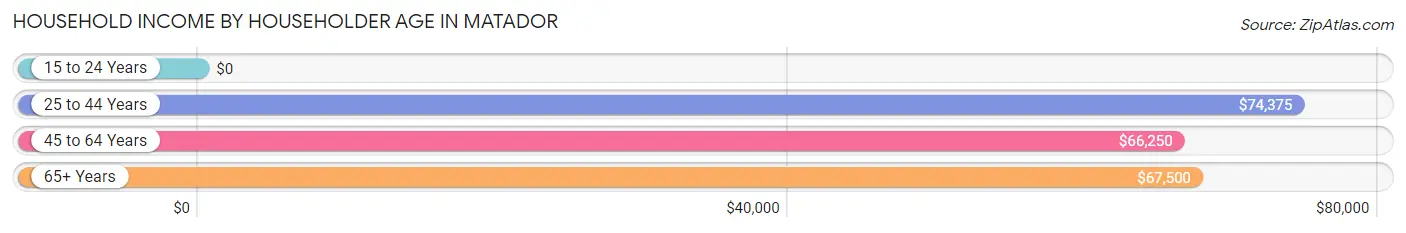
Household Income by Householder Age in Matador
The median household income in Matador is $70,132, with the highest median household income of $74,375 found in the 25 to 44 years age bracket for the primary householder. A total of 80 households (29.2%) fall into this category. Meanwhile, the 15 to 24 years age bracket for the primary householder has the lowest median household income of $0, with 10 households (3.6%) in this group.
| Income Bracket | # Households | Median Income |
| 15 to 24 Years | 10 (3.6%) | $0 |
| 25 to 44 Years | 80 (29.2%) | $74,375 |
| 45 to 64 Years | 52 (19.0%) | $66,250 |
| 65+ Years | 132 (48.2%) | $67,500 |
| Total | 274 (100.0%) | $70,132 |
Poverty in Matador
Income Below Poverty by Sex and Age in Matador
With 9.2% poverty level for males and 6.9% for females among the residents of Matador, 15 year old males and 75 year old and over females are the most vulnerable to poverty, with 6 males (46.2%) and 5 females (20.0%) in their respective age groups living below the poverty level.
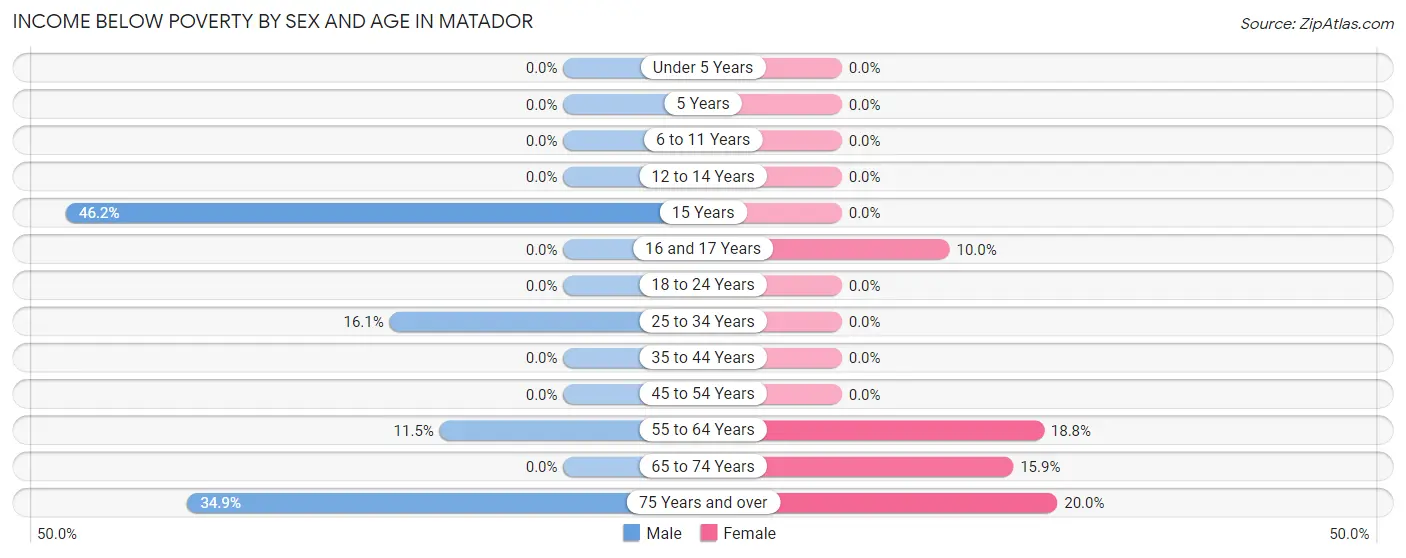
| Age Bracket | Male | Female |
| Under 5 Years | 0 (0.0%) | 0 (0.0%) |
| 5 Years | 0 (0.0%) | 0 (0.0%) |
| 6 to 11 Years | 0 (0.0%) | 0 (0.0%) |
| 12 to 14 Years | 0 (0.0%) | 0 (0.0%) |
| 15 Years | 6 (46.2%) | 0 (0.0%) |
| 16 and 17 Years | 0 (0.0%) | 1 (10.0%) |
| 18 to 24 Years | 0 (0.0%) | 0 (0.0%) |
| 25 to 34 Years | 10 (16.1%) | 0 (0.0%) |
| 35 to 44 Years | 0 (0.0%) | 0 (0.0%) |
| 45 to 54 Years | 0 (0.0%) | 0 (0.0%) |
| 55 to 64 Years | 7 (11.5%) | 3 (18.8%) |
| 65 to 74 Years | 0 (0.0%) | 14 (15.9%) |
| 75 Years and over | 15 (34.9%) | 5 (20.0%) |
| Total | 38 (9.2%) | 23 (6.9%) |
Income Above Poverty by Sex and Age in Matador
According to the poverty statistics in Matador, males aged under 5 years and females aged under 5 years are the age groups that are most secure financially, with 100.0% of males and 100.0% of females in these age groups living above the poverty line.
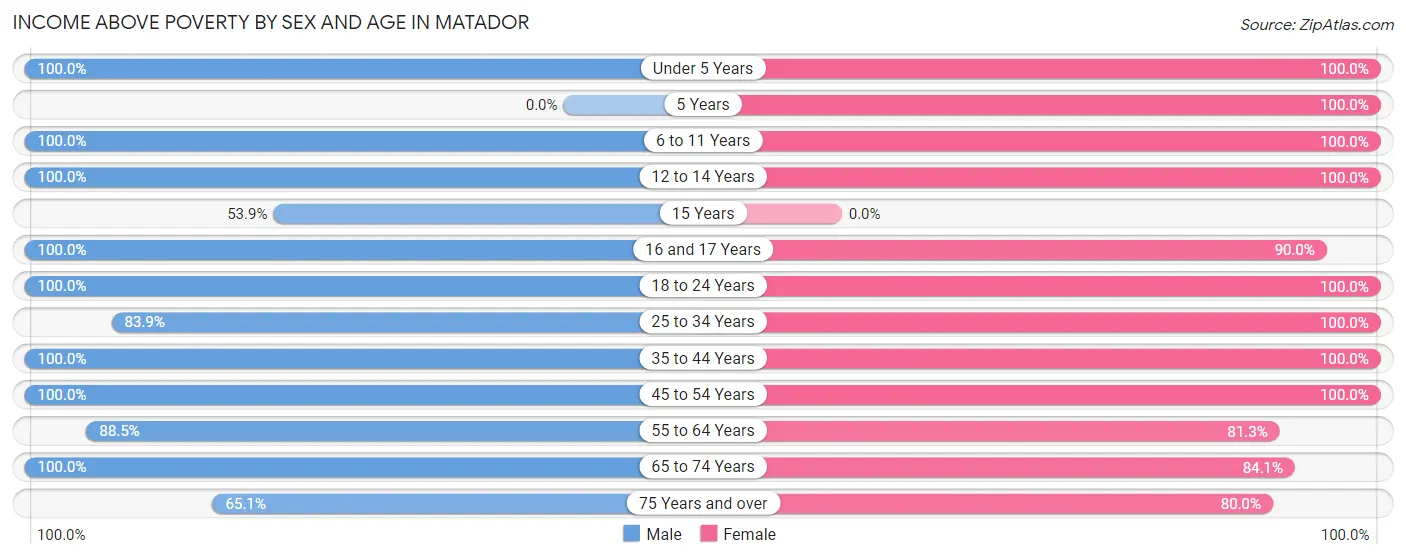
| Age Bracket | Male | Female |
| Under 5 Years | 43 (100.0%) | 17 (100.0%) |
| 5 Years | 0 (0.0%) | 7 (100.0%) |
| 6 to 11 Years | 34 (100.0%) | 23 (100.0%) |
| 12 to 14 Years | 14 (100.0%) | 10 (100.0%) |
| 15 Years | 7 (53.8%) | 0 (0.0%) |
| 16 and 17 Years | 6 (100.0%) | 9 (90.0%) |
| 18 to 24 Years | 44 (100.0%) | 5 (100.0%) |
| 25 to 34 Years | 52 (83.9%) | 69 (100.0%) |
| 35 to 44 Years | 12 (100.0%) | 34 (100.0%) |
| 45 to 54 Years | 33 (100.0%) | 29 (100.0%) |
| 55 to 64 Years | 54 (88.5%) | 13 (81.2%) |
| 65 to 74 Years | 49 (100.0%) | 74 (84.1%) |
| 75 Years and over | 28 (65.1%) | 20 (80.0%) |
| Total | 376 (90.8%) | 310 (93.1%) |
Income Below Poverty Among Married-Couple Families in Matador
The poverty statistics for married-couple families in Matador show that 6.8% or 10 of the total 147 families live below the poverty line. Families with no children have the highest poverty rate of 9.2%, comprising of 10 families. On the other hand, families with 1 or 2 children have the lowest poverty rate of 0.0%, which includes 0 families.
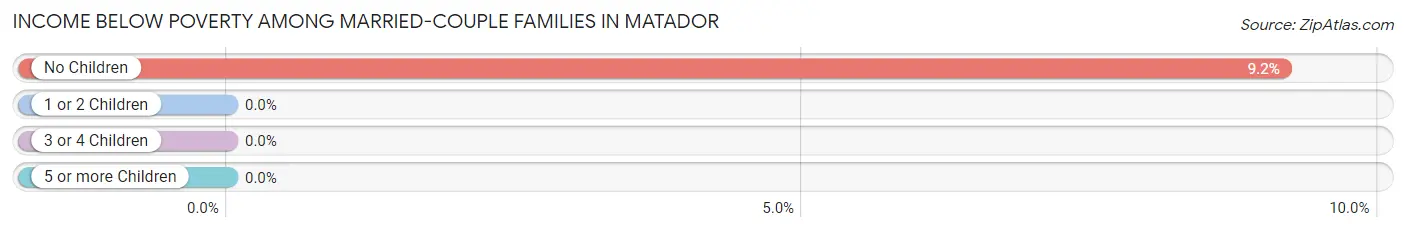
| Children | Above Poverty | Below Poverty |
| No Children | 99 (90.8%) | 10 (9.2%) |
| 1 or 2 Children | 23 (100.0%) | 0 (0.0%) |
| 3 or 4 Children | 15 (100.0%) | 0 (0.0%) |
| 5 or more Children | 0 (0.0%) | 0 (0.0%) |
| Total | 137 (93.2%) | 10 (6.8%) |
Income Below Poverty Among Single-Parent Households in Matador
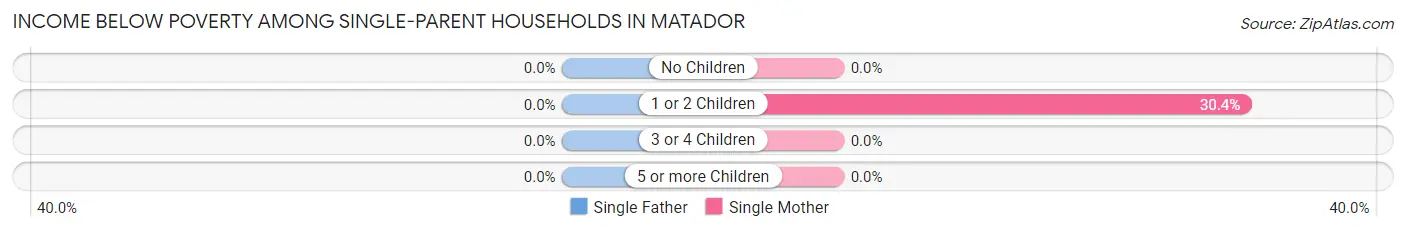
| Children | Single Father | Single Mother |
| No Children | 0 (0.0%) | 0 (0.0%) |
| 1 or 2 Children | 0 (0.0%) | 7 (30.4%) |
| 3 or 4 Children | 0 (0.0%) | 0 (0.0%) |
| 5 or more Children | 0 (0.0%) | 0 (0.0%) |
| Total | 0 (0.0%) | 7 (25.0%) |
Income Below Poverty Among Married-Couple vs Single-Parent Households in Matador
The poverty data for Matador shows that 10 of the married-couple family households (6.8%) and 7 of the single-parent households (21.9%) are living below the poverty level. Within the married-couple family households, those with no children have the highest poverty rate, with 10 households (9.2%) falling below the poverty line. Among the single-parent households, those with 1 or 2 children have the highest poverty rate, with 7 household (30.4%) living below poverty.
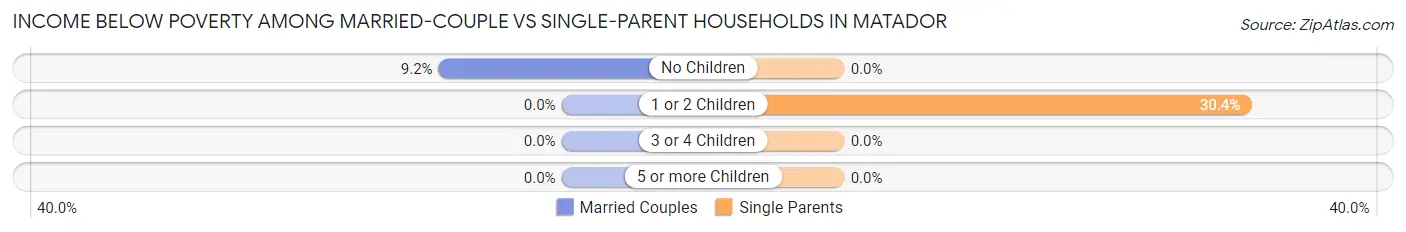
| Children | Married-Couple Families | Single-Parent Households |
| No Children | 10 (9.2%) | 0 (0.0%) |
| 1 or 2 Children | 0 (0.0%) | 7 (30.4%) |
| 3 or 4 Children | 0 (0.0%) | 0 (0.0%) |
| 5 or more Children | 0 (0.0%) | 0 (0.0%) |
| Total | 10 (6.8%) | 7 (21.9%) |
Employment Characteristics in Matador
Employment by Class of Employer in Matador
Among the 337 employed individuals in Matador, private company employees (239 | 70.9%), local government employees (41 | 12.2%), and self-employed (not incorporated) (26 | 7.7%) make up the most common classes of employment.
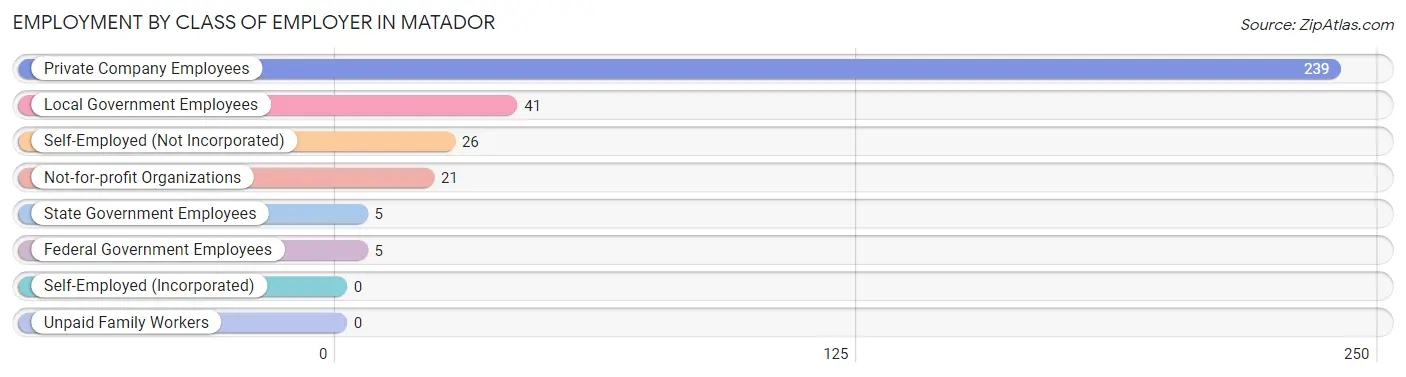
| Employer Class | # Employees | % Employees |
| Private Company Employees | 239 | 70.9% |
| Self-Employed (Incorporated) | 0 | 0.0% |
| Self-Employed (Not Incorporated) | 26 | 7.7% |
| Not-for-profit Organizations | 21 | 6.2% |
| Local Government Employees | 41 | 12.2% |
| State Government Employees | 5 | 1.5% |
| Federal Government Employees | 5 | 1.5% |
| Unpaid Family Workers | 0 | 0.0% |
| Total | 337 | 100.0% |
Employment Status by Age in Matador
According to the labor force statistics for Matador, out of the total population over 16 years of age (586), 61.6% or 361 individuals are in the labor force, with 5.0% or 18 of them unemployed. The age group with the highest labor force participation rate is 20 to 24 years, with 100.0% or 29 individuals in the labor force. Within the labor force, the 16 to 19 years age range has the highest percentage of unemployed individuals, with 100.0% or 1 of them being unemployed.
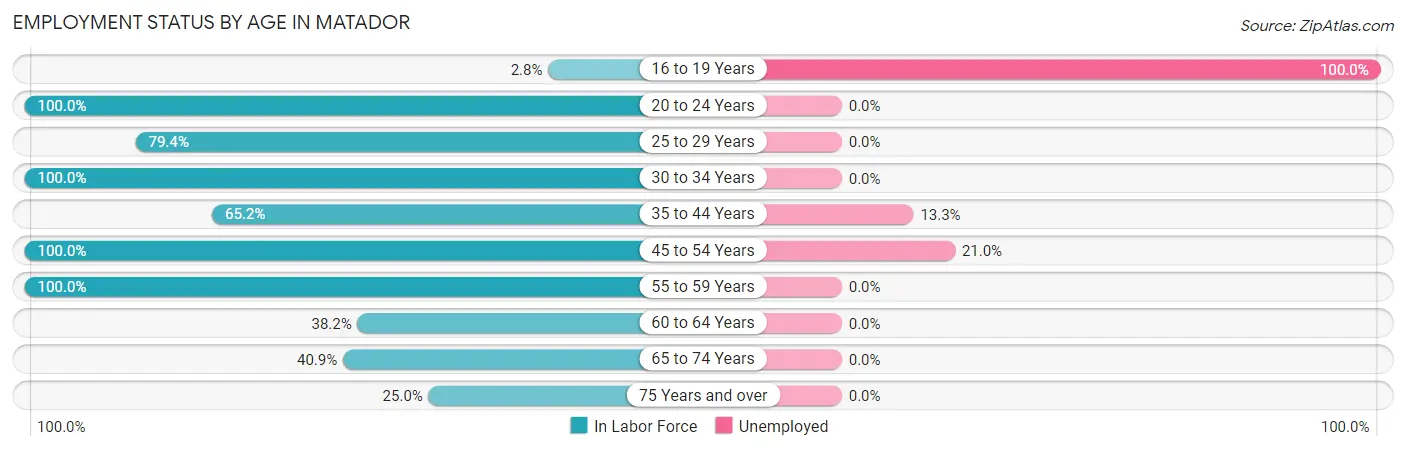
| Age Bracket | In Labor Force | Unemployed |
| 16 to 19 Years | 1 (2.8%) | 1 (100.0%) |
| 20 to 24 Years | 29 (100.0%) | 0 (0.0%) |
| 25 to 29 Years | 81 (79.4%) | 0 (0.0%) |
| 30 to 34 Years | 29 (100.0%) | 0 (0.0%) |
| 35 to 44 Years | 30 (65.2%) | 4 (13.3%) |
| 45 to 54 Years | 62 (100.0%) | 13 (21.0%) |
| 55 to 59 Years | 43 (100.0%) | 0 (0.0%) |
| 60 to 64 Years | 13 (38.2%) | 0 (0.0%) |
| 65 to 74 Years | 56 (40.9%) | 0 (0.0%) |
| 75 Years and over | 17 (25.0%) | 0 (0.0%) |
| Total | 361 (61.6%) | 18 (5.0%) |
Employment Status by Educational Attainment in Matador
According to labor force statistics for Matador, 81.6% of individuals (258) out of the total population between 25 and 64 years of age (316) are in the labor force, with 6.6% or 17 of them being unemployed. The group with the highest labor force participation rate are those with the educational attainment of bachelor's degree or higher, with 100.0% or 23 individuals in the labor force. Within the labor force, individuals with high school diploma education have the highest percentage of unemployment, with 17.6% or 13 of them being unemployed.
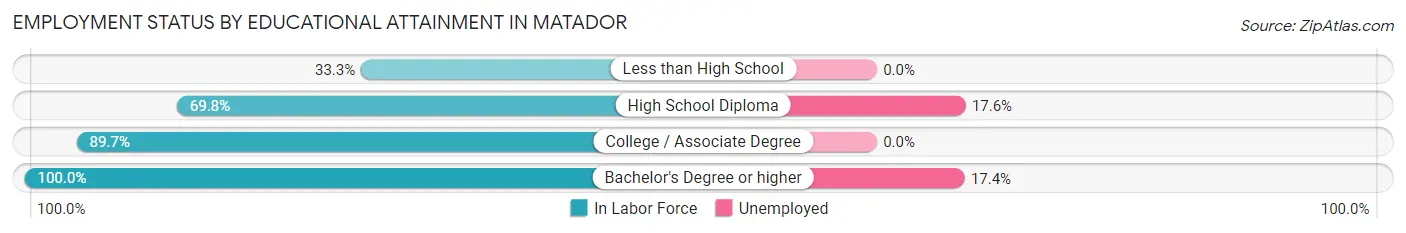
| Educational Attainment | In Labor Force | Unemployed |
| Less than High School | 4 (33.3%) | 0 (0.0%) |
| High School Diploma | 74 (69.8%) | 19 (17.6%) |
| College / Associate Degree | 157 (89.7%) | 0 (0.0%) |
| Bachelor's Degree or higher | 23 (100.0%) | 4 (17.4%) |
| Total | 258 (81.6%) | 21 (6.6%) |
Employment Occupations by Sex in Matador
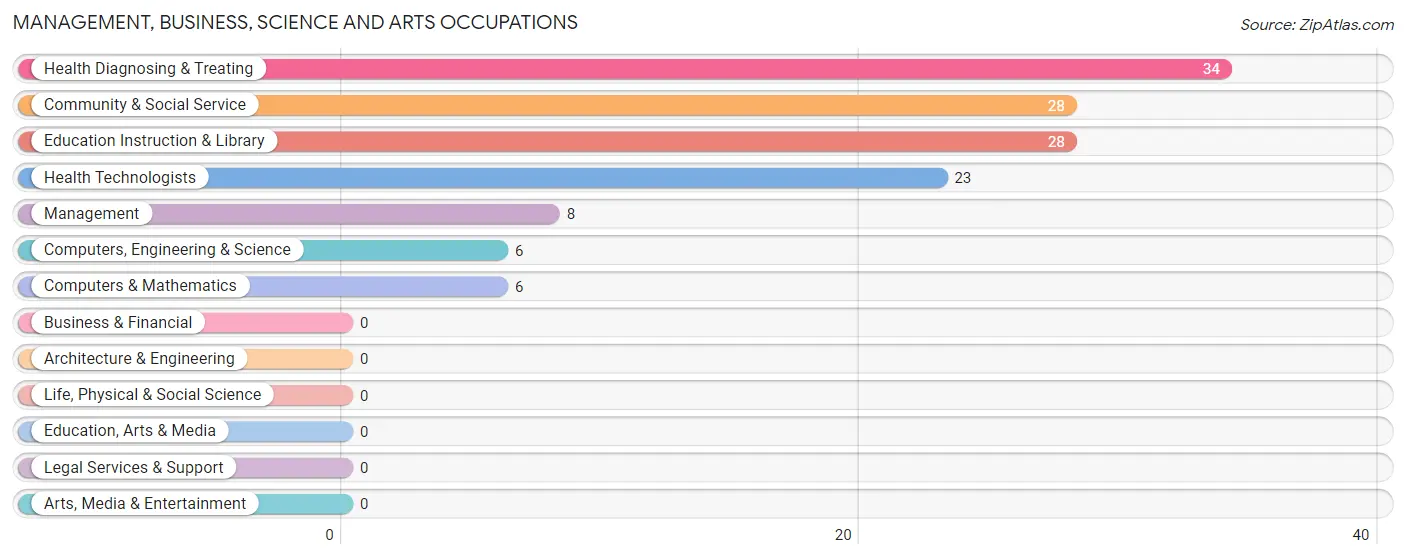
Management, Business, Science and Arts Occupations
The most common Management, Business, Science and Arts occupations in Matador are Health Diagnosing & Treating (34 | 9.9%), Community & Social Service (28 | 8.2%), Education Instruction & Library (28 | 8.2%), Health Technologists (23 | 6.7%), and Management (8 | 2.3%).
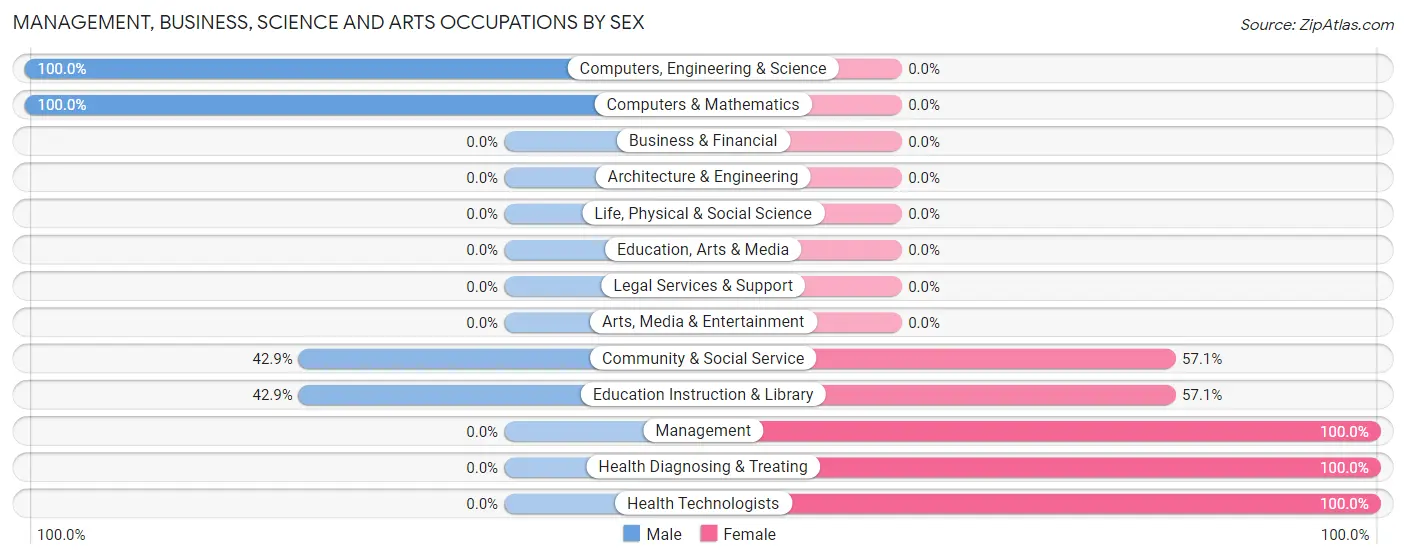
Management, Business, Science and Arts Occupations by Sex
Within the Management, Business, Science and Arts occupations in Matador, the most male-oriented occupations are Computers, Engineering & Science (100.0%), Computers & Mathematics (100.0%), and Community & Social Service (42.9%), while the most female-oriented occupations are Management (100.0%), Health Diagnosing & Treating (100.0%), and Health Technologists (100.0%).
| Occupation | Male | Female |
| Management | 0 (0.0%) | 8 (100.0%) |
| Business & Financial | 0 (0.0%) | 0 (0.0%) |
| Computers, Engineering & Science | 6 (100.0%) | 0 (0.0%) |
| Computers & Mathematics | 6 (100.0%) | 0 (0.0%) |
| Architecture & Engineering | 0 (0.0%) | 0 (0.0%) |
| Life, Physical & Social Science | 0 (0.0%) | 0 (0.0%) |
| Community & Social Service | 12 (42.9%) | 16 (57.1%) |
| Education, Arts & Media | 0 (0.0%) | 0 (0.0%) |
| Legal Services & Support | 0 (0.0%) | 0 (0.0%) |
| Education Instruction & Library | 12 (42.9%) | 16 (57.1%) |
| Arts, Media & Entertainment | 0 (0.0%) | 0 (0.0%) |
| Health Diagnosing & Treating | 0 (0.0%) | 34 (100.0%) |
| Health Technologists | 0 (0.0%) | 23 (100.0%) |
| Total (Category) | 18 (23.7%) | 58 (76.3%) |
| Total (Overall) | 191 (55.7%) | 152 (44.3%) |
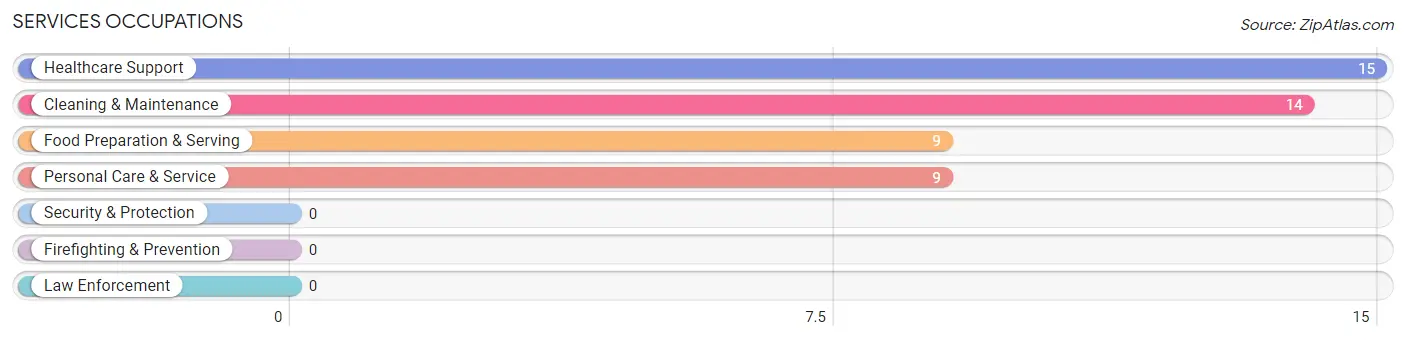
Services Occupations
The most common Services occupations in Matador are Healthcare Support (15 | 4.4%), Cleaning & Maintenance (14 | 4.1%), Food Preparation & Serving (9 | 2.6%), and Personal Care & Service (9 | 2.6%).
Services Occupations by Sex
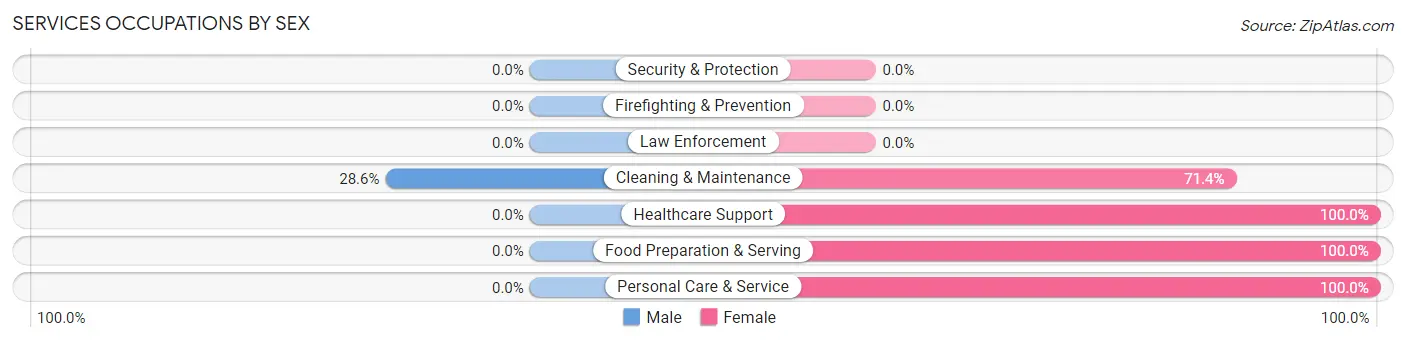
| Occupation | Male | Female |
| Healthcare Support | 0 (0.0%) | 15 (100.0%) |
| Security & Protection | 0 (0.0%) | 0 (0.0%) |
| Firefighting & Prevention | 0 (0.0%) | 0 (0.0%) |
| Law Enforcement | 0 (0.0%) | 0 (0.0%) |
| Food Preparation & Serving | 0 (0.0%) | 9 (100.0%) |
| Cleaning & Maintenance | 4 (28.6%) | 10 (71.4%) |
| Personal Care & Service | 0 (0.0%) | 9 (100.0%) |
| Total (Category) | 4 (8.5%) | 43 (91.5%) |
| Total (Overall) | 191 (55.7%) | 152 (44.3%) |
Sales and Office Occupations
The most common Sales and Office occupations in Matador are Sales & Related (46 | 13.4%), and Office & Administration (39 | 11.4%).

Sales and Office Occupations by Sex

| Occupation | Male | Female |
| Sales & Related | 7 (15.2%) | 39 (84.8%) |
| Office & Administration | 29 (74.4%) | 10 (25.6%) |
| Total (Category) | 36 (42.3%) | 49 (57.7%) |
| Total (Overall) | 191 (55.7%) | 152 (44.3%) |
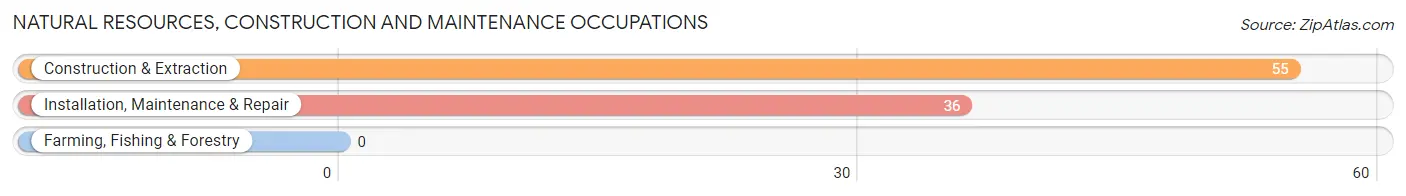
Natural Resources, Construction and Maintenance Occupations
The most common Natural Resources, Construction and Maintenance occupations in Matador are Construction & Extraction (55 | 16.0%), and Installation, Maintenance & Repair (36 | 10.5%).
Natural Resources, Construction and Maintenance Occupations by Sex
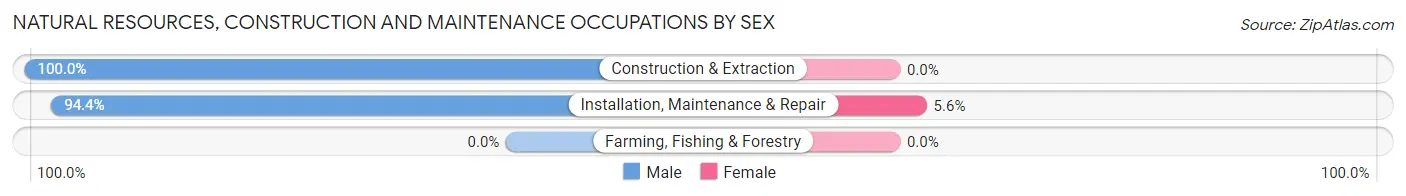
| Occupation | Male | Female |
| Farming, Fishing & Forestry | 0 (0.0%) | 0 (0.0%) |
| Construction & Extraction | 55 (100.0%) | 0 (0.0%) |
| Installation, Maintenance & Repair | 34 (94.4%) | 2 (5.6%) |
| Total (Category) | 89 (97.8%) | 2 (2.2%) |
| Total (Overall) | 191 (55.7%) | 152 (44.3%) |
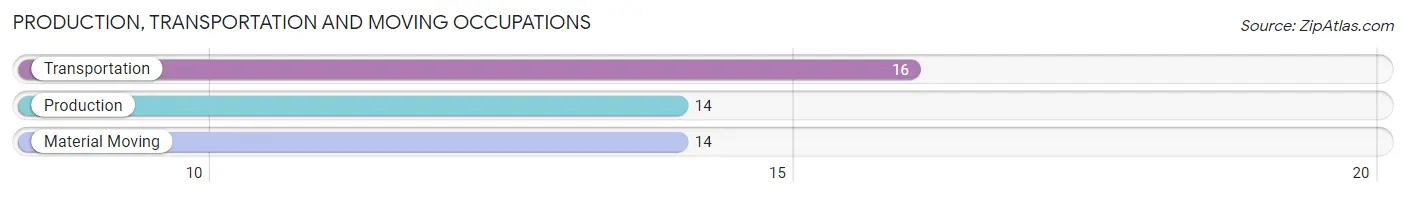
Production, Transportation and Moving Occupations
The most common Production, Transportation and Moving occupations in Matador are Transportation (16 | 4.7%), Production (14 | 4.1%), and Material Moving (14 | 4.1%).
Production, Transportation and Moving Occupations by Sex

| Occupation | Male | Female |
| Production | 14 (100.0%) | 0 (0.0%) |
| Transportation | 16 (100.0%) | 0 (0.0%) |
| Material Moving | 14 (100.0%) | 0 (0.0%) |
| Total (Category) | 44 (100.0%) | 0 (0.0%) |
| Total (Overall) | 191 (55.7%) | 152 (44.3%) |
Employment Industries by Sex in Matador
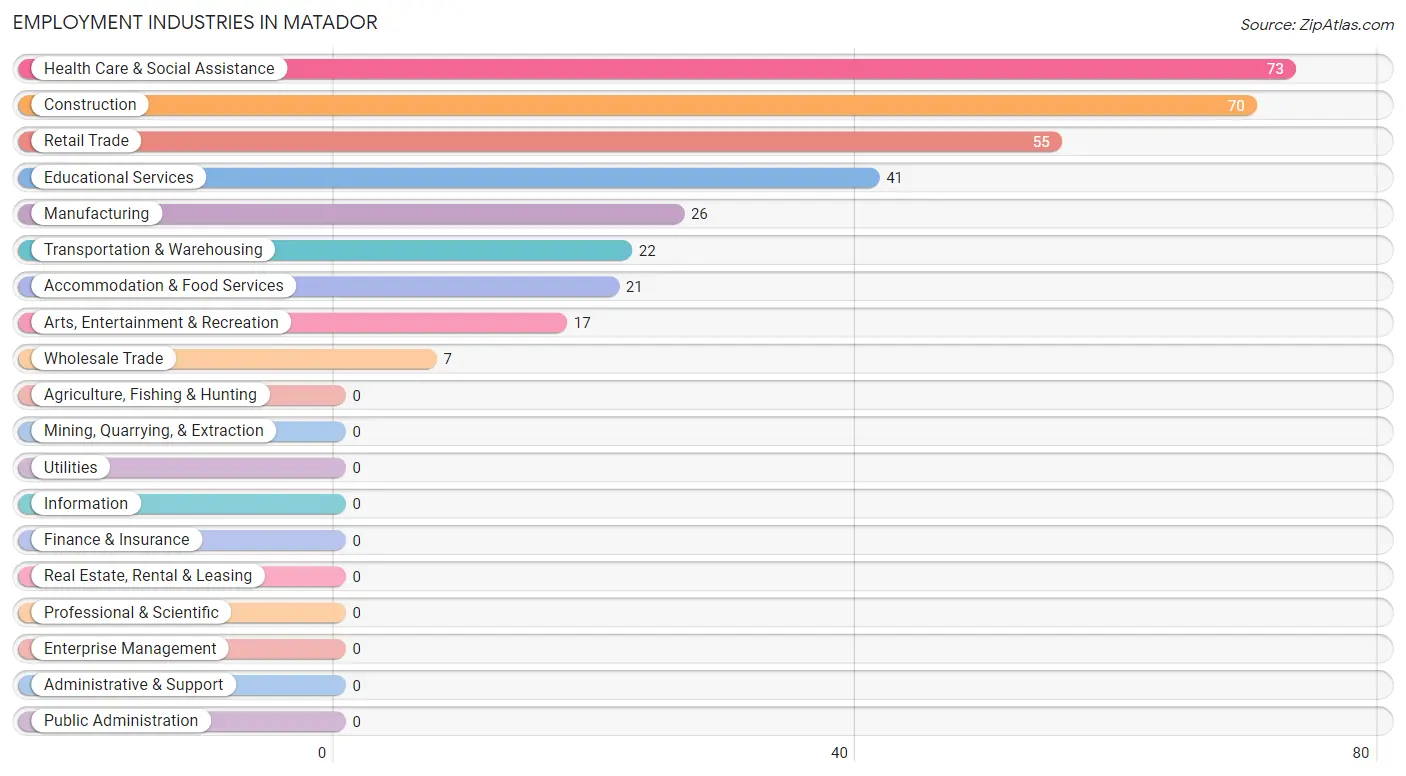
Employment Industries in Matador
The major employment industries in Matador include Health Care & Social Assistance (73 | 21.3%), Construction (70 | 20.4%), Retail Trade (55 | 16.0%), Educational Services (41 | 11.9%), and Manufacturing (26 | 7.6%).
Employment Industries by Sex in Matador
The Matador industries that see more men than women are Manufacturing (100.0%), Wholesale Trade (100.0%), and Transportation & Warehousing (100.0%), whereas the industries that tend to have a higher number of women are Accommodation & Food Services (100.0%), Health Care & Social Assistance (84.9%), and Retail Trade (60.0%).
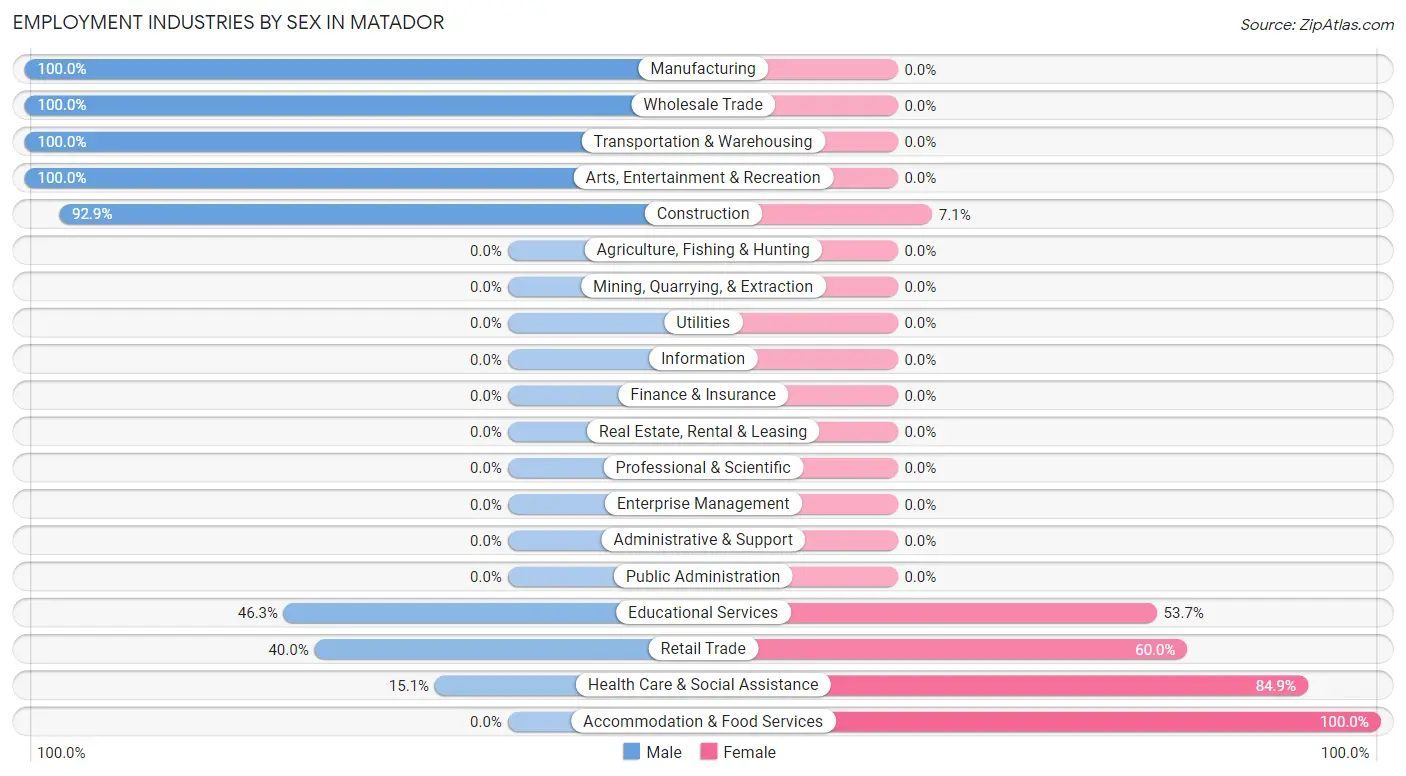
| Industry | Male | Female |
| Agriculture, Fishing & Hunting | 0 (0.0%) | 0 (0.0%) |
| Mining, Quarrying, & Extraction | 0 (0.0%) | 0 (0.0%) |
| Construction | 65 (92.9%) | 5 (7.1%) |
| Manufacturing | 26 (100.0%) | 0 (0.0%) |
| Wholesale Trade | 7 (100.0%) | 0 (0.0%) |
| Retail Trade | 22 (40.0%) | 33 (60.0%) |
| Transportation & Warehousing | 22 (100.0%) | 0 (0.0%) |
| Utilities | 0 (0.0%) | 0 (0.0%) |
| Information | 0 (0.0%) | 0 (0.0%) |
| Finance & Insurance | 0 (0.0%) | 0 (0.0%) |
| Real Estate, Rental & Leasing | 0 (0.0%) | 0 (0.0%) |
| Professional & Scientific | 0 (0.0%) | 0 (0.0%) |
| Enterprise Management | 0 (0.0%) | 0 (0.0%) |
| Administrative & Support | 0 (0.0%) | 0 (0.0%) |
| Educational Services | 19 (46.3%) | 22 (53.7%) |
| Health Care & Social Assistance | 11 (15.1%) | 62 (84.9%) |
| Arts, Entertainment & Recreation | 17 (100.0%) | 0 (0.0%) |
| Accommodation & Food Services | 0 (0.0%) | 21 (100.0%) |
| Public Administration | 0 (0.0%) | 0 (0.0%) |
| Total | 191 (55.7%) | 152 (44.3%) |
Education in Matador
School Enrollment in Matador
The most common levels of schooling among the 137 students in Matador are high school (52 | 38.0%), middle school (38 | 27.7%), and elementary school (28 | 20.4%).
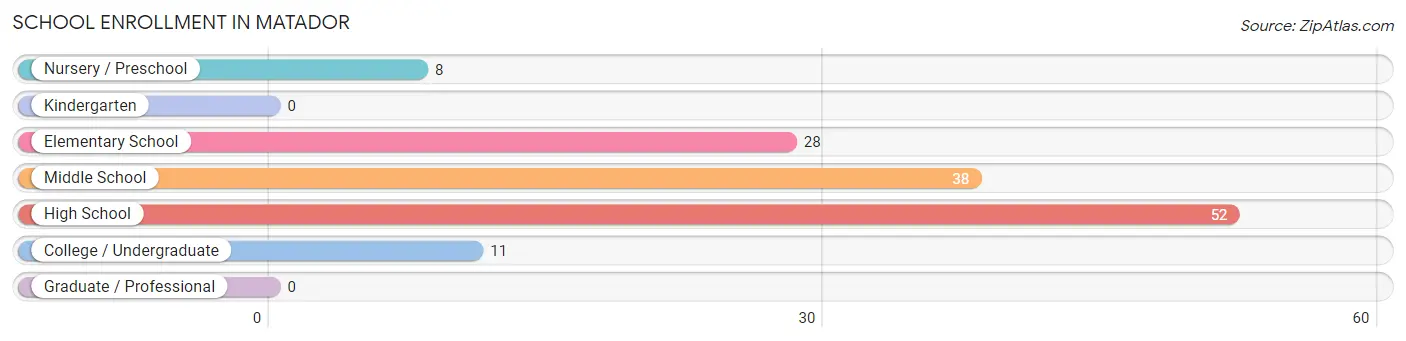
| School Level | # Students | % Students |
| Nursery / Preschool | 8 | 5.8% |
| Kindergarten | 0 | 0.0% |
| Elementary School | 28 | 20.4% |
| Middle School | 38 | 27.7% |
| High School | 52 | 38.0% |
| College / Undergraduate | 11 | 8.0% |
| Graduate / Professional | 0 | 0.0% |
| Total | 137 | 100.0% |
School Enrollment by Age by Funding Source in Matador
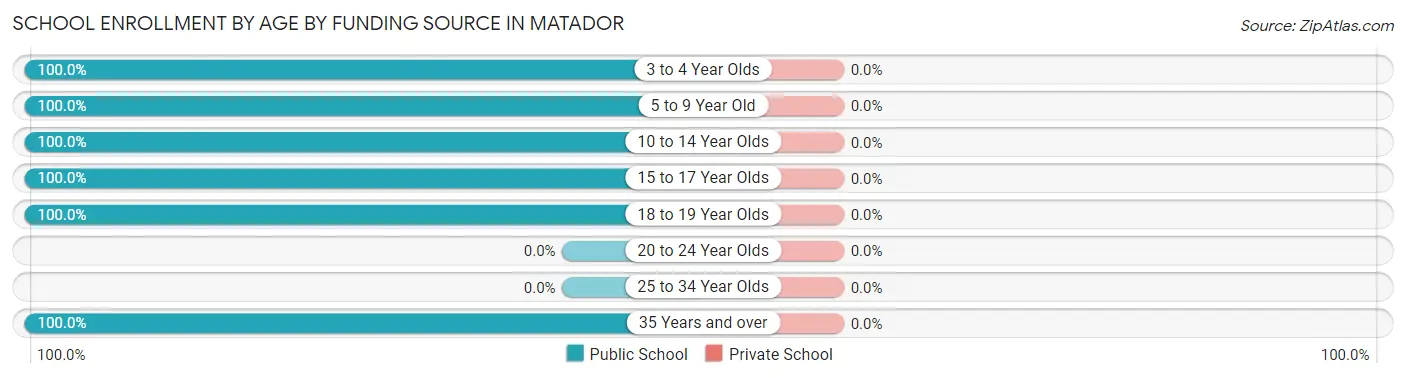
| Age Bracket | Public School | Private School |
| 3 to 4 Year Olds | 8 (100.0%) | 0 (0.0%) |
| 5 to 9 Year Old | 28 (100.0%) | 0 (0.0%) |
| 10 to 14 Year Olds | 41 (100.0%) | 0 (0.0%) |
| 15 to 17 Year Olds | 29 (100.0%) | 0 (0.0%) |
| 18 to 19 Year Olds | 20 (100.0%) | 0 (0.0%) |
| 20 to 24 Year Olds | 0 (0.0%) | 0 (0.0%) |
| 25 to 34 Year Olds | 0 (0.0%) | 0 (0.0%) |
| 35 Years and over | 11 (100.0%) | 0 (0.0%) |
| Total | 137 (100.0%) | 0 (0.0%) |
Educational Attainment by Field of Study in Matador
Education (34 | 36.2%), bio, nature & agricultural (32 | 34.0%), arts & humanities (17 | 18.1%), and engineering (11 | 11.7%) are the most common fields of study among 94 individuals in Matador who have obtained a bachelor's degree or higher.
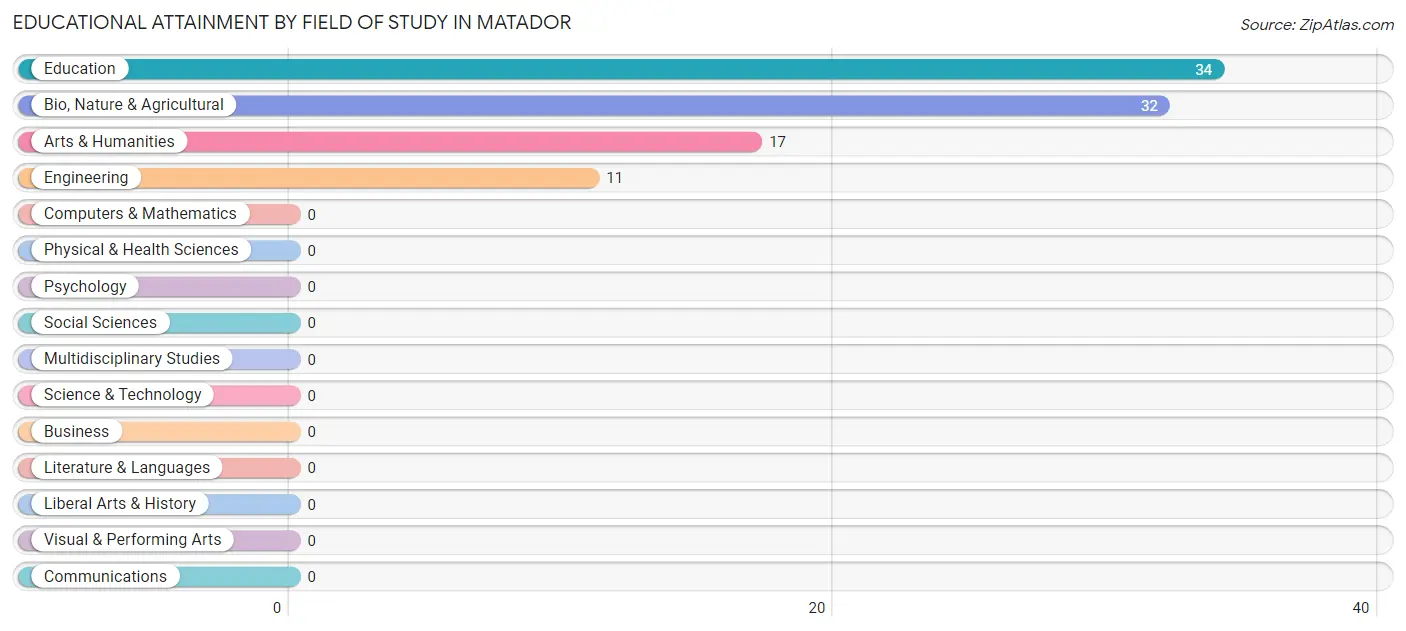
| Field of Study | # Graduates | % Graduates |
| Computers & Mathematics | 0 | 0.0% |
| Bio, Nature & Agricultural | 32 | 34.0% |
| Physical & Health Sciences | 0 | 0.0% |
| Psychology | 0 | 0.0% |
| Social Sciences | 0 | 0.0% |
| Engineering | 11 | 11.7% |
| Multidisciplinary Studies | 0 | 0.0% |
| Science & Technology | 0 | 0.0% |
| Business | 0 | 0.0% |
| Education | 34 | 36.2% |
| Literature & Languages | 0 | 0.0% |
| Liberal Arts & History | 0 | 0.0% |
| Visual & Performing Arts | 0 | 0.0% |
| Communications | 0 | 0.0% |
| Arts & Humanities | 17 | 18.1% |
| Total | 94 | 100.0% |
Transportation & Commute in Matador
Vehicle Availability by Sex in Matador
The most prevalent vehicle ownership categories in Matador are males with 2 vehicles (110, accounting for 58.8%) and females with 2 vehicles (91, making up 73.3%).
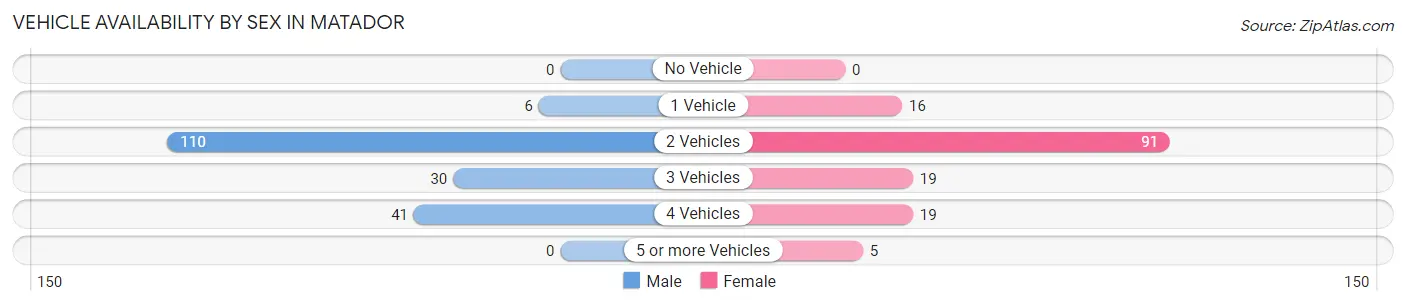
| Vehicles Available | Male | Female |
| No Vehicle | 0 (0.0%) | 0 (0.0%) |
| 1 Vehicle | 6 (3.2%) | 16 (10.7%) |
| 2 Vehicles | 110 (58.8%) | 91 (60.7%) |
| 3 Vehicles | 30 (16.0%) | 19 (12.7%) |
| 4 Vehicles | 41 (21.9%) | 19 (12.7%) |
| 5 or more Vehicles | 0 (0.0%) | 5 (3.3%) |
| Total | 187 (100.0%) | 150 (100.0%) |
Commute Time in Matador
The most frequently occuring commute durations in Matador are less than 5 minutes (109 commuters, 34.0%), 5 to 9 minutes (54 commuters, 16.8%), and 10 to 14 minutes (43 commuters, 13.4%).
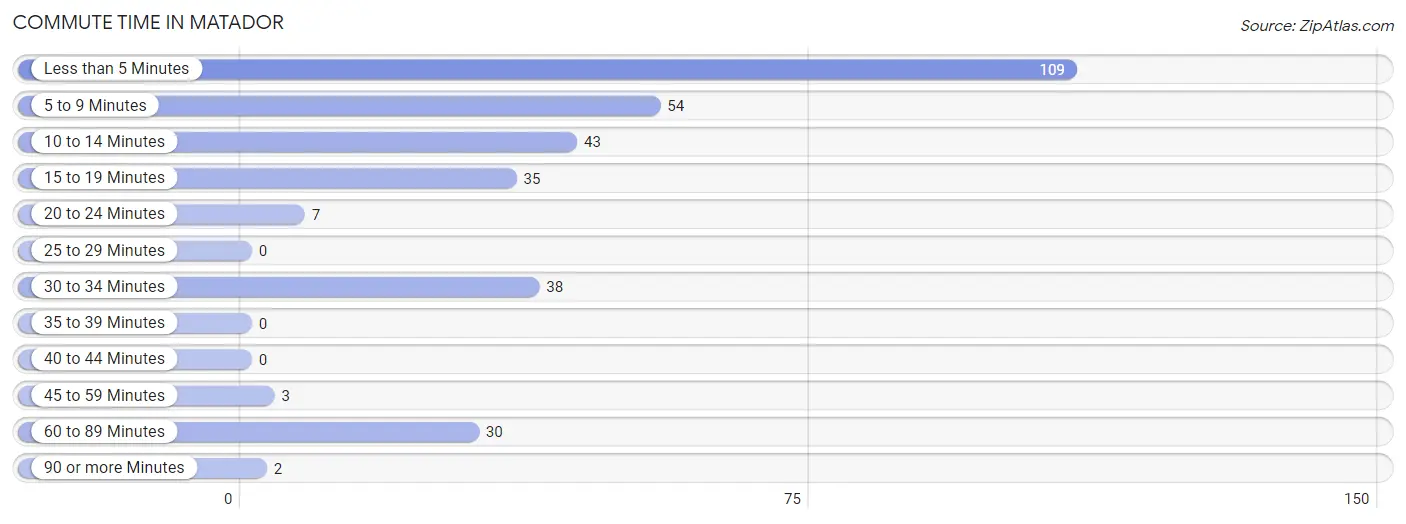
| Commute Time | # Commuters | % Commuters |
| Less than 5 Minutes | 109 | 34.0% |
| 5 to 9 Minutes | 54 | 16.8% |
| 10 to 14 Minutes | 43 | 13.4% |
| 15 to 19 Minutes | 35 | 10.9% |
| 20 to 24 Minutes | 7 | 2.2% |
| 25 to 29 Minutes | 0 | 0.0% |
| 30 to 34 Minutes | 38 | 11.8% |
| 35 to 39 Minutes | 0 | 0.0% |
| 40 to 44 Minutes | 0 | 0.0% |
| 45 to 59 Minutes | 3 | 0.9% |
| 60 to 89 Minutes | 30 | 9.3% |
| 90 or more Minutes | 2 | 0.6% |
Commute Time by Sex in Matador
The most common commute times in Matador are less than 5 minutes (56 commuters, 31.8%) for males and 5 to 9 minutes (54 commuters, 37.2%) for females.
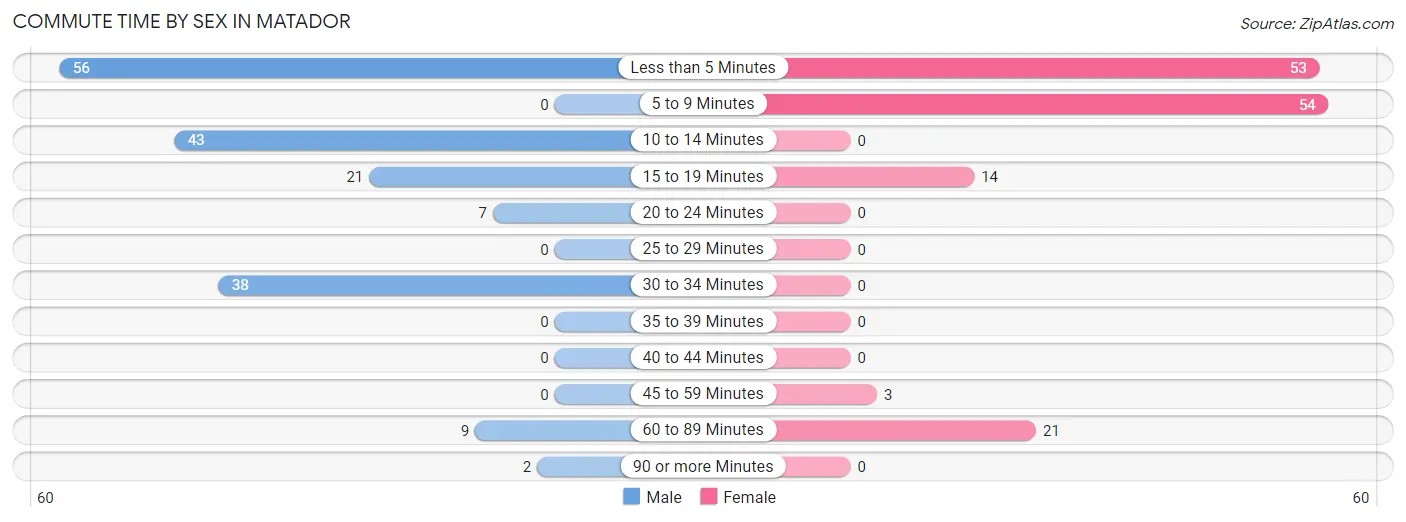
| Commute Time | Male | Female |
| Less than 5 Minutes | 56 (31.8%) | 53 (36.5%) |
| 5 to 9 Minutes | 0 (0.0%) | 54 (37.2%) |
| 10 to 14 Minutes | 43 (24.4%) | 0 (0.0%) |
| 15 to 19 Minutes | 21 (11.9%) | 14 (9.7%) |
| 20 to 24 Minutes | 7 (4.0%) | 0 (0.0%) |
| 25 to 29 Minutes | 0 (0.0%) | 0 (0.0%) |
| 30 to 34 Minutes | 38 (21.6%) | 0 (0.0%) |
| 35 to 39 Minutes | 0 (0.0%) | 0 (0.0%) |
| 40 to 44 Minutes | 0 (0.0%) | 0 (0.0%) |
| 45 to 59 Minutes | 0 (0.0%) | 3 (2.1%) |
| 60 to 89 Minutes | 9 (5.1%) | 21 (14.5%) |
| 90 or more Minutes | 2 (1.1%) | 0 (0.0%) |
Time of Departure to Work by Sex in Matador
The most frequent times of departure to work in Matador are 7:30 AM to 7:59 AM (49, 27.8%) for males and 6:00 AM to 6:29 AM (30, 20.7%) for females.
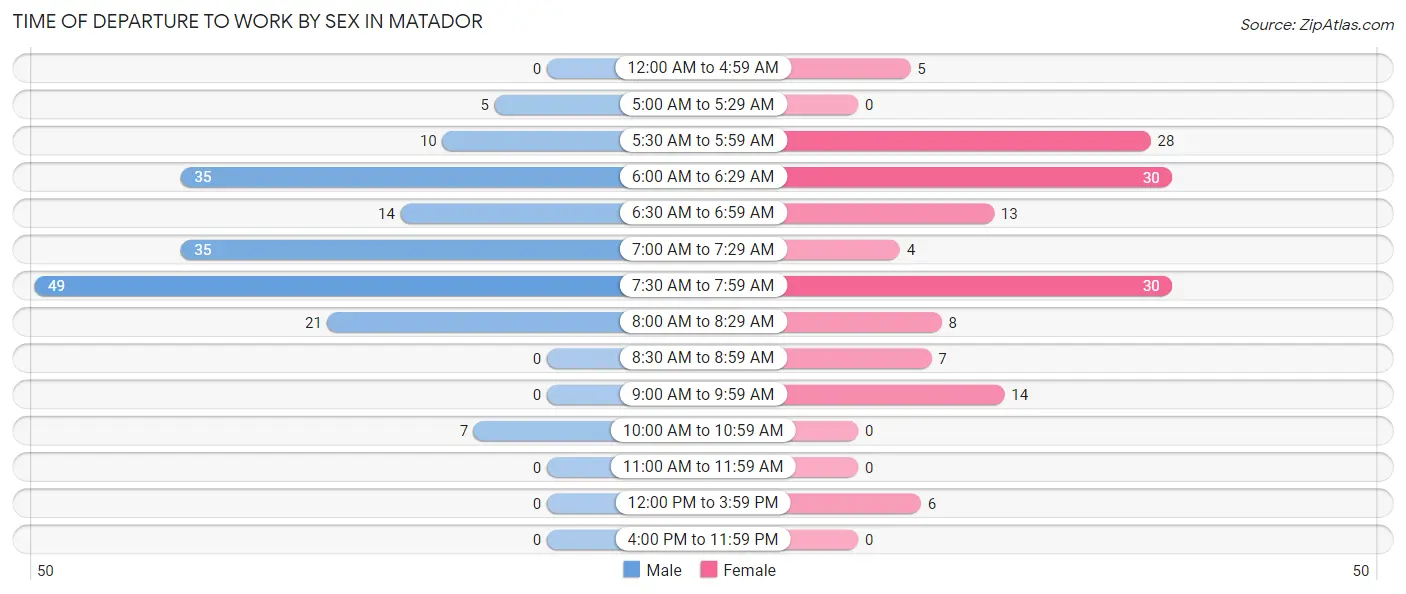
| Time of Departure | Male | Female |
| 12:00 AM to 4:59 AM | 0 (0.0%) | 5 (3.5%) |
| 5:00 AM to 5:29 AM | 5 (2.8%) | 0 (0.0%) |
| 5:30 AM to 5:59 AM | 10 (5.7%) | 28 (19.3%) |
| 6:00 AM to 6:29 AM | 35 (19.9%) | 30 (20.7%) |
| 6:30 AM to 6:59 AM | 14 (8.0%) | 13 (9.0%) |
| 7:00 AM to 7:29 AM | 35 (19.9%) | 4 (2.8%) |
| 7:30 AM to 7:59 AM | 49 (27.8%) | 30 (20.7%) |
| 8:00 AM to 8:29 AM | 21 (11.9%) | 8 (5.5%) |
| 8:30 AM to 8:59 AM | 0 (0.0%) | 7 (4.8%) |
| 9:00 AM to 9:59 AM | 0 (0.0%) | 14 (9.7%) |
| 10:00 AM to 10:59 AM | 7 (4.0%) | 0 (0.0%) |
| 11:00 AM to 11:59 AM | 0 (0.0%) | 0 (0.0%) |
| 12:00 PM to 3:59 PM | 0 (0.0%) | 6 (4.1%) |
| 4:00 PM to 11:59 PM | 0 (0.0%) | 0 (0.0%) |
| Total | 176 (100.0%) | 145 (100.0%) |
Housing Occupancy in Matador
Occupancy by Ownership in Matador
Of the total 274 dwellings in Matador, owner-occupied units account for 210 (76.6%), while renter-occupied units make up 64 (23.4%).
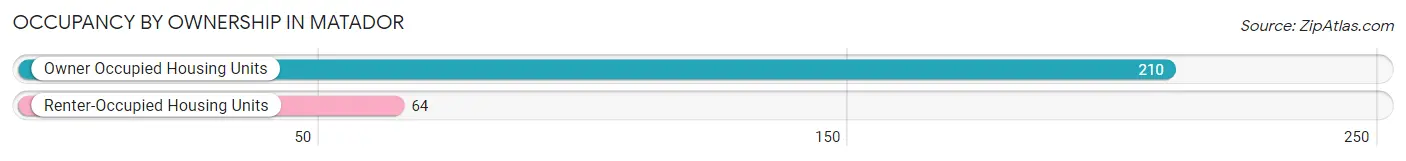
| Occupancy | # Housing Units | % Housing Units |
| Owner Occupied Housing Units | 210 | 76.6% |
| Renter-Occupied Housing Units | 64 | 23.4% |
| Total Occupied Housing Units | 274 | 100.0% |
Occupancy by Household Size in Matador
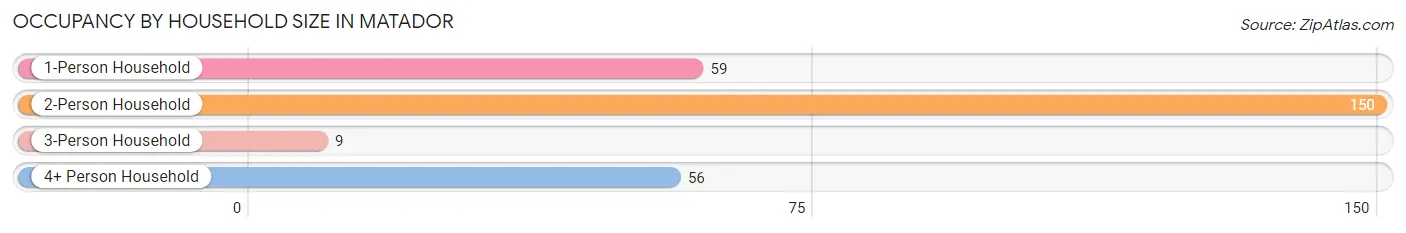
| Household Size | # Housing Units | % Housing Units |
| 1-Person Household | 59 | 21.5% |
| 2-Person Household | 150 | 54.7% |
| 3-Person Household | 9 | 3.3% |
| 4+ Person Household | 56 | 20.4% |
| Total Housing Units | 274 | 100.0% |
Occupancy by Ownership by Household Size in Matador
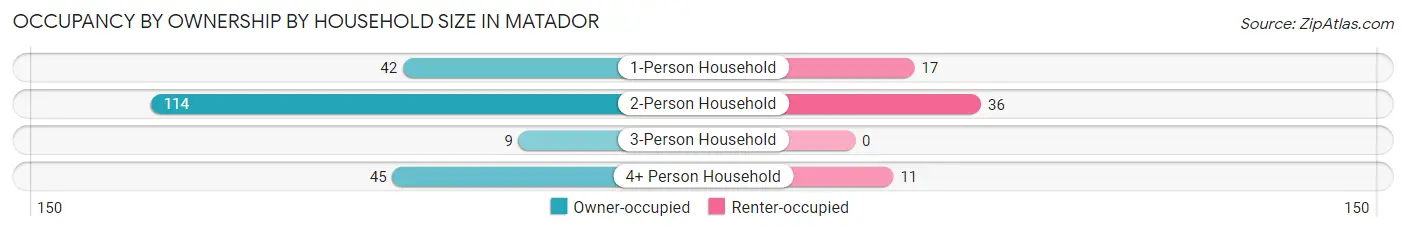
| Household Size | Owner-occupied | Renter-occupied |
| 1-Person Household | 42 (71.2%) | 17 (28.8%) |
| 2-Person Household | 114 (76.0%) | 36 (24.0%) |
| 3-Person Household | 9 (100.0%) | 0 (0.0%) |
| 4+ Person Household | 45 (80.4%) | 11 (19.6%) |
| Total Housing Units | 210 (76.6%) | 64 (23.4%) |
Occupancy by Educational Attainment in Matador
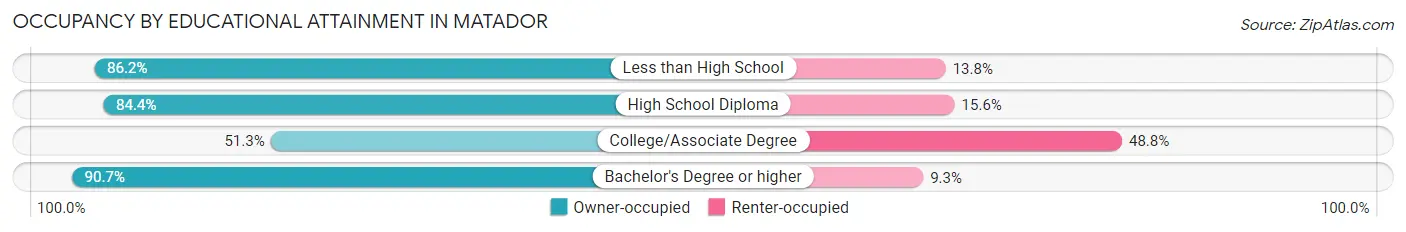
| Household Size | Owner-occupied | Renter-occupied |
| Less than High School | 25 (86.2%) | 4 (13.8%) |
| High School Diploma | 76 (84.4%) | 14 (15.6%) |
| College/Associate Degree | 41 (51.2%) | 39 (48.7%) |
| Bachelor's Degree or higher | 68 (90.7%) | 7 (9.3%) |
Occupancy by Age of Householder in Matador
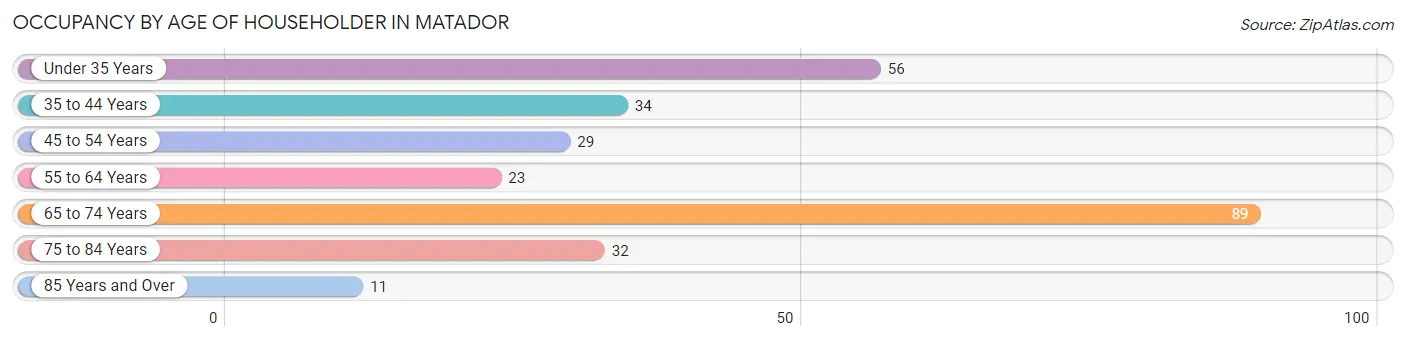
| Age Bracket | # Households | % Households |
| Under 35 Years | 56 | 20.4% |
| 35 to 44 Years | 34 | 12.4% |
| 45 to 54 Years | 29 | 10.6% |
| 55 to 64 Years | 23 | 8.4% |
| 65 to 74 Years | 89 | 32.5% |
| 75 to 84 Years | 32 | 11.7% |
| 85 Years and Over | 11 | 4.0% |
| Total | 274 | 100.0% |
Housing Finances in Matador
Median Income by Occupancy in Matador
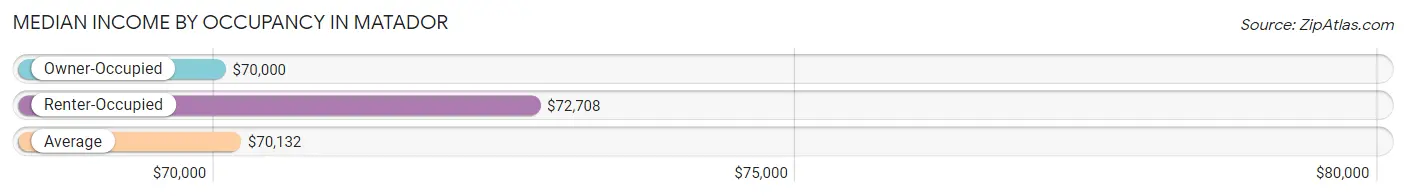
| Occupancy Type | # Households | Median Income |
| Owner-Occupied | 210 (76.6%) | $70,000 |
| Renter-Occupied | 64 (23.4%) | $72,708 |
| Average | 274 (100.0%) | $70,132 |
Occupancy by Householder Income Bracket in Matador
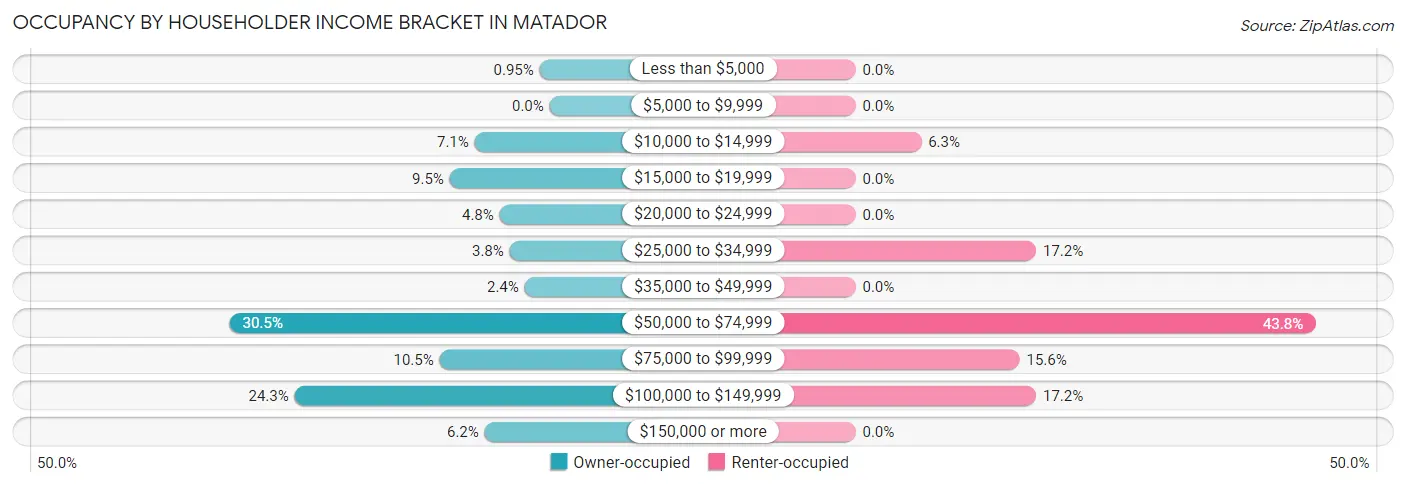
| Income Bracket | Owner-occupied | Renter-occupied |
| Less than $5,000 | 2 (0.9%) | 0 (0.0%) |
| $5,000 to $9,999 | 0 (0.0%) | 0 (0.0%) |
| $10,000 to $14,999 | 15 (7.1%) | 4 (6.2%) |
| $15,000 to $19,999 | 20 (9.5%) | 0 (0.0%) |
| $20,000 to $24,999 | 10 (4.8%) | 0 (0.0%) |
| $25,000 to $34,999 | 8 (3.8%) | 11 (17.2%) |
| $35,000 to $49,999 | 5 (2.4%) | 0 (0.0%) |
| $50,000 to $74,999 | 64 (30.5%) | 28 (43.8%) |
| $75,000 to $99,999 | 22 (10.5%) | 10 (15.6%) |
| $100,000 to $149,999 | 51 (24.3%) | 11 (17.2%) |
| $150,000 or more | 13 (6.2%) | 0 (0.0%) |
| Total | 210 (100.0%) | 64 (100.0%) |
Monthly Housing Cost Tiers in Matador
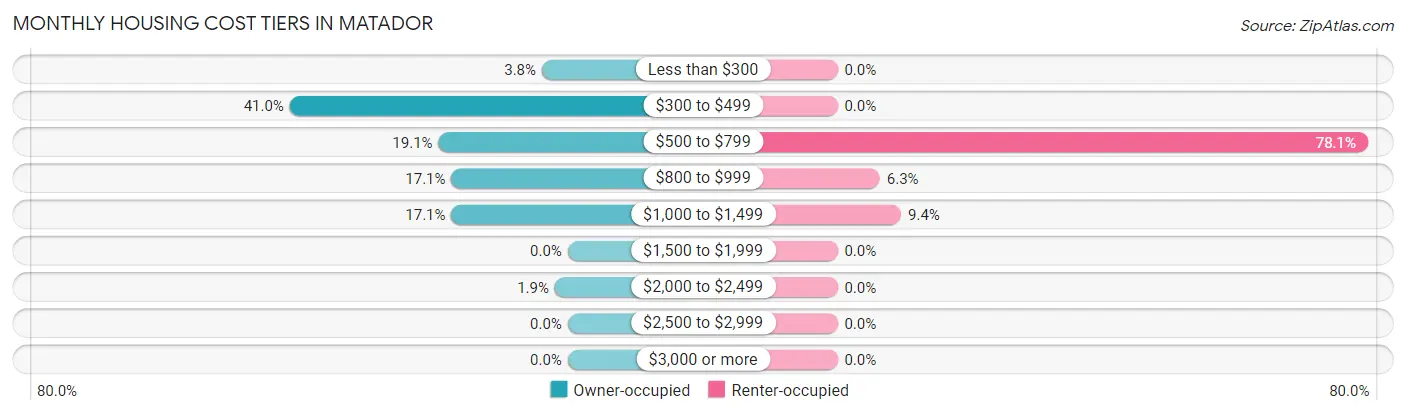
| Monthly Cost | Owner-occupied | Renter-occupied |
| Less than $300 | 8 (3.8%) | 0 (0.0%) |
| $300 to $499 | 86 (40.9%) | 0 (0.0%) |
| $500 to $799 | 40 (19.1%) | 50 (78.1%) |
| $800 to $999 | 36 (17.1%) | 4 (6.2%) |
| $1,000 to $1,499 | 36 (17.1%) | 6 (9.4%) |
| $1,500 to $1,999 | 0 (0.0%) | 0 (0.0%) |
| $2,000 to $2,499 | 4 (1.9%) | 0 (0.0%) |
| $2,500 to $2,999 | 0 (0.0%) | 0 (0.0%) |
| $3,000 or more | 0 (0.0%) | 0 (0.0%) |
| Total | 210 (100.0%) | 64 (100.0%) |
Physical Housing Characteristics in Matador
Housing Structures in Matador
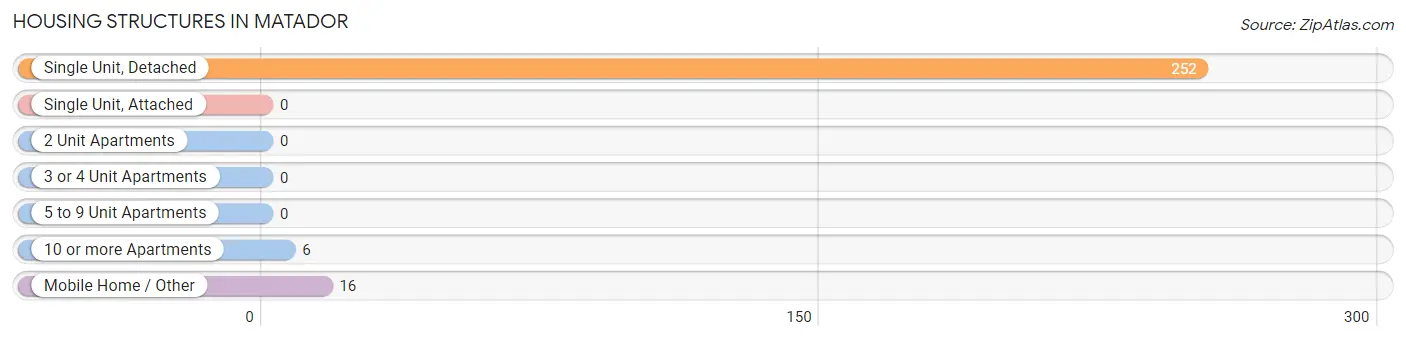
| Structure Type | # Housing Units | % Housing Units |
| Single Unit, Detached | 252 | 92.0% |
| Single Unit, Attached | 0 | 0.0% |
| 2 Unit Apartments | 0 | 0.0% |
| 3 or 4 Unit Apartments | 0 | 0.0% |
| 5 to 9 Unit Apartments | 0 | 0.0% |
| 10 or more Apartments | 6 | 2.2% |
| Mobile Home / Other | 16 | 5.8% |
| Total | 274 | 100.0% |
Housing Structures by Occupancy in Matador
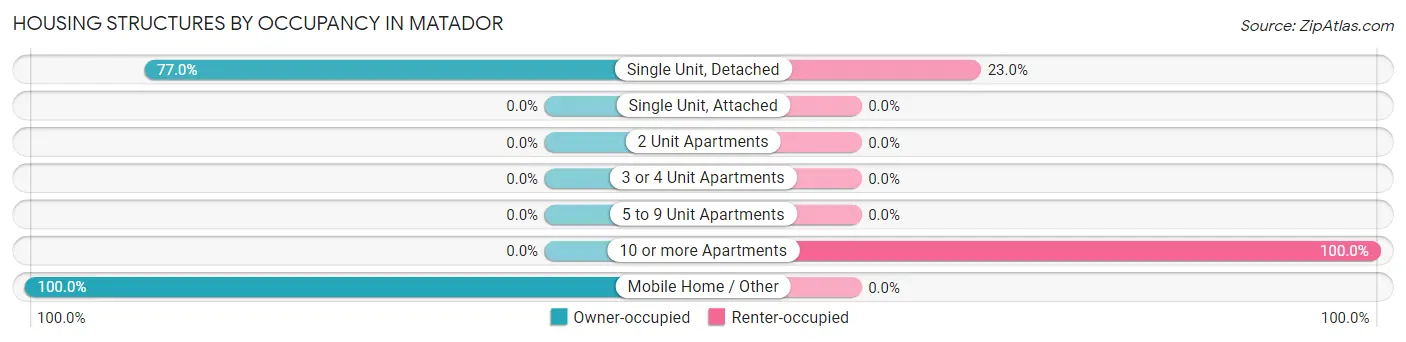
| Structure Type | Owner-occupied | Renter-occupied |
| Single Unit, Detached | 194 (77.0%) | 58 (23.0%) |
| Single Unit, Attached | 0 (0.0%) | 0 (0.0%) |
| 2 Unit Apartments | 0 (0.0%) | 0 (0.0%) |
| 3 or 4 Unit Apartments | 0 (0.0%) | 0 (0.0%) |
| 5 to 9 Unit Apartments | 0 (0.0%) | 0 (0.0%) |
| 10 or more Apartments | 0 (0.0%) | 6 (100.0%) |
| Mobile Home / Other | 16 (100.0%) | 0 (0.0%) |
| Total | 210 (76.6%) | 64 (23.4%) |
Housing Structures by Number of Rooms in Matador
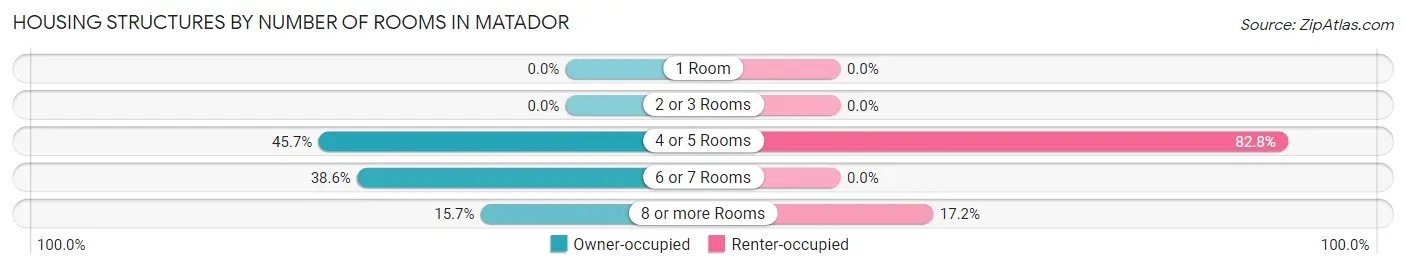
| Number of Rooms | Owner-occupied | Renter-occupied |
| 1 Room | 0 (0.0%) | 0 (0.0%) |
| 2 or 3 Rooms | 0 (0.0%) | 0 (0.0%) |
| 4 or 5 Rooms | 96 (45.7%) | 53 (82.8%) |
| 6 or 7 Rooms | 81 (38.6%) | 0 (0.0%) |
| 8 or more Rooms | 33 (15.7%) | 11 (17.2%) |
| Total | 210 (100.0%) | 64 (100.0%) |
Housing Structure by Heating Type in Matador
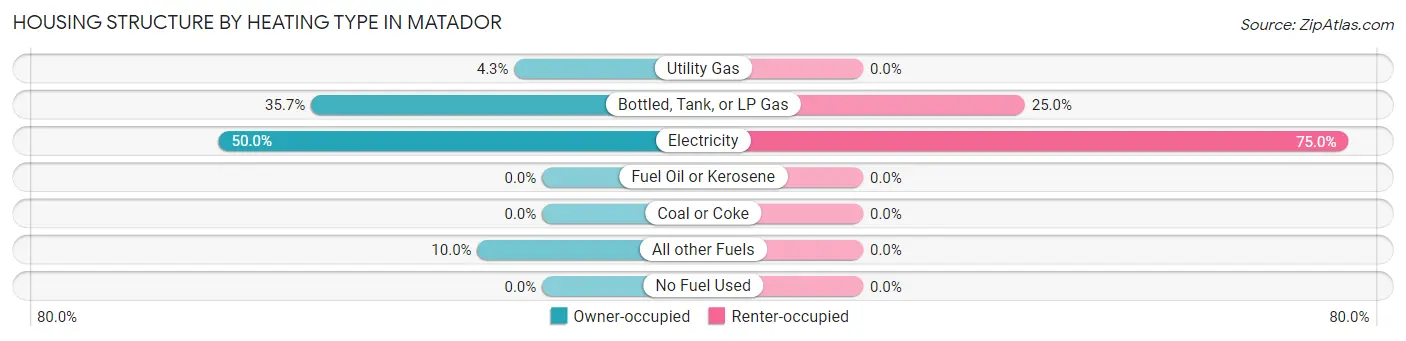
| Heating Type | Owner-occupied | Renter-occupied |
| Utility Gas | 9 (4.3%) | 0 (0.0%) |
| Bottled, Tank, or LP Gas | 75 (35.7%) | 16 (25.0%) |
| Electricity | 105 (50.0%) | 48 (75.0%) |
| Fuel Oil or Kerosene | 0 (0.0%) | 0 (0.0%) |
| Coal or Coke | 0 (0.0%) | 0 (0.0%) |
| All other Fuels | 21 (10.0%) | 0 (0.0%) |
| No Fuel Used | 0 (0.0%) | 0 (0.0%) |
| Total | 210 (100.0%) | 64 (100.0%) |
Household Vehicle Usage in Matador
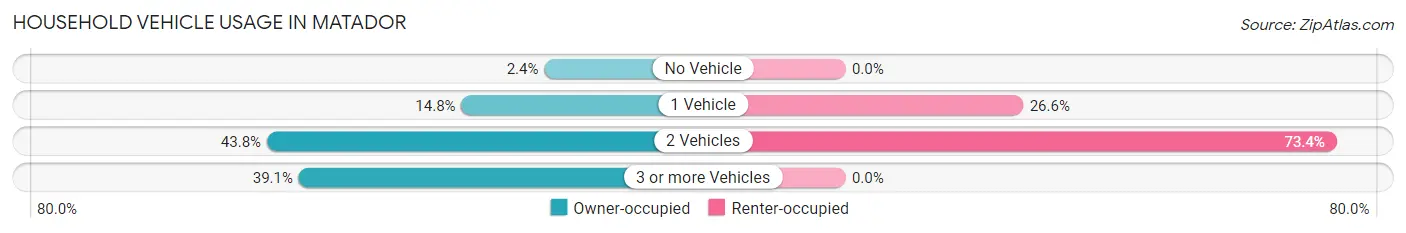
| Vehicles per Household | Owner-occupied | Renter-occupied |
| No Vehicle | 5 (2.4%) | 0 (0.0%) |
| 1 Vehicle | 31 (14.8%) | 17 (26.6%) |
| 2 Vehicles | 92 (43.8%) | 47 (73.4%) |
| 3 or more Vehicles | 82 (39.1%) | 0 (0.0%) |
| Total | 210 (100.0%) | 64 (100.0%) |
Real Estate & Mortgages in Matador
Real Estate and Mortgage Overview in Matador
| Characteristic | Without Mortgage | With Mortgage |
| Housing Units | 143 | 67 |
| Median Property Value | $57,900 | $105,700 |
| Median Household Income | $65,781 | $0 |
| Monthly Housing Costs | $422 | $0 |
| Real Estate Taxes | $826 | $0 |
Property Value by Mortgage Status in Matador
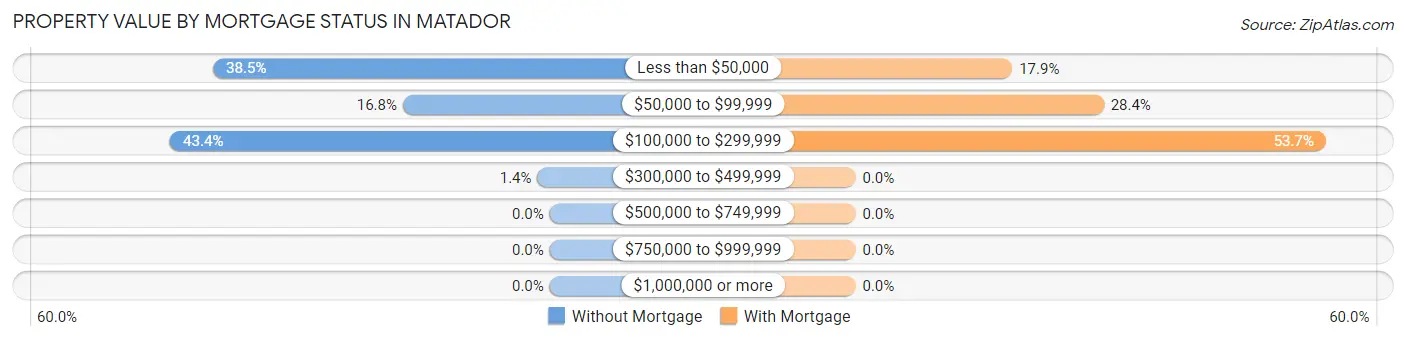
| Property Value | Without Mortgage | With Mortgage |
| Less than $50,000 | 55 (38.5%) | 12 (17.9%) |
| $50,000 to $99,999 | 24 (16.8%) | 19 (28.4%) |
| $100,000 to $299,999 | 62 (43.4%) | 36 (53.7%) |
| $300,000 to $499,999 | 2 (1.4%) | 0 (0.0%) |
| $500,000 to $749,999 | 0 (0.0%) | 0 (0.0%) |
| $750,000 to $999,999 | 0 (0.0%) | 0 (0.0%) |
| $1,000,000 or more | 0 (0.0%) | 0 (0.0%) |
| Total | 143 (100.0%) | 67 (100.0%) |
Household Income by Mortgage Status in Matador
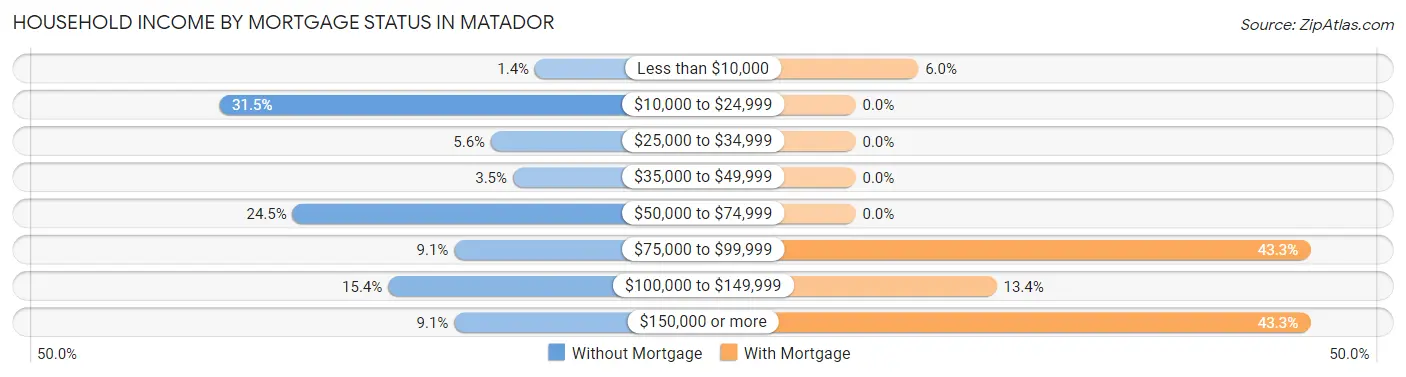
| Household Income | Without Mortgage | With Mortgage |
| Less than $10,000 | 2 (1.4%) | 4 (6.0%) |
| $10,000 to $24,999 | 45 (31.5%) | 0 (0.0%) |
| $25,000 to $34,999 | 8 (5.6%) | 0 (0.0%) |
| $35,000 to $49,999 | 5 (3.5%) | 0 (0.0%) |
| $50,000 to $74,999 | 35 (24.5%) | 0 (0.0%) |
| $75,000 to $99,999 | 13 (9.1%) | 29 (43.3%) |
| $100,000 to $149,999 | 22 (15.4%) | 9 (13.4%) |
| $150,000 or more | 13 (9.1%) | 29 (43.3%) |
| Total | 143 (100.0%) | 67 (100.0%) |
Property Value to Household Income Ratio in Matador
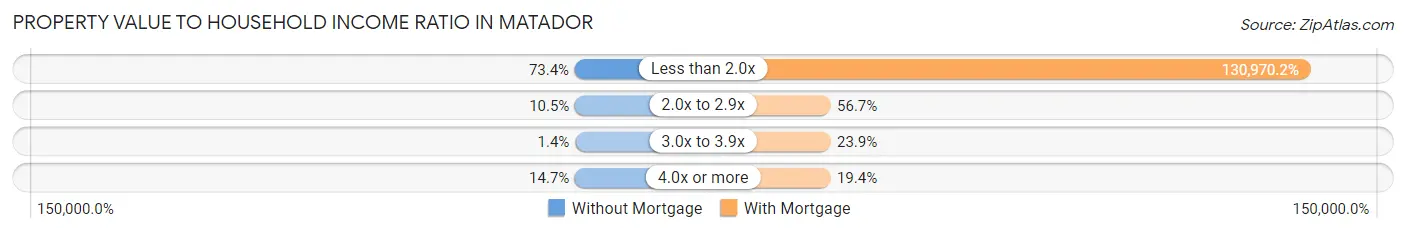
| Value-to-Income Ratio | Without Mortgage | With Mortgage |
| Less than 2.0x | 105 (73.4%) | 87,750 (130,970.1%) |
| 2.0x to 2.9x | 15 (10.5%) | 38 (56.7%) |
| 3.0x to 3.9x | 2 (1.4%) | 16 (23.9%) |
| 4.0x or more | 21 (14.7%) | 13 (19.4%) |
| Total | 143 (100.0%) | 67 (100.0%) |
Real Estate Taxes by Mortgage Status in Matador
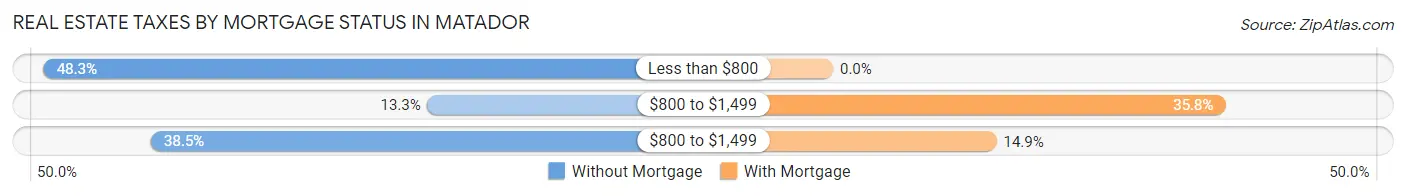
| Property Taxes | Without Mortgage | With Mortgage |
| Less than $800 | 69 (48.2%) | 0 (0.0%) |
| $800 to $1,499 | 19 (13.3%) | 24 (35.8%) |
| $800 to $1,499 | 55 (38.5%) | 10 (14.9%) |
| Total | 143 (100.0%) | 67 (100.0%) |
Health & Disability in Matador
Health Insurance Coverage by Age in Matador
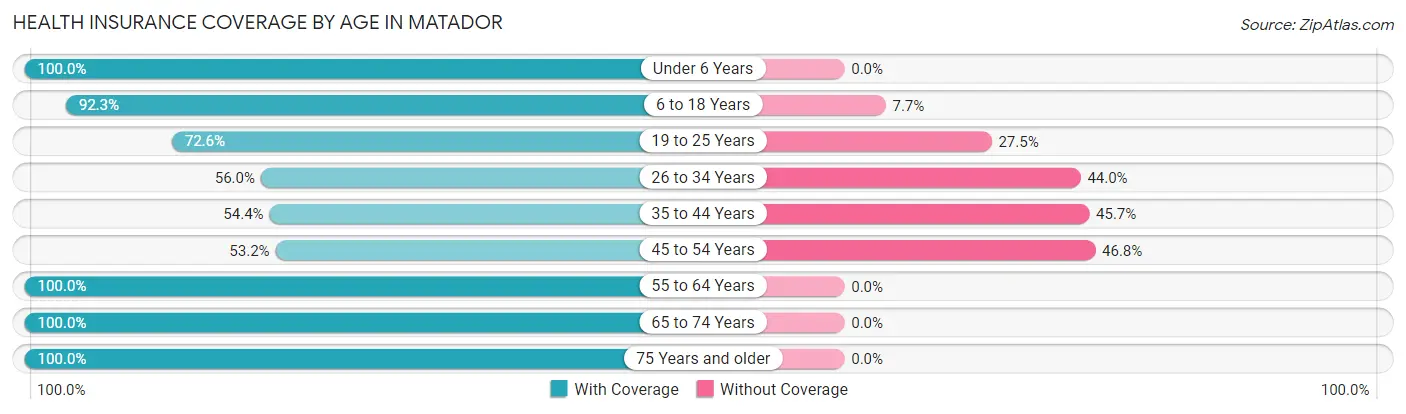
| Age Bracket | With Coverage | Without Coverage |
| Under 6 Years | 67 (100.0%) | 0 (0.0%) |
| 6 to 18 Years | 120 (92.3%) | 10 (7.7%) |
| 19 to 25 Years | 37 (72.6%) | 14 (27.5%) |
| 26 to 34 Years | 61 (56.0%) | 48 (44.0%) |
| 35 to 44 Years | 25 (54.3%) | 21 (45.7%) |
| 45 to 54 Years | 33 (53.2%) | 29 (46.8%) |
| 55 to 64 Years | 77 (100.0%) | 0 (0.0%) |
| 65 to 74 Years | 137 (100.0%) | 0 (0.0%) |
| 75 Years and older | 68 (100.0%) | 0 (0.0%) |
| Total | 625 (83.7%) | 122 (16.3%) |
Health Insurance Coverage by Citizenship Status in Matador
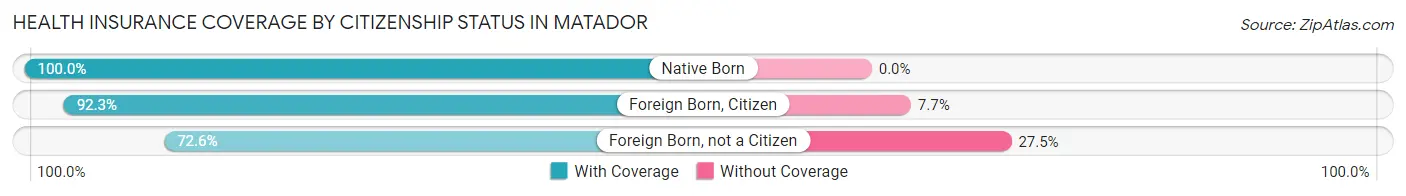
| Citizenship Status | With Coverage | Without Coverage |
| Native Born | 67 (100.0%) | 0 (0.0%) |
| Foreign Born, Citizen | 120 (92.3%) | 10 (7.7%) |
| Foreign Born, not a Citizen | 37 (72.6%) | 14 (27.5%) |
Health Insurance Coverage by Household Income in Matador
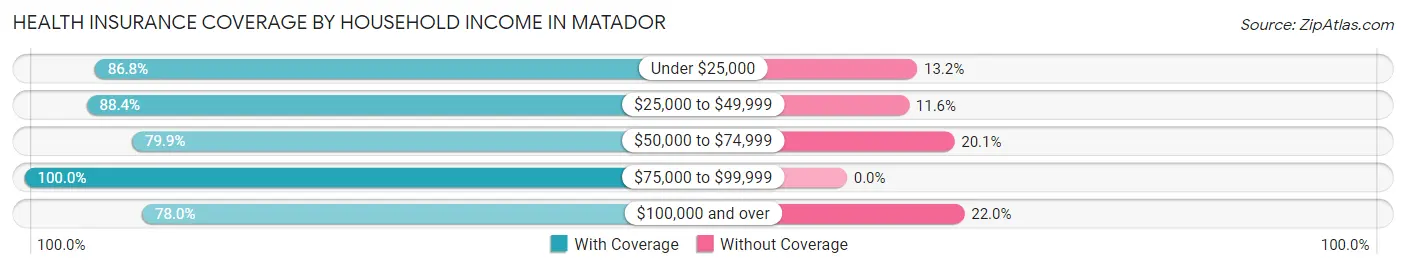
| Household Income | With Coverage | Without Coverage |
| Under $25,000 | 66 (86.8%) | 10 (13.2%) |
| $25,000 to $49,999 | 38 (88.4%) | 5 (11.6%) |
| $50,000 to $74,999 | 234 (79.9%) | 59 (20.1%) |
| $75,000 to $99,999 | 117 (100.0%) | 0 (0.0%) |
| $100,000 and over | 170 (78.0%) | 48 (22.0%) |
Public vs Private Health Insurance Coverage by Age in Matador
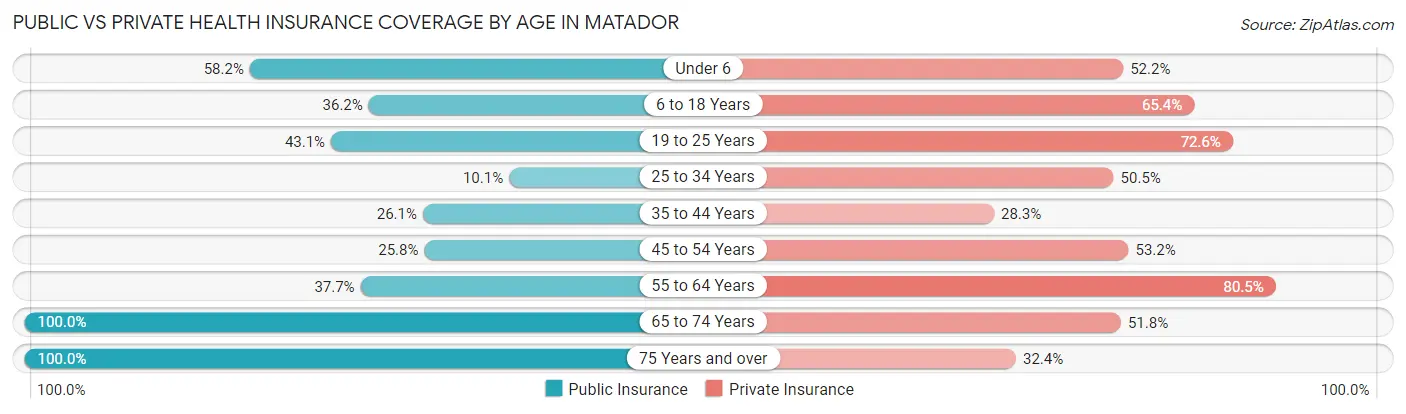
| Age Bracket | Public Insurance | Private Insurance |
| Under 6 | 39 (58.2%) | 35 (52.2%) |
| 6 to 18 Years | 47 (36.1%) | 85 (65.4%) |
| 19 to 25 Years | 22 (43.1%) | 37 (72.6%) |
| 25 to 34 Years | 11 (10.1%) | 55 (50.5%) |
| 35 to 44 Years | 12 (26.1%) | 13 (28.3%) |
| 45 to 54 Years | 16 (25.8%) | 33 (53.2%) |
| 55 to 64 Years | 29 (37.7%) | 62 (80.5%) |
| 65 to 74 Years | 137 (100.0%) | 71 (51.8%) |
| 75 Years and over | 68 (100.0%) | 22 (32.4%) |
| Total | 381 (51.0%) | 413 (55.3%) |
Disability Status by Sex by Age in Matador
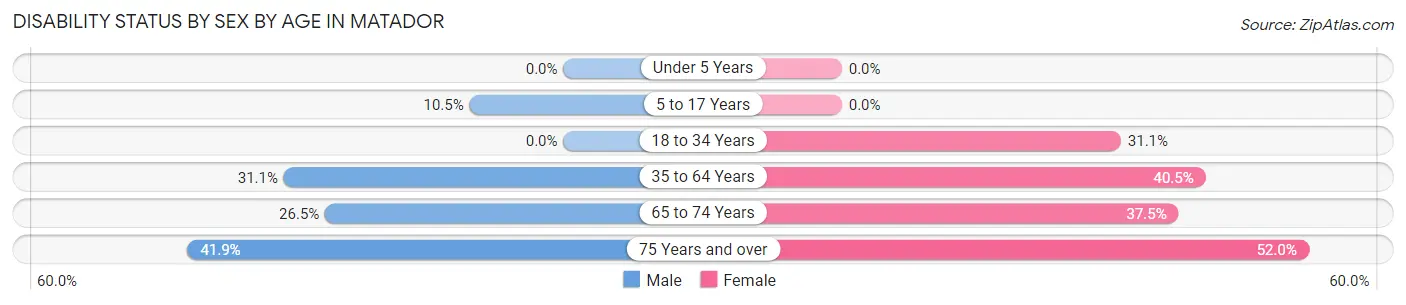
| Age Bracket | Male | Female |
| Under 5 Years | 0 (0.0%) | 0 (0.0%) |
| 5 to 17 Years | 7 (10.4%) | 0 (0.0%) |
| 18 to 34 Years | 0 (0.0%) | 23 (31.1%) |
| 35 to 64 Years | 33 (31.1%) | 32 (40.5%) |
| 65 to 74 Years | 13 (26.5%) | 33 (37.5%) |
| 75 Years and over | 18 (41.9%) | 13 (52.0%) |
Disability Class by Sex by Age in Matador
Disability Class: Hearing Difficulty
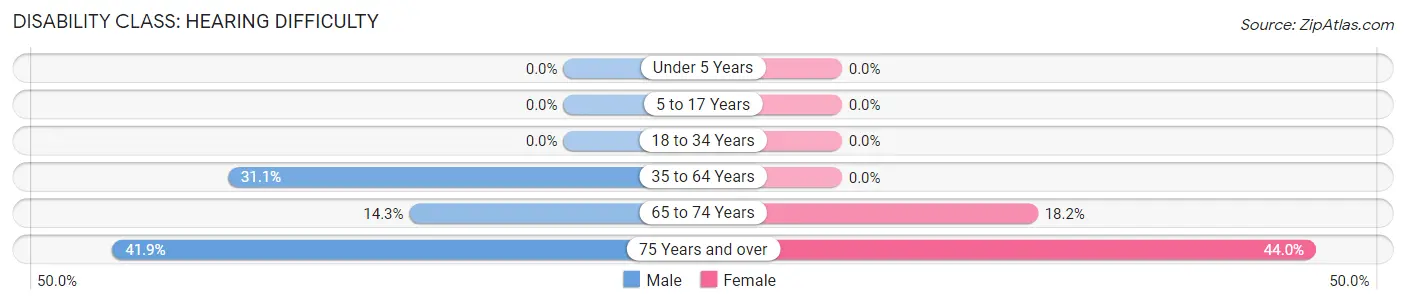
| Age Bracket | Male | Female |
| Under 5 Years | 0 (0.0%) | 0 (0.0%) |
| 5 to 17 Years | 0 (0.0%) | 0 (0.0%) |
| 18 to 34 Years | 0 (0.0%) | 0 (0.0%) |
| 35 to 64 Years | 33 (31.1%) | 0 (0.0%) |
| 65 to 74 Years | 7 (14.3%) | 16 (18.2%) |
| 75 Years and over | 18 (41.9%) | 11 (44.0%) |
Disability Class: Vision Difficulty
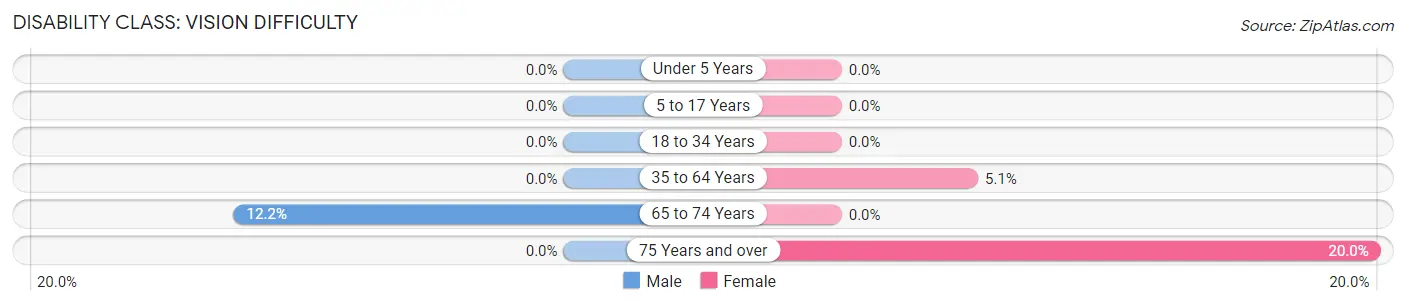
| Age Bracket | Male | Female |
| Under 5 Years | 0 (0.0%) | 0 (0.0%) |
| 5 to 17 Years | 0 (0.0%) | 0 (0.0%) |
| 18 to 34 Years | 0 (0.0%) | 0 (0.0%) |
| 35 to 64 Years | 0 (0.0%) | 4 (5.1%) |
| 65 to 74 Years | 6 (12.2%) | 0 (0.0%) |
| 75 Years and over | 0 (0.0%) | 5 (20.0%) |
Disability Class: Cognitive Difficulty
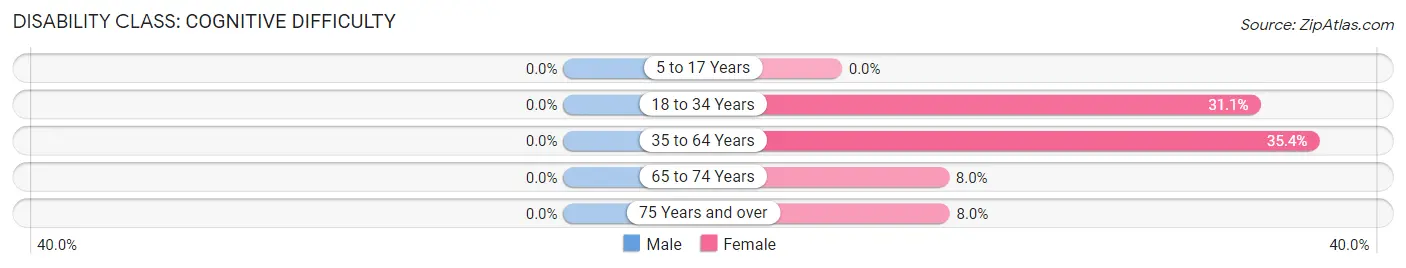
| Age Bracket | Male | Female |
| 5 to 17 Years | 0 (0.0%) | 0 (0.0%) |
| 18 to 34 Years | 0 (0.0%) | 23 (31.1%) |
| 35 to 64 Years | 0 (0.0%) | 28 (35.4%) |
| 65 to 74 Years | 0 (0.0%) | 7 (8.0%) |
| 75 Years and over | 0 (0.0%) | 2 (8.0%) |
Disability Class: Ambulatory Difficulty
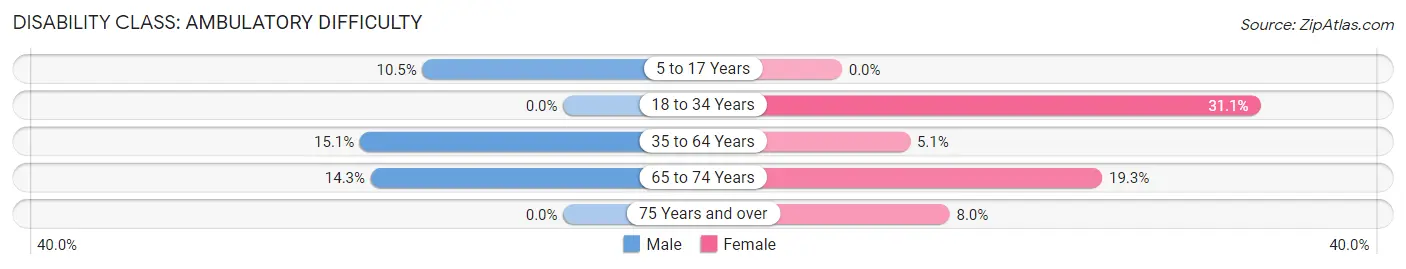
| Age Bracket | Male | Female |
| 5 to 17 Years | 7 (10.4%) | 0 (0.0%) |
| 18 to 34 Years | 0 (0.0%) | 23 (31.1%) |
| 35 to 64 Years | 16 (15.1%) | 4 (5.1%) |
| 65 to 74 Years | 7 (14.3%) | 17 (19.3%) |
| 75 Years and over | 0 (0.0%) | 2 (8.0%) |
Disability Class: Self-Care Difficulty
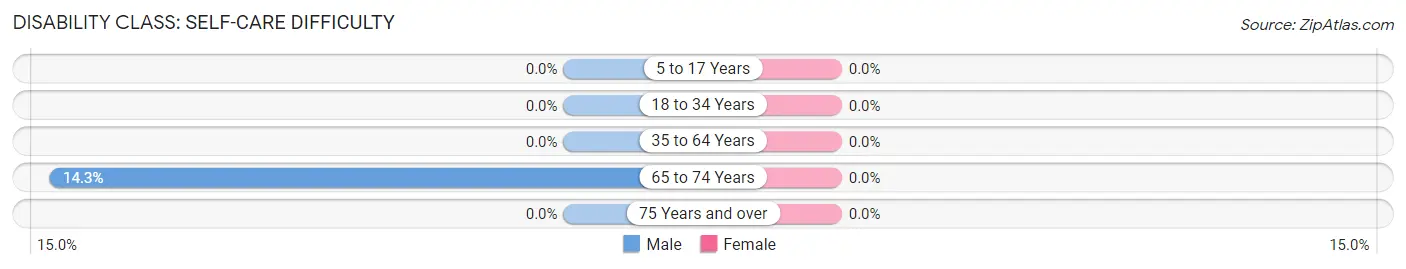
| Age Bracket | Male | Female |
| 5 to 17 Years | 0 (0.0%) | 0 (0.0%) |
| 18 to 34 Years | 0 (0.0%) | 0 (0.0%) |
| 35 to 64 Years | 0 (0.0%) | 0 (0.0%) |
| 65 to 74 Years | 7 (14.3%) | 0 (0.0%) |
| 75 Years and over | 0 (0.0%) | 0 (0.0%) |
Technology Access in Matador
Computing Device Access in Matador
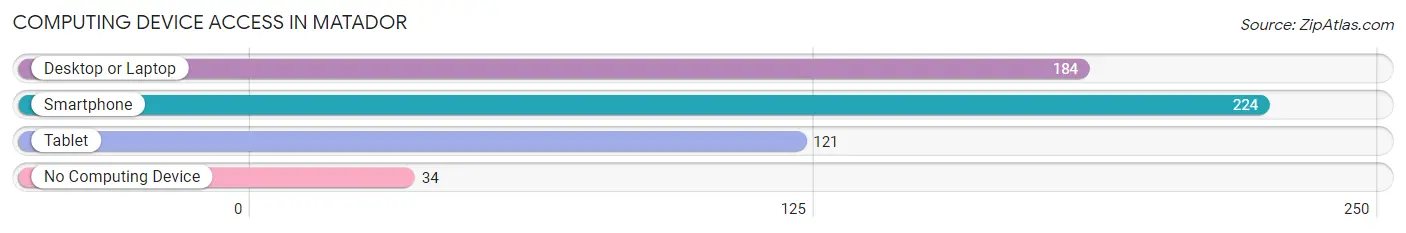
| Device Type | # Households | % Households |
| Desktop or Laptop | 184 | 67.1% |
| Smartphone | 224 | 81.8% |
| Tablet | 121 | 44.2% |
| No Computing Device | 34 | 12.4% |
| Total | 274 | 100.0% |
Internet Access in Matador
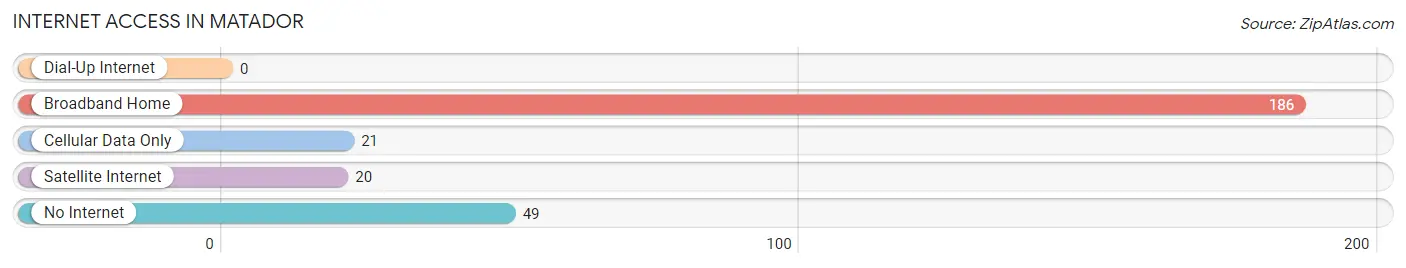
| Internet Type | # Households | % Households |
| Dial-Up Internet | 0 | 0.0% |
| Broadband Home | 186 | 67.9% |
| Cellular Data Only | 21 | 7.7% |
| Satellite Internet | 20 | 7.3% |
| No Internet | 49 | 17.9% |
| Total | 274 | 100.0% |
Matador Summary
Matador, Texas is a small town located in Motley County in the Texas Panhandle. It is situated on the banks of the Red River, approximately 90 miles east of Amarillo. The town was founded in 1891 and has a population of approximately 1,000 people.
History
Matador was founded in 1891 by a group of settlers from the nearby town of Paducah. The settlers were looking for a place to settle and start a new life. The town was named after the Matador Ranch, which was owned by the settlers. The town was officially incorporated in 1892 and the first post office was established in 1893.
The town grew slowly but steadily over the years, and by the early 1900s, it had become a thriving community. The town was home to several businesses, including a bank, a hotel, a general store, and a blacksmith shop. The town also had a school, a church, and a newspaper.
In the 1920s, the town experienced a period of growth and prosperity. The population increased from 500 to 1,000 people, and the town was home to several businesses, including a cotton gin, a flour mill, and a creamery.
In the 1930s, the Great Depression hit the town hard. Many businesses closed and the population decreased. However, the town was able to survive and by the 1940s, the population had increased to 1,200 people.
Geography
Matador is located in the Texas Panhandle, approximately 90 miles east of Amarillo. The town is situated on the banks of the Red River, which provides a natural border between Texas and Oklahoma. The town is surrounded by flat, open plains and is located in an area known as the High Plains.
The climate in Matador is semi-arid, with hot summers and cold winters. The average annual temperature is around 65 degrees Fahrenheit, and the average annual precipitation is around 18 inches.
Economy
The economy of Matador is largely based on agriculture. The town is home to several farms and ranches, and the main crops grown in the area are cotton, wheat, and sorghum. The town is also home to several businesses, including a bank, a hotel, a general store, and a blacksmith shop.
Demographics
As of the 2010 census, the population of Matador was 1,000 people. The racial makeup of the town was 95.2% White, 0.7% African American, 0.3% Native American, 0.2% Asian, 0.1% Pacific Islander, and 3.5% from other races. The median household income was $30,000, and the median family income was $35,000.
Matador is a small town with a rich history and a bright future. The town is home to a diverse population and a thriving economy. The town is a great place to live, work, and raise a family.
Common Questions
What is the Total Population of Matador?
Total Population of Matador is 747.
What is the Total Male Population of Matador?
Total Male Population of Matador is 414.
What is the Total Female Population of Matador?
Total Female Population of Matador is 333.
What is the Ratio of Males per 100 Females in Matador?
There are 124.32 Males per 100 Females in Matador.
What is the Ratio of Females per 100 Males in Matador?
There are 80.43 Females per 100 Males in Matador.
What is the Median Population Age in Matador?
Median Population Age in Matador is 37.8 Years.
What is the Average Family Size in Matador
Average Family Size in Matador is 3.5 People.
What is the Average Household Size in Matador
Average Household Size in Matador is 2.7 People.
What is Per Capita Income in Matador?
Per Capita income in Matador is $28,710.
What is the Median Family Income in Matador?
Median Family Income in Matador is $71,908.
What is the Median Household income in Matador?
Median Household Income in Matador is $70,132.
What is Income or Wage Gap in Matador?
Income or Wage Gap in Matador is 18.3%.
Women in Matador earn 81.7 cents for every dollar earned by a man.
What is Inequality or Gini Index in Matador?
Inequality or Gini Index in Matador is 0.34.
How Large is the Labor Force in Matador?
There are 361 People in the Labor Forcein in Matador.
What is the Percentage of People in the Labor Force in Matador?
61.6% of People are in the Labor Force in Matador.
What is the Unemployment Rate in Matador?
Unemployment Rate in Matador is 5.0%.