Los Barreras, TX
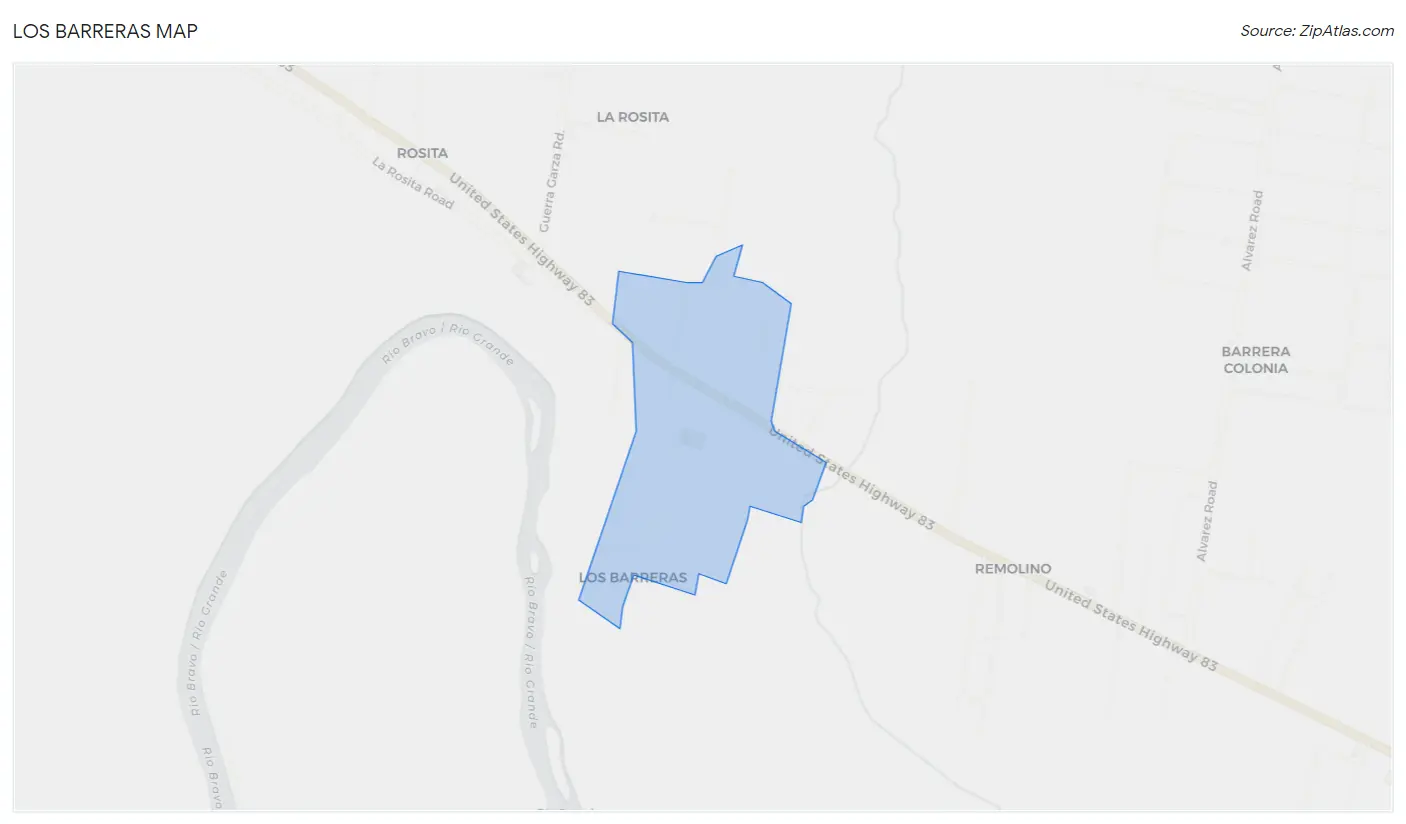
Los Barreras Map
Los Barreras Overview
351
TOTAL POPULATION
146
MALE POPULATION
205
FEMALE POPULATION
71.22
MALES / 100 FEMALES
140.41
FEMALES / 100 MALES
41.3
MEDIAN AGE
4.8
AVG FAMILY SIZE
2.5
AVG HOUSEHOLD SIZE
$20,698
PER CAPITA INCOME
$115,919
AVG FAMILY INCOME
31.2%
WAGE / INCOME GAP [ % ]
68.8¢/ $1
WAGE / INCOME GAP [ $ ]
0.46
INEQUALITY / GINI INDEX
144
LABOR FORCE [ PEOPLE ]
51.1%
PERCENT IN LABOR FORCE
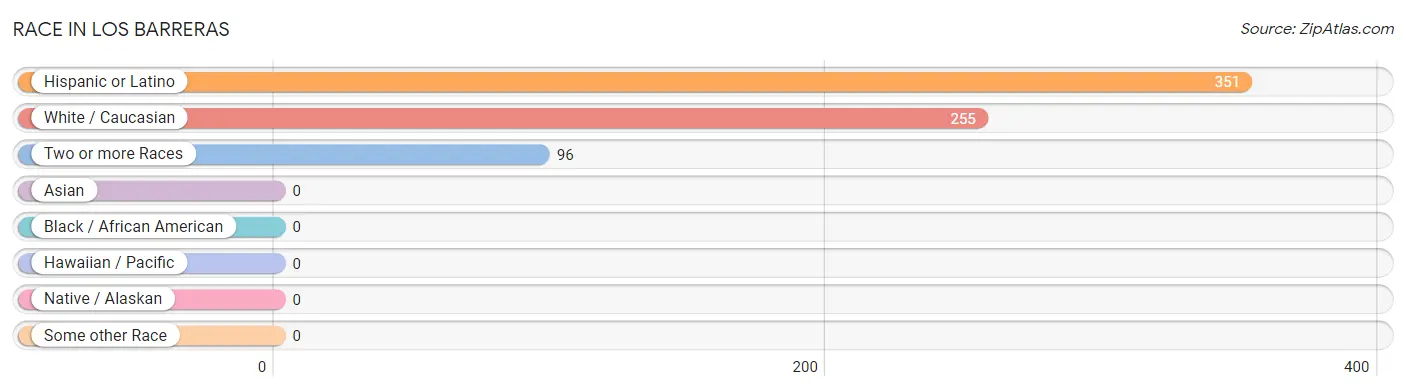
Race in Los Barreras
The most populous races in Los Barreras are Hispanic or Latino (351 | 100.0%), White / Caucasian (255 | 72.7%), and Two or more Races (96 | 27.4%).
| Race | # Population | % Population |
| Asian | 0 | 0.0% |
| Black / African American | 0 | 0.0% |
| Hawaiian / Pacific | 0 | 0.0% |
| Hispanic or Latino | 351 | 100.0% |
| Native / Alaskan | 0 | 0.0% |
| White / Caucasian | 255 | 72.7% |
| Two or more Races | 96 | 27.4% |
| Some other Race | 0 | 0.0% |
| Total | 351 | 100.0% |
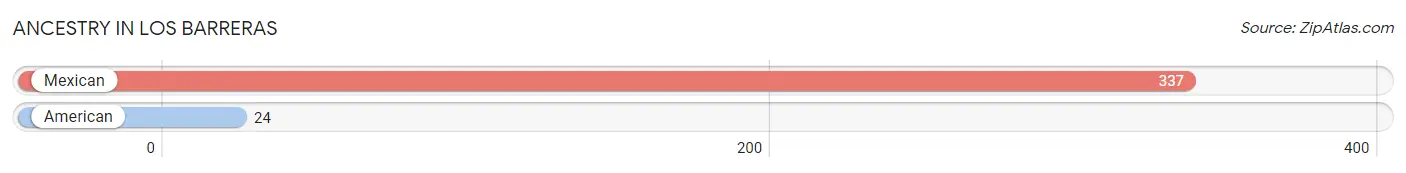
Ancestry in Los Barreras
The most populous ancestries reported in Los Barreras are Mexican (337 | 96.0%), and American (24 | 6.8%), together accounting for 102.8% of all Los Barreras residents.
| Ancestry | # Population | % Population |
| American | 24 | 6.8% |
| Mexican | 337 | 96.0% | View All 2 Rows |
Immigrants in Los Barreras

| Immigration Origin | # Population | % Population | View All 0 Rows |
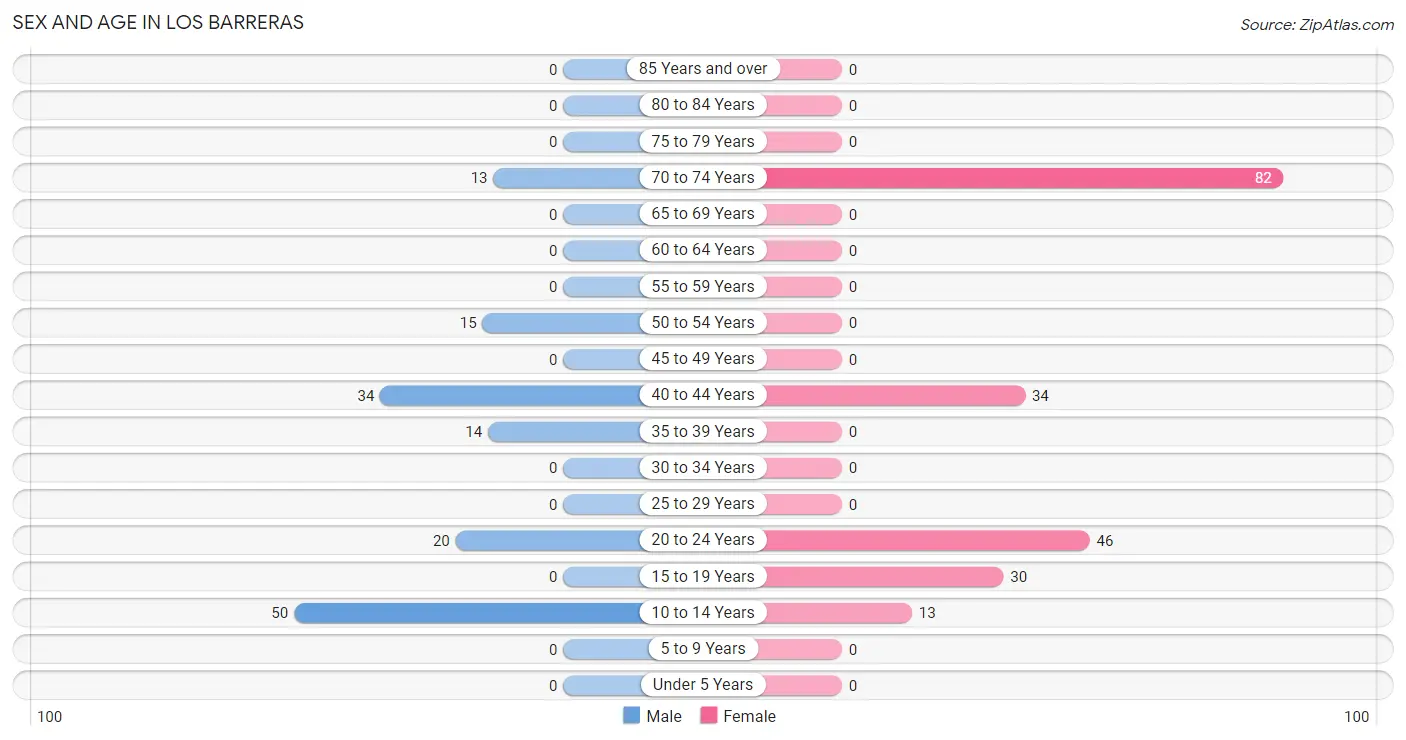
Sex and Age in Los Barreras
Sex and Age in Los Barreras
The most populous age groups in Los Barreras are 10 to 14 Years (50 | 34.3%) for men and 70 to 74 Years (82 | 40.0%) for women.
| Age Bracket | Male | Female |
| Under 5 Years | 0 (0.0%) | 0 (0.0%) |
| 5 to 9 Years | 0 (0.0%) | 0 (0.0%) |
| 10 to 14 Years | 50 (34.3%) | 13 (6.3%) |
| 15 to 19 Years | 0 (0.0%) | 30 (14.6%) |
| 20 to 24 Years | 20 (13.7%) | 46 (22.4%) |
| 25 to 29 Years | 0 (0.0%) | 0 (0.0%) |
| 30 to 34 Years | 0 (0.0%) | 0 (0.0%) |
| 35 to 39 Years | 14 (9.6%) | 0 (0.0%) |
| 40 to 44 Years | 34 (23.3%) | 34 (16.6%) |
| 45 to 49 Years | 0 (0.0%) | 0 (0.0%) |
| 50 to 54 Years | 15 (10.3%) | 0 (0.0%) |
| 55 to 59 Years | 0 (0.0%) | 0 (0.0%) |
| 60 to 64 Years | 0 (0.0%) | 0 (0.0%) |
| 65 to 69 Years | 0 (0.0%) | 0 (0.0%) |
| 70 to 74 Years | 13 (8.9%) | 82 (40.0%) |
| 75 to 79 Years | 0 (0.0%) | 0 (0.0%) |
| 80 to 84 Years | 0 (0.0%) | 0 (0.0%) |
| 85 Years and over | 0 (0.0%) | 0 (0.0%) |
| Total | 146 (100.0%) | 205 (100.0%) |
Families and Households in Los Barreras
Median Family Size in Los Barreras
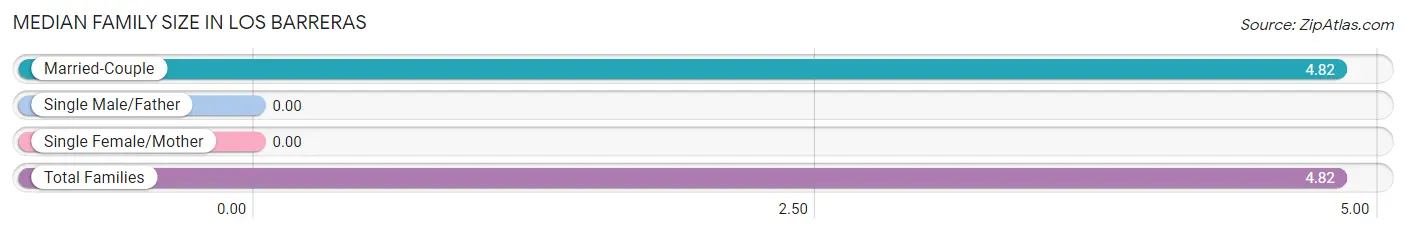
| Family Type | # Families | Family Size |
| Married-Couple | 55 (100.0%) | 4.82 |
| Single Male/Father | 0 (0.0%) | - |
| Single Female/Mother | 0 (0.0%) | - |
| Total Families | 55 (100.0%) | 4.82 |
Median Household Size in Los Barreras
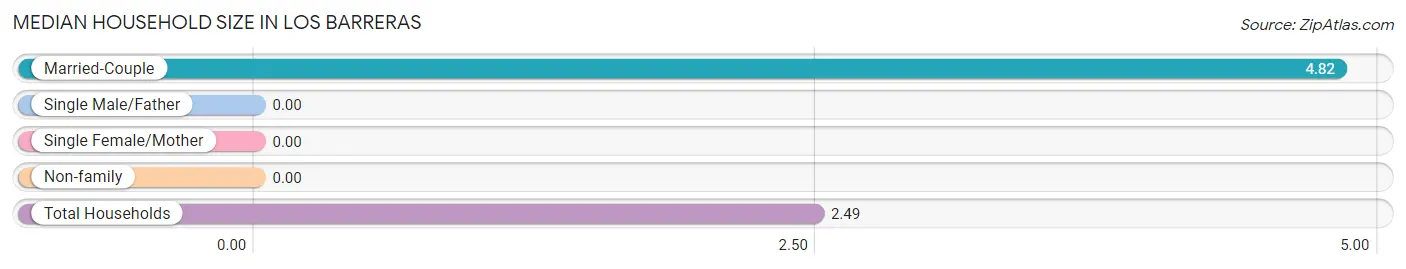
| Household Type | # Households | Household Size |
| Married-Couple | 55 (39.0%) | 4.82 |
| Single Male/Father | 0 (0.0%) | - |
| Single Female/Mother | 0 (0.0%) | - |
| Non-family | 86 (61.0%) | - |
| Total Households | 141 (100.0%) | 2.49 |
Household Size by Marriage Status in Los Barreras
Out of a total of 141 households in Los Barreras, 55 (39.0%) are family households, while 86 (61.0%) are nonfamily households. The most numerous type of family households are 5-person households, comprising 44, and the most common type of nonfamily households are 1-person households, comprising 86.
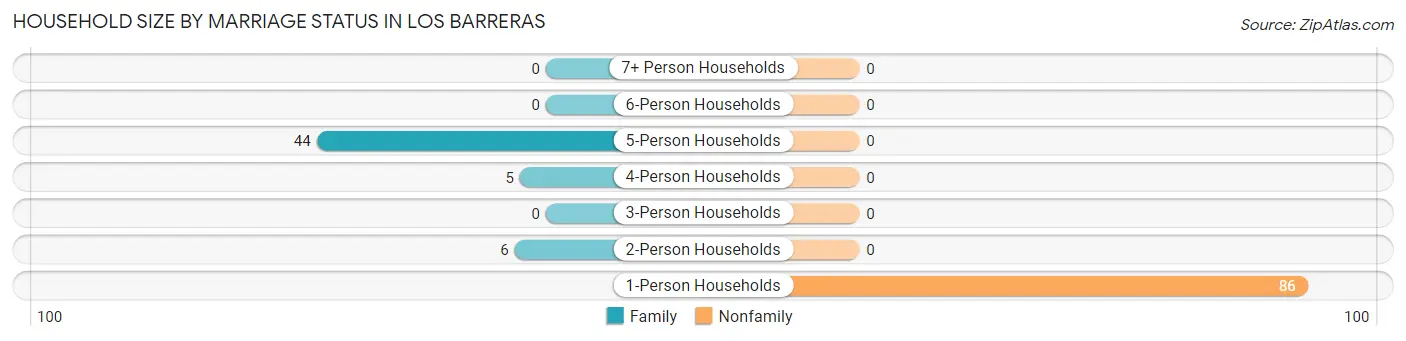
| Household Size | Family Households | Nonfamily Households |
| 1-Person Households | - | 86 (61.0%) |
| 2-Person Households | 6 (4.3%) | 0 (0.0%) |
| 3-Person Households | 0 (0.0%) | 0 (0.0%) |
| 4-Person Households | 5 (3.5%) | 0 (0.0%) |
| 5-Person Households | 44 (31.2%) | 0 (0.0%) |
| 6-Person Households | 0 (0.0%) | 0 (0.0%) |
| 7+ Person Households | 0 (0.0%) | 0 (0.0%) |
| Total | 55 (39.0%) | 86 (61.0%) |
Female Fertility in Los Barreras
Fertility by Age in Los Barreras
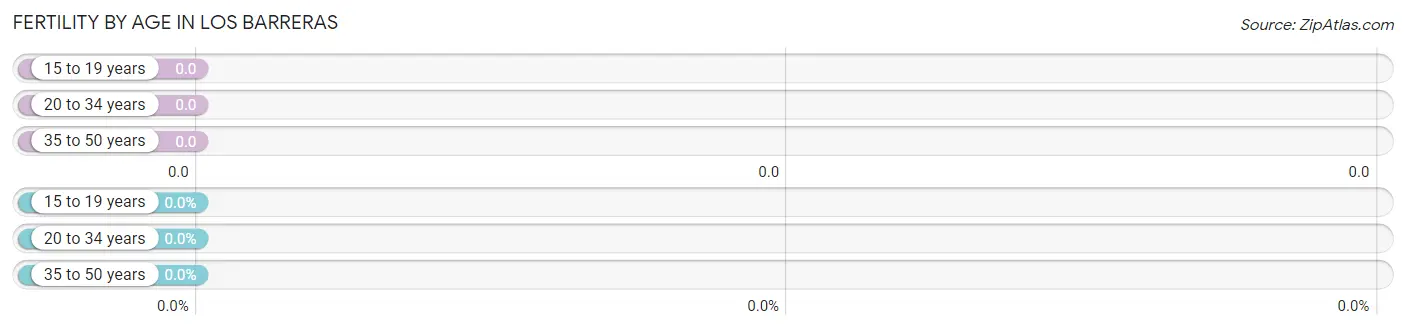
| Age Bracket | Women with Births | Births / 1,000 Women |
| 15 to 19 years | 0 (0.0%) | 0.0 |
| 20 to 34 years | 0 (0.0%) | 0.0 |
| 35 to 50 years | 0 (0.0%) | 0.0 |
| Total | 0 (0.0%) | 0.0 |
Fertility by Age by Marriage Status in Los Barreras
| Age Bracket | Married | Unmarried |
| 15 to 19 years | 0 (0.0%) | 0 (0.0%) |
| 20 to 34 years | 0 (0.0%) | 0 (0.0%) |
| 35 to 50 years | 0 (0.0%) | 0 (0.0%) |
| Total | 0 (0.0%) | 0 (0.0%) |
Fertility by Education in Los Barreras
| Educational Attainment | Women with Births | Births / 1,000 Women |
| Less than High School | 0 (0.0%) | 0.0 |
| High School Diploma | 0 (0.0%) | 0.0 |
| College or Associate's Degree | 0 (0.0%) | 0.0 |
| Bachelor's Degree | 0 (0.0%) | 0.0 |
| Graduate Degree | 0 (0.0%) | 0.0 |
| Total | 0 (0.0%) | 0.0 |
Fertility by Education by Marriage Status in Los Barreras
| Educational Attainment | Married | Unmarried |
| Less than High School | 0 (0.0%) | 0 (0.0%) |
| High School Diploma | 0 (0.0%) | 0 (0.0%) |
| College or Associate's Degree | 0 (0.0%) | 0 (0.0%) |
| Bachelor's Degree | 0 (0.0%) | 0 (0.0%) |
| Graduate Degree | 0 (0.0%) | 0 (0.0%) |
| Total | 0 (0.0%) | 0 (0.0%) |
Income in Los Barreras
Income Overview in Los Barreras
| Characteristic | Number | Measure |
| Per Capita Income | 351 | $20,698 |
| Median Family Income | 55 | $115,919 |
| Mean Family Income | 55 | $101,109 |
| Median Household Income | 141 | $0 |
| Mean Household Income | 141 | $52,364 |
| Income Deficit | 55 | $0 |
| Wage / Income Gap (%) | 351 | 31.16% |
| Wage / Income Gap ($) | 351 | 68.84¢ per $1 |
| Gini / Inequality Index | 351 | 0.46 |
Earnings by Sex in Los Barreras
Average Earnings in Los Barreras are $35,938, $47,757 for men and $32,875 for women, a difference of 31.2%.
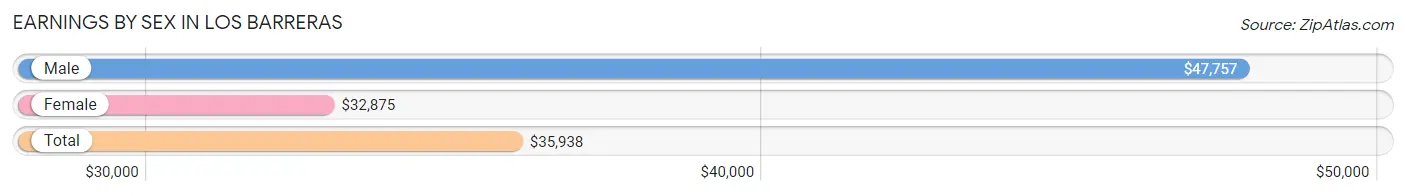
| Sex | Number | Average Earnings |
| Male | 91 (54.2%) | $47,757 |
| Female | 77 (45.8%) | $32,875 |
| Total | 168 (100.0%) | $35,938 |
Earnings by Sex by Income Bracket in Los Barreras
The most common earnings brackets in Los Barreras are $45,000 to $49,999 for men (34 | 37.4%) and $20,000 to $22,499 for women (37 | 48.0%).
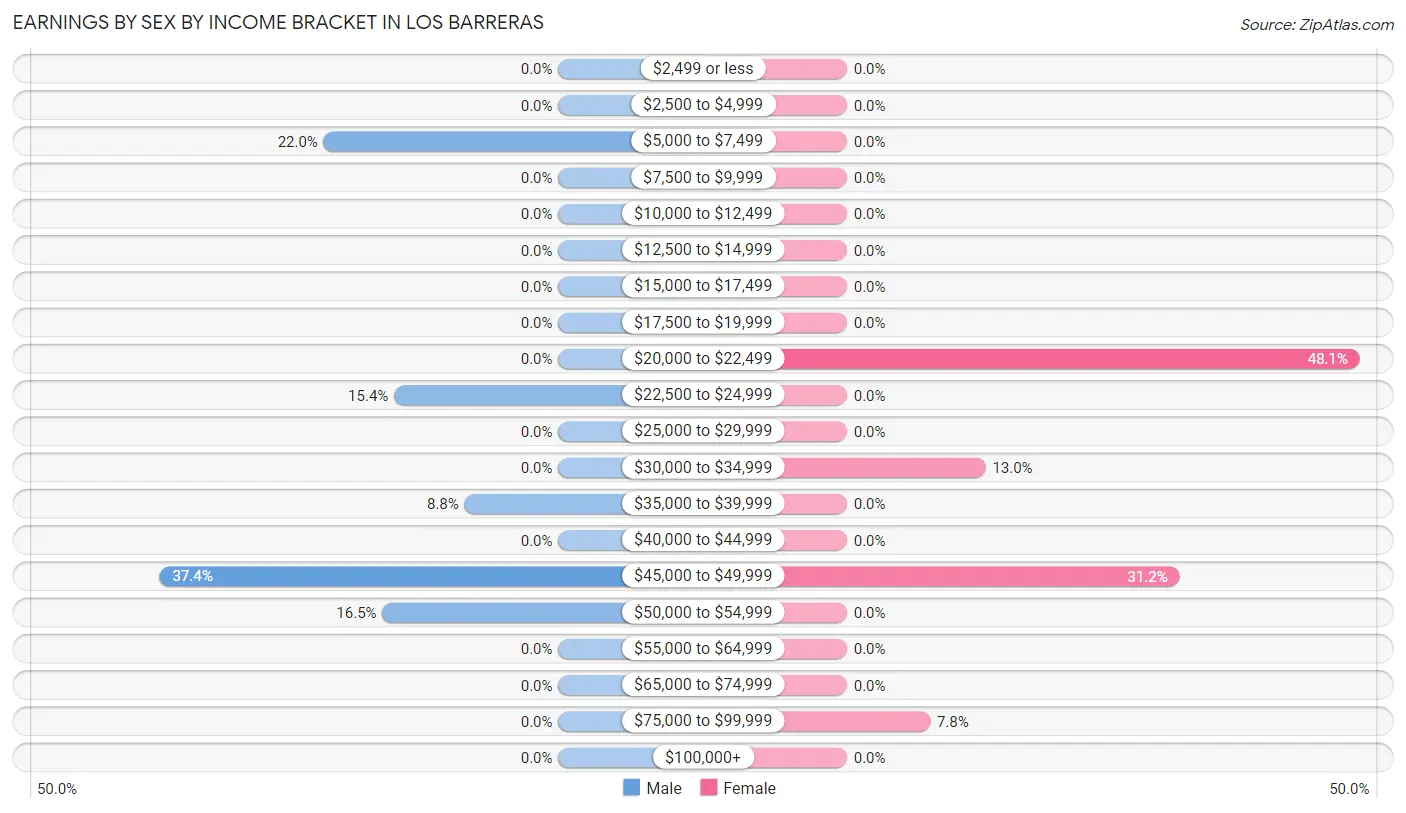
| Income | Male | Female |
| $2,499 or less | 0 (0.0%) | 0 (0.0%) |
| $2,500 to $4,999 | 0 (0.0%) | 0 (0.0%) |
| $5,000 to $7,499 | 20 (22.0%) | 0 (0.0%) |
| $7,500 to $9,999 | 0 (0.0%) | 0 (0.0%) |
| $10,000 to $12,499 | 0 (0.0%) | 0 (0.0%) |
| $12,500 to $14,999 | 0 (0.0%) | 0 (0.0%) |
| $15,000 to $17,499 | 0 (0.0%) | 0 (0.0%) |
| $17,500 to $19,999 | 0 (0.0%) | 0 (0.0%) |
| $20,000 to $22,499 | 0 (0.0%) | 37 (48.0%) |
| $22,500 to $24,999 | 14 (15.4%) | 0 (0.0%) |
| $25,000 to $29,999 | 0 (0.0%) | 0 (0.0%) |
| $30,000 to $34,999 | 0 (0.0%) | 10 (13.0%) |
| $35,000 to $39,999 | 8 (8.8%) | 0 (0.0%) |
| $40,000 to $44,999 | 0 (0.0%) | 0 (0.0%) |
| $45,000 to $49,999 | 34 (37.4%) | 24 (31.2%) |
| $50,000 to $54,999 | 15 (16.5%) | 0 (0.0%) |
| $55,000 to $64,999 | 0 (0.0%) | 0 (0.0%) |
| $65,000 to $74,999 | 0 (0.0%) | 0 (0.0%) |
| $75,000 to $99,999 | 0 (0.0%) | 6 (7.8%) |
| $100,000+ | 0 (0.0%) | 0 (0.0%) |
| Total | 91 (100.0%) | 77 (100.0%) |
Earnings by Sex by Educational Attainment in Los Barreras
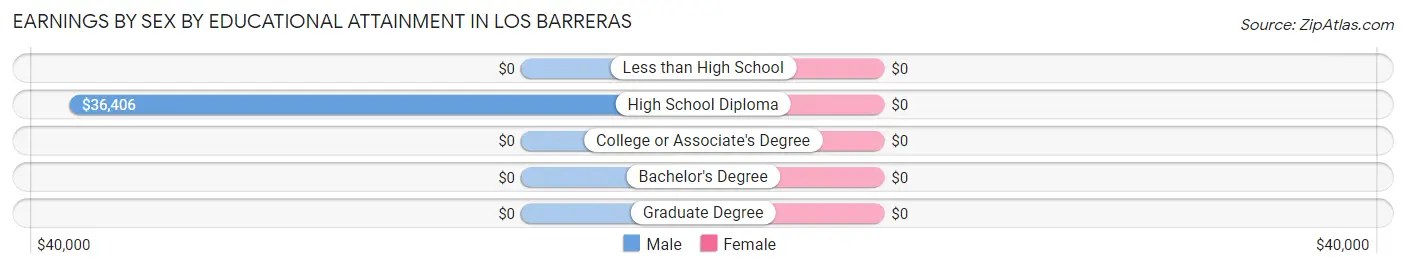
| Educational Attainment | Male Income | Female Income |
| Less than High School | - | - |
| High School Diploma | $36,406 | $0 |
| College or Associate's Degree | - | - |
| Bachelor's Degree | - | - |
| Graduate Degree | - | - |
| Total | $48,493 | $46,042 |
Family Income in Los Barreras
Family Income Brackets in Los Barreras
According to the Los Barreras family income data, there are 34 families falling into the $100,000 to $149,999 income range, which is the most common income bracket and makes up 61.8% of all families.
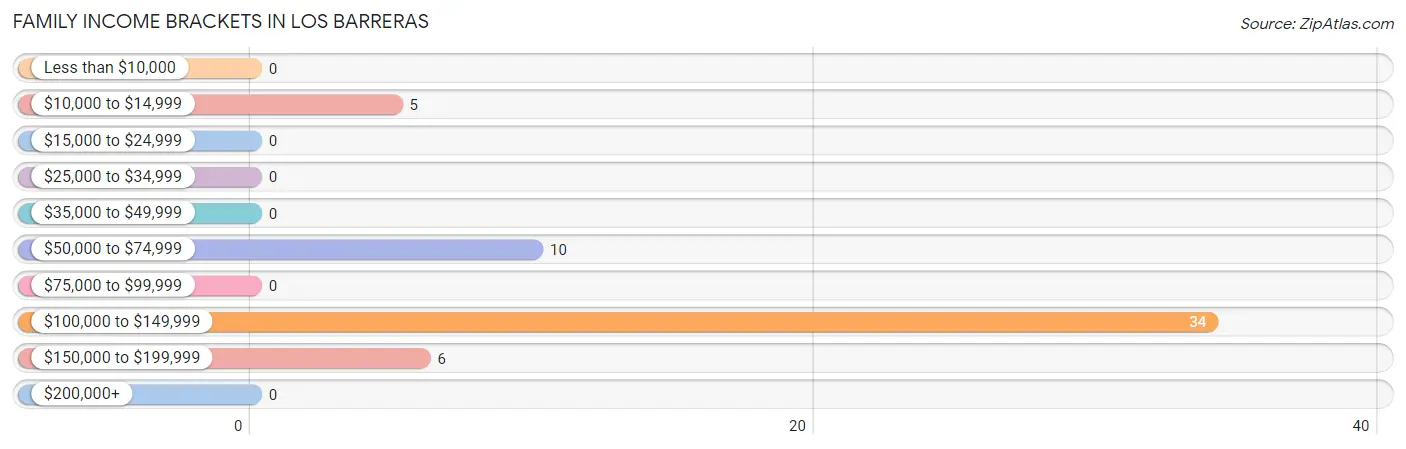
| Income Bracket | # Families | % Families |
| Less than $10,000 | 0 | 0.0% |
| $10,000 to $14,999 | 5 | 9.1% |
| $15,000 to $24,999 | 0 | 0.0% |
| $25,000 to $34,999 | 0 | 0.0% |
| $35,000 to $49,999 | 0 | 0.0% |
| $50,000 to $74,999 | 10 | 18.2% |
| $75,000 to $99,999 | 0 | 0.0% |
| $100,000 to $149,999 | 34 | 61.8% |
| $150,000 to $199,999 | 6 | 10.9% |
| $200,000+ | 0 | 0.0% |
Family Income by Famaliy Size in Los Barreras
| Income Bracket | # Families | Median Income |
| 2-Person Families | 6 (10.9%) | $0 |
| 3-Person Families | 0 (0.0%) | $0 |
| 4-Person Families | 5 (9.1%) | $0 |
| 5-Person Families | 44 (80.0%) | $0 |
| 6-Person Families | 0 (0.0%) | $0 |
| 7+ Person Families | 0 (0.0%) | $0 |
| Total | 55 (100.0%) | $115,919 |
Family Income by Number of Earners in Los Barreras
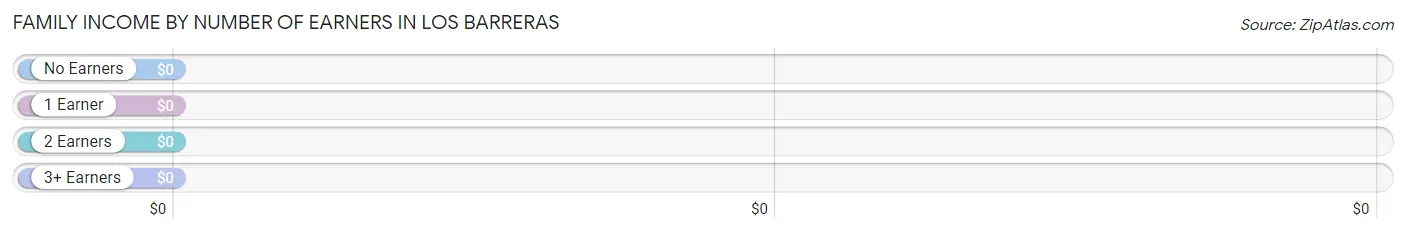
| Number of Earners | # Families | Median Income |
| No Earners | 5 (9.1%) | $0 |
| 1 Earner | 0 (0.0%) | $0 |
| 2 Earners | 6 (10.9%) | $0 |
| 3+ Earners | 44 (80.0%) | $0 |
| Total | 55 (100.0%) | $115,919 |
Household Income in Los Barreras
Household Income Brackets in Los Barreras
With 71 households falling in the category, the $15,000 to $24,999 income range is the most frequent in Los Barreras, accounting for 50.3% of all households.
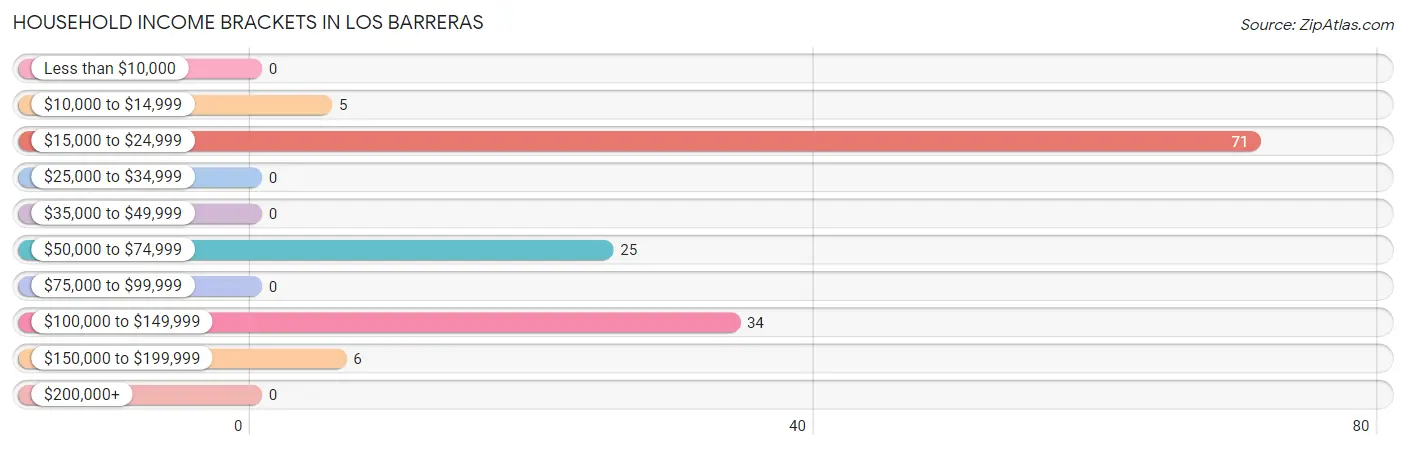
| Income Bracket | # Households | % Households |
| Less than $10,000 | 0 | 0.0% |
| $10,000 to $14,999 | 5 | 3.5% |
| $15,000 to $24,999 | 71 | 50.4% |
| $25,000 to $34,999 | 0 | 0.0% |
| $35,000 to $49,999 | 0 | 0.0% |
| $50,000 to $74,999 | 25 | 17.7% |
| $75,000 to $99,999 | 0 | 0.0% |
| $100,000 to $149,999 | 34 | 24.1% |
| $150,000 to $199,999 | 6 | 4.3% |
| $200,000+ | 0 | 0.0% |
Household Income by Householder Age in Los Barreras
The median household income in Los Barreras is $0, with the highest median household income of $16,268 found in the 65+ years age bracket for the primary householder. A total of 82 households (58.2%) fall into this category.
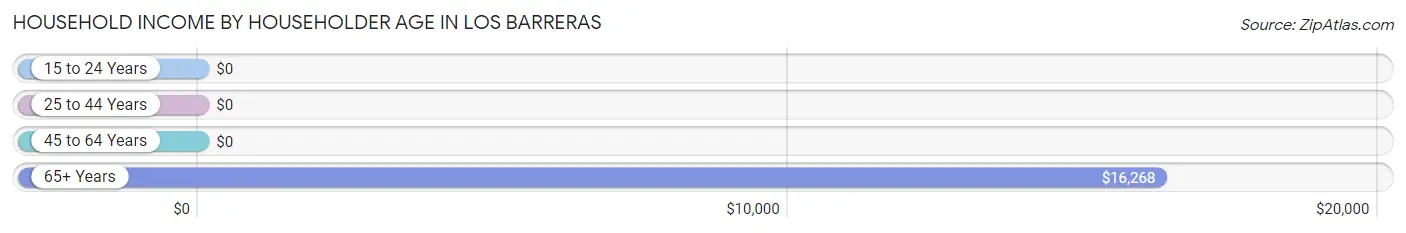
| Income Bracket | # Households | Median Income |
| 15 to 24 Years | 0 (0.0%) | $0 |
| 25 to 44 Years | 44 (31.2%) | $0 |
| 45 to 64 Years | 15 (10.6%) | $0 |
| 65+ Years | 82 (58.2%) | $16,268 |
| Total | 141 (100.0%) | $0 |
Poverty in Los Barreras
Income Below Poverty by Sex and Age in Los Barreras
With 3.4% poverty level for males and 9.8% for females among the residents of Los Barreras, 65 to 74 year old males and 15 year old females are the most vulnerable to poverty, with 5 males (38.5%) and 6 females (100.0%) in their respective age groups living below the poverty level.
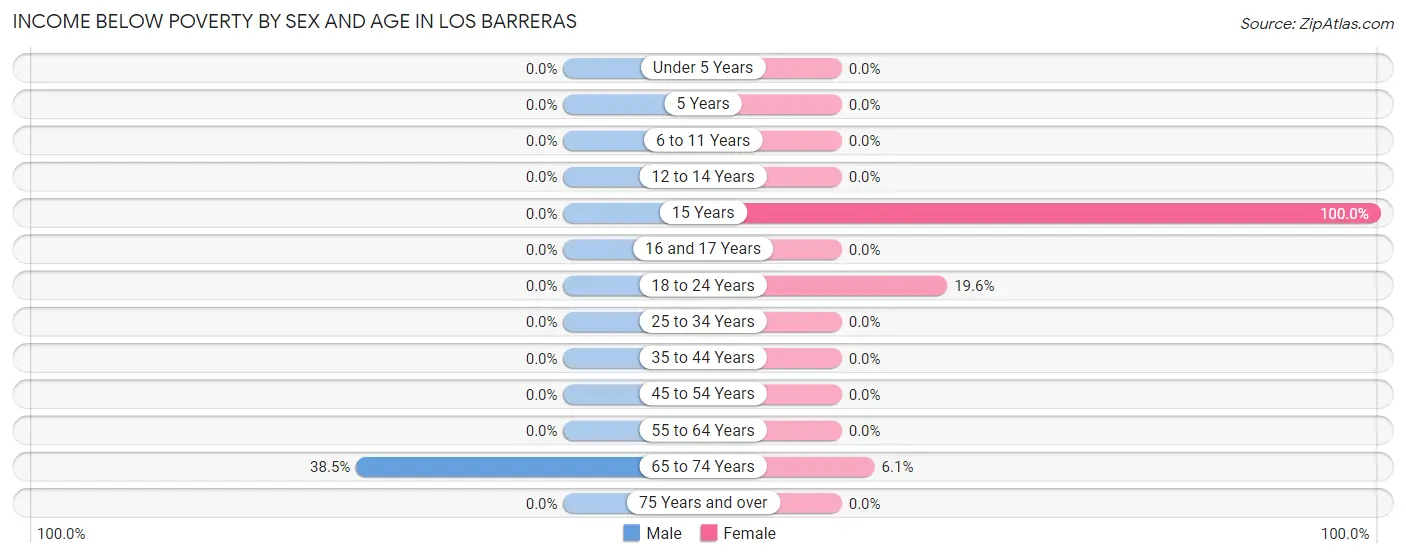
| Age Bracket | Male | Female |
| Under 5 Years | 0 (0.0%) | 0 (0.0%) |
| 5 Years | 0 (0.0%) | 0 (0.0%) |
| 6 to 11 Years | 0 (0.0%) | 0 (0.0%) |
| 12 to 14 Years | 0 (0.0%) | 0 (0.0%) |
| 15 Years | 0 (0.0%) | 6 (100.0%) |
| 16 and 17 Years | 0 (0.0%) | 0 (0.0%) |
| 18 to 24 Years | 0 (0.0%) | 9 (19.6%) |
| 25 to 34 Years | 0 (0.0%) | 0 (0.0%) |
| 35 to 44 Years | 0 (0.0%) | 0 (0.0%) |
| 45 to 54 Years | 0 (0.0%) | 0 (0.0%) |
| 55 to 64 Years | 0 (0.0%) | 0 (0.0%) |
| 65 to 74 Years | 5 (38.5%) | 5 (6.1%) |
| 75 Years and over | 0 (0.0%) | 0 (0.0%) |
| Total | 5 (3.4%) | 20 (9.8%) |
Income Above Poverty by Sex and Age in Los Barreras
According to the poverty statistics in Los Barreras, males aged 12 to 14 years and females aged 12 to 14 years are the age groups that are most secure financially, with 100.0% of males and 100.0% of females in these age groups living above the poverty line.
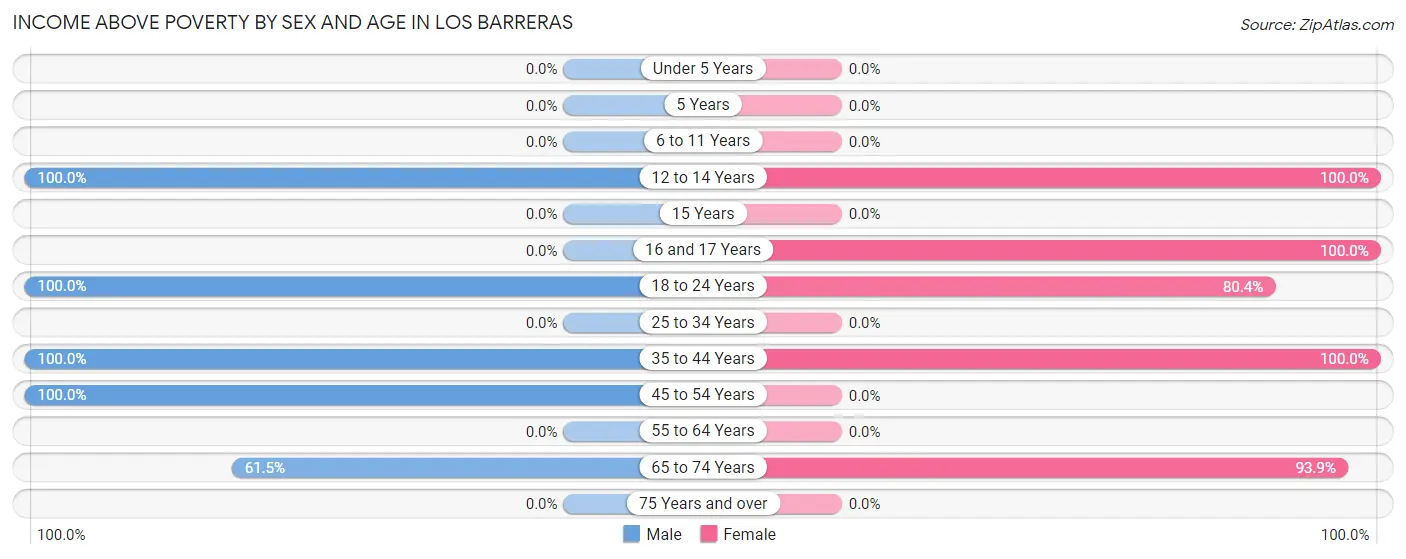
| Age Bracket | Male | Female |
| Under 5 Years | 0 (0.0%) | 0 (0.0%) |
| 5 Years | 0 (0.0%) | 0 (0.0%) |
| 6 to 11 Years | 0 (0.0%) | 0 (0.0%) |
| 12 to 14 Years | 50 (100.0%) | 13 (100.0%) |
| 15 Years | 0 (0.0%) | 0 (0.0%) |
| 16 and 17 Years | 0 (0.0%) | 24 (100.0%) |
| 18 to 24 Years | 20 (100.0%) | 37 (80.4%) |
| 25 to 34 Years | 0 (0.0%) | 0 (0.0%) |
| 35 to 44 Years | 48 (100.0%) | 34 (100.0%) |
| 45 to 54 Years | 15 (100.0%) | 0 (0.0%) |
| 55 to 64 Years | 0 (0.0%) | 0 (0.0%) |
| 65 to 74 Years | 8 (61.5%) | 77 (93.9%) |
| 75 Years and over | 0 (0.0%) | 0 (0.0%) |
| Total | 141 (96.6%) | 185 (90.2%) |
Income Below Poverty Among Married-Couple Families in Los Barreras
The poverty statistics for married-couple families in Los Barreras show that 9.1% or 5 of the total 55 families live below the poverty line. Families with 1 or 2 children have the highest poverty rate of 10.2%, comprising of 5 families. On the other hand, families with no children have the lowest poverty rate of 0.0%, which includes 0 families.
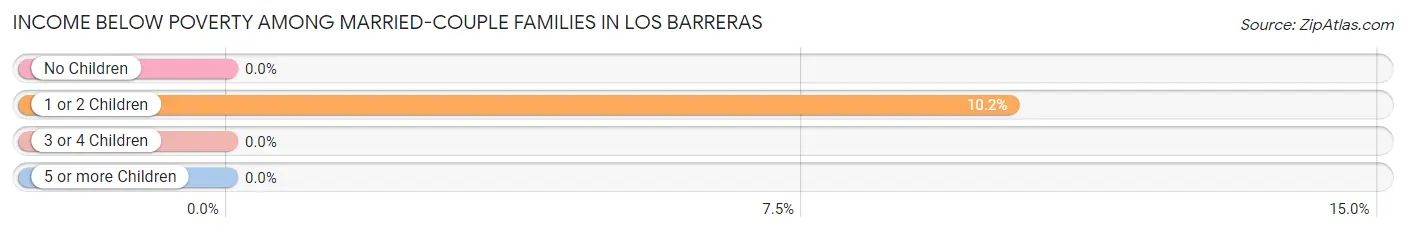
| Children | Above Poverty | Below Poverty |
| No Children | 6 (100.0%) | 0 (0.0%) |
| 1 or 2 Children | 44 (89.8%) | 5 (10.2%) |
| 3 or 4 Children | 0 (0.0%) | 0 (0.0%) |
| 5 or more Children | 0 (0.0%) | 0 (0.0%) |
| Total | 50 (90.9%) | 5 (9.1%) |
Income Below Poverty Among Single-Parent Households in Los Barreras
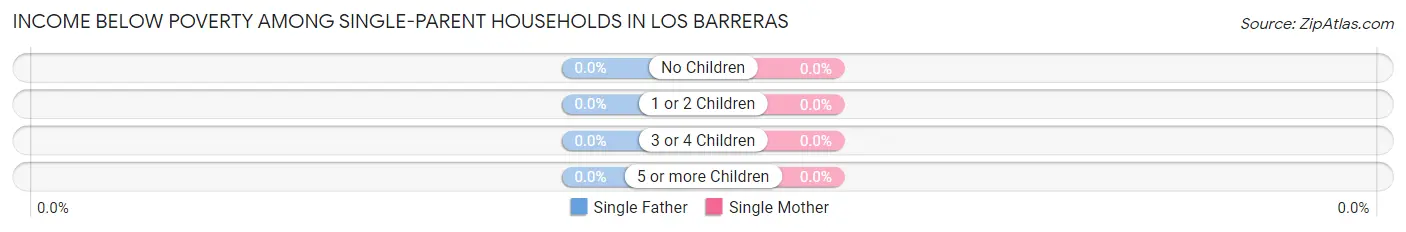
| Children | Single Father | Single Mother |
| No Children | 0 (0.0%) | 0 (0.0%) |
| 1 or 2 Children | 0 (0.0%) | 0 (0.0%) |
| 3 or 4 Children | 0 (0.0%) | 0 (0.0%) |
| 5 or more Children | 0 (0.0%) | 0 (0.0%) |
| Total | 0 (0.0%) | 0 (0.0%) |
Income Below Poverty Among Married-Couple vs Single-Parent Households in Los Barreras
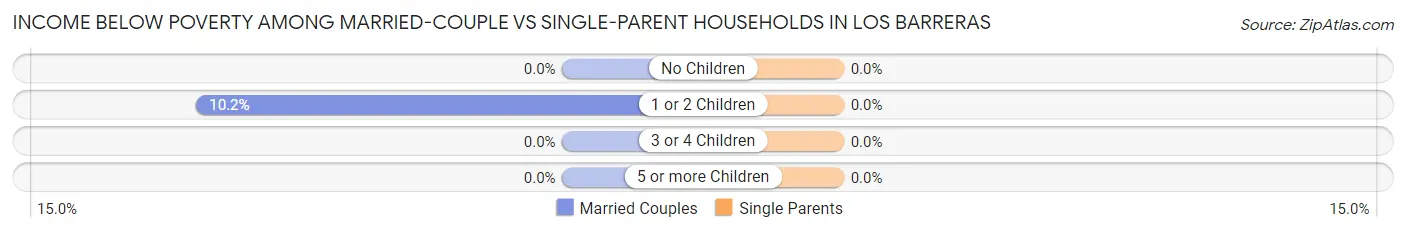
| Children | Married-Couple Families | Single-Parent Households |
| No Children | 0 (0.0%) | 0 (0.0%) |
| 1 or 2 Children | 5 (10.2%) | 0 (0.0%) |
| 3 or 4 Children | 0 (0.0%) | 0 (0.0%) |
| 5 or more Children | 0 (0.0%) | 0 (0.0%) |
| Total | 5 (9.1%) | 0 (0.0%) |
Employment Characteristics in Los Barreras
Employment by Class of Employer in Los Barreras
Among the 144 employed individuals in Los Barreras, private company employees (93 | 64.6%), not-for-profit organizations (37 | 25.7%), and self-employed (not incorporated) (8 | 5.6%) make up the most common classes of employment.
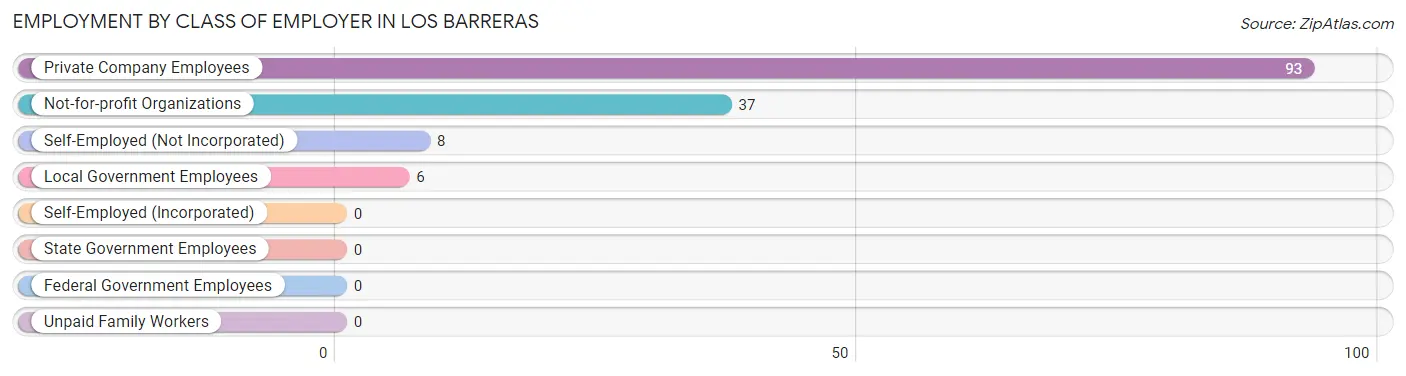
| Employer Class | # Employees | % Employees |
| Private Company Employees | 93 | 64.6% |
| Self-Employed (Incorporated) | 0 | 0.0% |
| Self-Employed (Not Incorporated) | 8 | 5.6% |
| Not-for-profit Organizations | 37 | 25.7% |
| Local Government Employees | 6 | 4.2% |
| State Government Employees | 0 | 0.0% |
| Federal Government Employees | 0 | 0.0% |
| Unpaid Family Workers | 0 | 0.0% |
| Total | 144 | 100.0% |
Employment Status by Age in Los Barreras
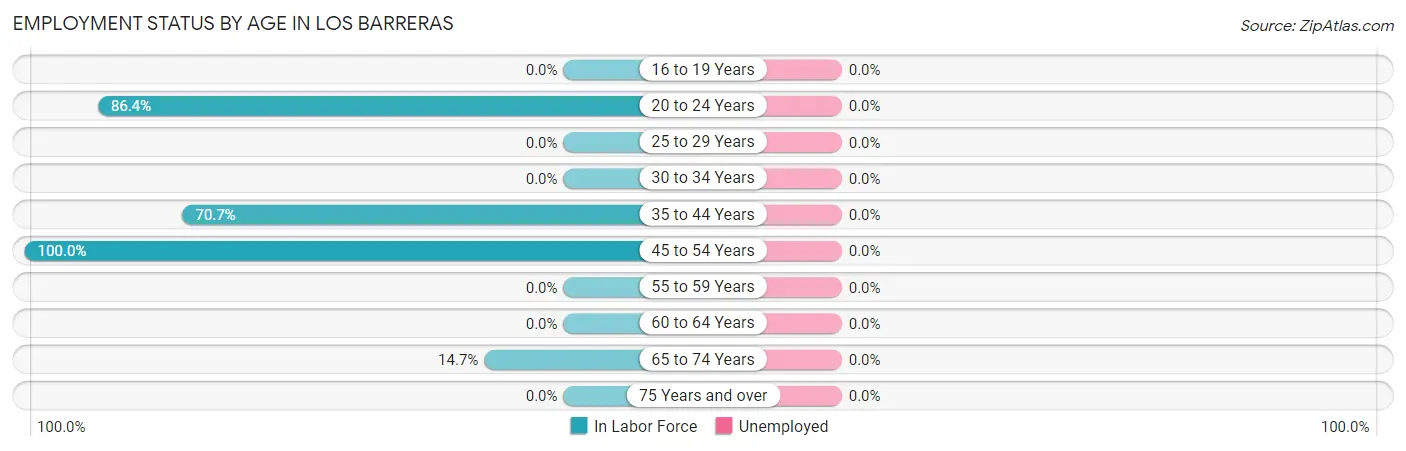
| Age Bracket | In Labor Force | Unemployed |
| 16 to 19 Years | 0 (0.0%) | 0 (0.0%) |
| 20 to 24 Years | 57 (86.4%) | 0 (0.0%) |
| 25 to 29 Years | 0 (0.0%) | 0 (0.0%) |
| 30 to 34 Years | 0 (0.0%) | 0 (0.0%) |
| 35 to 44 Years | 58 (70.7%) | 0 (0.0%) |
| 45 to 54 Years | 15 (100.0%) | 0 (0.0%) |
| 55 to 59 Years | 0 (0.0%) | 0 (0.0%) |
| 60 to 64 Years | 0 (0.0%) | 0 (0.0%) |
| 65 to 74 Years | 14 (14.7%) | 0 (0.0%) |
| 75 Years and over | 0 (0.0%) | 0 (0.0%) |
| Total | 144 (51.1%) | 0 (0.0%) |
Employment Status by Educational Attainment in Los Barreras
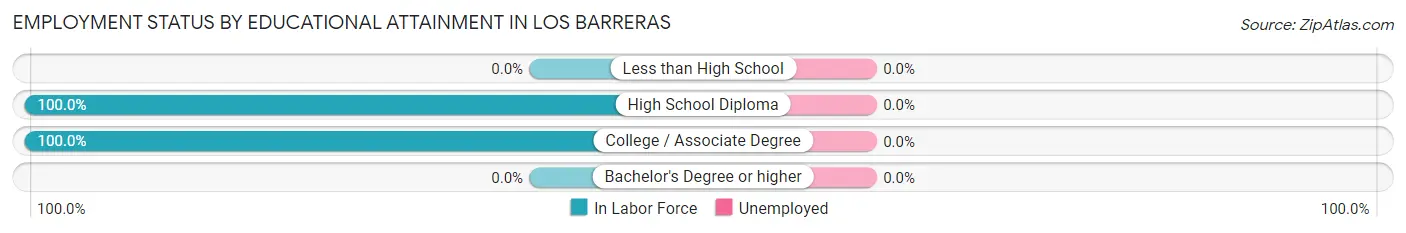
| Educational Attainment | In Labor Force | Unemployed |
| Less than High School | 0 (0.0%) | 0 (0.0%) |
| High School Diploma | 29 (100.0%) | 0 (0.0%) |
| College / Associate Degree | 44 (100.0%) | 0 (0.0%) |
| Bachelor's Degree or higher | 0 (0.0%) | 0 (0.0%) |
| Total | 73 (75.3%) | 0 (0.0%) |
Employment Occupations by Sex in Los Barreras
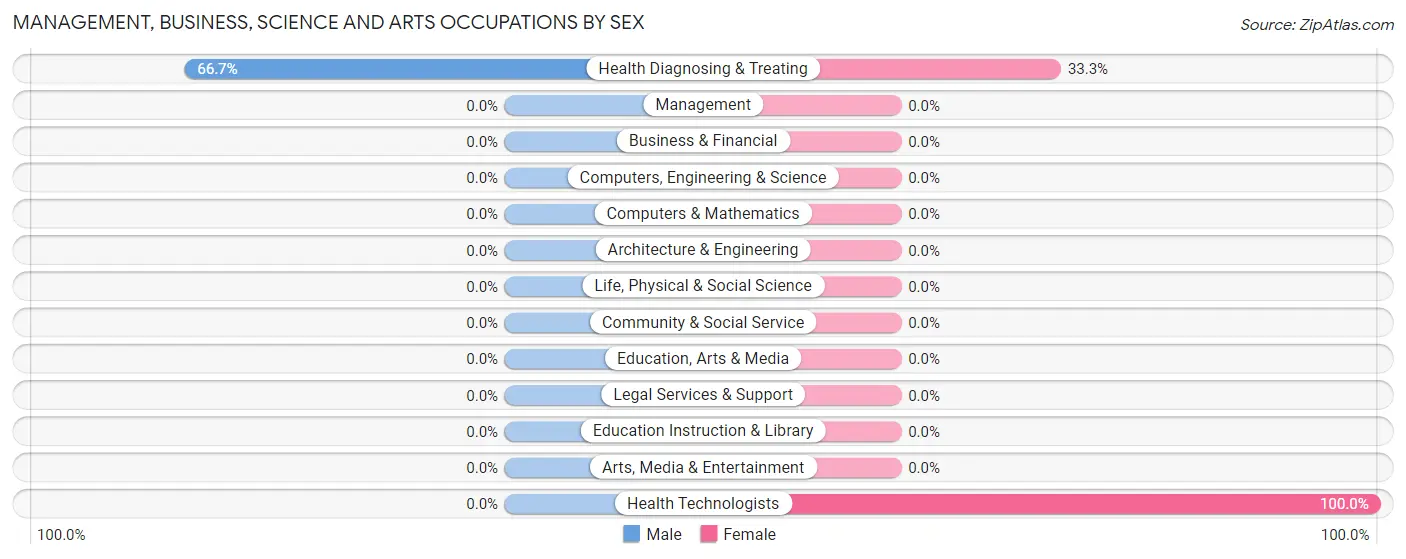
Management, Business, Science and Arts Occupations
The most common Management, Business, Science and Arts occupations in Los Barreras are Health Diagnosing & Treating (30 | 20.8%), and Health Technologists (10 | 6.9%).
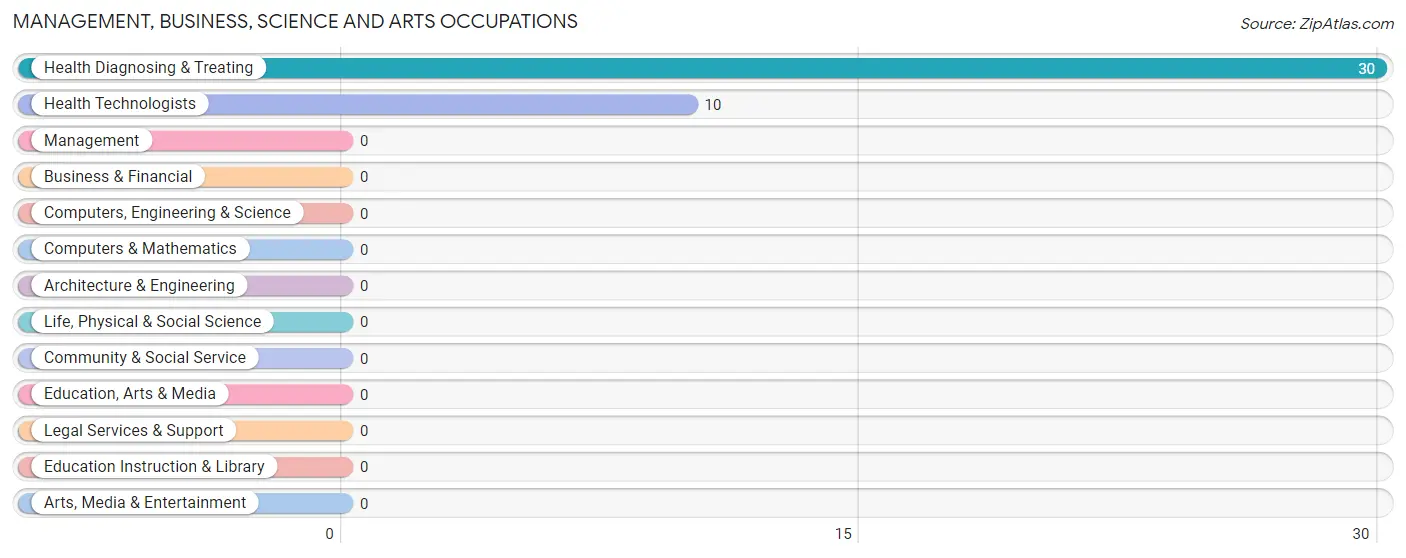
Management, Business, Science and Arts Occupations by Sex
| Occupation | Male | Female |
| Management | 0 (0.0%) | 0 (0.0%) |
| Business & Financial | 0 (0.0%) | 0 (0.0%) |
| Computers, Engineering & Science | 0 (0.0%) | 0 (0.0%) |
| Computers & Mathematics | 0 (0.0%) | 0 (0.0%) |
| Architecture & Engineering | 0 (0.0%) | 0 (0.0%) |
| Life, Physical & Social Science | 0 (0.0%) | 0 (0.0%) |
| Community & Social Service | 0 (0.0%) | 0 (0.0%) |
| Education, Arts & Media | 0 (0.0%) | 0 (0.0%) |
| Legal Services & Support | 0 (0.0%) | 0 (0.0%) |
| Education Instruction & Library | 0 (0.0%) | 0 (0.0%) |
| Arts, Media & Entertainment | 0 (0.0%) | 0 (0.0%) |
| Health Diagnosing & Treating | 20 (66.7%) | 10 (33.3%) |
| Health Technologists | 0 (0.0%) | 10 (100.0%) |
| Total (Category) | 20 (66.7%) | 10 (33.3%) |
| Total (Overall) | 91 (63.2%) | 53 (36.8%) |
Services Occupations
Services Occupations by Sex
| Occupation | Male | Female |
| Healthcare Support | 0 (0.0%) | 0 (0.0%) |
| Security & Protection | 0 (0.0%) | 0 (0.0%) |
| Firefighting & Prevention | 0 (0.0%) | 0 (0.0%) |
| Law Enforcement | 0 (0.0%) | 0 (0.0%) |
| Food Preparation & Serving | 0 (0.0%) | 0 (0.0%) |
| Cleaning & Maintenance | 0 (0.0%) | 0 (0.0%) |
| Personal Care & Service | 0 (0.0%) | 0 (0.0%) |
| Total (Category) | 0 (0.0%) | 0 (0.0%) |
| Total (Overall) | 91 (63.2%) | 53 (36.8%) |
Sales and Office Occupations
The most common Sales and Office occupations in Los Barreras are Office & Administration (43 | 29.9%), and Sales & Related (34 | 23.6%).
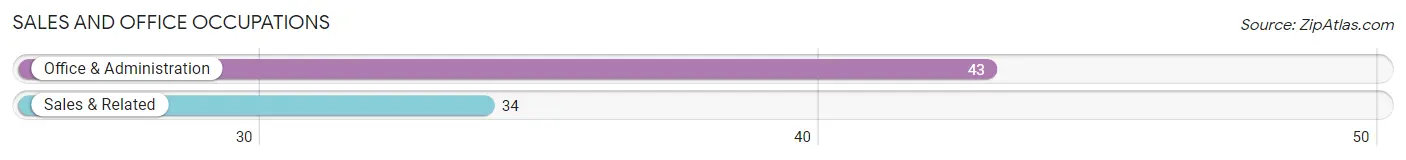
Sales and Office Occupations by Sex

| Occupation | Male | Female |
| Sales & Related | 34 (100.0%) | 0 (0.0%) |
| Office & Administration | 0 (0.0%) | 43 (100.0%) |
| Total (Category) | 34 (44.2%) | 43 (55.8%) |
| Total (Overall) | 91 (63.2%) | 53 (36.8%) |
Natural Resources, Construction and Maintenance Occupations
The most common Natural Resources, Construction and Maintenance occupations in Los Barreras are , and Installation, Maintenance & Repair (23 | 16.0%).
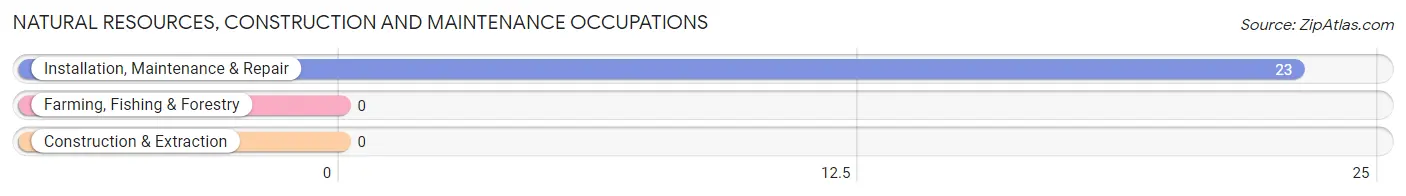
Natural Resources, Construction and Maintenance Occupations by Sex
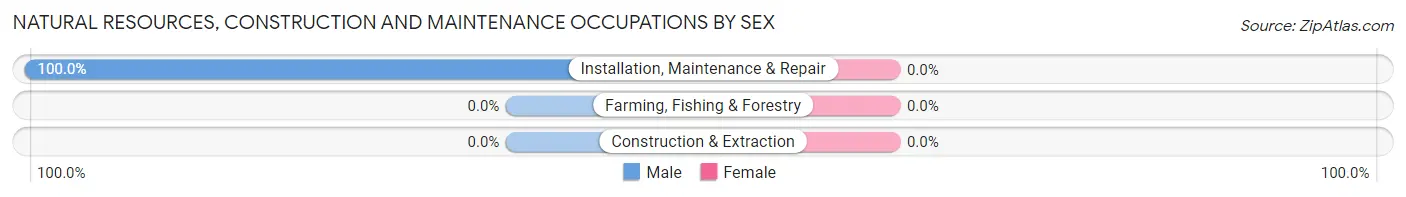
| Occupation | Male | Female |
| Farming, Fishing & Forestry | 0 (0.0%) | 0 (0.0%) |
| Construction & Extraction | 0 (0.0%) | 0 (0.0%) |
| Installation, Maintenance & Repair | 23 (100.0%) | 0 (0.0%) |
| Total (Category) | 23 (100.0%) | 0 (0.0%) |
| Total (Overall) | 91 (63.2%) | 53 (36.8%) |
Production, Transportation and Moving Occupations
The most common Production, Transportation and Moving occupations in Los Barreras are , and Material Moving (14 | 9.7%).
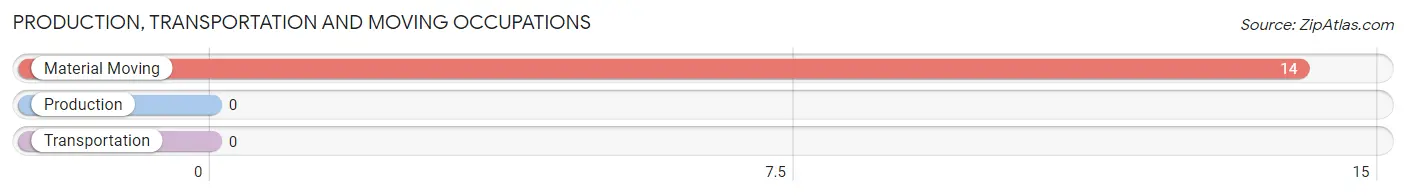
Production, Transportation and Moving Occupations by Sex
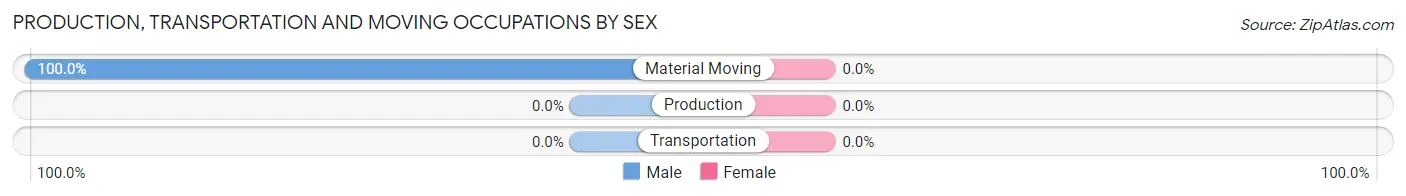
| Occupation | Male | Female |
| Production | 0 (0.0%) | 0 (0.0%) |
| Transportation | 0 (0.0%) | 0 (0.0%) |
| Material Moving | 14 (100.0%) | 0 (0.0%) |
| Total (Category) | 14 (100.0%) | 0 (0.0%) |
| Total (Overall) | 91 (63.2%) | 53 (36.8%) |
Employment Industries by Sex in Los Barreras
Employment Industries in Los Barreras
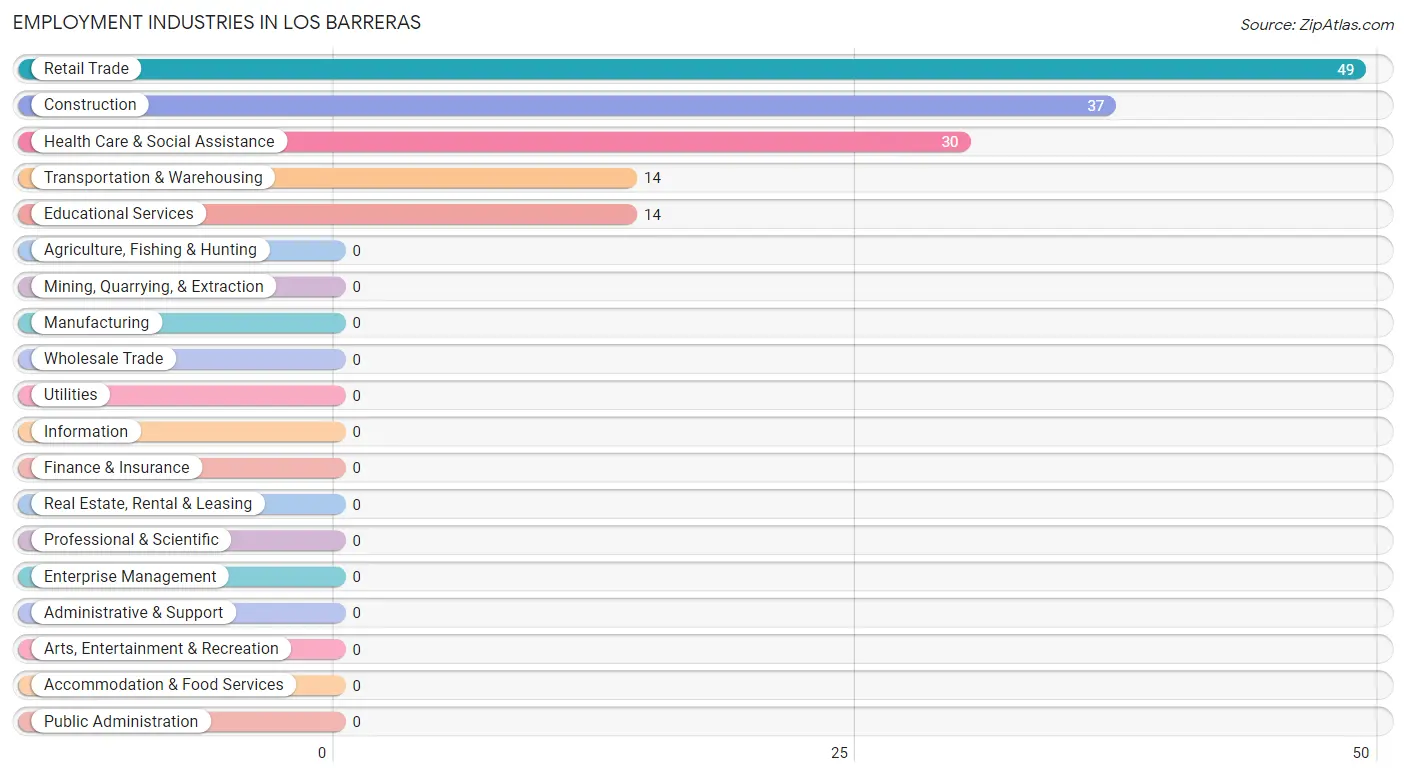
The major employment industries in Los Barreras include Retail Trade (49 | 34.0%), Construction (37 | 25.7%), Health Care & Social Assistance (30 | 20.8%), Transportation & Warehousing (14 | 9.7%), and Educational Services (14 | 9.7%).
Employment Industries by Sex in Los Barreras
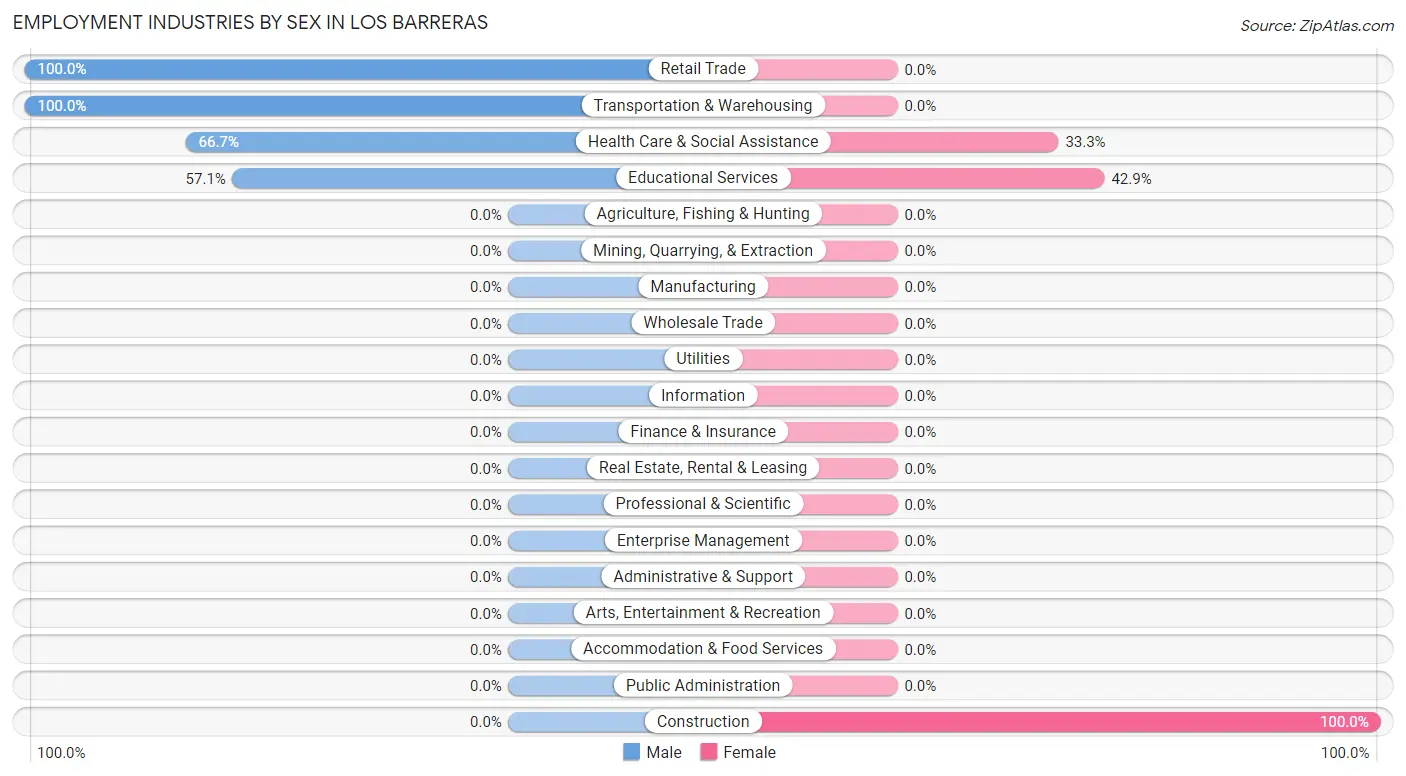
The Los Barreras industries that see more men than women are Retail Trade (100.0%), Transportation & Warehousing (100.0%), and Health Care & Social Assistance (66.7%), whereas the industries that tend to have a higher number of women are Construction (100.0%), Educational Services (42.9%), and Health Care & Social Assistance (33.3%).
| Industry | Male | Female |
| Agriculture, Fishing & Hunting | 0 (0.0%) | 0 (0.0%) |
| Mining, Quarrying, & Extraction | 0 (0.0%) | 0 (0.0%) |
| Construction | 0 (0.0%) | 37 (100.0%) |
| Manufacturing | 0 (0.0%) | 0 (0.0%) |
| Wholesale Trade | 0 (0.0%) | 0 (0.0%) |
| Retail Trade | 49 (100.0%) | 0 (0.0%) |
| Transportation & Warehousing | 14 (100.0%) | 0 (0.0%) |
| Utilities | 0 (0.0%) | 0 (0.0%) |
| Information | 0 (0.0%) | 0 (0.0%) |
| Finance & Insurance | 0 (0.0%) | 0 (0.0%) |
| Real Estate, Rental & Leasing | 0 (0.0%) | 0 (0.0%) |
| Professional & Scientific | 0 (0.0%) | 0 (0.0%) |
| Enterprise Management | 0 (0.0%) | 0 (0.0%) |
| Administrative & Support | 0 (0.0%) | 0 (0.0%) |
| Educational Services | 8 (57.1%) | 6 (42.9%) |
| Health Care & Social Assistance | 20 (66.7%) | 10 (33.3%) |
| Arts, Entertainment & Recreation | 0 (0.0%) | 0 (0.0%) |
| Accommodation & Food Services | 0 (0.0%) | 0 (0.0%) |
| Public Administration | 0 (0.0%) | 0 (0.0%) |
| Total | 91 (63.2%) | 53 (36.8%) |
Education in Los Barreras
School Enrollment in Los Barreras
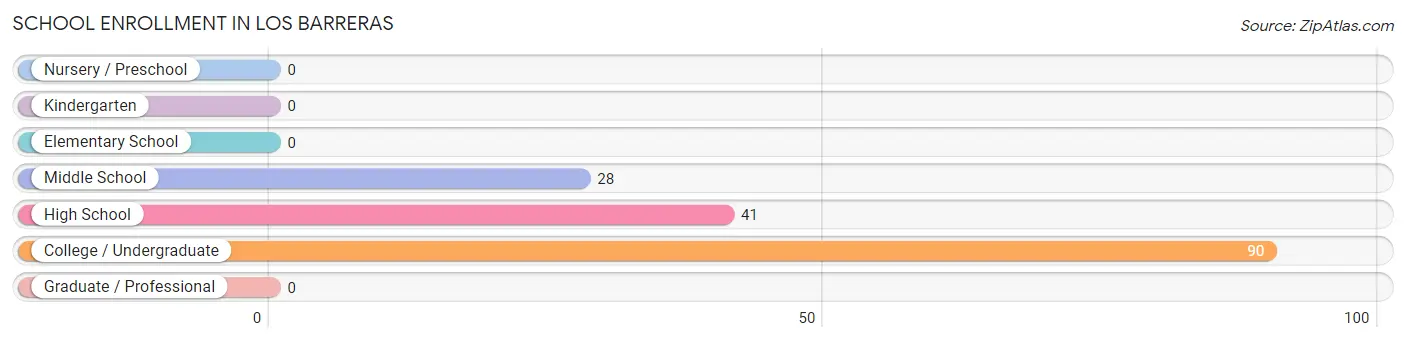
The most common levels of schooling among the 159 students in Los Barreras are college / undergraduate (90 | 56.6%), high school (41 | 25.8%), and middle school (28 | 17.6%).
| School Level | # Students | % Students |
| Nursery / Preschool | 0 | 0.0% |
| Kindergarten | 0 | 0.0% |
| Elementary School | 0 | 0.0% |
| Middle School | 28 | 17.6% |
| High School | 41 | 25.8% |
| College / Undergraduate | 90 | 56.6% |
| Graduate / Professional | 0 | 0.0% |
| Total | 159 | 100.0% |
School Enrollment by Age by Funding Source in Los Barreras
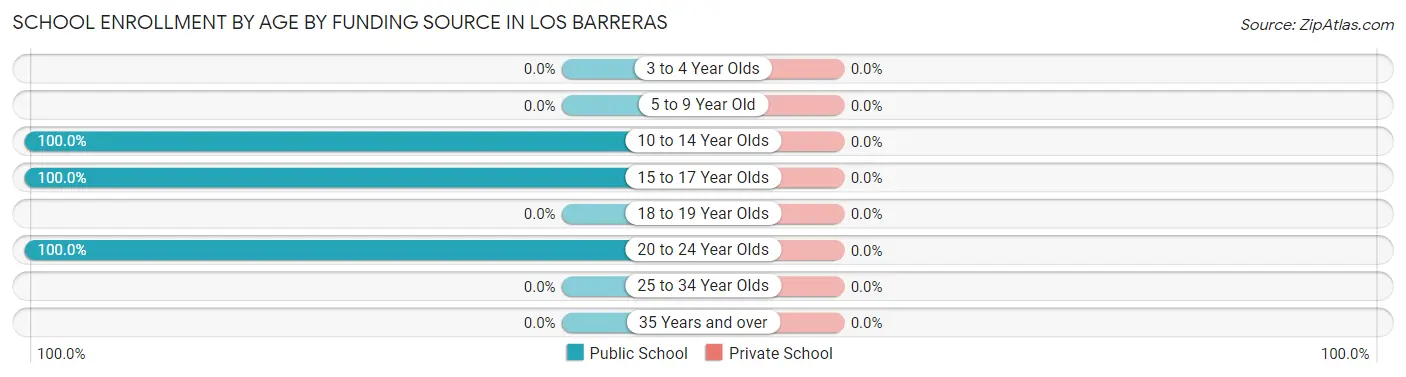
| Age Bracket | Public School | Private School |
| 3 to 4 Year Olds | 0 (0.0%) | 0 (0.0%) |
| 5 to 9 Year Old | 0 (0.0%) | 0 (0.0%) |
| 10 to 14 Year Olds | 63 (100.0%) | 0 (0.0%) |
| 15 to 17 Year Olds | 30 (100.0%) | 0 (0.0%) |
| 18 to 19 Year Olds | 0 (0.0%) | 0 (0.0%) |
| 20 to 24 Year Olds | 66 (100.0%) | 0 (0.0%) |
| 25 to 34 Year Olds | 0 (0.0%) | 0 (0.0%) |
| 35 Years and over | 0 (0.0%) | 0 (0.0%) |
| Total | 159 (100.0%) | 0 (0.0%) |
Educational Attainment by Field of Study in Los Barreras
Education (24 | 80.0%), and bio, nature & agricultural (6 | 20.0%) are the most common fields of study among 30 individuals in Los Barreras who have obtained a bachelor's degree or higher.
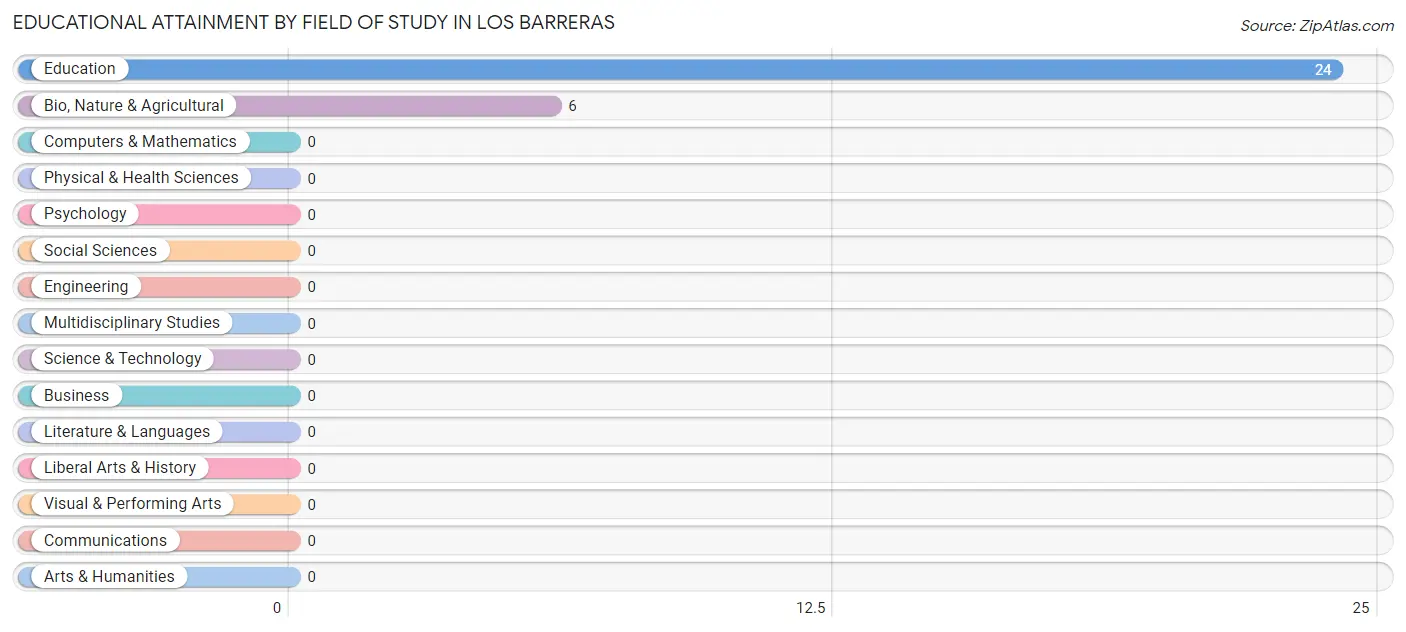
| Field of Study | # Graduates | % Graduates |
| Computers & Mathematics | 0 | 0.0% |
| Bio, Nature & Agricultural | 6 | 20.0% |
| Physical & Health Sciences | 0 | 0.0% |
| Psychology | 0 | 0.0% |
| Social Sciences | 0 | 0.0% |
| Engineering | 0 | 0.0% |
| Multidisciplinary Studies | 0 | 0.0% |
| Science & Technology | 0 | 0.0% |
| Business | 0 | 0.0% |
| Education | 24 | 80.0% |
| Literature & Languages | 0 | 0.0% |
| Liberal Arts & History | 0 | 0.0% |
| Visual & Performing Arts | 0 | 0.0% |
| Communications | 0 | 0.0% |
| Arts & Humanities | 0 | 0.0% |
| Total | 30 | 100.0% |
Transportation & Commute in Los Barreras
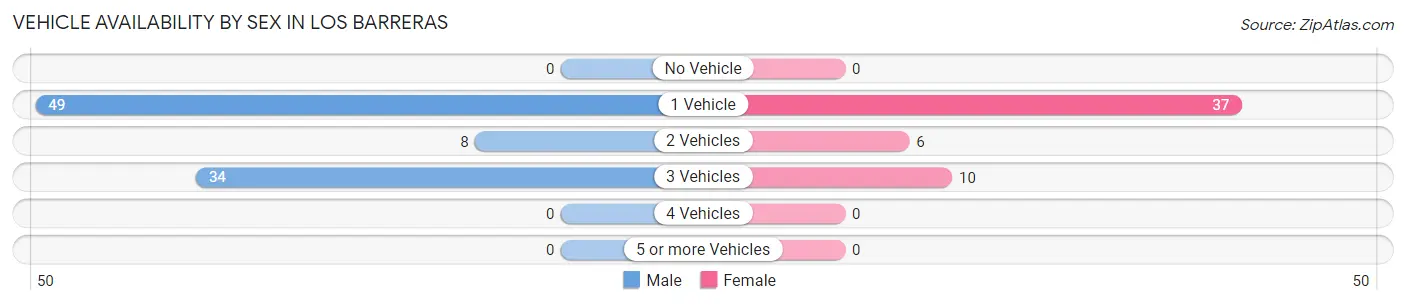
Vehicle Availability by Sex in Los Barreras
The most prevalent vehicle ownership categories in Los Barreras are males with 1 vehicle (49, accounting for 53.8%) and females with 1 vehicle (37, making up 92.4%).
| Vehicles Available | Male | Female |
| No Vehicle | 0 (0.0%) | 0 (0.0%) |
| 1 Vehicle | 49 (53.8%) | 37 (69.8%) |
| 2 Vehicles | 8 (8.8%) | 6 (11.3%) |
| 3 Vehicles | 34 (37.4%) | 10 (18.9%) |
| 4 Vehicles | 0 (0.0%) | 0 (0.0%) |
| 5 or more Vehicles | 0 (0.0%) | 0 (0.0%) |
| Total | 91 (100.0%) | 53 (100.0%) |
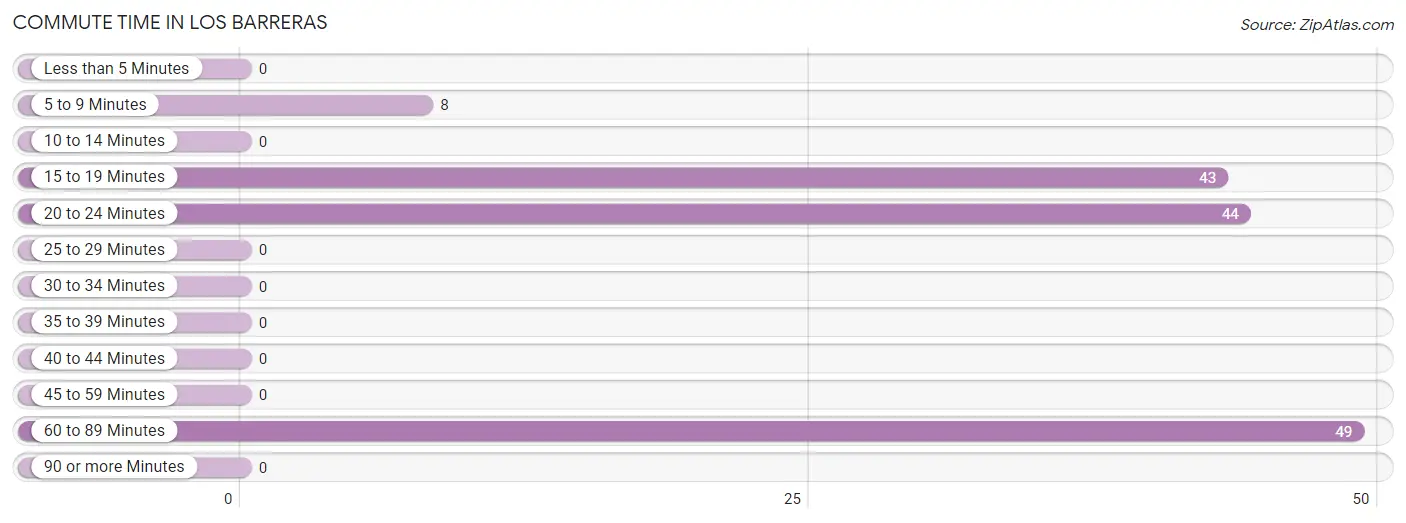
Commute Time in Los Barreras
The most frequently occuring commute durations in Los Barreras are 60 to 89 minutes (49 commuters, 34.0%), 20 to 24 minutes (44 commuters, 30.6%), and 15 to 19 minutes (43 commuters, 29.9%).
| Commute Time | # Commuters | % Commuters |
| Less than 5 Minutes | 0 | 0.0% |
| 5 to 9 Minutes | 8 | 5.6% |
| 10 to 14 Minutes | 0 | 0.0% |
| 15 to 19 Minutes | 43 | 29.9% |
| 20 to 24 Minutes | 44 | 30.6% |
| 25 to 29 Minutes | 0 | 0.0% |
| 30 to 34 Minutes | 0 | 0.0% |
| 35 to 39 Minutes | 0 | 0.0% |
| 40 to 44 Minutes | 0 | 0.0% |
| 45 to 59 Minutes | 0 | 0.0% |
| 60 to 89 Minutes | 49 | 34.0% |
| 90 or more Minutes | 0 | 0.0% |
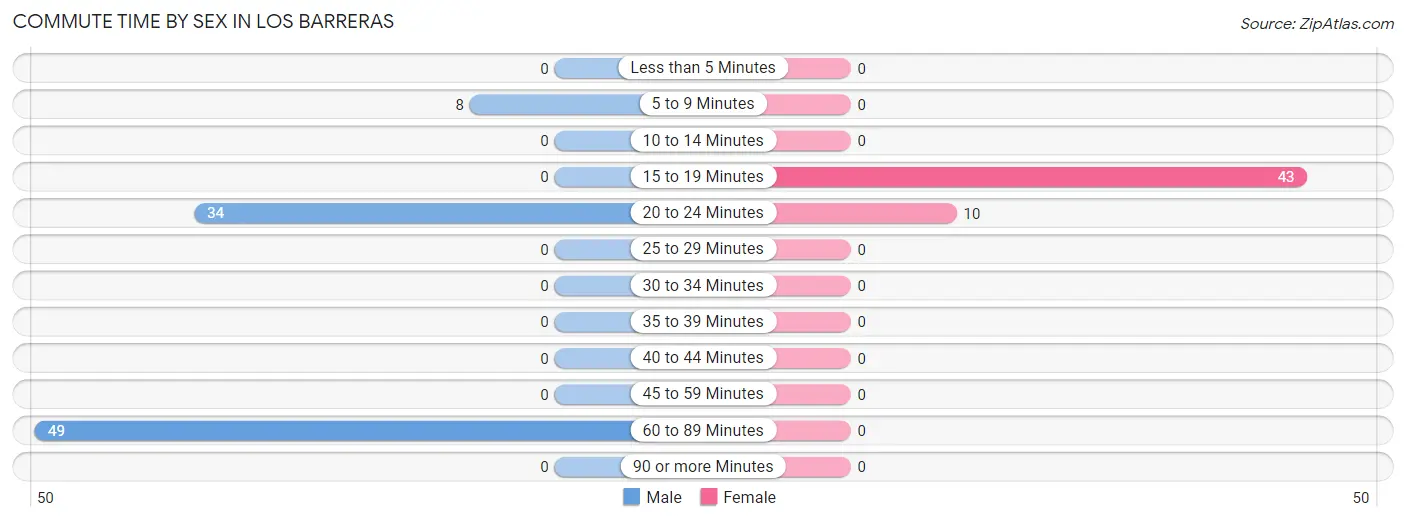
Commute Time by Sex in Los Barreras
The most common commute times in Los Barreras are 60 to 89 minutes (49 commuters, 53.8%) for males and 15 to 19 minutes (43 commuters, 81.1%) for females.
| Commute Time | Male | Female |
| Less than 5 Minutes | 0 (0.0%) | 0 (0.0%) |
| 5 to 9 Minutes | 8 (8.8%) | 0 (0.0%) |
| 10 to 14 Minutes | 0 (0.0%) | 0 (0.0%) |
| 15 to 19 Minutes | 0 (0.0%) | 43 (81.1%) |
| 20 to 24 Minutes | 34 (37.4%) | 10 (18.9%) |
| 25 to 29 Minutes | 0 (0.0%) | 0 (0.0%) |
| 30 to 34 Minutes | 0 (0.0%) | 0 (0.0%) |
| 35 to 39 Minutes | 0 (0.0%) | 0 (0.0%) |
| 40 to 44 Minutes | 0 (0.0%) | 0 (0.0%) |
| 45 to 59 Minutes | 0 (0.0%) | 0 (0.0%) |
| 60 to 89 Minutes | 49 (53.8%) | 0 (0.0%) |
| 90 or more Minutes | 0 (0.0%) | 0 (0.0%) |
Time of Departure to Work by Sex in Los Barreras
The most frequent times of departure to work in Los Barreras are 8:00 AM to 8:29 AM (57, 62.6%) for males and 4:00 PM to 11:59 PM (37, 69.8%) for females.
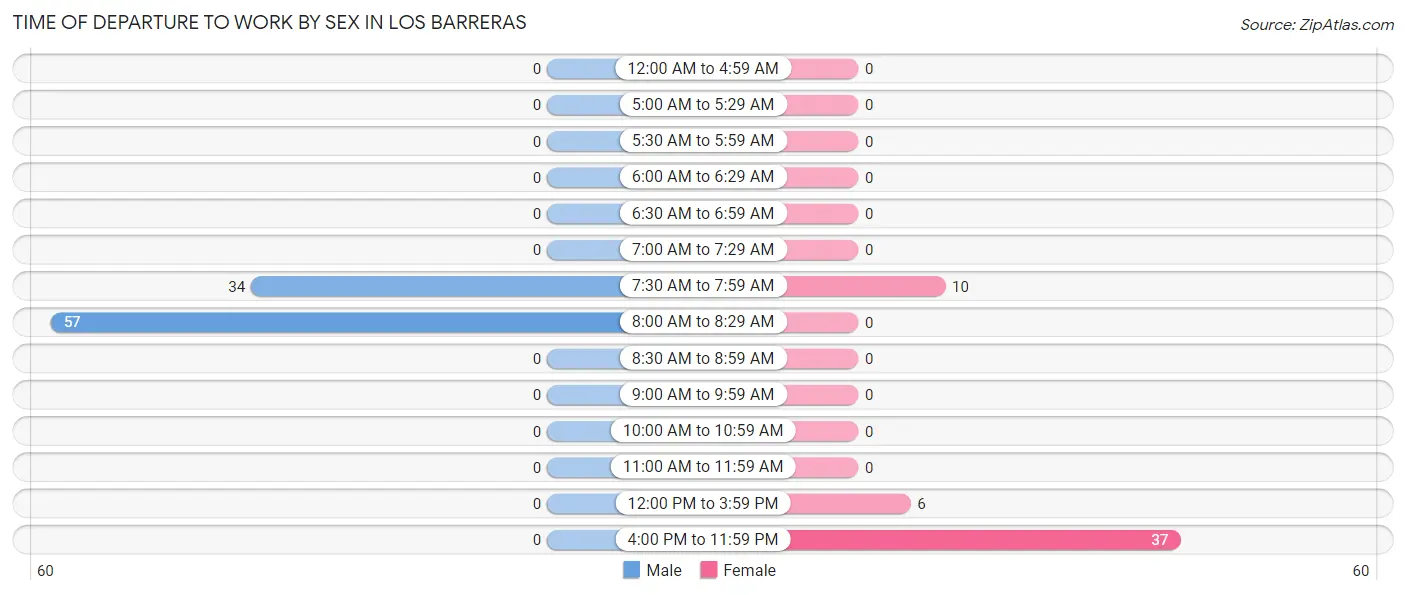
| Time of Departure | Male | Female |
| 12:00 AM to 4:59 AM | 0 (0.0%) | 0 (0.0%) |
| 5:00 AM to 5:29 AM | 0 (0.0%) | 0 (0.0%) |
| 5:30 AM to 5:59 AM | 0 (0.0%) | 0 (0.0%) |
| 6:00 AM to 6:29 AM | 0 (0.0%) | 0 (0.0%) |
| 6:30 AM to 6:59 AM | 0 (0.0%) | 0 (0.0%) |
| 7:00 AM to 7:29 AM | 0 (0.0%) | 0 (0.0%) |
| 7:30 AM to 7:59 AM | 34 (37.4%) | 10 (18.9%) |
| 8:00 AM to 8:29 AM | 57 (62.6%) | 0 (0.0%) |
| 8:30 AM to 8:59 AM | 0 (0.0%) | 0 (0.0%) |
| 9:00 AM to 9:59 AM | 0 (0.0%) | 0 (0.0%) |
| 10:00 AM to 10:59 AM | 0 (0.0%) | 0 (0.0%) |
| 11:00 AM to 11:59 AM | 0 (0.0%) | 0 (0.0%) |
| 12:00 PM to 3:59 PM | 0 (0.0%) | 6 (11.3%) |
| 4:00 PM to 11:59 PM | 0 (0.0%) | 37 (69.8%) |
| Total | 91 (100.0%) | 53 (100.0%) |
Housing Occupancy in Los Barreras
Occupancy by Ownership in Los Barreras
Of the total 141 dwellings in Los Barreras, owner-occupied units account for 70 (49.6%), while renter-occupied units make up 71 (50.3%).
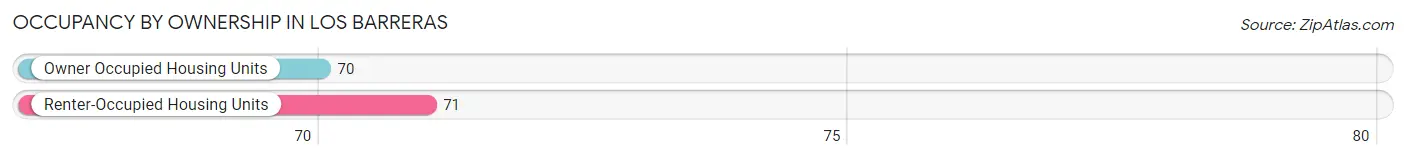
| Occupancy | # Housing Units | % Housing Units |
| Owner Occupied Housing Units | 70 | 49.6% |
| Renter-Occupied Housing Units | 71 | 50.3% |
| Total Occupied Housing Units | 141 | 100.0% |
Occupancy by Household Size in Los Barreras
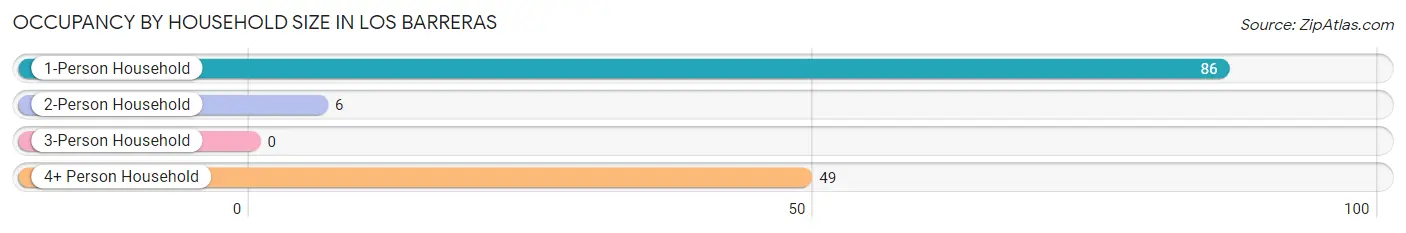
| Household Size | # Housing Units | % Housing Units |
| 1-Person Household | 86 | 61.0% |
| 2-Person Household | 6 | 4.3% |
| 3-Person Household | 0 | 0.0% |
| 4+ Person Household | 49 | 34.7% |
| Total Housing Units | 141 | 100.0% |
Occupancy by Ownership by Household Size in Los Barreras
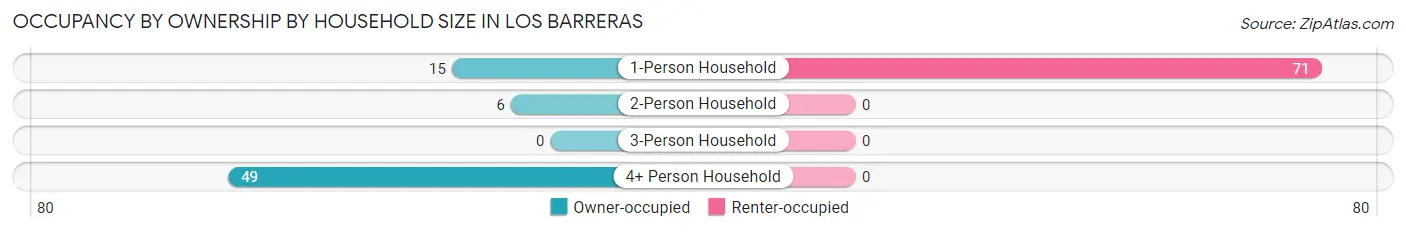
| Household Size | Owner-occupied | Renter-occupied |
| 1-Person Household | 15 (17.4%) | 71 (82.6%) |
| 2-Person Household | 6 (100.0%) | 0 (0.0%) |
| 3-Person Household | 0 (0.0%) | 0 (0.0%) |
| 4+ Person Household | 49 (100.0%) | 0 (0.0%) |
| Total Housing Units | 70 (49.6%) | 71 (50.3%) |
Occupancy by Educational Attainment in Los Barreras
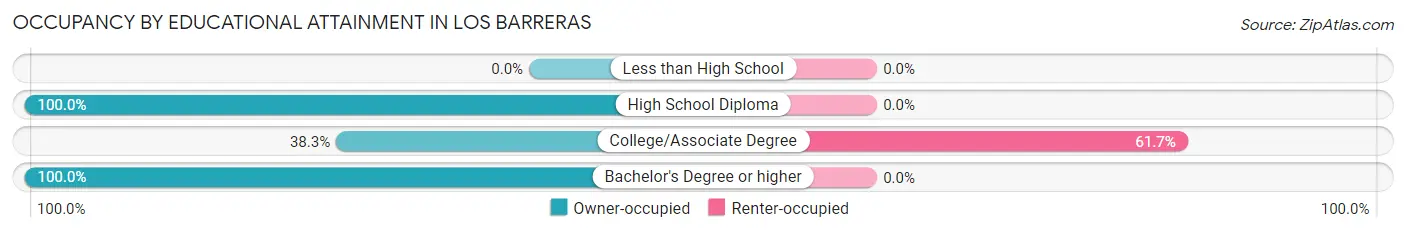
| Household Size | Owner-occupied | Renter-occupied |
| Less than High School | 0 (0.0%) | 0 (0.0%) |
| High School Diploma | 20 (100.0%) | 0 (0.0%) |
| College/Associate Degree | 44 (38.3%) | 71 (61.7%) |
| Bachelor's Degree or higher | 6 (100.0%) | 0 (0.0%) |
Occupancy by Age of Householder in Los Barreras
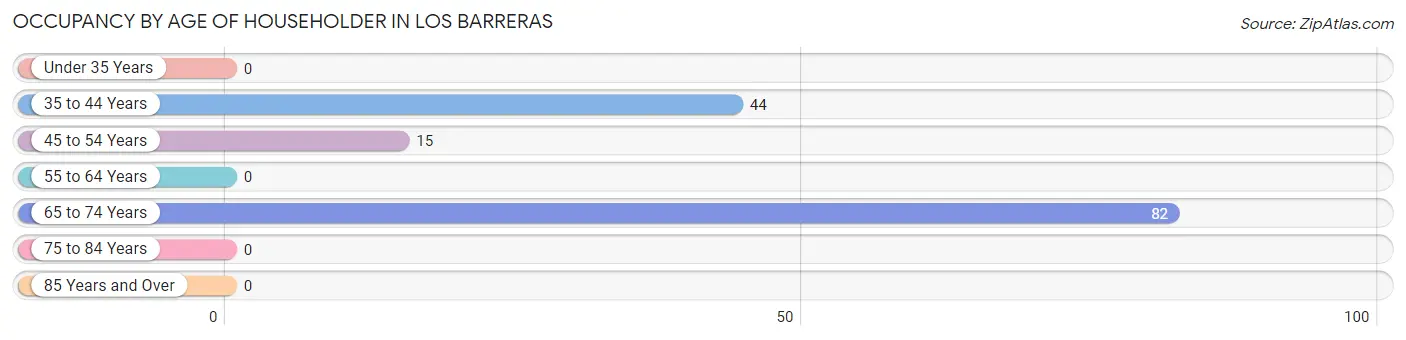
| Age Bracket | # Households | % Households |
| Under 35 Years | 0 | 0.0% |
| 35 to 44 Years | 44 | 31.2% |
| 45 to 54 Years | 15 | 10.6% |
| 55 to 64 Years | 0 | 0.0% |
| 65 to 74 Years | 82 | 58.2% |
| 75 to 84 Years | 0 | 0.0% |
| 85 Years and Over | 0 | 0.0% |
| Total | 141 | 100.0% |
Housing Finances in Los Barreras
Median Income by Occupancy in Los Barreras
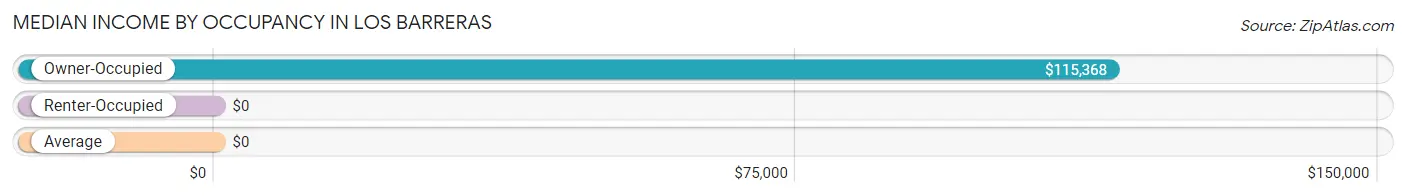
| Occupancy Type | # Households | Median Income |
| Owner-Occupied | 70 (49.6%) | $115,368 |
| Renter-Occupied | 71 (50.3%) | $0 |
| Average | 141 (100.0%) | $0 |
Occupancy by Householder Income Bracket in Los Barreras
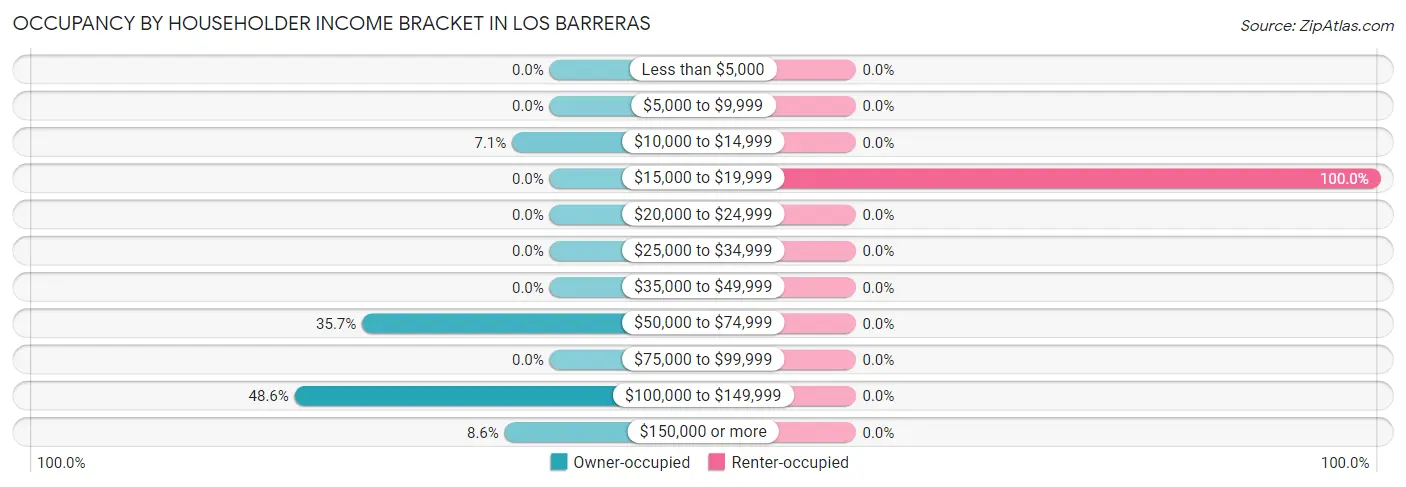
| Income Bracket | Owner-occupied | Renter-occupied |
| Less than $5,000 | 0 (0.0%) | 0 (0.0%) |
| $5,000 to $9,999 | 0 (0.0%) | 0 (0.0%) |
| $10,000 to $14,999 | 5 (7.1%) | 0 (0.0%) |
| $15,000 to $19,999 | 0 (0.0%) | 71 (100.0%) |
| $20,000 to $24,999 | 0 (0.0%) | 0 (0.0%) |
| $25,000 to $34,999 | 0 (0.0%) | 0 (0.0%) |
| $35,000 to $49,999 | 0 (0.0%) | 0 (0.0%) |
| $50,000 to $74,999 | 25 (35.7%) | 0 (0.0%) |
| $75,000 to $99,999 | 0 (0.0%) | 0 (0.0%) |
| $100,000 to $149,999 | 34 (48.6%) | 0 (0.0%) |
| $150,000 or more | 6 (8.6%) | 0 (0.0%) |
| Total | 70 (100.0%) | 71 (100.0%) |
Monthly Housing Cost Tiers in Los Barreras
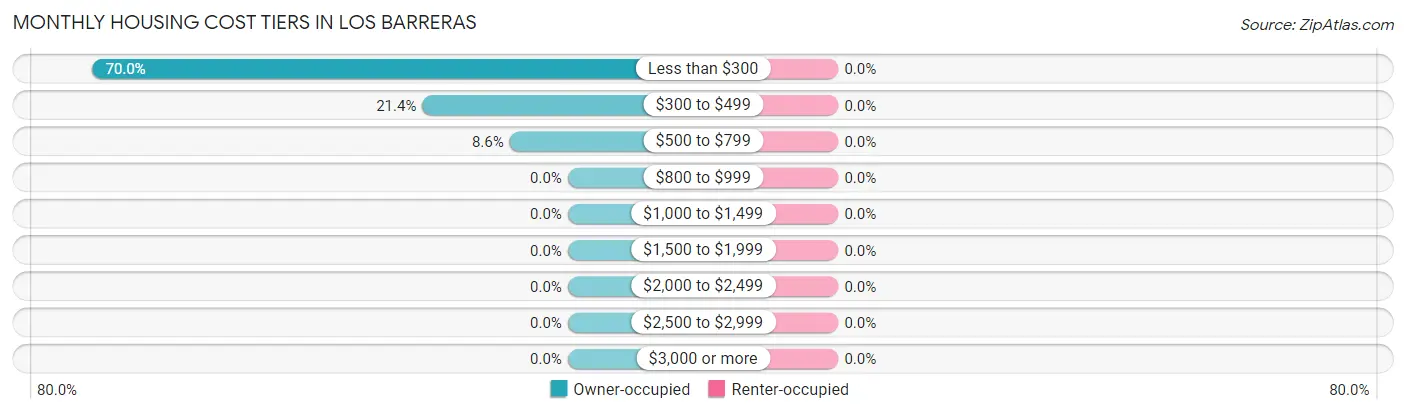
| Monthly Cost | Owner-occupied | Renter-occupied |
| Less than $300 | 49 (70.0%) | 0 (0.0%) |
| $300 to $499 | 15 (21.4%) | 0 (0.0%) |
| $500 to $799 | 6 (8.6%) | 0 (0.0%) |
| $800 to $999 | 0 (0.0%) | 0 (0.0%) |
| $1,000 to $1,499 | 0 (0.0%) | 0 (0.0%) |
| $1,500 to $1,999 | 0 (0.0%) | 0 (0.0%) |
| $2,000 to $2,499 | 0 (0.0%) | 0 (0.0%) |
| $2,500 to $2,999 | 0 (0.0%) | 0 (0.0%) |
| $3,000 or more | 0 (0.0%) | 0 (0.0%) |
| Total | 70 (100.0%) | 71 (100.0%) |
Physical Housing Characteristics in Los Barreras
Housing Structures in Los Barreras
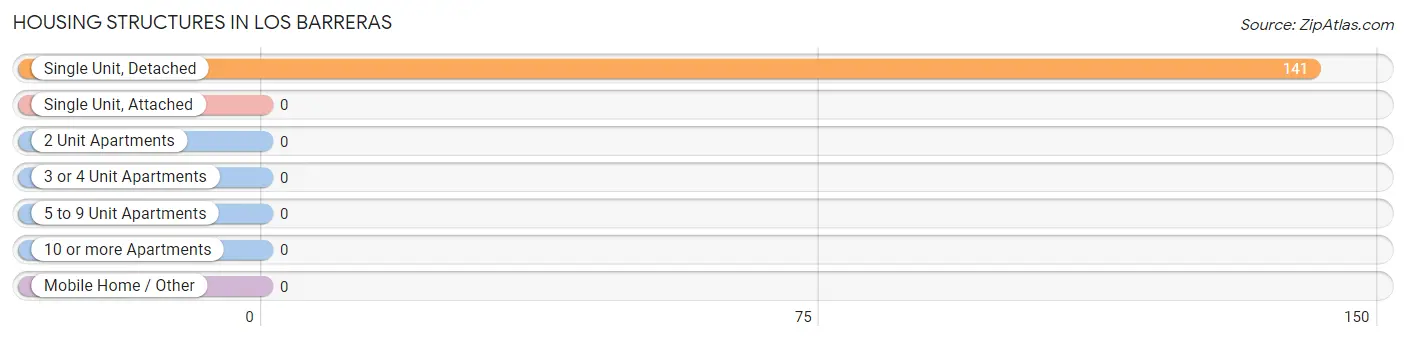
| Structure Type | # Housing Units | % Housing Units |
| Single Unit, Detached | 141 | 100.0% |
| Single Unit, Attached | 0 | 0.0% |
| 2 Unit Apartments | 0 | 0.0% |
| 3 or 4 Unit Apartments | 0 | 0.0% |
| 5 to 9 Unit Apartments | 0 | 0.0% |
| 10 or more Apartments | 0 | 0.0% |
| Mobile Home / Other | 0 | 0.0% |
| Total | 141 | 100.0% |
Housing Structures by Occupancy in Los Barreras
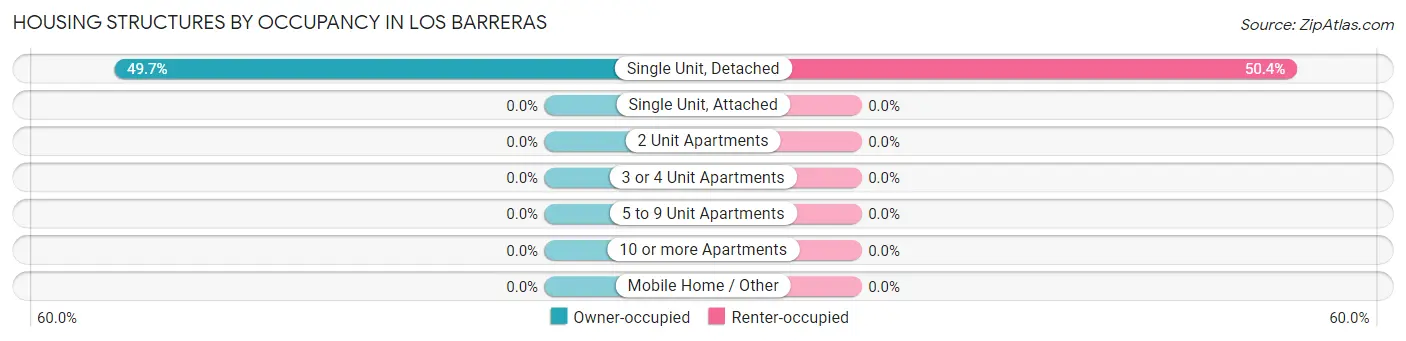
| Structure Type | Owner-occupied | Renter-occupied |
| Single Unit, Detached | 70 (49.6%) | 71 (50.3%) |
| Single Unit, Attached | 0 (0.0%) | 0 (0.0%) |
| 2 Unit Apartments | 0 (0.0%) | 0 (0.0%) |
| 3 or 4 Unit Apartments | 0 (0.0%) | 0 (0.0%) |
| 5 to 9 Unit Apartments | 0 (0.0%) | 0 (0.0%) |
| 10 or more Apartments | 0 (0.0%) | 0 (0.0%) |
| Mobile Home / Other | 0 (0.0%) | 0 (0.0%) |
| Total | 70 (49.6%) | 71 (50.3%) |
Housing Structures by Number of Rooms in Los Barreras
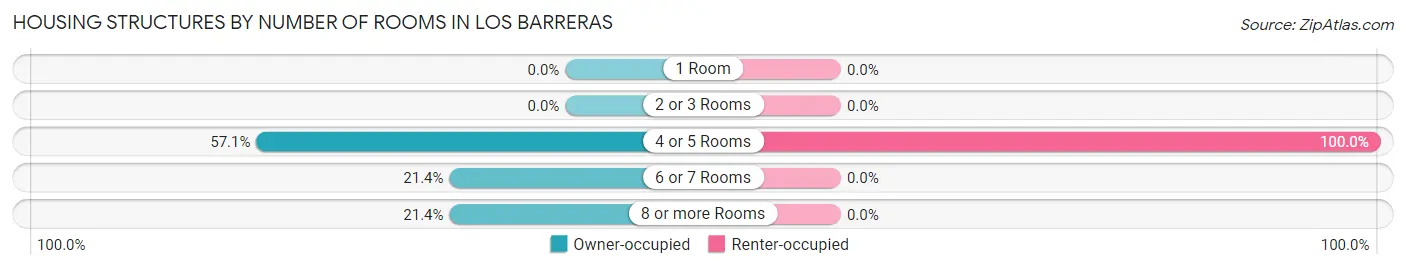
| Number of Rooms | Owner-occupied | Renter-occupied |
| 1 Room | 0 (0.0%) | 0 (0.0%) |
| 2 or 3 Rooms | 0 (0.0%) | 0 (0.0%) |
| 4 or 5 Rooms | 40 (57.1%) | 71 (100.0%) |
| 6 or 7 Rooms | 15 (21.4%) | 0 (0.0%) |
| 8 or more Rooms | 15 (21.4%) | 0 (0.0%) |
| Total | 70 (100.0%) | 71 (100.0%) |
Housing Structure by Heating Type in Los Barreras
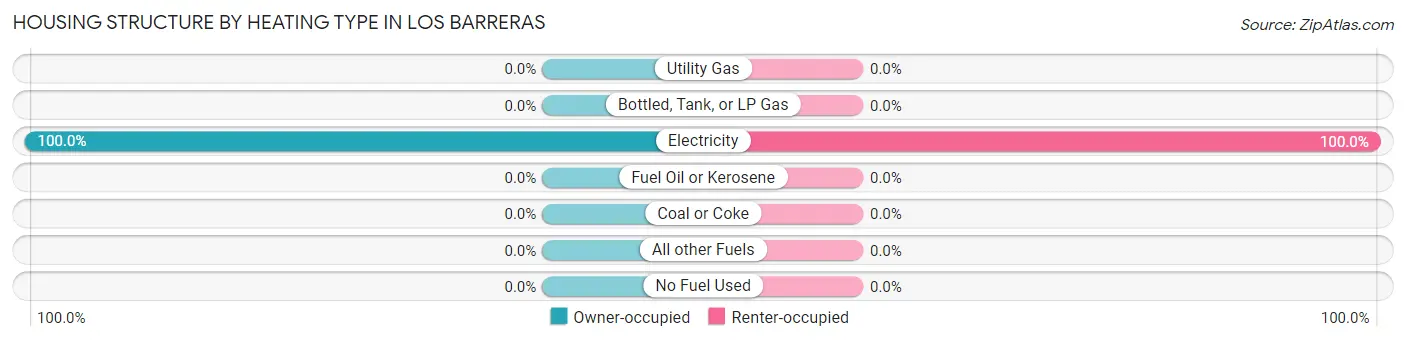
| Heating Type | Owner-occupied | Renter-occupied |
| Utility Gas | 0 (0.0%) | 0 (0.0%) |
| Bottled, Tank, or LP Gas | 0 (0.0%) | 0 (0.0%) |
| Electricity | 70 (100.0%) | 71 (100.0%) |
| Fuel Oil or Kerosene | 0 (0.0%) | 0 (0.0%) |
| Coal or Coke | 0 (0.0%) | 0 (0.0%) |
| All other Fuels | 0 (0.0%) | 0 (0.0%) |
| No Fuel Used | 0 (0.0%) | 0 (0.0%) |
| Total | 70 (100.0%) | 71 (100.0%) |
Household Vehicle Usage in Los Barreras
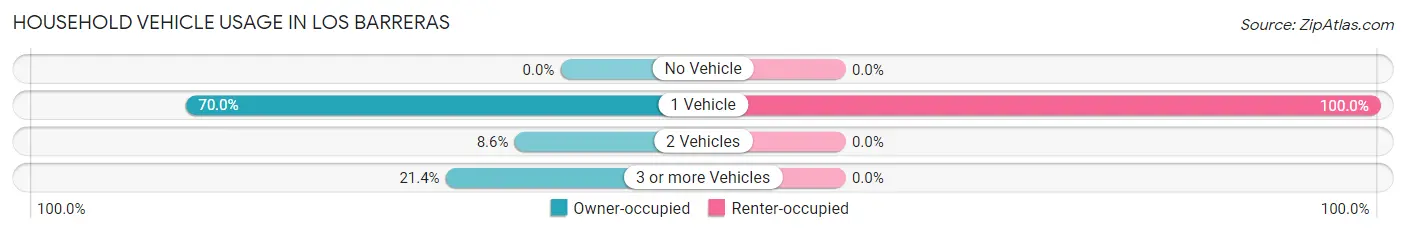
| Vehicles per Household | Owner-occupied | Renter-occupied |
| No Vehicle | 0 (0.0%) | 0 (0.0%) |
| 1 Vehicle | 49 (70.0%) | 71 (100.0%) |
| 2 Vehicles | 6 (8.6%) | 0 (0.0%) |
| 3 or more Vehicles | 15 (21.4%) | 0 (0.0%) |
| Total | 70 (100.0%) | 71 (100.0%) |
Real Estate & Mortgages in Los Barreras
Real Estate and Mortgage Overview in Los Barreras
| Characteristic | Without Mortgage | With Mortgage |
| Housing Units | 70 | 0 |
| Median Property Value | $51,000 | $0 |
| Median Household Income | $115,368 | $0 |
| Monthly Housing Costs | $279 | $0 |
| Real Estate Taxes | $1,331 | $0 |
Property Value by Mortgage Status in Los Barreras
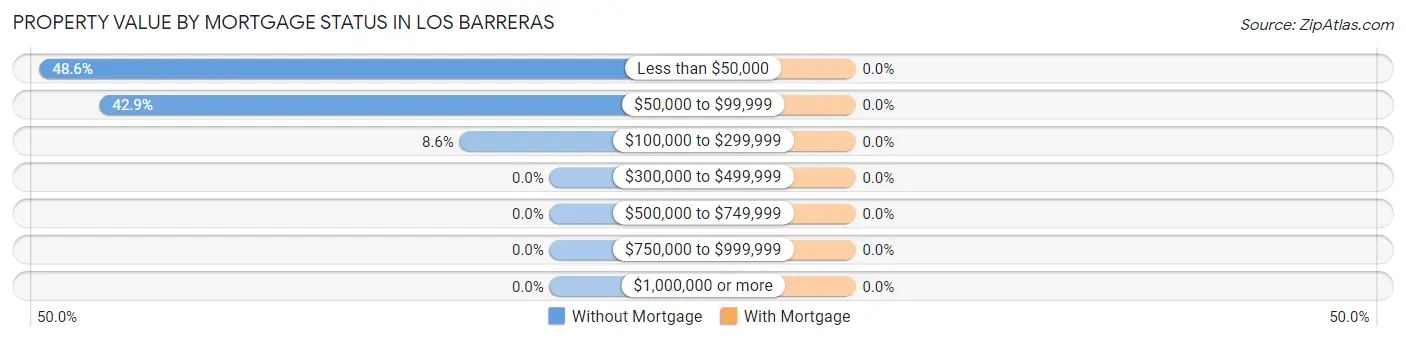
| Property Value | Without Mortgage | With Mortgage |
| Less than $50,000 | 34 (48.6%) | 0 (0.0%) |
| $50,000 to $99,999 | 30 (42.9%) | 0 (0.0%) |
| $100,000 to $299,999 | 6 (8.6%) | 0 (0.0%) |
| $300,000 to $499,999 | 0 (0.0%) | 0 (0.0%) |
| $500,000 to $749,999 | 0 (0.0%) | 0 (0.0%) |
| $750,000 to $999,999 | 0 (0.0%) | 0 (0.0%) |
| $1,000,000 or more | 0 (0.0%) | 0 (0.0%) |
| Total | 70 (100.0%) | 0 (0.0%) |
Household Income by Mortgage Status in Los Barreras
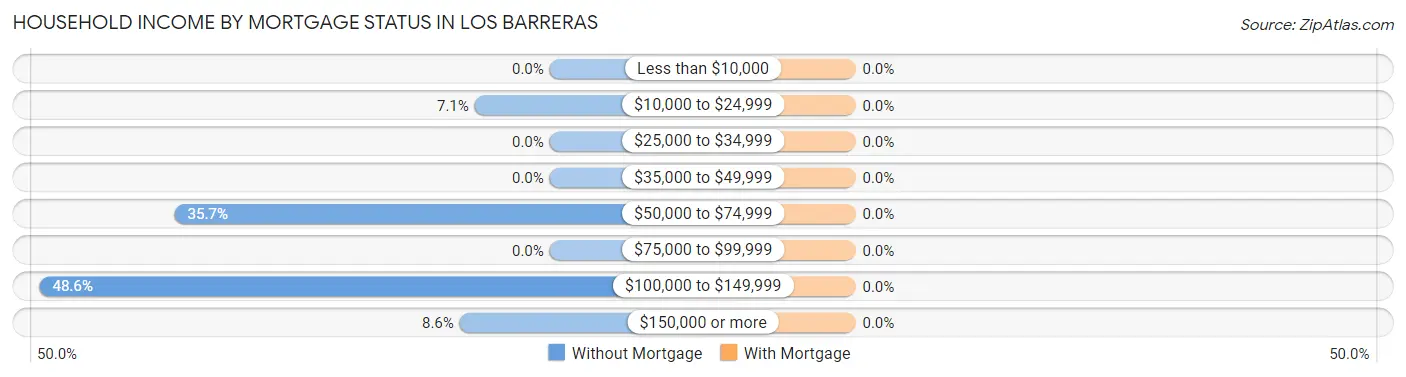
| Household Income | Without Mortgage | With Mortgage |
| Less than $10,000 | 0 (0.0%) | 0 (0.0%) |
| $10,000 to $24,999 | 5 (7.1%) | 0 (0.0%) |
| $25,000 to $34,999 | 0 (0.0%) | 0 (0.0%) |
| $35,000 to $49,999 | 0 (0.0%) | 0 (0.0%) |
| $50,000 to $74,999 | 25 (35.7%) | 0 (0.0%) |
| $75,000 to $99,999 | 0 (0.0%) | 0 (0.0%) |
| $100,000 to $149,999 | 34 (48.6%) | 0 (0.0%) |
| $150,000 or more | 6 (8.6%) | 0 (0.0%) |
| Total | 70 (100.0%) | 0 (0.0%) |
Property Value to Household Income Ratio in Los Barreras
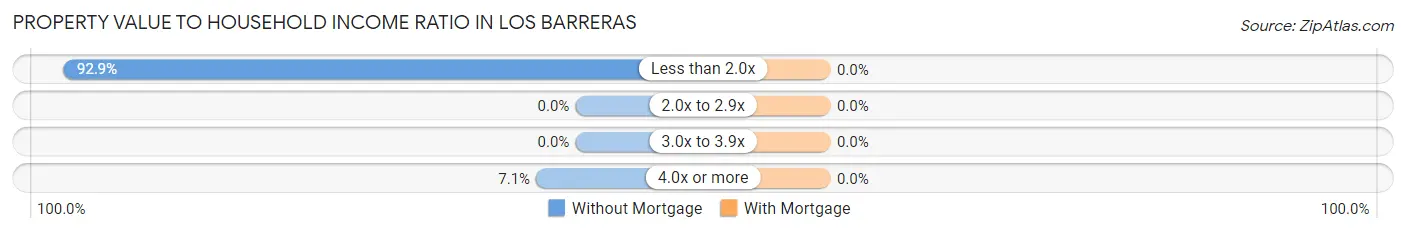
| Value-to-Income Ratio | Without Mortgage | With Mortgage |
| Less than 2.0x | 65 (92.9%) | 0 (0.0%) |
| 2.0x to 2.9x | 0 (0.0%) | 0 (0.0%) |
| 3.0x to 3.9x | 0 (0.0%) | 0 (0.0%) |
| 4.0x or more | 5 (7.1%) | 0 (0.0%) |
| Total | 70 (100.0%) | 0 (0.0%) |
Real Estate Taxes by Mortgage Status in Los Barreras
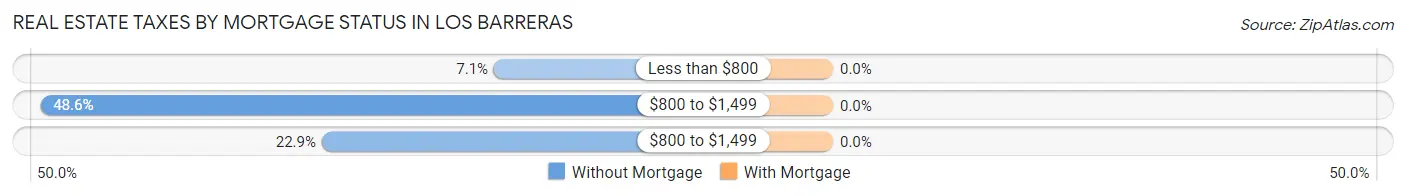
| Property Taxes | Without Mortgage | With Mortgage |
| Less than $800 | 5 (7.1%) | 0 (0.0%) |
| $800 to $1,499 | 34 (48.6%) | 0 (0.0%) |
| $800 to $1,499 | 16 (22.9%) | 0 (0.0%) |
| Total | 70 (100.0%) | 0 (0.0%) |
Health & Disability in Los Barreras
Health Insurance Coverage by Age in Los Barreras
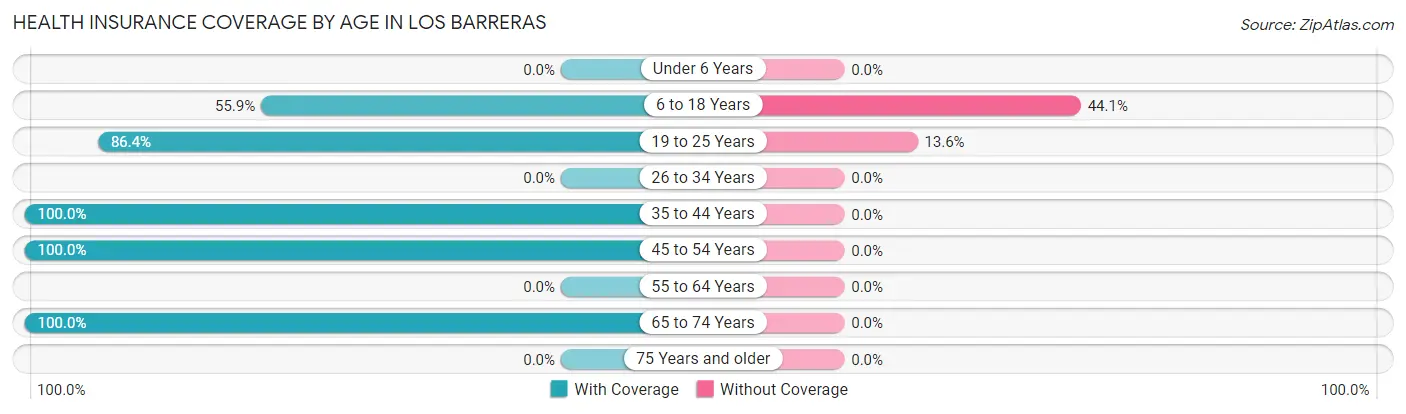
| Age Bracket | With Coverage | Without Coverage |
| Under 6 Years | 0 (0.0%) | 0 (0.0%) |
| 6 to 18 Years | 52 (55.9%) | 41 (44.1%) |
| 19 to 25 Years | 57 (86.4%) | 9 (13.6%) |
| 26 to 34 Years | 0 (0.0%) | 0 (0.0%) |
| 35 to 44 Years | 82 (100.0%) | 0 (0.0%) |
| 45 to 54 Years | 15 (100.0%) | 0 (0.0%) |
| 55 to 64 Years | 0 (0.0%) | 0 (0.0%) |
| 65 to 74 Years | 95 (100.0%) | 0 (0.0%) |
| 75 Years and older | 0 (0.0%) | 0 (0.0%) |
| Total | 301 (85.8%) | 50 (14.2%) |
Health Insurance Coverage by Citizenship Status in Los Barreras
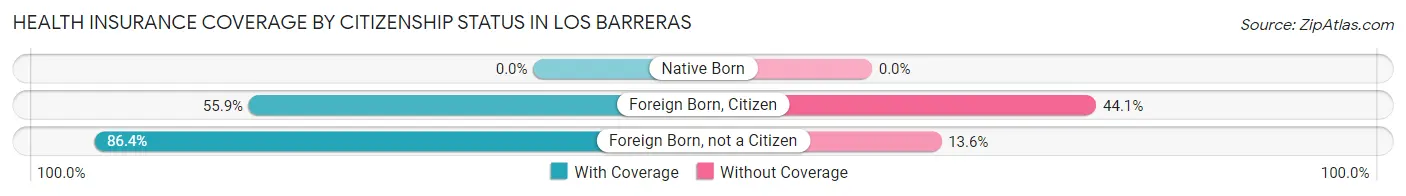
| Citizenship Status | With Coverage | Without Coverage |
| Native Born | 0 (0.0%) | 0 (0.0%) |
| Foreign Born, Citizen | 52 (55.9%) | 41 (44.1%) |
| Foreign Born, not a Citizen | 57 (86.4%) | 9 (13.6%) |
Health Insurance Coverage by Household Income in Los Barreras
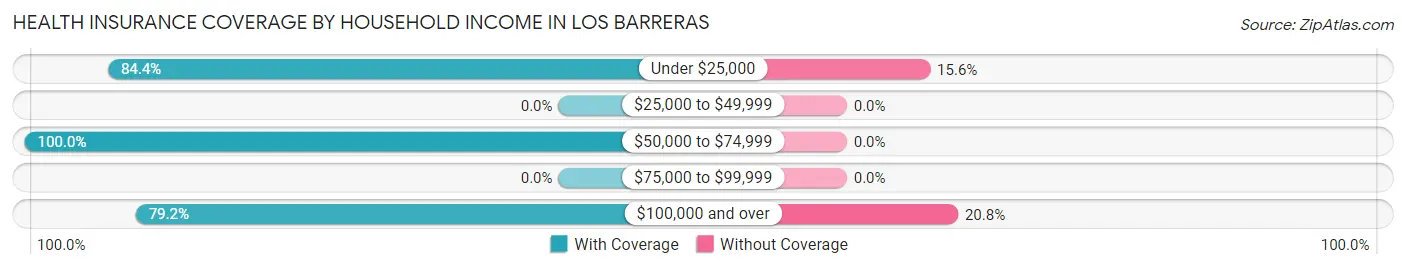
| Household Income | With Coverage | Without Coverage |
| Under $25,000 | 81 (84.4%) | 15 (15.6%) |
| $25,000 to $49,999 | 0 (0.0%) | 0 (0.0%) |
| $50,000 to $74,999 | 87 (100.0%) | 0 (0.0%) |
| $75,000 to $99,999 | 0 (0.0%) | 0 (0.0%) |
| $100,000 and over | 133 (79.2%) | 35 (20.8%) |
Public vs Private Health Insurance Coverage by Age in Los Barreras
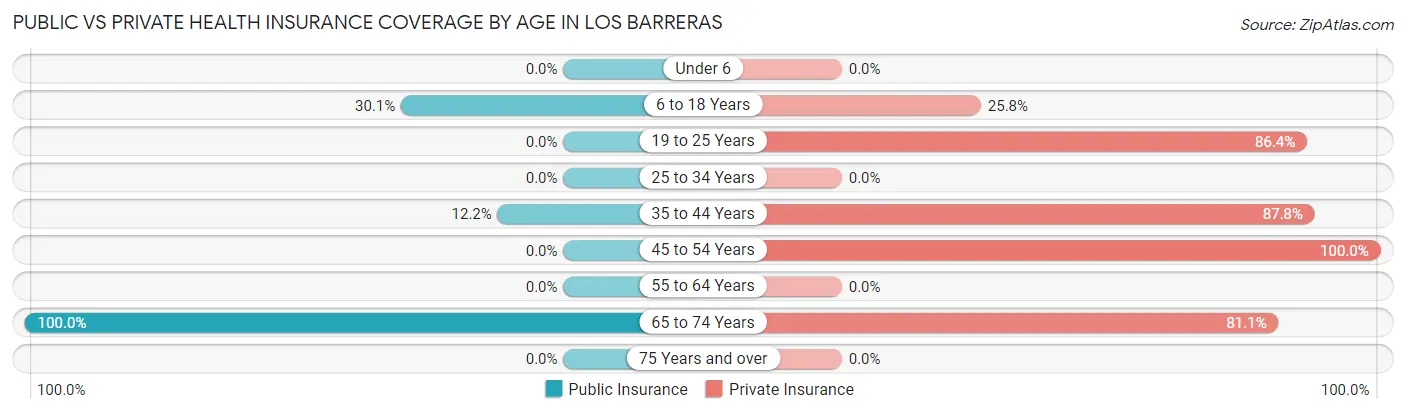
| Age Bracket | Public Insurance | Private Insurance |
| Under 6 | 0 (0.0%) | 0 (0.0%) |
| 6 to 18 Years | 28 (30.1%) | 24 (25.8%) |
| 19 to 25 Years | 0 (0.0%) | 57 (86.4%) |
| 25 to 34 Years | 0 (0.0%) | 0 (0.0%) |
| 35 to 44 Years | 10 (12.2%) | 72 (87.8%) |
| 45 to 54 Years | 0 (0.0%) | 15 (100.0%) |
| 55 to 64 Years | 0 (0.0%) | 0 (0.0%) |
| 65 to 74 Years | 95 (100.0%) | 77 (81.0%) |
| 75 Years and over | 0 (0.0%) | 0 (0.0%) |
| Total | 133 (37.9%) | 245 (69.8%) |
Disability Status by Sex by Age in Los Barreras
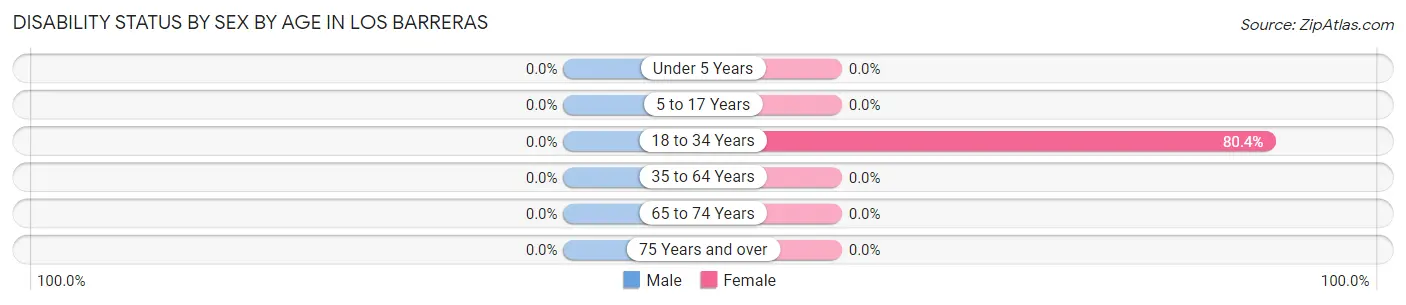
| Age Bracket | Male | Female |
| Under 5 Years | 0 (0.0%) | 0 (0.0%) |
| 5 to 17 Years | 0 (0.0%) | 0 (0.0%) |
| 18 to 34 Years | 0 (0.0%) | 37 (80.4%) |
| 35 to 64 Years | 0 (0.0%) | 0 (0.0%) |
| 65 to 74 Years | 0 (0.0%) | 0 (0.0%) |
| 75 Years and over | 0 (0.0%) | 0 (0.0%) |
Disability Class by Sex by Age in Los Barreras
Disability Class: Hearing Difficulty
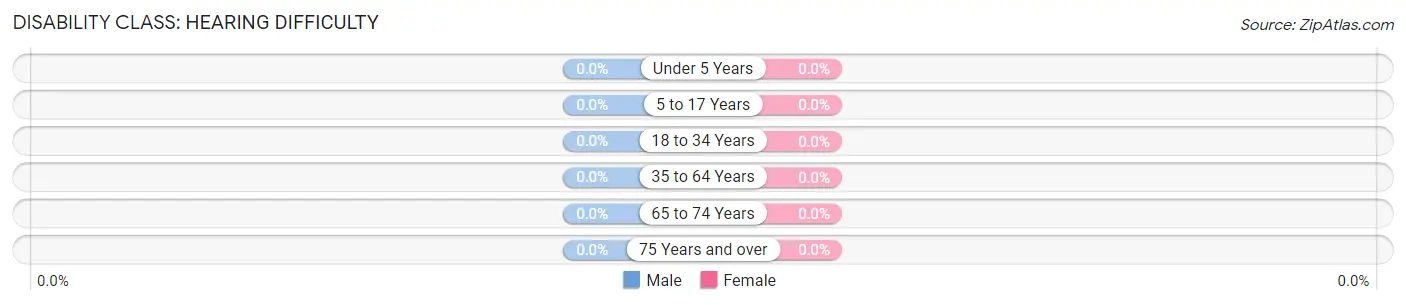
| Age Bracket | Male | Female |
| Under 5 Years | 0 (0.0%) | 0 (0.0%) |
| 5 to 17 Years | 0 (0.0%) | 0 (0.0%) |
| 18 to 34 Years | 0 (0.0%) | 0 (0.0%) |
| 35 to 64 Years | 0 (0.0%) | 0 (0.0%) |
| 65 to 74 Years | 0 (0.0%) | 0 (0.0%) |
| 75 Years and over | 0 (0.0%) | 0 (0.0%) |
Disability Class: Vision Difficulty
| Age Bracket | Male | Female |
| Under 5 Years | 0 (0.0%) | 0 (0.0%) |
| 5 to 17 Years | 0 (0.0%) | 0 (0.0%) |
| 18 to 34 Years | 0 (0.0%) | 0 (0.0%) |
| 35 to 64 Years | 0 (0.0%) | 0 (0.0%) |
| 65 to 74 Years | 0 (0.0%) | 0 (0.0%) |
| 75 Years and over | 0 (0.0%) | 0 (0.0%) |
Disability Class: Cognitive Difficulty
| Age Bracket | Male | Female |
| 5 to 17 Years | 0 (0.0%) | 0 (0.0%) |
| 18 to 34 Years | 0 (0.0%) | 0 (0.0%) |
| 35 to 64 Years | 0 (0.0%) | 0 (0.0%) |
| 65 to 74 Years | 0 (0.0%) | 0 (0.0%) |
| 75 Years and over | 0 (0.0%) | 0 (0.0%) |
Disability Class: Ambulatory Difficulty
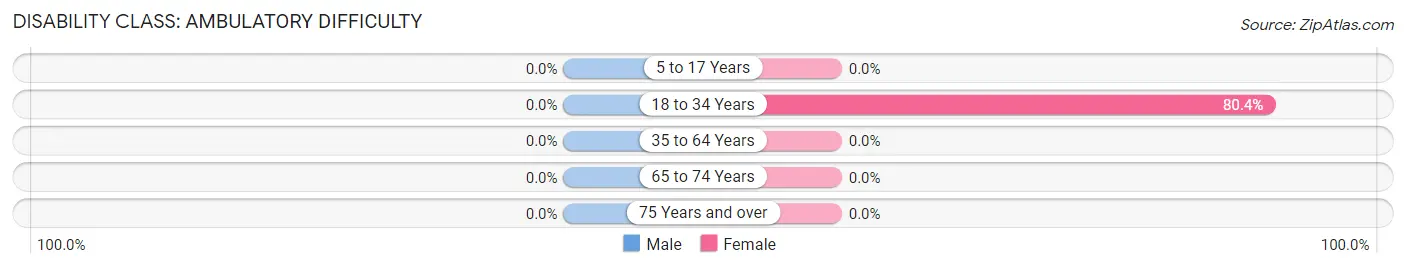
| Age Bracket | Male | Female |
| 5 to 17 Years | 0 (0.0%) | 0 (0.0%) |
| 18 to 34 Years | 0 (0.0%) | 37 (80.4%) |
| 35 to 64 Years | 0 (0.0%) | 0 (0.0%) |
| 65 to 74 Years | 0 (0.0%) | 0 (0.0%) |
| 75 Years and over | 0 (0.0%) | 0 (0.0%) |
Disability Class: Self-Care Difficulty
| Age Bracket | Male | Female |
| 5 to 17 Years | 0 (0.0%) | 0 (0.0%) |
| 18 to 34 Years | 0 (0.0%) | 0 (0.0%) |
| 35 to 64 Years | 0 (0.0%) | 0 (0.0%) |
| 65 to 74 Years | 0 (0.0%) | 0 (0.0%) |
| 75 Years and over | 0 (0.0%) | 0 (0.0%) |
Technology Access in Los Barreras
Computing Device Access in Los Barreras
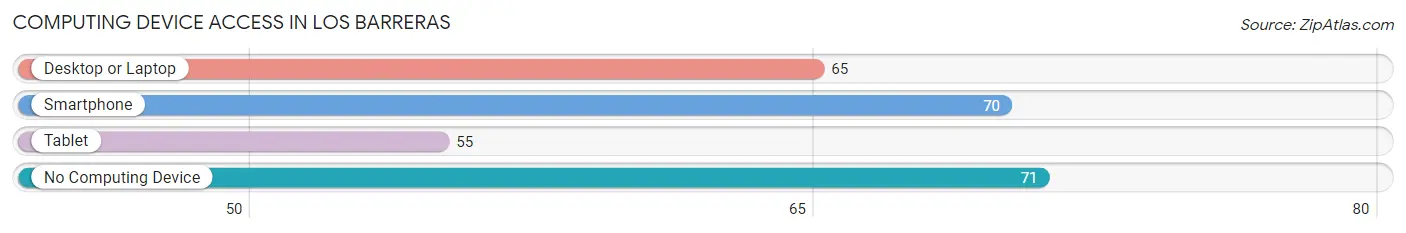
| Device Type | # Households | % Households |
| Desktop or Laptop | 65 | 46.1% |
| Smartphone | 70 | 49.6% |
| Tablet | 55 | 39.0% |
| No Computing Device | 71 | 50.3% |
| Total | 141 | 100.0% |
Internet Access in Los Barreras
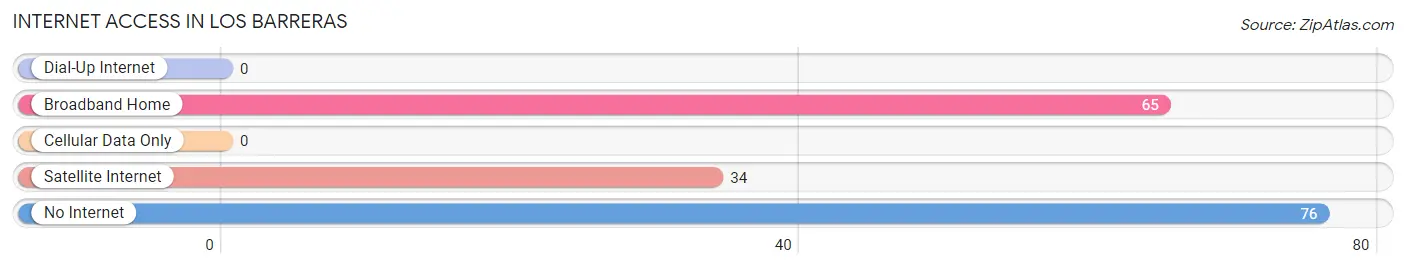
| Internet Type | # Households | % Households |
| Dial-Up Internet | 0 | 0.0% |
| Broadband Home | 65 | 46.1% |
| Cellular Data Only | 0 | 0.0% |
| Satellite Internet | 34 | 24.1% |
| No Internet | 76 | 53.9% |
| Total | 141 | 100.0% |
Los Barreras Summary
History
The small town of Los Barreras, Texas is located in the Rio Grande Valley of South Texas. It is situated in Hidalgo County, approximately 20 miles from the Mexican border. The town was founded in the late 1800s by a group of Mexican immigrants who were looking for a place to settle and start a new life. The town was originally called “Las Barreras”, which translates to “the barriers” in English. This name was chosen to reflect the fact that the town was located near the Rio Grande River, which served as a natural barrier between Mexico and the United States.
The town was initially populated by a mix of Mexican and American settlers. The Mexican settlers were mostly farmers and ranchers, while the American settlers were mostly merchants and traders. As the town grew, it became a hub for trade between Mexico and the United States. The town also became a popular destination for Mexican immigrants looking for work in the United States.
In the early 1900s, Los Barreras experienced a period of rapid growth. This was due to the influx of Mexican immigrants who were looking for work in the United States. The town also became a popular destination for tourists, as it was located near the Rio Grande River and the Mexican border.
Geography
Los Barreras is located in the Rio Grande Valley of South Texas. It is situated in Hidalgo County, approximately 20 miles from the Mexican border. The town is located on the banks of the Rio Grande River, which serves as a natural barrier between Mexico and the United States. The town is surrounded by a variety of landscapes, including flat plains, rolling hills, and dense forests.
The climate in Los Barreras is generally warm and humid. The average temperature in the summer is around 90 degrees Fahrenheit, while the average temperature in the winter is around 70 degrees Fahrenheit. The town receives an average of 30 inches of rain per year.
Economy
The economy of Los Barreras is largely based on agriculture and tourism. The town is home to a variety of farms, which produce a variety of crops, including cotton, corn, and sorghum. The town is also home to a number of tourist attractions, including the Rio Grande River, the Mexican border, and the nearby cities of McAllen and Brownsville.
The town is also home to a number of businesses, including restaurants, bars, and shops. The town is also home to a number of manufacturing companies, which produce a variety of products, including furniture, clothing, and electronics.
Demographics
As of the 2010 census, the population of Los Barreras was 2,845. The town is predominantly Hispanic, with 95.3% of the population identifying as such. The median household income in the town is $25,972, and the median age is 28.7 years. The town is also home to a variety of religious denominations, including Catholic, Protestant, and Mormon.
Conclusion
Los Barreras, Texas is a small town located in the Rio Grande Valley of South Texas. It is situated in Hidalgo County, approximately 20 miles from the Mexican border. The town was founded in the late 1800s by a group of Mexican immigrants who were looking for a place to settle and start a new life. The town is predominantly Hispanic, with 95.3% of the population identifying as such. The economy of Los Barreras is largely based on agriculture and tourism. The town is also home to a number of businesses, including restaurants, bars, and shops. The town is also home to a variety of religious denominations, including Catholic, Protestant, and Mormon.
Common Questions
What is the Total Population of Los Barreras?
Total Population of Los Barreras is 351.
What is the Total Male Population of Los Barreras?
Total Male Population of Los Barreras is 146.
What is the Total Female Population of Los Barreras?
Total Female Population of Los Barreras is 205.
What is the Ratio of Males per 100 Females in Los Barreras?
There are 71.22 Males per 100 Females in Los Barreras.
What is the Ratio of Females per 100 Males in Los Barreras?
There are 140.41 Females per 100 Males in Los Barreras.
What is the Median Population Age in Los Barreras?
Median Population Age in Los Barreras is 41.3 Years.
What is the Average Family Size in Los Barreras
Average Family Size in Los Barreras is 4.8 People.
What is the Average Household Size in Los Barreras
Average Household Size in Los Barreras is 2.5 People.
What is Per Capita Income in Los Barreras?
Per Capita income in Los Barreras is $20,698.
What is the Median Family Income in Los Barreras?
Median Family Income in Los Barreras is $115,919.
What is Income or Wage Gap in Los Barreras?
Income or Wage Gap in Los Barreras is 31.2%.
Women in Los Barreras earn 68.8 cents for every dollar earned by a man.
What is Inequality or Gini Index in Los Barreras?
Inequality or Gini Index in Los Barreras is 0.46.
How Large is the Labor Force in Los Barreras?
There are 144 People in the Labor Forcein in Los Barreras.
What is the Percentage of People in the Labor Force in Los Barreras?
51.1% of People are in the Labor Force in Los Barreras.