Linden, TX
Linden Map
Linden Overview
1,707
TOTAL POPULATION
746
MALE POPULATION
961
FEMALE POPULATION
77.63
MALES / 100 FEMALES
128.82
FEMALES / 100 MALES
45.3
MEDIAN AGE
2.8
AVG FAMILY SIZE
2.2
AVG HOUSEHOLD SIZE
$24,319
PER CAPITA INCOME
$61,500
AVG FAMILY INCOME
$42,750
AVG HOUSEHOLD INCOME
42.2%
WAGE / INCOME GAP [ % ]
57.8¢/ $1
WAGE / INCOME GAP [ $ ]
$12,460
FAMILY INCOME DEFICIT
0.47
INEQUALITY / GINI INDEX
636
LABOR FORCE [ PEOPLE ]
45.9%
PERCENT IN LABOR FORCE
9.3%
UNEMPLOYMENT RATE
Linden Zip Codes
Linden Area Codes
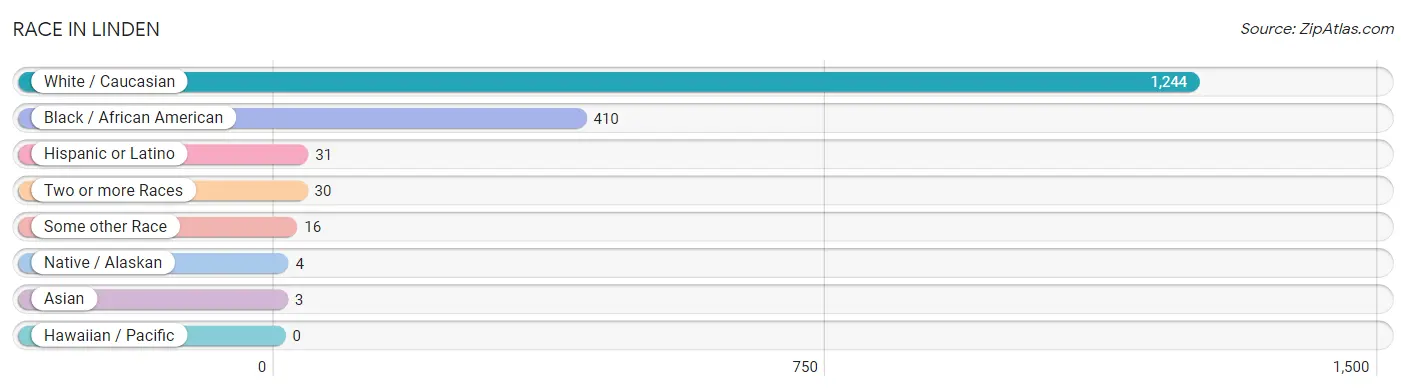
Race in Linden
The most populous races in Linden are White / Caucasian (1,244 | 72.9%), Black / African American (410 | 24.0%), and Hispanic or Latino (31 | 1.8%).
| Race | # Population | % Population |
| Asian | 3 | 0.2% |
| Black / African American | 410 | 24.0% |
| Hawaiian / Pacific | 0 | 0.0% |
| Hispanic or Latino | 31 | 1.8% |
| Native / Alaskan | 4 | 0.2% |
| White / Caucasian | 1,244 | 72.9% |
| Two or more Races | 30 | 1.8% |
| Some other Race | 16 | 0.9% |
| Total | 1,707 | 100.0% |
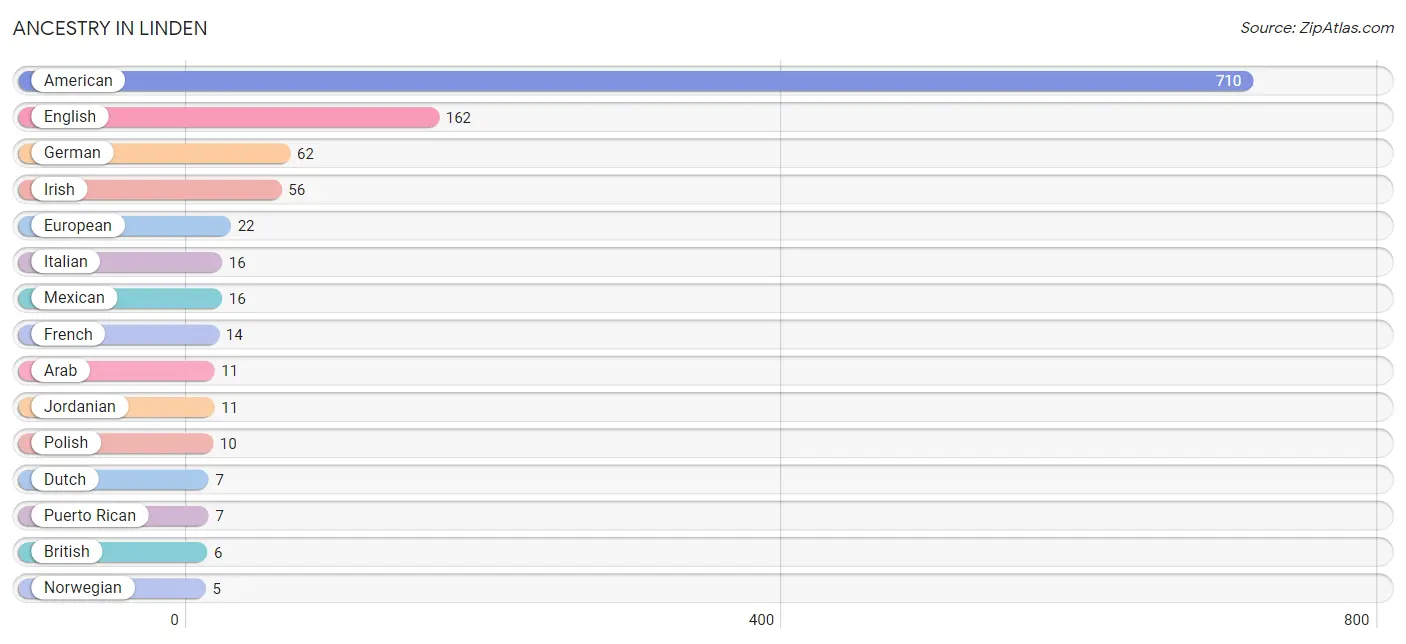
Ancestry in Linden
The most populous ancestries reported in Linden are American (710 | 41.6%), English (162 | 9.5%), German (62 | 3.6%), Irish (56 | 3.3%), and European (22 | 1.3%), together accounting for 59.3% of all Linden residents.
| Ancestry | # Population | % Population |
| American | 710 | 41.6% |
| Arab | 11 | 0.6% |
| Blackfeet | 4 | 0.2% |
| British | 6 | 0.4% |
| Dutch | 7 | 0.4% |
| English | 162 | 9.5% |
| European | 22 | 1.3% |
| French | 14 | 0.8% |
| German | 62 | 3.6% |
| Indian (Asian) | 1 | 0.1% |
| Irish | 56 | 3.3% |
| Italian | 16 | 0.9% |
| Jordanian | 11 | 0.6% |
| Mexican | 16 | 0.9% |
| Norwegian | 5 | 0.3% |
| Pennsylvania German | 5 | 0.3% |
| Polish | 10 | 0.6% |
| Puerto Rican | 7 | 0.4% |
| Scotch-Irish | 4 | 0.2% |
| Scottish | 3 | 0.2% |
| Sri Lankan | 2 | 0.1% | View All 21 Rows |
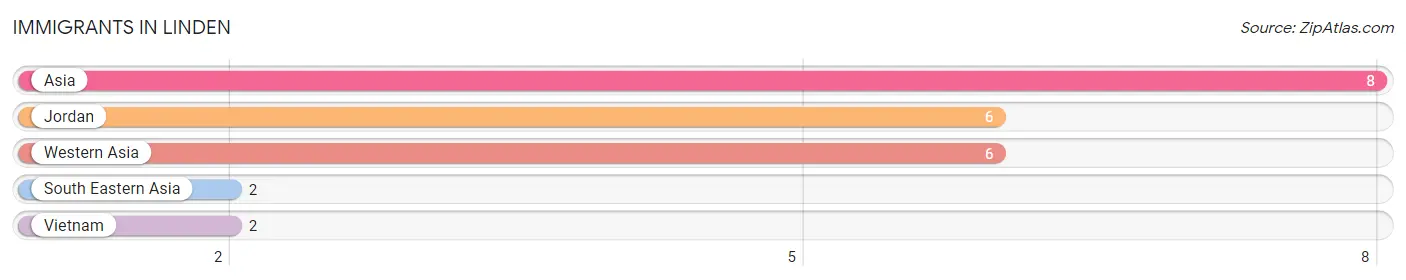
Immigrants in Linden
The most numerous immigrant groups reported in Linden came from Asia (8 | 0.5%), Jordan (6 | 0.4%), Western Asia (6 | 0.4%), South Eastern Asia (2 | 0.1%), and Vietnam (2 | 0.1%), together accounting for 1.4% of all Linden residents.
| Immigration Origin | # Population | % Population |
| Asia | 8 | 0.5% |
| Jordan | 6 | 0.4% |
| South Eastern Asia | 2 | 0.1% |
| Vietnam | 2 | 0.1% |
| Western Asia | 6 | 0.4% | View All 5 Rows |
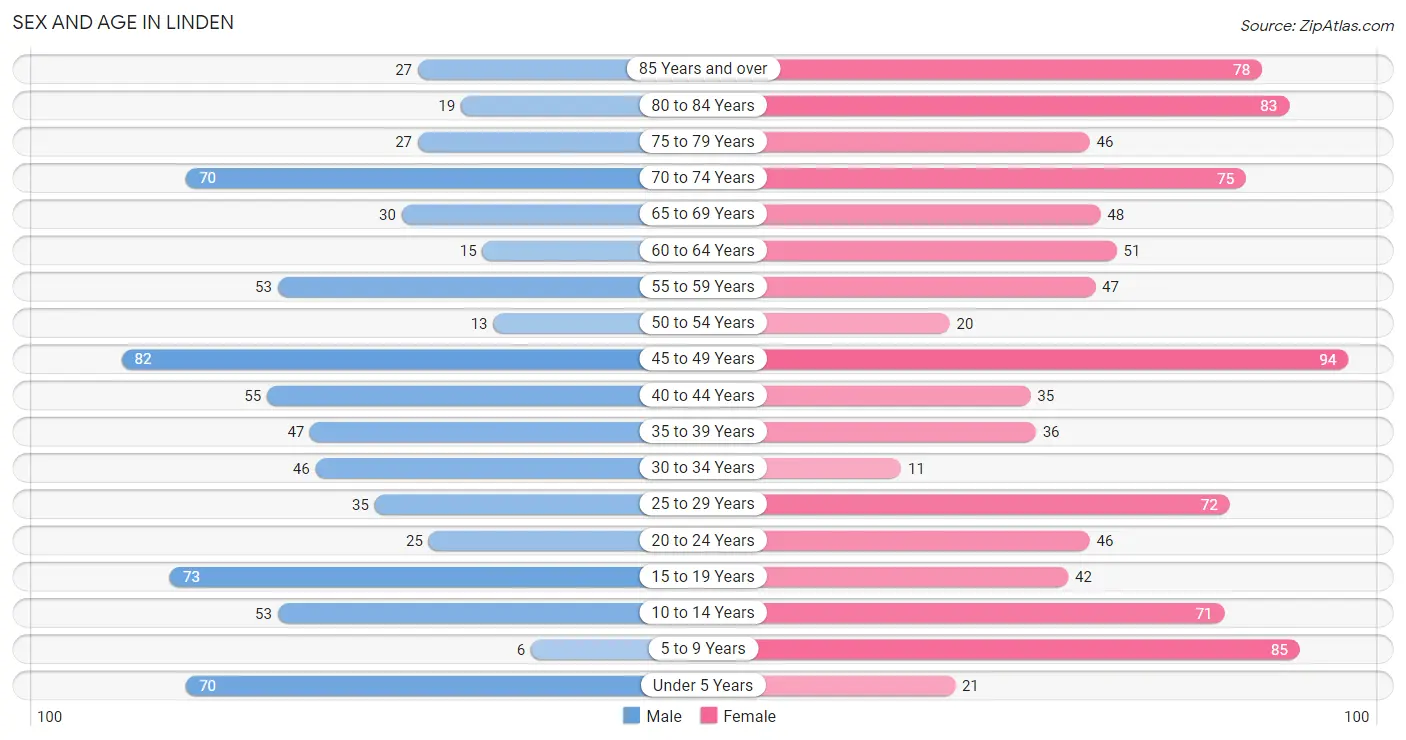
Sex and Age in Linden
Sex and Age in Linden
The most populous age groups in Linden are 45 to 49 Years (82 | 11.0%) for men and 45 to 49 Years (94 | 9.8%) for women.
| Age Bracket | Male | Female |
| Under 5 Years | 70 (9.4%) | 21 (2.2%) |
| 5 to 9 Years | 6 (0.8%) | 85 (8.8%) |
| 10 to 14 Years | 53 (7.1%) | 71 (7.4%) |
| 15 to 19 Years | 73 (9.8%) | 42 (4.4%) |
| 20 to 24 Years | 25 (3.4%) | 46 (4.8%) |
| 25 to 29 Years | 35 (4.7%) | 72 (7.5%) |
| 30 to 34 Years | 46 (6.2%) | 11 (1.1%) |
| 35 to 39 Years | 47 (6.3%) | 36 (3.7%) |
| 40 to 44 Years | 55 (7.4%) | 35 (3.6%) |
| 45 to 49 Years | 82 (11.0%) | 94 (9.8%) |
| 50 to 54 Years | 13 (1.7%) | 20 (2.1%) |
| 55 to 59 Years | 53 (7.1%) | 47 (4.9%) |
| 60 to 64 Years | 15 (2.0%) | 51 (5.3%) |
| 65 to 69 Years | 30 (4.0%) | 48 (5.0%) |
| 70 to 74 Years | 70 (9.4%) | 75 (7.8%) |
| 75 to 79 Years | 27 (3.6%) | 46 (4.8%) |
| 80 to 84 Years | 19 (2.5%) | 83 (8.6%) |
| 85 Years and over | 27 (3.6%) | 78 (8.1%) |
| Total | 746 (100.0%) | 961 (100.0%) |
Families and Households in Linden
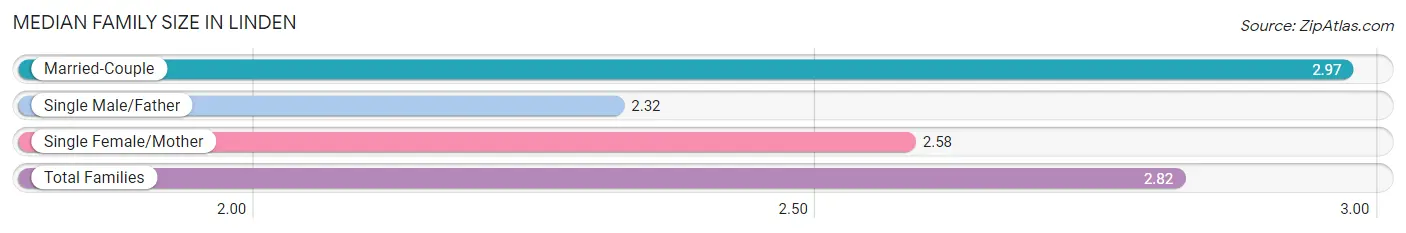
Median Family Size in Linden
The median family size in Linden is 2.82 persons per family, with married-couple families (283 | 65.5%) accounting for the largest median family size of 2.97 persons per family. On the other hand, single male/father families (25 | 5.8%) represent the smallest median family size with 2.32 persons per family.
| Family Type | # Families | Family Size |
| Married-Couple | 283 (65.5%) | 2.97 |
| Single Male/Father | 25 (5.8%) | 2.32 |
| Single Female/Mother | 124 (28.7%) | 2.58 |
| Total Families | 432 (100.0%) | 2.82 |
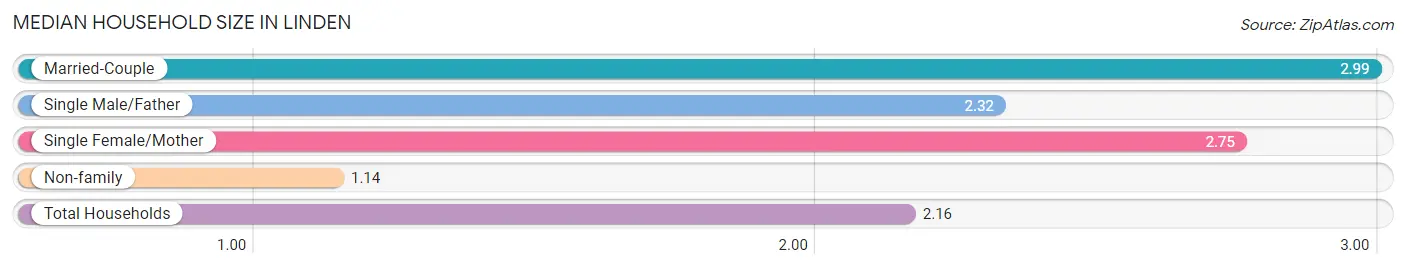
Median Household Size in Linden
The median household size in Linden is 2.16 persons per household, with married-couple households (283 | 38.4%) accounting for the largest median household size of 2.99 persons per household. non-family households (305 | 41.4%) represent the smallest median household size with 1.14 persons per household.
| Household Type | # Households | Household Size |
| Married-Couple | 283 (38.4%) | 2.99 |
| Single Male/Father | 25 (3.4%) | 2.32 |
| Single Female/Mother | 124 (16.8%) | 2.75 |
| Non-family | 305 (41.4%) | 1.14 |
| Total Households | 737 (100.0%) | 2.16 |
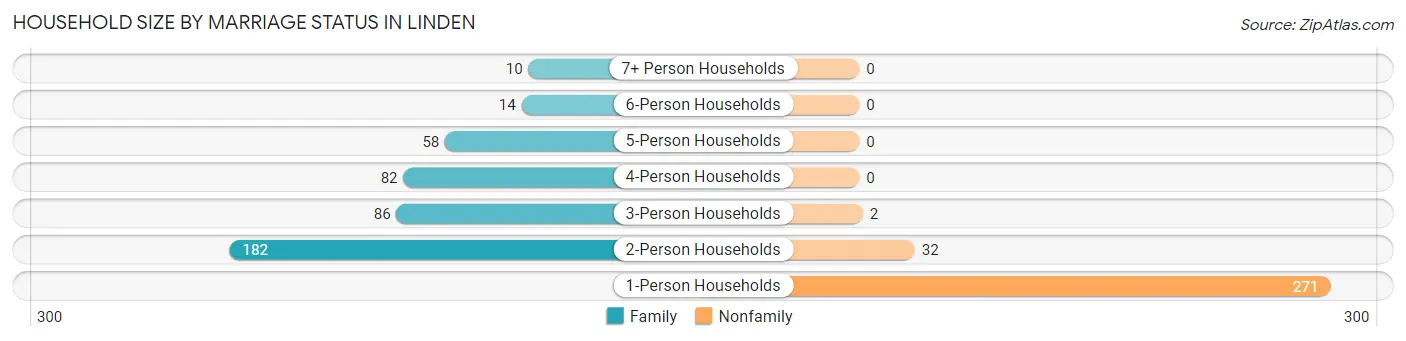
Household Size by Marriage Status in Linden
Out of a total of 737 households in Linden, 432 (58.6%) are family households, while 305 (41.4%) are nonfamily households. The most numerous type of family households are 2-person households, comprising 182, and the most common type of nonfamily households are 1-person households, comprising 271.
| Household Size | Family Households | Nonfamily Households |
| 1-Person Households | - | 271 (36.8%) |
| 2-Person Households | 182 (24.7%) | 32 (4.3%) |
| 3-Person Households | 86 (11.7%) | 2 (0.3%) |
| 4-Person Households | 82 (11.1%) | 0 (0.0%) |
| 5-Person Households | 58 (7.9%) | 0 (0.0%) |
| 6-Person Households | 14 (1.9%) | 0 (0.0%) |
| 7+ Person Households | 10 (1.4%) | 0 (0.0%) |
| Total | 432 (58.6%) | 305 (41.4%) |
Female Fertility in Linden
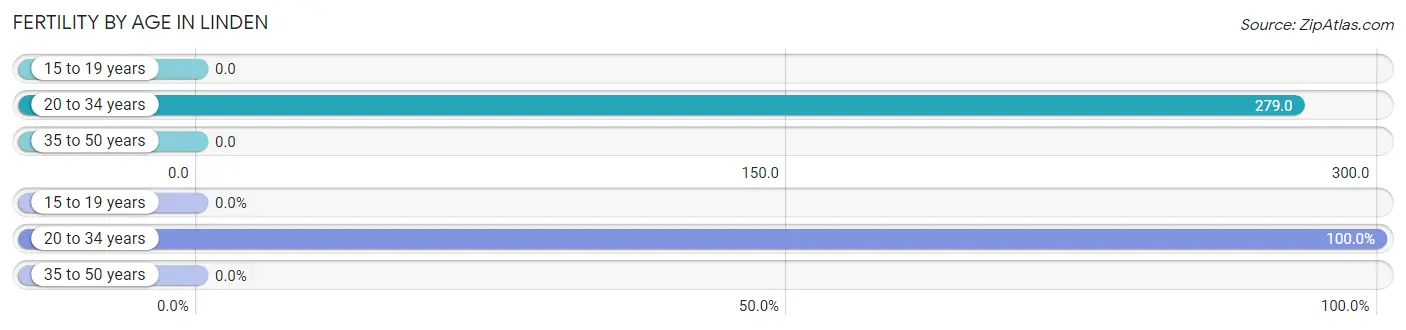
Fertility by Age in Linden
Average fertility rate in Linden is 107.0 births per 1,000 women. Women in the age bracket of 20 to 34 years have the highest fertility rate with 279.0 births per 1,000 women. Women in the age bracket of 20 to 34 years acount for 100.0% of all women with births.
| Age Bracket | Women with Births | Births / 1,000 Women |
| 15 to 19 years | 0 (0.0%) | 0.0 |
| 20 to 34 years | 36 (100.0%) | 279.0 |
| 35 to 50 years | 0 (0.0%) | 0.0 |
| Total | 36 (100.0%) | 107.0 |
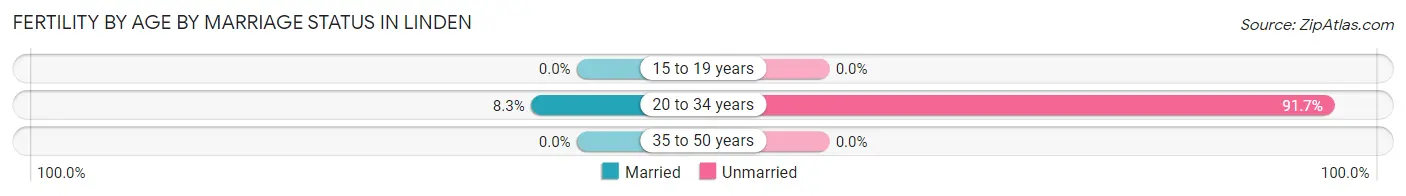
Fertility by Age by Marriage Status in Linden
8.3% of women with births (36) in Linden are married. The highest percentage of unmarried women with births falls into 20 to 34 years age bracket with 91.7% of them unmarried at the time of birth, while the lowest percentage of unmarried women with births belong to 20 to 34 years age bracket with 91.7% of them unmarried.
| Age Bracket | Married | Unmarried |
| 15 to 19 years | 0 (0.0%) | 0 (0.0%) |
| 20 to 34 years | 3 (8.3%) | 33 (91.7%) |
| 35 to 50 years | 0 (0.0%) | 0 (0.0%) |
| Total | 3 (8.3%) | 33 (91.7%) |
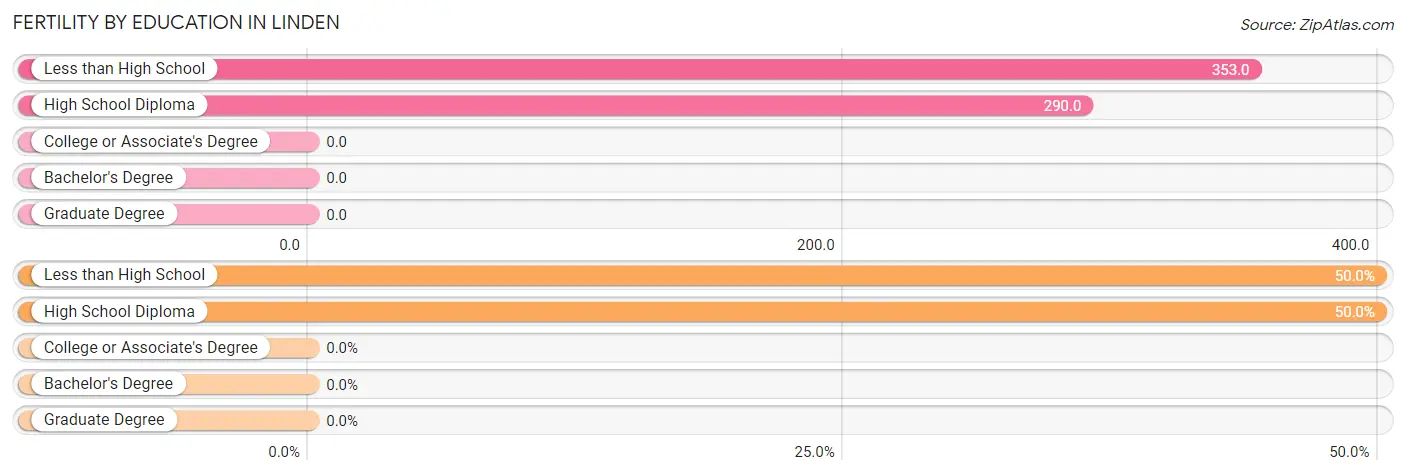
Fertility by Education in Linden
| Educational Attainment | Women with Births | Births / 1,000 Women |
| Less than High School | 18 (50.0%) | 353.0 |
| High School Diploma | 18 (50.0%) | 290.0 |
| College or Associate's Degree | 0 (0.0%) | 0.0 |
| Bachelor's Degree | 0 (0.0%) | 0.0 |
| Graduate Degree | 0 (0.0%) | 0.0 |
| Total | 36 (100.0%) | 107.0 |
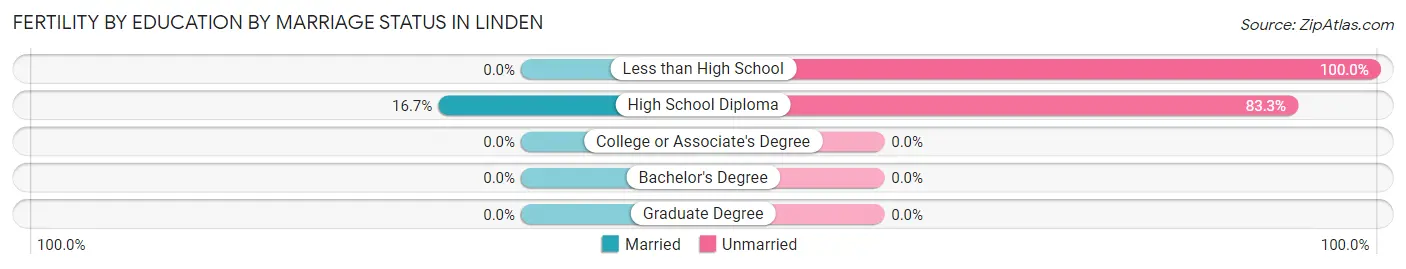
Fertility by Education by Marriage Status in Linden
91.7% of women with births in Linden are unmarried. Women with the educational attainment of high school diploma are most likely to be married with 16.7% of them married at childbirth, while women with the educational attainment of less than high school are least likely to be married with 100.0% of them unmarried at childbirth.
| Educational Attainment | Married | Unmarried |
| Less than High School | 0 (0.0%) | 18 (100.0%) |
| High School Diploma | 3 (16.7%) | 15 (83.3%) |
| College or Associate's Degree | 0 (0.0%) | 0 (0.0%) |
| Bachelor's Degree | 0 (0.0%) | 0 (0.0%) |
| Graduate Degree | 0 (0.0%) | 0 (0.0%) |
| Total | 3 (8.3%) | 33 (91.7%) |
Income in Linden
Income Overview in Linden
Per Capita Income in Linden is $24,319, while median incomes of families and households are $61,500 and $42,750 respectively.
| Characteristic | Number | Measure |
| Per Capita Income | 1,707 | $24,319 |
| Median Family Income | 432 | $61,500 |
| Mean Family Income | 432 | $75,648 |
| Median Household Income | 737 | $42,750 |
| Mean Household Income | 737 | $56,914 |
| Income Deficit | 432 | $12,460 |
| Wage / Income Gap (%) | 1,707 | 42.17% |
| Wage / Income Gap ($) | 1,707 | 57.83¢ per $1 |
| Gini / Inequality Index | 1,707 | 0.47 |
Earnings by Sex in Linden
Average Earnings in Linden are $32,780, $38,906 for men and $22,500 for women, a difference of 42.2%.
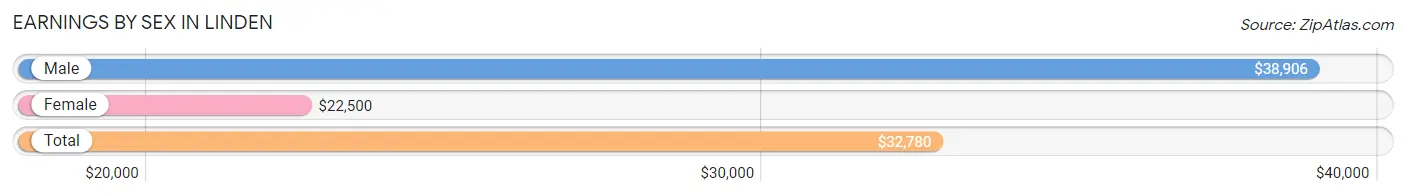
| Sex | Number | Average Earnings |
| Male | 351 (53.1%) | $38,906 |
| Female | 310 (46.9%) | $22,500 |
| Total | 661 (100.0%) | $32,780 |
Earnings by Sex by Income Bracket in Linden
The most common earnings brackets in Linden are $55,000 to $64,999 for men (61 | 17.4%) and $30,000 to $34,999 for women (64 | 20.6%).
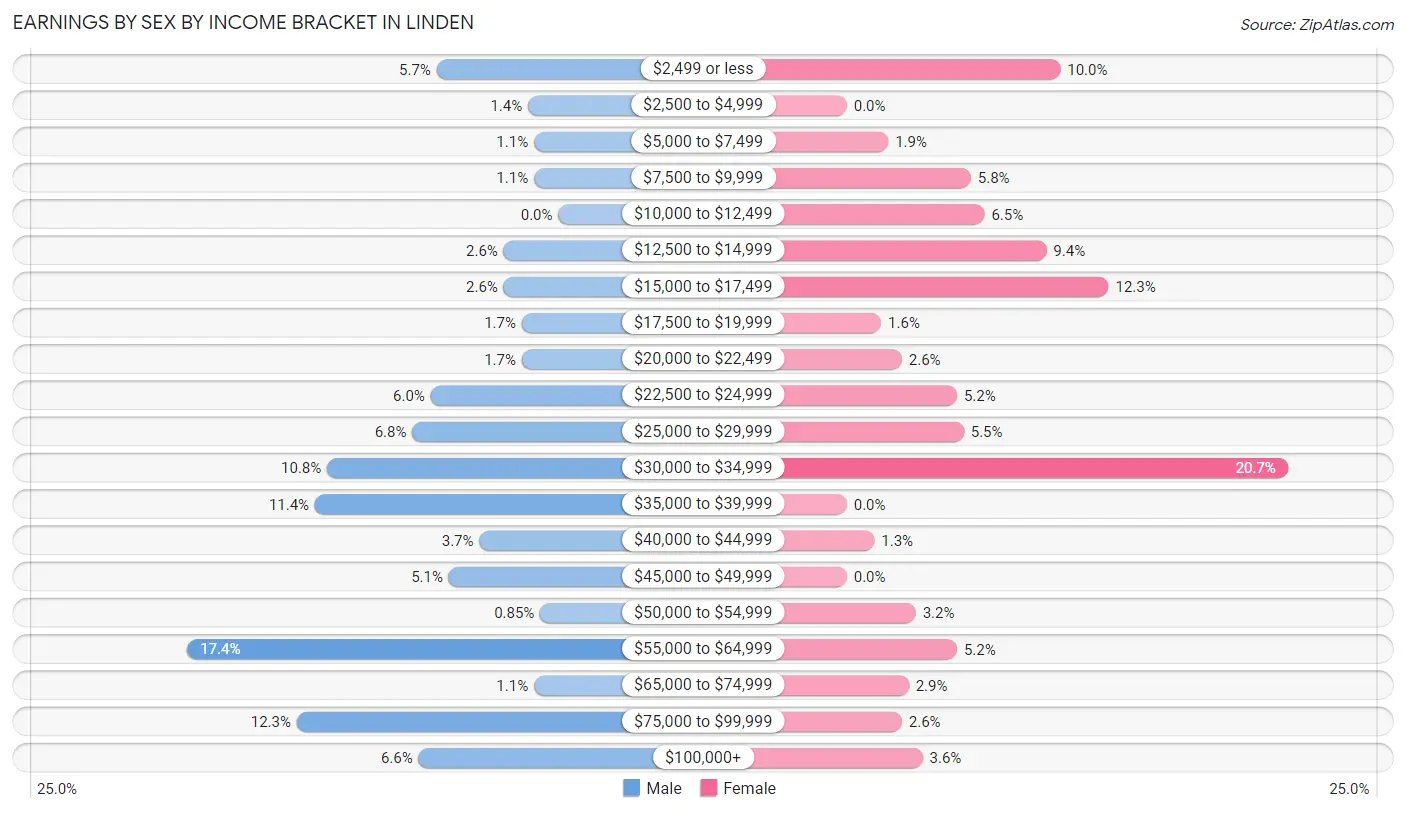
| Income | Male | Female |
| $2,499 or less | 20 (5.7%) | 31 (10.0%) |
| $2,500 to $4,999 | 5 (1.4%) | 0 (0.0%) |
| $5,000 to $7,499 | 4 (1.1%) | 6 (1.9%) |
| $7,500 to $9,999 | 4 (1.1%) | 18 (5.8%) |
| $10,000 to $12,499 | 0 (0.0%) | 20 (6.5%) |
| $12,500 to $14,999 | 9 (2.6%) | 29 (9.3%) |
| $15,000 to $17,499 | 9 (2.6%) | 38 (12.3%) |
| $17,500 to $19,999 | 6 (1.7%) | 5 (1.6%) |
| $20,000 to $22,499 | 6 (1.7%) | 8 (2.6%) |
| $22,500 to $24,999 | 21 (6.0%) | 16 (5.2%) |
| $25,000 to $29,999 | 24 (6.8%) | 17 (5.5%) |
| $30,000 to $34,999 | 38 (10.8%) | 64 (20.6%) |
| $35,000 to $39,999 | 40 (11.4%) | 0 (0.0%) |
| $40,000 to $44,999 | 13 (3.7%) | 4 (1.3%) |
| $45,000 to $49,999 | 18 (5.1%) | 0 (0.0%) |
| $50,000 to $54,999 | 3 (0.9%) | 10 (3.2%) |
| $55,000 to $64,999 | 61 (17.4%) | 16 (5.2%) |
| $65,000 to $74,999 | 4 (1.1%) | 9 (2.9%) |
| $75,000 to $99,999 | 43 (12.2%) | 8 (2.6%) |
| $100,000+ | 23 (6.6%) | 11 (3.5%) |
| Total | 351 (100.0%) | 310 (100.0%) |
Earnings by Sex by Educational Attainment in Linden
Average earnings in Linden are $41,375 for men and $28,088 for women, a difference of 32.1%. Men with an educational attainment of high school diploma enjoy the highest average annual earnings of $47,917, while those with college or associate's degree education earn the least with $37,708. Women with an educational attainment of high school diploma earn the most with the average annual earnings of $33,056, while those with college or associate's degree education have the smallest earnings of $31,250.
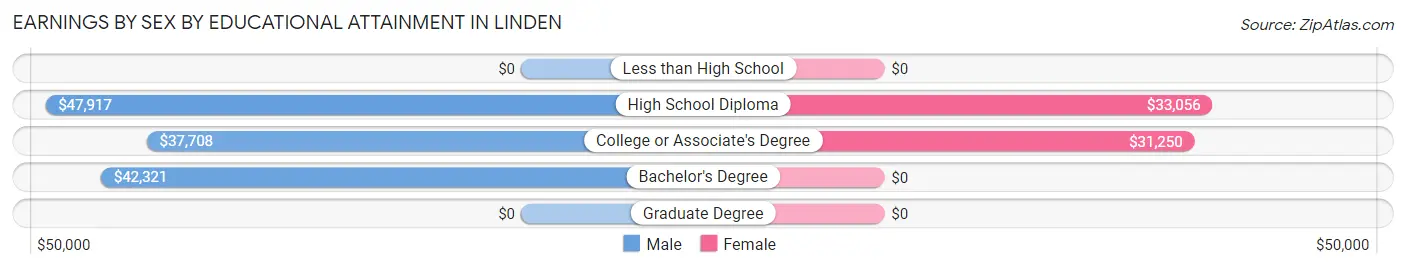
| Educational Attainment | Male Income | Female Income |
| Less than High School | - | - |
| High School Diploma | $47,917 | $33,056 |
| College or Associate's Degree | $37,708 | $31,250 |
| Bachelor's Degree | $42,321 | $0 |
| Graduate Degree | - | - |
| Total | $41,375 | $28,088 |
Family Income in Linden
Family Income Brackets in Linden
According to the Linden family income data, there are 146 families falling into the $50,000 to $74,999 income range, which is the most common income bracket and makes up 33.8% of all families. Conversely, the less than $10,000 income bracket is the least frequent group with only 8 families (1.8%) belonging to this category.
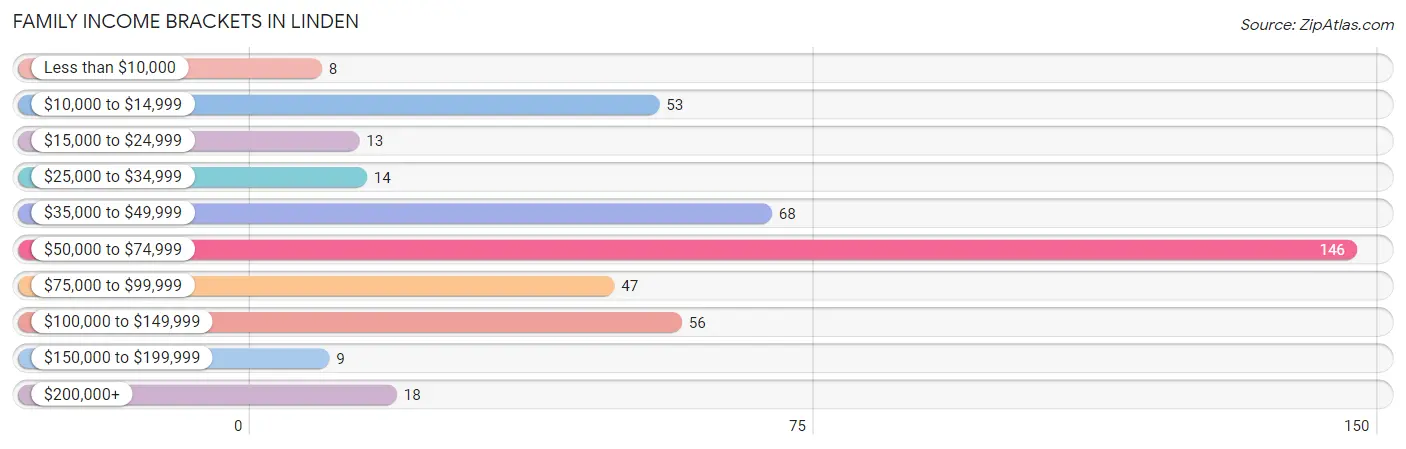
| Income Bracket | # Families | % Families |
| Less than $10,000 | 8 | 1.9% |
| $10,000 to $14,999 | 53 | 12.3% |
| $15,000 to $24,999 | 13 | 3.0% |
| $25,000 to $34,999 | 14 | 3.2% |
| $35,000 to $49,999 | 68 | 15.7% |
| $50,000 to $74,999 | 146 | 33.8% |
| $75,000 to $99,999 | 47 | 10.9% |
| $100,000 to $149,999 | 56 | 13.0% |
| $150,000 to $199,999 | 9 | 2.1% |
| $200,000+ | 18 | 4.2% |
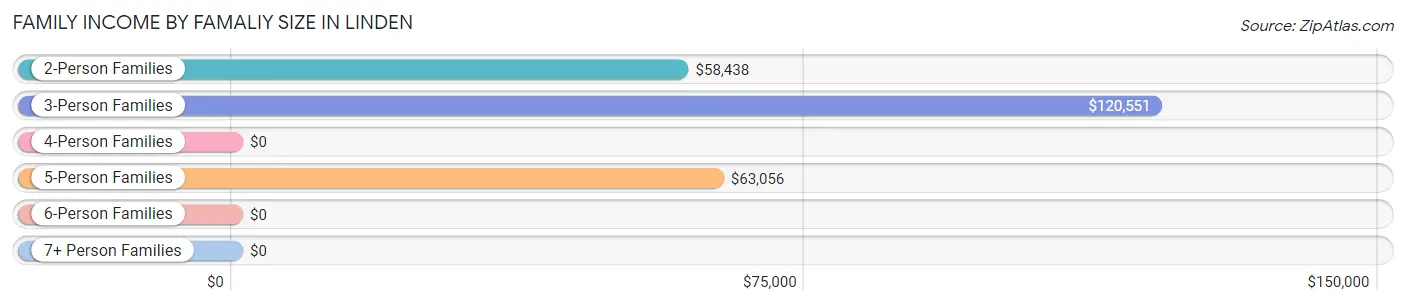
Family Income by Famaliy Size in Linden
3-person families (65 | 15.0%) account for the highest median family income in Linden with $120,551 per family, while 3-person families (65 | 15.0%) have the highest median income of $40,184 per family member.
| Income Bracket | # Families | Median Income |
| 2-Person Families | 203 (47.0%) | $58,438 |
| 3-Person Families | 65 (15.0%) | $120,551 |
| 4-Person Families | 82 (19.0%) | $0 |
| 5-Person Families | 58 (13.4%) | $63,056 |
| 6-Person Families | 14 (3.2%) | $0 |
| 7+ Person Families | 10 (2.3%) | $0 |
| Total | 432 (100.0%) | $61,500 |
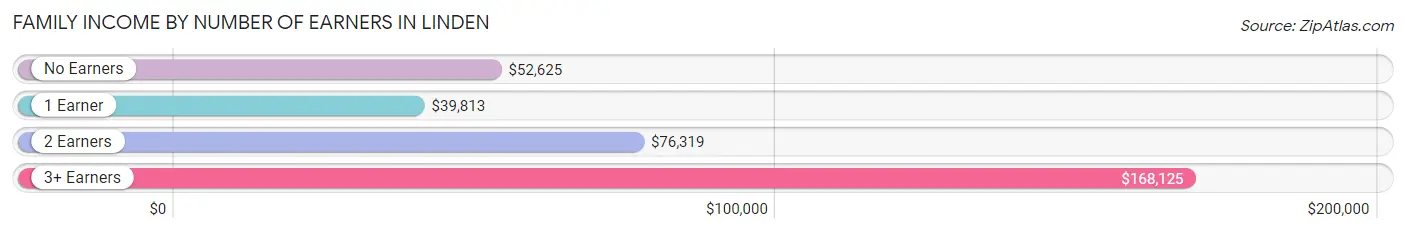
Family Income by Number of Earners in Linden
The median family income in Linden is $61,500, with families comprising 3+ earners (25) having the highest median family income of $168,125, while families with 1 earner (185) have the lowest median family income of $39,813, accounting for 5.8% and 42.8% of families, respectively.
| Number of Earners | # Families | Median Income |
| No Earners | 99 (22.9%) | $52,625 |
| 1 Earner | 185 (42.8%) | $39,813 |
| 2 Earners | 123 (28.5%) | $76,319 |
| 3+ Earners | 25 (5.8%) | $168,125 |
| Total | 432 (100.0%) | $61,500 |
Household Income in Linden
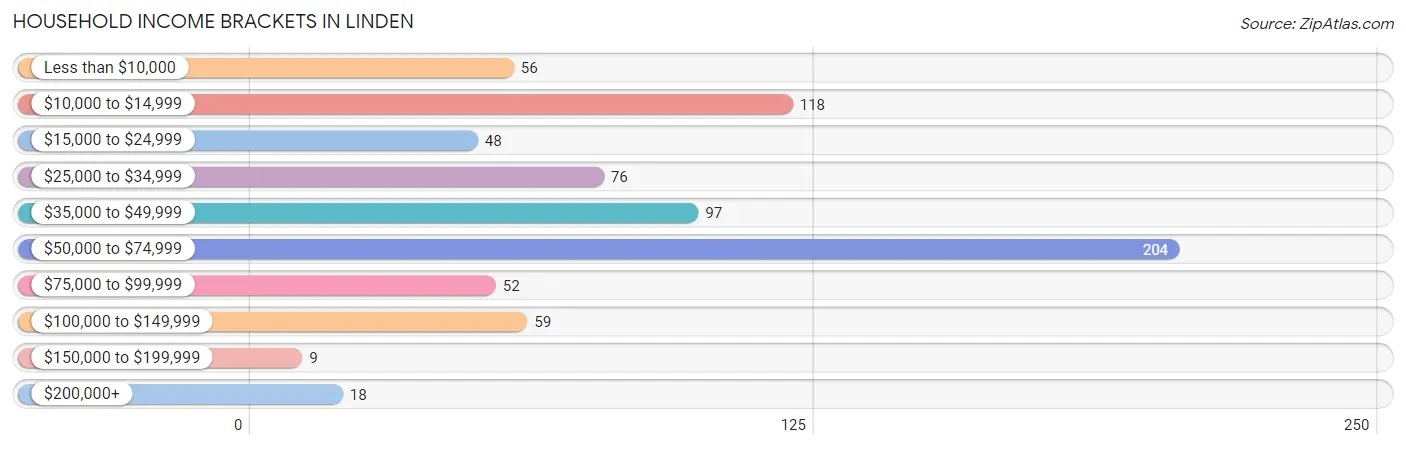
Household Income Brackets in Linden
With 204 households falling in the category, the $50,000 to $74,999 income range is the most frequent in Linden, accounting for 27.7% of all households. In contrast, only 9 households (1.2%) fall into the $150,000 to $199,999 income bracket, making it the least populous group.
| Income Bracket | # Households | % Households |
| Less than $10,000 | 56 | 7.6% |
| $10,000 to $14,999 | 118 | 16.0% |
| $15,000 to $24,999 | 48 | 6.5% |
| $25,000 to $34,999 | 76 | 10.3% |
| $35,000 to $49,999 | 97 | 13.2% |
| $50,000 to $74,999 | 204 | 27.7% |
| $75,000 to $99,999 | 52 | 7.1% |
| $100,000 to $149,999 | 59 | 8.0% |
| $150,000 to $199,999 | 9 | 1.2% |
| $200,000+ | 18 | 2.4% |
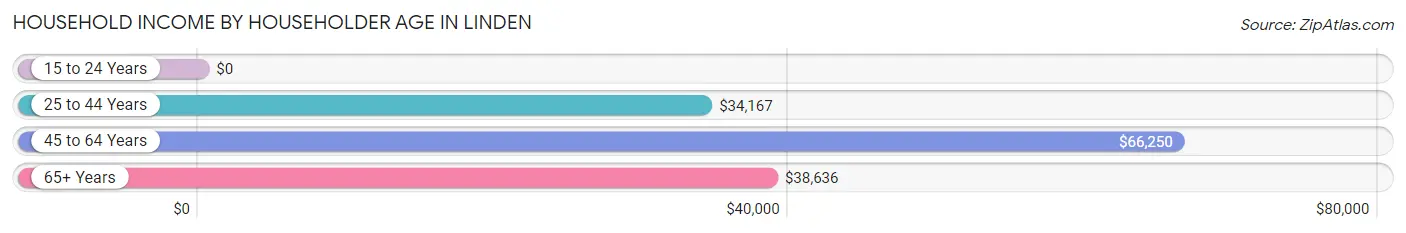
Household Income by Householder Age in Linden
The median household income in Linden is $42,750, with the highest median household income of $66,250 found in the 45 to 64 years age bracket for the primary householder. A total of 259 households (35.1%) fall into this category. Meanwhile, the 15 to 24 years age bracket for the primary householder has the lowest median household income of $0, with 18 households (2.4%) in this group.
| Income Bracket | # Households | Median Income |
| 15 to 24 Years | 18 (2.4%) | $0 |
| 25 to 44 Years | 160 (21.7%) | $34,167 |
| 45 to 64 Years | 259 (35.1%) | $66,250 |
| 65+ Years | 300 (40.7%) | $38,636 |
| Total | 737 (100.0%) | $42,750 |
Poverty in Linden
Income Below Poverty by Sex and Age in Linden
With 31.8% poverty level for males and 29.3% for females among the residents of Linden, under 5 year old males and under 5 year old females are the most vulnerable to poverty, with 64 males (100.0%) and 21 females (100.0%) in their respective age groups living below the poverty level.

| Age Bracket | Male | Female |
| Under 5 Years | 64 (100.0%) | 21 (100.0%) |
| 5 Years | 6 (100.0%) | 5 (100.0%) |
| 6 to 11 Years | 6 (22.2%) | 22 (22.9%) |
| 12 to 14 Years | 6 (23.1%) | 6 (10.9%) |
| 15 Years | 15 (100.0%) | 0 (0.0%) |
| 16 and 17 Years | 28 (71.8%) | 16 (100.0%) |
| 18 to 24 Years | 15 (45.5%) | 18 (25.0%) |
| 25 to 34 Years | 21 (36.8%) | 45 (54.2%) |
| 35 to 44 Years | 23 (28.7%) | 26 (36.6%) |
| 45 to 54 Years | 3 (3.2%) | 26 (22.8%) |
| 55 to 64 Years | 5 (7.3%) | 36 (37.1%) |
| 65 to 74 Years | 13 (14.9%) | 17 (13.8%) |
| 75 Years and over | 4 (6.6%) | 34 (19.3%) |
| Total | 209 (31.8%) | 272 (29.3%) |
Income Above Poverty by Sex and Age in Linden
According to the poverty statistics in Linden, males aged 45 to 54 years and females aged 12 to 14 years are the age groups that are most secure financially, with 96.8% of males and 89.1% of females in these age groups living above the poverty line.
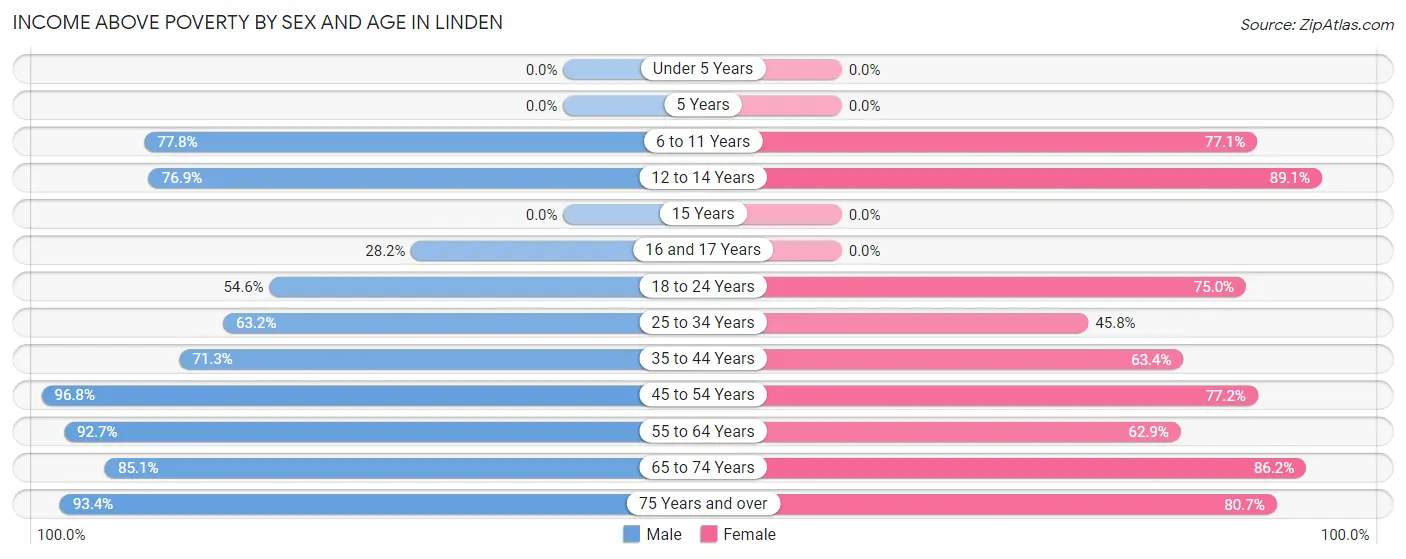
| Age Bracket | Male | Female |
| Under 5 Years | 0 (0.0%) | 0 (0.0%) |
| 5 Years | 0 (0.0%) | 0 (0.0%) |
| 6 to 11 Years | 21 (77.8%) | 74 (77.1%) |
| 12 to 14 Years | 20 (76.9%) | 49 (89.1%) |
| 15 Years | 0 (0.0%) | 0 (0.0%) |
| 16 and 17 Years | 11 (28.2%) | 0 (0.0%) |
| 18 to 24 Years | 18 (54.5%) | 54 (75.0%) |
| 25 to 34 Years | 36 (63.2%) | 38 (45.8%) |
| 35 to 44 Years | 57 (71.3%) | 45 (63.4%) |
| 45 to 54 Years | 92 (96.8%) | 88 (77.2%) |
| 55 to 64 Years | 63 (92.6%) | 61 (62.9%) |
| 65 to 74 Years | 74 (85.1%) | 106 (86.2%) |
| 75 Years and over | 57 (93.4%) | 142 (80.7%) |
| Total | 449 (68.2%) | 657 (70.7%) |
Income Below Poverty Among Married-Couple Families in Linden
The poverty statistics for married-couple families in Linden show that 11.3% or 32 of the total 283 families live below the poverty line. Families with 5 or more children have the highest poverty rate of 100.0%, comprising of 10 families. On the other hand, families with no children have the lowest poverty rate of 3.0%, which includes 4 families.
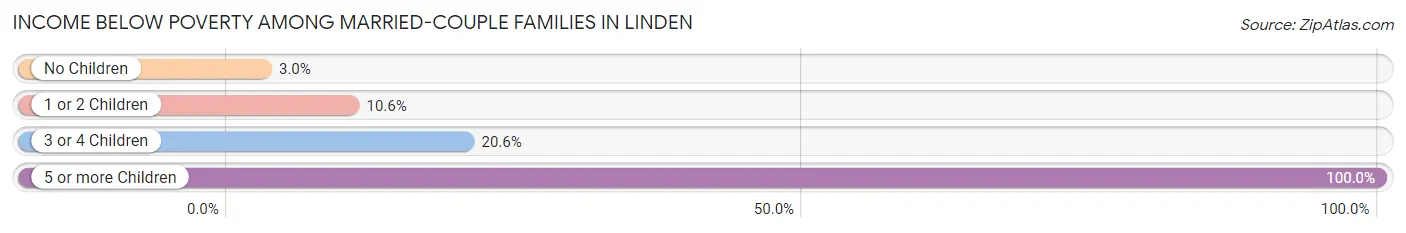
| Children | Above Poverty | Below Poverty |
| No Children | 131 (97.0%) | 4 (3.0%) |
| 1 or 2 Children | 93 (89.4%) | 11 (10.6%) |
| 3 or 4 Children | 27 (79.4%) | 7 (20.6%) |
| 5 or more Children | 0 (0.0%) | 10 (100.0%) |
| Total | 251 (88.7%) | 32 (11.3%) |
Income Below Poverty Among Single-Parent Households in Linden
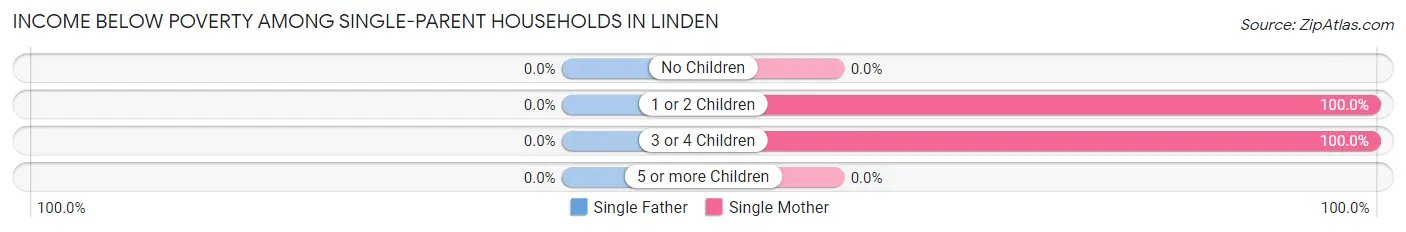
| Children | Single Father | Single Mother |
| No Children | 0 (0.0%) | 0 (0.0%) |
| 1 or 2 Children | 0 (0.0%) | 22 (100.0%) |
| 3 or 4 Children | 0 (0.0%) | 34 (100.0%) |
| 5 or more Children | 0 (0.0%) | 0 (0.0%) |
| Total | 0 (0.0%) | 56 (45.2%) |
Income Below Poverty Among Married-Couple vs Single-Parent Households in Linden
The poverty data for Linden shows that 32 of the married-couple family households (11.3%) and 56 of the single-parent households (37.6%) are living below the poverty level. Within the married-couple family households, those with 5 or more children have the highest poverty rate, with 10 households (100.0%) falling below the poverty line. Among the single-parent households, those with 3 or 4 children have the highest poverty rate, with 34 household (100.0%) living below poverty.
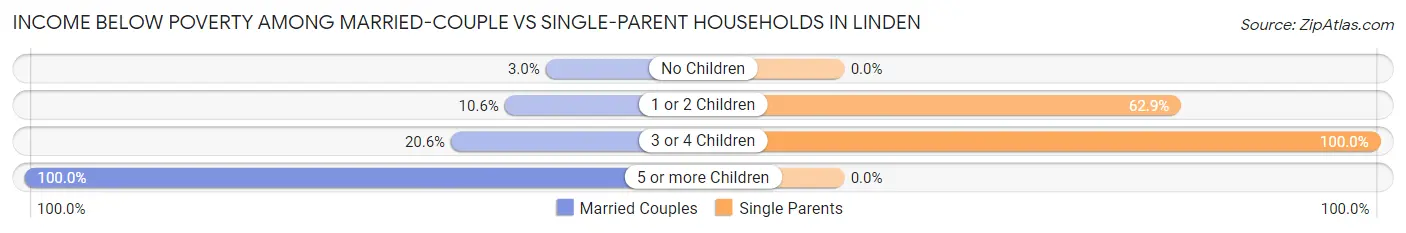
| Children | Married-Couple Families | Single-Parent Households |
| No Children | 4 (3.0%) | 0 (0.0%) |
| 1 or 2 Children | 11 (10.6%) | 22 (62.9%) |
| 3 or 4 Children | 7 (20.6%) | 34 (100.0%) |
| 5 or more Children | 10 (100.0%) | 0 (0.0%) |
| Total | 32 (11.3%) | 56 (37.6%) |
Employment Characteristics in Linden
Employment by Class of Employer in Linden
Among the 574 employed individuals in Linden, private company employees (378 | 65.8%), local government employees (65 | 11.3%), and not-for-profit organizations (46 | 8.0%) make up the most common classes of employment.
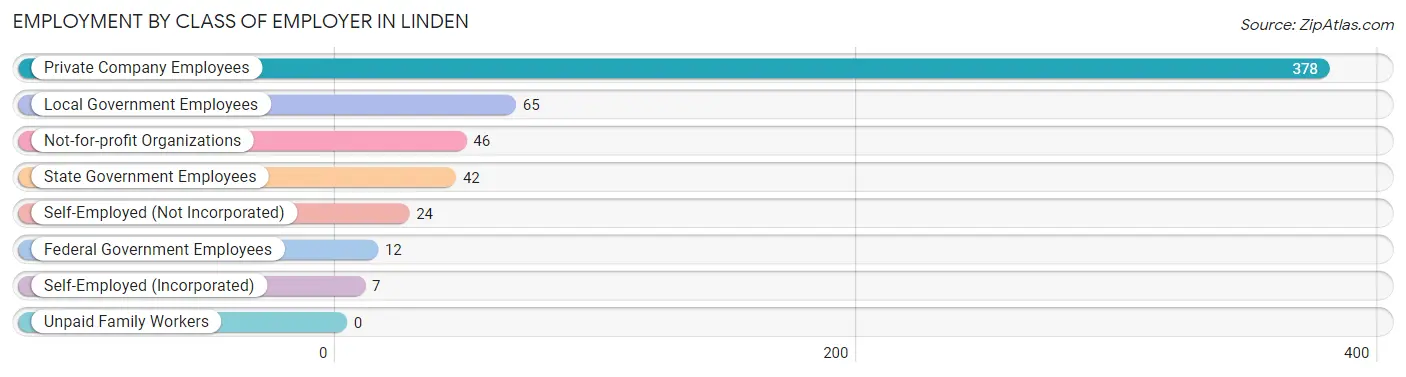
| Employer Class | # Employees | % Employees |
| Private Company Employees | 378 | 65.8% |
| Self-Employed (Incorporated) | 7 | 1.2% |
| Self-Employed (Not Incorporated) | 24 | 4.2% |
| Not-for-profit Organizations | 46 | 8.0% |
| Local Government Employees | 65 | 11.3% |
| State Government Employees | 42 | 7.3% |
| Federal Government Employees | 12 | 2.1% |
| Unpaid Family Workers | 0 | 0.0% |
| Total | 574 | 100.0% |
Employment Status by Age in Linden
According to the labor force statistics for Linden, out of the total population over 16 years of age (1,386), 45.9% or 636 individuals are in the labor force, with 9.3% or 59 of them unemployed. The age group with the highest labor force participation rate is 45 to 54 years, with 90.4% or 189 individuals in the labor force. Within the labor force, the 35 to 44 years age range has the highest percentage of unemployed individuals, with 19.3% or 23 of them being unemployed.
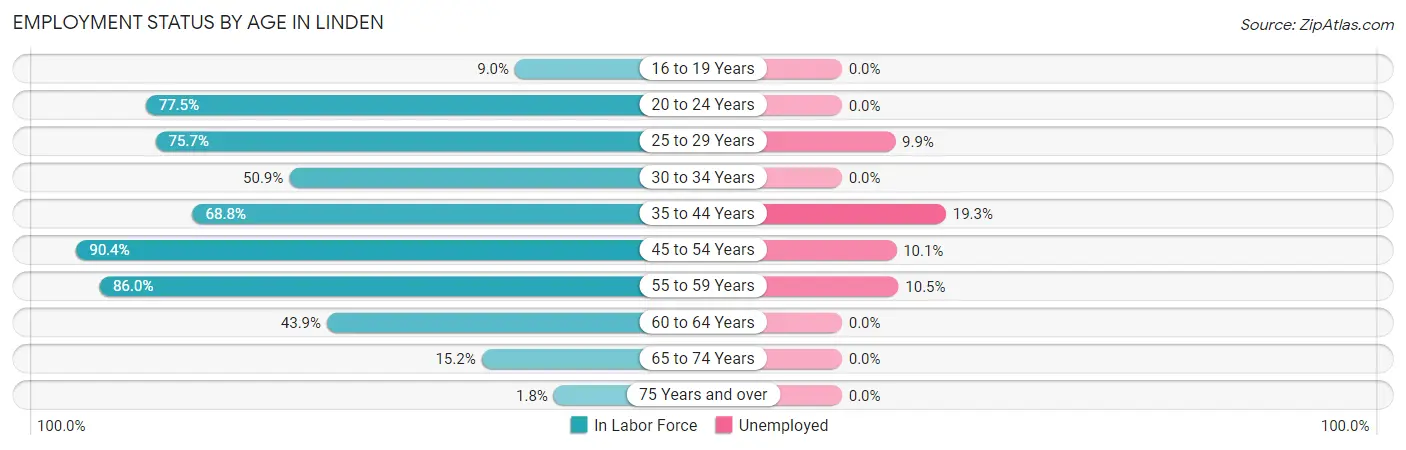
| Age Bracket | In Labor Force | Unemployed |
| 16 to 19 Years | 9 (9.0%) | 0 (0.0%) |
| 20 to 24 Years | 55 (77.5%) | 0 (0.0%) |
| 25 to 29 Years | 81 (75.7%) | 8 (9.9%) |
| 30 to 34 Years | 29 (50.9%) | 0 (0.0%) |
| 35 to 44 Years | 119 (68.8%) | 23 (19.3%) |
| 45 to 54 Years | 189 (90.4%) | 19 (10.1%) |
| 55 to 59 Years | 86 (86.0%) | 9 (10.5%) |
| 60 to 64 Years | 29 (43.9%) | 0 (0.0%) |
| 65 to 74 Years | 34 (15.2%) | 0 (0.0%) |
| 75 Years and over | 5 (1.8%) | 0 (0.0%) |
| Total | 636 (45.9%) | 59 (9.3%) |
Employment Status by Educational Attainment in Linden
According to labor force statistics for Linden, 74.9% of individuals (533) out of the total population between 25 and 64 years of age (712) are in the labor force, with 11.1% or 59 of them being unemployed. The group with the highest labor force participation rate are those with the educational attainment of bachelor's degree or higher, with 91.7% or 99 individuals in the labor force. Within the labor force, individuals with bachelor's degree or higher education have the highest percentage of unemployment, with 28.3% or 28 of them being unemployed.
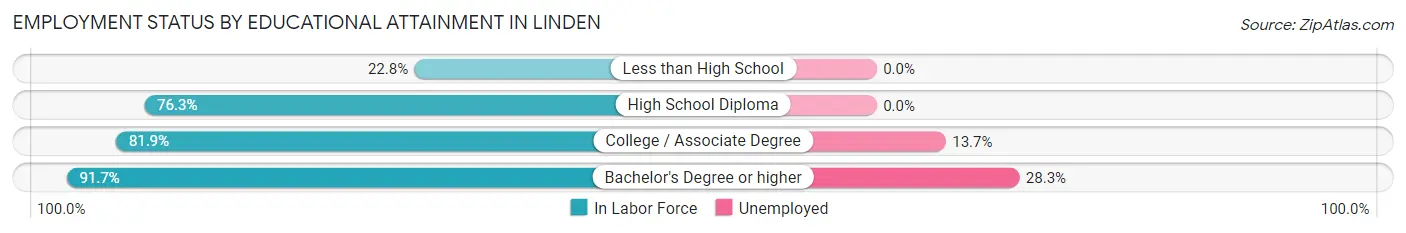
| Educational Attainment | In Labor Force | Unemployed |
| Less than High School | 18 (22.8%) | 0 (0.0%) |
| High School Diploma | 190 (76.3%) | 0 (0.0%) |
| College / Associate Degree | 226 (81.9%) | 38 (13.7%) |
| Bachelor's Degree or higher | 99 (91.7%) | 31 (28.3%) |
| Total | 533 (74.9%) | 79 (11.1%) |
Employment Occupations by Sex in Linden
Management, Business, Science and Arts Occupations
The most common Management, Business, Science and Arts occupations in Linden are Community & Social Service (56 | 9.7%), Management (43 | 7.4%), Arts, Media & Entertainment (18 | 3.1%), Education, Arts & Media (14 | 2.4%), and Legal Services & Support (14 | 2.4%).
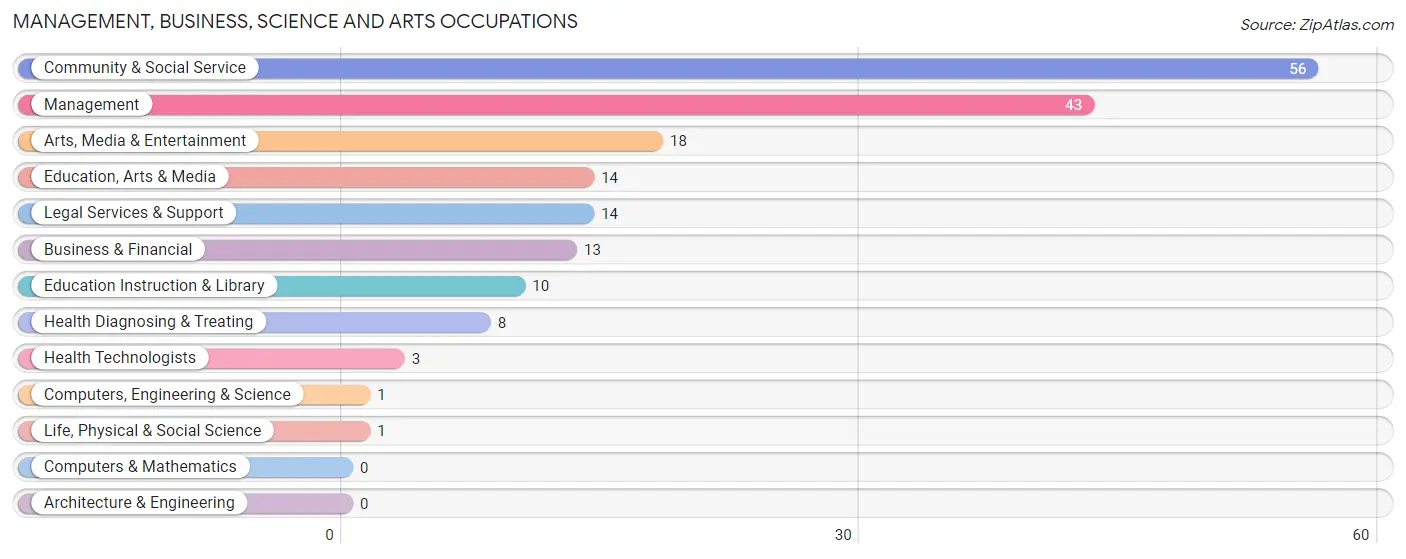
Management, Business, Science and Arts Occupations by Sex
Within the Management, Business, Science and Arts occupations in Linden, the most male-oriented occupations are Education, Arts & Media (85.7%), Management (79.1%), and Business & Financial (76.9%), while the most female-oriented occupations are Computers, Engineering & Science (100.0%), Life, Physical & Social Science (100.0%), and Legal Services & Support (100.0%).
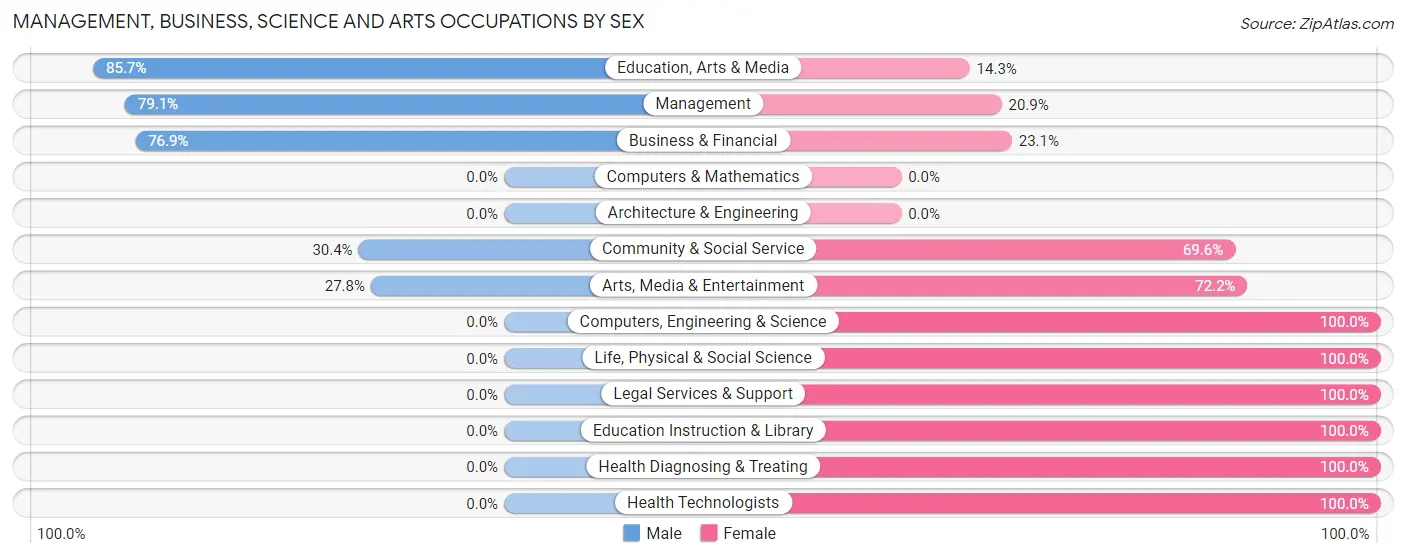
| Occupation | Male | Female |
| Management | 34 (79.1%) | 9 (20.9%) |
| Business & Financial | 10 (76.9%) | 3 (23.1%) |
| Computers, Engineering & Science | 0 (0.0%) | 1 (100.0%) |
| Computers & Mathematics | 0 (0.0%) | 0 (0.0%) |
| Architecture & Engineering | 0 (0.0%) | 0 (0.0%) |
| Life, Physical & Social Science | 0 (0.0%) | 1 (100.0%) |
| Community & Social Service | 17 (30.4%) | 39 (69.6%) |
| Education, Arts & Media | 12 (85.7%) | 2 (14.3%) |
| Legal Services & Support | 0 (0.0%) | 14 (100.0%) |
| Education Instruction & Library | 0 (0.0%) | 10 (100.0%) |
| Arts, Media & Entertainment | 5 (27.8%) | 13 (72.2%) |
| Health Diagnosing & Treating | 0 (0.0%) | 8 (100.0%) |
| Health Technologists | 0 (0.0%) | 3 (100.0%) |
| Total (Category) | 61 (50.4%) | 60 (49.6%) |
| Total (Overall) | 300 (52.0%) | 277 (48.0%) |
Services Occupations
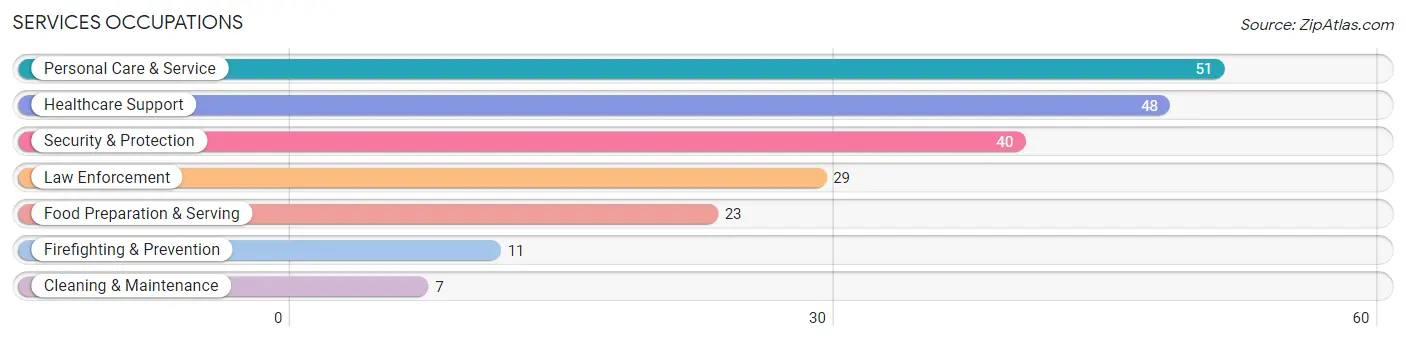
The most common Services occupations in Linden are Personal Care & Service (51 | 8.8%), Healthcare Support (48 | 8.3%), Security & Protection (40 | 6.9%), Law Enforcement (29 | 5.0%), and Food Preparation & Serving (23 | 4.0%).
Services Occupations by Sex
Within the Services occupations in Linden, the most male-oriented occupations are Security & Protection (100.0%), Firefighting & Prevention (100.0%), and Law Enforcement (100.0%), while the most female-oriented occupations are Healthcare Support (100.0%), Food Preparation & Serving (100.0%), and Personal Care & Service (88.2%).
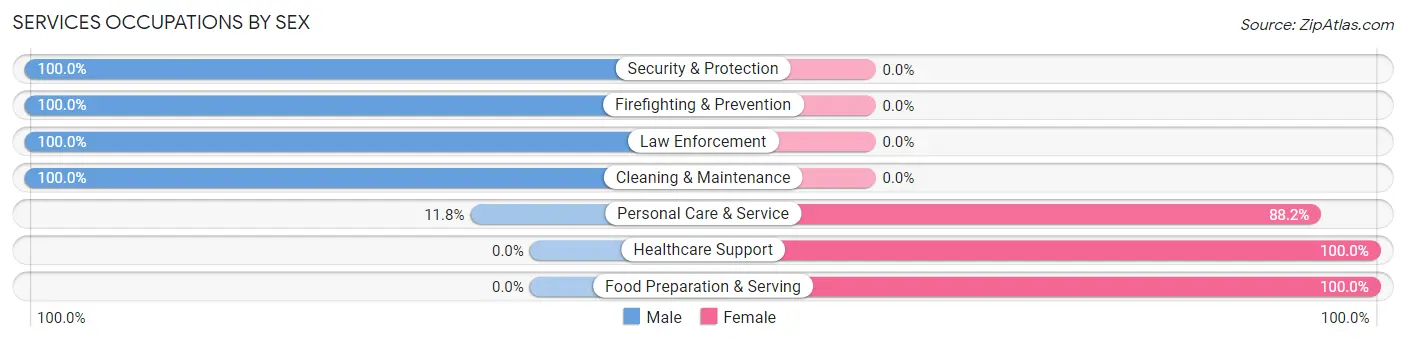
| Occupation | Male | Female |
| Healthcare Support | 0 (0.0%) | 48 (100.0%) |
| Security & Protection | 40 (100.0%) | 0 (0.0%) |
| Firefighting & Prevention | 11 (100.0%) | 0 (0.0%) |
| Law Enforcement | 29 (100.0%) | 0 (0.0%) |
| Food Preparation & Serving | 0 (0.0%) | 23 (100.0%) |
| Cleaning & Maintenance | 7 (100.0%) | 0 (0.0%) |
| Personal Care & Service | 6 (11.8%) | 45 (88.2%) |
| Total (Category) | 53 (31.4%) | 116 (68.6%) |
| Total (Overall) | 300 (52.0%) | 277 (48.0%) |
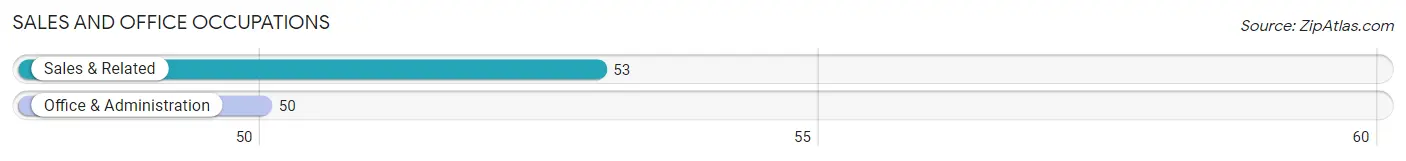
Sales and Office Occupations
The most common Sales and Office occupations in Linden are Sales & Related (53 | 9.2%), and Office & Administration (50 | 8.7%).
Sales and Office Occupations by Sex
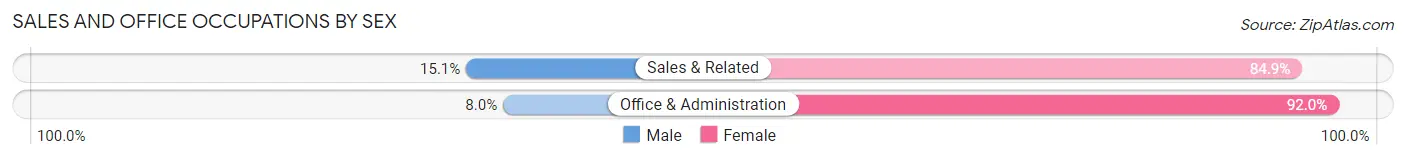
| Occupation | Male | Female |
| Sales & Related | 8 (15.1%) | 45 (84.9%) |
| Office & Administration | 4 (8.0%) | 46 (92.0%) |
| Total (Category) | 12 (11.7%) | 91 (88.3%) |
| Total (Overall) | 300 (52.0%) | 277 (48.0%) |
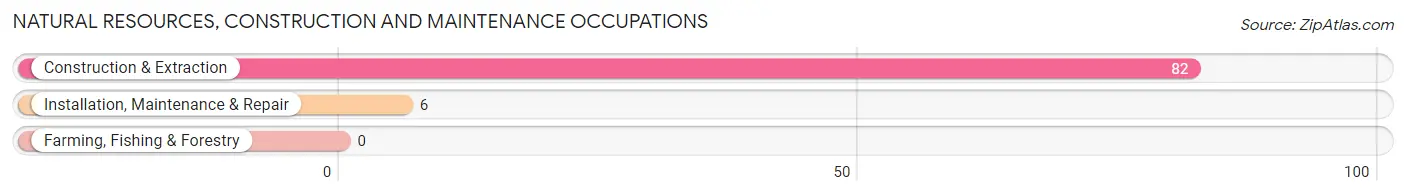
Natural Resources, Construction and Maintenance Occupations
The most common Natural Resources, Construction and Maintenance occupations in Linden are Construction & Extraction (82 | 14.2%), and Installation, Maintenance & Repair (6 | 1.0%).
Natural Resources, Construction and Maintenance Occupations by Sex
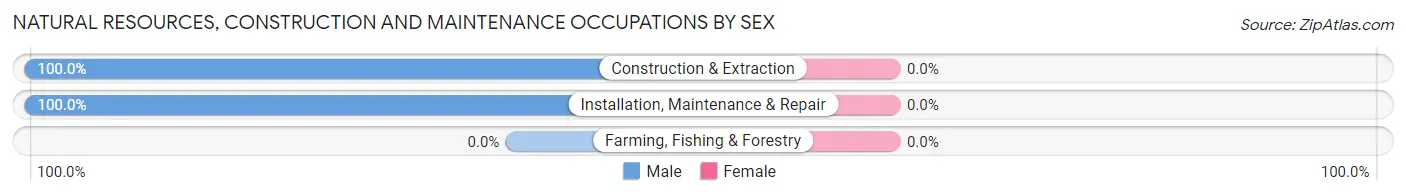
| Occupation | Male | Female |
| Farming, Fishing & Forestry | 0 (0.0%) | 0 (0.0%) |
| Construction & Extraction | 82 (100.0%) | 0 (0.0%) |
| Installation, Maintenance & Repair | 6 (100.0%) | 0 (0.0%) |
| Total (Category) | 88 (100.0%) | 0 (0.0%) |
| Total (Overall) | 300 (52.0%) | 277 (48.0%) |
Production, Transportation and Moving Occupations
The most common Production, Transportation and Moving occupations in Linden are Production (55 | 9.5%), Transportation (35 | 6.1%), and Material Moving (6 | 1.0%).
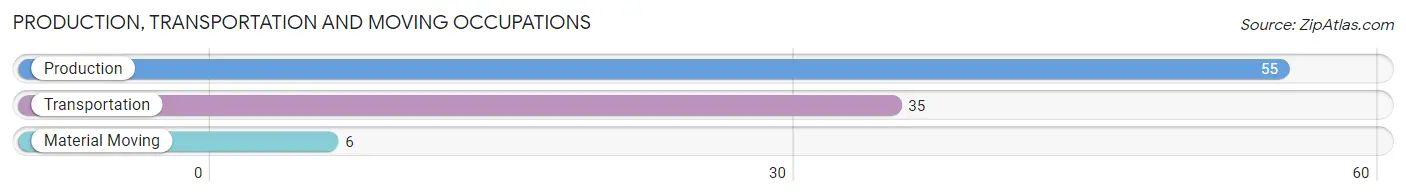
Production, Transportation and Moving Occupations by Sex
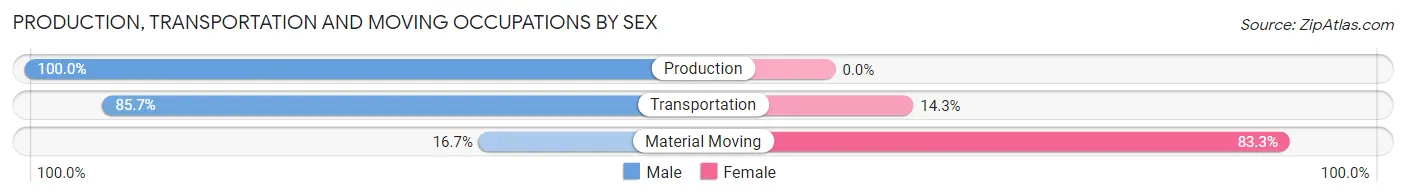
| Occupation | Male | Female |
| Production | 55 (100.0%) | 0 (0.0%) |
| Transportation | 30 (85.7%) | 5 (14.3%) |
| Material Moving | 1 (16.7%) | 5 (83.3%) |
| Total (Category) | 86 (89.6%) | 10 (10.4%) |
| Total (Overall) | 300 (52.0%) | 277 (48.0%) |
Employment Industries by Sex in Linden
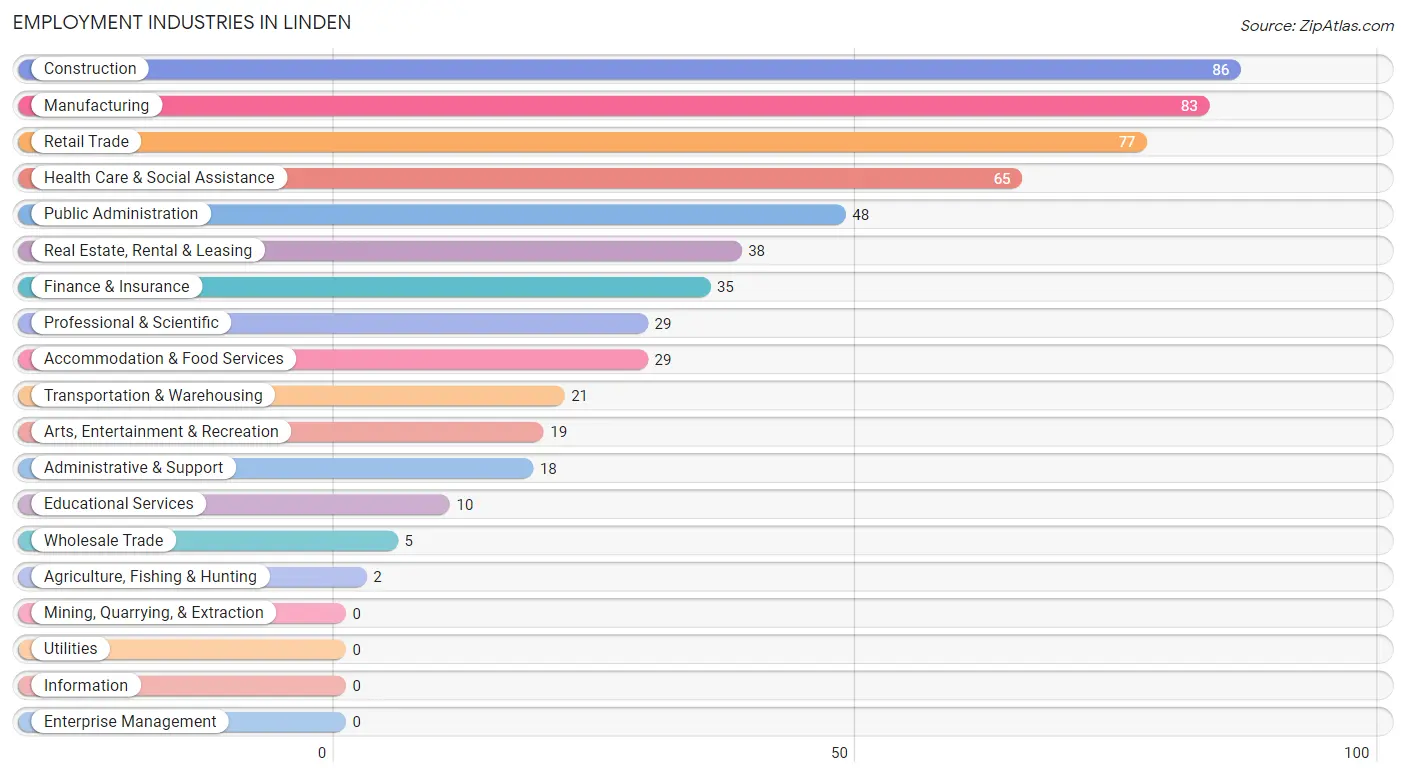
Employment Industries in Linden
The major employment industries in Linden include Construction (86 | 14.9%), Manufacturing (83 | 14.4%), Retail Trade (77 | 13.3%), Health Care & Social Assistance (65 | 11.3%), and Public Administration (48 | 8.3%).
Employment Industries by Sex in Linden
The Linden industries that see more men than women are Construction (100.0%), Manufacturing (100.0%), and Administrative & Support (100.0%), whereas the industries that tend to have a higher number of women are Agriculture, Fishing & Hunting (100.0%), Wholesale Trade (100.0%), and Educational Services (100.0%).
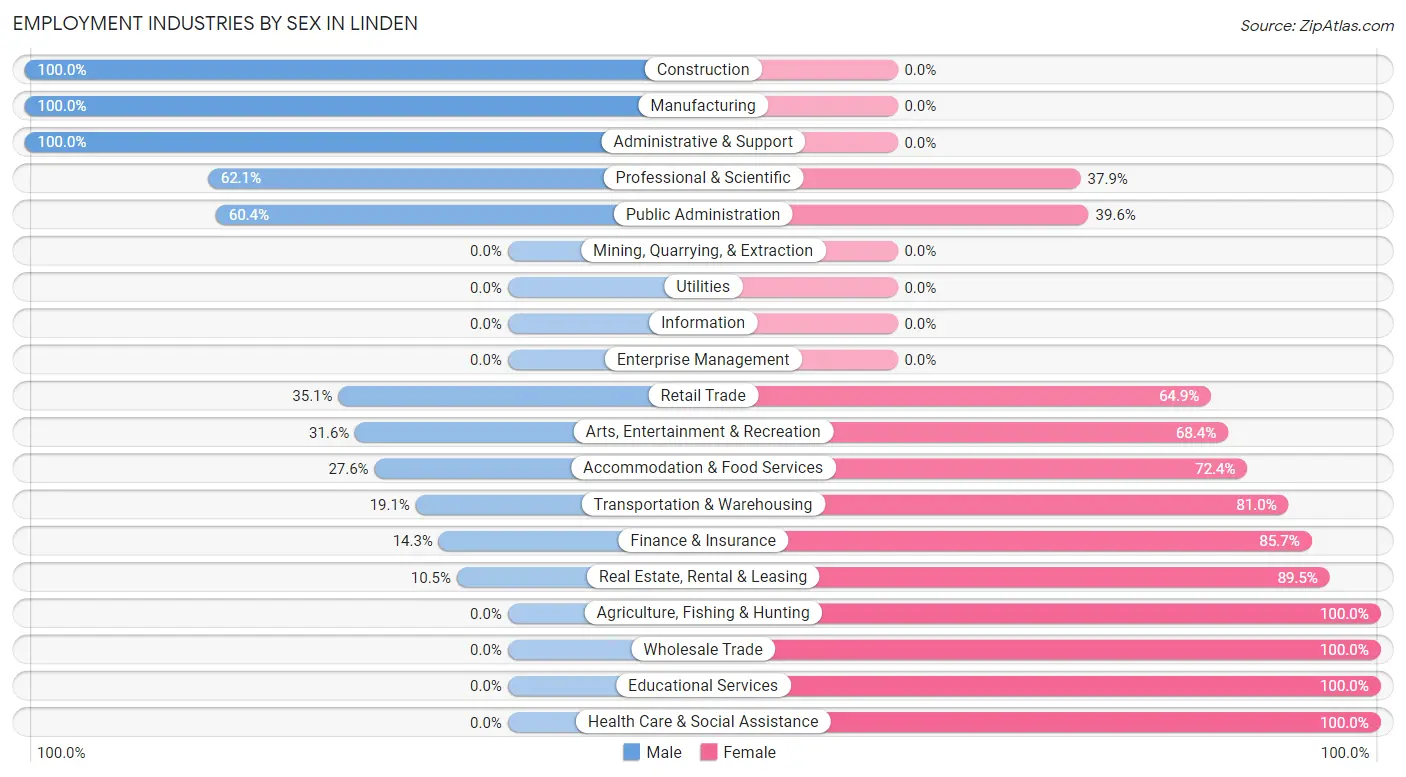
| Industry | Male | Female |
| Agriculture, Fishing & Hunting | 0 (0.0%) | 2 (100.0%) |
| Mining, Quarrying, & Extraction | 0 (0.0%) | 0 (0.0%) |
| Construction | 86 (100.0%) | 0 (0.0%) |
| Manufacturing | 83 (100.0%) | 0 (0.0%) |
| Wholesale Trade | 0 (0.0%) | 5 (100.0%) |
| Retail Trade | 27 (35.1%) | 50 (64.9%) |
| Transportation & Warehousing | 4 (19.1%) | 17 (80.9%) |
| Utilities | 0 (0.0%) | 0 (0.0%) |
| Information | 0 (0.0%) | 0 (0.0%) |
| Finance & Insurance | 5 (14.3%) | 30 (85.7%) |
| Real Estate, Rental & Leasing | 4 (10.5%) | 34 (89.5%) |
| Professional & Scientific | 18 (62.1%) | 11 (37.9%) |
| Enterprise Management | 0 (0.0%) | 0 (0.0%) |
| Administrative & Support | 18 (100.0%) | 0 (0.0%) |
| Educational Services | 0 (0.0%) | 10 (100.0%) |
| Health Care & Social Assistance | 0 (0.0%) | 65 (100.0%) |
| Arts, Entertainment & Recreation | 6 (31.6%) | 13 (68.4%) |
| Accommodation & Food Services | 8 (27.6%) | 21 (72.4%) |
| Public Administration | 29 (60.4%) | 19 (39.6%) |
| Total | 300 (52.0%) | 277 (48.0%) |
Education in Linden
School Enrollment in Linden
The most common levels of schooling among the 379 students in Linden are high school (130 | 34.3%), middle school (89 | 23.5%), and elementary school (86 | 22.7%).
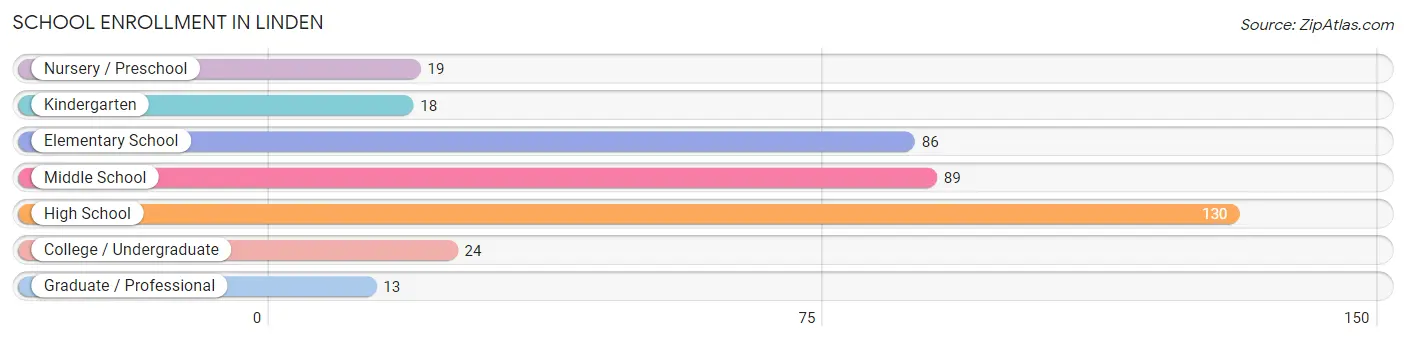
| School Level | # Students | % Students |
| Nursery / Preschool | 19 | 5.0% |
| Kindergarten | 18 | 4.8% |
| Elementary School | 86 | 22.7% |
| Middle School | 89 | 23.5% |
| High School | 130 | 34.3% |
| College / Undergraduate | 24 | 6.3% |
| Graduate / Professional | 13 | 3.4% |
| Total | 379 | 100.0% |
School Enrollment by Age by Funding Source in Linden
Out of a total of 379 students who are enrolled in schools in Linden, 33 (8.7%) attend a private institution, while the remaining 346 (91.3%) are enrolled in public schools. The age group of 25 to 34 year olds has the highest likelihood of being enrolled in private schools, with 4 (100.0% in the age bracket) enrolled. Conversely, the age group of 3 to 4 year olds has the lowest likelihood of being enrolled in a private school, with 26 (100.0% in the age bracket) attending a public institution.
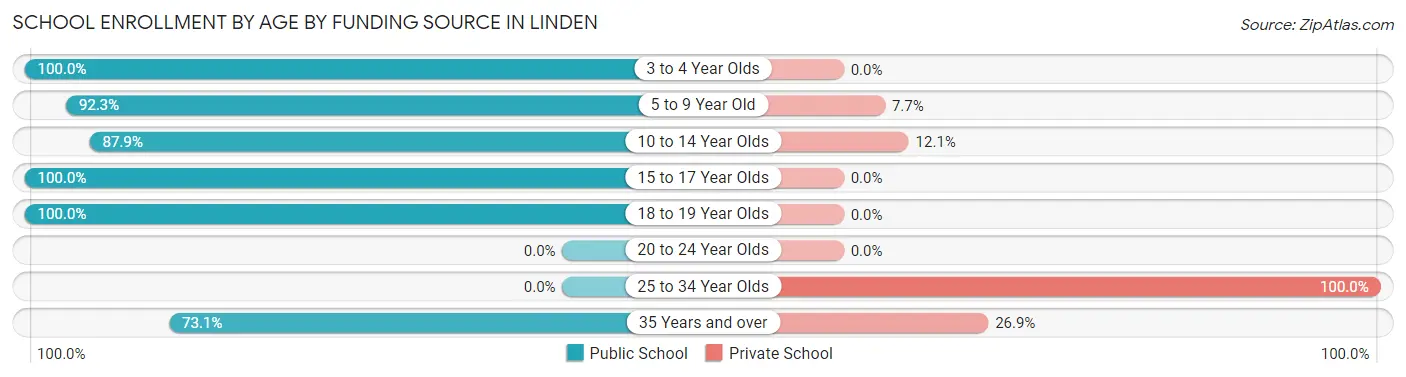
| Age Bracket | Public School | Private School |
| 3 to 4 Year Olds | 26 (100.0%) | 0 (0.0%) |
| 5 to 9 Year Old | 84 (92.3%) | 7 (7.7%) |
| 10 to 14 Year Olds | 109 (87.9%) | 15 (12.1%) |
| 15 to 17 Year Olds | 70 (100.0%) | 0 (0.0%) |
| 18 to 19 Year Olds | 38 (100.0%) | 0 (0.0%) |
| 20 to 24 Year Olds | 0 (0.0%) | 0 (0.0%) |
| 25 to 34 Year Olds | 0 (0.0%) | 4 (100.0%) |
| 35 Years and over | 19 (73.1%) | 7 (26.9%) |
| Total | 346 (91.3%) | 33 (8.7%) |
Educational Attainment by Field of Study in Linden
Education (65 | 29.5%), science & technology (32 | 14.5%), social sciences (28 | 12.7%), business (27 | 12.3%), and bio, nature & agricultural (19 | 8.6%) are the most common fields of study among 220 individuals in Linden who have obtained a bachelor's degree or higher.
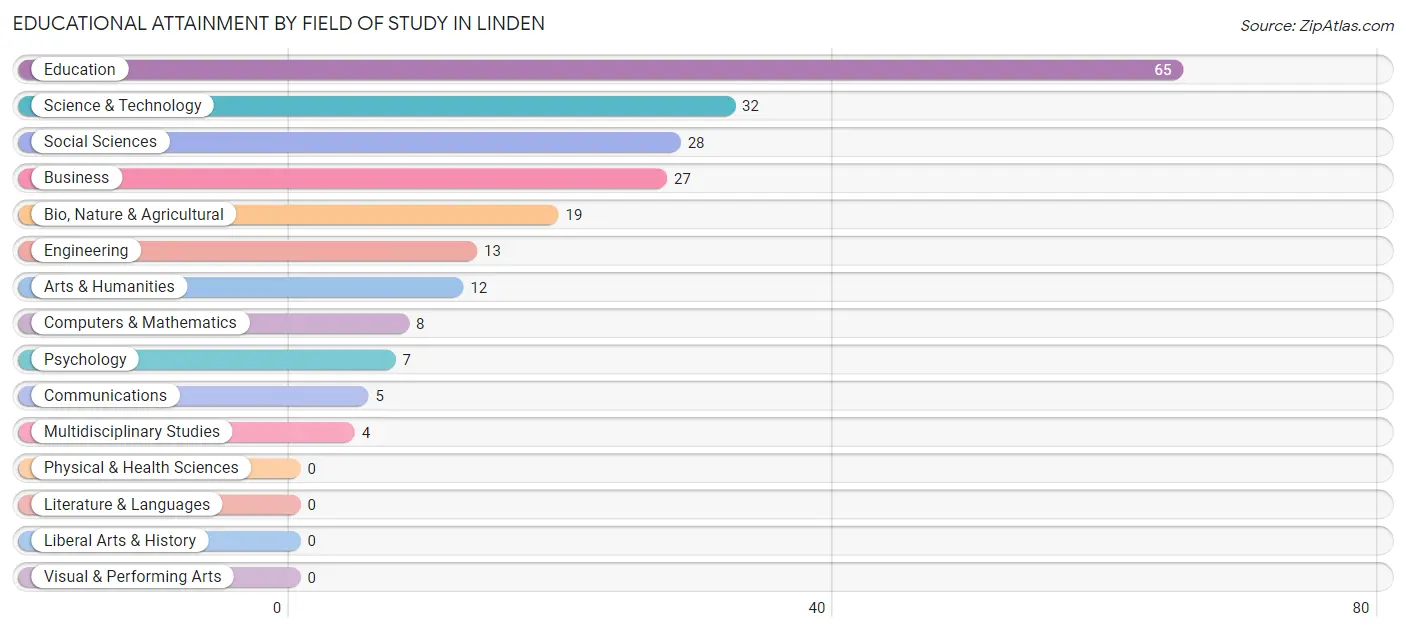
| Field of Study | # Graduates | % Graduates |
| Computers & Mathematics | 8 | 3.6% |
| Bio, Nature & Agricultural | 19 | 8.6% |
| Physical & Health Sciences | 0 | 0.0% |
| Psychology | 7 | 3.2% |
| Social Sciences | 28 | 12.7% |
| Engineering | 13 | 5.9% |
| Multidisciplinary Studies | 4 | 1.8% |
| Science & Technology | 32 | 14.5% |
| Business | 27 | 12.3% |
| Education | 65 | 29.5% |
| Literature & Languages | 0 | 0.0% |
| Liberal Arts & History | 0 | 0.0% |
| Visual & Performing Arts | 0 | 0.0% |
| Communications | 5 | 2.3% |
| Arts & Humanities | 12 | 5.4% |
| Total | 220 | 100.0% |
Transportation & Commute in Linden
Vehicle Availability by Sex in Linden
The most prevalent vehicle ownership categories in Linden are males with 1 vehicle (82, accounting for 27.6%) and females with 1 vehicle (104, making up 29.6%).
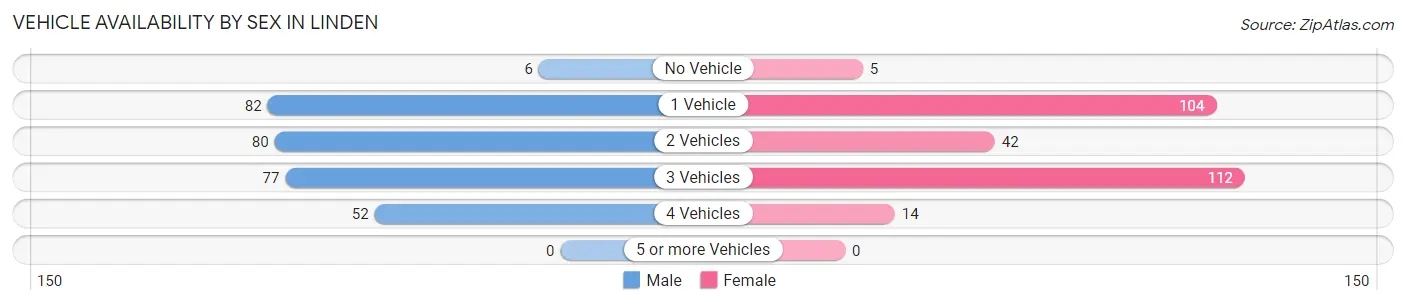
| Vehicles Available | Male | Female |
| No Vehicle | 6 (2.0%) | 5 (1.8%) |
| 1 Vehicle | 82 (27.6%) | 104 (37.6%) |
| 2 Vehicles | 80 (26.9%) | 42 (15.2%) |
| 3 Vehicles | 77 (25.9%) | 112 (40.4%) |
| 4 Vehicles | 52 (17.5%) | 14 (5.1%) |
| 5 or more Vehicles | 0 (0.0%) | 0 (0.0%) |
| Total | 297 (100.0%) | 277 (100.0%) |
Commute Time in Linden
The most frequently occuring commute durations in Linden are 20 to 24 minutes (134 commuters, 24.3%), 45 to 59 minutes (114 commuters, 20.6%), and 5 to 9 minutes (109 commuters, 19.8%).
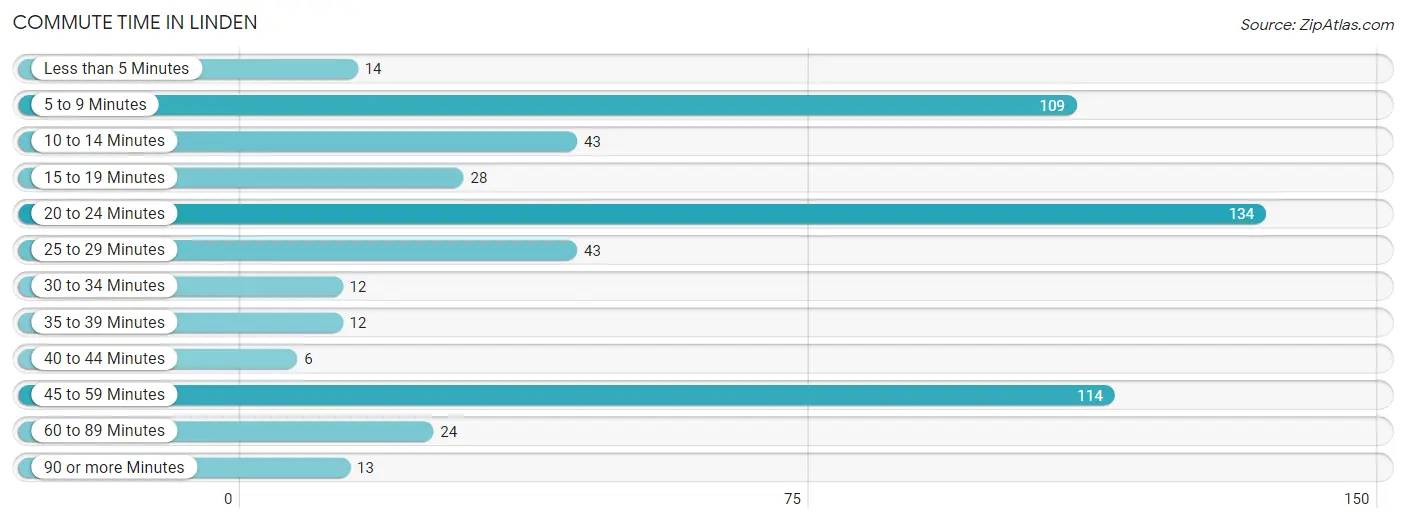
| Commute Time | # Commuters | % Commuters |
| Less than 5 Minutes | 14 | 2.5% |
| 5 to 9 Minutes | 109 | 19.8% |
| 10 to 14 Minutes | 43 | 7.8% |
| 15 to 19 Minutes | 28 | 5.1% |
| 20 to 24 Minutes | 134 | 24.3% |
| 25 to 29 Minutes | 43 | 7.8% |
| 30 to 34 Minutes | 12 | 2.2% |
| 35 to 39 Minutes | 12 | 2.2% |
| 40 to 44 Minutes | 6 | 1.1% |
| 45 to 59 Minutes | 114 | 20.6% |
| 60 to 89 Minutes | 24 | 4.3% |
| 90 or more Minutes | 13 | 2.4% |
Commute Time by Sex in Linden
The most common commute times in Linden are 20 to 24 minutes (83 commuters, 28.8%) for males and 5 to 9 minutes (70 commuters, 26.5%) for females.
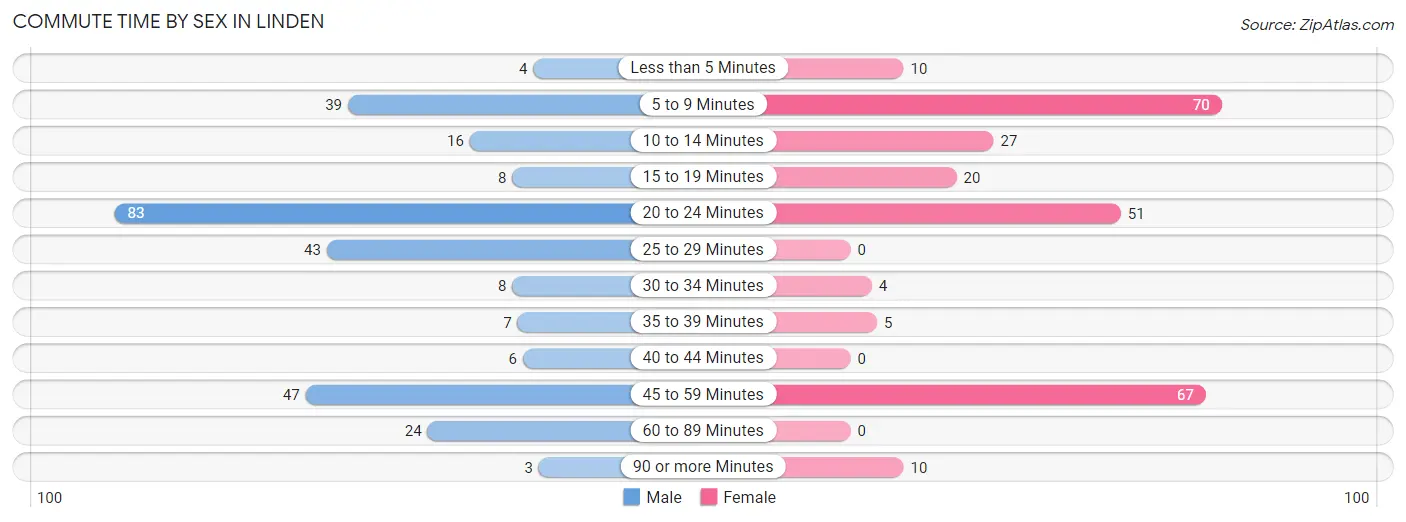
| Commute Time | Male | Female |
| Less than 5 Minutes | 4 (1.4%) | 10 (3.8%) |
| 5 to 9 Minutes | 39 (13.5%) | 70 (26.5%) |
| 10 to 14 Minutes | 16 (5.6%) | 27 (10.2%) |
| 15 to 19 Minutes | 8 (2.8%) | 20 (7.6%) |
| 20 to 24 Minutes | 83 (28.8%) | 51 (19.3%) |
| 25 to 29 Minutes | 43 (14.9%) | 0 (0.0%) |
| 30 to 34 Minutes | 8 (2.8%) | 4 (1.5%) |
| 35 to 39 Minutes | 7 (2.4%) | 5 (1.9%) |
| 40 to 44 Minutes | 6 (2.1%) | 0 (0.0%) |
| 45 to 59 Minutes | 47 (16.3%) | 67 (25.4%) |
| 60 to 89 Minutes | 24 (8.3%) | 0 (0.0%) |
| 90 or more Minutes | 3 (1.0%) | 10 (3.8%) |
Time of Departure to Work by Sex in Linden
The most frequent times of departure to work in Linden are 6:00 AM to 6:29 AM (72, 25.0%) for males and 7:30 AM to 7:59 AM (71, 26.9%) for females.
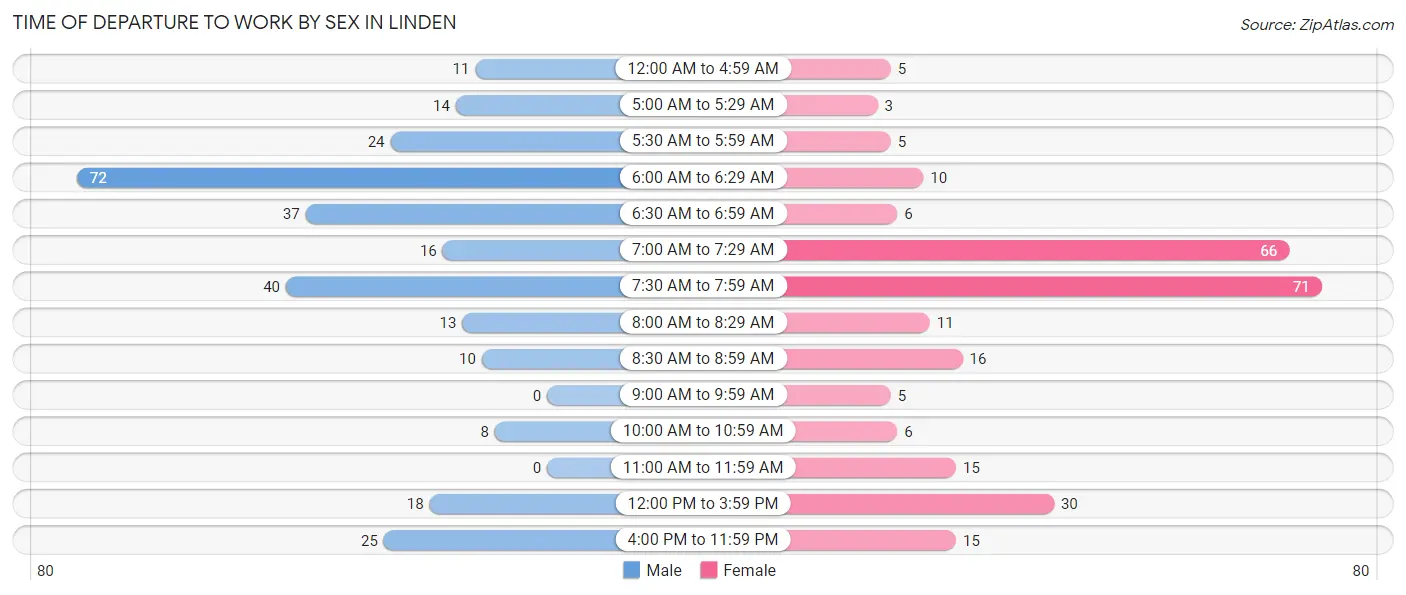
| Time of Departure | Male | Female |
| 12:00 AM to 4:59 AM | 11 (3.8%) | 5 (1.9%) |
| 5:00 AM to 5:29 AM | 14 (4.9%) | 3 (1.1%) |
| 5:30 AM to 5:59 AM | 24 (8.3%) | 5 (1.9%) |
| 6:00 AM to 6:29 AM | 72 (25.0%) | 10 (3.8%) |
| 6:30 AM to 6:59 AM | 37 (12.9%) | 6 (2.3%) |
| 7:00 AM to 7:29 AM | 16 (5.6%) | 66 (25.0%) |
| 7:30 AM to 7:59 AM | 40 (13.9%) | 71 (26.9%) |
| 8:00 AM to 8:29 AM | 13 (4.5%) | 11 (4.2%) |
| 8:30 AM to 8:59 AM | 10 (3.5%) | 16 (6.1%) |
| 9:00 AM to 9:59 AM | 0 (0.0%) | 5 (1.9%) |
| 10:00 AM to 10:59 AM | 8 (2.8%) | 6 (2.3%) |
| 11:00 AM to 11:59 AM | 0 (0.0%) | 15 (5.7%) |
| 12:00 PM to 3:59 PM | 18 (6.2%) | 30 (11.4%) |
| 4:00 PM to 11:59 PM | 25 (8.7%) | 15 (5.7%) |
| Total | 288 (100.0%) | 264 (100.0%) |
Housing Occupancy in Linden
Occupancy by Ownership in Linden
Of the total 737 dwellings in Linden, owner-occupied units account for 449 (60.9%), while renter-occupied units make up 288 (39.1%).
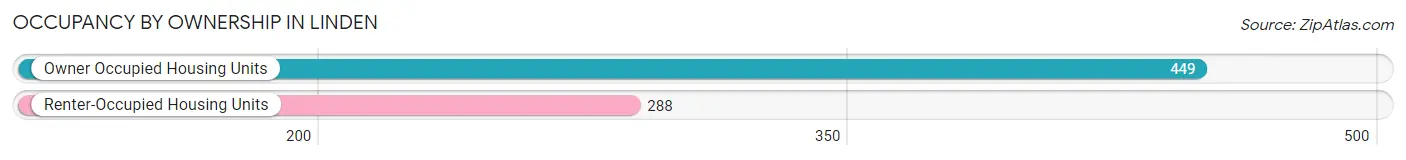
| Occupancy | # Housing Units | % Housing Units |
| Owner Occupied Housing Units | 449 | 60.9% |
| Renter-Occupied Housing Units | 288 | 39.1% |
| Total Occupied Housing Units | 737 | 100.0% |
Occupancy by Household Size in Linden
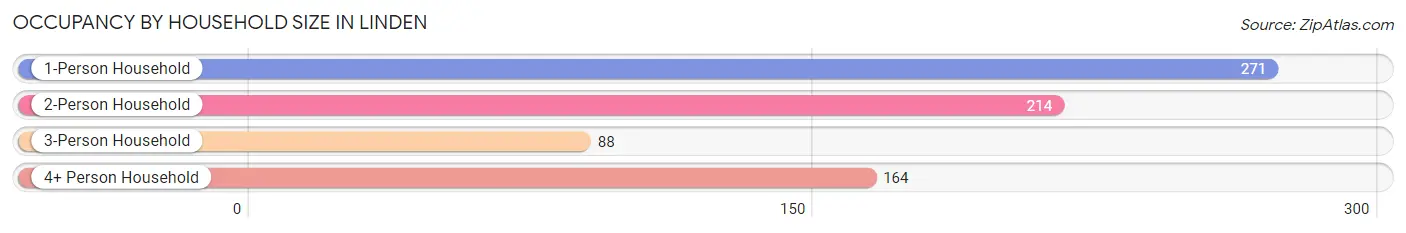
| Household Size | # Housing Units | % Housing Units |
| 1-Person Household | 271 | 36.8% |
| 2-Person Household | 214 | 29.0% |
| 3-Person Household | 88 | 11.9% |
| 4+ Person Household | 164 | 22.3% |
| Total Housing Units | 737 | 100.0% |
Occupancy by Ownership by Household Size in Linden
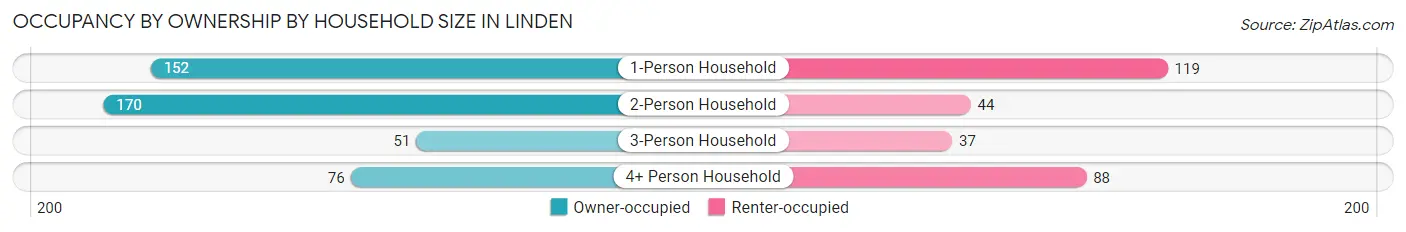
| Household Size | Owner-occupied | Renter-occupied |
| 1-Person Household | 152 (56.1%) | 119 (43.9%) |
| 2-Person Household | 170 (79.4%) | 44 (20.6%) |
| 3-Person Household | 51 (58.0%) | 37 (42.0%) |
| 4+ Person Household | 76 (46.3%) | 88 (53.7%) |
| Total Housing Units | 449 (60.9%) | 288 (39.1%) |
Occupancy by Educational Attainment in Linden
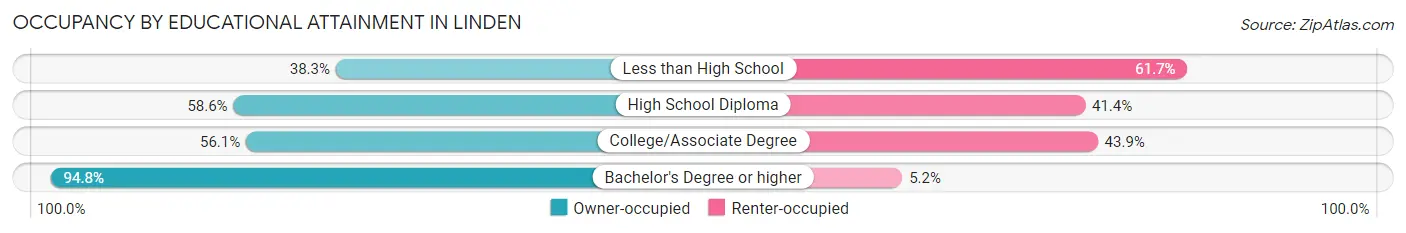
| Household Size | Owner-occupied | Renter-occupied |
| Less than High School | 36 (38.3%) | 58 (61.7%) |
| High School Diploma | 174 (58.6%) | 123 (41.4%) |
| College/Associate Degree | 129 (56.1%) | 101 (43.9%) |
| Bachelor's Degree or higher | 110 (94.8%) | 6 (5.2%) |
Occupancy by Age of Householder in Linden
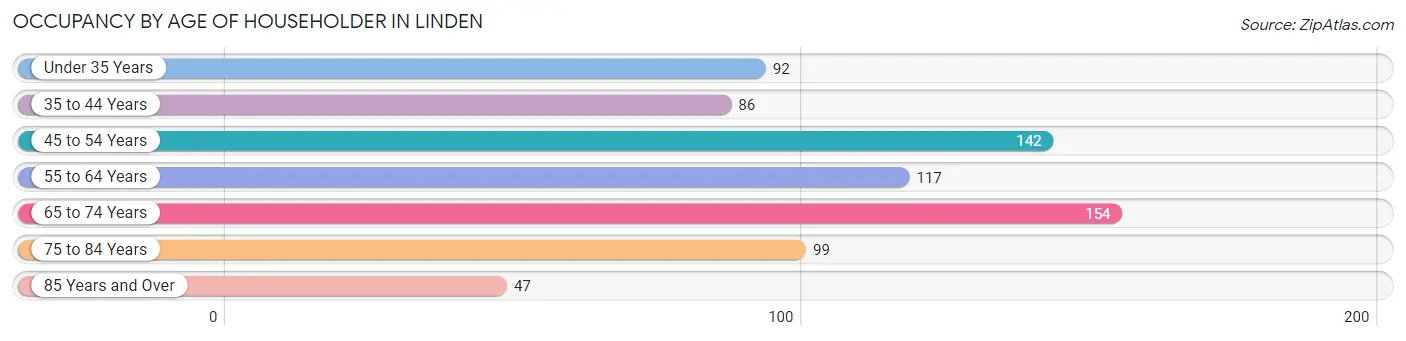
| Age Bracket | # Households | % Households |
| Under 35 Years | 92 | 12.5% |
| 35 to 44 Years | 86 | 11.7% |
| 45 to 54 Years | 142 | 19.3% |
| 55 to 64 Years | 117 | 15.9% |
| 65 to 74 Years | 154 | 20.9% |
| 75 to 84 Years | 99 | 13.4% |
| 85 Years and Over | 47 | 6.4% |
| Total | 737 | 100.0% |
Housing Finances in Linden
Median Income by Occupancy in Linden
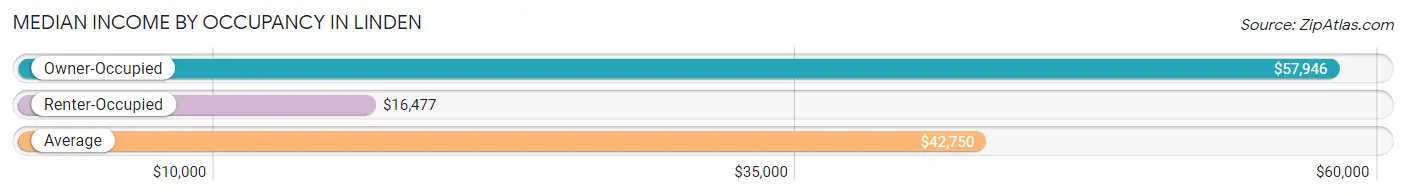
| Occupancy Type | # Households | Median Income |
| Owner-Occupied | 449 (60.9%) | $57,946 |
| Renter-Occupied | 288 (39.1%) | $16,477 |
| Average | 737 (100.0%) | $42,750 |
Occupancy by Householder Income Bracket in Linden
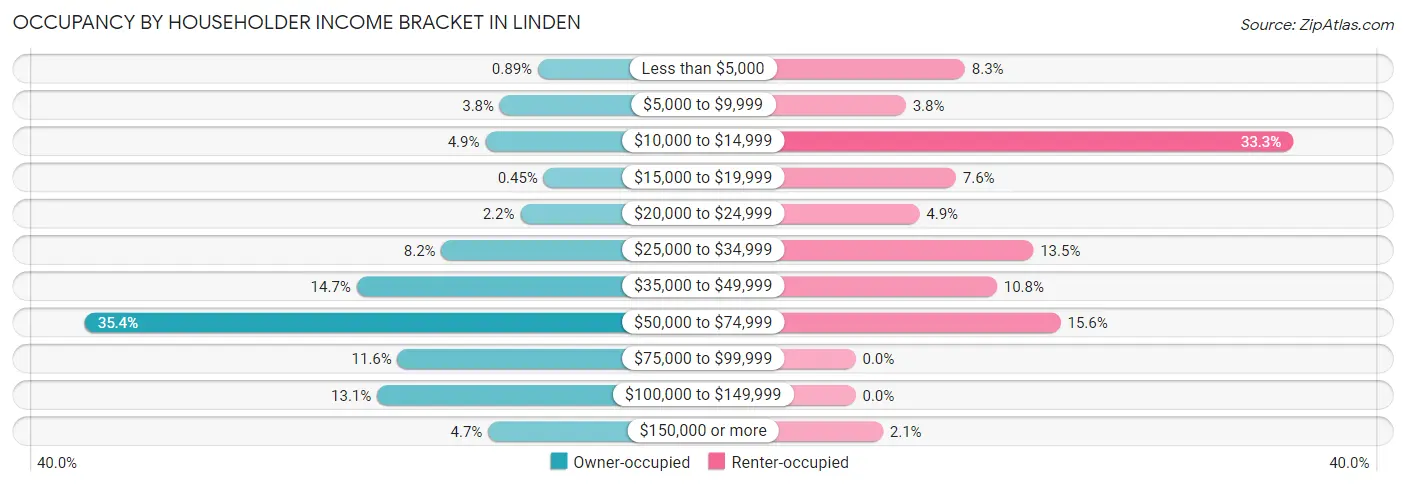
| Income Bracket | Owner-occupied | Renter-occupied |
| Less than $5,000 | 4 (0.9%) | 24 (8.3%) |
| $5,000 to $9,999 | 17 (3.8%) | 11 (3.8%) |
| $10,000 to $14,999 | 22 (4.9%) | 96 (33.3%) |
| $15,000 to $19,999 | 2 (0.4%) | 22 (7.6%) |
| $20,000 to $24,999 | 10 (2.2%) | 14 (4.9%) |
| $25,000 to $34,999 | 37 (8.2%) | 39 (13.5%) |
| $35,000 to $49,999 | 66 (14.7%) | 31 (10.8%) |
| $50,000 to $74,999 | 159 (35.4%) | 45 (15.6%) |
| $75,000 to $99,999 | 52 (11.6%) | 0 (0.0%) |
| $100,000 to $149,999 | 59 (13.1%) | 0 (0.0%) |
| $150,000 or more | 21 (4.7%) | 6 (2.1%) |
| Total | 449 (100.0%) | 288 (100.0%) |
Monthly Housing Cost Tiers in Linden
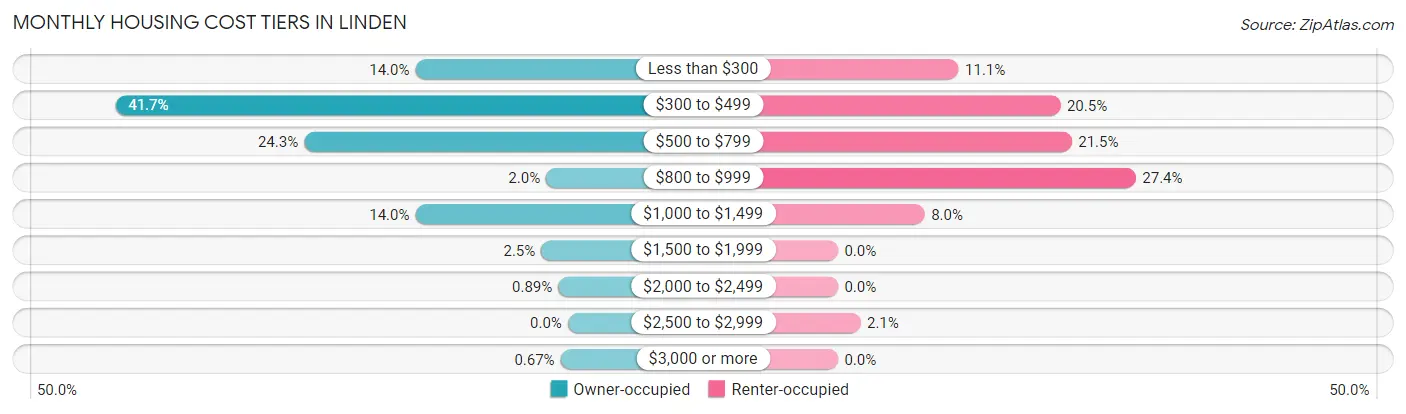
| Monthly Cost | Owner-occupied | Renter-occupied |
| Less than $300 | 63 (14.0%) | 32 (11.1%) |
| $300 to $499 | 187 (41.6%) | 59 (20.5%) |
| $500 to $799 | 109 (24.3%) | 62 (21.5%) |
| $800 to $999 | 9 (2.0%) | 79 (27.4%) |
| $1,000 to $1,499 | 63 (14.0%) | 23 (8.0%) |
| $1,500 to $1,999 | 11 (2.5%) | 0 (0.0%) |
| $2,000 to $2,499 | 4 (0.9%) | 0 (0.0%) |
| $2,500 to $2,999 | 0 (0.0%) | 6 (2.1%) |
| $3,000 or more | 3 (0.7%) | 0 (0.0%) |
| Total | 449 (100.0%) | 288 (100.0%) |
Physical Housing Characteristics in Linden
Housing Structures in Linden
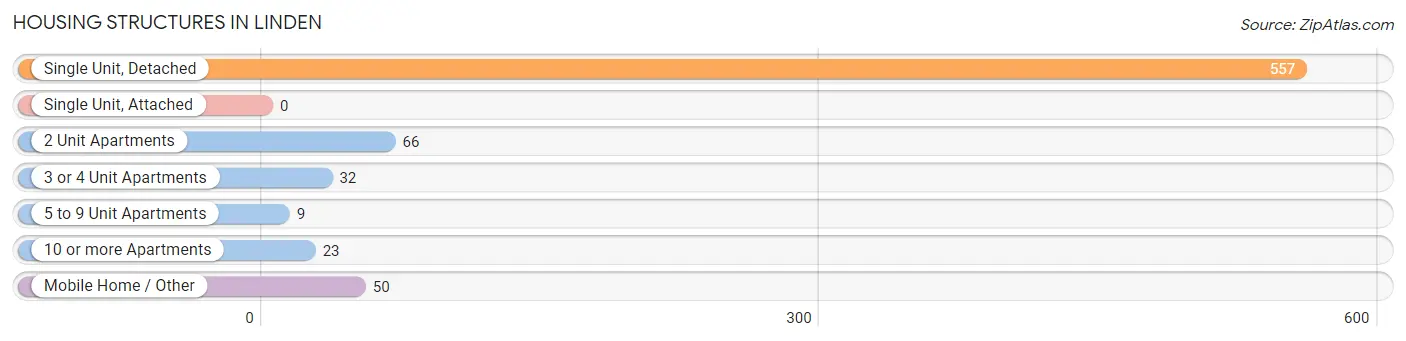
| Structure Type | # Housing Units | % Housing Units |
| Single Unit, Detached | 557 | 75.6% |
| Single Unit, Attached | 0 | 0.0% |
| 2 Unit Apartments | 66 | 9.0% |
| 3 or 4 Unit Apartments | 32 | 4.3% |
| 5 to 9 Unit Apartments | 9 | 1.2% |
| 10 or more Apartments | 23 | 3.1% |
| Mobile Home / Other | 50 | 6.8% |
| Total | 737 | 100.0% |
Housing Structures by Occupancy in Linden
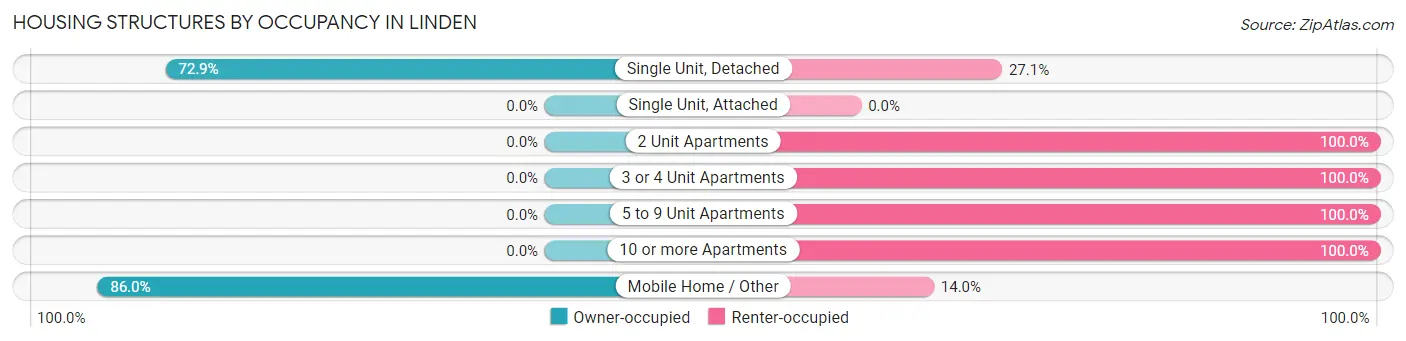
| Structure Type | Owner-occupied | Renter-occupied |
| Single Unit, Detached | 406 (72.9%) | 151 (27.1%) |
| Single Unit, Attached | 0 (0.0%) | 0 (0.0%) |
| 2 Unit Apartments | 0 (0.0%) | 66 (100.0%) |
| 3 or 4 Unit Apartments | 0 (0.0%) | 32 (100.0%) |
| 5 to 9 Unit Apartments | 0 (0.0%) | 9 (100.0%) |
| 10 or more Apartments | 0 (0.0%) | 23 (100.0%) |
| Mobile Home / Other | 43 (86.0%) | 7 (14.0%) |
| Total | 449 (60.9%) | 288 (39.1%) |
Housing Structures by Number of Rooms in Linden
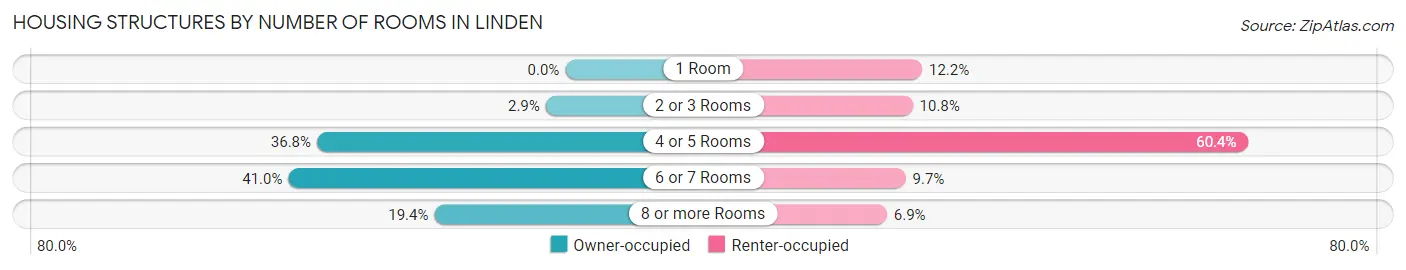
| Number of Rooms | Owner-occupied | Renter-occupied |
| 1 Room | 0 (0.0%) | 35 (12.1%) |
| 2 or 3 Rooms | 13 (2.9%) | 31 (10.8%) |
| 4 or 5 Rooms | 165 (36.7%) | 174 (60.4%) |
| 6 or 7 Rooms | 184 (41.0%) | 28 (9.7%) |
| 8 or more Rooms | 87 (19.4%) | 20 (6.9%) |
| Total | 449 (100.0%) | 288 (100.0%) |
Housing Structure by Heating Type in Linden
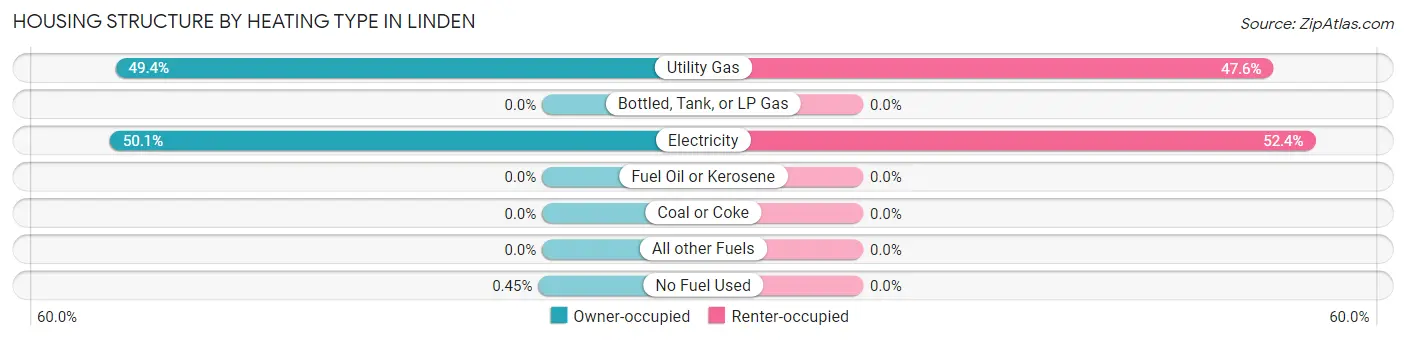
| Heating Type | Owner-occupied | Renter-occupied |
| Utility Gas | 222 (49.4%) | 137 (47.6%) |
| Bottled, Tank, or LP Gas | 0 (0.0%) | 0 (0.0%) |
| Electricity | 225 (50.1%) | 151 (52.4%) |
| Fuel Oil or Kerosene | 0 (0.0%) | 0 (0.0%) |
| Coal or Coke | 0 (0.0%) | 0 (0.0%) |
| All other Fuels | 0 (0.0%) | 0 (0.0%) |
| No Fuel Used | 2 (0.4%) | 0 (0.0%) |
| Total | 449 (100.0%) | 288 (100.0%) |
Household Vehicle Usage in Linden
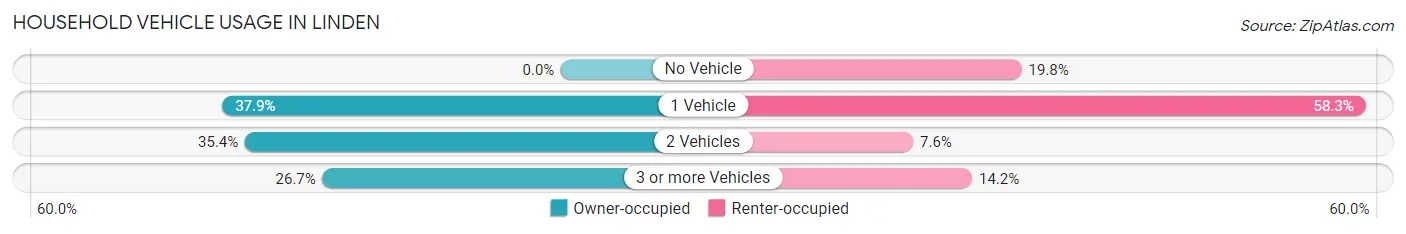
| Vehicles per Household | Owner-occupied | Renter-occupied |
| No Vehicle | 0 (0.0%) | 57 (19.8%) |
| 1 Vehicle | 170 (37.9%) | 168 (58.3%) |
| 2 Vehicles | 159 (35.4%) | 22 (7.6%) |
| 3 or more Vehicles | 120 (26.7%) | 41 (14.2%) |
| Total | 449 (100.0%) | 288 (100.0%) |
Real Estate & Mortgages in Linden
Real Estate and Mortgage Overview in Linden
| Characteristic | Without Mortgage | With Mortgage |
| Housing Units | 317 | 132 |
| Median Property Value | $94,900 | $134,700 |
| Median Household Income | $53,625 | $18 |
| Monthly Housing Costs | $357 | $3 |
| Real Estate Taxes | $1,118 | $0 |
Property Value by Mortgage Status in Linden
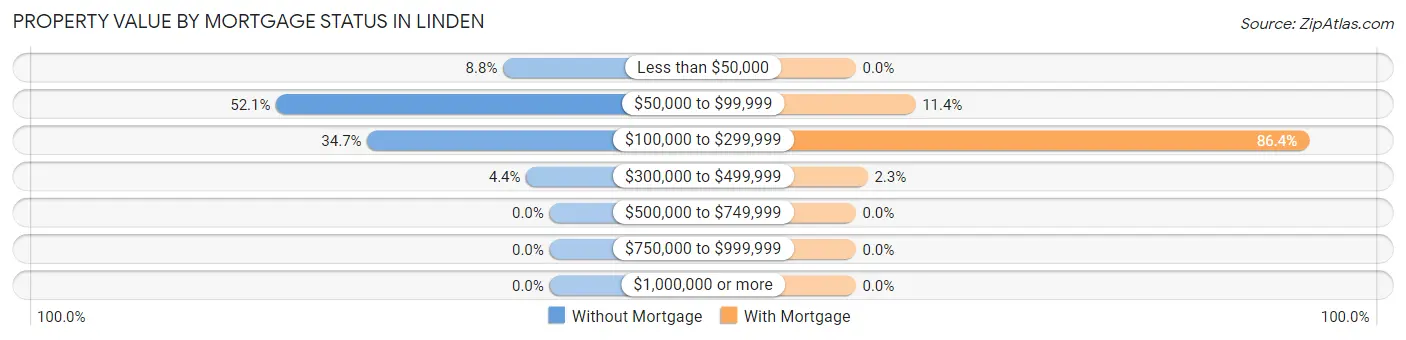
| Property Value | Without Mortgage | With Mortgage |
| Less than $50,000 | 28 (8.8%) | 0 (0.0%) |
| $50,000 to $99,999 | 165 (52.0%) | 15 (11.4%) |
| $100,000 to $299,999 | 110 (34.7%) | 114 (86.4%) |
| $300,000 to $499,999 | 14 (4.4%) | 3 (2.3%) |
| $500,000 to $749,999 | 0 (0.0%) | 0 (0.0%) |
| $750,000 to $999,999 | 0 (0.0%) | 0 (0.0%) |
| $1,000,000 or more | 0 (0.0%) | 0 (0.0%) |
| Total | 317 (100.0%) | 132 (100.0%) |
Household Income by Mortgage Status in Linden
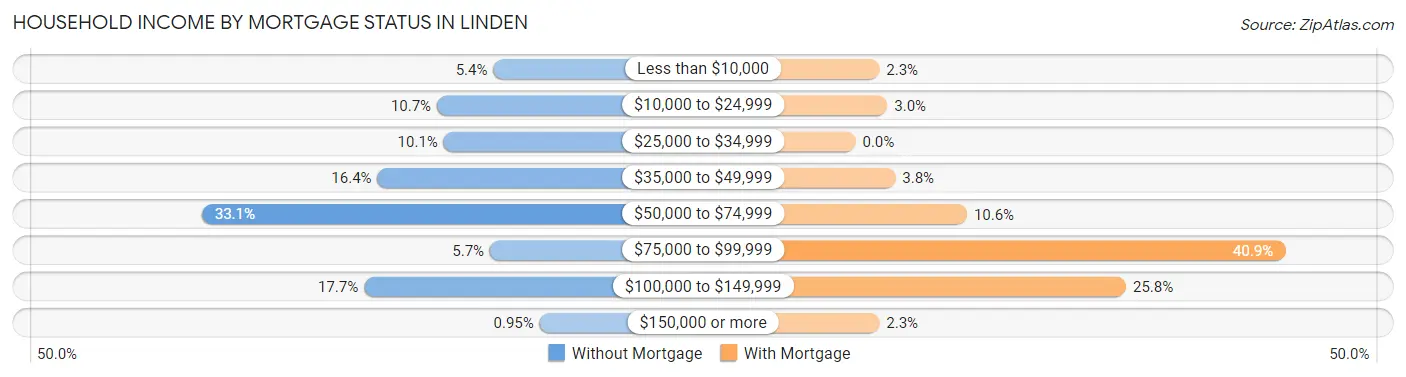
| Household Income | Without Mortgage | With Mortgage |
| Less than $10,000 | 17 (5.4%) | 3 (2.3%) |
| $10,000 to $24,999 | 34 (10.7%) | 4 (3.0%) |
| $25,000 to $34,999 | 32 (10.1%) | 0 (0.0%) |
| $35,000 to $49,999 | 52 (16.4%) | 5 (3.8%) |
| $50,000 to $74,999 | 105 (33.1%) | 14 (10.6%) |
| $75,000 to $99,999 | 18 (5.7%) | 54 (40.9%) |
| $100,000 to $149,999 | 56 (17.7%) | 34 (25.8%) |
| $150,000 or more | 3 (0.9%) | 3 (2.3%) |
| Total | 317 (100.0%) | 132 (100.0%) |
Property Value to Household Income Ratio in Linden
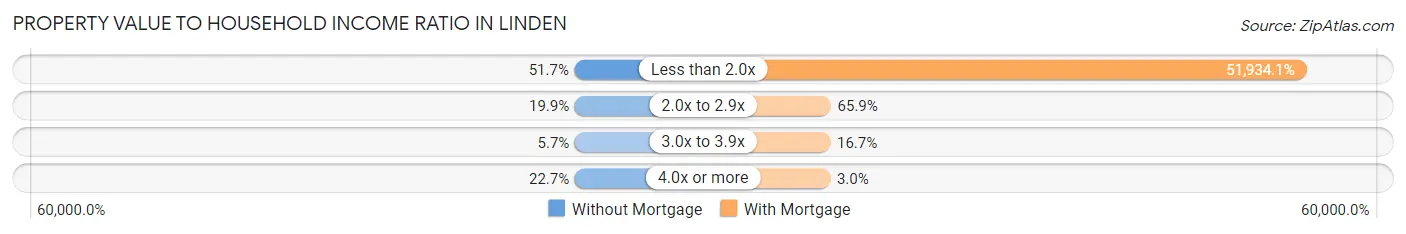
| Value-to-Income Ratio | Without Mortgage | With Mortgage |
| Less than 2.0x | 164 (51.7%) | 68,553 (51,934.1%) |
| 2.0x to 2.9x | 63 (19.9%) | 87 (65.9%) |
| 3.0x to 3.9x | 18 (5.7%) | 22 (16.7%) |
| 4.0x or more | 72 (22.7%) | 4 (3.0%) |
| Total | 317 (100.0%) | 132 (100.0%) |
Real Estate Taxes by Mortgage Status in Linden
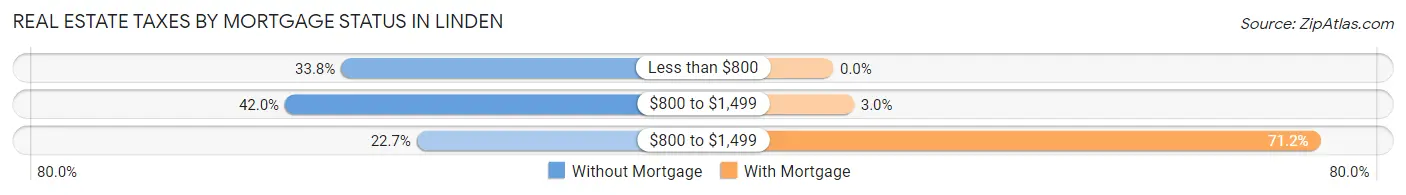
| Property Taxes | Without Mortgage | With Mortgage |
| Less than $800 | 107 (33.8%) | 0 (0.0%) |
| $800 to $1,499 | 133 (42.0%) | 4 (3.0%) |
| $800 to $1,499 | 72 (22.7%) | 94 (71.2%) |
| Total | 317 (100.0%) | 132 (100.0%) |
Health & Disability in Linden
Health Insurance Coverage by Age in Linden
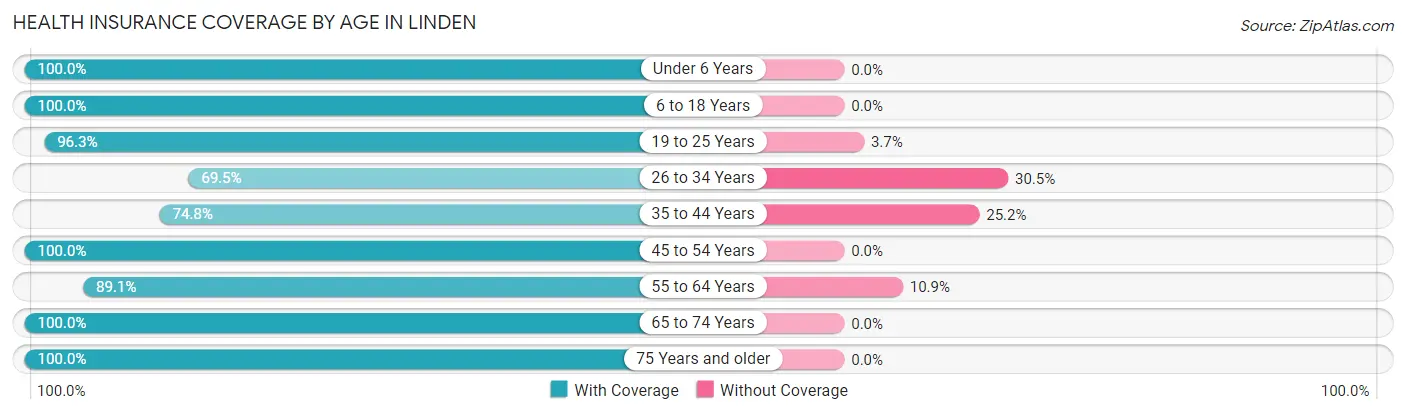
| Age Bracket | With Coverage | Without Coverage |
| Under 6 Years | 102 (100.0%) | 0 (0.0%) |
| 6 to 18 Years | 315 (100.0%) | 0 (0.0%) |
| 19 to 25 Years | 105 (96.3%) | 4 (3.7%) |
| 26 to 34 Years | 66 (69.5%) | 29 (30.5%) |
| 35 to 44 Years | 113 (74.8%) | 38 (25.2%) |
| 45 to 54 Years | 209 (100.0%) | 0 (0.0%) |
| 55 to 64 Years | 147 (89.1%) | 18 (10.9%) |
| 65 to 74 Years | 210 (100.0%) | 0 (0.0%) |
| 75 Years and older | 237 (100.0%) | 0 (0.0%) |
| Total | 1,504 (94.4%) | 89 (5.6%) |
Health Insurance Coverage by Citizenship Status in Linden
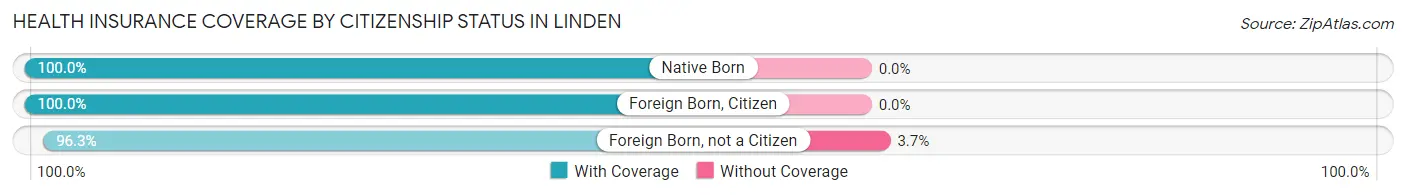
| Citizenship Status | With Coverage | Without Coverage |
| Native Born | 102 (100.0%) | 0 (0.0%) |
| Foreign Born, Citizen | 315 (100.0%) | 0 (0.0%) |
| Foreign Born, not a Citizen | 105 (96.3%) | 4 (3.7%) |
Health Insurance Coverage by Household Income in Linden
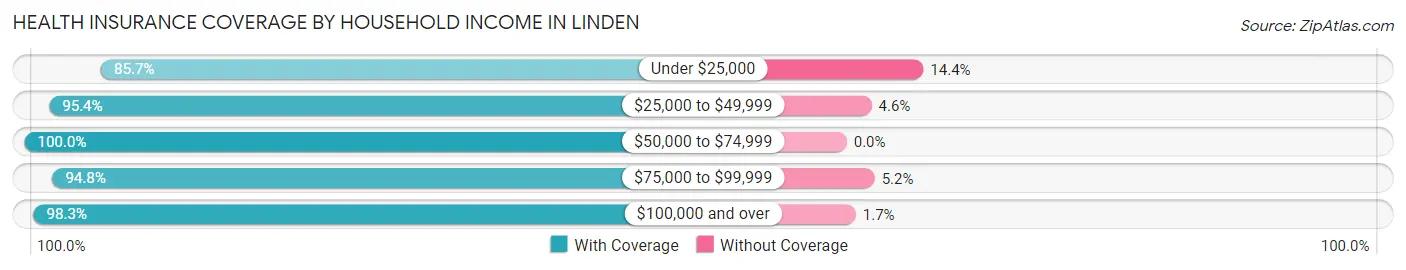
| Household Income | With Coverage | Without Coverage |
| Under $25,000 | 358 (85.7%) | 60 (14.3%) |
| $25,000 to $49,999 | 349 (95.4%) | 17 (4.6%) |
| $50,000 to $74,999 | 421 (100.0%) | 0 (0.0%) |
| $75,000 to $99,999 | 145 (94.8%) | 8 (5.2%) |
| $100,000 and over | 231 (98.3%) | 4 (1.7%) |
Public vs Private Health Insurance Coverage by Age in Linden
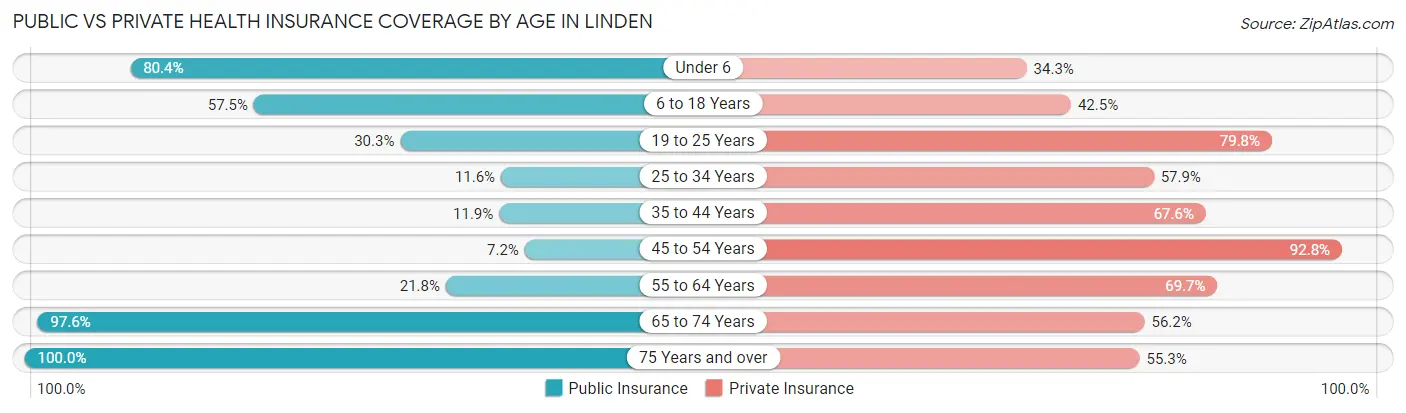
| Age Bracket | Public Insurance | Private Insurance |
| Under 6 | 82 (80.4%) | 35 (34.3%) |
| 6 to 18 Years | 181 (57.5%) | 134 (42.5%) |
| 19 to 25 Years | 33 (30.3%) | 87 (79.8%) |
| 25 to 34 Years | 11 (11.6%) | 55 (57.9%) |
| 35 to 44 Years | 18 (11.9%) | 102 (67.5%) |
| 45 to 54 Years | 15 (7.2%) | 194 (92.8%) |
| 55 to 64 Years | 36 (21.8%) | 115 (69.7%) |
| 65 to 74 Years | 205 (97.6%) | 118 (56.2%) |
| 75 Years and over | 237 (100.0%) | 131 (55.3%) |
| Total | 818 (51.3%) | 971 (61.0%) |
Disability Status by Sex by Age in Linden
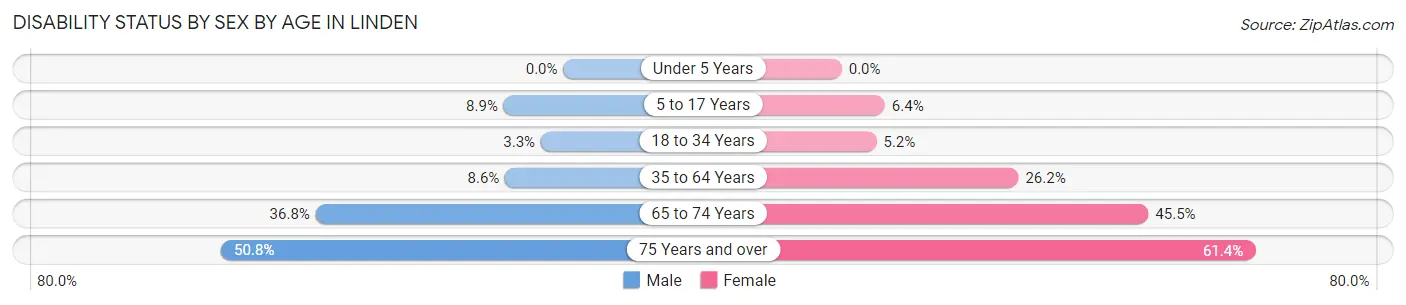
| Age Bracket | Male | Female |
| Under 5 Years | 0 (0.0%) | 0 (0.0%) |
| 5 to 17 Years | 10 (8.8%) | 11 (6.4%) |
| 18 to 34 Years | 3 (3.3%) | 8 (5.2%) |
| 35 to 64 Years | 21 (8.6%) | 74 (26.2%) |
| 65 to 74 Years | 32 (36.8%) | 56 (45.5%) |
| 75 Years and over | 31 (50.8%) | 108 (61.4%) |
Disability Class by Sex by Age in Linden
Disability Class: Hearing Difficulty
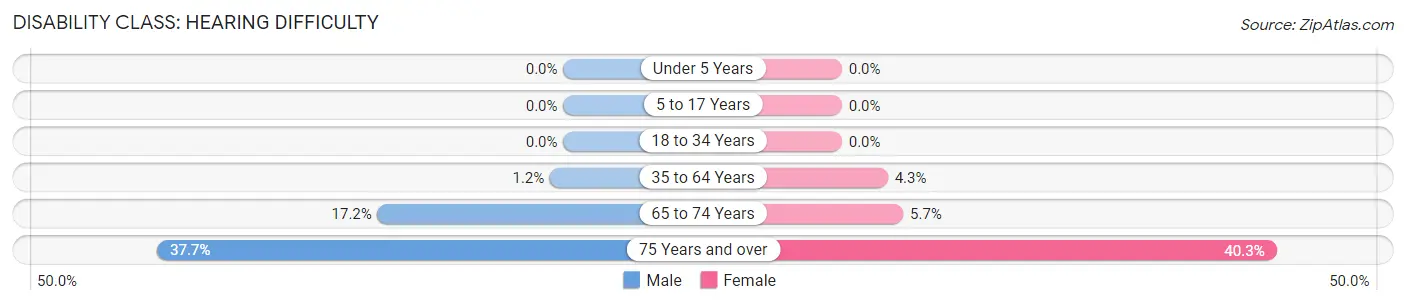
| Age Bracket | Male | Female |
| Under 5 Years | 0 (0.0%) | 0 (0.0%) |
| 5 to 17 Years | 0 (0.0%) | 0 (0.0%) |
| 18 to 34 Years | 0 (0.0%) | 0 (0.0%) |
| 35 to 64 Years | 3 (1.2%) | 12 (4.3%) |
| 65 to 74 Years | 15 (17.2%) | 7 (5.7%) |
| 75 Years and over | 23 (37.7%) | 71 (40.3%) |
Disability Class: Vision Difficulty
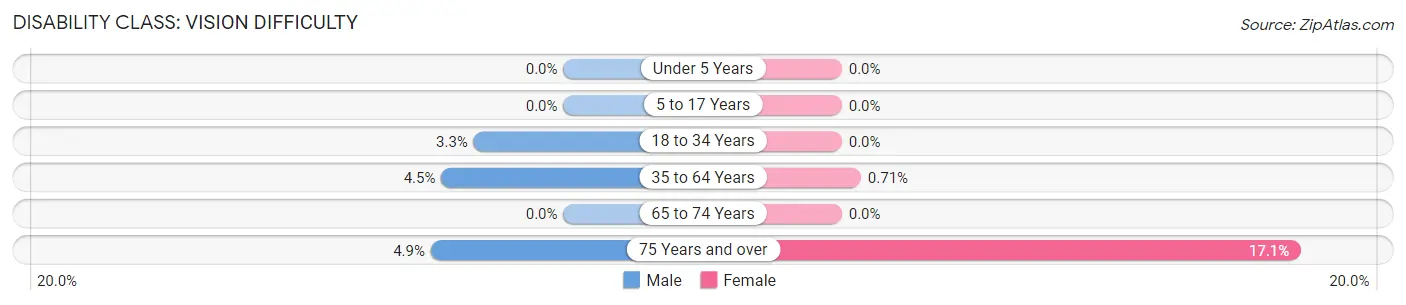
| Age Bracket | Male | Female |
| Under 5 Years | 0 (0.0%) | 0 (0.0%) |
| 5 to 17 Years | 0 (0.0%) | 0 (0.0%) |
| 18 to 34 Years | 3 (3.3%) | 0 (0.0%) |
| 35 to 64 Years | 11 (4.5%) | 2 (0.7%) |
| 65 to 74 Years | 0 (0.0%) | 0 (0.0%) |
| 75 Years and over | 3 (4.9%) | 30 (17.1%) |
Disability Class: Cognitive Difficulty
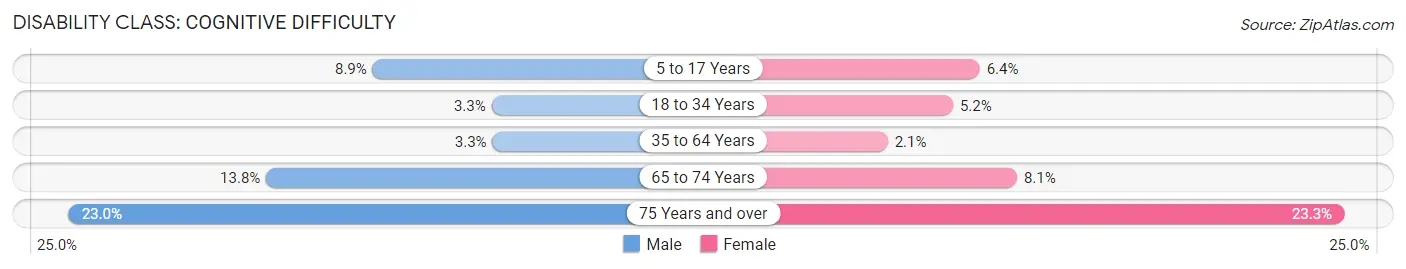
| Age Bracket | Male | Female |
| 5 to 17 Years | 10 (8.8%) | 11 (6.4%) |
| 18 to 34 Years | 3 (3.3%) | 8 (5.2%) |
| 35 to 64 Years | 8 (3.3%) | 6 (2.1%) |
| 65 to 74 Years | 12 (13.8%) | 10 (8.1%) |
| 75 Years and over | 14 (23.0%) | 41 (23.3%) |
Disability Class: Ambulatory Difficulty
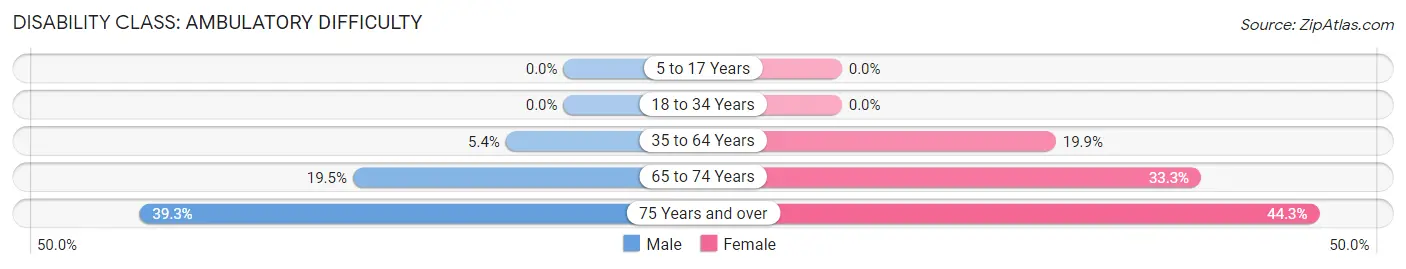
| Age Bracket | Male | Female |
| 5 to 17 Years | 0 (0.0%) | 0 (0.0%) |
| 18 to 34 Years | 0 (0.0%) | 0 (0.0%) |
| 35 to 64 Years | 13 (5.3%) | 56 (19.9%) |
| 65 to 74 Years | 17 (19.5%) | 41 (33.3%) |
| 75 Years and over | 24 (39.3%) | 78 (44.3%) |
Disability Class: Self-Care Difficulty
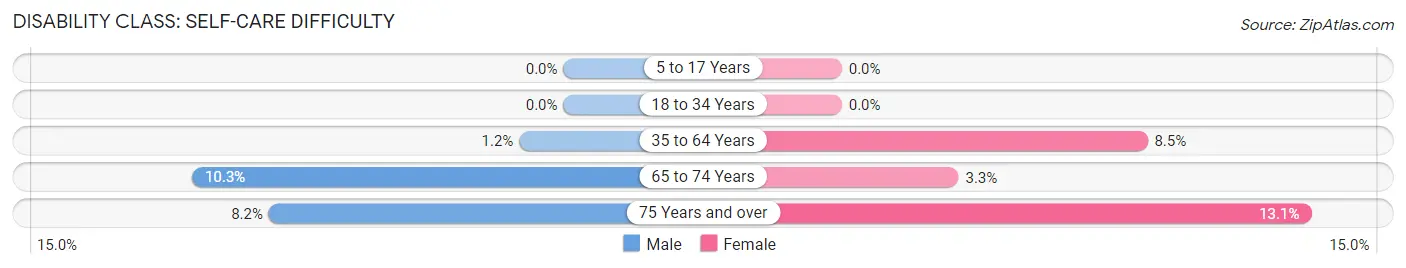
| Age Bracket | Male | Female |
| 5 to 17 Years | 0 (0.0%) | 0 (0.0%) |
| 18 to 34 Years | 0 (0.0%) | 0 (0.0%) |
| 35 to 64 Years | 3 (1.2%) | 24 (8.5%) |
| 65 to 74 Years | 9 (10.3%) | 4 (3.3%) |
| 75 Years and over | 5 (8.2%) | 23 (13.1%) |
Technology Access in Linden
Computing Device Access in Linden
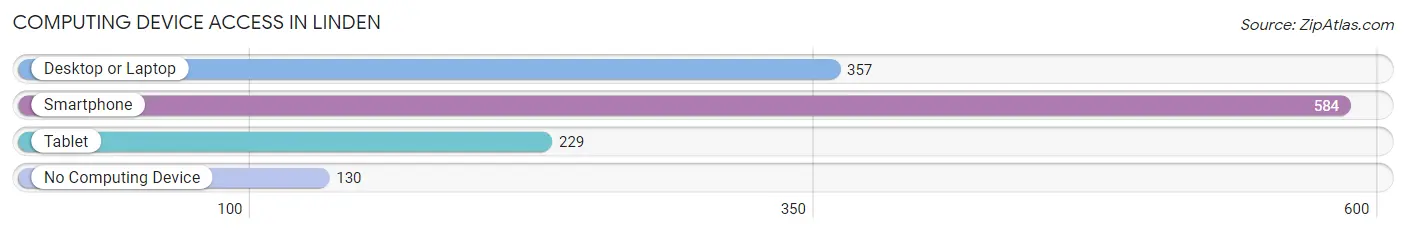
| Device Type | # Households | % Households |
| Desktop or Laptop | 357 | 48.4% |
| Smartphone | 584 | 79.2% |
| Tablet | 229 | 31.1% |
| No Computing Device | 130 | 17.6% |
| Total | 737 | 100.0% |
Internet Access in Linden
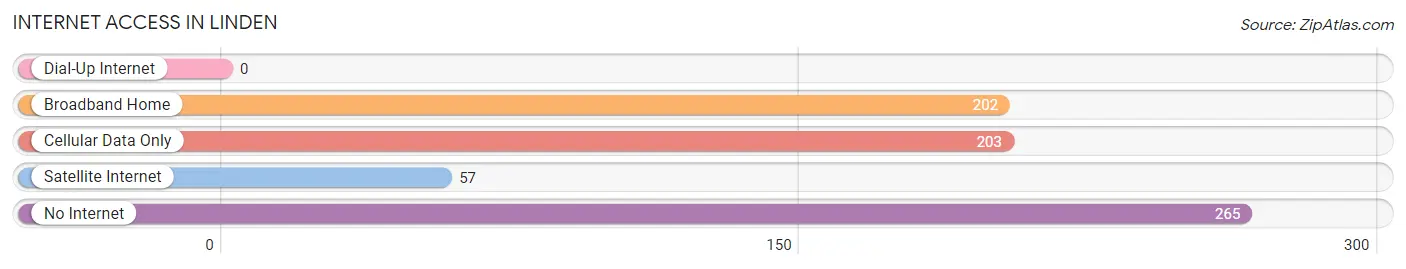
| Internet Type | # Households | % Households |
| Dial-Up Internet | 0 | 0.0% |
| Broadband Home | 202 | 27.4% |
| Cellular Data Only | 203 | 27.5% |
| Satellite Internet | 57 | 7.7% |
| No Internet | 265 | 36.0% |
| Total | 737 | 100.0% |
Linden Summary
Linden, Texas is a small town located in Cass County, Texas, United States. It is situated on the banks of the Sulphur River, approximately 20 miles east of the Texas-Arkansas border. The population of Linden was 1,945 at the 2010 census.
History
The area that is now Linden was first settled in the early 1840s by a group of settlers from Arkansas. The town was originally known as Sulphur Springs, and was later renamed Linden in 1854. The name was chosen in honor of Linden, Tennessee, the hometown of one of the settlers.
The town was officially incorporated in 1856, and the first post office was established in 1857. The town quickly grew, and by 1860, it had a population of over 500.
During the Civil War, Linden was a major supply center for the Confederate Army. The town was also the site of several skirmishes between Union and Confederate forces.
In 1871, the Texas and Pacific Railway was built through Linden, connecting the town to the rest of the state. This allowed for the growth of the local economy, and the population of Linden increased to over 1,000 by 1880.
Geography
Linden is located at 33°14'25" North, 94°25'45" West (33.240278, -94.429167). It is situated on the banks of the Sulphur River, approximately 20 miles east of the Texas-Arkansas border.
The town has a total area of 2 2 square miles all of which is land
Economy
The economy of Linden is largely based on agriculture. The town is home to several farms, which produce a variety of crops, including cotton, corn, soybeans, and wheat.
The town is also home to several small businesses, including a grocery store, a hardware store, and a few restaurants.
Demographics
As of the 2010 census, there were 1,945 people, 745 households, and 517 families residing in Linden. The population density was 877.3 people per square mile. The racial makeup of the town was 79.2% White, 17.2% African American, 0.5% Native American, 0.3% Asian, 0.1% Pacific Islander, 1.2% from other races, and 1.6% from two or more races. Hispanic or Latino of any race were 3.3% of the population.
The median income for a household in Linden was $31,250, and the median income for a family was $37,500. The per capita income for the town was $15,945. About 17.2% of families and 20.2% of the population were below the poverty line, including 28.2% of those under age 18 and 15.2% of those age 65 or over.
Common Questions
What is the Total Population of Linden?
Total Population of Linden is 1,707.
What is the Total Male Population of Linden?
Total Male Population of Linden is 746.
What is the Total Female Population of Linden?
Total Female Population of Linden is 961.
What is the Ratio of Males per 100 Females in Linden?
There are 77.63 Males per 100 Females in Linden.
What is the Ratio of Females per 100 Males in Linden?
There are 128.82 Females per 100 Males in Linden.
What is the Median Population Age in Linden?
Median Population Age in Linden is 45.3 Years.
What is the Average Family Size in Linden
Average Family Size in Linden is 2.8 People.
What is the Average Household Size in Linden
Average Household Size in Linden is 2.2 People.
What is Per Capita Income in Linden?
Per Capita income in Linden is $24,319.
What is the Median Family Income in Linden?
Median Family Income in Linden is $61,500.
What is the Median Household income in Linden?
Median Household Income in Linden is $42,750.
What is Income or Wage Gap in Linden?
Income or Wage Gap in Linden is 42.2%.
Women in Linden earn 57.8 cents for every dollar earned by a man.
What is Family Income Deficit in Linden?
Family Income Deficit in Linden is $12,460.
Families that are below poverty line in Linden earn $12,460 less on average than the poverty threshold level.
What is Inequality or Gini Index in Linden?
Inequality or Gini Index in Linden is 0.47.
How Large is the Labor Force in Linden?
There are 636 People in the Labor Forcein in Linden.
What is the Percentage of People in the Labor Force in Linden?
45.9% of People are in the Labor Force in Linden.
What is the Unemployment Rate in Linden?
Unemployment Rate in Linden is 9.3%.