Lake City, TX
Lake City Map
Lake City Overview
540
TOTAL POPULATION
289
MALE POPULATION
251
FEMALE POPULATION
115.14
MALES / 100 FEMALES
86.85
FEMALES / 100 MALES
49.1
MEDIAN AGE
3.2
AVG FAMILY SIZE
2.4
AVG HOUSEHOLD SIZE
$31,343
PER CAPITA INCOME
$73,750
AVG FAMILY INCOME
$50,625
AVG HOUSEHOLD INCOME
62.7%
WAGE / INCOME GAP [ % ]
37.3¢/ $1
WAGE / INCOME GAP [ $ ]
0.44
INEQUALITY / GINI INDEX
240
LABOR FORCE [ PEOPLE ]
54.5%
PERCENT IN LABOR FORCE
3.8%
UNEMPLOYMENT RATE
Lake City Area Codes
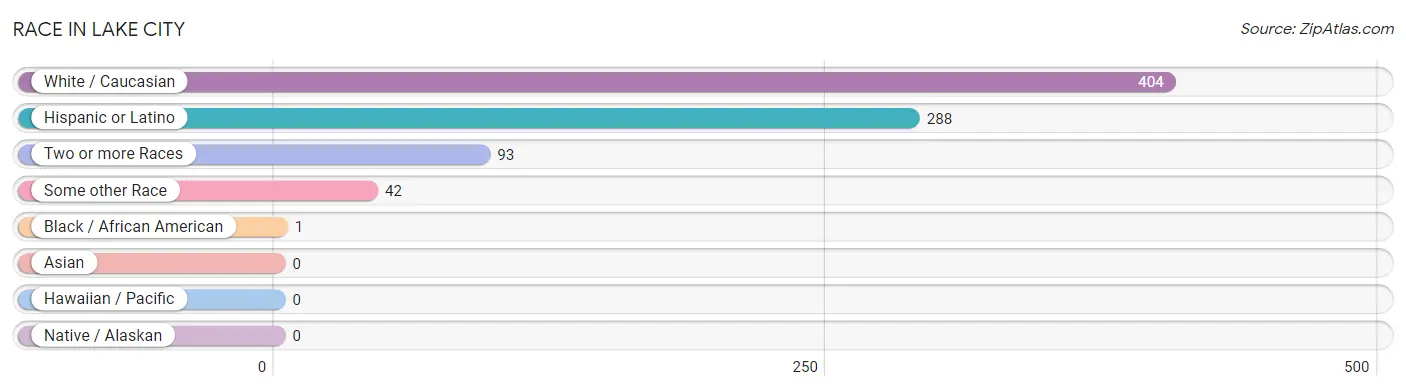
Race in Lake City
The most populous races in Lake City are White / Caucasian (404 | 74.8%), Hispanic or Latino (288 | 53.3%), and Two or more Races (93 | 17.2%).
| Race | # Population | % Population |
| Asian | 0 | 0.0% |
| Black / African American | 1 | 0.2% |
| Hawaiian / Pacific | 0 | 0.0% |
| Hispanic or Latino | 288 | 53.3% |
| Native / Alaskan | 0 | 0.0% |
| White / Caucasian | 404 | 74.8% |
| Two or more Races | 93 | 17.2% |
| Some other Race | 42 | 7.8% |
| Total | 540 | 100.0% |
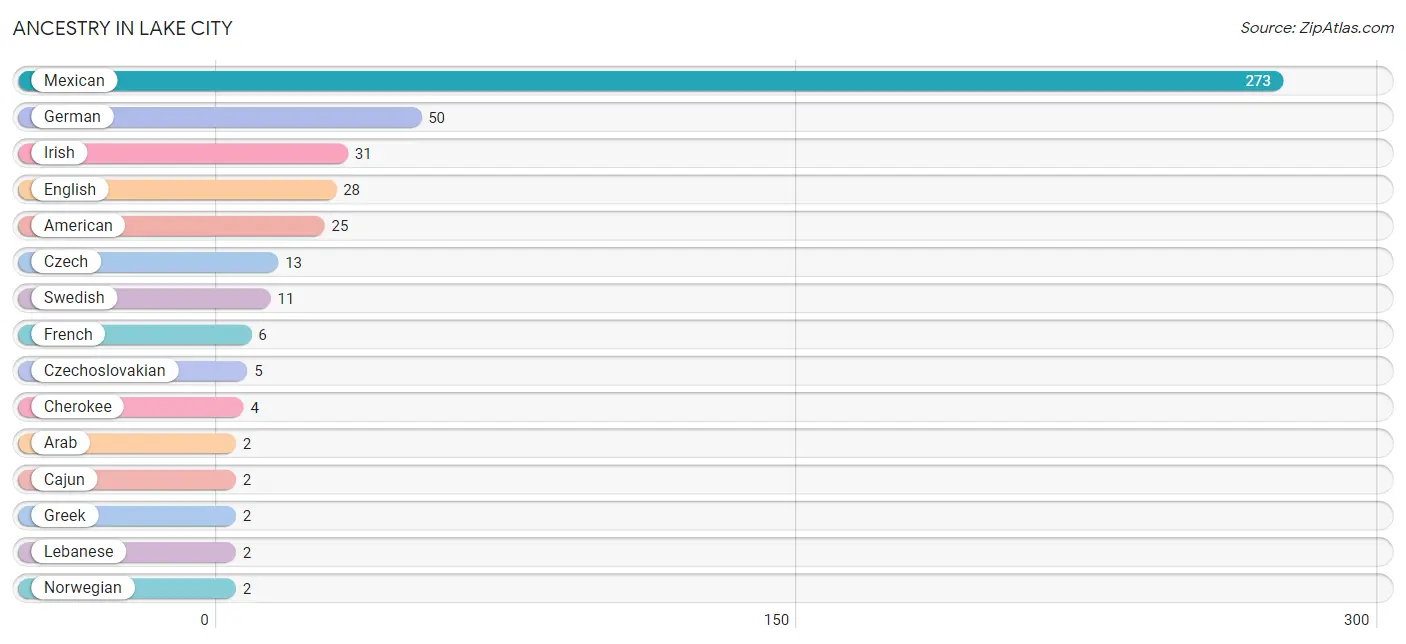
Ancestry in Lake City
The most populous ancestries reported in Lake City are Mexican (273 | 50.6%), German (50 | 9.3%), Irish (31 | 5.7%), English (28 | 5.2%), and American (25 | 4.6%), together accounting for 75.4% of all Lake City residents.
| Ancestry | # Population | % Population |
| American | 25 | 4.6% |
| Arab | 2 | 0.4% |
| Cajun | 2 | 0.4% |
| Cherokee | 4 | 0.7% |
| Czech | 13 | 2.4% |
| Czechoslovakian | 5 | 0.9% |
| English | 28 | 5.2% |
| French | 6 | 1.1% |
| German | 50 | 9.3% |
| Greek | 2 | 0.4% |
| Irish | 31 | 5.7% |
| Lebanese | 2 | 0.4% |
| Mexican | 273 | 50.6% |
| Norwegian | 2 | 0.4% |
| Puerto Rican | 2 | 0.4% |
| Scandinavian | 2 | 0.4% |
| Scottish | 2 | 0.4% |
| Swedish | 11 | 2.0% | View All 18 Rows |
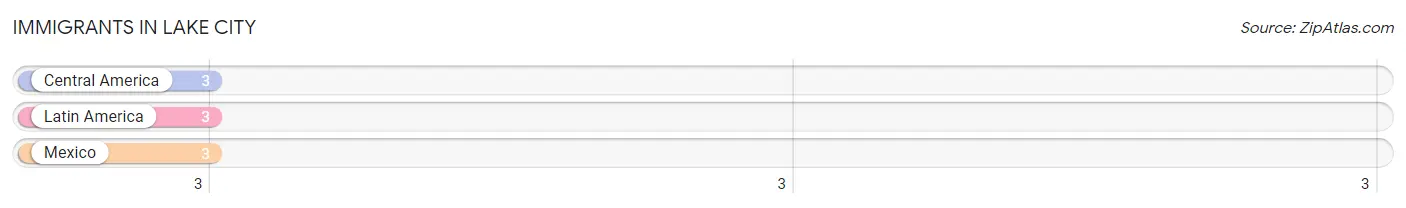
Immigrants in Lake City
The most numerous immigrant groups reported in Lake City came from Central America (3 | 0.6%), Latin America (3 | 0.6%), and Mexico (3 | 0.6%), together accounting for 1.7% of all Lake City residents.
| Immigration Origin | # Population | % Population |
| Central America | 3 | 0.6% |
| Latin America | 3 | 0.6% |
| Mexico | 3 | 0.6% | View All 3 Rows |
Sex and Age in Lake City
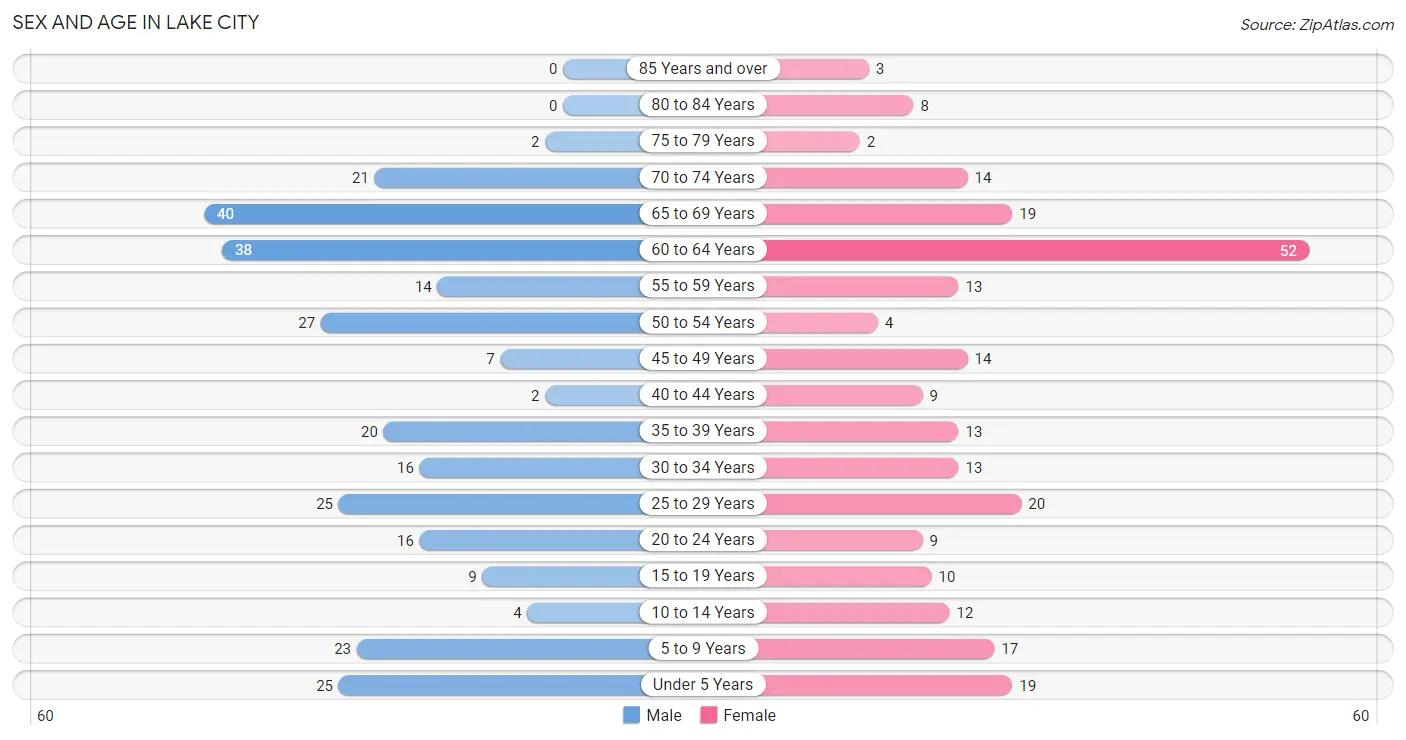
Sex and Age in Lake City
The most populous age groups in Lake City are 65 to 69 Years (40 | 13.8%) for men and 60 to 64 Years (52 | 20.7%) for women.
| Age Bracket | Male | Female |
| Under 5 Years | 25 (8.6%) | 19 (7.6%) |
| 5 to 9 Years | 23 (8.0%) | 17 (6.8%) |
| 10 to 14 Years | 4 (1.4%) | 12 (4.8%) |
| 15 to 19 Years | 9 (3.1%) | 10 (4.0%) |
| 20 to 24 Years | 16 (5.5%) | 9 (3.6%) |
| 25 to 29 Years | 25 (8.6%) | 20 (8.0%) |
| 30 to 34 Years | 16 (5.5%) | 13 (5.2%) |
| 35 to 39 Years | 20 (6.9%) | 13 (5.2%) |
| 40 to 44 Years | 2 (0.7%) | 9 (3.6%) |
| 45 to 49 Years | 7 (2.4%) | 14 (5.6%) |
| 50 to 54 Years | 27 (9.3%) | 4 (1.6%) |
| 55 to 59 Years | 14 (4.8%) | 13 (5.2%) |
| 60 to 64 Years | 38 (13.2%) | 52 (20.7%) |
| 65 to 69 Years | 40 (13.8%) | 19 (7.6%) |
| 70 to 74 Years | 21 (7.3%) | 14 (5.6%) |
| 75 to 79 Years | 2 (0.7%) | 2 (0.8%) |
| 80 to 84 Years | 0 (0.0%) | 8 (3.2%) |
| 85 Years and over | 0 (0.0%) | 3 (1.2%) |
| Total | 289 (100.0%) | 251 (100.0%) |
Families and Households in Lake City
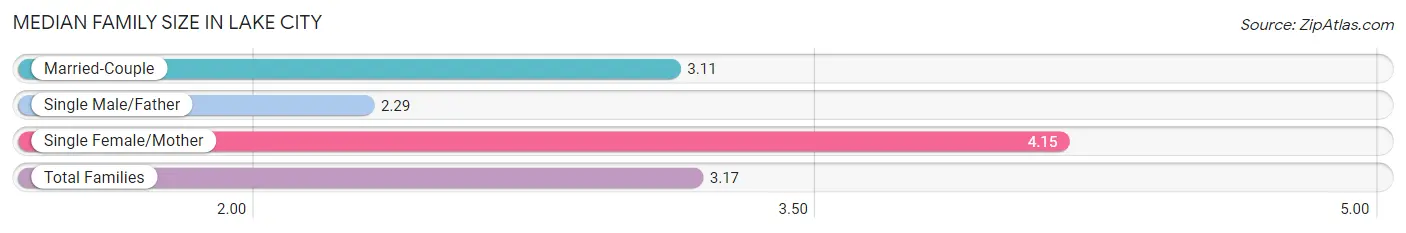
Median Family Size in Lake City
The median family size in Lake City is 3.17 persons per family, with single female/mother families (13 | 9.3%) accounting for the largest median family size of 4.15 persons per family. On the other hand, single male/father families (7 | 5.0%) represent the smallest median family size with 2.29 persons per family.
| Family Type | # Families | Family Size |
| Married-Couple | 119 (85.6%) | 3.11 |
| Single Male/Father | 7 (5.0%) | 2.29 |
| Single Female/Mother | 13 (9.3%) | 4.15 |
| Total Families | 139 (100.0%) | 3.17 |
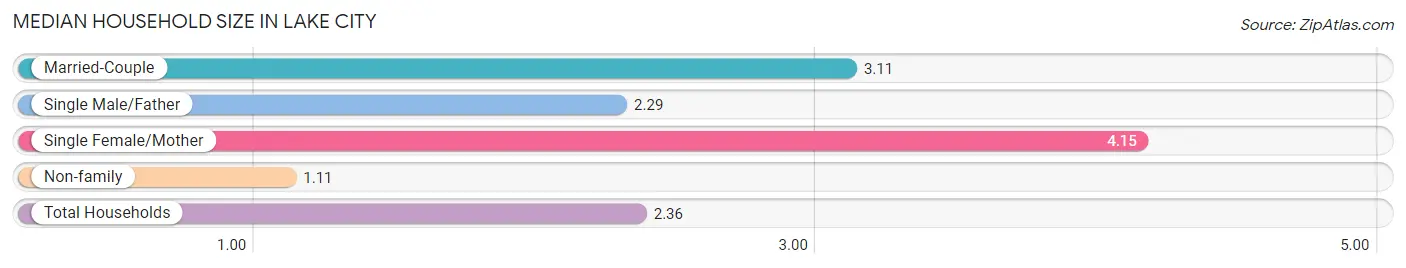
Median Household Size in Lake City
The median household size in Lake City is 2.36 persons per household, with single female/mother households (13 | 5.7%) accounting for the largest median household size of 4.15 persons per household. non-family households (90 | 39.3%) represent the smallest median household size with 1.11 persons per household.
| Household Type | # Households | Household Size |
| Married-Couple | 119 (52.0%) | 3.11 |
| Single Male/Father | 7 (3.1%) | 2.29 |
| Single Female/Mother | 13 (5.7%) | 4.15 |
| Non-family | 90 (39.3%) | 1.11 |
| Total Households | 229 (100.0%) | 2.36 |
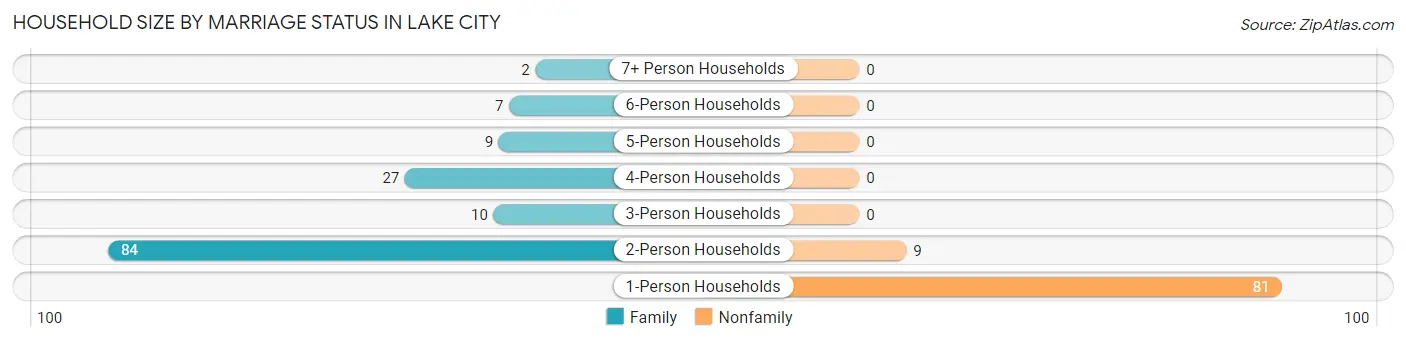
Household Size by Marriage Status in Lake City
Out of a total of 229 households in Lake City, 139 (60.7%) are family households, while 90 (39.3%) are nonfamily households. The most numerous type of family households are 2-person households, comprising 84, and the most common type of nonfamily households are 1-person households, comprising 81.
| Household Size | Family Households | Nonfamily Households |
| 1-Person Households | - | 81 (35.4%) |
| 2-Person Households | 84 (36.7%) | 9 (3.9%) |
| 3-Person Households | 10 (4.4%) | 0 (0.0%) |
| 4-Person Households | 27 (11.8%) | 0 (0.0%) |
| 5-Person Households | 9 (3.9%) | 0 (0.0%) |
| 6-Person Households | 7 (3.1%) | 0 (0.0%) |
| 7+ Person Households | 2 (0.9%) | 0 (0.0%) |
| Total | 139 (60.7%) | 90 (39.3%) |
Female Fertility in Lake City
Fertility by Age in Lake City
Average fertility rate in Lake City is 136.0 births per 1,000 women. Women in the age bracket of 20 to 34 years have the highest fertility rate with 238.0 births per 1,000 women. Women in the age bracket of 20 to 34 years acount for 83.3% of all women with births.
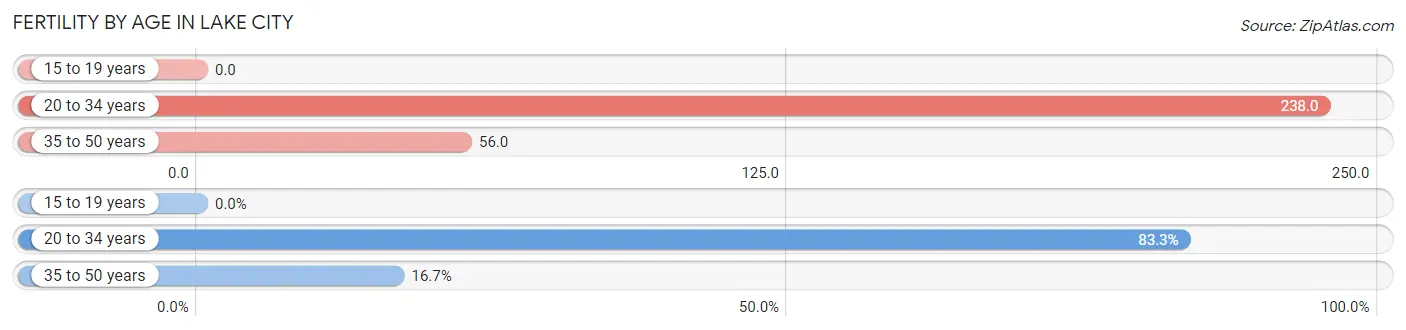
| Age Bracket | Women with Births | Births / 1,000 Women |
| 15 to 19 years | 0 (0.0%) | 0.0 |
| 20 to 34 years | 10 (83.3%) | 238.0 |
| 35 to 50 years | 2 (16.7%) | 56.0 |
| Total | 12 (100.0%) | 136.0 |
Fertility by Age by Marriage Status in Lake City
50.0% of women with births (12) in Lake City are married. The highest percentage of unmarried women with births falls into 20 to 34 years age bracket with 60.0% of them unmarried at the time of birth, while the lowest percentage of unmarried women with births belong to 35 to 50 years age bracket with 0.0% of them unmarried.
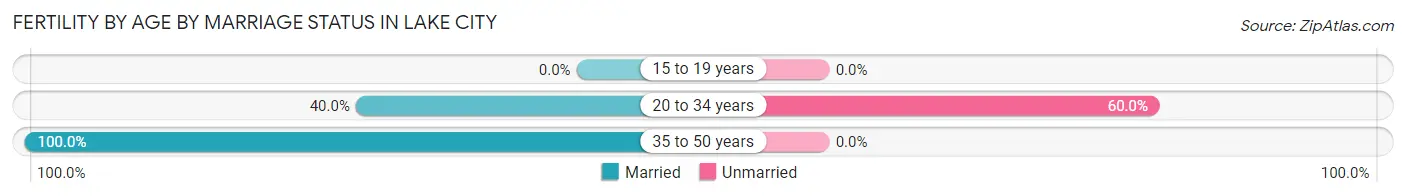
| Age Bracket | Married | Unmarried |
| 15 to 19 years | 0 (0.0%) | 0 (0.0%) |
| 20 to 34 years | 4 (40.0%) | 6 (60.0%) |
| 35 to 50 years | 2 (100.0%) | 0 (0.0%) |
| Total | 6 (50.0%) | 6 (50.0%) |
Fertility by Education in Lake City
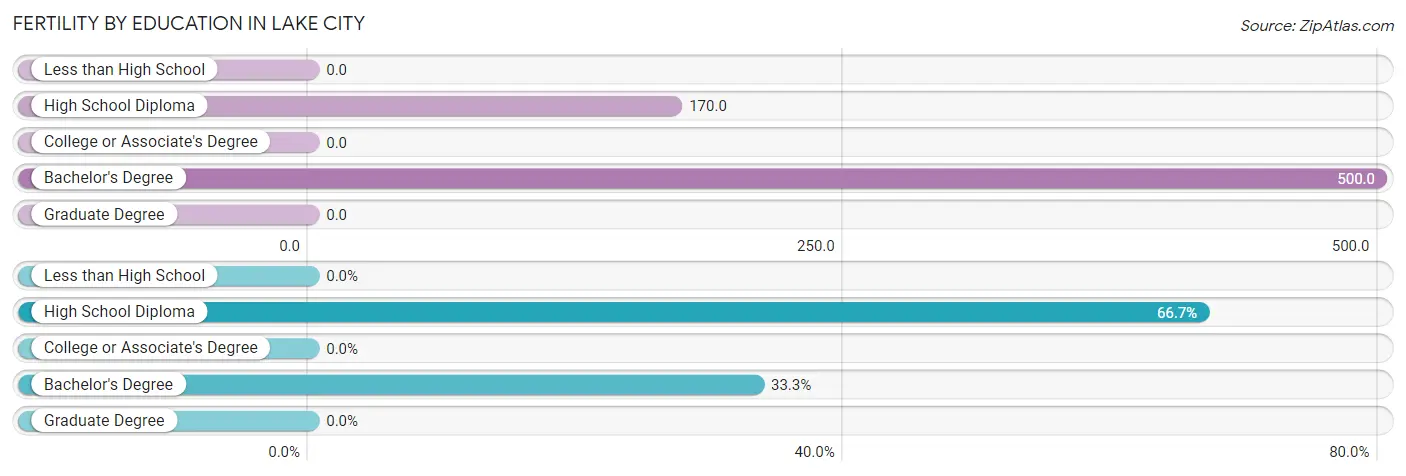
| Educational Attainment | Women with Births | Births / 1,000 Women |
| Less than High School | 0 (0.0%) | 0.0 |
| High School Diploma | 8 (66.7%) | 170.0 |
| College or Associate's Degree | 0 (0.0%) | 0.0 |
| Bachelor's Degree | 4 (33.3%) | 500.0 |
| Graduate Degree | 0 (0.0%) | 0.0 |
| Total | 12 (100.0%) | 136.0 |
Fertility by Education by Marriage Status in Lake City
50.0% of women with births in Lake City are unmarried. Women with the educational attainment of bachelor's degree are most likely to be married with 100.0% of them married at childbirth, while women with the educational attainment of high school diploma are least likely to be married with 75.0% of them unmarried at childbirth.
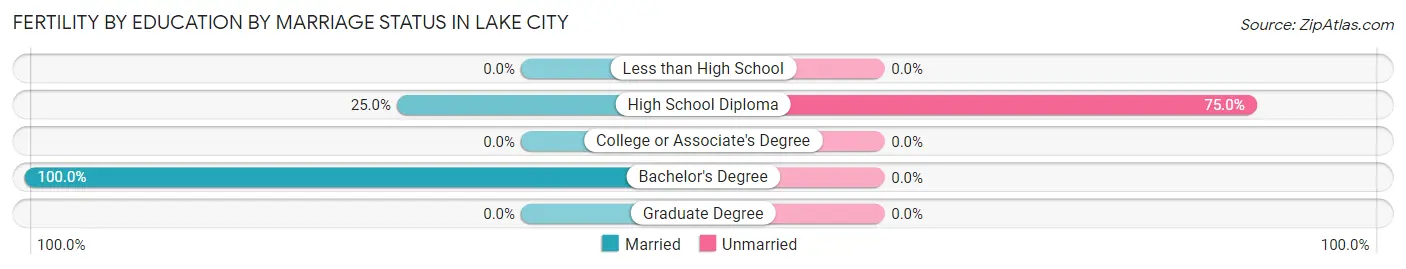
| Educational Attainment | Married | Unmarried |
| Less than High School | 0 (0.0%) | 0 (0.0%) |
| High School Diploma | 2 (25.0%) | 6 (75.0%) |
| College or Associate's Degree | 0 (0.0%) | 0 (0.0%) |
| Bachelor's Degree | 4 (100.0%) | 0 (0.0%) |
| Graduate Degree | 0 (0.0%) | 0 (0.0%) |
| Total | 6 (50.0%) | 6 (50.0%) |
Income in Lake City
Income Overview in Lake City
Per Capita Income in Lake City is $31,343, while median incomes of families and households are $73,750 and $50,625 respectively.
| Characteristic | Number | Measure |
| Per Capita Income | 540 | $31,343 |
| Median Family Income | 139 | $73,750 |
| Mean Family Income | 139 | $88,301 |
| Median Household Income | 229 | $50,625 |
| Mean Household Income | 229 | $70,313 |
| Income Deficit | 139 | $0 |
| Wage / Income Gap (%) | 540 | 62.72% |
| Wage / Income Gap ($) | 540 | 37.28¢ per $1 |
| Gini / Inequality Index | 540 | 0.44 |
Earnings by Sex in Lake City
Average Earnings in Lake City are $38,500, $58,438 for men and $21,786 for women, a difference of 62.7%.
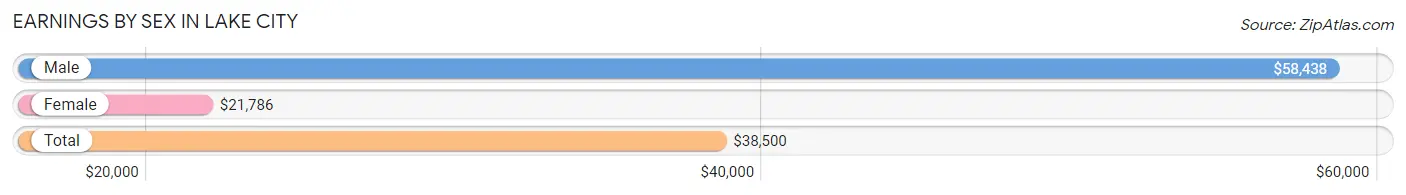
| Sex | Number | Average Earnings |
| Male | 166 (68.6%) | $58,438 |
| Female | 76 (31.4%) | $21,786 |
| Total | 242 (100.0%) | $38,500 |
Earnings by Sex by Income Bracket in Lake City
The most common earnings brackets in Lake City are $75,000 to $99,999 for men (34 | 20.5%) and $25,000 to $29,999 for women (15 | 19.7%).
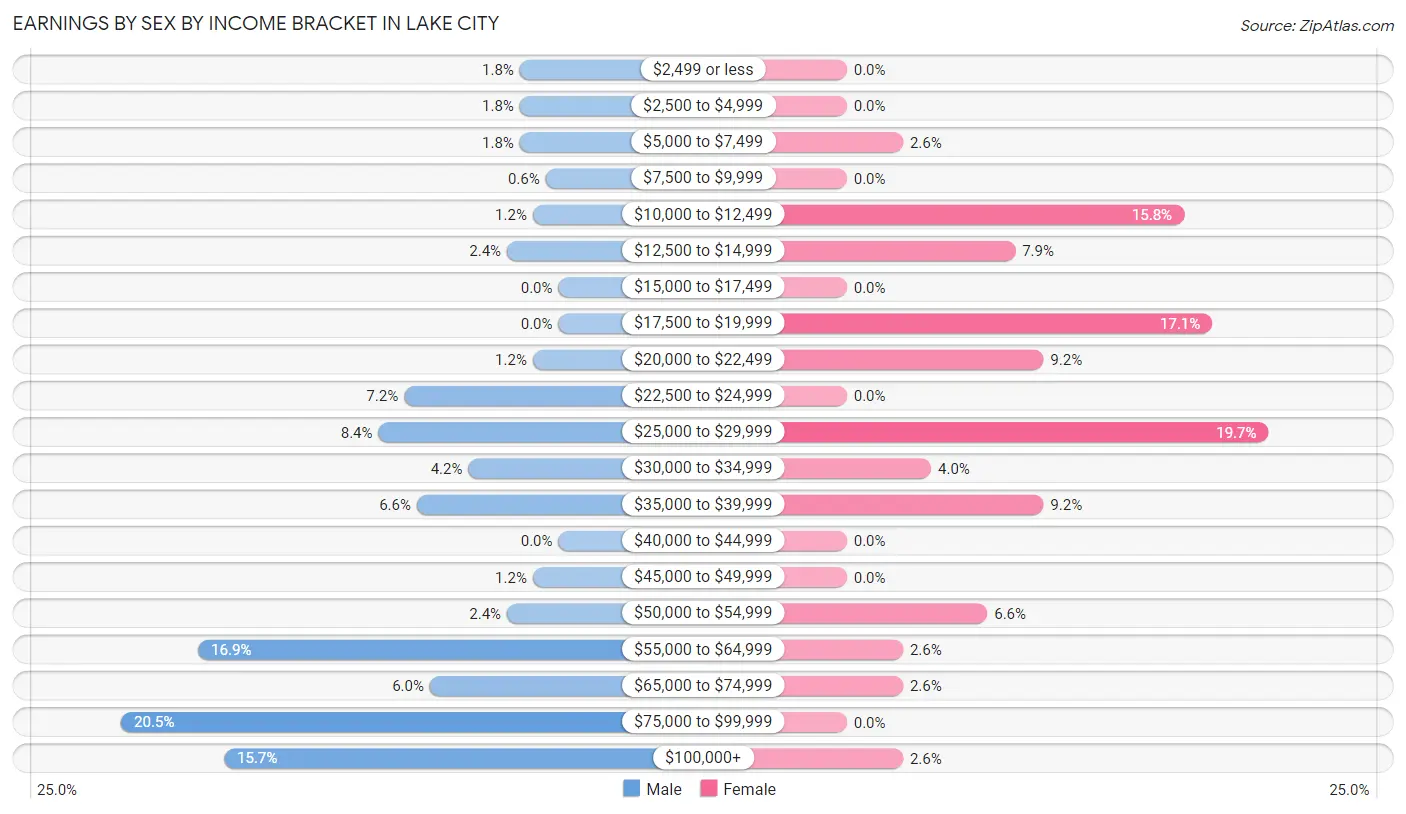
| Income | Male | Female |
| $2,499 or less | 3 (1.8%) | 0 (0.0%) |
| $2,500 to $4,999 | 3 (1.8%) | 0 (0.0%) |
| $5,000 to $7,499 | 3 (1.8%) | 2 (2.6%) |
| $7,500 to $9,999 | 1 (0.6%) | 0 (0.0%) |
| $10,000 to $12,499 | 2 (1.2%) | 12 (15.8%) |
| $12,500 to $14,999 | 4 (2.4%) | 6 (7.9%) |
| $15,000 to $17,499 | 0 (0.0%) | 0 (0.0%) |
| $17,500 to $19,999 | 0 (0.0%) | 13 (17.1%) |
| $20,000 to $22,499 | 2 (1.2%) | 7 (9.2%) |
| $22,500 to $24,999 | 12 (7.2%) | 0 (0.0%) |
| $25,000 to $29,999 | 14 (8.4%) | 15 (19.7%) |
| $30,000 to $34,999 | 7 (4.2%) | 3 (4.0%) |
| $35,000 to $39,999 | 11 (6.6%) | 7 (9.2%) |
| $40,000 to $44,999 | 0 (0.0%) | 0 (0.0%) |
| $45,000 to $49,999 | 2 (1.2%) | 0 (0.0%) |
| $50,000 to $54,999 | 4 (2.4%) | 5 (6.6%) |
| $55,000 to $64,999 | 28 (16.9%) | 2 (2.6%) |
| $65,000 to $74,999 | 10 (6.0%) | 2 (2.6%) |
| $75,000 to $99,999 | 34 (20.5%) | 0 (0.0%) |
| $100,000+ | 26 (15.7%) | 2 (2.6%) |
| Total | 166 (100.0%) | 76 (100.0%) |
Earnings by Sex by Educational Attainment in Lake City
Average earnings in Lake City are $59,688 for men and $21,786 for women, a difference of 63.5%. Men with an educational attainment of college or associate's degree enjoy the highest average annual earnings of $80,625, while those with college or associate's degree education earn the least with $80,625. Women with an educational attainment of college or associate's degree earn the most with the average annual earnings of $50,833, while those with high school diploma education have the smallest earnings of $19,519.
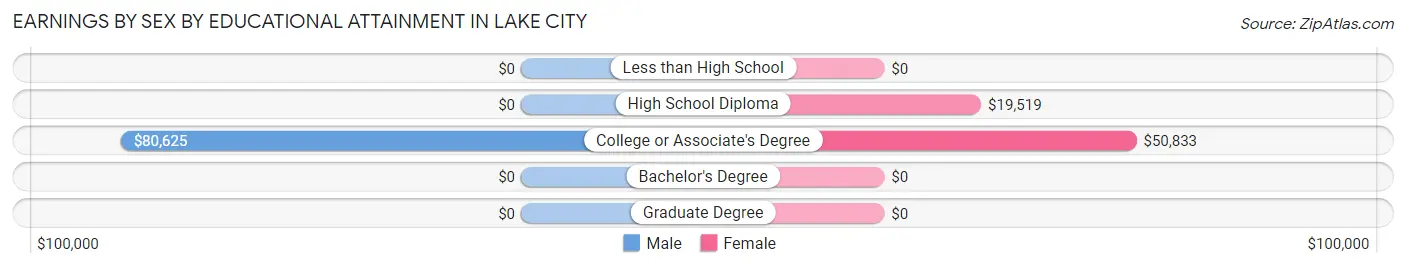
| Educational Attainment | Male Income | Female Income |
| Less than High School | - | - |
| High School Diploma | - | - |
| College or Associate's Degree | $80,625 | $50,833 |
| Bachelor's Degree | - | - |
| Graduate Degree | - | - |
| Total | $59,688 | $21,786 |
Family Income in Lake City
Family Income Brackets in Lake City
According to the Lake City family income data, there are 24 families falling into the $35,000 to $49,999 income range, which is the most common income bracket and makes up 17.3% of all families. Conversely, the $10,000 to $14,999 income bracket is the least frequent group with only 2 families (1.4%) belonging to this category.
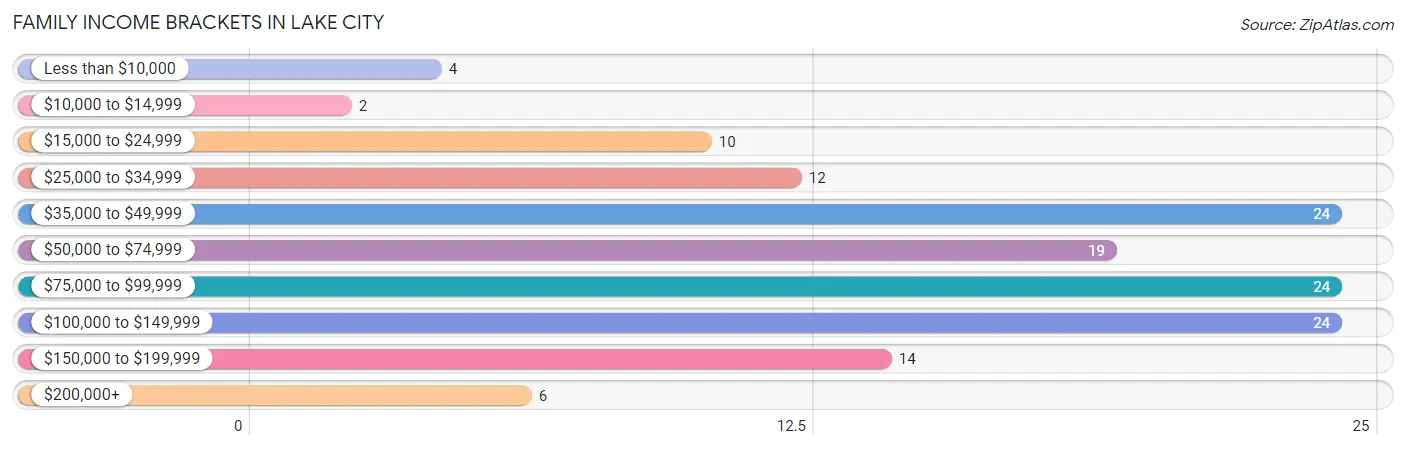
| Income Bracket | # Families | % Families |
| Less than $10,000 | 4 | 2.9% |
| $10,000 to $14,999 | 2 | 1.4% |
| $15,000 to $24,999 | 10 | 7.2% |
| $25,000 to $34,999 | 12 | 8.6% |
| $35,000 to $49,999 | 24 | 17.3% |
| $50,000 to $74,999 | 19 | 13.7% |
| $75,000 to $99,999 | 24 | 17.3% |
| $100,000 to $149,999 | 24 | 17.3% |
| $150,000 to $199,999 | 14 | 10.1% |
| $200,000+ | 6 | 4.3% |
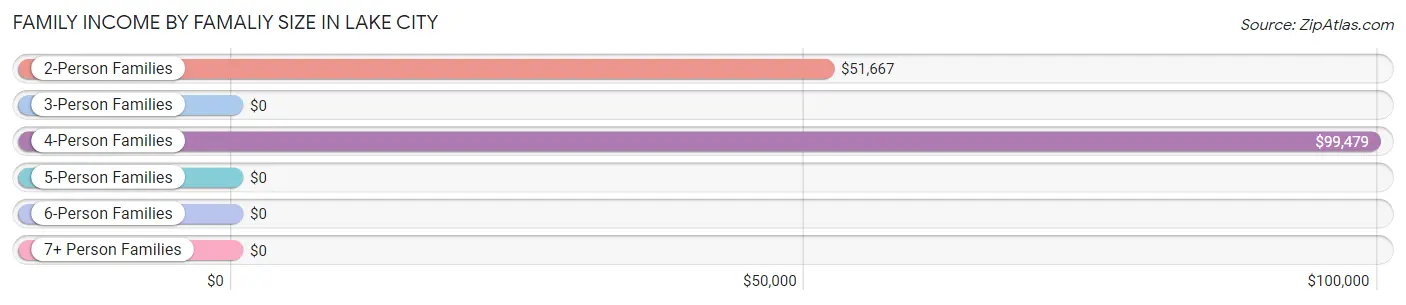
Family Income by Famaliy Size in Lake City
4-person families (27 | 19.4%) account for the highest median family income in Lake City with $99,479 per family, while 2-person families (84 | 60.4%) have the highest median income of $25,834 per family member.
| Income Bracket | # Families | Median Income |
| 2-Person Families | 84 (60.4%) | $51,667 |
| 3-Person Families | 10 (7.2%) | $0 |
| 4-Person Families | 27 (19.4%) | $99,479 |
| 5-Person Families | 9 (6.5%) | $0 |
| 6-Person Families | 7 (5.0%) | $0 |
| 7+ Person Families | 2 (1.4%) | $0 |
| Total | 139 (100.0%) | $73,750 |
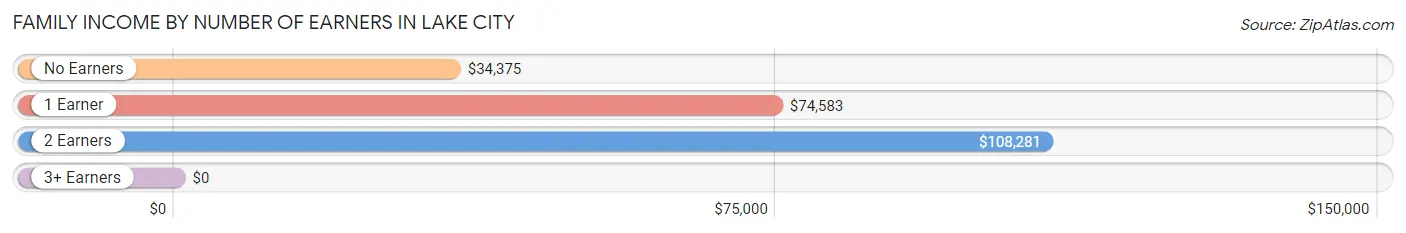
Family Income by Number of Earners in Lake City
| Number of Earners | # Families | Median Income |
| No Earners | 35 (25.2%) | $34,375 |
| 1 Earner | 57 (41.0%) | $74,583 |
| 2 Earners | 39 (28.1%) | $108,281 |
| 3+ Earners | 8 (5.8%) | $0 |
| Total | 139 (100.0%) | $73,750 |
Household Income in Lake City
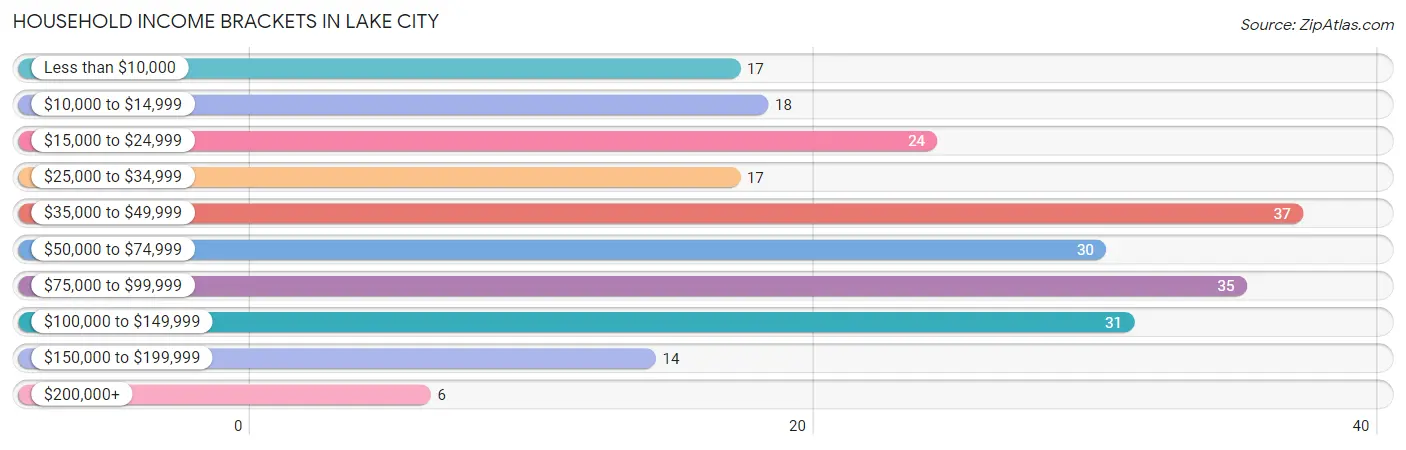
Household Income Brackets in Lake City
With 37 households falling in the category, the $35,000 to $49,999 income range is the most frequent in Lake City, accounting for 16.2% of all households. In contrast, only 6 households (2.6%) fall into the $200,000+ income bracket, making it the least populous group.
| Income Bracket | # Households | % Households |
| Less than $10,000 | 17 | 7.4% |
| $10,000 to $14,999 | 18 | 7.9% |
| $15,000 to $24,999 | 24 | 10.5% |
| $25,000 to $34,999 | 17 | 7.4% |
| $35,000 to $49,999 | 37 | 16.2% |
| $50,000 to $74,999 | 30 | 13.1% |
| $75,000 to $99,999 | 35 | 15.3% |
| $100,000 to $149,999 | 31 | 13.5% |
| $150,000 to $199,999 | 14 | 6.1% |
| $200,000+ | 6 | 2.6% |
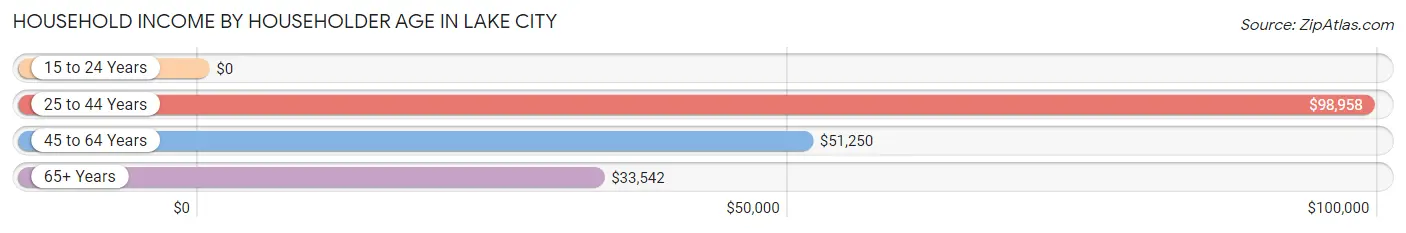
Household Income by Householder Age in Lake City
The median household income in Lake City is $50,625, with the highest median household income of $98,958 found in the 25 to 44 years age bracket for the primary householder. A total of 42 households (18.3%) fall into this category. Meanwhile, the 15 to 24 years age bracket for the primary householder has the lowest median household income of $0, with 9 households (3.9%) in this group.
| Income Bracket | # Households | Median Income |
| 15 to 24 Years | 9 (3.9%) | $0 |
| 25 to 44 Years | 42 (18.3%) | $98,958 |
| 45 to 64 Years | 108 (47.2%) | $51,250 |
| 65+ Years | 70 (30.6%) | $33,542 |
| Total | 229 (100.0%) | $50,625 |
Poverty in Lake City
Income Below Poverty by Sex and Age in Lake City
With 11.4% poverty level for males and 13.6% for females among the residents of Lake City, 12 to 14 year old males and 5 year old females are the most vulnerable to poverty, with 2 males (50.0%) and 3 females (100.0%) in their respective age groups living below the poverty level.
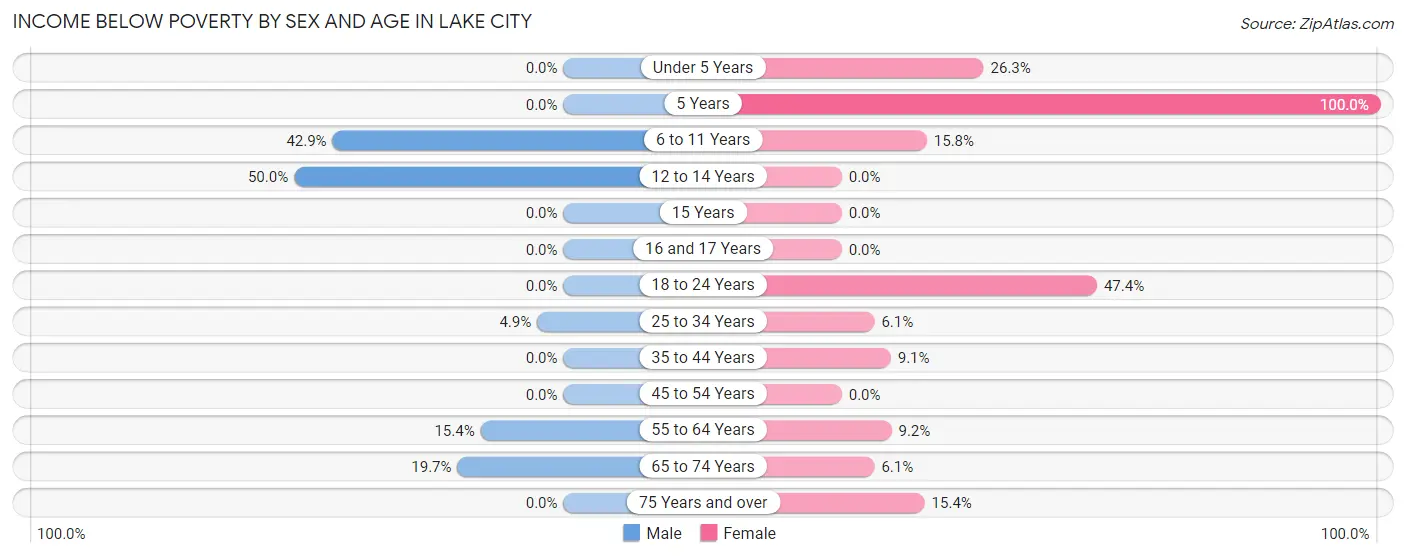
| Age Bracket | Male | Female |
| Under 5 Years | 0 (0.0%) | 5 (26.3%) |
| 5 Years | 0 (0.0%) | 3 (100.0%) |
| 6 to 11 Years | 9 (42.9%) | 3 (15.8%) |
| 12 to 14 Years | 2 (50.0%) | 0 (0.0%) |
| 15 Years | 0 (0.0%) | 0 (0.0%) |
| 16 and 17 Years | 0 (0.0%) | 0 (0.0%) |
| 18 to 24 Years | 0 (0.0%) | 9 (47.4%) |
| 25 to 34 Years | 2 (4.9%) | 2 (6.1%) |
| 35 to 44 Years | 0 (0.0%) | 2 (9.1%) |
| 45 to 54 Years | 0 (0.0%) | 0 (0.0%) |
| 55 to 64 Years | 8 (15.4%) | 6 (9.2%) |
| 65 to 74 Years | 12 (19.7%) | 2 (6.1%) |
| 75 Years and over | 0 (0.0%) | 2 (15.4%) |
| Total | 33 (11.4%) | 34 (13.6%) |
Income Above Poverty by Sex and Age in Lake City
According to the poverty statistics in Lake City, males aged under 5 years and females aged 12 to 14 years are the age groups that are most secure financially, with 100.0% of males and 100.0% of females in these age groups living above the poverty line.
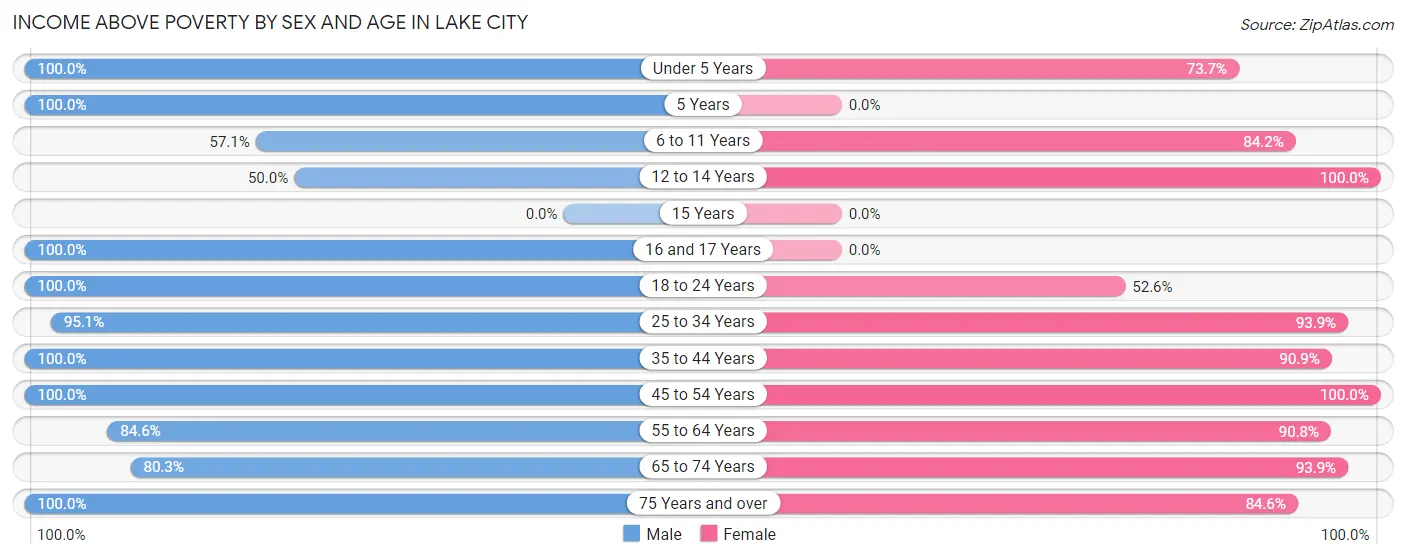
| Age Bracket | Male | Female |
| Under 5 Years | 25 (100.0%) | 14 (73.7%) |
| 5 Years | 2 (100.0%) | 0 (0.0%) |
| 6 to 11 Years | 12 (57.1%) | 16 (84.2%) |
| 12 to 14 Years | 2 (50.0%) | 7 (100.0%) |
| 15 Years | 0 (0.0%) | 0 (0.0%) |
| 16 and 17 Years | 9 (100.0%) | 0 (0.0%) |
| 18 to 24 Years | 16 (100.0%) | 10 (52.6%) |
| 25 to 34 Years | 39 (95.1%) | 31 (93.9%) |
| 35 to 44 Years | 22 (100.0%) | 20 (90.9%) |
| 45 to 54 Years | 34 (100.0%) | 18 (100.0%) |
| 55 to 64 Years | 44 (84.6%) | 59 (90.8%) |
| 65 to 74 Years | 49 (80.3%) | 31 (93.9%) |
| 75 Years and over | 2 (100.0%) | 11 (84.6%) |
| Total | 256 (88.6%) | 217 (86.5%) |
Income Below Poverty Among Married-Couple Families in Lake City
The poverty statistics for married-couple families in Lake City show that 3.4% or 4 of the total 119 families live below the poverty line. Families with 5 or more children have the highest poverty rate of 100.0%, comprising of 2 families. On the other hand, families with 1 or 2 children have the lowest poverty rate of 0.0%, which includes 0 families.
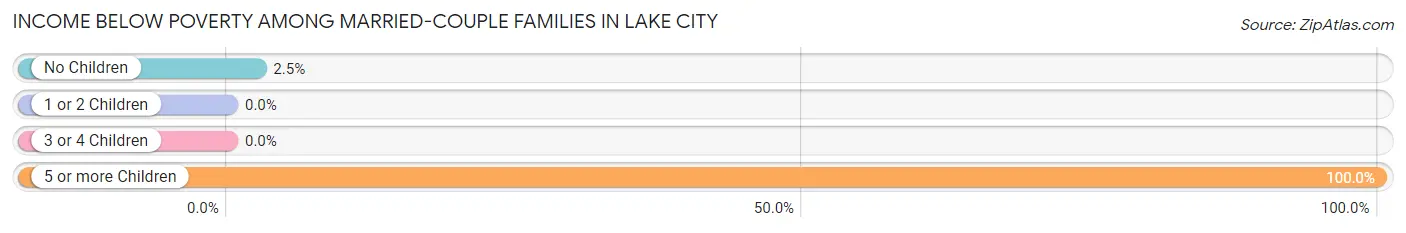
| Children | Above Poverty | Below Poverty |
| No Children | 79 (97.5%) | 2 (2.5%) |
| 1 or 2 Children | 29 (100.0%) | 0 (0.0%) |
| 3 or 4 Children | 7 (100.0%) | 0 (0.0%) |
| 5 or more Children | 0 (0.0%) | 2 (100.0%) |
| Total | 115 (96.6%) | 4 (3.4%) |
Income Below Poverty Among Single-Parent Households in Lake City
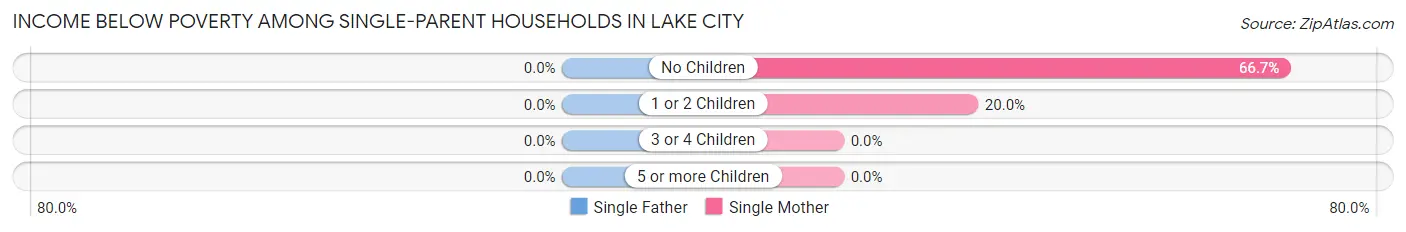
| Children | Single Father | Single Mother |
| No Children | 0 (0.0%) | 2 (66.7%) |
| 1 or 2 Children | 0 (0.0%) | 2 (20.0%) |
| 3 or 4 Children | 0 (0.0%) | 0 (0.0%) |
| 5 or more Children | 0 (0.0%) | 0 (0.0%) |
| Total | 0 (0.0%) | 4 (30.8%) |
Income Below Poverty Among Married-Couple vs Single-Parent Households in Lake City
The poverty data for Lake City shows that 4 of the married-couple family households (3.4%) and 4 of the single-parent households (20.0%) are living below the poverty level. Within the married-couple family households, those with 5 or more children have the highest poverty rate, with 2 households (100.0%) falling below the poverty line. Among the single-parent households, those with no children have the highest poverty rate, with 2 household (20.0%) living below poverty.
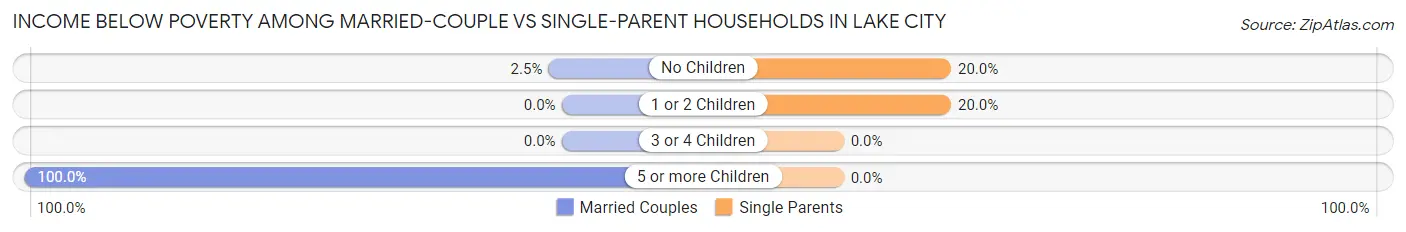
| Children | Married-Couple Families | Single-Parent Households |
| No Children | 2 (2.5%) | 2 (20.0%) |
| 1 or 2 Children | 0 (0.0%) | 2 (20.0%) |
| 3 or 4 Children | 0 (0.0%) | 0 (0.0%) |
| 5 or more Children | 2 (100.0%) | 0 (0.0%) |
| Total | 4 (3.4%) | 4 (20.0%) |
Employment Characteristics in Lake City
Employment by Class of Employer in Lake City
Among the 231 employed individuals in Lake City, private company employees (162 | 70.1%), local government employees (21 | 9.1%), and not-for-profit organizations (15 | 6.5%) make up the most common classes of employment.
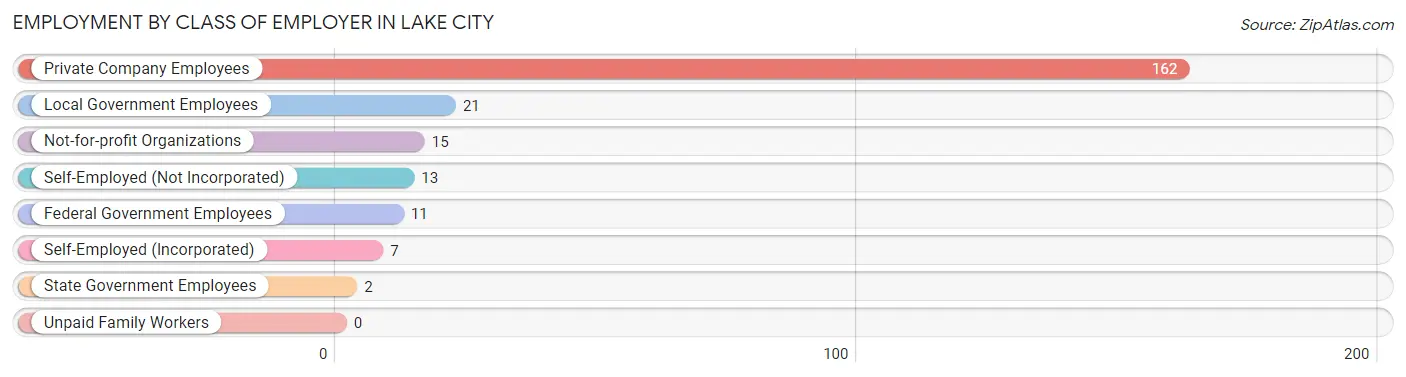
| Employer Class | # Employees | % Employees |
| Private Company Employees | 162 | 70.1% |
| Self-Employed (Incorporated) | 7 | 3.0% |
| Self-Employed (Not Incorporated) | 13 | 5.6% |
| Not-for-profit Organizations | 15 | 6.5% |
| Local Government Employees | 21 | 9.1% |
| State Government Employees | 2 | 0.9% |
| Federal Government Employees | 11 | 4.8% |
| Unpaid Family Workers | 0 | 0.0% |
| Total | 231 | 100.0% |
Employment Status by Age in Lake City
According to the labor force statistics for Lake City, out of the total population over 16 years of age (440), 54.5% or 240 individuals are in the labor force, with 3.8% or 9 of them unemployed. The age group with the highest labor force participation rate is 20 to 24 years, with 100.0% or 25 individuals in the labor force. Within the labor force, the 20 to 24 years age range has the highest percentage of unemployed individuals, with 36.0% or 9 of them being unemployed.
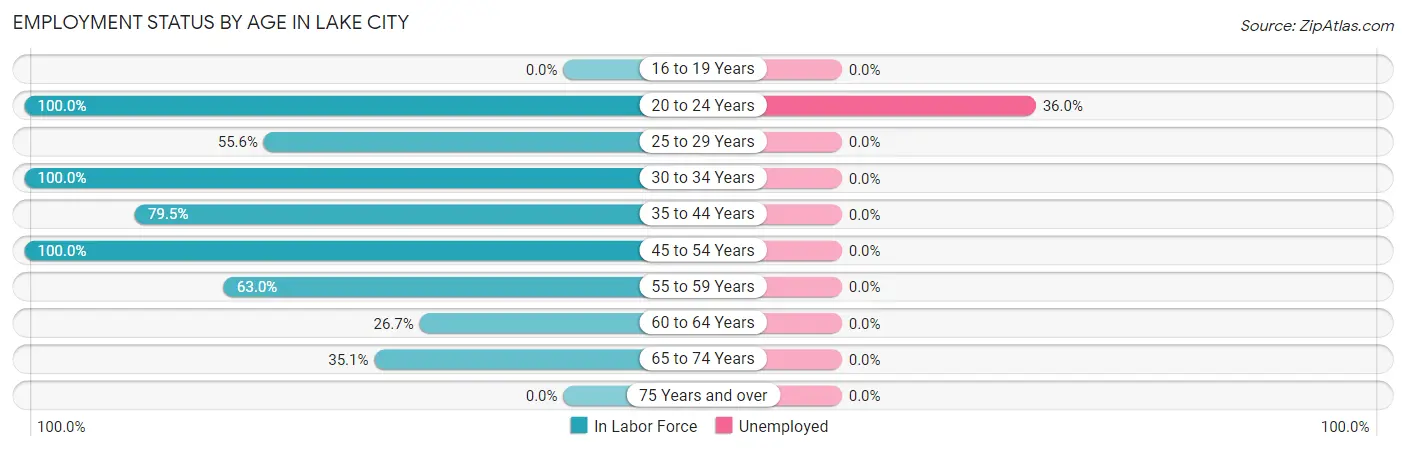
| Age Bracket | In Labor Force | Unemployed |
| 16 to 19 Years | 0 (0.0%) | 0 (0.0%) |
| 20 to 24 Years | 25 (100.0%) | 9 (36.0%) |
| 25 to 29 Years | 25 (55.6%) | 0 (0.0%) |
| 30 to 34 Years | 29 (100.0%) | 0 (0.0%) |
| 35 to 44 Years | 35 (79.5%) | 0 (0.0%) |
| 45 to 54 Years | 52 (100.0%) | 0 (0.0%) |
| 55 to 59 Years | 17 (63.0%) | 0 (0.0%) |
| 60 to 64 Years | 24 (26.7%) | 0 (0.0%) |
| 65 to 74 Years | 33 (35.1%) | 0 (0.0%) |
| 75 Years and over | 0 (0.0%) | 0 (0.0%) |
| Total | 240 (54.5%) | 9 (3.8%) |
Employment Status by Educational Attainment in Lake City
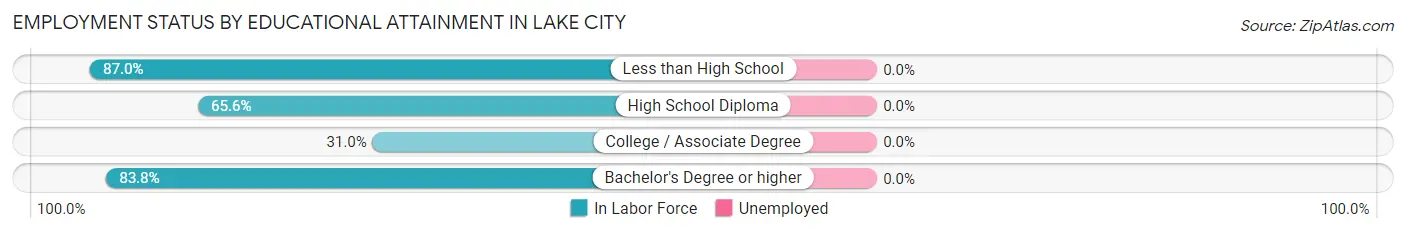
| Educational Attainment | In Labor Force | Unemployed |
| Less than High School | 47 (87.0%) | 0 (0.0%) |
| High School Diploma | 82 (65.6%) | 0 (0.0%) |
| College / Associate Degree | 22 (31.0%) | 0 (0.0%) |
| Bachelor's Degree or higher | 31 (83.8%) | 0 (0.0%) |
| Total | 182 (63.4%) | 0 (0.0%) |
Employment Occupations by Sex in Lake City
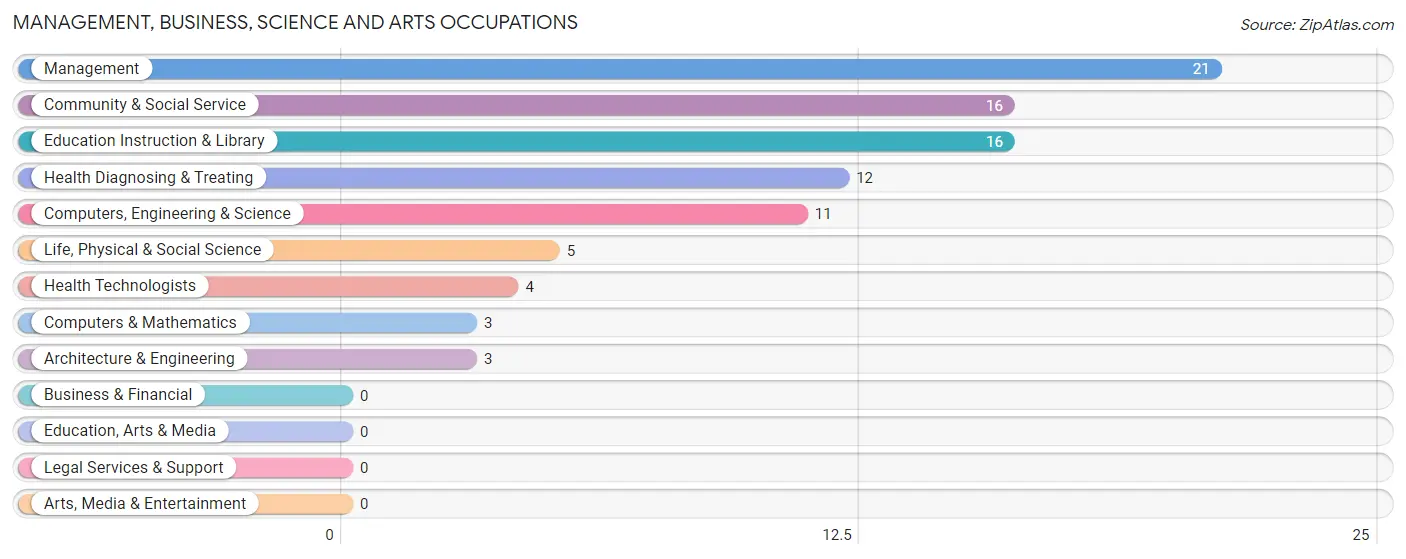
Management, Business, Science and Arts Occupations
The most common Management, Business, Science and Arts occupations in Lake City are Management (21 | 9.1%), Community & Social Service (16 | 6.9%), Education Instruction & Library (16 | 6.9%), Health Diagnosing & Treating (12 | 5.2%), and Computers, Engineering & Science (11 | 4.8%).
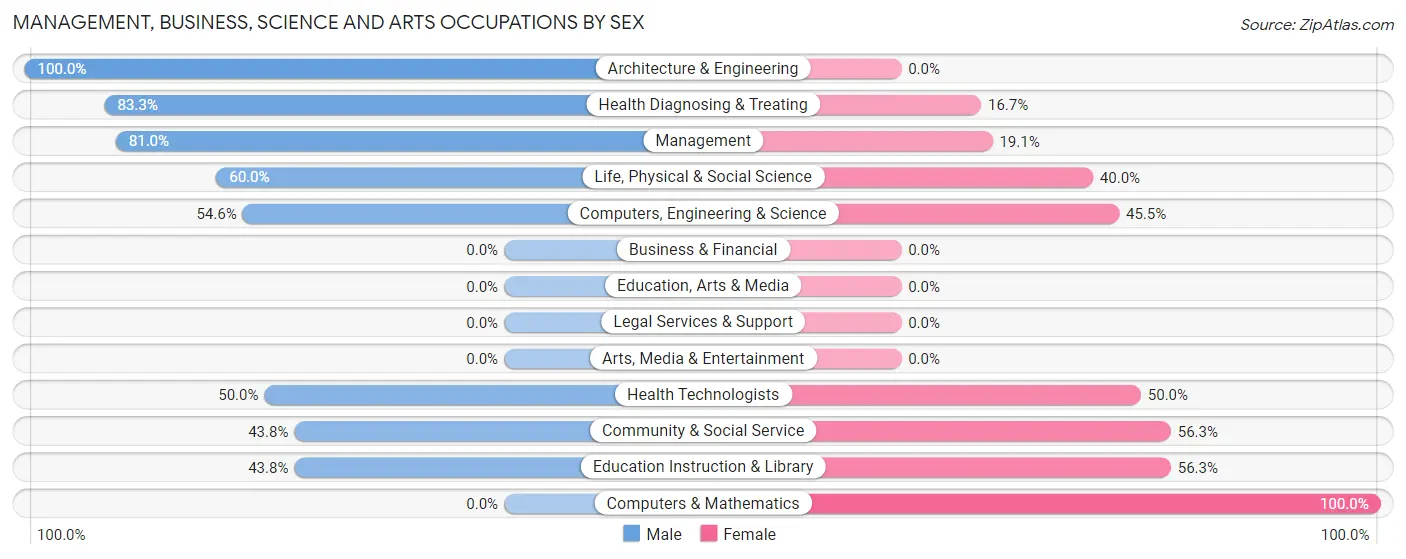
Management, Business, Science and Arts Occupations by Sex
Within the Management, Business, Science and Arts occupations in Lake City, the most male-oriented occupations are Architecture & Engineering (100.0%), Health Diagnosing & Treating (83.3%), and Management (80.9%), while the most female-oriented occupations are Computers & Mathematics (100.0%), Community & Social Service (56.2%), and Education Instruction & Library (56.2%).
| Occupation | Male | Female |
| Management | 17 (80.9%) | 4 (19.1%) |
| Business & Financial | 0 (0.0%) | 0 (0.0%) |
| Computers, Engineering & Science | 6 (54.5%) | 5 (45.5%) |
| Computers & Mathematics | 0 (0.0%) | 3 (100.0%) |
| Architecture & Engineering | 3 (100.0%) | 0 (0.0%) |
| Life, Physical & Social Science | 3 (60.0%) | 2 (40.0%) |
| Community & Social Service | 7 (43.8%) | 9 (56.2%) |
| Education, Arts & Media | 0 (0.0%) | 0 (0.0%) |
| Legal Services & Support | 0 (0.0%) | 0 (0.0%) |
| Education Instruction & Library | 7 (43.8%) | 9 (56.2%) |
| Arts, Media & Entertainment | 0 (0.0%) | 0 (0.0%) |
| Health Diagnosing & Treating | 10 (83.3%) | 2 (16.7%) |
| Health Technologists | 2 (50.0%) | 2 (50.0%) |
| Total (Category) | 40 (66.7%) | 20 (33.3%) |
| Total (Overall) | 157 (68.0%) | 74 (32.0%) |
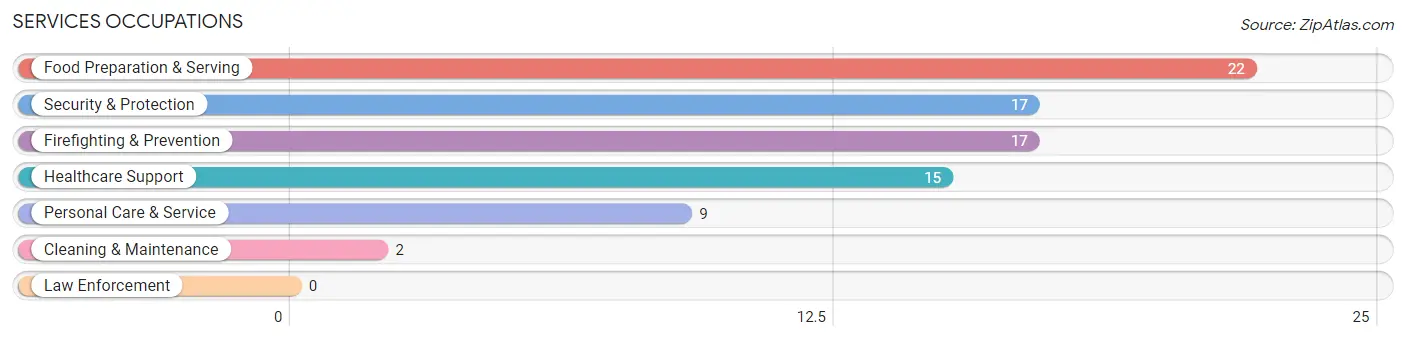
Services Occupations
The most common Services occupations in Lake City are Food Preparation & Serving (22 | 9.5%), Security & Protection (17 | 7.4%), Firefighting & Prevention (17 | 7.4%), Healthcare Support (15 | 6.5%), and Personal Care & Service (9 | 3.9%).
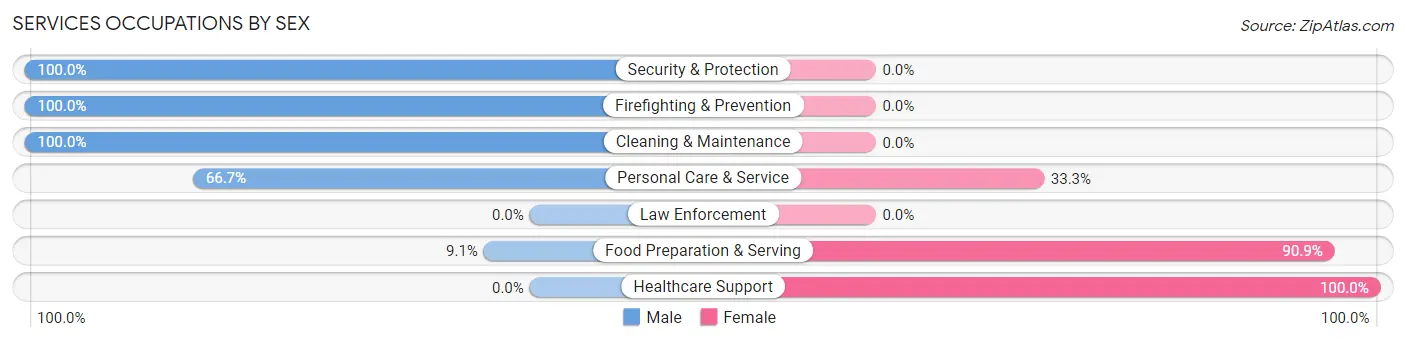
Services Occupations by Sex
Within the Services occupations in Lake City, the most male-oriented occupations are Security & Protection (100.0%), Firefighting & Prevention (100.0%), and Cleaning & Maintenance (100.0%), while the most female-oriented occupations are Healthcare Support (100.0%), Food Preparation & Serving (90.9%), and Personal Care & Service (33.3%).
| Occupation | Male | Female |
| Healthcare Support | 0 (0.0%) | 15 (100.0%) |
| Security & Protection | 17 (100.0%) | 0 (0.0%) |
| Firefighting & Prevention | 17 (100.0%) | 0 (0.0%) |
| Law Enforcement | 0 (0.0%) | 0 (0.0%) |
| Food Preparation & Serving | 2 (9.1%) | 20 (90.9%) |
| Cleaning & Maintenance | 2 (100.0%) | 0 (0.0%) |
| Personal Care & Service | 6 (66.7%) | 3 (33.3%) |
| Total (Category) | 27 (41.5%) | 38 (58.5%) |
| Total (Overall) | 157 (68.0%) | 74 (32.0%) |
Sales and Office Occupations
The most common Sales and Office occupations in Lake City are Sales & Related (18 | 7.8%), and Office & Administration (13 | 5.6%).
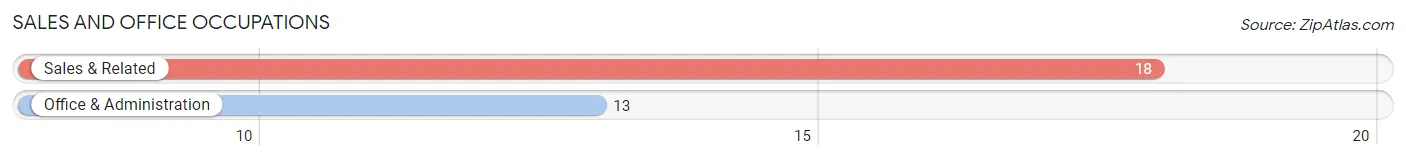
Sales and Office Occupations by Sex

| Occupation | Male | Female |
| Sales & Related | 15 (83.3%) | 3 (16.7%) |
| Office & Administration | 2 (15.4%) | 11 (84.6%) |
| Total (Category) | 17 (54.8%) | 14 (45.2%) |
| Total (Overall) | 157 (68.0%) | 74 (32.0%) |
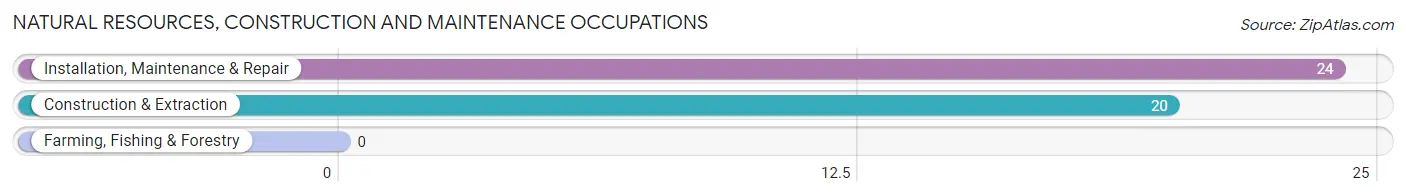
Natural Resources, Construction and Maintenance Occupations
The most common Natural Resources, Construction and Maintenance occupations in Lake City are Installation, Maintenance & Repair (24 | 10.4%), and Construction & Extraction (20 | 8.7%).
Natural Resources, Construction and Maintenance Occupations by Sex
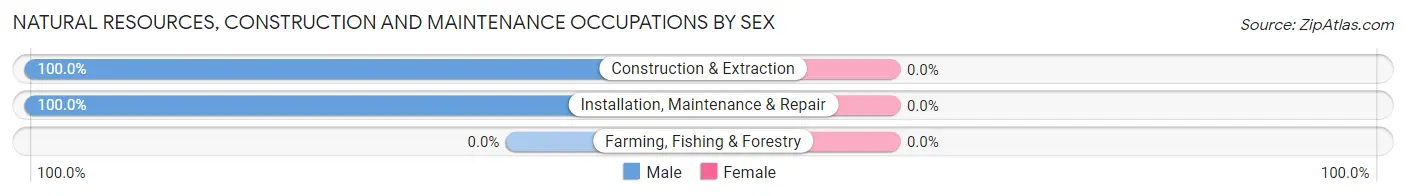
| Occupation | Male | Female |
| Farming, Fishing & Forestry | 0 (0.0%) | 0 (0.0%) |
| Construction & Extraction | 20 (100.0%) | 0 (0.0%) |
| Installation, Maintenance & Repair | 24 (100.0%) | 0 (0.0%) |
| Total (Category) | 44 (100.0%) | 0 (0.0%) |
| Total (Overall) | 157 (68.0%) | 74 (32.0%) |
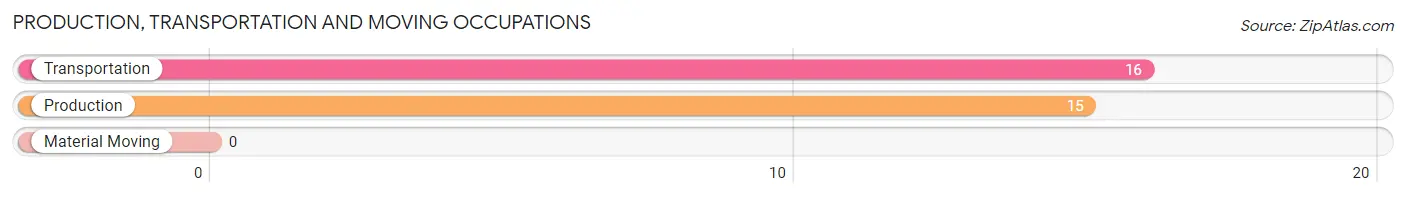
Production, Transportation and Moving Occupations
The most common Production, Transportation and Moving occupations in Lake City are Transportation (16 | 6.9%), and Production (15 | 6.5%).
Production, Transportation and Moving Occupations by Sex
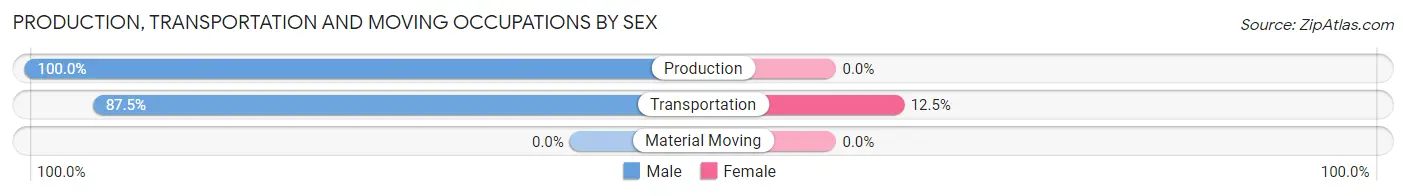
| Occupation | Male | Female |
| Production | 15 (100.0%) | 0 (0.0%) |
| Transportation | 14 (87.5%) | 2 (12.5%) |
| Material Moving | 0 (0.0%) | 0 (0.0%) |
| Total (Category) | 29 (93.5%) | 2 (6.5%) |
| Total (Overall) | 157 (68.0%) | 74 (32.0%) |
Employment Industries by Sex in Lake City
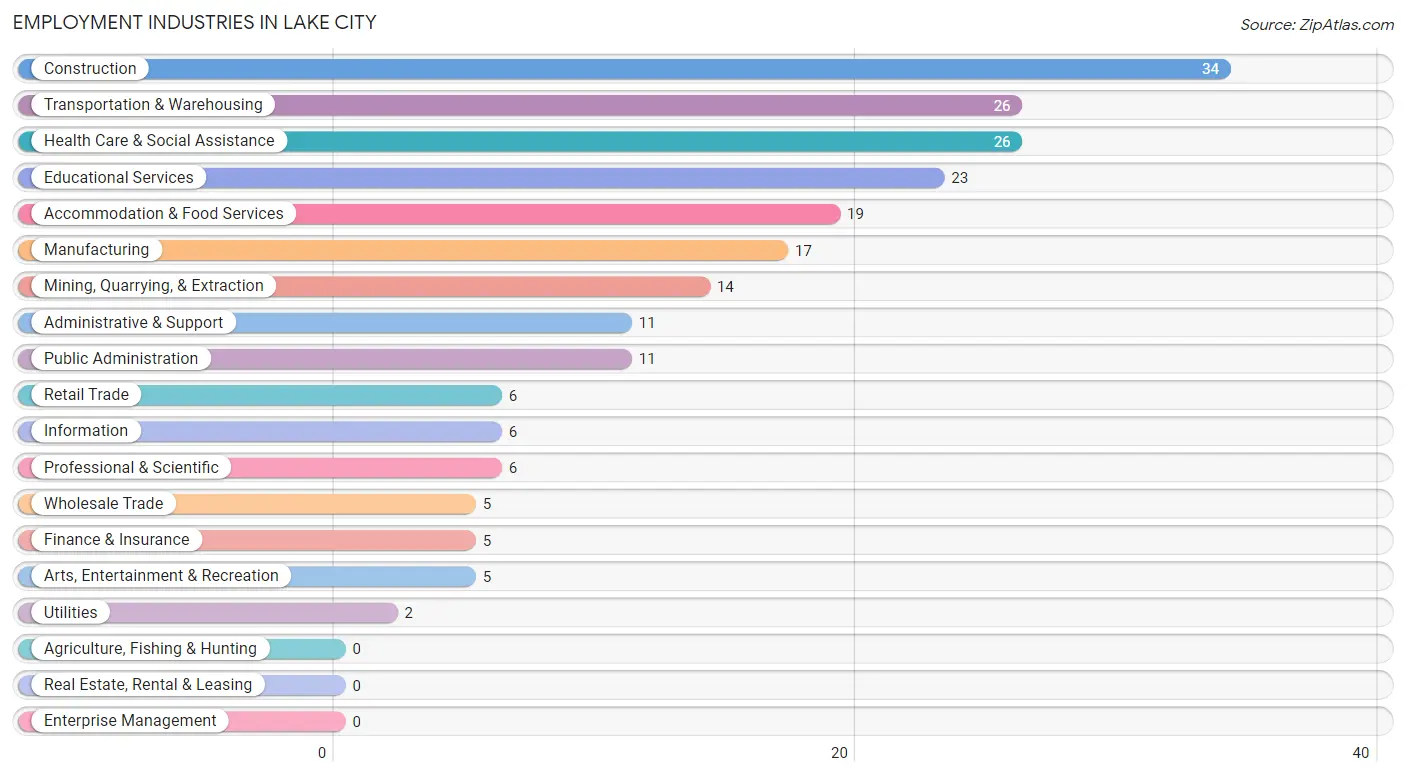
Employment Industries in Lake City
The major employment industries in Lake City include Construction (34 | 14.7%), Transportation & Warehousing (26 | 11.3%), Health Care & Social Assistance (26 | 11.3%), Educational Services (23 | 10.0%), and Accommodation & Food Services (19 | 8.2%).
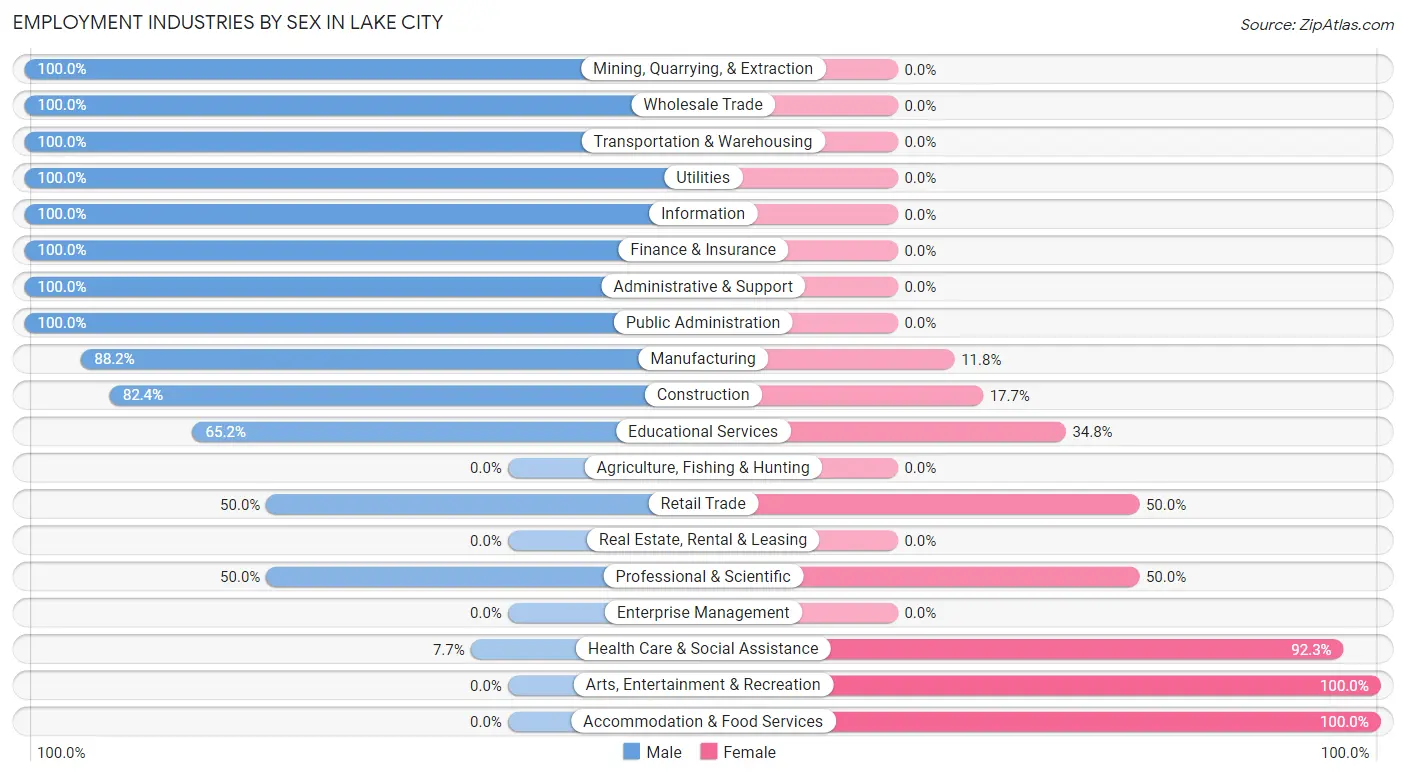
Employment Industries by Sex in Lake City
The Lake City industries that see more men than women are Mining, Quarrying, & Extraction (100.0%), Wholesale Trade (100.0%), and Transportation & Warehousing (100.0%), whereas the industries that tend to have a higher number of women are Arts, Entertainment & Recreation (100.0%), Accommodation & Food Services (100.0%), and Health Care & Social Assistance (92.3%).
| Industry | Male | Female |
| Agriculture, Fishing & Hunting | 0 (0.0%) | 0 (0.0%) |
| Mining, Quarrying, & Extraction | 14 (100.0%) | 0 (0.0%) |
| Construction | 28 (82.4%) | 6 (17.6%) |
| Manufacturing | 15 (88.2%) | 2 (11.8%) |
| Wholesale Trade | 5 (100.0%) | 0 (0.0%) |
| Retail Trade | 3 (50.0%) | 3 (50.0%) |
| Transportation & Warehousing | 26 (100.0%) | 0 (0.0%) |
| Utilities | 2 (100.0%) | 0 (0.0%) |
| Information | 6 (100.0%) | 0 (0.0%) |
| Finance & Insurance | 5 (100.0%) | 0 (0.0%) |
| Real Estate, Rental & Leasing | 0 (0.0%) | 0 (0.0%) |
| Professional & Scientific | 3 (50.0%) | 3 (50.0%) |
| Enterprise Management | 0 (0.0%) | 0 (0.0%) |
| Administrative & Support | 11 (100.0%) | 0 (0.0%) |
| Educational Services | 15 (65.2%) | 8 (34.8%) |
| Health Care & Social Assistance | 2 (7.7%) | 24 (92.3%) |
| Arts, Entertainment & Recreation | 0 (0.0%) | 5 (100.0%) |
| Accommodation & Food Services | 0 (0.0%) | 19 (100.0%) |
| Public Administration | 11 (100.0%) | 0 (0.0%) |
| Total | 157 (68.0%) | 74 (32.0%) |
Education in Lake City
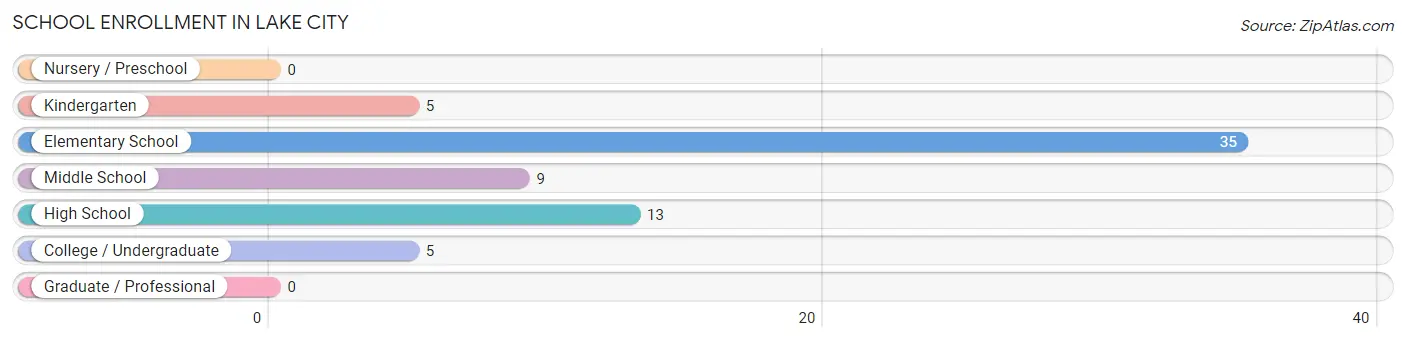
School Enrollment in Lake City
The most common levels of schooling among the 67 students in Lake City are elementary school (35 | 52.2%), high school (13 | 19.4%), and middle school (9 | 13.4%).
| School Level | # Students | % Students |
| Nursery / Preschool | 0 | 0.0% |
| Kindergarten | 5 | 7.5% |
| Elementary School | 35 | 52.2% |
| Middle School | 9 | 13.4% |
| High School | 13 | 19.4% |
| College / Undergraduate | 5 | 7.5% |
| Graduate / Professional | 0 | 0.0% |
| Total | 67 | 100.0% |
School Enrollment by Age by Funding Source in Lake City
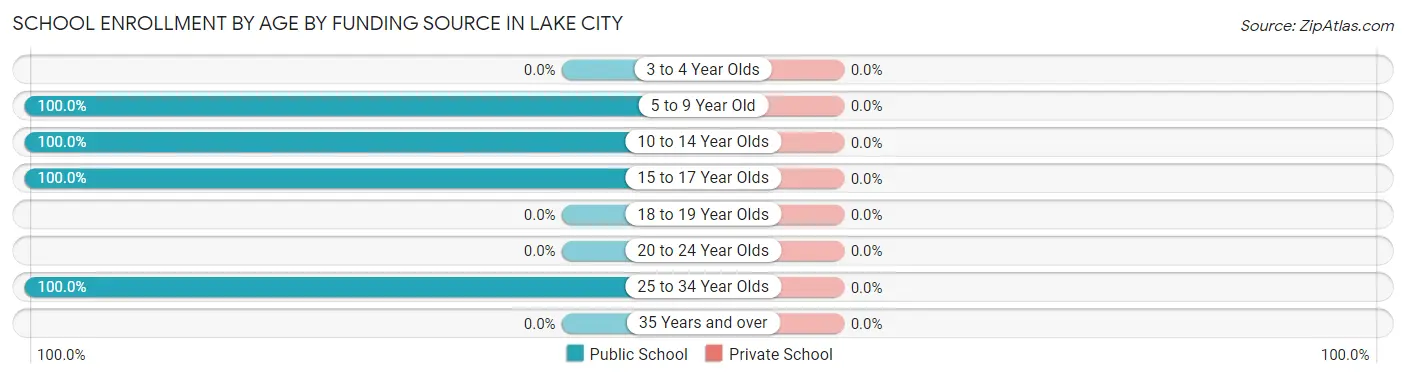
| Age Bracket | Public School | Private School |
| 3 to 4 Year Olds | 0 (0.0%) | 0 (0.0%) |
| 5 to 9 Year Old | 40 (100.0%) | 0 (0.0%) |
| 10 to 14 Year Olds | 16 (100.0%) | 0 (0.0%) |
| 15 to 17 Year Olds | 6 (100.0%) | 0 (0.0%) |
| 18 to 19 Year Olds | 0 (0.0%) | 0 (0.0%) |
| 20 to 24 Year Olds | 0 (0.0%) | 0 (0.0%) |
| 25 to 34 Year Olds | 5 (100.0%) | 0 (0.0%) |
| 35 Years and over | 0 (0.0%) | 0 (0.0%) |
| Total | 67 (100.0%) | 0 (0.0%) |
Educational Attainment by Field of Study in Lake City
Education (19 | 45.2%), science & technology (11 | 26.2%), social sciences (4 | 9.5%), physical & health sciences (2 | 4.8%), and psychology (2 | 4.8%) are the most common fields of study among 42 individuals in Lake City who have obtained a bachelor's degree or higher.
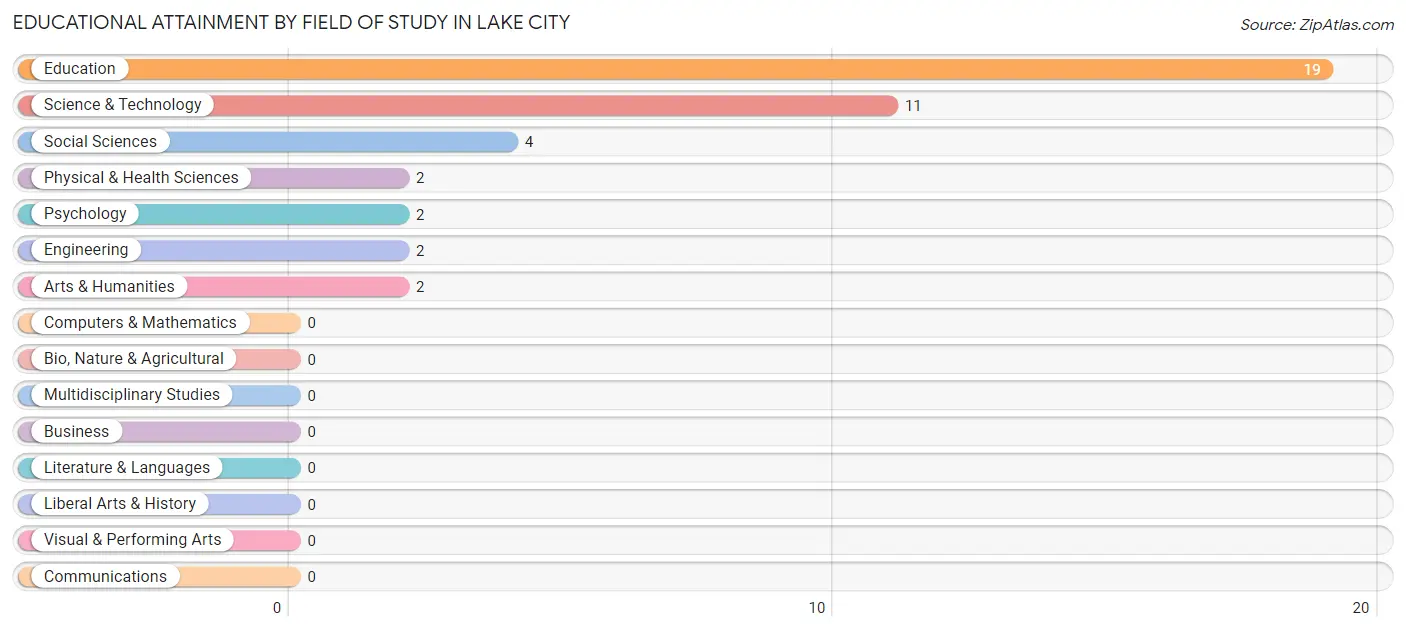
| Field of Study | # Graduates | % Graduates |
| Computers & Mathematics | 0 | 0.0% |
| Bio, Nature & Agricultural | 0 | 0.0% |
| Physical & Health Sciences | 2 | 4.8% |
| Psychology | 2 | 4.8% |
| Social Sciences | 4 | 9.5% |
| Engineering | 2 | 4.8% |
| Multidisciplinary Studies | 0 | 0.0% |
| Science & Technology | 11 | 26.2% |
| Business | 0 | 0.0% |
| Education | 19 | 45.2% |
| Literature & Languages | 0 | 0.0% |
| Liberal Arts & History | 0 | 0.0% |
| Visual & Performing Arts | 0 | 0.0% |
| Communications | 0 | 0.0% |
| Arts & Humanities | 2 | 4.8% |
| Total | 42 | 100.0% |
Transportation & Commute in Lake City
Vehicle Availability by Sex in Lake City
The most prevalent vehicle ownership categories in Lake City are males with 2 vehicles (81, accounting for 51.6%) and females with 2 vehicles (36, making up 109.5%).
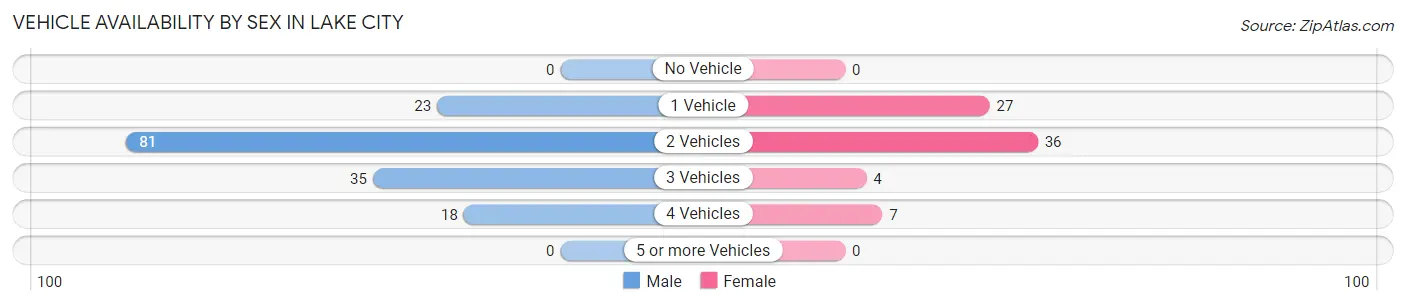
| Vehicles Available | Male | Female |
| No Vehicle | 0 (0.0%) | 0 (0.0%) |
| 1 Vehicle | 23 (14.6%) | 27 (36.5%) |
| 2 Vehicles | 81 (51.6%) | 36 (48.6%) |
| 3 Vehicles | 35 (22.3%) | 4 (5.4%) |
| 4 Vehicles | 18 (11.5%) | 7 (9.5%) |
| 5 or more Vehicles | 0 (0.0%) | 0 (0.0%) |
| Total | 157 (100.0%) | 74 (100.0%) |
Commute Time in Lake City
The most frequently occuring commute durations in Lake City are 10 to 14 minutes (48 commuters, 21.1%), 30 to 34 minutes (43 commuters, 18.9%), and 15 to 19 minutes (42 commuters, 18.5%).
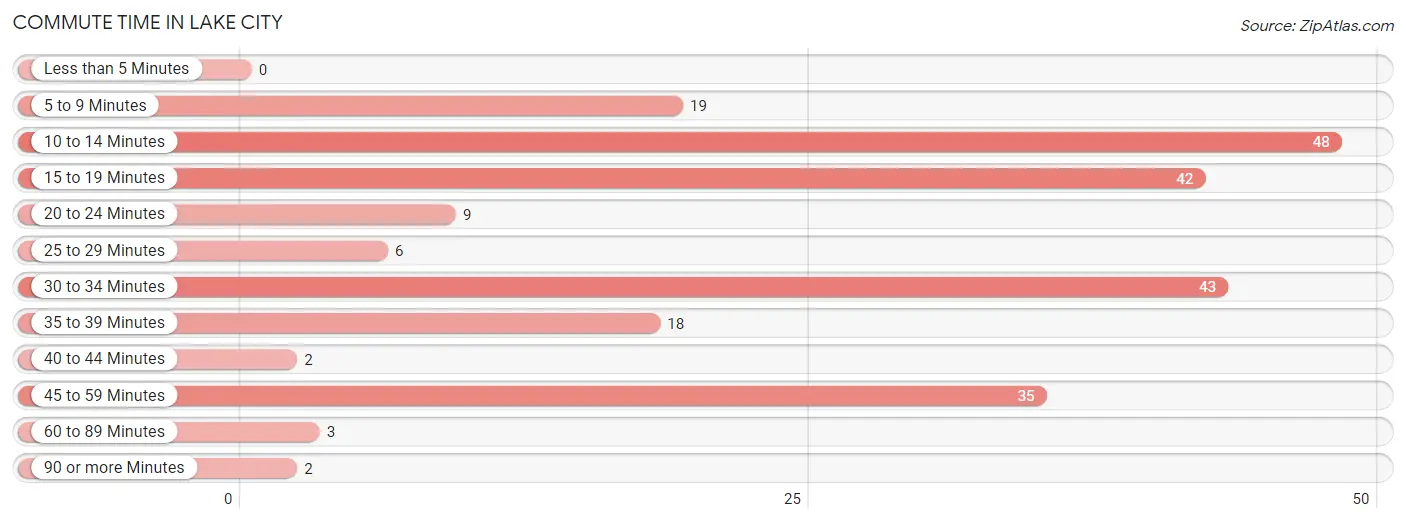
| Commute Time | # Commuters | % Commuters |
| Less than 5 Minutes | 0 | 0.0% |
| 5 to 9 Minutes | 19 | 8.4% |
| 10 to 14 Minutes | 48 | 21.1% |
| 15 to 19 Minutes | 42 | 18.5% |
| 20 to 24 Minutes | 9 | 4.0% |
| 25 to 29 Minutes | 6 | 2.6% |
| 30 to 34 Minutes | 43 | 18.9% |
| 35 to 39 Minutes | 18 | 7.9% |
| 40 to 44 Minutes | 2 | 0.9% |
| 45 to 59 Minutes | 35 | 15.4% |
| 60 to 89 Minutes | 3 | 1.3% |
| 90 or more Minutes | 2 | 0.9% |
Commute Time by Sex in Lake City
The most common commute times in Lake City are 10 to 14 minutes (38 commuters, 24.5%) for males and 15 to 19 minutes (17 commuters, 23.6%) for females.
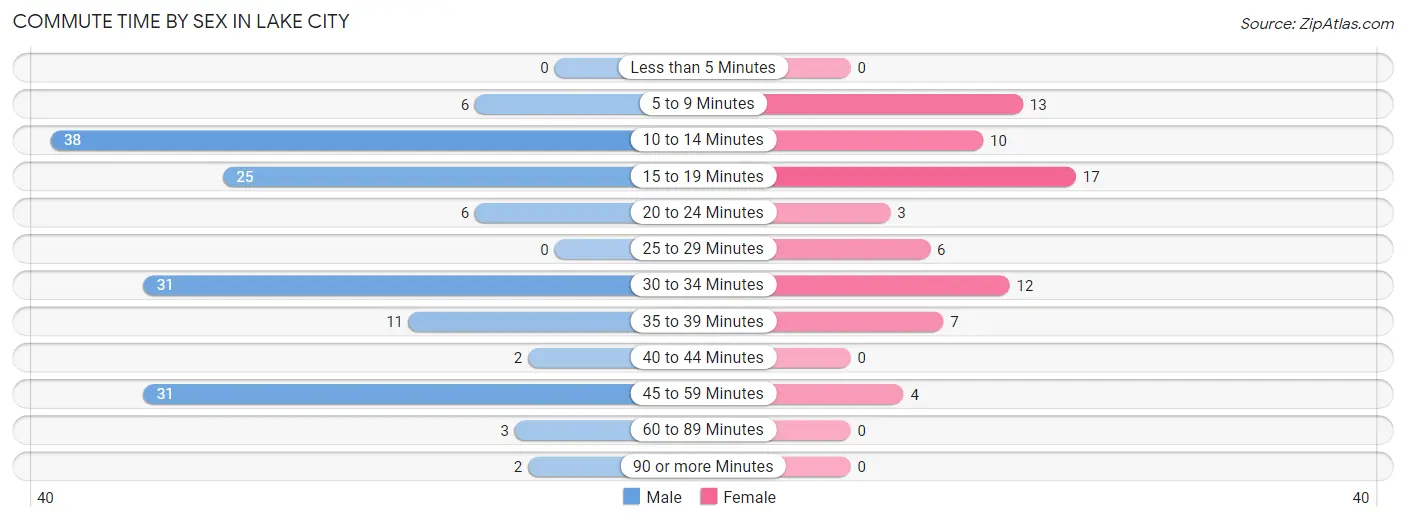
| Commute Time | Male | Female |
| Less than 5 Minutes | 0 (0.0%) | 0 (0.0%) |
| 5 to 9 Minutes | 6 (3.9%) | 13 (18.1%) |
| 10 to 14 Minutes | 38 (24.5%) | 10 (13.9%) |
| 15 to 19 Minutes | 25 (16.1%) | 17 (23.6%) |
| 20 to 24 Minutes | 6 (3.9%) | 3 (4.2%) |
| 25 to 29 Minutes | 0 (0.0%) | 6 (8.3%) |
| 30 to 34 Minutes | 31 (20.0%) | 12 (16.7%) |
| 35 to 39 Minutes | 11 (7.1%) | 7 (9.7%) |
| 40 to 44 Minutes | 2 (1.3%) | 0 (0.0%) |
| 45 to 59 Minutes | 31 (20.0%) | 4 (5.6%) |
| 60 to 89 Minutes | 3 (1.9%) | 0 (0.0%) |
| 90 or more Minutes | 2 (1.3%) | 0 (0.0%) |
Time of Departure to Work by Sex in Lake City
The most frequent times of departure to work in Lake City are 6:00 AM to 6:29 AM (37, 23.9%) for males and 7:30 AM to 7:59 AM (18, 25.0%) for females.
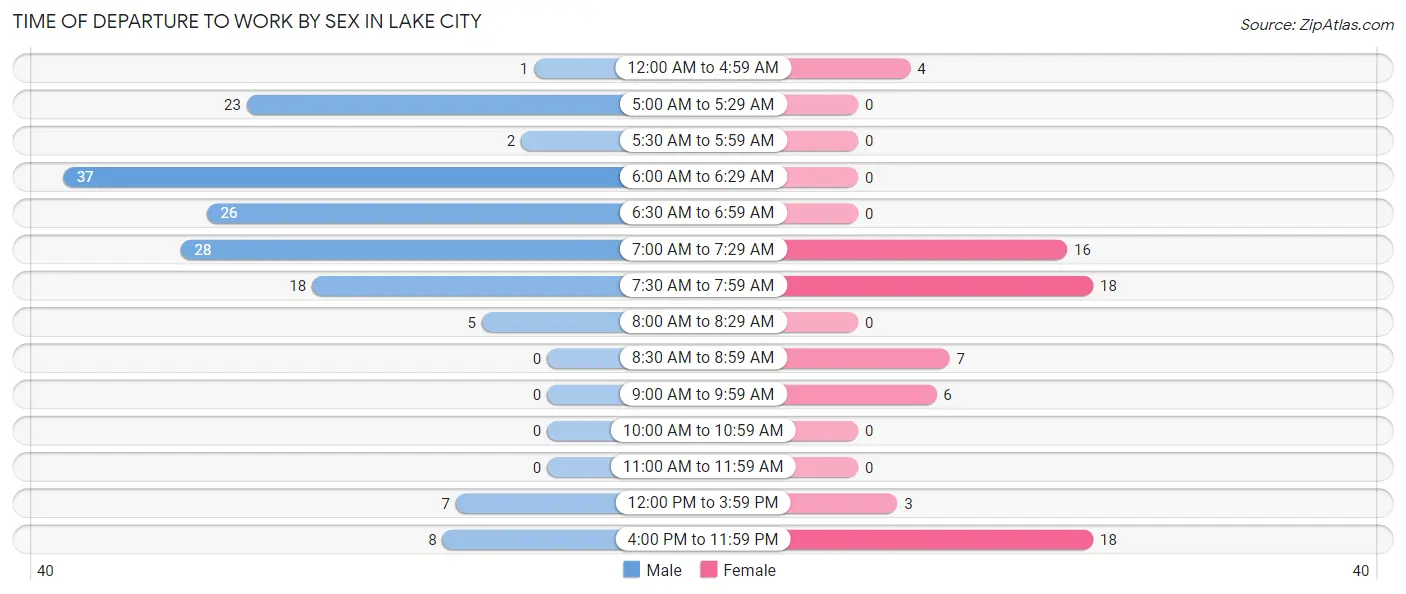
| Time of Departure | Male | Female |
| 12:00 AM to 4:59 AM | 1 (0.6%) | 4 (5.6%) |
| 5:00 AM to 5:29 AM | 23 (14.8%) | 0 (0.0%) |
| 5:30 AM to 5:59 AM | 2 (1.3%) | 0 (0.0%) |
| 6:00 AM to 6:29 AM | 37 (23.9%) | 0 (0.0%) |
| 6:30 AM to 6:59 AM | 26 (16.8%) | 0 (0.0%) |
| 7:00 AM to 7:29 AM | 28 (18.1%) | 16 (22.2%) |
| 7:30 AM to 7:59 AM | 18 (11.6%) | 18 (25.0%) |
| 8:00 AM to 8:29 AM | 5 (3.2%) | 0 (0.0%) |
| 8:30 AM to 8:59 AM | 0 (0.0%) | 7 (9.7%) |
| 9:00 AM to 9:59 AM | 0 (0.0%) | 6 (8.3%) |
| 10:00 AM to 10:59 AM | 0 (0.0%) | 0 (0.0%) |
| 11:00 AM to 11:59 AM | 0 (0.0%) | 0 (0.0%) |
| 12:00 PM to 3:59 PM | 7 (4.5%) | 3 (4.2%) |
| 4:00 PM to 11:59 PM | 8 (5.2%) | 18 (25.0%) |
| Total | 155 (100.0%) | 72 (100.0%) |
Housing Occupancy in Lake City
Occupancy by Ownership in Lake City
Of the total 229 dwellings in Lake City, owner-occupied units account for 198 (86.5%), while renter-occupied units make up 31 (13.5%).
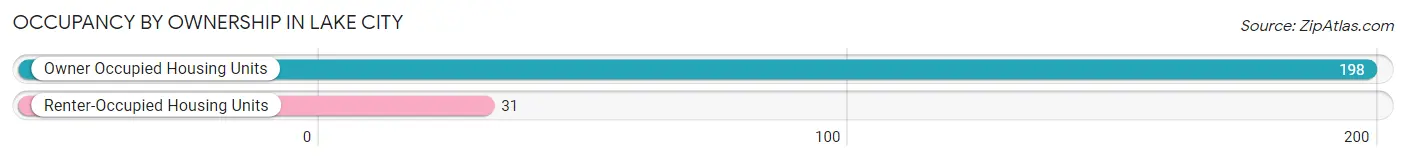
| Occupancy | # Housing Units | % Housing Units |
| Owner Occupied Housing Units | 198 | 86.5% |
| Renter-Occupied Housing Units | 31 | 13.5% |
| Total Occupied Housing Units | 229 | 100.0% |
Occupancy by Household Size in Lake City
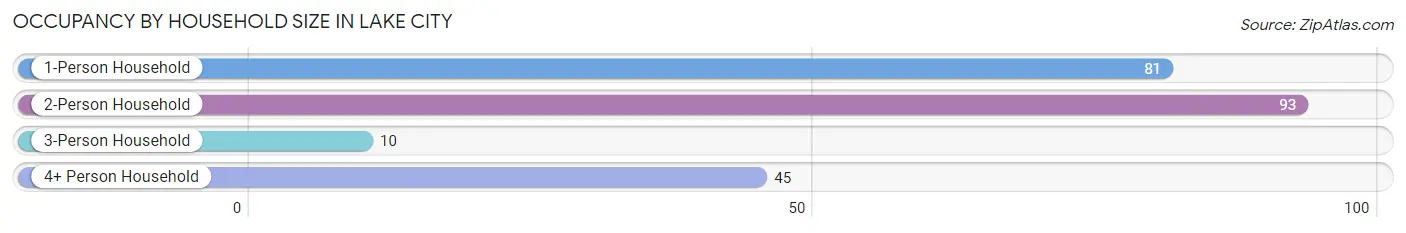
| Household Size | # Housing Units | % Housing Units |
| 1-Person Household | 81 | 35.4% |
| 2-Person Household | 93 | 40.6% |
| 3-Person Household | 10 | 4.4% |
| 4+ Person Household | 45 | 19.7% |
| Total Housing Units | 229 | 100.0% |
Occupancy by Ownership by Household Size in Lake City
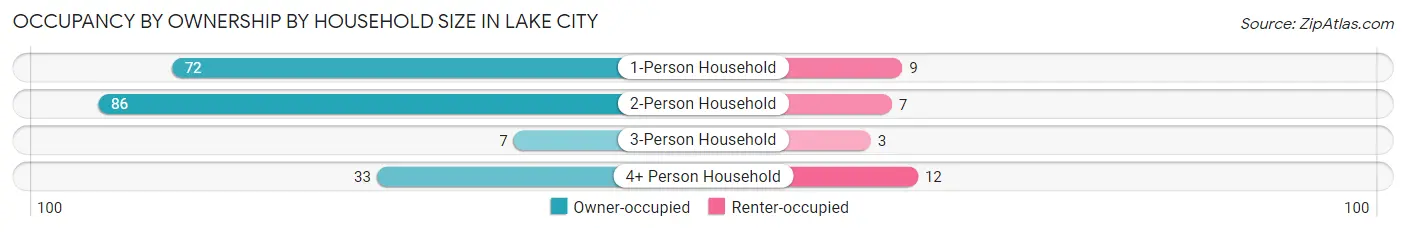
| Household Size | Owner-occupied | Renter-occupied |
| 1-Person Household | 72 (88.9%) | 9 (11.1%) |
| 2-Person Household | 86 (92.5%) | 7 (7.5%) |
| 3-Person Household | 7 (70.0%) | 3 (30.0%) |
| 4+ Person Household | 33 (73.3%) | 12 (26.7%) |
| Total Housing Units | 198 (86.5%) | 31 (13.5%) |
Occupancy by Educational Attainment in Lake City
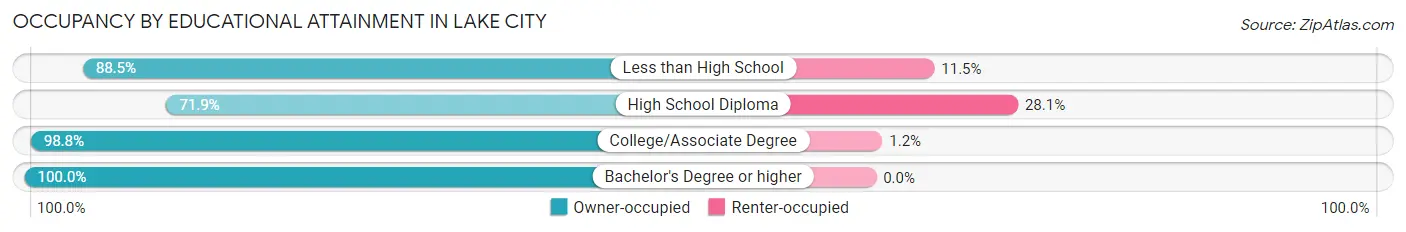
| Household Size | Owner-occupied | Renter-occupied |
| Less than High School | 23 (88.5%) | 3 (11.5%) |
| High School Diploma | 69 (71.9%) | 27 (28.1%) |
| College/Associate Degree | 80 (98.8%) | 1 (1.2%) |
| Bachelor's Degree or higher | 26 (100.0%) | 0 (0.0%) |
Occupancy by Age of Householder in Lake City
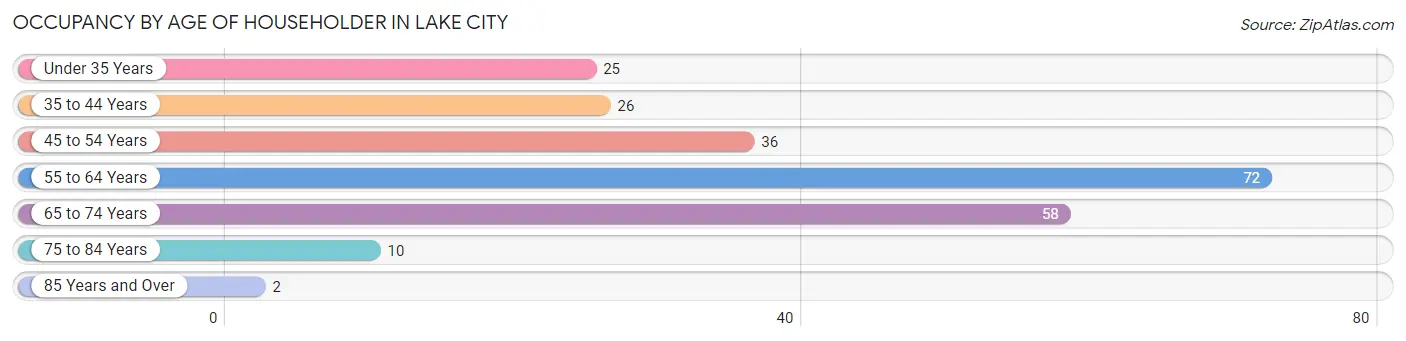
| Age Bracket | # Households | % Households |
| Under 35 Years | 25 | 10.9% |
| 35 to 44 Years | 26 | 11.4% |
| 45 to 54 Years | 36 | 15.7% |
| 55 to 64 Years | 72 | 31.4% |
| 65 to 74 Years | 58 | 25.3% |
| 75 to 84 Years | 10 | 4.4% |
| 85 Years and Over | 2 | 0.9% |
| Total | 229 | 100.0% |
Housing Finances in Lake City
Median Income by Occupancy in Lake City
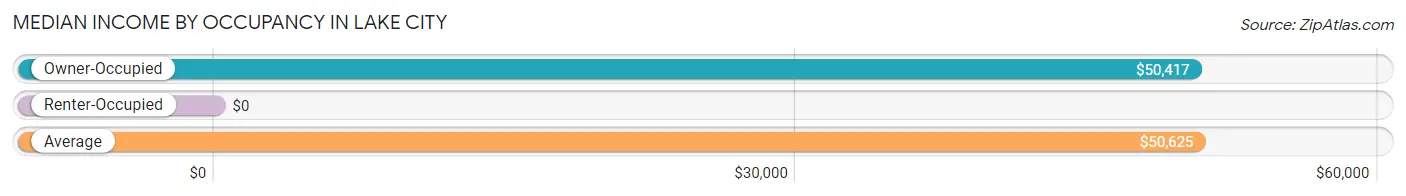
| Occupancy Type | # Households | Median Income |
| Owner-Occupied | 198 (86.5%) | $50,417 |
| Renter-Occupied | 31 (13.5%) | $0 |
| Average | 229 (100.0%) | $50,625 |
Occupancy by Householder Income Bracket in Lake City
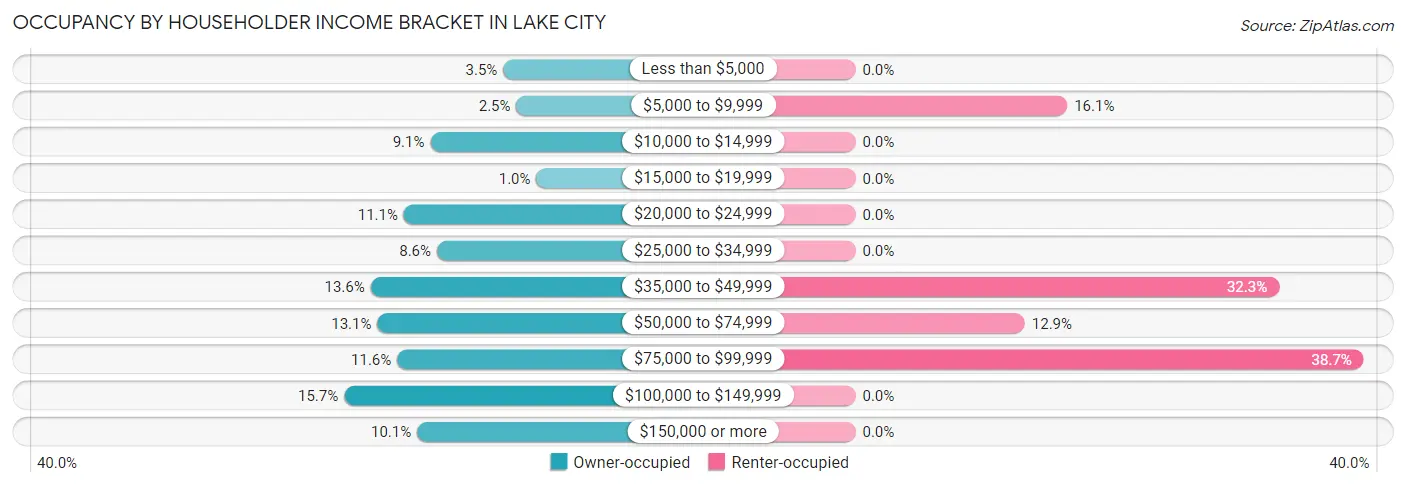
| Income Bracket | Owner-occupied | Renter-occupied |
| Less than $5,000 | 7 (3.5%) | 0 (0.0%) |
| $5,000 to $9,999 | 5 (2.5%) | 5 (16.1%) |
| $10,000 to $14,999 | 18 (9.1%) | 0 (0.0%) |
| $15,000 to $19,999 | 2 (1.0%) | 0 (0.0%) |
| $20,000 to $24,999 | 22 (11.1%) | 0 (0.0%) |
| $25,000 to $34,999 | 17 (8.6%) | 0 (0.0%) |
| $35,000 to $49,999 | 27 (13.6%) | 10 (32.3%) |
| $50,000 to $74,999 | 26 (13.1%) | 4 (12.9%) |
| $75,000 to $99,999 | 23 (11.6%) | 12 (38.7%) |
| $100,000 to $149,999 | 31 (15.7%) | 0 (0.0%) |
| $150,000 or more | 20 (10.1%) | 0 (0.0%) |
| Total | 198 (100.0%) | 31 (100.0%) |
Monthly Housing Cost Tiers in Lake City
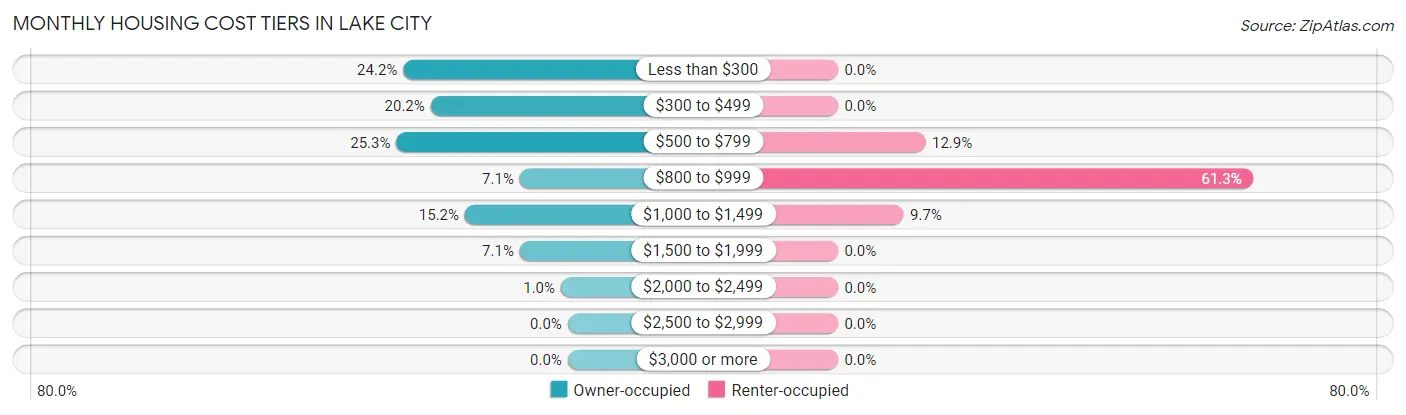
| Monthly Cost | Owner-occupied | Renter-occupied |
| Less than $300 | 48 (24.2%) | 0 (0.0%) |
| $300 to $499 | 40 (20.2%) | 0 (0.0%) |
| $500 to $799 | 50 (25.3%) | 4 (12.9%) |
| $800 to $999 | 14 (7.1%) | 19 (61.3%) |
| $1,000 to $1,499 | 30 (15.1%) | 3 (9.7%) |
| $1,500 to $1,999 | 14 (7.1%) | 0 (0.0%) |
| $2,000 to $2,499 | 2 (1.0%) | 0 (0.0%) |
| $2,500 to $2,999 | 0 (0.0%) | 0 (0.0%) |
| $3,000 or more | 0 (0.0%) | 0 (0.0%) |
| Total | 198 (100.0%) | 31 (100.0%) |
Physical Housing Characteristics in Lake City
Housing Structures in Lake City
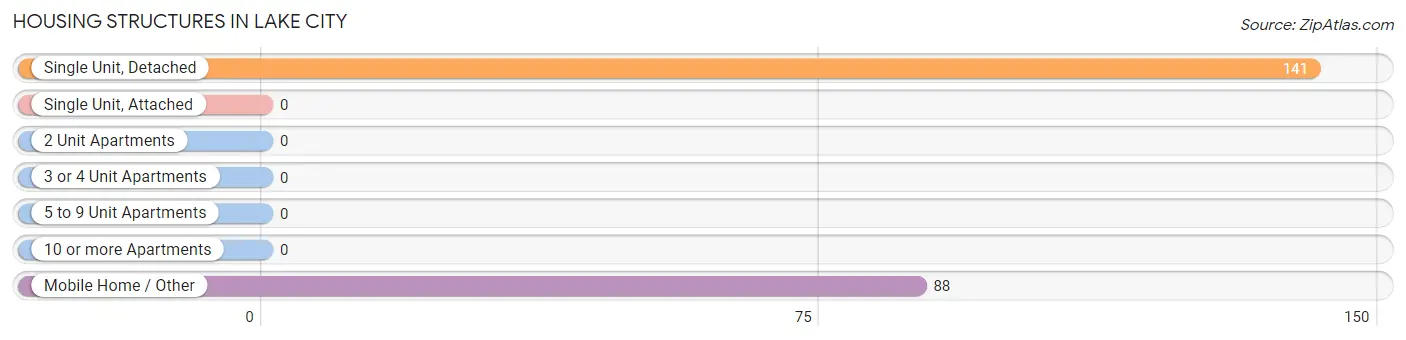
| Structure Type | # Housing Units | % Housing Units |
| Single Unit, Detached | 141 | 61.6% |
| Single Unit, Attached | 0 | 0.0% |
| 2 Unit Apartments | 0 | 0.0% |
| 3 or 4 Unit Apartments | 0 | 0.0% |
| 5 to 9 Unit Apartments | 0 | 0.0% |
| 10 or more Apartments | 0 | 0.0% |
| Mobile Home / Other | 88 | 38.4% |
| Total | 229 | 100.0% |
Housing Structures by Occupancy in Lake City
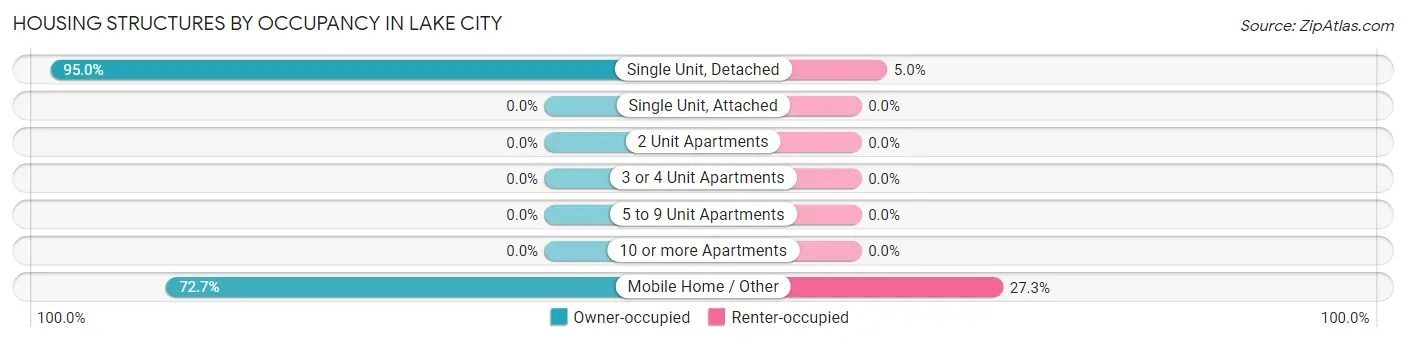
| Structure Type | Owner-occupied | Renter-occupied |
| Single Unit, Detached | 134 (95.0%) | 7 (5.0%) |
| Single Unit, Attached | 0 (0.0%) | 0 (0.0%) |
| 2 Unit Apartments | 0 (0.0%) | 0 (0.0%) |
| 3 or 4 Unit Apartments | 0 (0.0%) | 0 (0.0%) |
| 5 to 9 Unit Apartments | 0 (0.0%) | 0 (0.0%) |
| 10 or more Apartments | 0 (0.0%) | 0 (0.0%) |
| Mobile Home / Other | 64 (72.7%) | 24 (27.3%) |
| Total | 198 (86.5%) | 31 (13.5%) |
Housing Structures by Number of Rooms in Lake City
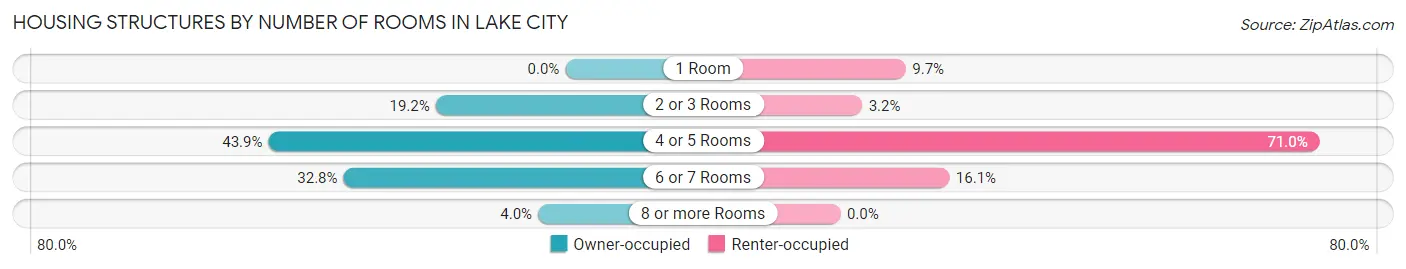
| Number of Rooms | Owner-occupied | Renter-occupied |
| 1 Room | 0 (0.0%) | 3 (9.7%) |
| 2 or 3 Rooms | 38 (19.2%) | 1 (3.2%) |
| 4 or 5 Rooms | 87 (43.9%) | 22 (71.0%) |
| 6 or 7 Rooms | 65 (32.8%) | 5 (16.1%) |
| 8 or more Rooms | 8 (4.0%) | 0 (0.0%) |
| Total | 198 (100.0%) | 31 (100.0%) |
Housing Structure by Heating Type in Lake City
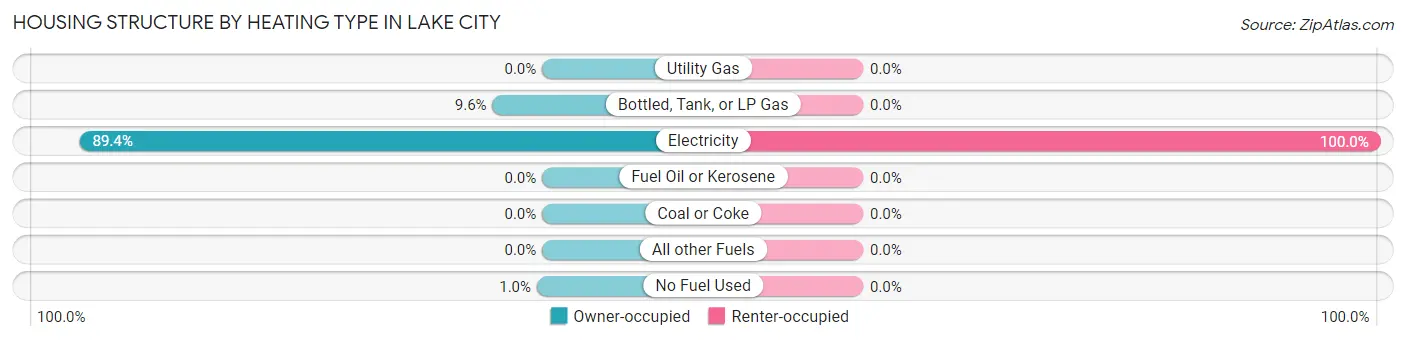
| Heating Type | Owner-occupied | Renter-occupied |
| Utility Gas | 0 (0.0%) | 0 (0.0%) |
| Bottled, Tank, or LP Gas | 19 (9.6%) | 0 (0.0%) |
| Electricity | 177 (89.4%) | 31 (100.0%) |
| Fuel Oil or Kerosene | 0 (0.0%) | 0 (0.0%) |
| Coal or Coke | 0 (0.0%) | 0 (0.0%) |
| All other Fuels | 0 (0.0%) | 0 (0.0%) |
| No Fuel Used | 2 (1.0%) | 0 (0.0%) |
| Total | 198 (100.0%) | 31 (100.0%) |
Household Vehicle Usage in Lake City
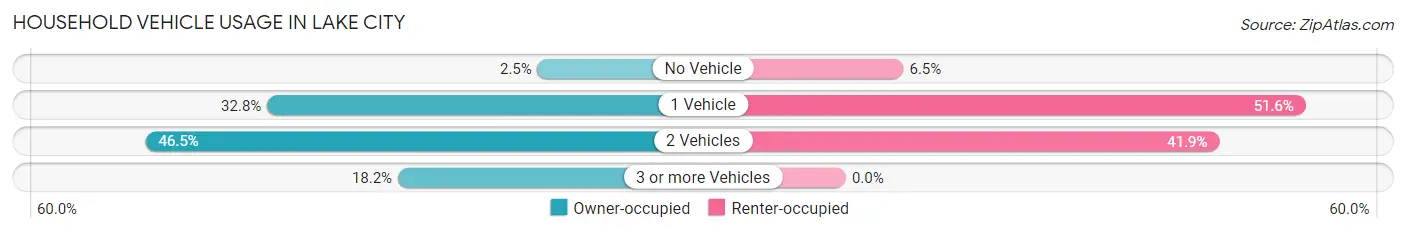
| Vehicles per Household | Owner-occupied | Renter-occupied |
| No Vehicle | 5 (2.5%) | 2 (6.5%) |
| 1 Vehicle | 65 (32.8%) | 16 (51.6%) |
| 2 Vehicles | 92 (46.5%) | 13 (41.9%) |
| 3 or more Vehicles | 36 (18.2%) | 0 (0.0%) |
| Total | 198 (100.0%) | 31 (100.0%) |
Real Estate & Mortgages in Lake City
Real Estate and Mortgage Overview in Lake City
| Characteristic | Without Mortgage | With Mortgage |
| Housing Units | 142 | 56 |
| Median Property Value | $74,000 | $130,000 |
| Median Household Income | $41,250 | $14 |
| Monthly Housing Costs | $384 | $0 |
| Real Estate Taxes | $1,070 | $7 |
Property Value by Mortgage Status in Lake City
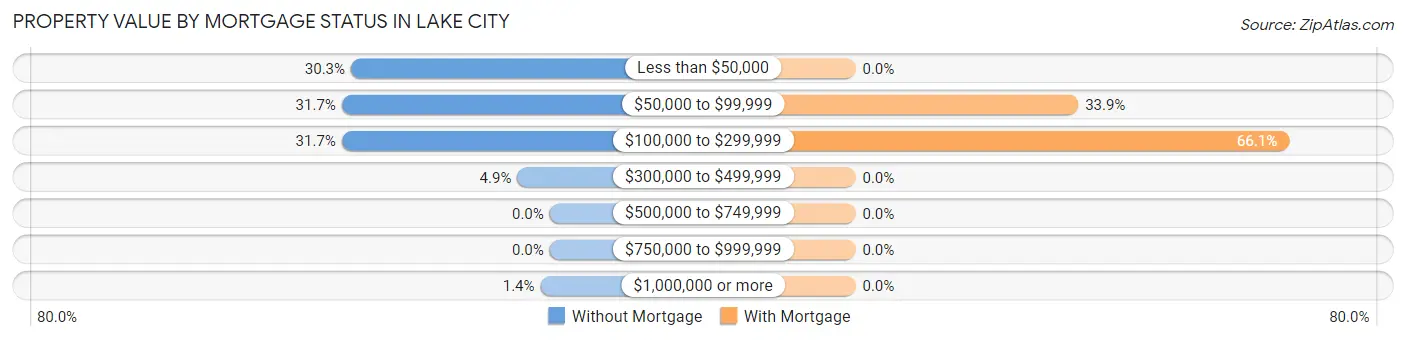
| Property Value | Without Mortgage | With Mortgage |
| Less than $50,000 | 43 (30.3%) | 0 (0.0%) |
| $50,000 to $99,999 | 45 (31.7%) | 19 (33.9%) |
| $100,000 to $299,999 | 45 (31.7%) | 37 (66.1%) |
| $300,000 to $499,999 | 7 (4.9%) | 0 (0.0%) |
| $500,000 to $749,999 | 0 (0.0%) | 0 (0.0%) |
| $750,000 to $999,999 | 0 (0.0%) | 0 (0.0%) |
| $1,000,000 or more | 2 (1.4%) | 0 (0.0%) |
| Total | 142 (100.0%) | 56 (100.0%) |
Household Income by Mortgage Status in Lake City
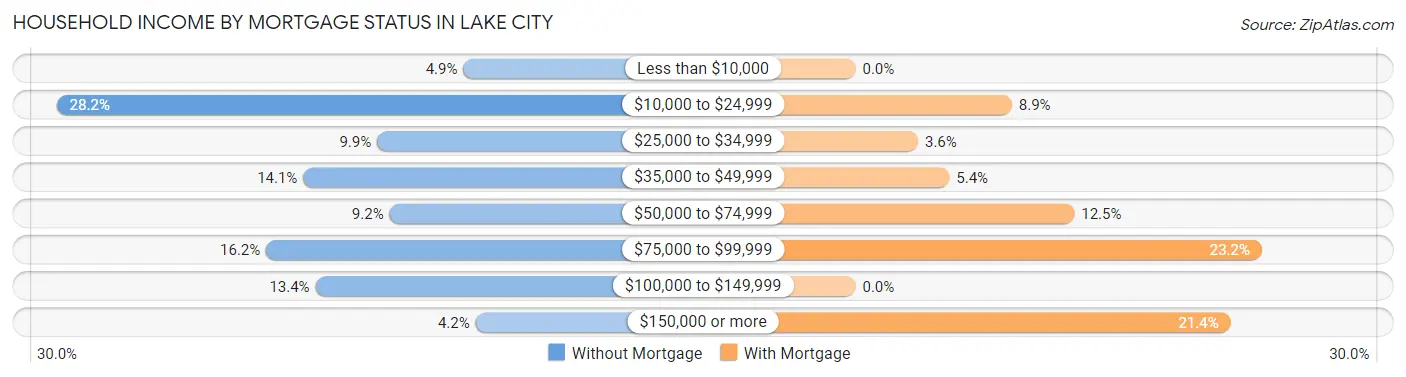
| Household Income | Without Mortgage | With Mortgage |
| Less than $10,000 | 7 (4.9%) | 0 (0.0%) |
| $10,000 to $24,999 | 40 (28.2%) | 5 (8.9%) |
| $25,000 to $34,999 | 14 (9.9%) | 2 (3.6%) |
| $35,000 to $49,999 | 20 (14.1%) | 3 (5.4%) |
| $50,000 to $74,999 | 13 (9.1%) | 7 (12.5%) |
| $75,000 to $99,999 | 23 (16.2%) | 13 (23.2%) |
| $100,000 to $149,999 | 19 (13.4%) | 0 (0.0%) |
| $150,000 or more | 6 (4.2%) | 12 (21.4%) |
| Total | 142 (100.0%) | 56 (100.0%) |
Property Value to Household Income Ratio in Lake City
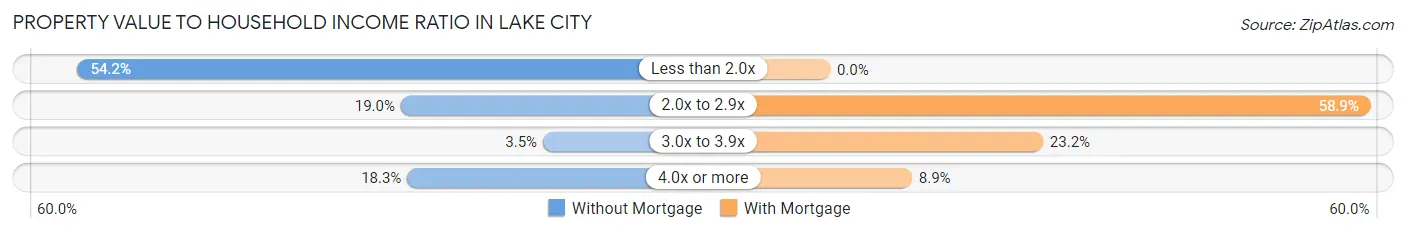
| Value-to-Income Ratio | Without Mortgage | With Mortgage |
| Less than 2.0x | 77 (54.2%) | 0 (0.0%) |
| 2.0x to 2.9x | 27 (19.0%) | 33 (58.9%) |
| 3.0x to 3.9x | 5 (3.5%) | 13 (23.2%) |
| 4.0x or more | 26 (18.3%) | 5 (8.9%) |
| Total | 142 (100.0%) | 56 (100.0%) |
Real Estate Taxes by Mortgage Status in Lake City
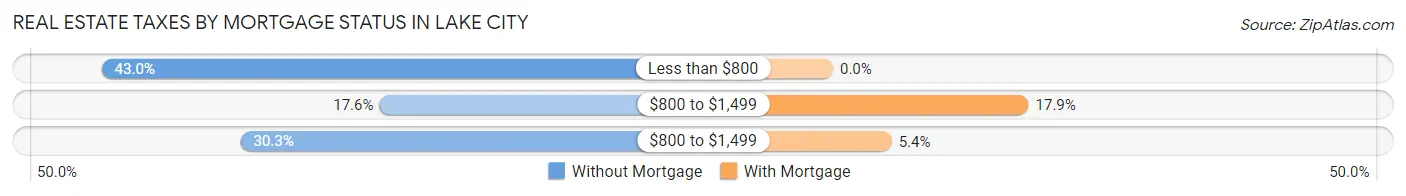
| Property Taxes | Without Mortgage | With Mortgage |
| Less than $800 | 61 (43.0%) | 0 (0.0%) |
| $800 to $1,499 | 25 (17.6%) | 10 (17.9%) |
| $800 to $1,499 | 43 (30.3%) | 3 (5.4%) |
| Total | 142 (100.0%) | 56 (100.0%) |
Health & Disability in Lake City
Health Insurance Coverage by Age in Lake City
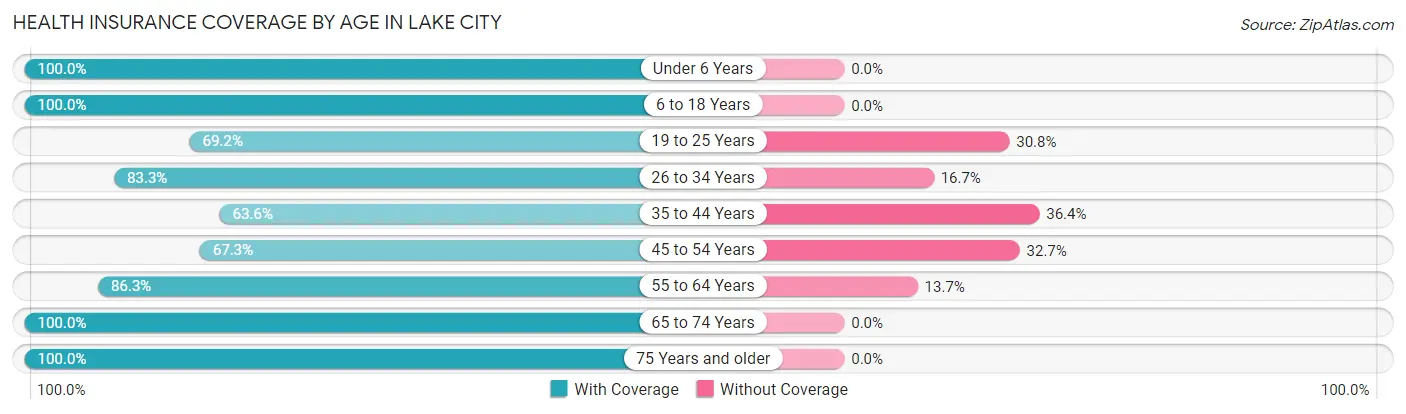
| Age Bracket | With Coverage | Without Coverage |
| Under 6 Years | 49 (100.0%) | 0 (0.0%) |
| 6 to 18 Years | 70 (100.0%) | 0 (0.0%) |
| 19 to 25 Years | 27 (69.2%) | 12 (30.8%) |
| 26 to 34 Years | 50 (83.3%) | 10 (16.7%) |
| 35 to 44 Years | 28 (63.6%) | 16 (36.4%) |
| 45 to 54 Years | 35 (67.3%) | 17 (32.7%) |
| 55 to 64 Years | 101 (86.3%) | 16 (13.7%) |
| 65 to 74 Years | 94 (100.0%) | 0 (0.0%) |
| 75 Years and older | 15 (100.0%) | 0 (0.0%) |
| Total | 469 (86.9%) | 71 (13.2%) |
Health Insurance Coverage by Citizenship Status in Lake City
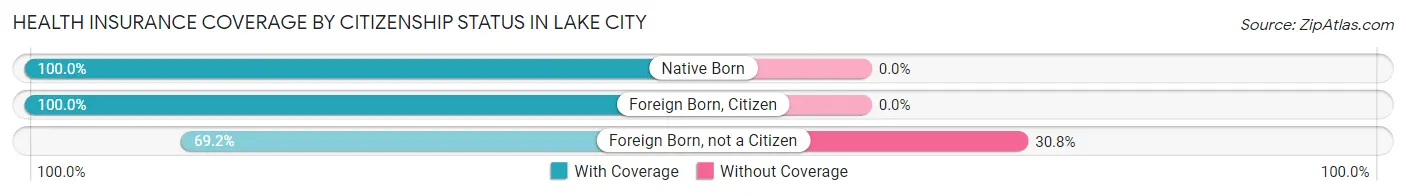
| Citizenship Status | With Coverage | Without Coverage |
| Native Born | 49 (100.0%) | 0 (0.0%) |
| Foreign Born, Citizen | 70 (100.0%) | 0 (0.0%) |
| Foreign Born, not a Citizen | 27 (69.2%) | 12 (30.8%) |
Health Insurance Coverage by Household Income in Lake City
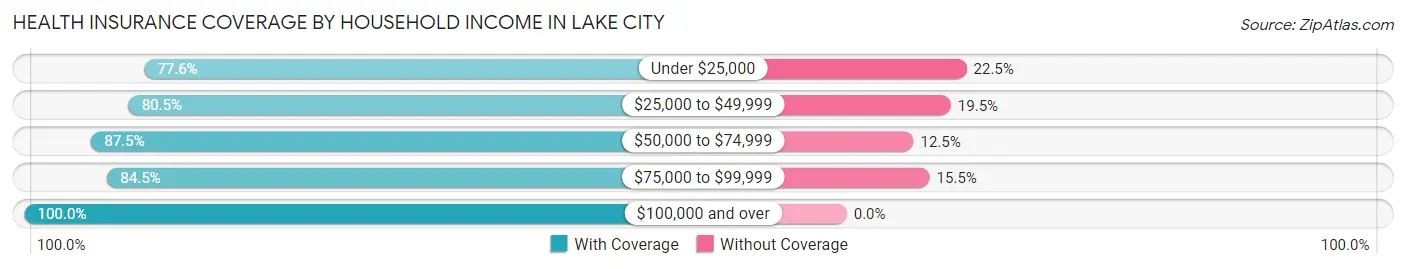
| Household Income | With Coverage | Without Coverage |
| Under $25,000 | 76 (77.5%) | 22 (22.5%) |
| $25,000 to $49,999 | 99 (80.5%) | 24 (19.5%) |
| $50,000 to $74,999 | 49 (87.5%) | 7 (12.5%) |
| $75,000 to $99,999 | 98 (84.5%) | 18 (15.5%) |
| $100,000 and over | 147 (100.0%) | 0 (0.0%) |
Public vs Private Health Insurance Coverage by Age in Lake City
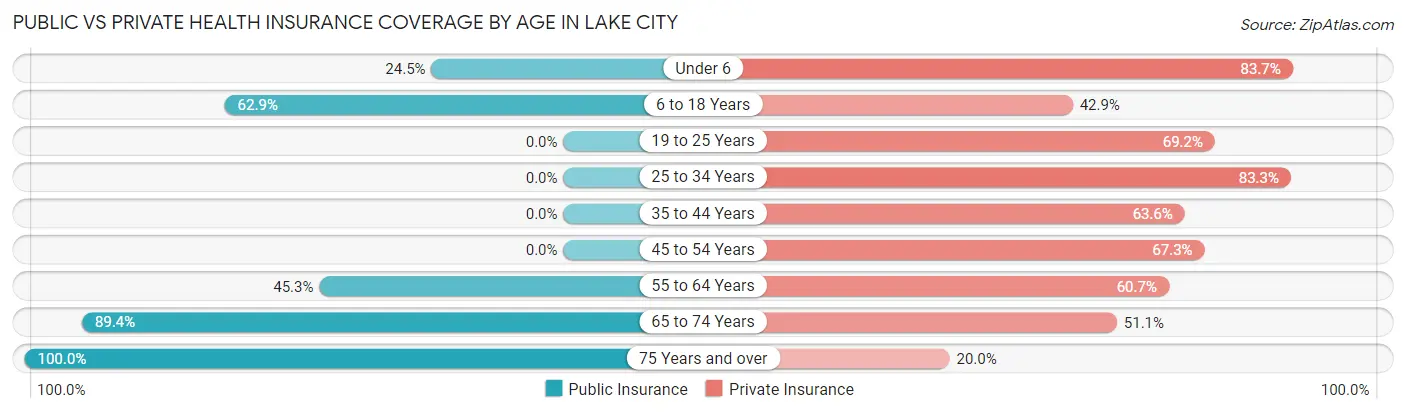
| Age Bracket | Public Insurance | Private Insurance |
| Under 6 | 12 (24.5%) | 41 (83.7%) |
| 6 to 18 Years | 44 (62.9%) | 30 (42.9%) |
| 19 to 25 Years | 0 (0.0%) | 27 (69.2%) |
| 25 to 34 Years | 0 (0.0%) | 50 (83.3%) |
| 35 to 44 Years | 0 (0.0%) | 28 (63.6%) |
| 45 to 54 Years | 0 (0.0%) | 35 (67.3%) |
| 55 to 64 Years | 53 (45.3%) | 71 (60.7%) |
| 65 to 74 Years | 84 (89.4%) | 48 (51.1%) |
| 75 Years and over | 15 (100.0%) | 3 (20.0%) |
| Total | 208 (38.5%) | 333 (61.7%) |
Disability Status by Sex by Age in Lake City
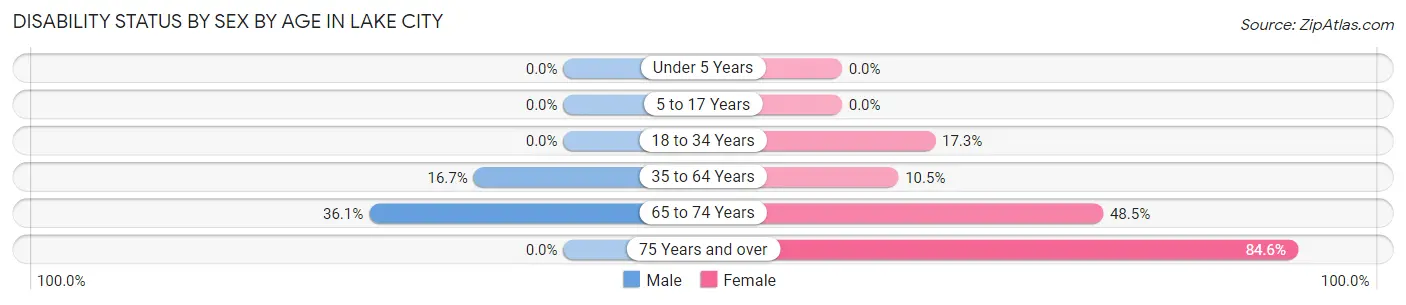
| Age Bracket | Male | Female |
| Under 5 Years | 0 (0.0%) | 0 (0.0%) |
| 5 to 17 Years | 0 (0.0%) | 0 (0.0%) |
| 18 to 34 Years | 0 (0.0%) | 9 (17.3%) |
| 35 to 64 Years | 18 (16.7%) | 11 (10.5%) |
| 65 to 74 Years | 22 (36.1%) | 16 (48.5%) |
| 75 Years and over | 0 (0.0%) | 11 (84.6%) |
Disability Class by Sex by Age in Lake City
Disability Class: Hearing Difficulty
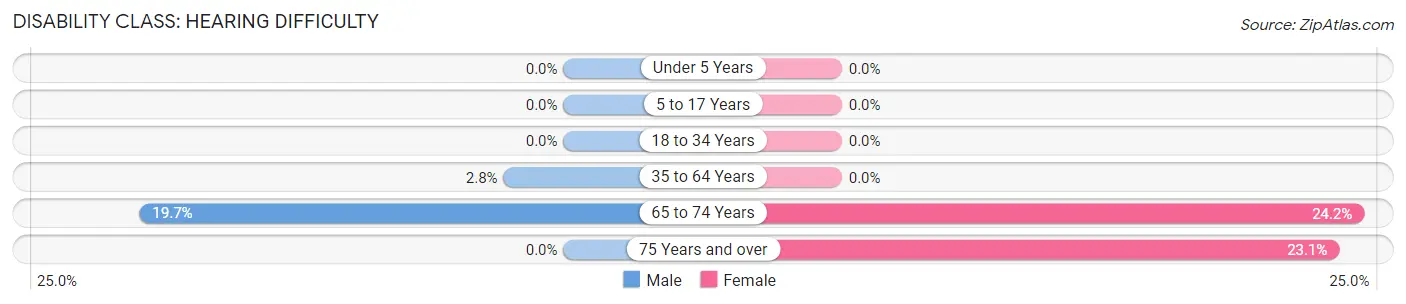
| Age Bracket | Male | Female |
| Under 5 Years | 0 (0.0%) | 0 (0.0%) |
| 5 to 17 Years | 0 (0.0%) | 0 (0.0%) |
| 18 to 34 Years | 0 (0.0%) | 0 (0.0%) |
| 35 to 64 Years | 3 (2.8%) | 0 (0.0%) |
| 65 to 74 Years | 12 (19.7%) | 8 (24.2%) |
| 75 Years and over | 0 (0.0%) | 3 (23.1%) |
Disability Class: Vision Difficulty
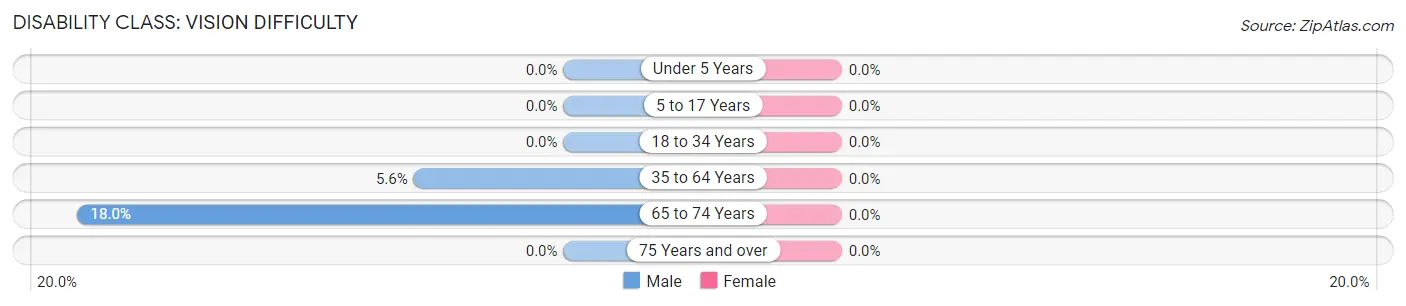
| Age Bracket | Male | Female |
| Under 5 Years | 0 (0.0%) | 0 (0.0%) |
| 5 to 17 Years | 0 (0.0%) | 0 (0.0%) |
| 18 to 34 Years | 0 (0.0%) | 0 (0.0%) |
| 35 to 64 Years | 6 (5.6%) | 0 (0.0%) |
| 65 to 74 Years | 11 (18.0%) | 0 (0.0%) |
| 75 Years and over | 0 (0.0%) | 0 (0.0%) |
Disability Class: Cognitive Difficulty
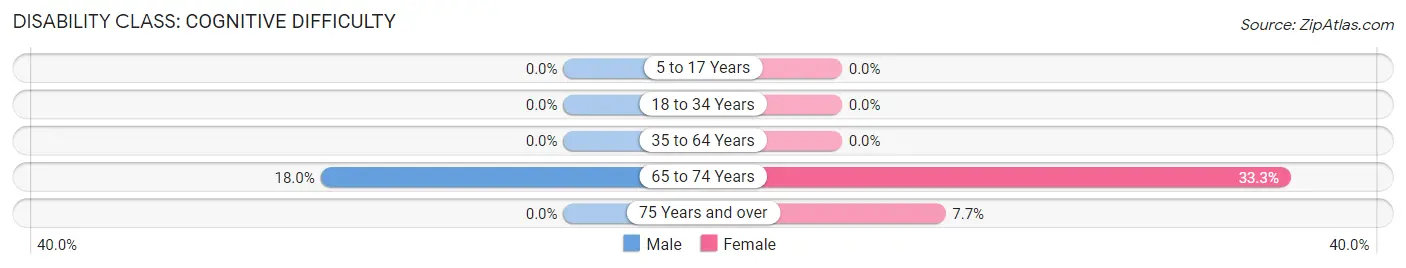
| Age Bracket | Male | Female |
| 5 to 17 Years | 0 (0.0%) | 0 (0.0%) |
| 18 to 34 Years | 0 (0.0%) | 0 (0.0%) |
| 35 to 64 Years | 0 (0.0%) | 0 (0.0%) |
| 65 to 74 Years | 11 (18.0%) | 11 (33.3%) |
| 75 Years and over | 0 (0.0%) | 1 (7.7%) |
Disability Class: Ambulatory Difficulty
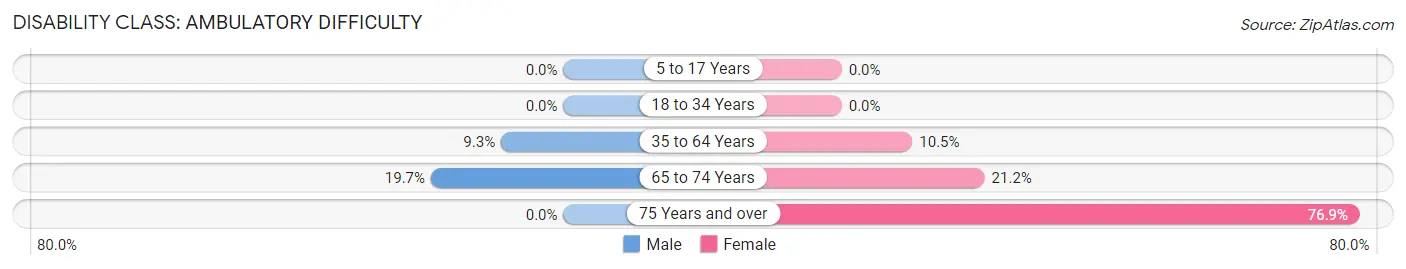
| Age Bracket | Male | Female |
| 5 to 17 Years | 0 (0.0%) | 0 (0.0%) |
| 18 to 34 Years | 0 (0.0%) | 0 (0.0%) |
| 35 to 64 Years | 10 (9.3%) | 11 (10.5%) |
| 65 to 74 Years | 12 (19.7%) | 7 (21.2%) |
| 75 Years and over | 0 (0.0%) | 10 (76.9%) |
Disability Class: Self-Care Difficulty
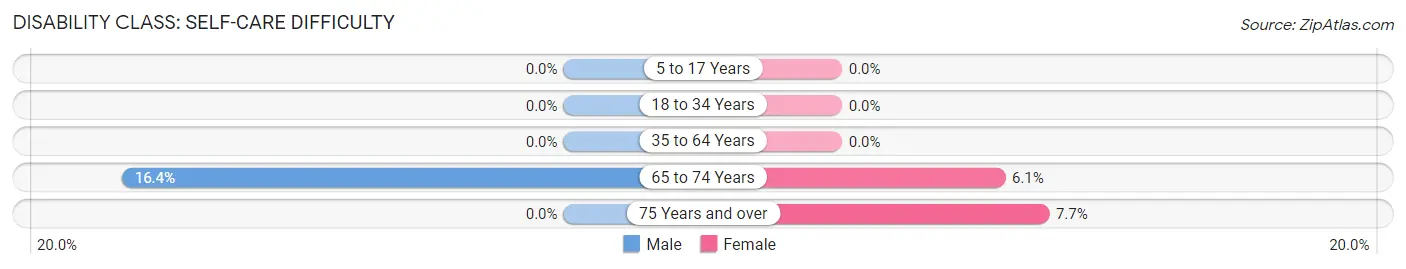
| Age Bracket | Male | Female |
| 5 to 17 Years | 0 (0.0%) | 0 (0.0%) |
| 18 to 34 Years | 0 (0.0%) | 0 (0.0%) |
| 35 to 64 Years | 0 (0.0%) | 0 (0.0%) |
| 65 to 74 Years | 10 (16.4%) | 2 (6.1%) |
| 75 Years and over | 0 (0.0%) | 1 (7.7%) |
Technology Access in Lake City
Computing Device Access in Lake City
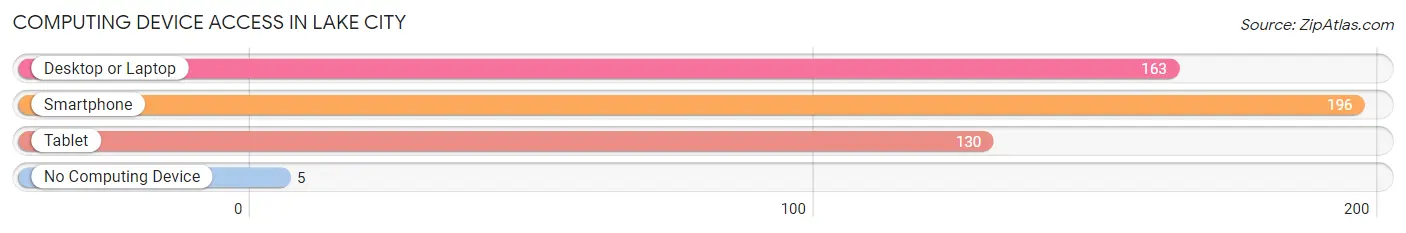
| Device Type | # Households | % Households |
| Desktop or Laptop | 163 | 71.2% |
| Smartphone | 196 | 85.6% |
| Tablet | 130 | 56.8% |
| No Computing Device | 5 | 2.2% |
| Total | 229 | 100.0% |
Internet Access in Lake City
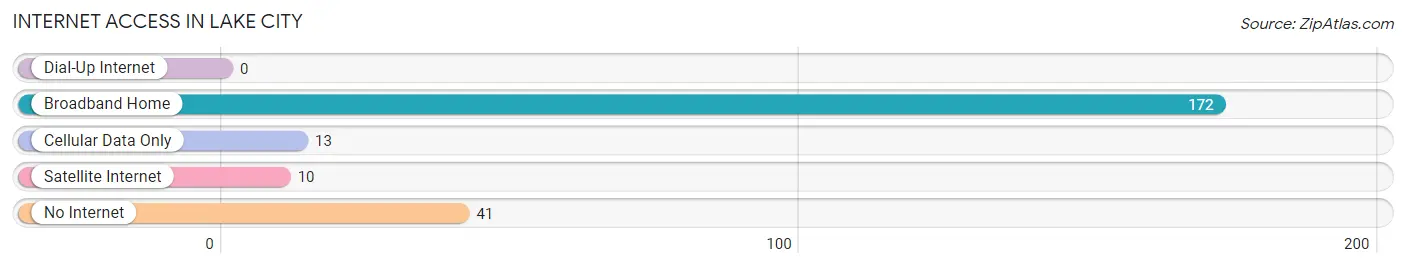
| Internet Type | # Households | % Households |
| Dial-Up Internet | 0 | 0.0% |
| Broadband Home | 172 | 75.1% |
| Cellular Data Only | 13 | 5.7% |
| Satellite Internet | 10 | 4.4% |
| No Internet | 41 | 17.9% |
| Total | 229 | 100.0% |
Lake City Summary
City of Lake City Texas
Lake City is a small city located in the state of Texas, United States. It is situated in the county of Cass, and is part of the Texarkana metropolitan area. The city has a population of approximately 1,000 people, and is located in the northeast corner of the state.
History
The area that is now Lake City was first settled in the late 1800s by a group of settlers from Arkansas. The settlers were attracted to the area due to its abundance of natural resources, including timber, water, and fertile soil. The settlers established a small community, which they named Lake City, due to its proximity to a nearby lake.
The city was officially incorporated in 1891, and the first mayor was elected in 1892. The city quickly grew, and by the early 1900s, it had become a thriving community. The city was home to several businesses, including a sawmill, a cotton gin, and a general store.
In the 1920s, the city experienced a period of growth and prosperity. The population increased, and new businesses were established. The city also became a popular tourist destination, as it was located near several lakes and rivers.
In the 1950s, the city began to decline. The population decreased, and many businesses closed. The city was also affected by the Great Depression, and many of its citizens moved away in search of better opportunities.
In the late 1970s, the city began to experience a resurgence. The population increased, and new businesses were established. The city also became a popular destination for outdoor recreation, as it was located near several lakes and rivers.
Geography
Lake City is located in the northeast corner of the state of Texas. It is situated in the county of Cass, and is part of the Texarkana metropolitan area. The city is located at the intersection of U.S. Highway 59 and State Highway 77.
The city is situated on the banks of the Sulphur River, and is surrounded by several lakes and rivers. The city is located in a region of rolling hills and wooded areas, and is home to several parks and recreational areas.
Economy
The economy of Lake City is largely based on agriculture and tourism. The city is home to several farms, and the surrounding area is known for its production of cotton, soybeans, and other crops. The city is also home to several businesses, including restaurants, retail stores, and service providers.
The city is also a popular destination for outdoor recreation, as it is located near several lakes and rivers. The city is home to several parks and recreational areas, and is a popular destination for fishing, boating, and camping.
Demographics
As of the 2010 census, the population of Lake City was 1,000 people. The racial makeup of the city was 94.2% White, 2.2% African American, 0.2% Native American, 0.2% Asian, and 3.2% from other races. The median household income was $31,250, and the median family income was $37,500.
Conclusion
Lake City is a small city located in the northeast corner of the state of Texas. It is situated in the county of Cass, and is part of the Texarkana metropolitan area. The city has a population of approximately 1,000 people, and is located in a region of rolling hills and wooded areas. The economy of Lake City is largely based on agriculture and tourism, and the city is a popular destination for outdoor recreation. The population of Lake City is predominantly White, with a small percentage of African American, Native American, and Asian residents.
Common Questions
What is the Total Population of Lake City?
Total Population of Lake City is 540.
What is the Total Male Population of Lake City?
Total Male Population of Lake City is 289.
What is the Total Female Population of Lake City?
Total Female Population of Lake City is 251.
What is the Ratio of Males per 100 Females in Lake City?
There are 115.14 Males per 100 Females in Lake City.
What is the Ratio of Females per 100 Males in Lake City?
There are 86.85 Females per 100 Males in Lake City.
What is the Median Population Age in Lake City?
Median Population Age in Lake City is 49.1 Years.
What is the Average Family Size in Lake City
Average Family Size in Lake City is 3.2 People.
What is the Average Household Size in Lake City
Average Household Size in Lake City is 2.4 People.
What is Per Capita Income in Lake City?
Per Capita income in Lake City is $31,343.
What is the Median Family Income in Lake City?
Median Family Income in Lake City is $73,750.
What is the Median Household income in Lake City?
Median Household Income in Lake City is $50,625.
What is Income or Wage Gap in Lake City?
Income or Wage Gap in Lake City is 62.7%.
Women in Lake City earn 37.3 cents for every dollar earned by a man.
What is Inequality or Gini Index in Lake City?
Inequality or Gini Index in Lake City is 0.44.
How Large is the Labor Force in Lake City?
There are 240 People in the Labor Forcein in Lake City.
What is the Percentage of People in the Labor Force in Lake City?
54.5% of People are in the Labor Force in Lake City.
What is the Unemployment Rate in Lake City?
Unemployment Rate in Lake City is 3.8%.