Iglesia Antigua, TX
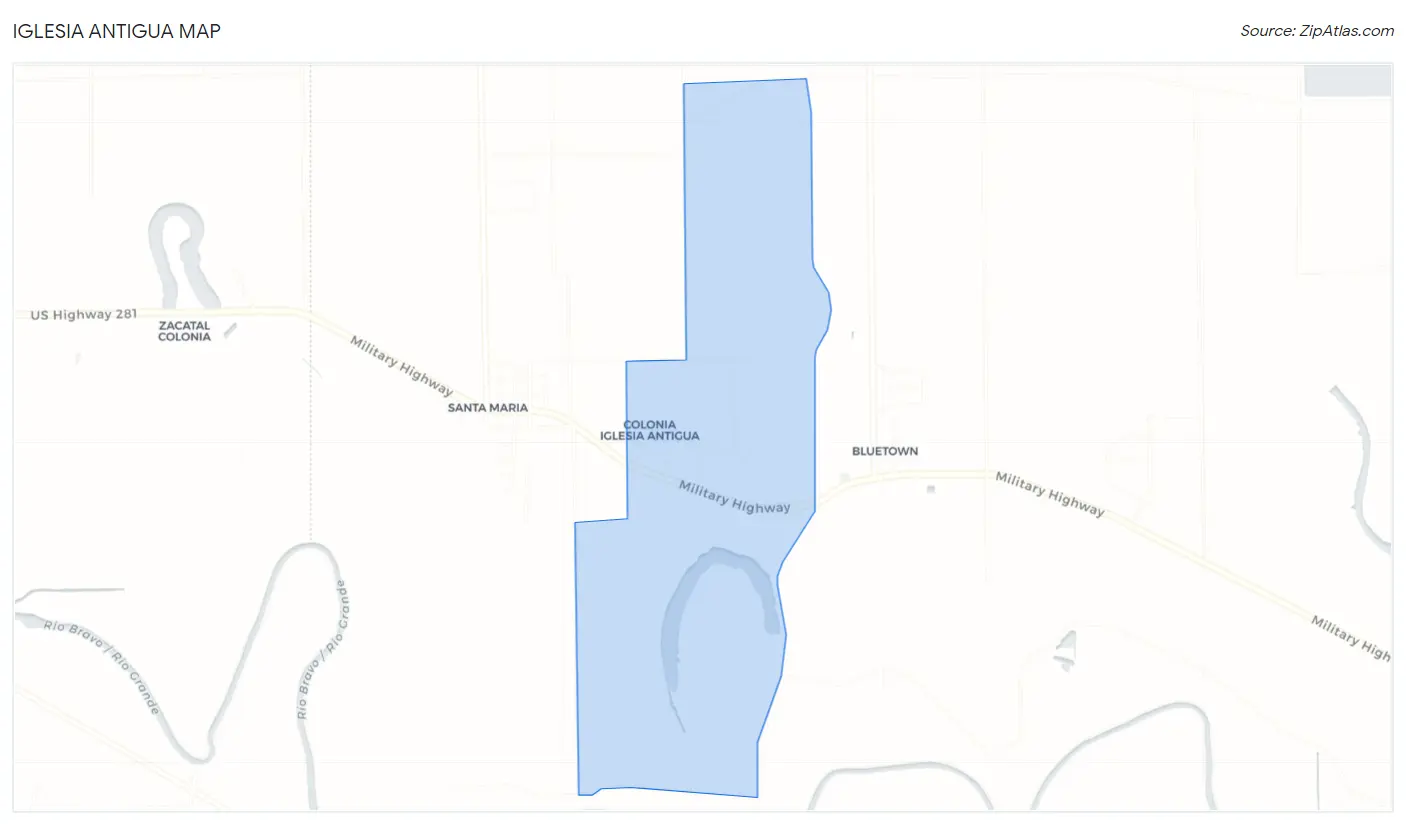
Iglesia Antigua Map
Iglesia Antigua Overview
92
TOTAL POPULATION
55
MALE POPULATION
37
FEMALE POPULATION
148.65
MALES / 100 FEMALES
67.27
FEMALES / 100 MALES
35.3
MEDIAN AGE
3.0
AVG FAMILY SIZE
2.4
AVG HOUSEHOLD SIZE
$52,614
PER CAPITA INCOME
$148,203
AVG HOUSEHOLD INCOME
16.5%
WAGE / INCOME GAP [ % ]
83.5¢/ $1
WAGE / INCOME GAP [ $ ]
0.23
INEQUALITY / GINI INDEX
92
LABOR FORCE [ PEOPLE ]
100.0%
PERCENT IN LABOR FORCE
Race in Iglesia Antigua
The most populous races in Iglesia Antigua are Hispanic or Latino (87 | 94.6%), White / Caucasian (68 | 73.9%), and Some other Race (24 | 26.1%).
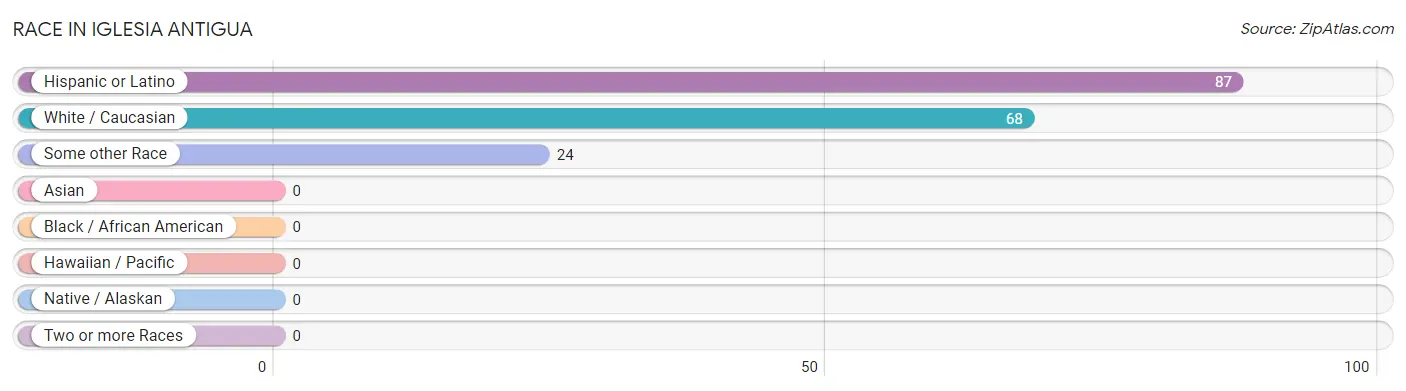
| Race | # Population | % Population |
| Asian | 0 | 0.0% |
| Black / African American | 0 | 0.0% |
| Hawaiian / Pacific | 0 | 0.0% |
| Hispanic or Latino | 87 | 94.6% |
| Native / Alaskan | 0 | 0.0% |
| White / Caucasian | 68 | 73.9% |
| Two or more Races | 0 | 0.0% |
| Some other Race | 24 | 26.1% |
| Total | 92 | 100.0% |
Ancestry in Iglesia Antigua
The most populous ancestries reported in Iglesia Antigua are , and Mexican (87 | 94.6%), together accounting for 94.6% of all Iglesia Antigua residents.

| Ancestry | # Population | % Population |
| Mexican | 87 | 94.6% | View All 1 Rows |
Immigrants in Iglesia Antigua
The most numerous immigrant groups reported in Iglesia Antigua came from Central America (26 | 28.3%), Latin America (26 | 28.3%), and Mexico (26 | 28.3%), together accounting for 84.8% of all Iglesia Antigua residents.
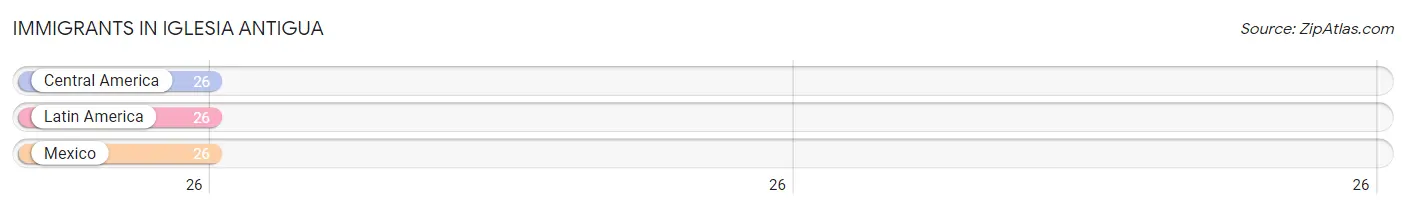
| Immigration Origin | # Population | % Population |
| Central America | 26 | 28.3% |
| Latin America | 26 | 28.3% |
| Mexico | 26 | 28.3% | View All 3 Rows |
Sex and Age in Iglesia Antigua
Sex and Age in Iglesia Antigua
The most populous age groups in Iglesia Antigua are 20 to 24 Years (26 | 47.3%) for men and 60 to 64 Years (16 | 43.2%) for women.
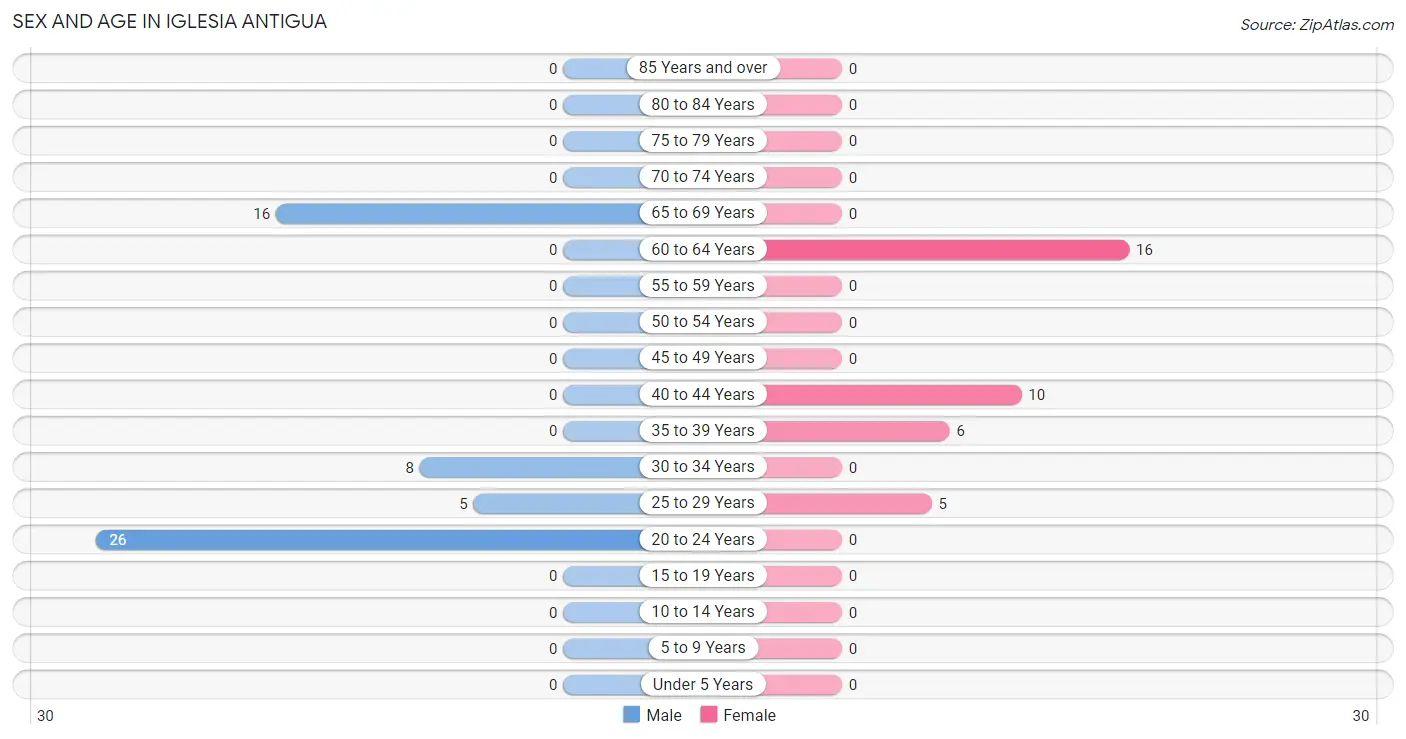
| Age Bracket | Male | Female |
| Under 5 Years | 0 (0.0%) | 0 (0.0%) |
| 5 to 9 Years | 0 (0.0%) | 0 (0.0%) |
| 10 to 14 Years | 0 (0.0%) | 0 (0.0%) |
| 15 to 19 Years | 0 (0.0%) | 0 (0.0%) |
| 20 to 24 Years | 26 (47.3%) | 0 (0.0%) |
| 25 to 29 Years | 5 (9.1%) | 5 (13.5%) |
| 30 to 34 Years | 8 (14.5%) | 0 (0.0%) |
| 35 to 39 Years | 0 (0.0%) | 6 (16.2%) |
| 40 to 44 Years | 0 (0.0%) | 10 (27.0%) |
| 45 to 49 Years | 0 (0.0%) | 0 (0.0%) |
| 50 to 54 Years | 0 (0.0%) | 0 (0.0%) |
| 55 to 59 Years | 0 (0.0%) | 0 (0.0%) |
| 60 to 64 Years | 0 (0.0%) | 16 (43.2%) |
| 65 to 69 Years | 16 (29.1%) | 0 (0.0%) |
| 70 to 74 Years | 0 (0.0%) | 0 (0.0%) |
| 75 to 79 Years | 0 (0.0%) | 0 (0.0%) |
| 80 to 84 Years | 0 (0.0%) | 0 (0.0%) |
| 85 Years and over | 0 (0.0%) | 0 (0.0%) |
| Total | 55 (100.0%) | 37 (100.0%) |
Families and Households in Iglesia Antigua
Median Family Size in Iglesia Antigua
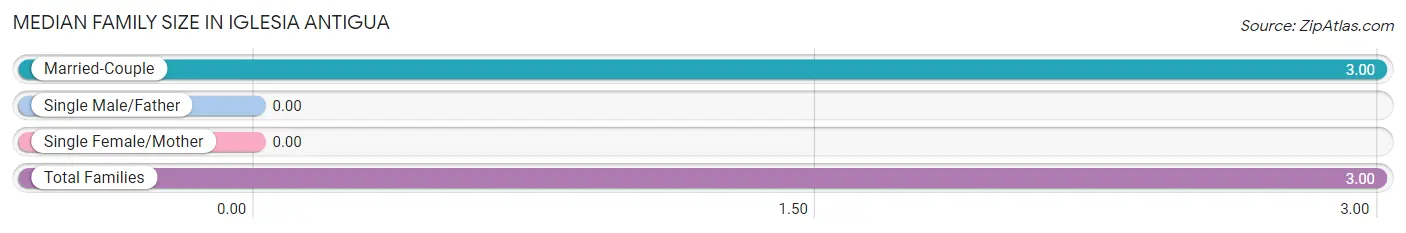
| Family Type | # Families | Family Size |
| Married-Couple | 24 (100.0%) | 3.00 |
| Single Male/Father | 0 (0.0%) | - |
| Single Female/Mother | 0 (0.0%) | - |
| Total Families | 24 (100.0%) | 3.00 |
Median Household Size in Iglesia Antigua
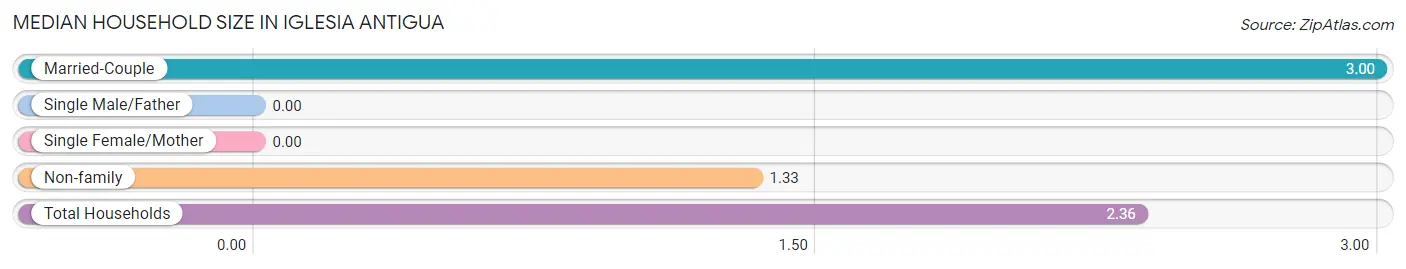
| Household Type | # Households | Household Size |
| Married-Couple | 24 (61.5%) | 3.00 |
| Single Male/Father | 0 (0.0%) | - |
| Single Female/Mother | 0 (0.0%) | - |
| Non-family | 15 (38.5%) | 1.33 |
| Total Households | 39 (100.0%) | 2.36 |
Household Size by Marriage Status in Iglesia Antigua
Out of a total of 39 households in Iglesia Antigua, 24 (61.5%) are family households, while 15 (38.5%) are nonfamily households. The most numerous type of family households are 3-person households, comprising 16, and the most common type of nonfamily households are 1-person households, comprising 10.
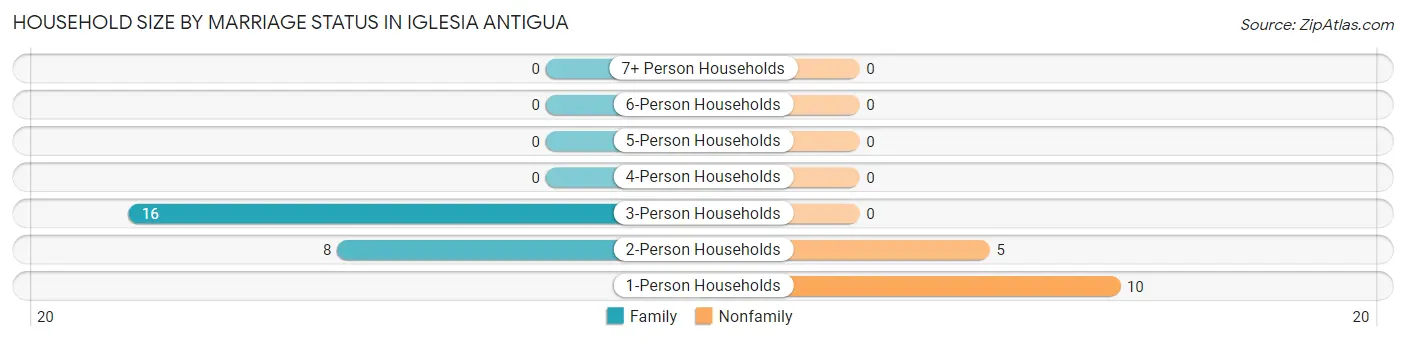
| Household Size | Family Households | Nonfamily Households |
| 1-Person Households | - | 10 (25.6%) |
| 2-Person Households | 8 (20.5%) | 5 (12.8%) |
| 3-Person Households | 16 (41.0%) | 0 (0.0%) |
| 4-Person Households | 0 (0.0%) | 0 (0.0%) |
| 5-Person Households | 0 (0.0%) | 0 (0.0%) |
| 6-Person Households | 0 (0.0%) | 0 (0.0%) |
| 7+ Person Households | 0 (0.0%) | 0 (0.0%) |
| Total | 24 (61.5%) | 15 (38.5%) |
Female Fertility in Iglesia Antigua
Fertility by Age in Iglesia Antigua
| Age Bracket | Women with Births | Births / 1,000 Women |
| 15 to 19 years | 0 (0.0%) | 0.0 |
| 20 to 34 years | 0 (0.0%) | 0.0 |
| 35 to 50 years | 0 (0.0%) | 0.0 |
| Total | 0 (0.0%) | 0.0 |
Fertility by Age by Marriage Status in Iglesia Antigua
| Age Bracket | Married | Unmarried |
| 15 to 19 years | 0 (0.0%) | 0 (0.0%) |
| 20 to 34 years | 0 (0.0%) | 0 (0.0%) |
| 35 to 50 years | 0 (0.0%) | 0 (0.0%) |
| Total | 0 (0.0%) | 0 (0.0%) |
Fertility by Education in Iglesia Antigua
| Educational Attainment | Women with Births | Births / 1,000 Women |
| Less than High School | 0 (0.0%) | 0.0 |
| High School Diploma | 0 (0.0%) | 0.0 |
| College or Associate's Degree | 0 (0.0%) | 0.0 |
| Bachelor's Degree | 0 (0.0%) | 0.0 |
| Graduate Degree | 0 (0.0%) | 0.0 |
| Total | 0 (0.0%) | 0.0 |
Fertility by Education by Marriage Status in Iglesia Antigua
| Educational Attainment | Married | Unmarried |
| Less than High School | 0 (0.0%) | 0 (0.0%) |
| High School Diploma | 0 (0.0%) | 0 (0.0%) |
| College or Associate's Degree | 0 (0.0%) | 0 (0.0%) |
| Bachelor's Degree | 0 (0.0%) | 0 (0.0%) |
| Graduate Degree | 0 (0.0%) | 0 (0.0%) |
| Total | 0 (0.0%) | 0 (0.0%) |
Income in Iglesia Antigua
Income Overview in Iglesia Antigua
| Characteristic | Number | Measure |
| Per Capita Income | 92 | $52,614 |
| Median Family Income | 24 | $0 |
| Mean Family Income | 24 | $0 |
| Median Household Income | 39 | $148,203 |
| Mean Household Income | 39 | $112,544 |
| Income Deficit | 24 | $0 |
| Wage / Income Gap (%) | 92 | 16.51% |
| Wage / Income Gap ($) | 92 | 83.49¢ per $1 |
| Gini / Inequality Index | 92 | 0.23 |
Earnings by Sex in Iglesia Antigua
Average Earnings in Iglesia Antigua are $45,385, $47,163 for men and $39,375 for women, a difference of 16.5%.
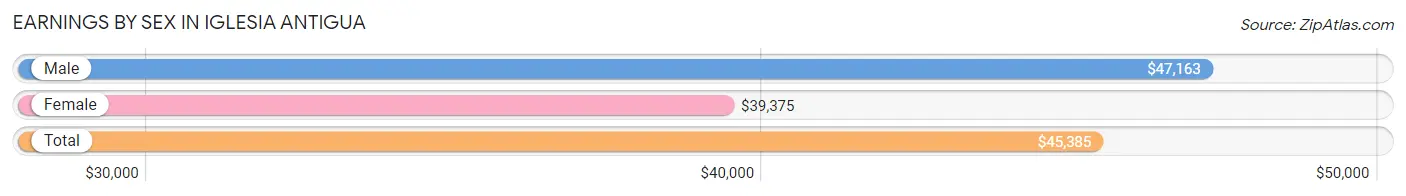
| Sex | Number | Average Earnings |
| Male | 55 (59.8%) | $47,163 |
| Female | 37 (40.2%) | $39,375 |
| Total | 92 (100.0%) | $45,385 |
Earnings by Sex by Income Bracket in Iglesia Antigua
The most common earnings brackets in Iglesia Antigua are $45,000 to $49,999 for men (42 | 76.4%) and $40,000 to $44,999 for women (16 | 43.2%).
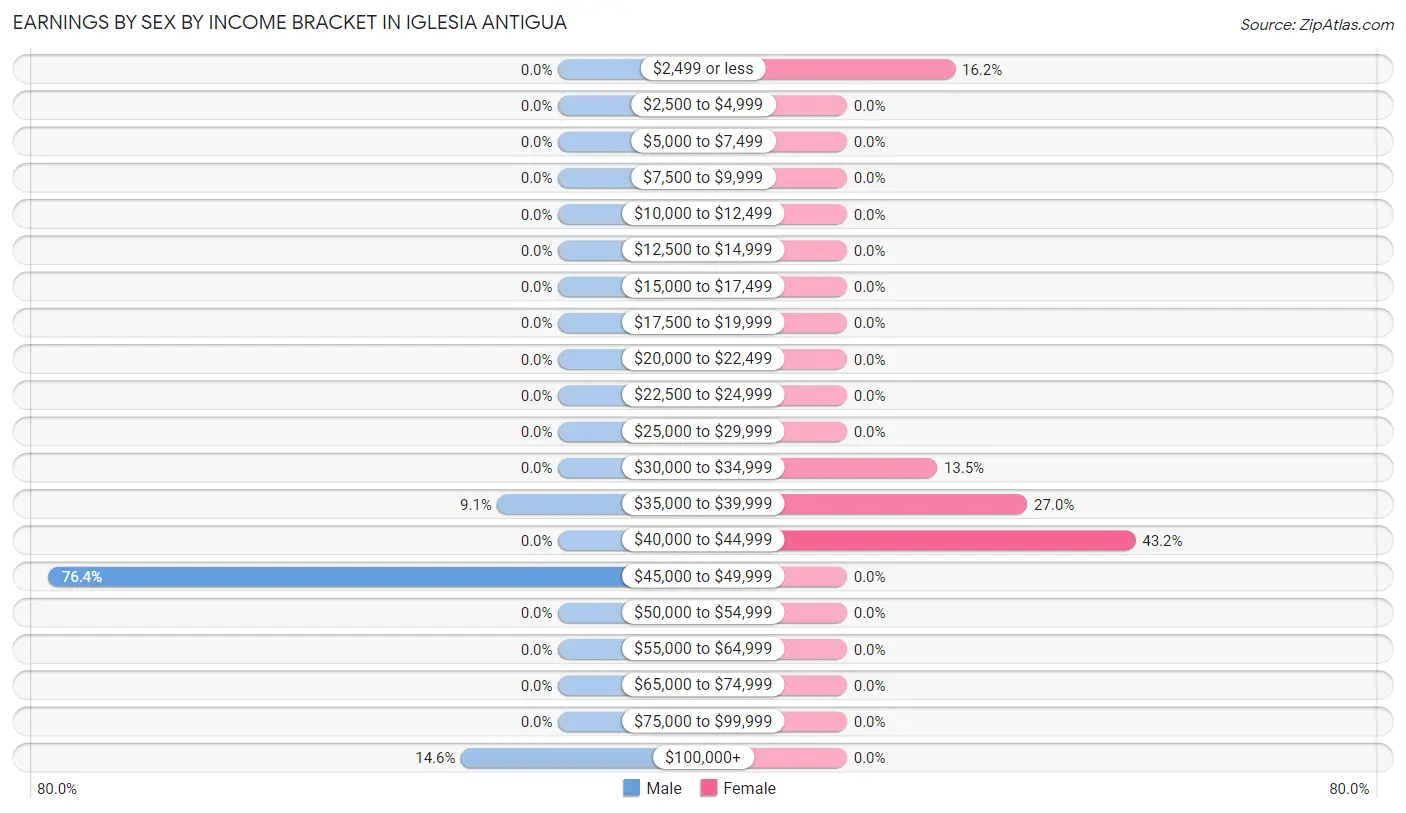
| Income | Male | Female |
| $2,499 or less | 0 (0.0%) | 6 (16.2%) |
| $2,500 to $4,999 | 0 (0.0%) | 0 (0.0%) |
| $5,000 to $7,499 | 0 (0.0%) | 0 (0.0%) |
| $7,500 to $9,999 | 0 (0.0%) | 0 (0.0%) |
| $10,000 to $12,499 | 0 (0.0%) | 0 (0.0%) |
| $12,500 to $14,999 | 0 (0.0%) | 0 (0.0%) |
| $15,000 to $17,499 | 0 (0.0%) | 0 (0.0%) |
| $17,500 to $19,999 | 0 (0.0%) | 0 (0.0%) |
| $20,000 to $22,499 | 0 (0.0%) | 0 (0.0%) |
| $22,500 to $24,999 | 0 (0.0%) | 0 (0.0%) |
| $25,000 to $29,999 | 0 (0.0%) | 0 (0.0%) |
| $30,000 to $34,999 | 0 (0.0%) | 5 (13.5%) |
| $35,000 to $39,999 | 5 (9.1%) | 10 (27.0%) |
| $40,000 to $44,999 | 0 (0.0%) | 16 (43.2%) |
| $45,000 to $49,999 | 42 (76.4%) | 0 (0.0%) |
| $50,000 to $54,999 | 0 (0.0%) | 0 (0.0%) |
| $55,000 to $64,999 | 0 (0.0%) | 0 (0.0%) |
| $65,000 to $74,999 | 0 (0.0%) | 0 (0.0%) |
| $75,000 to $99,999 | 0 (0.0%) | 0 (0.0%) |
| $100,000+ | 8 (14.5%) | 0 (0.0%) |
| Total | 55 (100.0%) | 37 (100.0%) |
Earnings by Sex by Educational Attainment in Iglesia Antigua
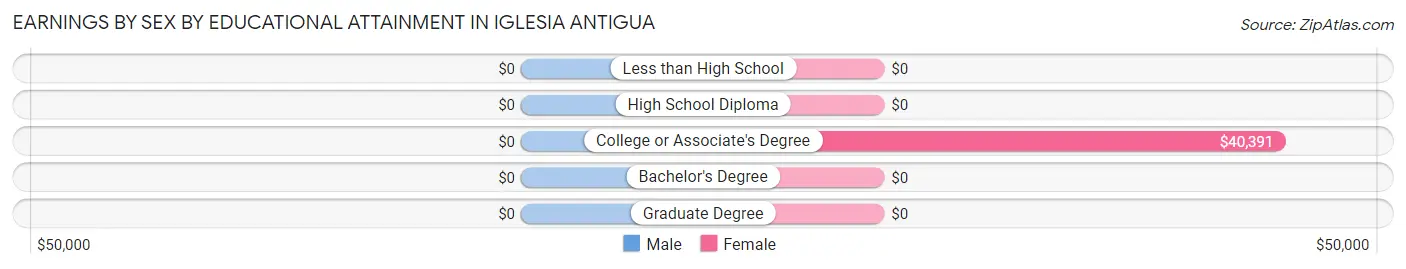
| Educational Attainment | Male Income | Female Income |
| Less than High School | - | - |
| High School Diploma | - | - |
| College or Associate's Degree | - | - |
| Bachelor's Degree | - | - |
| Graduate Degree | - | - |
| Total | - | - |
Family Income in Iglesia Antigua
Family Income Brackets in Iglesia Antigua
According to the Iglesia Antigua family income data, there are 16 families falling into the $100,000 to $149,999 income range, which is the most common income bracket and makes up 66.7% of all families.
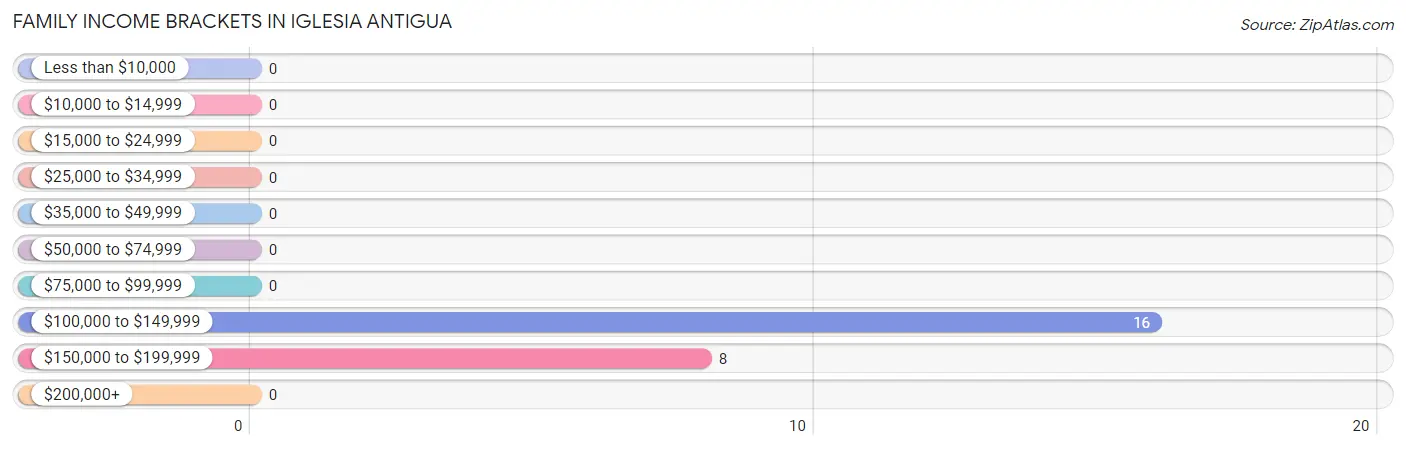
| Income Bracket | # Families | % Families |
| Less than $10,000 | 0 | 0.0% |
| $10,000 to $14,999 | 0 | 0.0% |
| $15,000 to $24,999 | 0 | 0.0% |
| $25,000 to $34,999 | 0 | 0.0% |
| $35,000 to $49,999 | 0 | 0.0% |
| $50,000 to $74,999 | 0 | 0.0% |
| $75,000 to $99,999 | 0 | 0.0% |
| $100,000 to $149,999 | 16 | 66.7% |
| $150,000 to $199,999 | 8 | 33.3% |
| $200,000+ | 0 | 0.0% |
Family Income by Famaliy Size in Iglesia Antigua
| Income Bracket | # Families | Median Income |
| 2-Person Families | 8 (33.3%) | $0 |
| 3-Person Families | 16 (66.7%) | $0 |
| 4-Person Families | 0 (0.0%) | $0 |
| 5-Person Families | 0 (0.0%) | $0 |
| 6-Person Families | 0 (0.0%) | $0 |
| 7+ Person Families | 0 (0.0%) | $0 |
| Total | 24 (100.0%) | $0 |
Family Income by Number of Earners in Iglesia Antigua
| Number of Earners | # Families | Median Income |
| No Earners | 0 (0.0%) | $0 |
| 1 Earner | 0 (0.0%) | $0 |
| 2 Earners | 8 (33.3%) | $0 |
| 3+ Earners | 16 (66.7%) | $0 |
| Total | 24 (100.0%) | $0 |
Household Income in Iglesia Antigua
Household Income Brackets in Iglesia Antigua
With 16 households falling in the category, the $100,000 to $149,999 income range is the most frequent in Iglesia Antigua, accounting for 41.0% of all households.
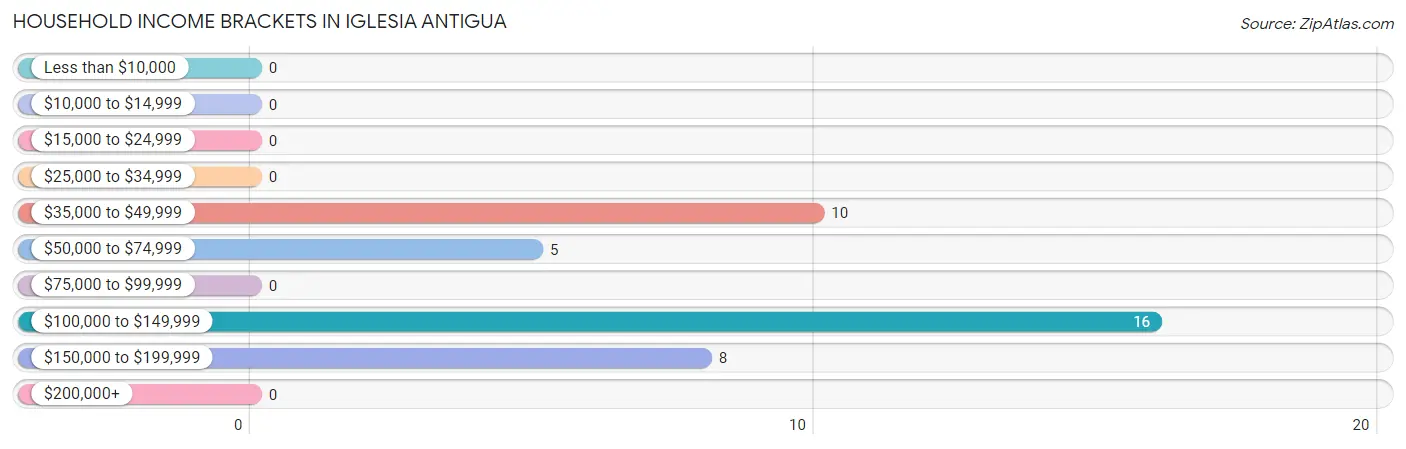
| Income Bracket | # Households | % Households |
| Less than $10,000 | 0 | 0.0% |
| $10,000 to $14,999 | 0 | 0.0% |
| $15,000 to $24,999 | 0 | 0.0% |
| $25,000 to $34,999 | 0 | 0.0% |
| $35,000 to $49,999 | 10 | 25.6% |
| $50,000 to $74,999 | 5 | 12.8% |
| $75,000 to $99,999 | 0 | 0.0% |
| $100,000 to $149,999 | 16 | 41.0% |
| $150,000 to $199,999 | 8 | 20.5% |
| $200,000+ | 0 | 0.0% |
Household Income by Householder Age in Iglesia Antigua
| Income Bracket | # Households | Median Income |
| 15 to 24 Years | 0 (0.0%) | $0 |
| 25 to 44 Years | 23 (59.0%) | $0 |
| 45 to 64 Years | 16 (41.0%) | $0 |
| 65+ Years | 0 (0.0%) | $0 |
| Total | 39 (100.0%) | $148,203 |
Poverty in Iglesia Antigua
Income Below Poverty by Sex and Age in Iglesia Antigua
| Age Bracket | Male | Female |
| Under 5 Years | 0 (0.0%) | 0 (0.0%) |
| 5 Years | 0 (0.0%) | 0 (0.0%) |
| 6 to 11 Years | 0 (0.0%) | 0 (0.0%) |
| 12 to 14 Years | 0 (0.0%) | 0 (0.0%) |
| 15 Years | 0 (0.0%) | 0 (0.0%) |
| 16 and 17 Years | 0 (0.0%) | 0 (0.0%) |
| 18 to 24 Years | 0 (0.0%) | 0 (0.0%) |
| 25 to 34 Years | 0 (0.0%) | 0 (0.0%) |
| 35 to 44 Years | 0 (0.0%) | 0 (0.0%) |
| 45 to 54 Years | 0 (0.0%) | 0 (0.0%) |
| 55 to 64 Years | 0 (0.0%) | 0 (0.0%) |
| 65 to 74 Years | 0 (0.0%) | 0 (0.0%) |
| 75 Years and over | 0 (0.0%) | 0 (0.0%) |
| Total | 0 (0.0%) | 0 (0.0%) |
Income Above Poverty by Sex and Age in Iglesia Antigua
According to the poverty statistics in Iglesia Antigua, males aged 18 to 24 years and females aged 25 to 34 years are the age groups that are most secure financially, with 100.0% of males and 100.0% of females in these age groups living above the poverty line.
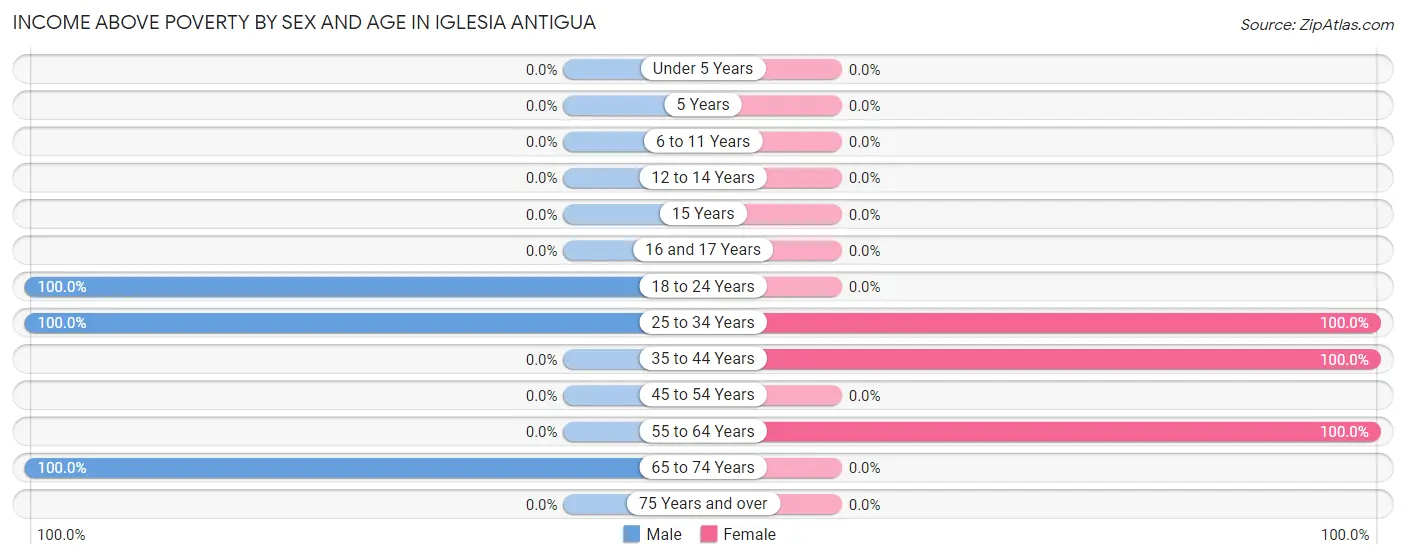
| Age Bracket | Male | Female |
| Under 5 Years | 0 (0.0%) | 0 (0.0%) |
| 5 Years | 0 (0.0%) | 0 (0.0%) |
| 6 to 11 Years | 0 (0.0%) | 0 (0.0%) |
| 12 to 14 Years | 0 (0.0%) | 0 (0.0%) |
| 15 Years | 0 (0.0%) | 0 (0.0%) |
| 16 and 17 Years | 0 (0.0%) | 0 (0.0%) |
| 18 to 24 Years | 26 (100.0%) | 0 (0.0%) |
| 25 to 34 Years | 13 (100.0%) | 5 (100.0%) |
| 35 to 44 Years | 0 (0.0%) | 16 (100.0%) |
| 45 to 54 Years | 0 (0.0%) | 0 (0.0%) |
| 55 to 64 Years | 0 (0.0%) | 16 (100.0%) |
| 65 to 74 Years | 16 (100.0%) | 0 (0.0%) |
| 75 Years and over | 0 (0.0%) | 0 (0.0%) |
| Total | 55 (100.0%) | 37 (100.0%) |
Income Below Poverty Among Married-Couple Families in Iglesia Antigua
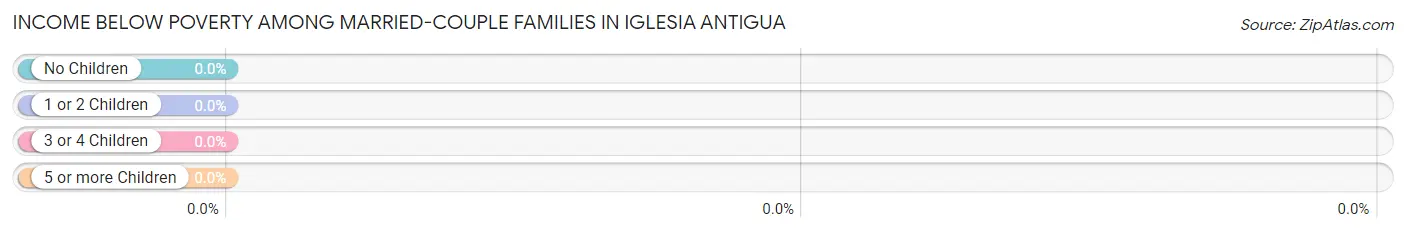
| Children | Above Poverty | Below Poverty |
| No Children | 24 (100.0%) | 0 (0.0%) |
| 1 or 2 Children | 0 (0.0%) | 0 (0.0%) |
| 3 or 4 Children | 0 (0.0%) | 0 (0.0%) |
| 5 or more Children | 0 (0.0%) | 0 (0.0%) |
| Total | 24 (100.0%) | 0 (0.0%) |
Income Below Poverty Among Single-Parent Households in Iglesia Antigua
| Children | Single Father | Single Mother |
| No Children | 0 (0.0%) | 0 (0.0%) |
| 1 or 2 Children | 0 (0.0%) | 0 (0.0%) |
| 3 or 4 Children | 0 (0.0%) | 0 (0.0%) |
| 5 or more Children | 0 (0.0%) | 0 (0.0%) |
| Total | 0 (0.0%) | 0 (0.0%) |
Income Below Poverty Among Married-Couple vs Single-Parent Households in Iglesia Antigua
| Children | Married-Couple Families | Single-Parent Households |
| No Children | 0 (0.0%) | 0 (0.0%) |
| 1 or 2 Children | 0 (0.0%) | 0 (0.0%) |
| 3 or 4 Children | 0 (0.0%) | 0 (0.0%) |
| 5 or more Children | 0 (0.0%) | 0 (0.0%) |
| Total | 0 (0.0%) | 0 (0.0%) |
Employment Characteristics in Iglesia Antigua
Employment by Class of Employer in Iglesia Antigua
Among the 92 employed individuals in Iglesia Antigua, private company employees (60 | 65.2%), and local government employees (32 | 34.8%) make up the most common classes of employment.
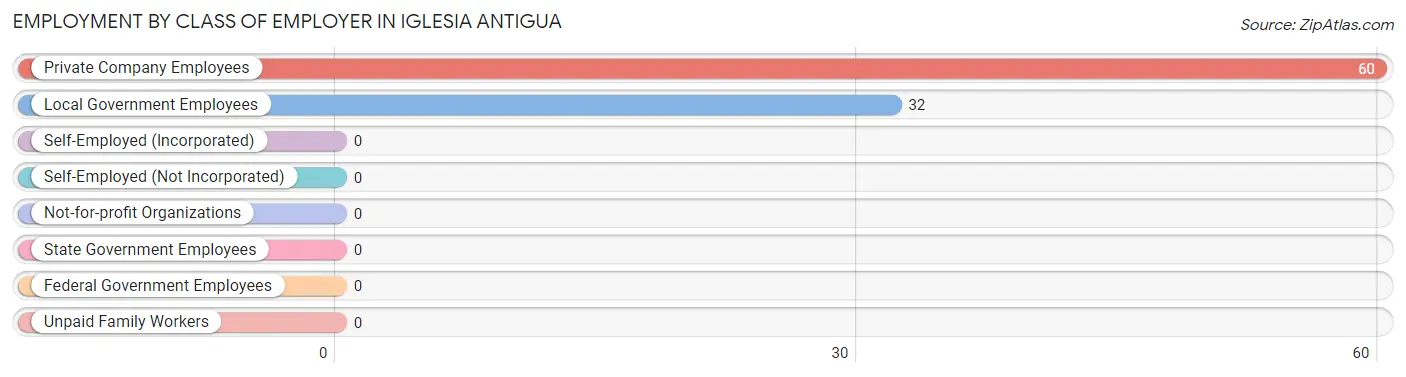
| Employer Class | # Employees | % Employees |
| Private Company Employees | 60 | 65.2% |
| Self-Employed (Incorporated) | 0 | 0.0% |
| Self-Employed (Not Incorporated) | 0 | 0.0% |
| Not-for-profit Organizations | 0 | 0.0% |
| Local Government Employees | 32 | 34.8% |
| State Government Employees | 0 | 0.0% |
| Federal Government Employees | 0 | 0.0% |
| Unpaid Family Workers | 0 | 0.0% |
| Total | 92 | 100.0% |
Employment Status by Age in Iglesia Antigua
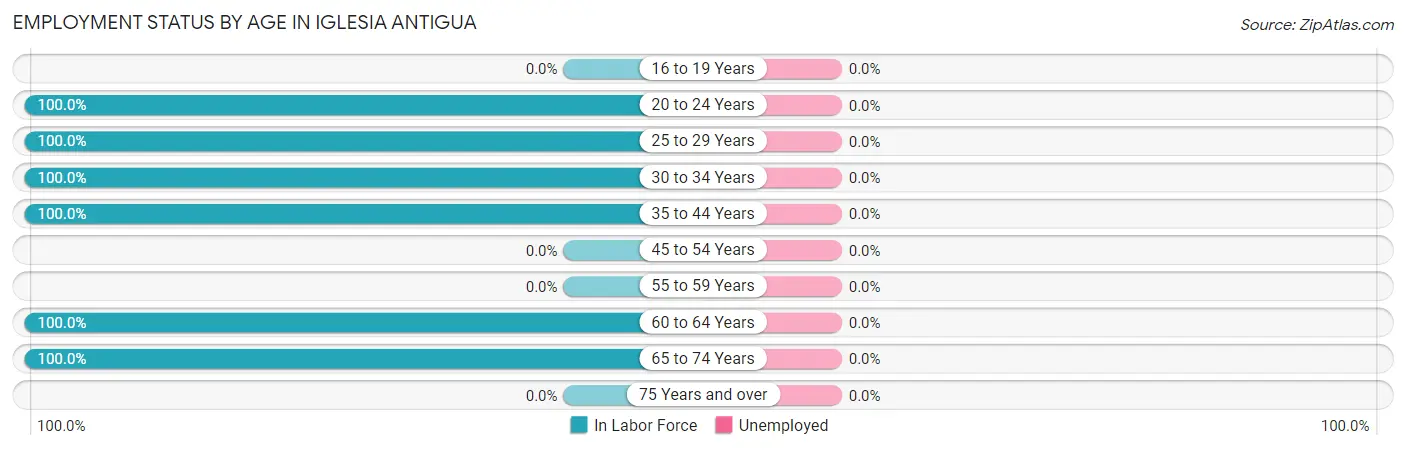
| Age Bracket | In Labor Force | Unemployed |
| 16 to 19 Years | 0 (0.0%) | 0 (0.0%) |
| 20 to 24 Years | 26 (100.0%) | 0 (0.0%) |
| 25 to 29 Years | 10 (100.0%) | 0 (0.0%) |
| 30 to 34 Years | 8 (100.0%) | 0 (0.0%) |
| 35 to 44 Years | 16 (100.0%) | 0 (0.0%) |
| 45 to 54 Years | 0 (0.0%) | 0 (0.0%) |
| 55 to 59 Years | 0 (0.0%) | 0 (0.0%) |
| 60 to 64 Years | 16 (100.0%) | 0 (0.0%) |
| 65 to 74 Years | 16 (100.0%) | 0 (0.0%) |
| 75 Years and over | 0 (0.0%) | 0 (0.0%) |
| Total | 92 (100.0%) | 0 (0.0%) |
Employment Status by Educational Attainment in Iglesia Antigua
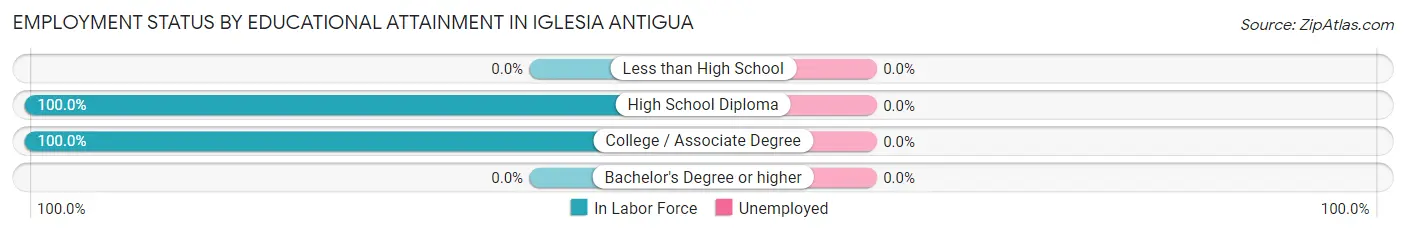
| Educational Attainment | In Labor Force | Unemployed |
| Less than High School | 0 (0.0%) | 0 (0.0%) |
| High School Diploma | 10 (100.0%) | 0 (0.0%) |
| College / Associate Degree | 40 (100.0%) | 0 (0.0%) |
| Bachelor's Degree or higher | 0 (0.0%) | 0 (0.0%) |
| Total | 50 (100.0%) | 0 (0.0%) |
Employment Occupations by Sex in Iglesia Antigua
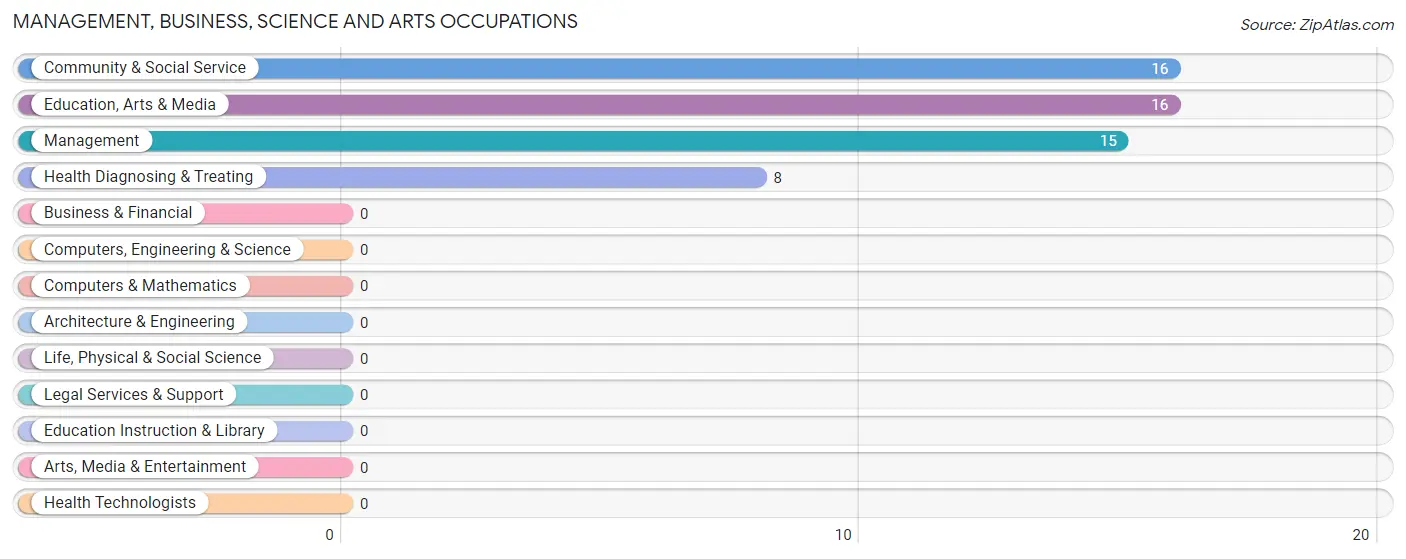
Management, Business, Science and Arts Occupations
The most common Management, Business, Science and Arts occupations in Iglesia Antigua are Community & Social Service (16 | 17.4%), Education, Arts & Media (16 | 17.4%), Management (15 | 16.3%), and Health Diagnosing & Treating (8 | 8.7%).
Management, Business, Science and Arts Occupations by Sex
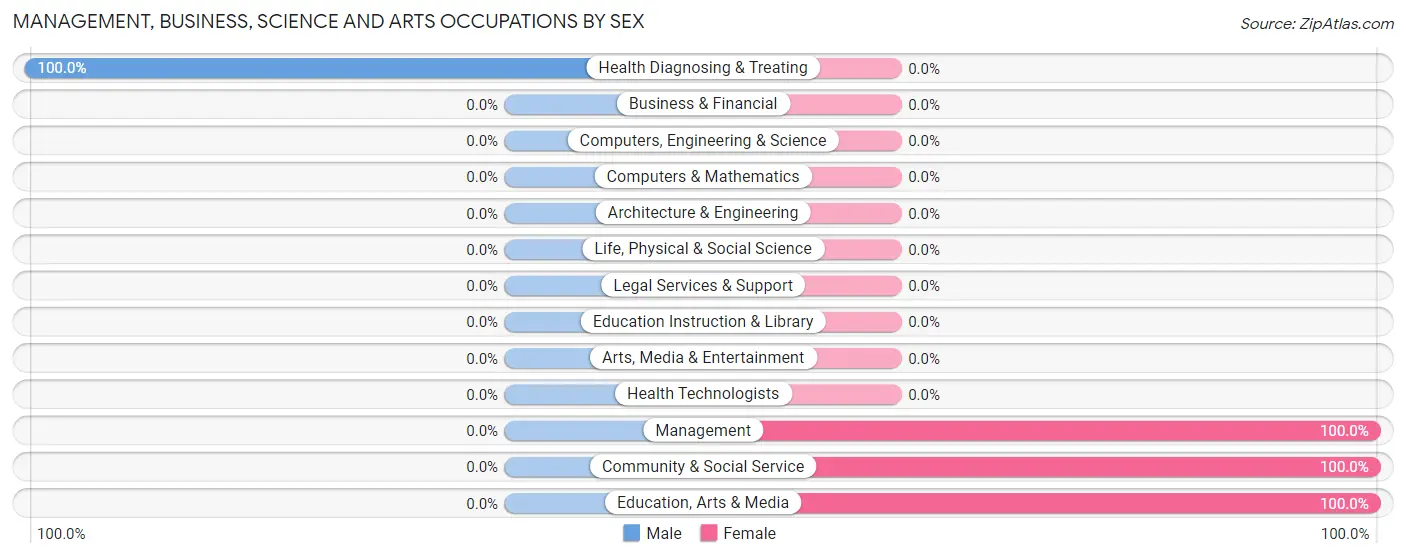
| Occupation | Male | Female |
| Management | 0 (0.0%) | 15 (100.0%) |
| Business & Financial | 0 (0.0%) | 0 (0.0%) |
| Computers, Engineering & Science | 0 (0.0%) | 0 (0.0%) |
| Computers & Mathematics | 0 (0.0%) | 0 (0.0%) |
| Architecture & Engineering | 0 (0.0%) | 0 (0.0%) |
| Life, Physical & Social Science | 0 (0.0%) | 0 (0.0%) |
| Community & Social Service | 0 (0.0%) | 16 (100.0%) |
| Education, Arts & Media | 0 (0.0%) | 16 (100.0%) |
| Legal Services & Support | 0 (0.0%) | 0 (0.0%) |
| Education Instruction & Library | 0 (0.0%) | 0 (0.0%) |
| Arts, Media & Entertainment | 0 (0.0%) | 0 (0.0%) |
| Health Diagnosing & Treating | 8 (100.0%) | 0 (0.0%) |
| Health Technologists | 0 (0.0%) | 0 (0.0%) |
| Total (Category) | 8 (20.5%) | 31 (79.5%) |
| Total (Overall) | 55 (59.8%) | 37 (40.2%) |
Services Occupations
The most common Services occupations in Iglesia Antigua are Cleaning & Maintenance (16 | 17.4%), and Healthcare Support (6 | 6.5%).
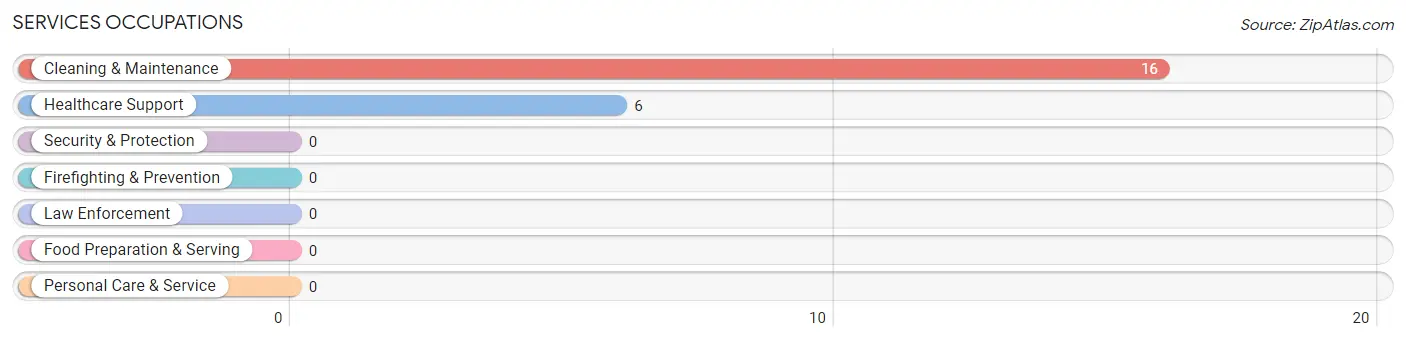
Services Occupations by Sex
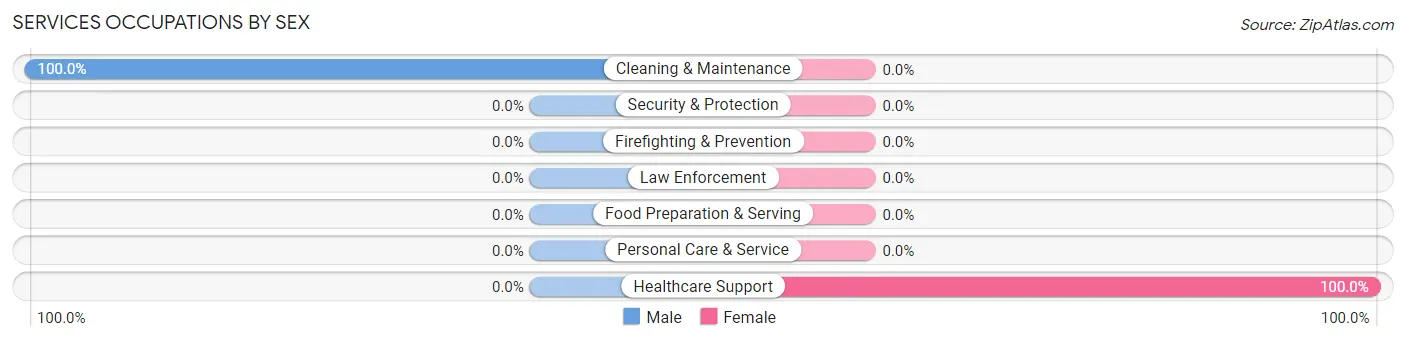
| Occupation | Male | Female |
| Healthcare Support | 0 (0.0%) | 6 (100.0%) |
| Security & Protection | 0 (0.0%) | 0 (0.0%) |
| Firefighting & Prevention | 0 (0.0%) | 0 (0.0%) |
| Law Enforcement | 0 (0.0%) | 0 (0.0%) |
| Food Preparation & Serving | 0 (0.0%) | 0 (0.0%) |
| Cleaning & Maintenance | 16 (100.0%) | 0 (0.0%) |
| Personal Care & Service | 0 (0.0%) | 0 (0.0%) |
| Total (Category) | 16 (72.7%) | 6 (27.3%) |
| Total (Overall) | 55 (59.8%) | 37 (40.2%) |
Sales and Office Occupations
The most common Sales and Office occupations in Iglesia Antigua are , and Sales & Related (26 | 28.3%).

Sales and Office Occupations by Sex

| Occupation | Male | Female |
| Sales & Related | 26 (100.0%) | 0 (0.0%) |
| Office & Administration | 0 (0.0%) | 0 (0.0%) |
| Total (Category) | 26 (100.0%) | 0 (0.0%) |
| Total (Overall) | 55 (59.8%) | 37 (40.2%) |
Natural Resources, Construction and Maintenance Occupations
The most common Natural Resources, Construction and Maintenance occupations in Iglesia Antigua are , and Installation, Maintenance & Repair (5 | 5.4%).
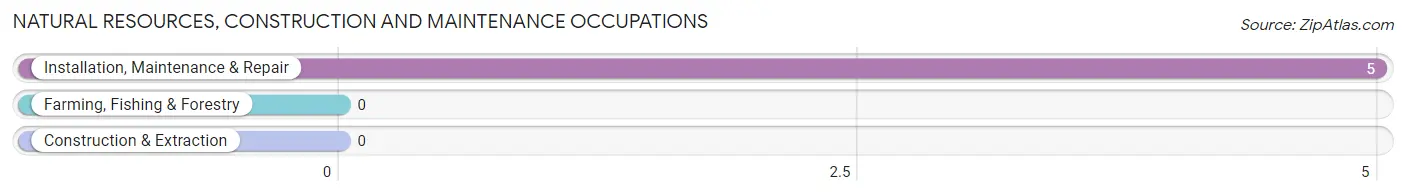
Natural Resources, Construction and Maintenance Occupations by Sex
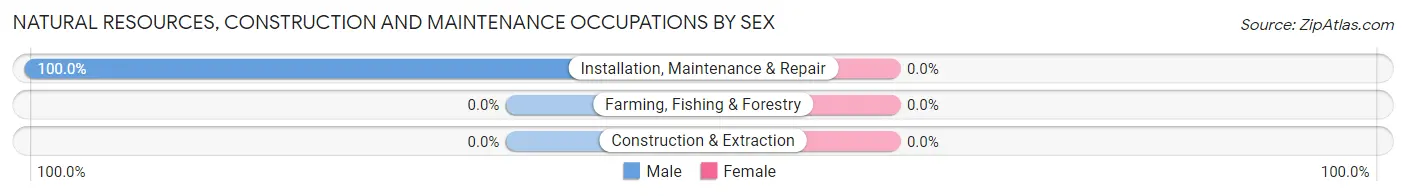
| Occupation | Male | Female |
| Farming, Fishing & Forestry | 0 (0.0%) | 0 (0.0%) |
| Construction & Extraction | 0 (0.0%) | 0 (0.0%) |
| Installation, Maintenance & Repair | 5 (100.0%) | 0 (0.0%) |
| Total (Category) | 5 (100.0%) | 0 (0.0%) |
| Total (Overall) | 55 (59.8%) | 37 (40.2%) |
Production, Transportation and Moving Occupations
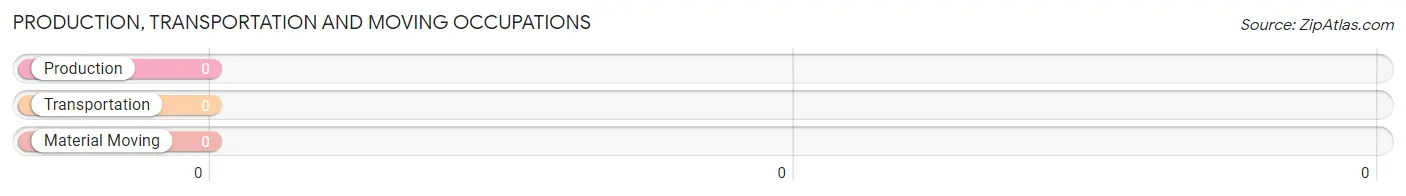
Production, Transportation and Moving Occupations by Sex
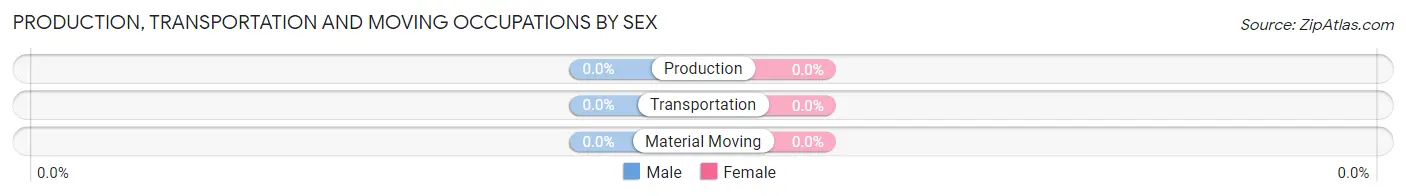
| Occupation | Male | Female |
| Production | 0 (0.0%) | 0 (0.0%) |
| Transportation | 0 (0.0%) | 0 (0.0%) |
| Material Moving | 0 (0.0%) | 0 (0.0%) |
| Total (Category) | 0 (0.0%) | 0 (0.0%) |
| Total (Overall) | 55 (59.8%) | 37 (40.2%) |
Employment Industries by Sex in Iglesia Antigua
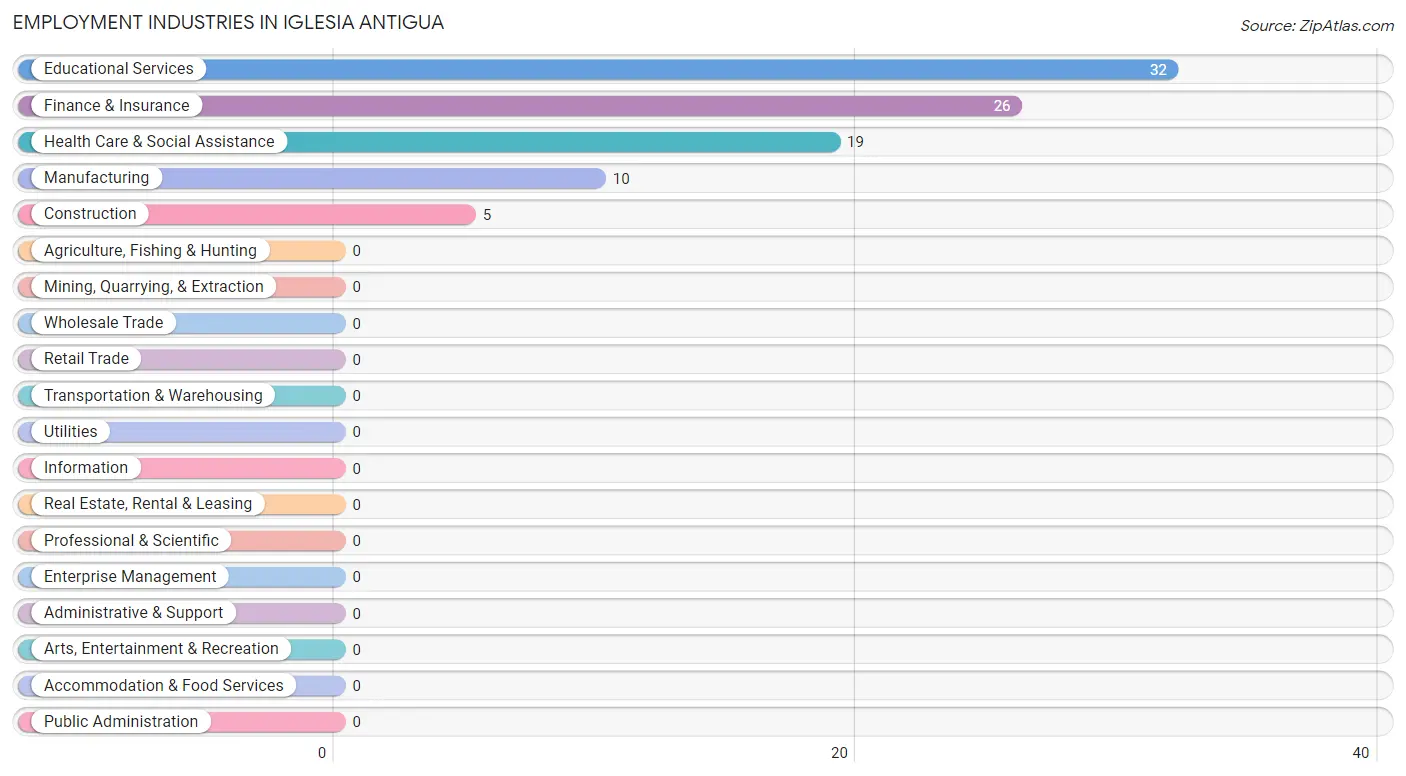
Employment Industries in Iglesia Antigua
The major employment industries in Iglesia Antigua include Educational Services (32 | 34.8%), Finance & Insurance (26 | 28.3%), Health Care & Social Assistance (19 | 20.6%), Manufacturing (10 | 10.9%), and Construction (5 | 5.4%).
Employment Industries by Sex in Iglesia Antigua
The Iglesia Antigua industries that see more men than women are Construction (100.0%), Finance & Insurance (100.0%), and Educational Services (50.0%), whereas the industries that tend to have a higher number of women are Manufacturing (100.0%), Health Care & Social Assistance (57.9%), and Educational Services (50.0%).
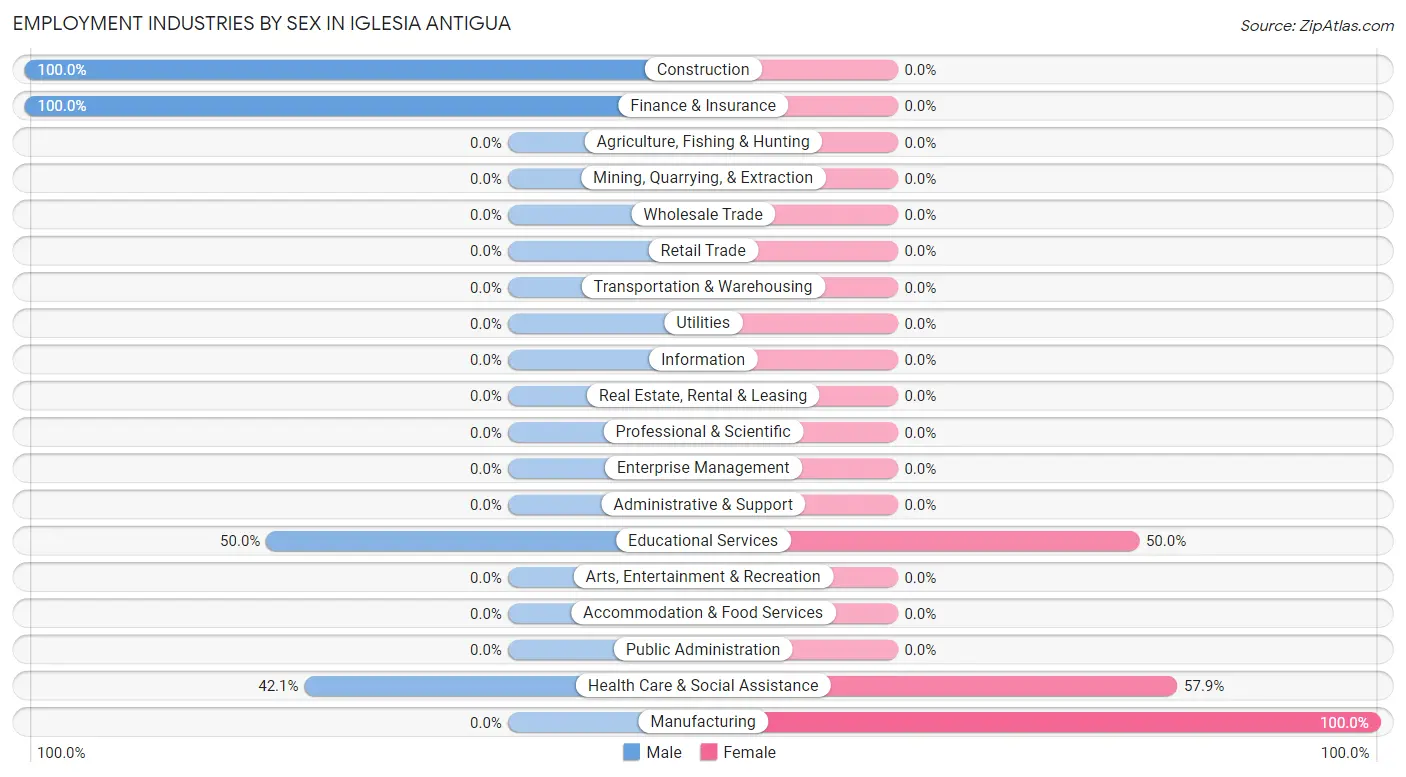
| Industry | Male | Female |
| Agriculture, Fishing & Hunting | 0 (0.0%) | 0 (0.0%) |
| Mining, Quarrying, & Extraction | 0 (0.0%) | 0 (0.0%) |
| Construction | 5 (100.0%) | 0 (0.0%) |
| Manufacturing | 0 (0.0%) | 10 (100.0%) |
| Wholesale Trade | 0 (0.0%) | 0 (0.0%) |
| Retail Trade | 0 (0.0%) | 0 (0.0%) |
| Transportation & Warehousing | 0 (0.0%) | 0 (0.0%) |
| Utilities | 0 (0.0%) | 0 (0.0%) |
| Information | 0 (0.0%) | 0 (0.0%) |
| Finance & Insurance | 26 (100.0%) | 0 (0.0%) |
| Real Estate, Rental & Leasing | 0 (0.0%) | 0 (0.0%) |
| Professional & Scientific | 0 (0.0%) | 0 (0.0%) |
| Enterprise Management | 0 (0.0%) | 0 (0.0%) |
| Administrative & Support | 0 (0.0%) | 0 (0.0%) |
| Educational Services | 16 (50.0%) | 16 (50.0%) |
| Health Care & Social Assistance | 8 (42.1%) | 11 (57.9%) |
| Arts, Entertainment & Recreation | 0 (0.0%) | 0 (0.0%) |
| Accommodation & Food Services | 0 (0.0%) | 0 (0.0%) |
| Public Administration | 0 (0.0%) | 0 (0.0%) |
| Total | 55 (59.8%) | 37 (40.2%) |
Education in Iglesia Antigua
School Enrollment in Iglesia Antigua
| School Level | # Students | % Students |
| Nursery / Preschool | 0 | 0.0% |
| Kindergarten | 0 | 0.0% |
| Elementary School | 0 | 0.0% |
| Middle School | 0 | 0.0% |
| High School | 0 | 0.0% |
| College / Undergraduate | 0 | 0.0% |
| Graduate / Professional | 0 | 0.0% |
| Total | 0 | 0.0% |
School Enrollment by Age by Funding Source in Iglesia Antigua
| Age Bracket | Public School | Private School |
| 3 to 4 Year Olds | 0 (0.0%) | 0 (0.0%) |
| 5 to 9 Year Old | 0 (0.0%) | 0 (0.0%) |
| 10 to 14 Year Olds | 0 (0.0%) | 0 (0.0%) |
| 15 to 17 Year Olds | 0 (0.0%) | 0 (0.0%) |
| 18 to 19 Year Olds | 0 (0.0%) | 0 (0.0%) |
| 20 to 24 Year Olds | 0 (0.0%) | 0 (0.0%) |
| 25 to 34 Year Olds | 0 (0.0%) | 0 (0.0%) |
| 35 Years and over | 0 (0.0%) | 0 (0.0%) |
| Total | 0 (0.0%) | 0 (0.0%) |
Educational Attainment by Field of Study in Iglesia Antigua
| Field of Study | # Graduates | % Graduates |
| Computers & Mathematics | 0 | 0.0% |
| Bio, Nature & Agricultural | 0 | 0.0% |
| Physical & Health Sciences | 0 | 0.0% |
| Psychology | 0 | 0.0% |
| Social Sciences | 0 | 0.0% |
| Engineering | 0 | 0.0% |
| Multidisciplinary Studies | 0 | 0.0% |
| Science & Technology | 0 | 0.0% |
| Business | 0 | 0.0% |
| Education | 0 | 0.0% |
| Literature & Languages | 0 | 0.0% |
| Liberal Arts & History | 0 | 0.0% |
| Visual & Performing Arts | 0 | 0.0% |
| Communications | 0 | 0.0% |
| Arts & Humanities | 0 | 0.0% |
| Total | 0 | 0.0% |
Transportation & Commute in Iglesia Antigua
Vehicle Availability by Sex in Iglesia Antigua
The most prevalent vehicle ownership categories in Iglesia Antigua are males with 3 vehicles (42, accounting for 76.4%) and females with 3 vehicles (16, making up 113.5%).
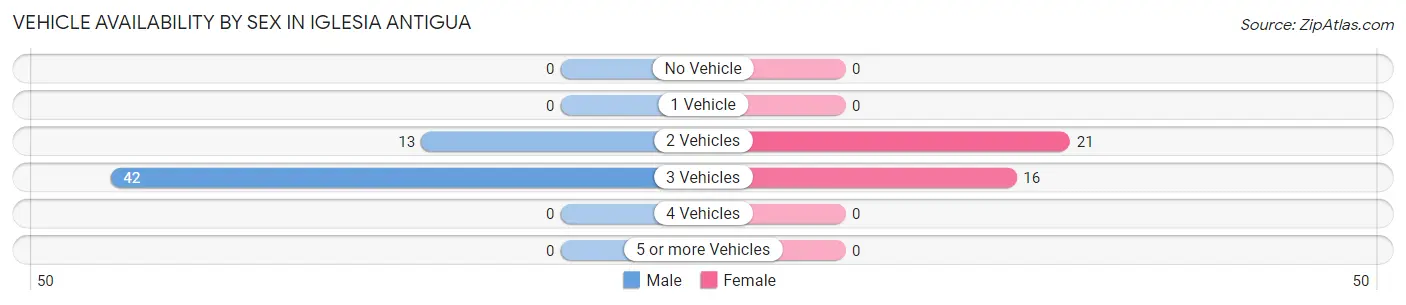
| Vehicles Available | Male | Female |
| No Vehicle | 0 (0.0%) | 0 (0.0%) |
| 1 Vehicle | 0 (0.0%) | 0 (0.0%) |
| 2 Vehicles | 13 (23.6%) | 21 (56.8%) |
| 3 Vehicles | 42 (76.4%) | 16 (43.2%) |
| 4 Vehicles | 0 (0.0%) | 0 (0.0%) |
| 5 or more Vehicles | 0 (0.0%) | 0 (0.0%) |
| Total | 55 (100.0%) | 37 (100.0%) |
Commute Time in Iglesia Antigua
The most frequently occuring commute durations in Iglesia Antigua are 5 to 9 minutes (32 commuters, 34.8%), 40 to 44 minutes (26 commuters, 28.3%), and 20 to 24 minutes (15 commuters, 16.3%).
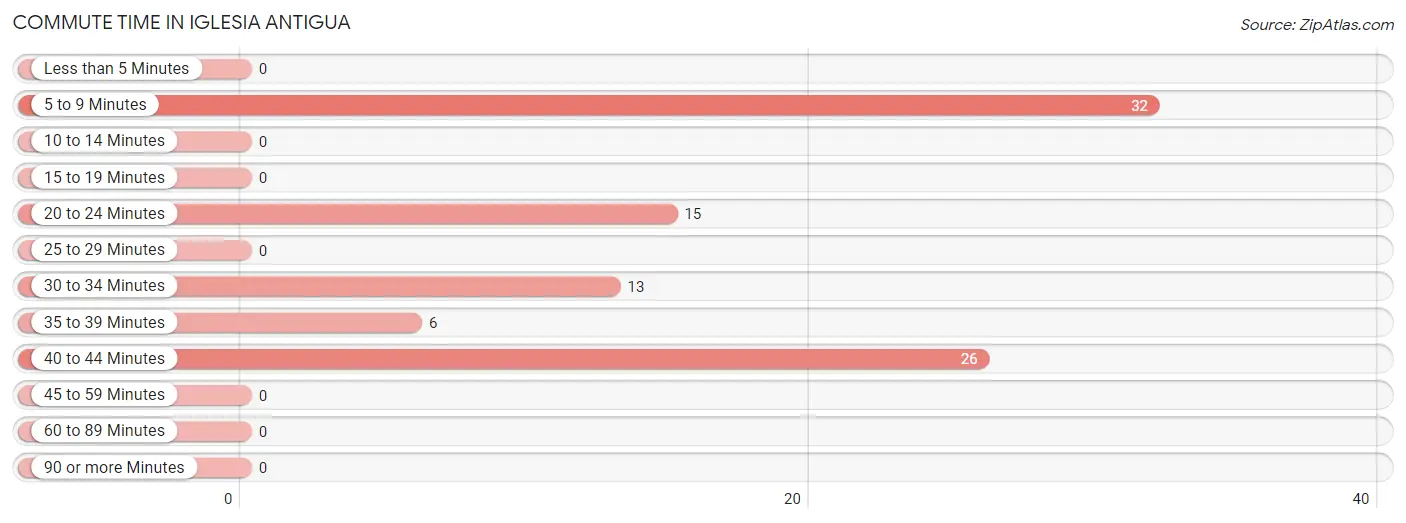
| Commute Time | # Commuters | % Commuters |
| Less than 5 Minutes | 0 | 0.0% |
| 5 to 9 Minutes | 32 | 34.8% |
| 10 to 14 Minutes | 0 | 0.0% |
| 15 to 19 Minutes | 0 | 0.0% |
| 20 to 24 Minutes | 15 | 16.3% |
| 25 to 29 Minutes | 0 | 0.0% |
| 30 to 34 Minutes | 13 | 14.1% |
| 35 to 39 Minutes | 6 | 6.5% |
| 40 to 44 Minutes | 26 | 28.3% |
| 45 to 59 Minutes | 0 | 0.0% |
| 60 to 89 Minutes | 0 | 0.0% |
| 90 or more Minutes | 0 | 0.0% |
Commute Time by Sex in Iglesia Antigua
The most common commute times in Iglesia Antigua are 40 to 44 minutes (26 commuters, 47.3%) for males and 5 to 9 minutes (16 commuters, 43.2%) for females.
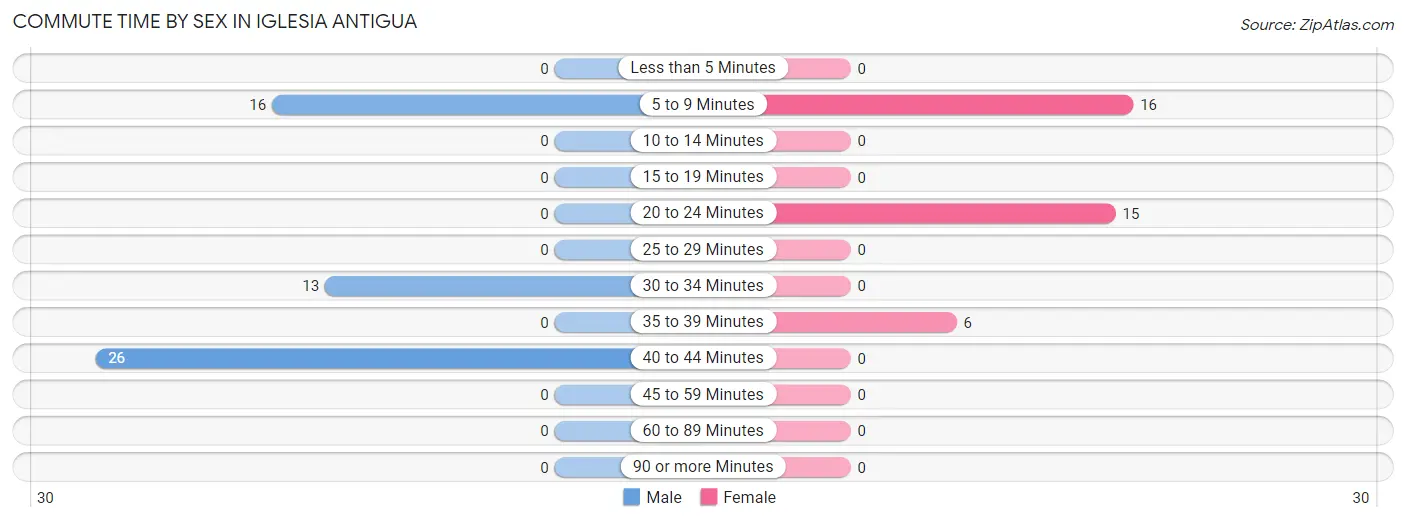
| Commute Time | Male | Female |
| Less than 5 Minutes | 0 (0.0%) | 0 (0.0%) |
| 5 to 9 Minutes | 16 (29.1%) | 16 (43.2%) |
| 10 to 14 Minutes | 0 (0.0%) | 0 (0.0%) |
| 15 to 19 Minutes | 0 (0.0%) | 0 (0.0%) |
| 20 to 24 Minutes | 0 (0.0%) | 15 (40.5%) |
| 25 to 29 Minutes | 0 (0.0%) | 0 (0.0%) |
| 30 to 34 Minutes | 13 (23.6%) | 0 (0.0%) |
| 35 to 39 Minutes | 0 (0.0%) | 6 (16.2%) |
| 40 to 44 Minutes | 26 (47.3%) | 0 (0.0%) |
| 45 to 59 Minutes | 0 (0.0%) | 0 (0.0%) |
| 60 to 89 Minutes | 0 (0.0%) | 0 (0.0%) |
| 90 or more Minutes | 0 (0.0%) | 0 (0.0%) |
Time of Departure to Work by Sex in Iglesia Antigua
The most frequent times of departure to work in Iglesia Antigua are 8:00 AM to 8:29 AM (26, 47.3%) for males and 6:30 AM to 6:59 AM (21, 56.8%) for females.
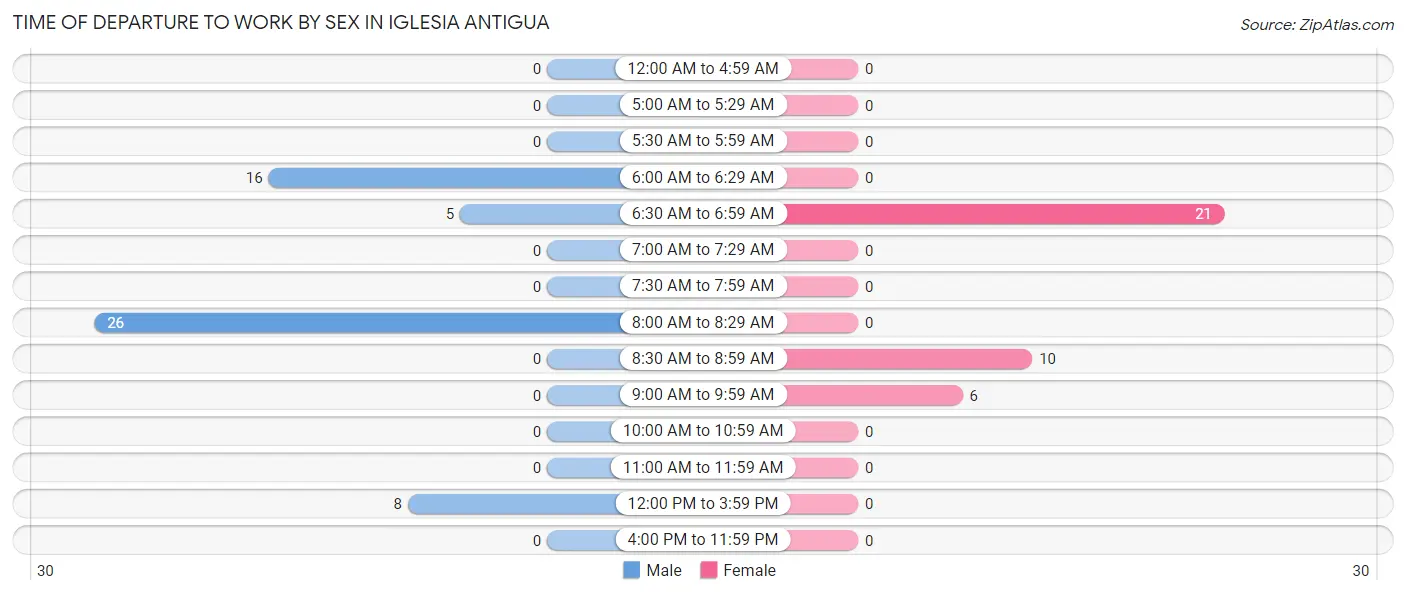
| Time of Departure | Male | Female |
| 12:00 AM to 4:59 AM | 0 (0.0%) | 0 (0.0%) |
| 5:00 AM to 5:29 AM | 0 (0.0%) | 0 (0.0%) |
| 5:30 AM to 5:59 AM | 0 (0.0%) | 0 (0.0%) |
| 6:00 AM to 6:29 AM | 16 (29.1%) | 0 (0.0%) |
| 6:30 AM to 6:59 AM | 5 (9.1%) | 21 (56.8%) |
| 7:00 AM to 7:29 AM | 0 (0.0%) | 0 (0.0%) |
| 7:30 AM to 7:59 AM | 0 (0.0%) | 0 (0.0%) |
| 8:00 AM to 8:29 AM | 26 (47.3%) | 0 (0.0%) |
| 8:30 AM to 8:59 AM | 0 (0.0%) | 10 (27.0%) |
| 9:00 AM to 9:59 AM | 0 (0.0%) | 6 (16.2%) |
| 10:00 AM to 10:59 AM | 0 (0.0%) | 0 (0.0%) |
| 11:00 AM to 11:59 AM | 0 (0.0%) | 0 (0.0%) |
| 12:00 PM to 3:59 PM | 8 (14.5%) | 0 (0.0%) |
| 4:00 PM to 11:59 PM | 0 (0.0%) | 0 (0.0%) |
| Total | 55 (100.0%) | 37 (100.0%) |
Housing Occupancy in Iglesia Antigua
Occupancy by Ownership in Iglesia Antigua
Of the total 39 dwellings in Iglesia Antigua, owner-occupied units account for 31 (79.5%), while renter-occupied units make up 8 (20.5%).
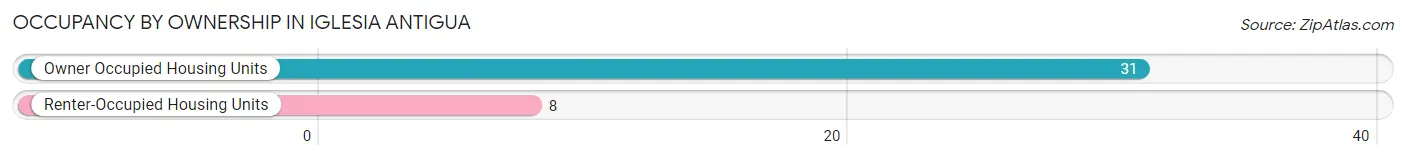
| Occupancy | # Housing Units | % Housing Units |
| Owner Occupied Housing Units | 31 | 79.5% |
| Renter-Occupied Housing Units | 8 | 20.5% |
| Total Occupied Housing Units | 39 | 100.0% |
Occupancy by Household Size in Iglesia Antigua
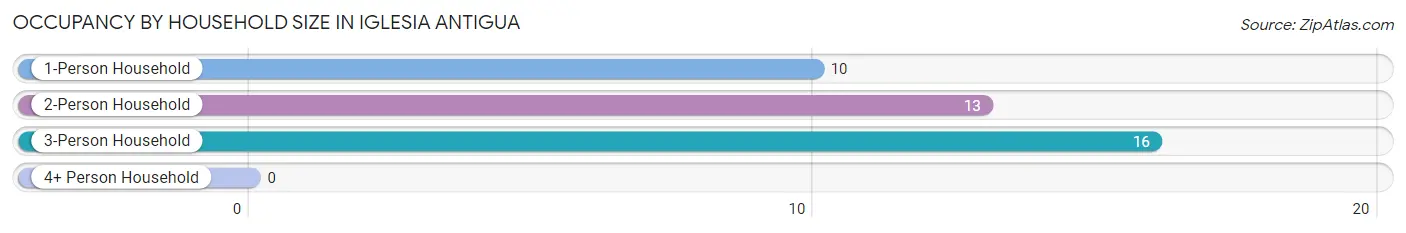
| Household Size | # Housing Units | % Housing Units |
| 1-Person Household | 10 | 25.6% |
| 2-Person Household | 13 | 33.3% |
| 3-Person Household | 16 | 41.0% |
| 4+ Person Household | 0 | 0.0% |
| Total Housing Units | 39 | 100.0% |
Occupancy by Ownership by Household Size in Iglesia Antigua
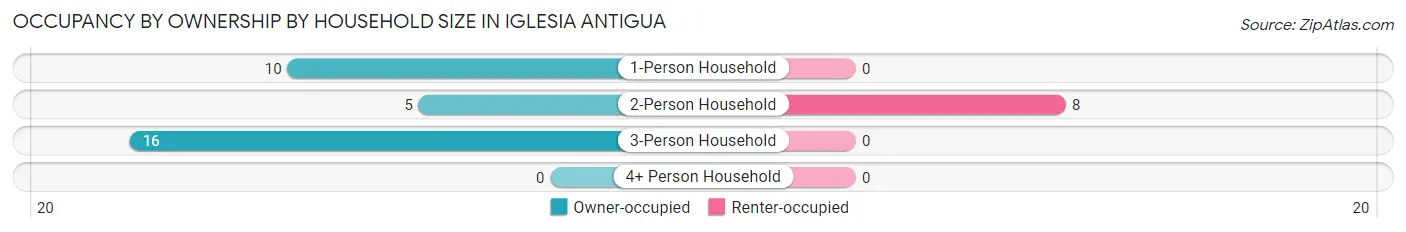
| Household Size | Owner-occupied | Renter-occupied |
| 1-Person Household | 10 (100.0%) | 0 (0.0%) |
| 2-Person Household | 5 (38.5%) | 8 (61.5%) |
| 3-Person Household | 16 (100.0%) | 0 (0.0%) |
| 4+ Person Household | 0 (0.0%) | 0 (0.0%) |
| Total Housing Units | 31 (79.5%) | 8 (20.5%) |
Occupancy by Educational Attainment in Iglesia Antigua
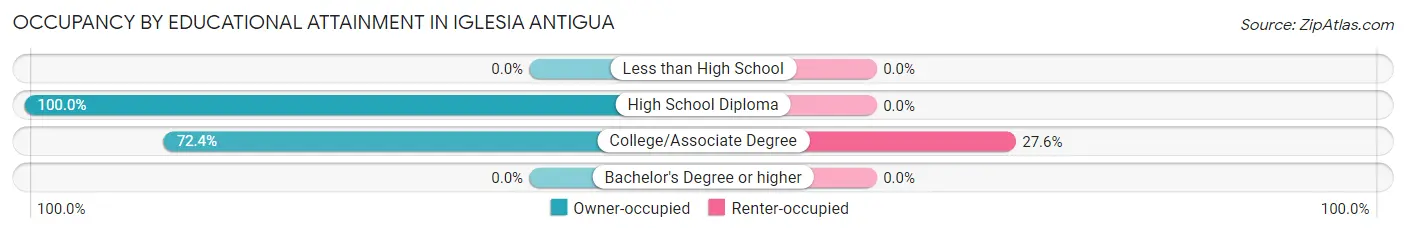
| Household Size | Owner-occupied | Renter-occupied |
| Less than High School | 0 (0.0%) | 0 (0.0%) |
| High School Diploma | 10 (100.0%) | 0 (0.0%) |
| College/Associate Degree | 21 (72.4%) | 8 (27.6%) |
| Bachelor's Degree or higher | 0 (0.0%) | 0 (0.0%) |
Occupancy by Age of Householder in Iglesia Antigua
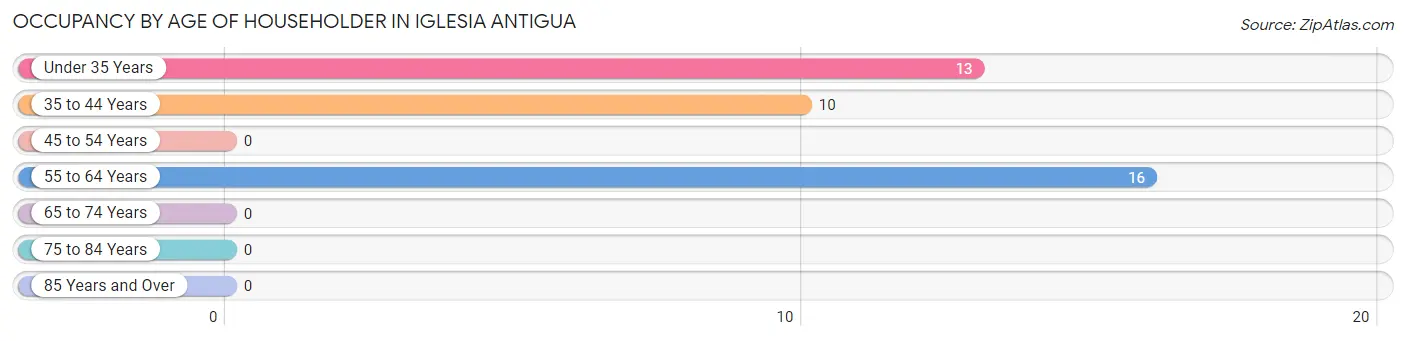
| Age Bracket | # Households | % Households |
| Under 35 Years | 13 | 33.3% |
| 35 to 44 Years | 10 | 25.6% |
| 45 to 54 Years | 0 | 0.0% |
| 55 to 64 Years | 16 | 41.0% |
| 65 to 74 Years | 0 | 0.0% |
| 75 to 84 Years | 0 | 0.0% |
| 85 Years and Over | 0 | 0.0% |
| Total | 39 | 100.0% |
Housing Finances in Iglesia Antigua
Median Income by Occupancy in Iglesia Antigua
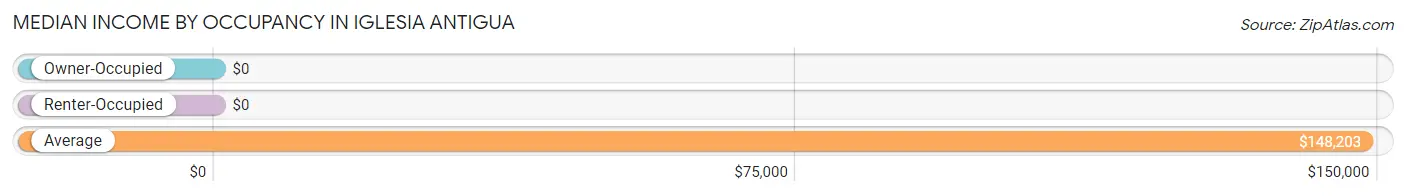
| Occupancy Type | # Households | Median Income |
| Owner-Occupied | 31 (79.5%) | $0 |
| Renter-Occupied | 8 (20.5%) | $0 |
| Average | 39 (100.0%) | $148,203 |
Occupancy by Householder Income Bracket in Iglesia Antigua
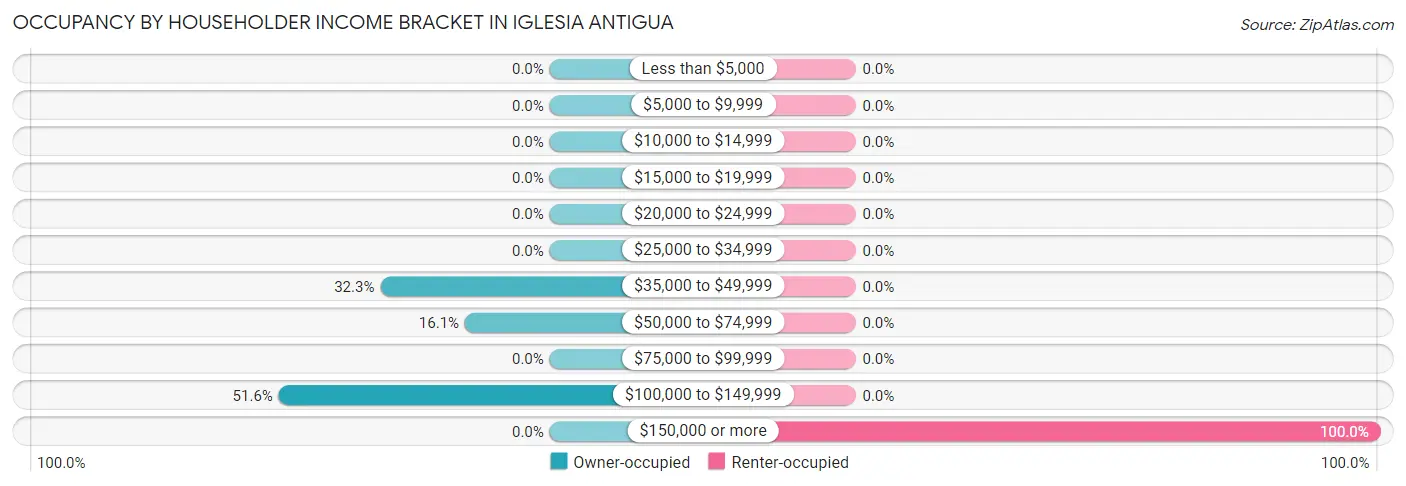
| Income Bracket | Owner-occupied | Renter-occupied |
| Less than $5,000 | 0 (0.0%) | 0 (0.0%) |
| $5,000 to $9,999 | 0 (0.0%) | 0 (0.0%) |
| $10,000 to $14,999 | 0 (0.0%) | 0 (0.0%) |
| $15,000 to $19,999 | 0 (0.0%) | 0 (0.0%) |
| $20,000 to $24,999 | 0 (0.0%) | 0 (0.0%) |
| $25,000 to $34,999 | 0 (0.0%) | 0 (0.0%) |
| $35,000 to $49,999 | 10 (32.3%) | 0 (0.0%) |
| $50,000 to $74,999 | 5 (16.1%) | 0 (0.0%) |
| $75,000 to $99,999 | 0 (0.0%) | 0 (0.0%) |
| $100,000 to $149,999 | 16 (51.6%) | 0 (0.0%) |
| $150,000 or more | 0 (0.0%) | 8 (100.0%) |
| Total | 31 (100.0%) | 8 (100.0%) |
Monthly Housing Cost Tiers in Iglesia Antigua
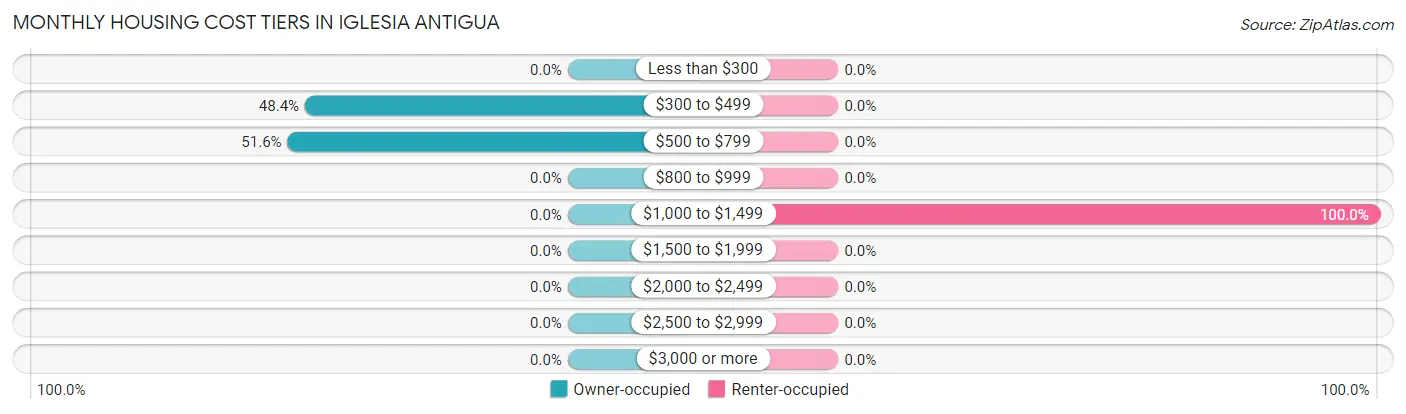
| Monthly Cost | Owner-occupied | Renter-occupied |
| Less than $300 | 0 (0.0%) | 0 (0.0%) |
| $300 to $499 | 15 (48.4%) | 0 (0.0%) |
| $500 to $799 | 16 (51.6%) | 0 (0.0%) |
| $800 to $999 | 0 (0.0%) | 0 (0.0%) |
| $1,000 to $1,499 | 0 (0.0%) | 8 (100.0%) |
| $1,500 to $1,999 | 0 (0.0%) | 0 (0.0%) |
| $2,000 to $2,499 | 0 (0.0%) | 0 (0.0%) |
| $2,500 to $2,999 | 0 (0.0%) | 0 (0.0%) |
| $3,000 or more | 0 (0.0%) | 0 (0.0%) |
| Total | 31 (100.0%) | 8 (100.0%) |
Physical Housing Characteristics in Iglesia Antigua
Housing Structures in Iglesia Antigua
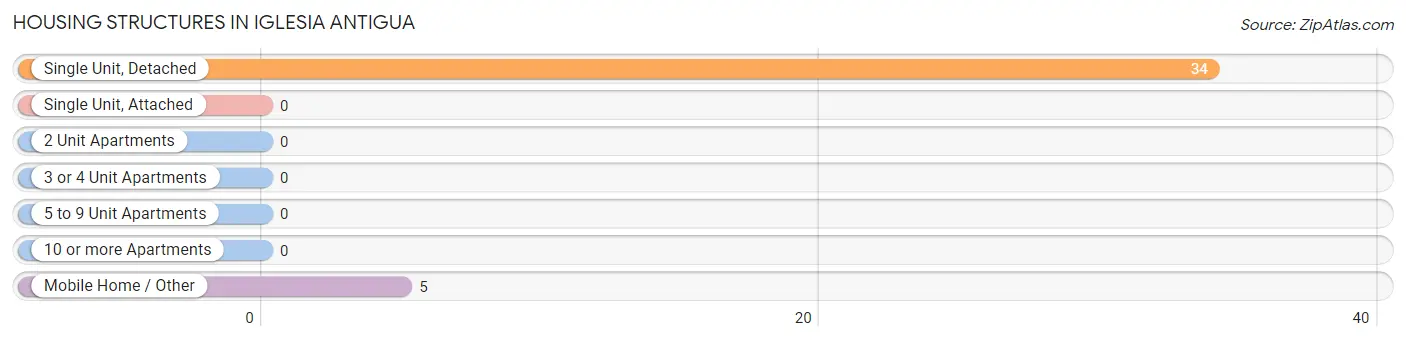
| Structure Type | # Housing Units | % Housing Units |
| Single Unit, Detached | 34 | 87.2% |
| Single Unit, Attached | 0 | 0.0% |
| 2 Unit Apartments | 0 | 0.0% |
| 3 or 4 Unit Apartments | 0 | 0.0% |
| 5 to 9 Unit Apartments | 0 | 0.0% |
| 10 or more Apartments | 0 | 0.0% |
| Mobile Home / Other | 5 | 12.8% |
| Total | 39 | 100.0% |
Housing Structures by Occupancy in Iglesia Antigua
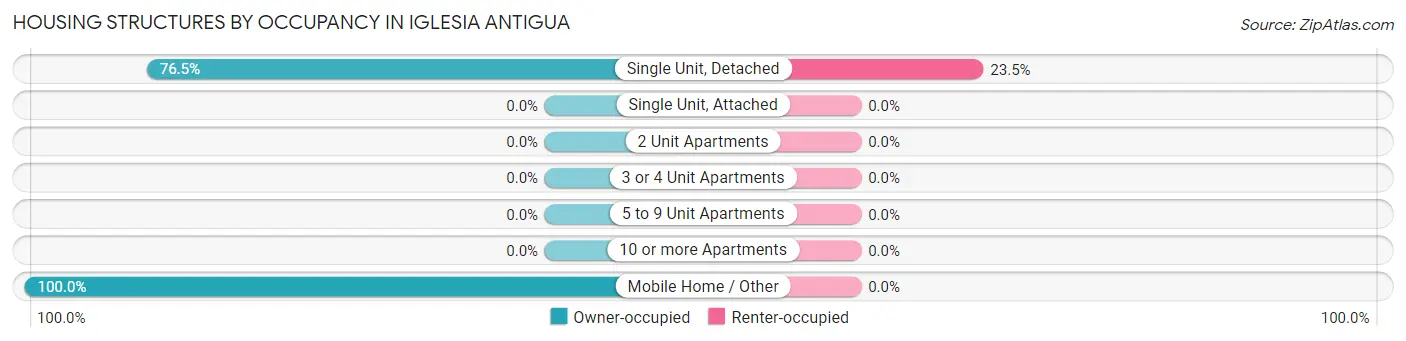
| Structure Type | Owner-occupied | Renter-occupied |
| Single Unit, Detached | 26 (76.5%) | 8 (23.5%) |
| Single Unit, Attached | 0 (0.0%) | 0 (0.0%) |
| 2 Unit Apartments | 0 (0.0%) | 0 (0.0%) |
| 3 or 4 Unit Apartments | 0 (0.0%) | 0 (0.0%) |
| 5 to 9 Unit Apartments | 0 (0.0%) | 0 (0.0%) |
| 10 or more Apartments | 0 (0.0%) | 0 (0.0%) |
| Mobile Home / Other | 5 (100.0%) | 0 (0.0%) |
| Total | 31 (79.5%) | 8 (20.5%) |
Housing Structures by Number of Rooms in Iglesia Antigua
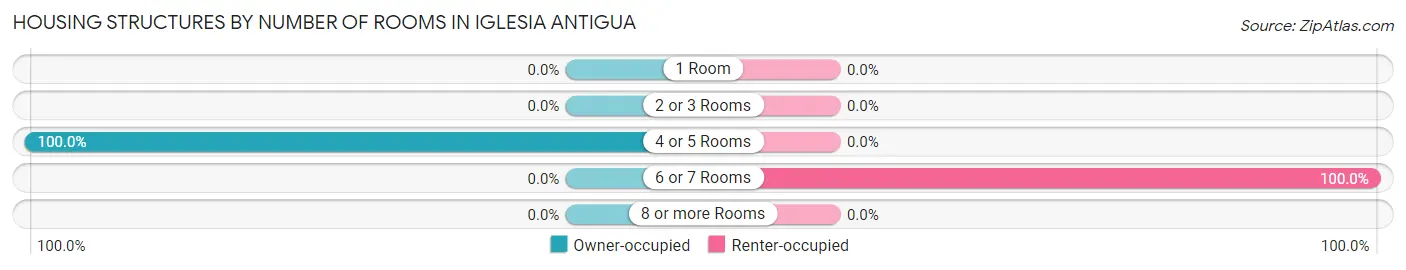
| Number of Rooms | Owner-occupied | Renter-occupied |
| 1 Room | 0 (0.0%) | 0 (0.0%) |
| 2 or 3 Rooms | 0 (0.0%) | 0 (0.0%) |
| 4 or 5 Rooms | 31 (100.0%) | 0 (0.0%) |
| 6 or 7 Rooms | 0 (0.0%) | 8 (100.0%) |
| 8 or more Rooms | 0 (0.0%) | 0 (0.0%) |
| Total | 31 (100.0%) | 8 (100.0%) |
Housing Structure by Heating Type in Iglesia Antigua
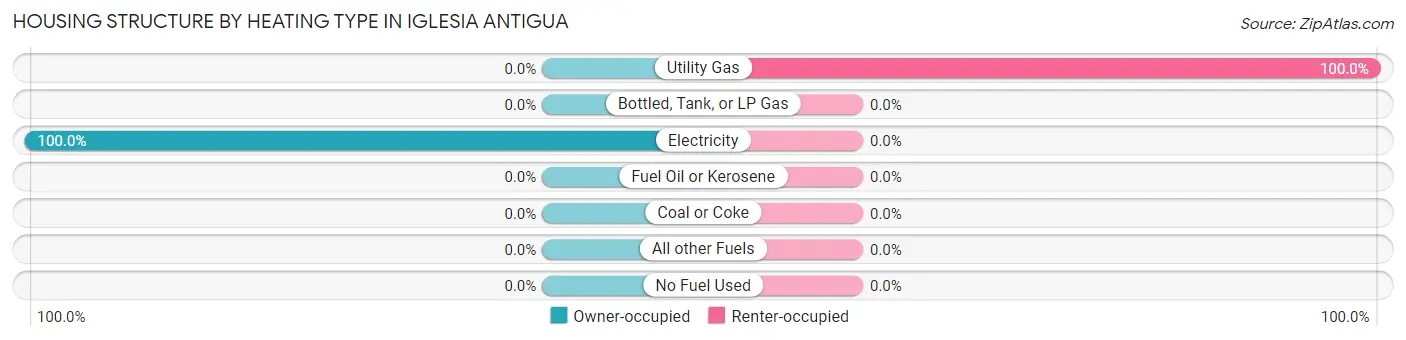
| Heating Type | Owner-occupied | Renter-occupied |
| Utility Gas | 0 (0.0%) | 8 (100.0%) |
| Bottled, Tank, or LP Gas | 0 (0.0%) | 0 (0.0%) |
| Electricity | 31 (100.0%) | 0 (0.0%) |
| Fuel Oil or Kerosene | 0 (0.0%) | 0 (0.0%) |
| Coal or Coke | 0 (0.0%) | 0 (0.0%) |
| All other Fuels | 0 (0.0%) | 0 (0.0%) |
| No Fuel Used | 0 (0.0%) | 0 (0.0%) |
| Total | 31 (100.0%) | 8 (100.0%) |
Household Vehicle Usage in Iglesia Antigua
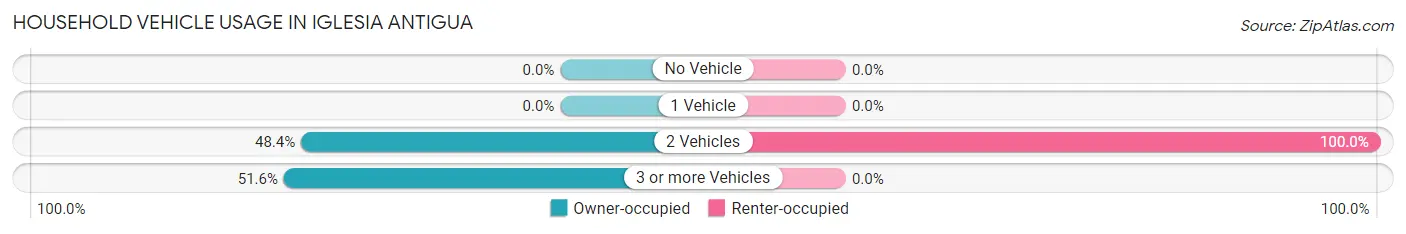
| Vehicles per Household | Owner-occupied | Renter-occupied |
| No Vehicle | 0 (0.0%) | 0 (0.0%) |
| 1 Vehicle | 0 (0.0%) | 0 (0.0%) |
| 2 Vehicles | 15 (48.4%) | 8 (100.0%) |
| 3 or more Vehicles | 16 (51.6%) | 0 (0.0%) |
| Total | 31 (100.0%) | 8 (100.0%) |
Real Estate & Mortgages in Iglesia Antigua
Real Estate and Mortgage Overview in Iglesia Antigua
| Characteristic | Without Mortgage | With Mortgage |
| Housing Units | 31 | 0 |
| Median Property Value | $60,300 | $0 |
| Median Household Income | - | - |
| Monthly Housing Costs | $503 | $0 |
| Real Estate Taxes | $1,172 | $0 |
Property Value by Mortgage Status in Iglesia Antigua
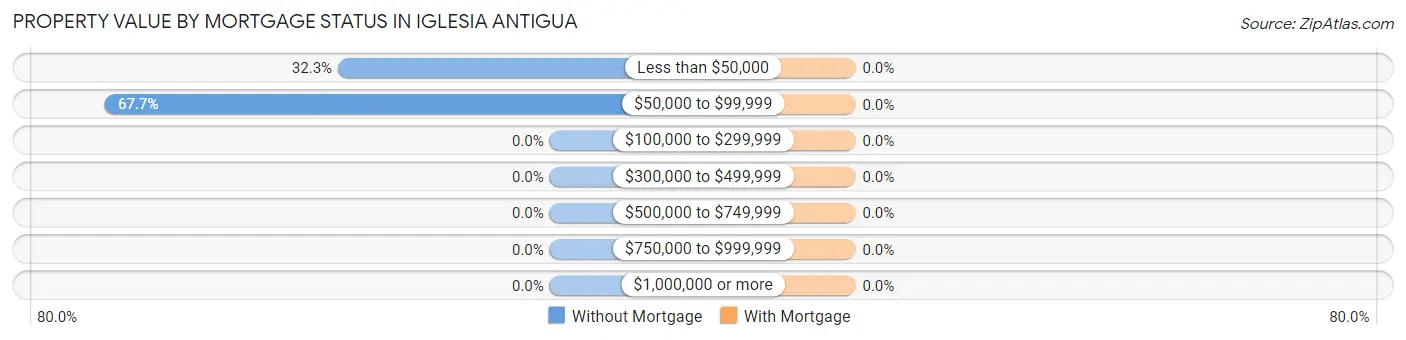
| Property Value | Without Mortgage | With Mortgage |
| Less than $50,000 | 10 (32.3%) | 0 (0.0%) |
| $50,000 to $99,999 | 21 (67.7%) | 0 (0.0%) |
| $100,000 to $299,999 | 0 (0.0%) | 0 (0.0%) |
| $300,000 to $499,999 | 0 (0.0%) | 0 (0.0%) |
| $500,000 to $749,999 | 0 (0.0%) | 0 (0.0%) |
| $750,000 to $999,999 | 0 (0.0%) | 0 (0.0%) |
| $1,000,000 or more | 0 (0.0%) | 0 (0.0%) |
| Total | 31 (100.0%) | 0 (0.0%) |
Household Income by Mortgage Status in Iglesia Antigua
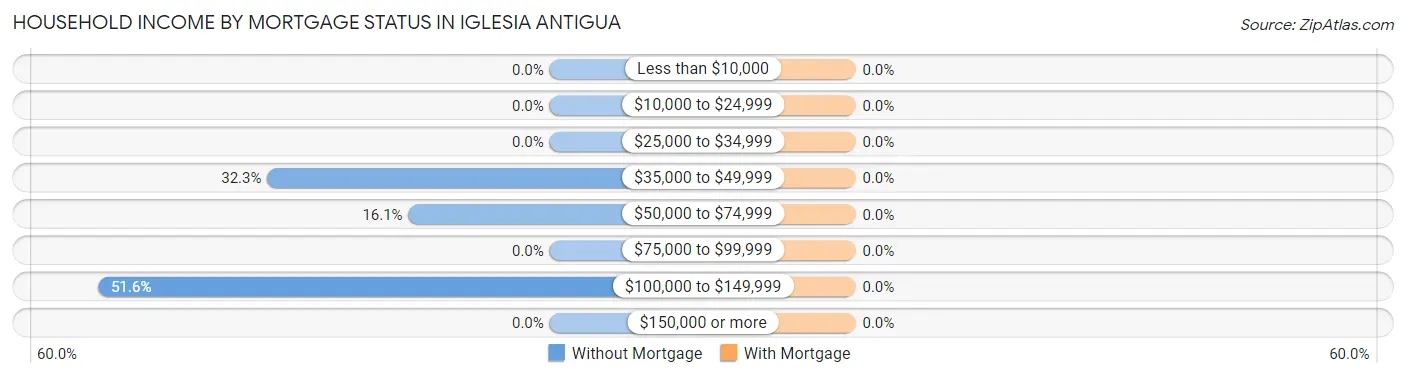
| Household Income | Without Mortgage | With Mortgage |
| Less than $10,000 | 0 (0.0%) | 0 (0.0%) |
| $10,000 to $24,999 | 0 (0.0%) | 0 (0.0%) |
| $25,000 to $34,999 | 0 (0.0%) | 0 (0.0%) |
| $35,000 to $49,999 | 10 (32.3%) | 0 (0.0%) |
| $50,000 to $74,999 | 5 (16.1%) | 0 (0.0%) |
| $75,000 to $99,999 | 0 (0.0%) | 0 (0.0%) |
| $100,000 to $149,999 | 16 (51.6%) | 0 (0.0%) |
| $150,000 or more | 0 (0.0%) | 0 (0.0%) |
| Total | 31 (100.0%) | 0 (0.0%) |
Property Value to Household Income Ratio in Iglesia Antigua
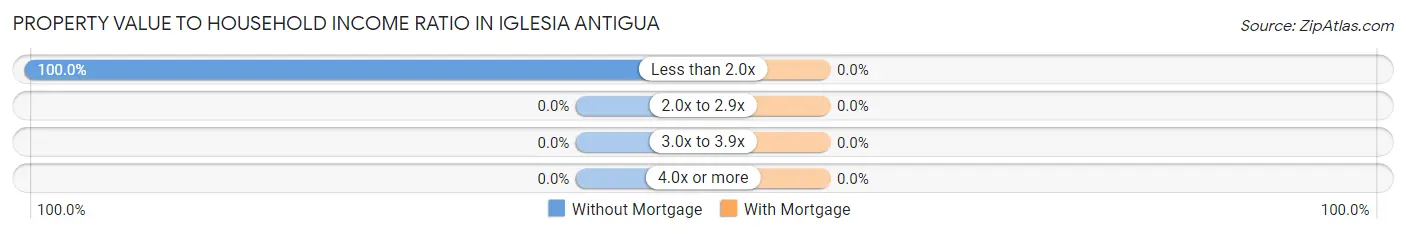
| Value-to-Income Ratio | Without Mortgage | With Mortgage |
| Less than 2.0x | 31 (100.0%) | 0 (0.0%) |
| 2.0x to 2.9x | 0 (0.0%) | 0 (0.0%) |
| 3.0x to 3.9x | 0 (0.0%) | 0 (0.0%) |
| 4.0x or more | 0 (0.0%) | 0 (0.0%) |
| Total | 31 (100.0%) | 0 (0.0%) |
Real Estate Taxes by Mortgage Status in Iglesia Antigua
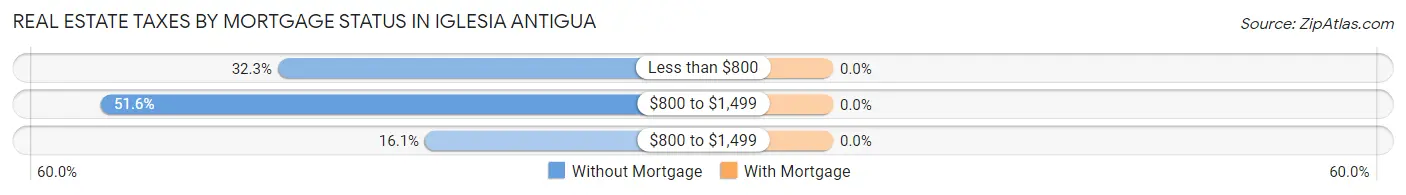
| Property Taxes | Without Mortgage | With Mortgage |
| Less than $800 | 10 (32.3%) | 0 (0.0%) |
| $800 to $1,499 | 16 (51.6%) | 0 (0.0%) |
| $800 to $1,499 | 5 (16.1%) | 0 (0.0%) |
| Total | 31 (100.0%) | 0 (0.0%) |
Health & Disability in Iglesia Antigua
Health Insurance Coverage by Age in Iglesia Antigua
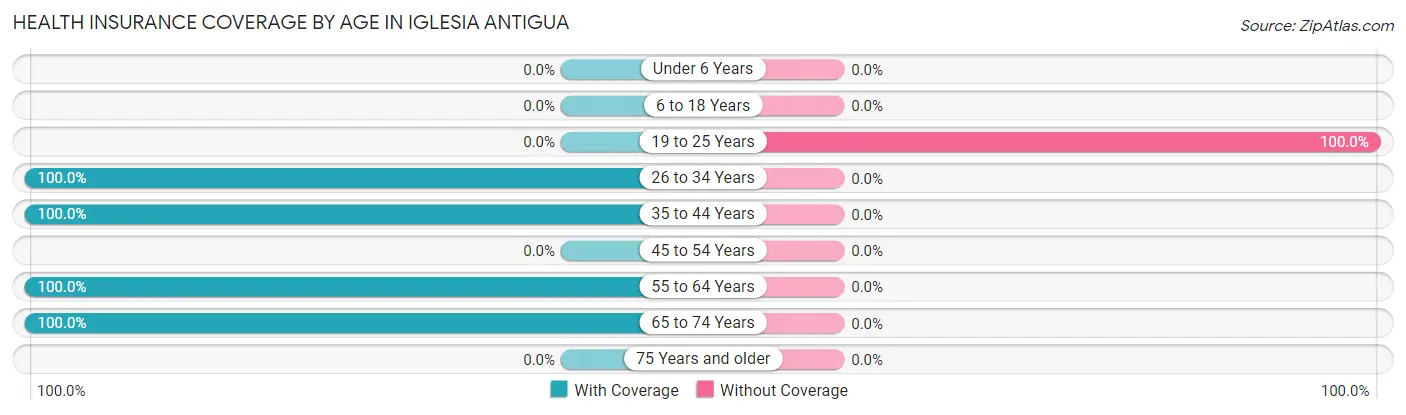
| Age Bracket | With Coverage | Without Coverage |
| Under 6 Years | 0 (0.0%) | 0 (0.0%) |
| 6 to 18 Years | 0 (0.0%) | 0 (0.0%) |
| 19 to 25 Years | 0 (0.0%) | 26 (100.0%) |
| 26 to 34 Years | 18 (100.0%) | 0 (0.0%) |
| 35 to 44 Years | 16 (100.0%) | 0 (0.0%) |
| 45 to 54 Years | 0 (0.0%) | 0 (0.0%) |
| 55 to 64 Years | 16 (100.0%) | 0 (0.0%) |
| 65 to 74 Years | 16 (100.0%) | 0 (0.0%) |
| 75 Years and older | 0 (0.0%) | 0 (0.0%) |
| Total | 66 (71.7%) | 26 (28.3%) |
Health Insurance Coverage by Citizenship Status in Iglesia Antigua
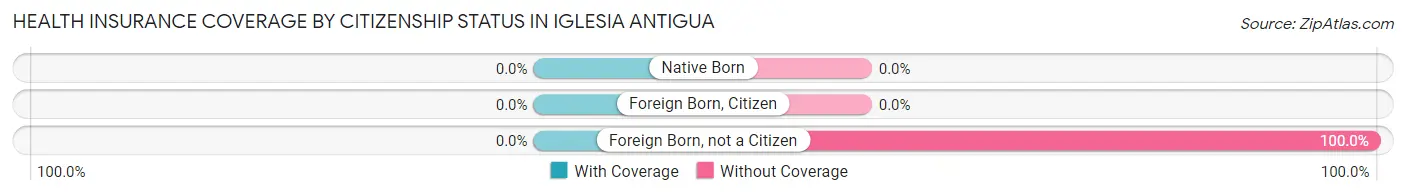
| Citizenship Status | With Coverage | Without Coverage |
| Native Born | 0 (0.0%) | 0 (0.0%) |
| Foreign Born, Citizen | 0 (0.0%) | 0 (0.0%) |
| Foreign Born, not a Citizen | 0 (0.0%) | 26 (100.0%) |
Health Insurance Coverage by Household Income in Iglesia Antigua
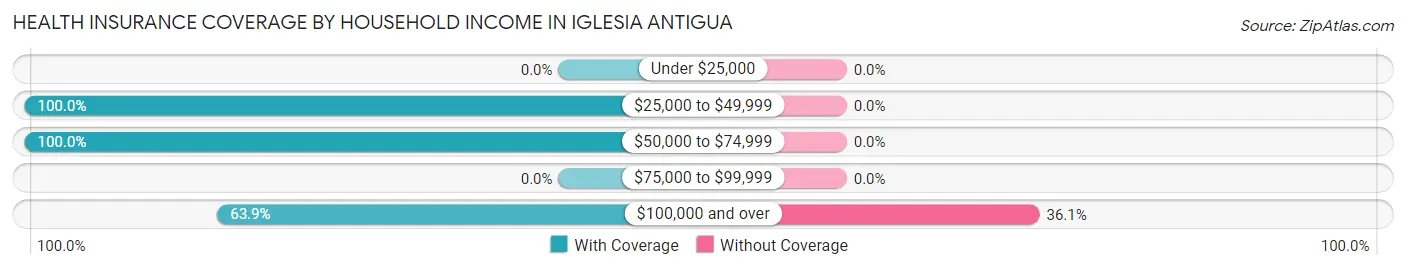
| Household Income | With Coverage | Without Coverage |
| Under $25,000 | 0 (0.0%) | 0 (0.0%) |
| $25,000 to $49,999 | 10 (100.0%) | 0 (0.0%) |
| $50,000 to $74,999 | 10 (100.0%) | 0 (0.0%) |
| $75,000 to $99,999 | 0 (0.0%) | 0 (0.0%) |
| $100,000 and over | 46 (63.9%) | 26 (36.1%) |
Public vs Private Health Insurance Coverage by Age in Iglesia Antigua
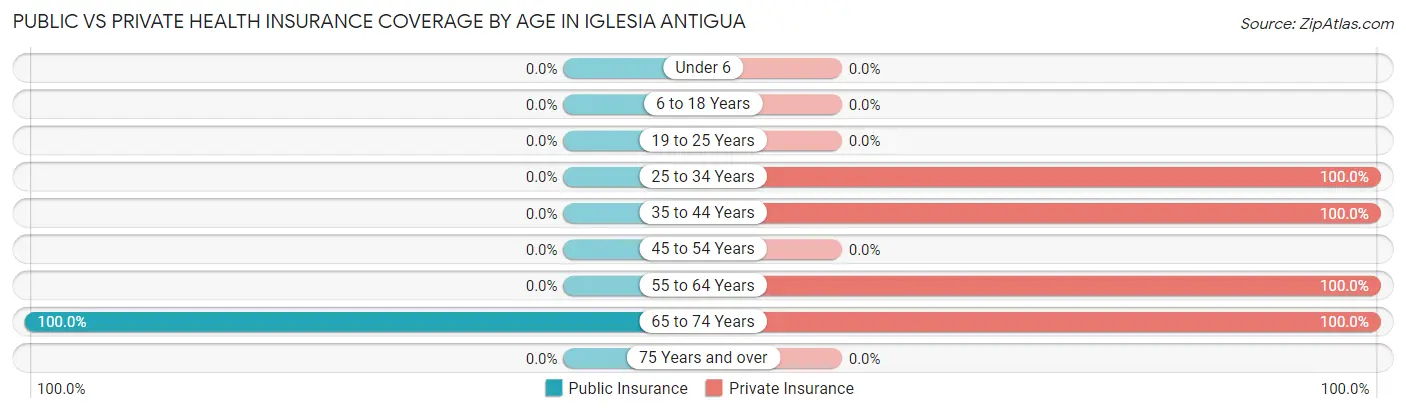
| Age Bracket | Public Insurance | Private Insurance |
| Under 6 | 0 (0.0%) | 0 (0.0%) |
| 6 to 18 Years | 0 (0.0%) | 0 (0.0%) |
| 19 to 25 Years | 0 (0.0%) | 0 (0.0%) |
| 25 to 34 Years | 0 (0.0%) | 18 (100.0%) |
| 35 to 44 Years | 0 (0.0%) | 16 (100.0%) |
| 45 to 54 Years | 0 (0.0%) | 0 (0.0%) |
| 55 to 64 Years | 0 (0.0%) | 16 (100.0%) |
| 65 to 74 Years | 16 (100.0%) | 16 (100.0%) |
| 75 Years and over | 0 (0.0%) | 0 (0.0%) |
| Total | 16 (17.4%) | 66 (71.7%) |
Disability Status by Sex by Age in Iglesia Antigua
| Age Bracket | Male | Female |
| Under 5 Years | 0 (0.0%) | 0 (0.0%) |
| 5 to 17 Years | 0 (0.0%) | 0 (0.0%) |
| 18 to 34 Years | 0 (0.0%) | 0 (0.0%) |
| 35 to 64 Years | 0 (0.0%) | 0 (0.0%) |
| 65 to 74 Years | 0 (0.0%) | 0 (0.0%) |
| 75 Years and over | 0 (0.0%) | 0 (0.0%) |
Disability Class by Sex by Age in Iglesia Antigua
Disability Class: Hearing Difficulty
| Age Bracket | Male | Female |
| Under 5 Years | 0 (0.0%) | 0 (0.0%) |
| 5 to 17 Years | 0 (0.0%) | 0 (0.0%) |
| 18 to 34 Years | 0 (0.0%) | 0 (0.0%) |
| 35 to 64 Years | 0 (0.0%) | 0 (0.0%) |
| 65 to 74 Years | 0 (0.0%) | 0 (0.0%) |
| 75 Years and over | 0 (0.0%) | 0 (0.0%) |
Disability Class: Vision Difficulty
| Age Bracket | Male | Female |
| Under 5 Years | 0 (0.0%) | 0 (0.0%) |
| 5 to 17 Years | 0 (0.0%) | 0 (0.0%) |
| 18 to 34 Years | 0 (0.0%) | 0 (0.0%) |
| 35 to 64 Years | 0 (0.0%) | 0 (0.0%) |
| 65 to 74 Years | 0 (0.0%) | 0 (0.0%) |
| 75 Years and over | 0 (0.0%) | 0 (0.0%) |
Disability Class: Cognitive Difficulty
| Age Bracket | Male | Female |
| 5 to 17 Years | 0 (0.0%) | 0 (0.0%) |
| 18 to 34 Years | 0 (0.0%) | 0 (0.0%) |
| 35 to 64 Years | 0 (0.0%) | 0 (0.0%) |
| 65 to 74 Years | 0 (0.0%) | 0 (0.0%) |
| 75 Years and over | 0 (0.0%) | 0 (0.0%) |
Disability Class: Ambulatory Difficulty

| Age Bracket | Male | Female |
| 5 to 17 Years | 0 (0.0%) | 0 (0.0%) |
| 18 to 34 Years | 0 (0.0%) | 0 (0.0%) |
| 35 to 64 Years | 0 (0.0%) | 0 (0.0%) |
| 65 to 74 Years | 0 (0.0%) | 0 (0.0%) |
| 75 Years and over | 0 (0.0%) | 0 (0.0%) |
Disability Class: Self-Care Difficulty
| Age Bracket | Male | Female |
| 5 to 17 Years | 0 (0.0%) | 0 (0.0%) |
| 18 to 34 Years | 0 (0.0%) | 0 (0.0%) |
| 35 to 64 Years | 0 (0.0%) | 0 (0.0%) |
| 65 to 74 Years | 0 (0.0%) | 0 (0.0%) |
| 75 Years and over | 0 (0.0%) | 0 (0.0%) |
Technology Access in Iglesia Antigua
Computing Device Access in Iglesia Antigua
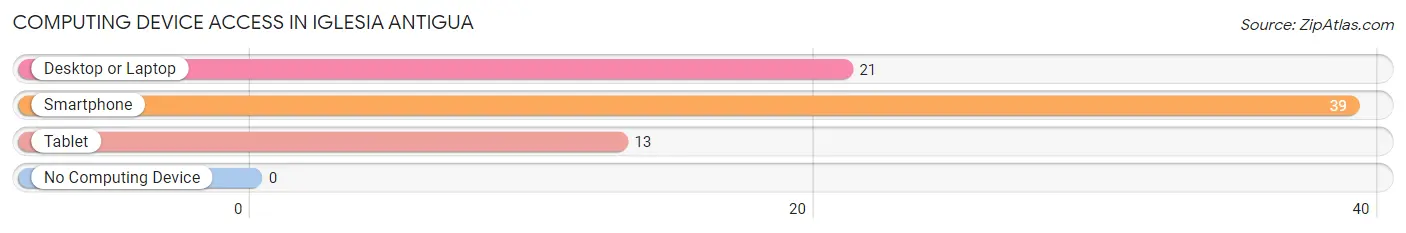
| Device Type | # Households | % Households |
| Desktop or Laptop | 21 | 53.8% |
| Smartphone | 39 | 100.0% |
| Tablet | 13 | 33.3% |
| No Computing Device | 0 | 0.0% |
| Total | 39 | 100.0% |
Internet Access in Iglesia Antigua
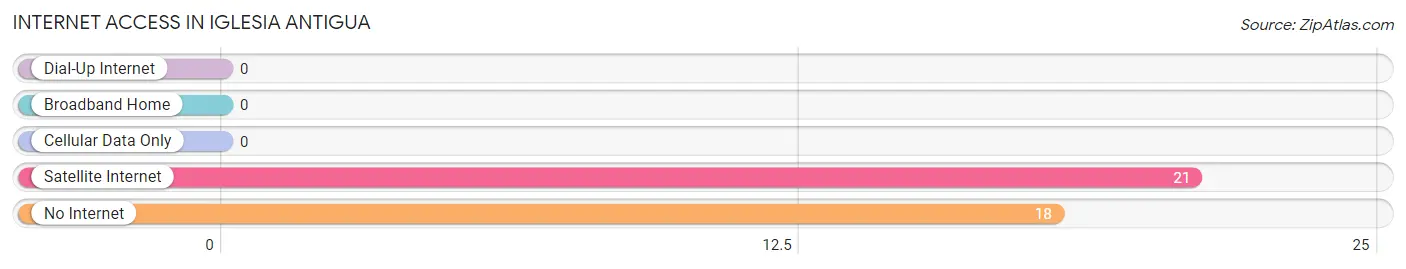
| Internet Type | # Households | % Households |
| Dial-Up Internet | 0 | 0.0% |
| Broadband Home | 0 | 0.0% |
| Cellular Data Only | 0 | 0.0% |
| Satellite Internet | 21 | 53.8% |
| No Internet | 18 | 46.2% |
| Total | 39 | 100.0% |
Iglesia Antigua Summary
Iglesia Antigua, Texas is a small town located in the Rio Grande Valley of South Texas. It is situated in Hidalgo County, approximately 20 miles south of McAllen and 30 miles north of Brownsville. The town is home to a population of approximately 1,500 people, most of whom are of Hispanic descent.
History
Iglesia Antigua was founded in 1883 by a group of Mexican settlers who were looking for a place to settle and practice their Catholic faith. The town was named after the Iglesia Antigua, a Catholic church that was built in the area in 1884. The church still stands today and is the oldest building in the town.
The town grew slowly over the years, but it was not until the 1950s that it began to experience significant growth. This was due to the influx of Mexican immigrants who were looking for work in the area. The population of Iglesia Antigua increased from 1,000 in 1950 to 1,500 in 2000.
Geography
Iglesia Antigua is located in the Rio Grande Valley of South Texas. It is situated in Hidalgo County, approximately 20 miles south of McAllen and 30 miles north of Brownsville. The town is located on the banks of the Rio Grande River, which forms the border between the United States and Mexico.
The town is surrounded by agricultural land, which is used to grow a variety of crops, including cotton, corn, and sorghum. The climate in Iglesia Antigua is subtropical, with hot summers and mild winters. The average annual temperature is 73°F (23°C).
Economy
The economy of Iglesia Antigua is largely based on agriculture. The town is surrounded by agricultural land, which is used to grow a variety of crops, including cotton, corn, and sorghum. The town also has a small manufacturing sector, which produces a variety of goods, including furniture, clothing, and electronics.
The town also has a small tourism industry, which is centered around the Iglesia Antigua church. The church is a popular destination for tourists, who come to see the historic building and learn about the town’s history.
Demographics
As of the 2010 census, the population of Iglesia Antigua was 1,500. The town is predominantly Hispanic, with 95% of the population identifying as such. The remaining 5% of the population is made up of other ethnicities, including White, African American, and Native American.
The median household income in Iglesia Antigua is $25,000, which is significantly lower than the national average. The town has a poverty rate of 28%, which is higher than the national average. The town also has a high unemployment rate, with 10% of the population out of work.
Conclusion
Iglesia Antigua is a small town located in the Rio Grande Valley of South Texas. It is home to a population of approximately 1,500 people, most of whom are of Hispanic descent. The town’s economy is largely based on agriculture, with a small manufacturing and tourism sector. The town has a high poverty rate and a high unemployment rate.
Common Questions
What is the Total Population of Iglesia Antigua?
Total Population of Iglesia Antigua is 92.
What is the Total Male Population of Iglesia Antigua?
Total Male Population of Iglesia Antigua is 55.
What is the Total Female Population of Iglesia Antigua?
Total Female Population of Iglesia Antigua is 37.
What is the Ratio of Males per 100 Females in Iglesia Antigua?
There are 148.65 Males per 100 Females in Iglesia Antigua.
What is the Ratio of Females per 100 Males in Iglesia Antigua?
There are 67.27 Females per 100 Males in Iglesia Antigua.
What is the Median Population Age in Iglesia Antigua?
Median Population Age in Iglesia Antigua is 35.3 Years.
What is the Average Family Size in Iglesia Antigua
Average Family Size in Iglesia Antigua is 3.0 People.
What is the Average Household Size in Iglesia Antigua
Average Household Size in Iglesia Antigua is 2.4 People.
What is Per Capita Income in Iglesia Antigua?
Per Capita income in Iglesia Antigua is $52,614.
What is the Median Household income in Iglesia Antigua?
Median Household Income in Iglesia Antigua is $148,203.
What is Income or Wage Gap in Iglesia Antigua?
Income or Wage Gap in Iglesia Antigua is 16.5%.
Women in Iglesia Antigua earn 83.5 cents for every dollar earned by a man.
What is Inequality or Gini Index in Iglesia Antigua?
Inequality or Gini Index in Iglesia Antigua is 0.23.
How Large is the Labor Force in Iglesia Antigua?
There are 92 People in the Labor Forcein in Iglesia Antigua.
What is the Percentage of People in the Labor Force in Iglesia Antigua?
100.0% of People are in the Labor Force in Iglesia Antigua.