Holly Lake Ranch, TX
Holly Lake Ranch Map
Holly Lake Ranch Overview
2,523
TOTAL POPULATION
1,050
MALE POPULATION
1,473
FEMALE POPULATION
71.28
MALES / 100 FEMALES
140.29
FEMALES / 100 MALES
62.6
MEDIAN AGE
2.5
AVG FAMILY SIZE
2.1
AVG HOUSEHOLD SIZE
$54,787
PER CAPITA INCOME
$90,425
AVG FAMILY INCOME
$65,962
AVG HOUSEHOLD INCOME
17.8%
WAGE / INCOME GAP [ % ]
82.2¢/ $1
WAGE / INCOME GAP [ $ ]
0.54
INEQUALITY / GINI INDEX
626
LABOR FORCE [ PEOPLE ]
29.1%
PERCENT IN LABOR FORCE
3.4%
UNEMPLOYMENT RATE
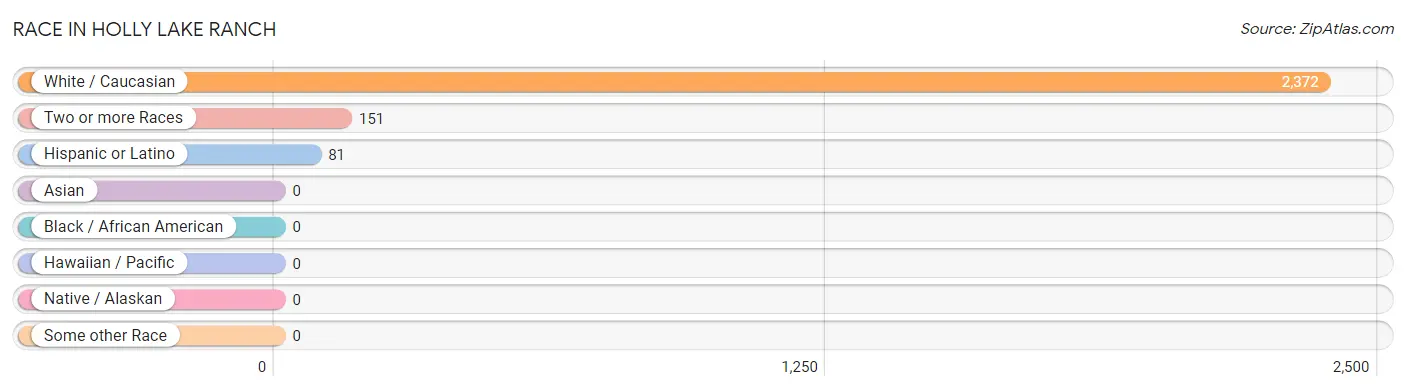
Race in Holly Lake Ranch
The most populous races in Holly Lake Ranch are White / Caucasian (2,372 | 94.0%), Two or more Races (151 | 6.0%), and Hispanic or Latino (81 | 3.2%).
| Race | # Population | % Population |
| Asian | 0 | 0.0% |
| Black / African American | 0 | 0.0% |
| Hawaiian / Pacific | 0 | 0.0% |
| Hispanic or Latino | 81 | 3.2% |
| Native / Alaskan | 0 | 0.0% |
| White / Caucasian | 2,372 | 94.0% |
| Two or more Races | 151 | 6.0% |
| Some other Race | 0 | 0.0% |
| Total | 2,523 | 100.0% |
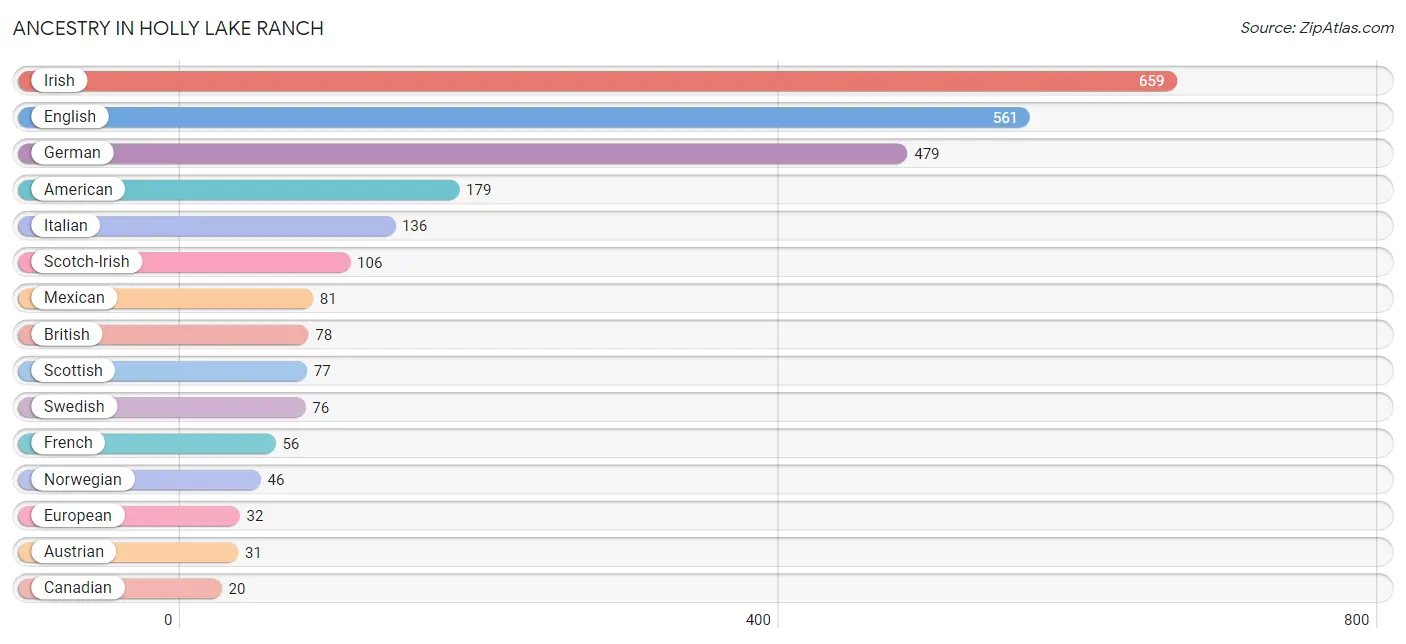
Ancestry in Holly Lake Ranch
The most populous ancestries reported in Holly Lake Ranch are Irish (659 | 26.1%), English (561 | 22.2%), German (479 | 19.0%), American (179 | 7.1%), and Italian (136 | 5.4%), together accounting for 79.8% of all Holly Lake Ranch residents.
| Ancestry | # Population | % Population |
| American | 179 | 7.1% |
| Austrian | 31 | 1.2% |
| British | 78 | 3.1% |
| Canadian | 20 | 0.8% |
| Carpatho Rusyn | 13 | 0.5% |
| Czech | 10 | 0.4% |
| Danish | 14 | 0.5% |
| Eastern European | 9 | 0.4% |
| English | 561 | 22.2% |
| European | 32 | 1.3% |
| French | 56 | 2.2% |
| German | 479 | 19.0% |
| Irish | 659 | 26.1% |
| Italian | 136 | 5.4% |
| Lithuanian | 19 | 0.7% |
| Mexican | 81 | 3.2% |
| Norwegian | 46 | 1.8% |
| Polish | 15 | 0.6% |
| Portuguese | 4 | 0.2% |
| Russian | 13 | 0.5% |
| Scotch-Irish | 106 | 4.2% |
| Scottish | 77 | 3.0% |
| Swedish | 76 | 3.0% |
| Welsh | 11 | 0.4% | View All 24 Rows |
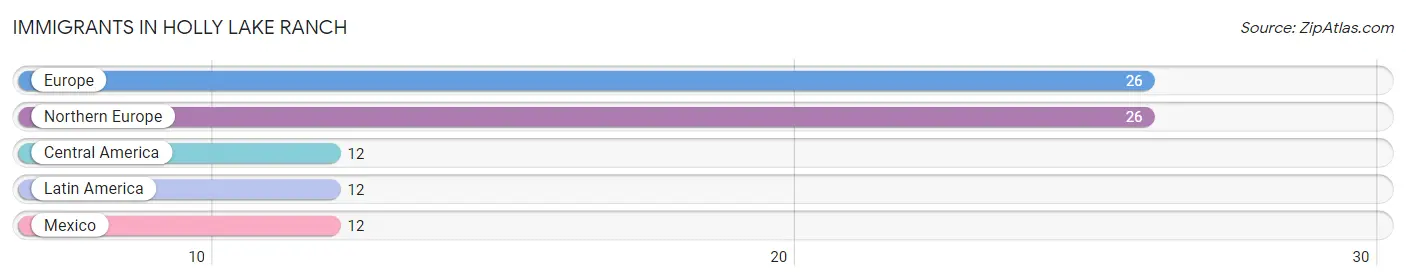
Immigrants in Holly Lake Ranch
The most numerous immigrant groups reported in Holly Lake Ranch came from Europe (26 | 1.0%), Northern Europe (26 | 1.0%), Central America (12 | 0.5%), Latin America (12 | 0.5%), and Mexico (12 | 0.5%), together accounting for 3.5% of all Holly Lake Ranch residents.
| Immigration Origin | # Population | % Population |
| Central America | 12 | 0.5% |
| Europe | 26 | 1.0% |
| Latin America | 12 | 0.5% |
| Mexico | 12 | 0.5% |
| Northern Europe | 26 | 1.0% | View All 5 Rows |
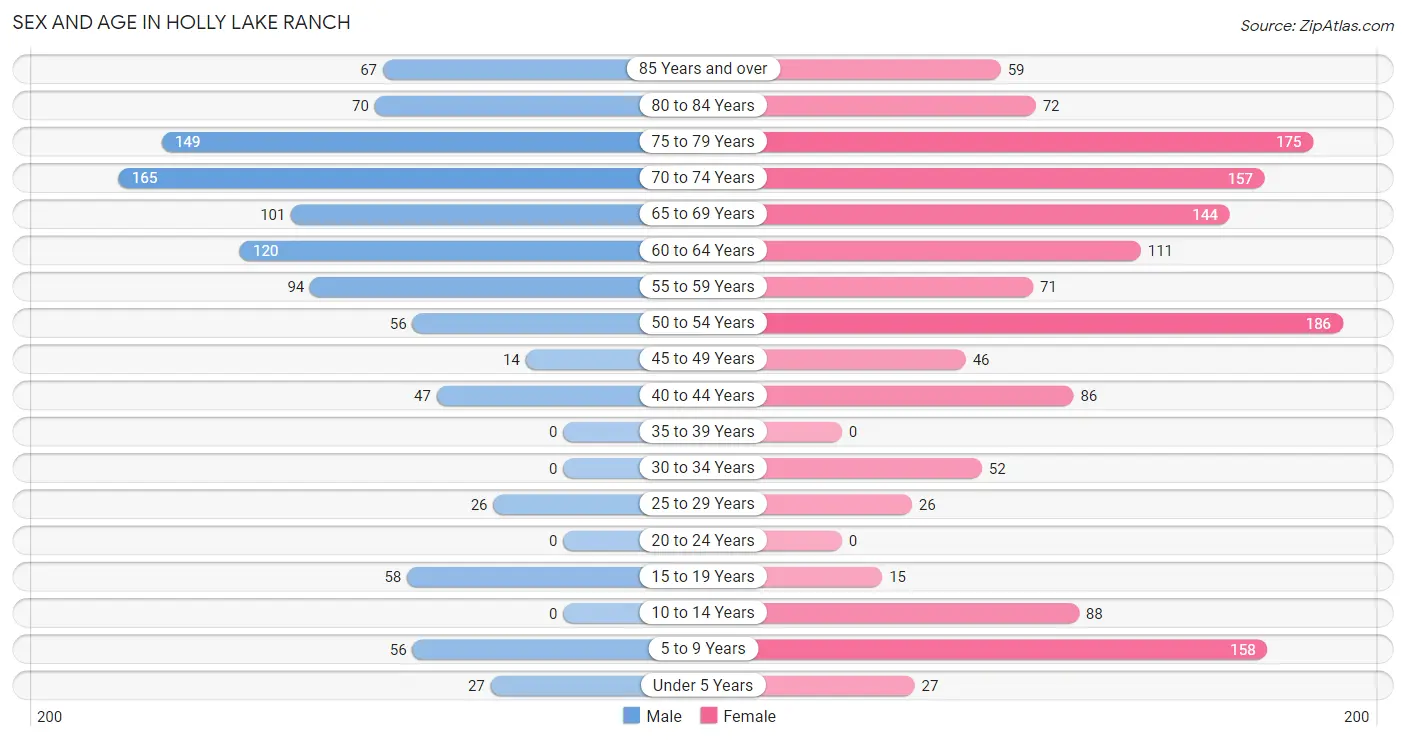
Sex and Age in Holly Lake Ranch
Sex and Age in Holly Lake Ranch
The most populous age groups in Holly Lake Ranch are 70 to 74 Years (165 | 15.7%) for men and 50 to 54 Years (186 | 12.6%) for women.
| Age Bracket | Male | Female |
| Under 5 Years | 27 (2.6%) | 27 (1.8%) |
| 5 to 9 Years | 56 (5.3%) | 158 (10.7%) |
| 10 to 14 Years | 0 (0.0%) | 88 (6.0%) |
| 15 to 19 Years | 58 (5.5%) | 15 (1.0%) |
| 20 to 24 Years | 0 (0.0%) | 0 (0.0%) |
| 25 to 29 Years | 26 (2.5%) | 26 (1.8%) |
| 30 to 34 Years | 0 (0.0%) | 52 (3.5%) |
| 35 to 39 Years | 0 (0.0%) | 0 (0.0%) |
| 40 to 44 Years | 47 (4.5%) | 86 (5.8%) |
| 45 to 49 Years | 14 (1.3%) | 46 (3.1%) |
| 50 to 54 Years | 56 (5.3%) | 186 (12.6%) |
| 55 to 59 Years | 94 (8.9%) | 71 (4.8%) |
| 60 to 64 Years | 120 (11.4%) | 111 (7.5%) |
| 65 to 69 Years | 101 (9.6%) | 144 (9.8%) |
| 70 to 74 Years | 165 (15.7%) | 157 (10.7%) |
| 75 to 79 Years | 149 (14.2%) | 175 (11.9%) |
| 80 to 84 Years | 70 (6.7%) | 72 (4.9%) |
| 85 Years and over | 67 (6.4%) | 59 (4.0%) |
| Total | 1,050 (100.0%) | 1,473 (100.0%) |
Families and Households in Holly Lake Ranch
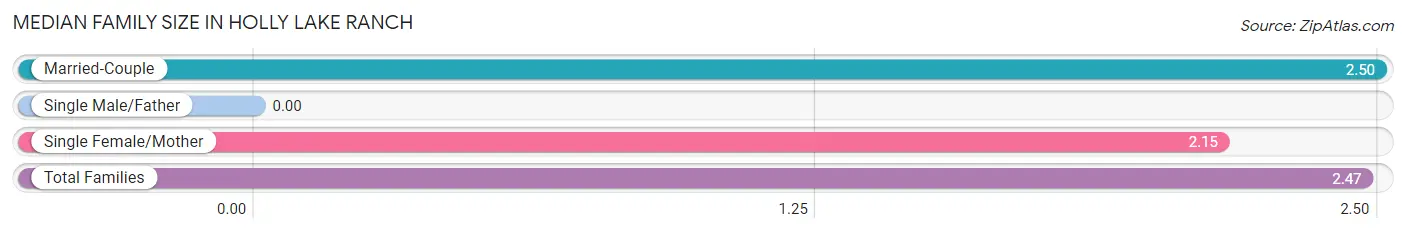
Median Family Size in Holly Lake Ranch
| Family Type | # Families | Family Size |
| Married-Couple | 819 (93.0%) | 2.50 |
| Single Male/Father | 0 (0.0%) | - |
| Single Female/Mother | 62 (7.0%) | 2.15 |
| Total Families | 881 (100.0%) | 2.47 |
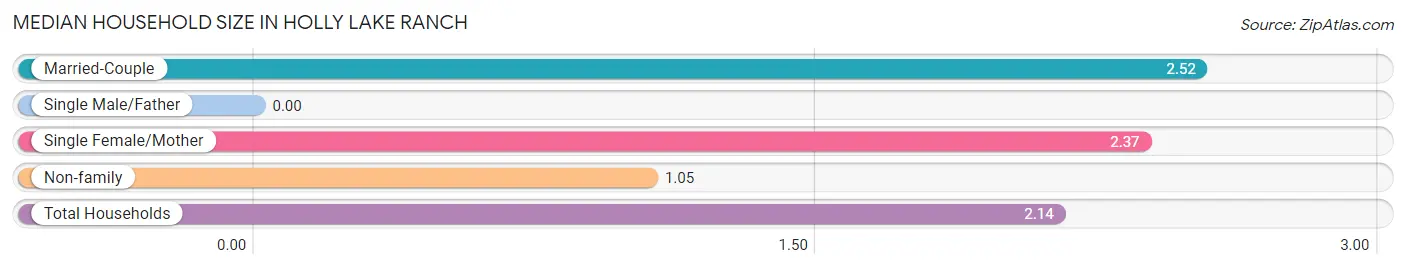
Median Household Size in Holly Lake Ranch
| Household Type | # Households | Household Size |
| Married-Couple | 819 (69.4%) | 2.52 |
| Single Male/Father | 0 (0.0%) | - |
| Single Female/Mother | 62 (5.2%) | 2.37 |
| Non-family | 299 (25.3%) | 1.05 |
| Total Households | 1,180 (100.0%) | 2.14 |
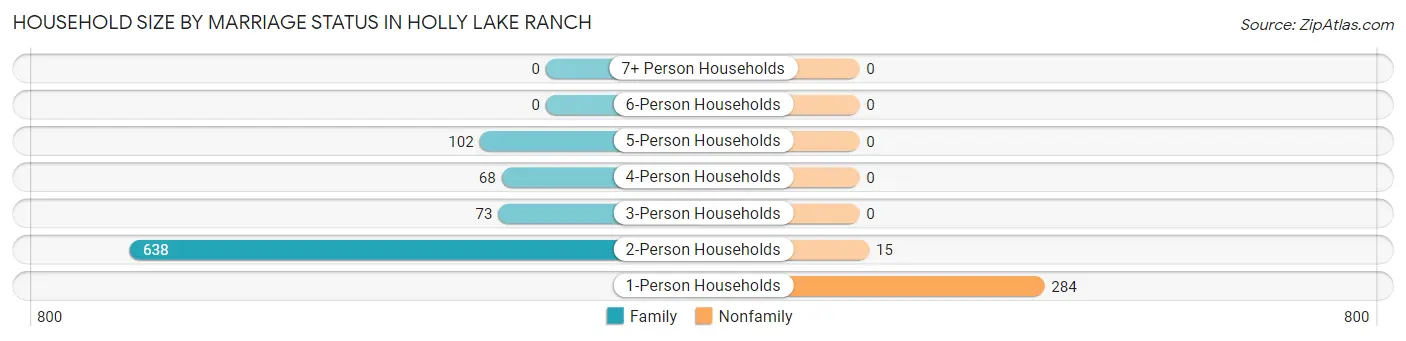
Household Size by Marriage Status in Holly Lake Ranch
Out of a total of 1,180 households in Holly Lake Ranch, 881 (74.7%) are family households, while 299 (25.3%) are nonfamily households. The most numerous type of family households are 2-person households, comprising 638, and the most common type of nonfamily households are 1-person households, comprising 284.
| Household Size | Family Households | Nonfamily Households |
| 1-Person Households | - | 284 (24.1%) |
| 2-Person Households | 638 (54.1%) | 15 (1.3%) |
| 3-Person Households | 73 (6.2%) | 0 (0.0%) |
| 4-Person Households | 68 (5.8%) | 0 (0.0%) |
| 5-Person Households | 102 (8.6%) | 0 (0.0%) |
| 6-Person Households | 0 (0.0%) | 0 (0.0%) |
| 7+ Person Households | 0 (0.0%) | 0 (0.0%) |
| Total | 881 (74.7%) | 299 (25.3%) |
Female Fertility in Holly Lake Ranch
Fertility by Age in Holly Lake Ranch
| Age Bracket | Women with Births | Births / 1,000 Women |
| 15 to 19 years | 0 (0.0%) | 0.0 |
| 20 to 34 years | 0 (0.0%) | 0.0 |
| 35 to 50 years | 0 (0.0%) | 0.0 |
| Total | 0 (0.0%) | 0.0 |
Fertility by Age by Marriage Status in Holly Lake Ranch
| Age Bracket | Married | Unmarried |
| 15 to 19 years | 0 (0.0%) | 0 (0.0%) |
| 20 to 34 years | 0 (0.0%) | 0 (0.0%) |
| 35 to 50 years | 0 (0.0%) | 0 (0.0%) |
| Total | 0 (0.0%) | 0 (0.0%) |
Fertility by Education in Holly Lake Ranch
| Educational Attainment | Women with Births | Births / 1,000 Women |
| Less than High School | 0 (0.0%) | 0.0 |
| High School Diploma | 0 (0.0%) | 0.0 |
| College or Associate's Degree | 0 (0.0%) | 0.0 |
| Bachelor's Degree | 0 (0.0%) | 0.0 |
| Graduate Degree | 0 (0.0%) | 0.0 |
| Total | 0 (0.0%) | 0.0 |
Fertility by Education by Marriage Status in Holly Lake Ranch
| Educational Attainment | Married | Unmarried |
| Less than High School | 0 (0.0%) | 0 (0.0%) |
| High School Diploma | 0 (0.0%) | 0 (0.0%) |
| College or Associate's Degree | 0 (0.0%) | 0 (0.0%) |
| Bachelor's Degree | 0 (0.0%) | 0 (0.0%) |
| Graduate Degree | 0 (0.0%) | 0 (0.0%) |
| Total | 0 (0.0%) | 0 (0.0%) |
Income in Holly Lake Ranch
Income Overview in Holly Lake Ranch
Per Capita Income in Holly Lake Ranch is $54,787, while median incomes of families and households are $90,425 and $65,962 respectively.
| Characteristic | Number | Measure |
| Per Capita Income | 2,523 | $54,787 |
| Median Family Income | 881 | $90,425 |
| Mean Family Income | 881 | $142,851 |
| Median Household Income | 1,180 | $65,962 |
| Mean Household Income | 1,180 | $119,025 |
| Income Deficit | 881 | $0 |
| Wage / Income Gap (%) | 2,523 | 17.84% |
| Wage / Income Gap ($) | 2,523 | 82.16¢ per $1 |
| Gini / Inequality Index | 2,523 | 0.54 |
Earnings by Sex in Holly Lake Ranch
Average Earnings in Holly Lake Ranch are $47,321, $51,731 for men and $42,500 for women, a difference of 17.8%.
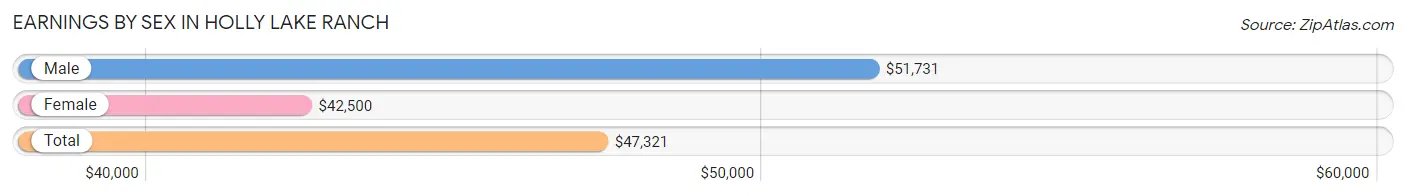
| Sex | Number | Average Earnings |
| Male | 322 (48.5%) | $51,731 |
| Female | 342 (51.5%) | $42,500 |
| Total | 664 (100.0%) | $47,321 |
Earnings by Sex by Income Bracket in Holly Lake Ranch
The most common earnings brackets in Holly Lake Ranch are $2,499 or less for men (56 | 17.4%) and $100,000+ for women (106 | 31.0%).
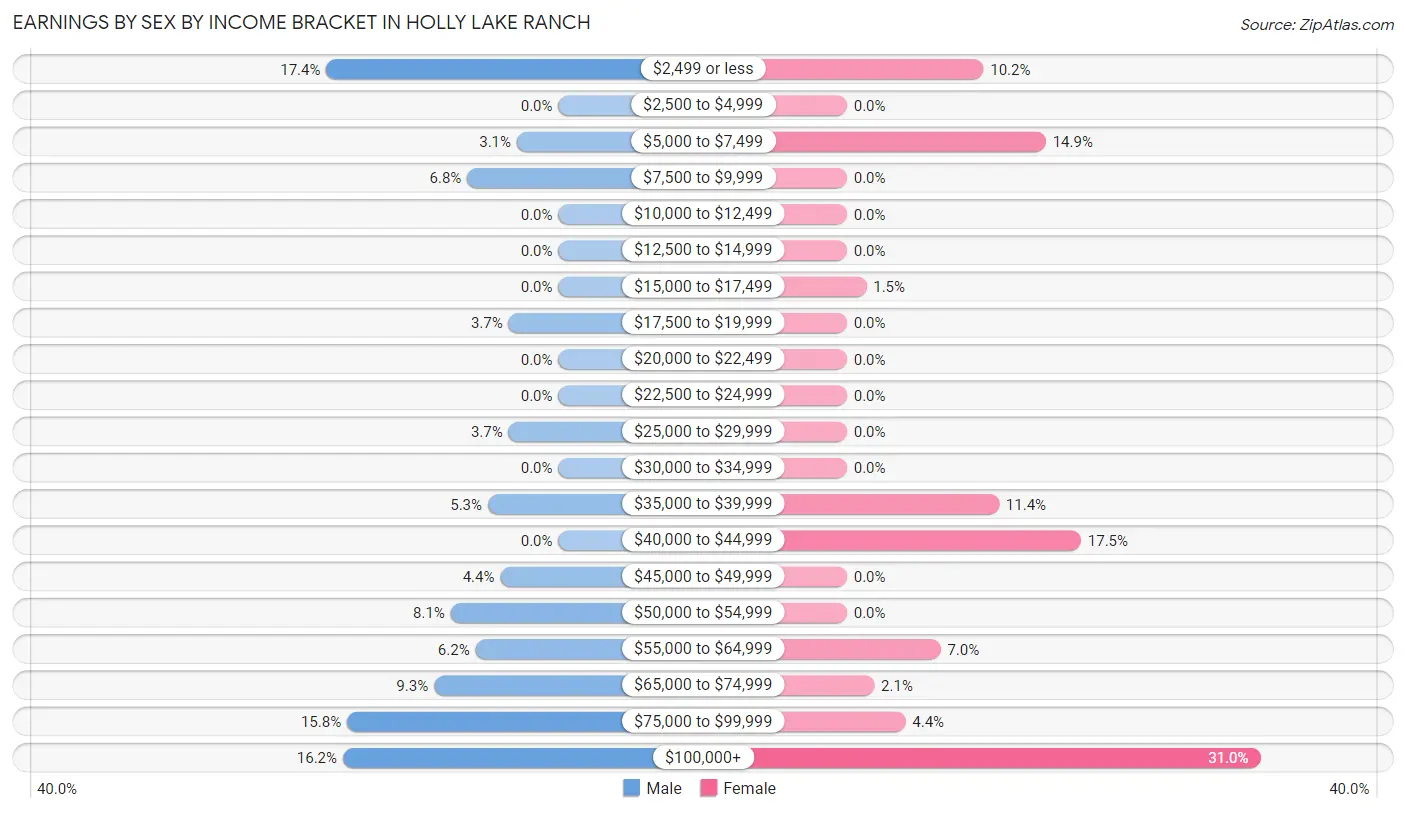
| Income | Male | Female |
| $2,499 or less | 56 (17.4%) | 35 (10.2%) |
| $2,500 to $4,999 | 0 (0.0%) | 0 (0.0%) |
| $5,000 to $7,499 | 10 (3.1%) | 51 (14.9%) |
| $7,500 to $9,999 | 22 (6.8%) | 0 (0.0%) |
| $10,000 to $12,499 | 0 (0.0%) | 0 (0.0%) |
| $12,500 to $14,999 | 0 (0.0%) | 0 (0.0%) |
| $15,000 to $17,499 | 0 (0.0%) | 5 (1.5%) |
| $17,500 to $19,999 | 12 (3.7%) | 0 (0.0%) |
| $20,000 to $22,499 | 0 (0.0%) | 0 (0.0%) |
| $22,500 to $24,999 | 0 (0.0%) | 0 (0.0%) |
| $25,000 to $29,999 | 12 (3.7%) | 0 (0.0%) |
| $30,000 to $34,999 | 0 (0.0%) | 0 (0.0%) |
| $35,000 to $39,999 | 17 (5.3%) | 39 (11.4%) |
| $40,000 to $44,999 | 0 (0.0%) | 60 (17.5%) |
| $45,000 to $49,999 | 14 (4.3%) | 0 (0.0%) |
| $50,000 to $54,999 | 26 (8.1%) | 0 (0.0%) |
| $55,000 to $64,999 | 20 (6.2%) | 24 (7.0%) |
| $65,000 to $74,999 | 30 (9.3%) | 7 (2.1%) |
| $75,000 to $99,999 | 51 (15.8%) | 15 (4.4%) |
| $100,000+ | 52 (16.2%) | 106 (31.0%) |
| Total | 322 (100.0%) | 342 (100.0%) |
Earnings by Sex by Educational Attainment in Holly Lake Ranch
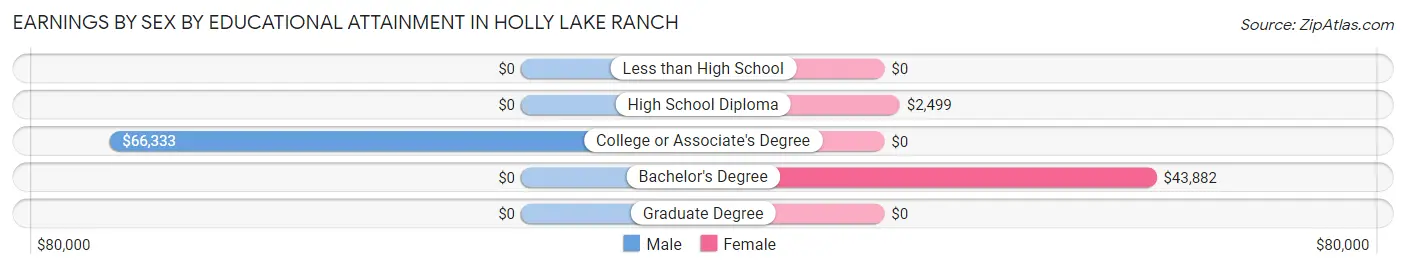
| Educational Attainment | Male Income | Female Income |
| Less than High School | - | - |
| High School Diploma | - | - |
| College or Associate's Degree | $66,333 | $0 |
| Bachelor's Degree | - | - |
| Graduate Degree | - | - |
| Total | $51,731 | $0 |
Family Income in Holly Lake Ranch
Family Income Brackets in Holly Lake Ranch
According to the Holly Lake Ranch family income data, there are 182 families falling into the $35,000 to $49,999 income range, which is the most common income bracket and makes up 20.7% of all families. Conversely, the $10,000 to $14,999 income bracket is the least frequent group with only 12 families (1.4%) belonging to this category.
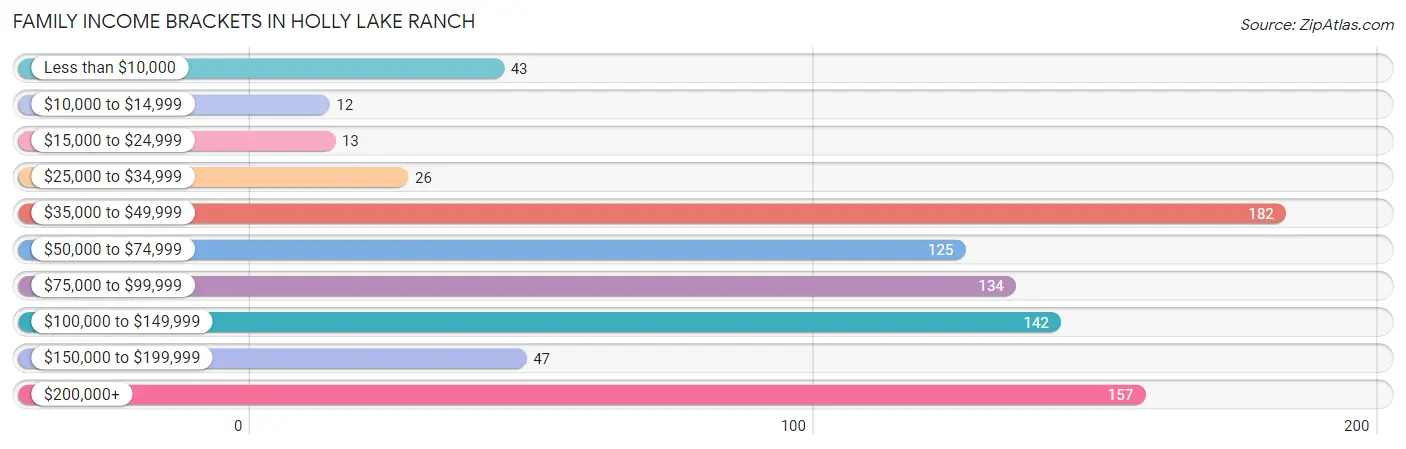
| Income Bracket | # Families | % Families |
| Less than $10,000 | 43 | 4.9% |
| $10,000 to $14,999 | 12 | 1.4% |
| $15,000 to $24,999 | 13 | 1.5% |
| $25,000 to $34,999 | 26 | 3.0% |
| $35,000 to $49,999 | 182 | 20.7% |
| $50,000 to $74,999 | 125 | 14.2% |
| $75,000 to $99,999 | 134 | 15.2% |
| $100,000 to $149,999 | 142 | 16.1% |
| $150,000 to $199,999 | 47 | 5.3% |
| $200,000+ | 157 | 17.8% |
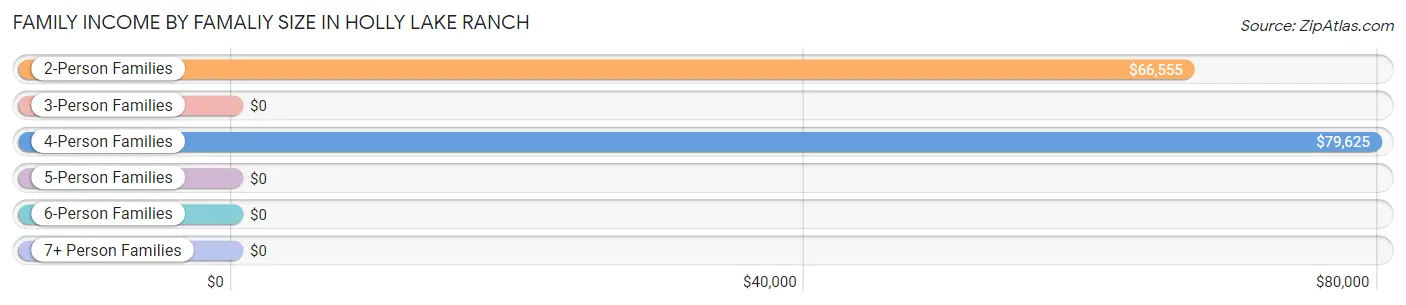
Family Income by Famaliy Size in Holly Lake Ranch
4-person families (78 | 8.8%) account for the highest median family income in Holly Lake Ranch with $79,625 per family, while 2-person families (649 | 73.7%) have the highest median income of $33,278 per family member.
| Income Bracket | # Families | Median Income |
| 2-Person Families | 649 (73.7%) | $66,555 |
| 3-Person Families | 62 (7.0%) | $0 |
| 4-Person Families | 78 (8.8%) | $79,625 |
| 5-Person Families | 92 (10.4%) | $0 |
| 6-Person Families | 0 (0.0%) | $0 |
| 7+ Person Families | 0 (0.0%) | $0 |
| Total | 881 (100.0%) | $90,425 |
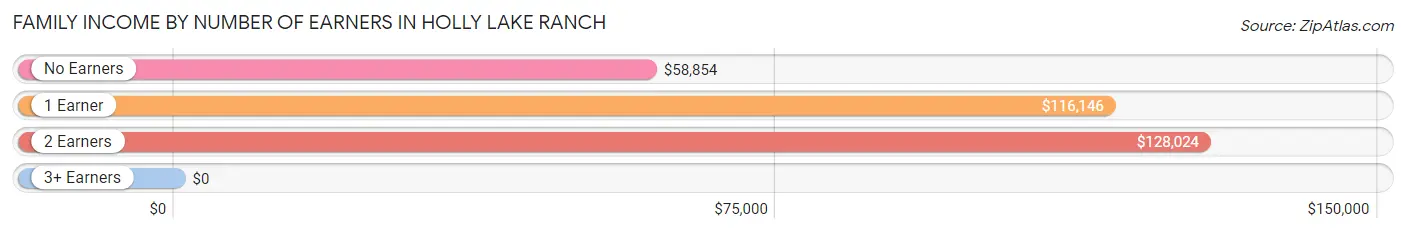
Family Income by Number of Earners in Holly Lake Ranch
| Number of Earners | # Families | Median Income |
| No Earners | 412 (46.8%) | $58,854 |
| 1 Earner | 352 (40.0%) | $116,146 |
| 2 Earners | 99 (11.2%) | $128,024 |
| 3+ Earners | 18 (2.0%) | $0 |
| Total | 881 (100.0%) | $90,425 |
Household Income in Holly Lake Ranch
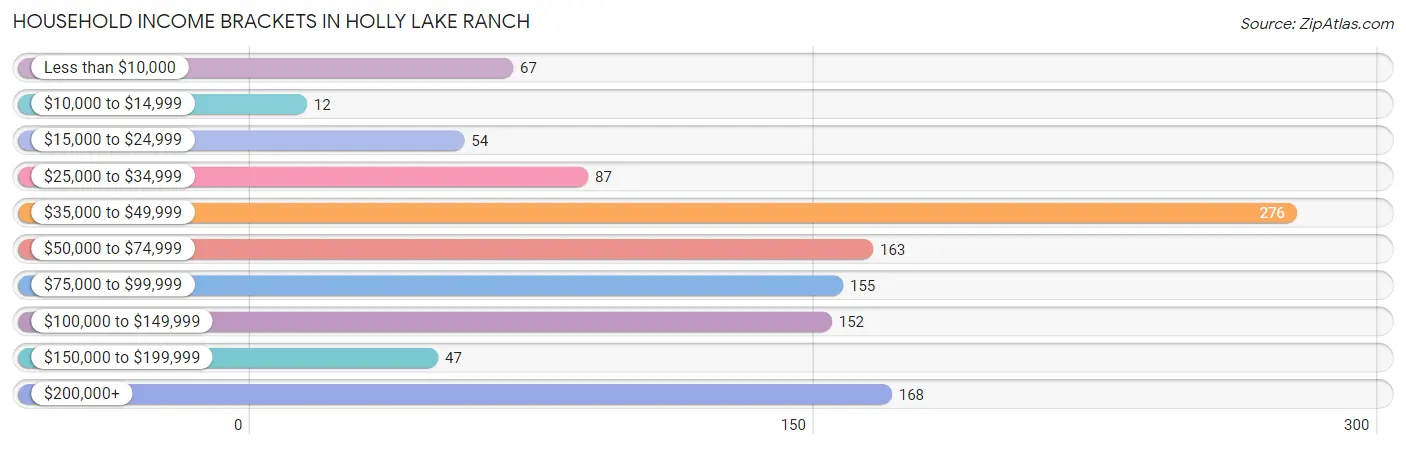
Household Income Brackets in Holly Lake Ranch
With 276 households falling in the category, the $35,000 to $49,999 income range is the most frequent in Holly Lake Ranch, accounting for 23.4% of all households. In contrast, only 12 households (1.0%) fall into the $10,000 to $14,999 income bracket, making it the least populous group.
| Income Bracket | # Households | % Households |
| Less than $10,000 | 67 | 5.7% |
| $10,000 to $14,999 | 12 | 1.0% |
| $15,000 to $24,999 | 54 | 4.6% |
| $25,000 to $34,999 | 87 | 7.4% |
| $35,000 to $49,999 | 276 | 23.4% |
| $50,000 to $74,999 | 163 | 13.8% |
| $75,000 to $99,999 | 155 | 13.1% |
| $100,000 to $149,999 | 152 | 12.9% |
| $150,000 to $199,999 | 47 | 4.0% |
| $200,000+ | 168 | 14.2% |
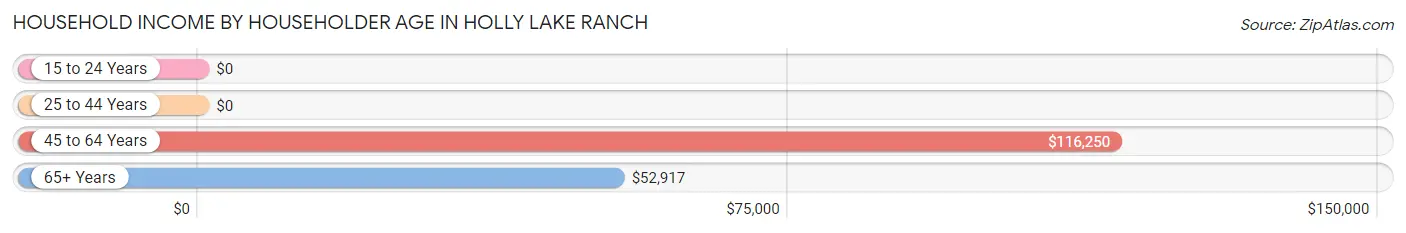
Household Income by Householder Age in Holly Lake Ranch
The median household income in Holly Lake Ranch is $65,962, with the highest median household income of $116,250 found in the 45 to 64 years age bracket for the primary householder. A total of 474 households (40.2%) fall into this category.
| Income Bracket | # Households | Median Income |
| 15 to 24 Years | 0 (0.0%) | $0 |
| 25 to 44 Years | 58 (4.9%) | $0 |
| 45 to 64 Years | 474 (40.2%) | $116,250 |
| 65+ Years | 648 (54.9%) | $52,917 |
| Total | 1,180 (100.0%) | $65,962 |
Poverty in Holly Lake Ranch
Income Below Poverty by Sex and Age in Holly Lake Ranch
With 6.9% poverty level for males and 5.0% for females among the residents of Holly Lake Ranch, 6 to 11 year old males and 18 to 24 year old females are the most vulnerable to poverty, with 31 males (100.0%) and 15 females (100.0%) in their respective age groups living below the poverty level.
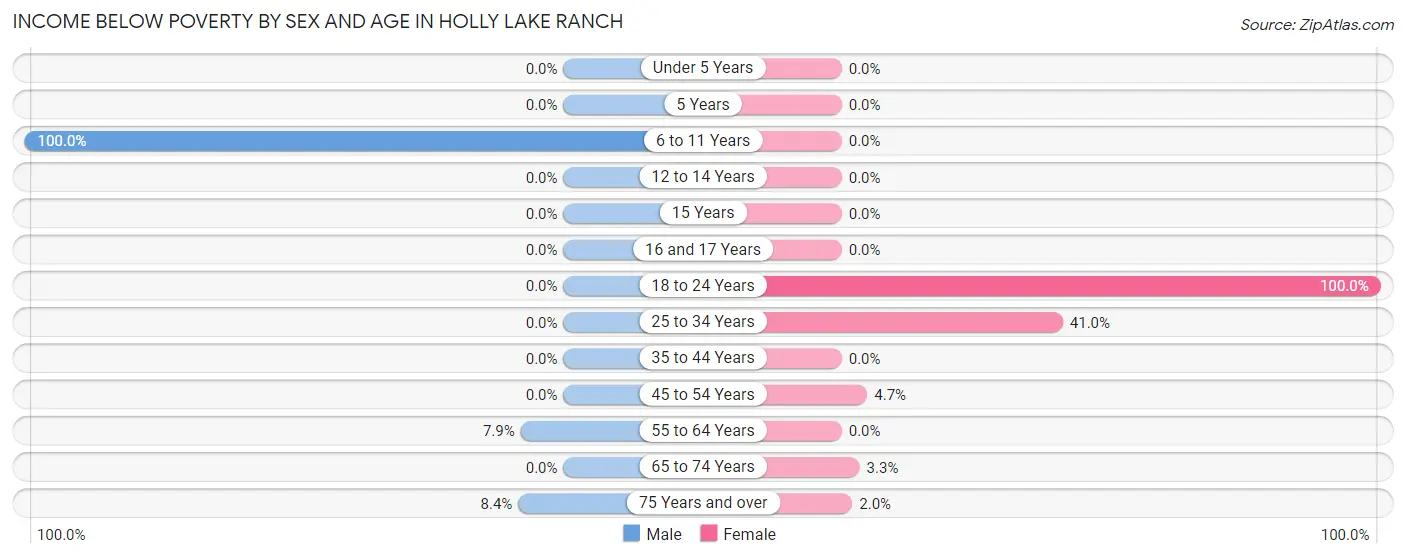
| Age Bracket | Male | Female |
| Under 5 Years | 0 (0.0%) | 0 (0.0%) |
| 5 Years | 0 (0.0%) | 0 (0.0%) |
| 6 to 11 Years | 31 (100.0%) | 0 (0.0%) |
| 12 to 14 Years | 0 (0.0%) | 0 (0.0%) |
| 15 Years | 0 (0.0%) | 0 (0.0%) |
| 16 and 17 Years | 0 (0.0%) | 0 (0.0%) |
| 18 to 24 Years | 0 (0.0%) | 15 (100.0%) |
| 25 to 34 Years | 0 (0.0%) | 32 (41.0%) |
| 35 to 44 Years | 0 (0.0%) | 0 (0.0%) |
| 45 to 54 Years | 0 (0.0%) | 11 (4.7%) |
| 55 to 64 Years | 17 (7.9%) | 0 (0.0%) |
| 65 to 74 Years | 0 (0.0%) | 10 (3.3%) |
| 75 Years and over | 24 (8.4%) | 6 (2.0%) |
| Total | 72 (6.9%) | 74 (5.0%) |
Income Above Poverty by Sex and Age in Holly Lake Ranch
According to the poverty statistics in Holly Lake Ranch, males aged under 5 years and females aged under 5 years are the age groups that are most secure financially, with 100.0% of males and 100.0% of females in these age groups living above the poverty line.
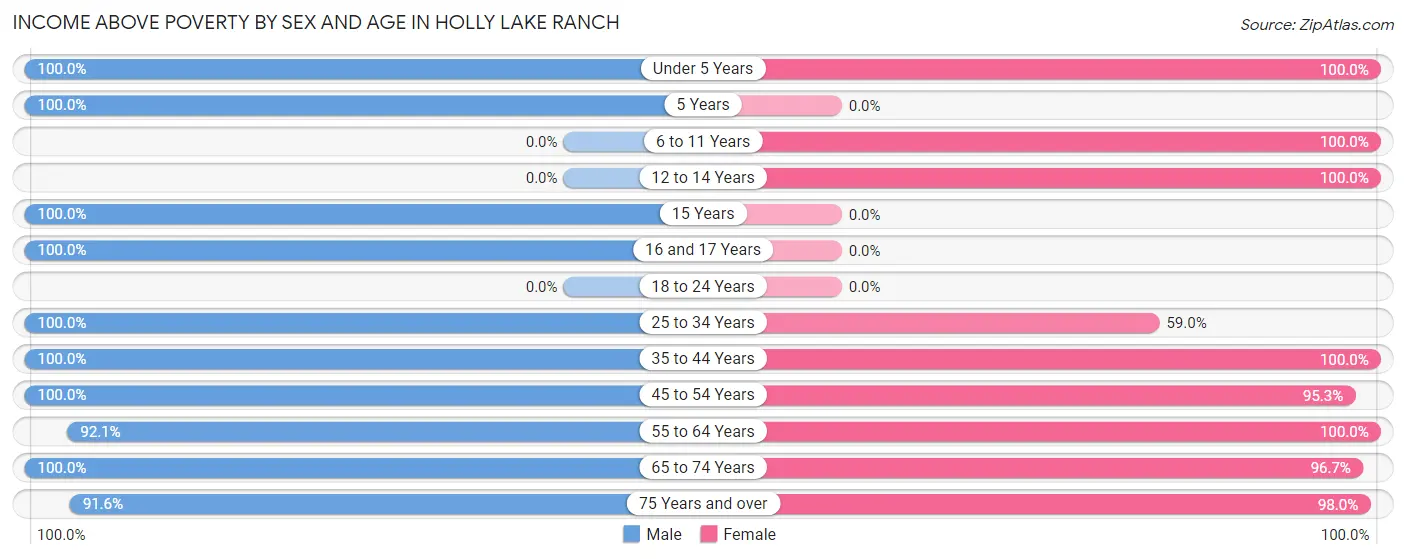
| Age Bracket | Male | Female |
| Under 5 Years | 27 (100.0%) | 27 (100.0%) |
| 5 Years | 25 (100.0%) | 0 (0.0%) |
| 6 to 11 Years | 0 (0.0%) | 225 (100.0%) |
| 12 to 14 Years | 0 (0.0%) | 21 (100.0%) |
| 15 Years | 17 (100.0%) | 0 (0.0%) |
| 16 and 17 Years | 41 (100.0%) | 0 (0.0%) |
| 18 to 24 Years | 0 (0.0%) | 0 (0.0%) |
| 25 to 34 Years | 26 (100.0%) | 46 (59.0%) |
| 35 to 44 Years | 47 (100.0%) | 86 (100.0%) |
| 45 to 54 Years | 70 (100.0%) | 221 (95.3%) |
| 55 to 64 Years | 197 (92.1%) | 182 (100.0%) |
| 65 to 74 Years | 266 (100.0%) | 291 (96.7%) |
| 75 Years and over | 262 (91.6%) | 300 (98.0%) |
| Total | 978 (93.1%) | 1,399 (95.0%) |
Income Below Poverty Among Married-Couple Families in Holly Lake Ranch
The poverty statistics for married-couple families in Holly Lake Ranch show that 1.5% or 12 of the total 819 families live below the poverty line. Families with no children have the highest poverty rate of 1.9%, comprising of 12 families. On the other hand, families with 1 or 2 children have the lowest poverty rate of 0.0%, which includes 0 families.
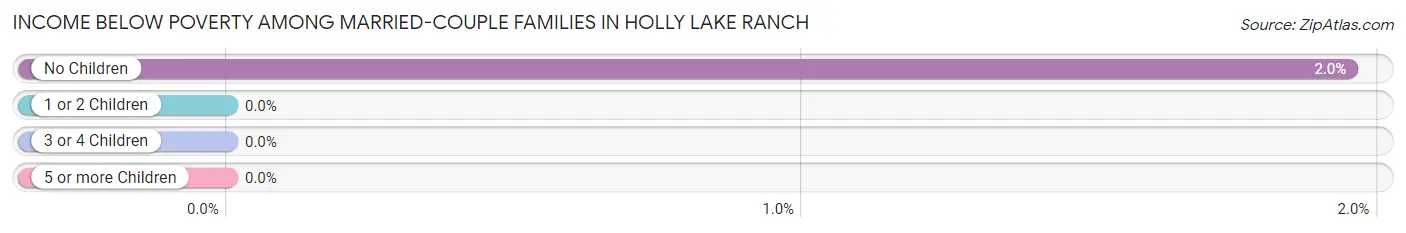
| Children | Above Poverty | Below Poverty |
| No Children | 603 (98.1%) | 12 (1.9%) |
| 1 or 2 Children | 112 (100.0%) | 0 (0.0%) |
| 3 or 4 Children | 92 (100.0%) | 0 (0.0%) |
| 5 or more Children | 0 (0.0%) | 0 (0.0%) |
| Total | 807 (98.5%) | 12 (1.5%) |
Income Below Poverty Among Single-Parent Households in Holly Lake Ranch
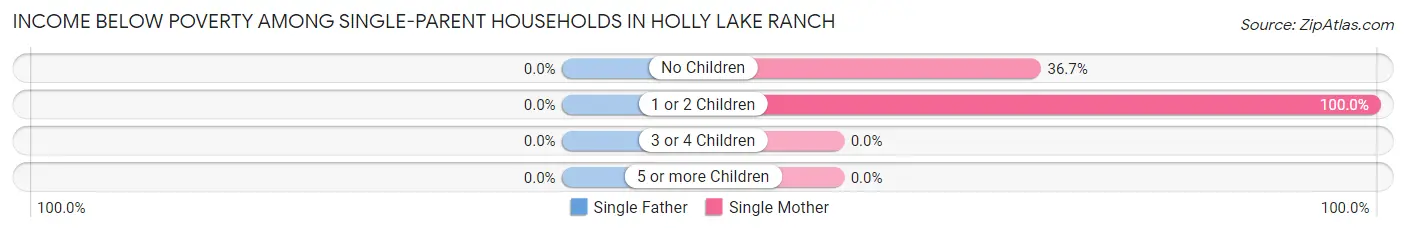
| Children | Single Father | Single Mother |
| No Children | 0 (0.0%) | 11 (36.7%) |
| 1 or 2 Children | 0 (0.0%) | 32 (100.0%) |
| 3 or 4 Children | 0 (0.0%) | 0 (0.0%) |
| 5 or more Children | 0 (0.0%) | 0 (0.0%) |
| Total | 0 (0.0%) | 43 (69.4%) |
Income Below Poverty Among Married-Couple vs Single-Parent Households in Holly Lake Ranch
The poverty data for Holly Lake Ranch shows that 12 of the married-couple family households (1.5%) and 43 of the single-parent households (69.4%) are living below the poverty level. Within the married-couple family households, those with no children have the highest poverty rate, with 12 households (1.9%) falling below the poverty line. Among the single-parent households, those with 1 or 2 children have the highest poverty rate, with 32 household (100.0%) living below poverty.
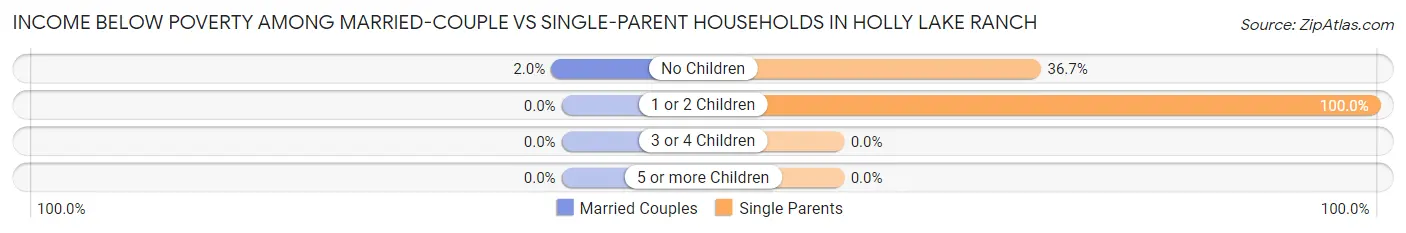
| Children | Married-Couple Families | Single-Parent Households |
| No Children | 12 (1.9%) | 11 (36.7%) |
| 1 or 2 Children | 0 (0.0%) | 32 (100.0%) |
| 3 or 4 Children | 0 (0.0%) | 0 (0.0%) |
| 5 or more Children | 0 (0.0%) | 0 (0.0%) |
| Total | 12 (1.5%) | 43 (69.4%) |
Employment Characteristics in Holly Lake Ranch
Employment by Class of Employer in Holly Lake Ranch
Among the 592 employed individuals in Holly Lake Ranch, private company employees (178 | 30.1%), local government employees (174 | 29.4%), and state government employees (165 | 27.9%) make up the most common classes of employment.
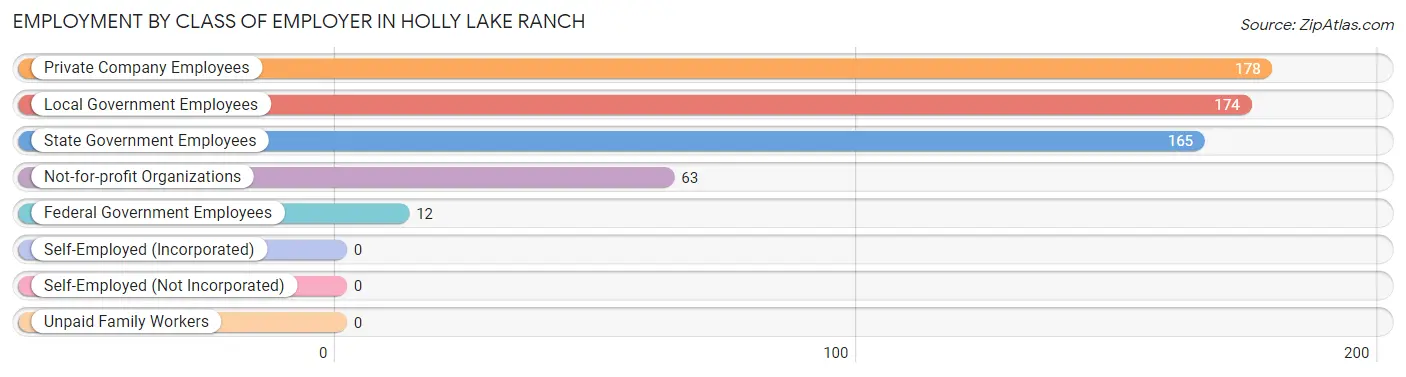
| Employer Class | # Employees | % Employees |
| Private Company Employees | 178 | 30.1% |
| Self-Employed (Incorporated) | 0 | 0.0% |
| Self-Employed (Not Incorporated) | 0 | 0.0% |
| Not-for-profit Organizations | 63 | 10.6% |
| Local Government Employees | 174 | 29.4% |
| State Government Employees | 165 | 27.9% |
| Federal Government Employees | 12 | 2.0% |
| Unpaid Family Workers | 0 | 0.0% |
| Total | 592 | 100.0% |
Employment Status by Age in Holly Lake Ranch
According to the labor force statistics for Holly Lake Ranch, out of the total population over 16 years of age (2,150), 29.1% or 626 individuals are in the labor force, with 3.4% or 21 of them unemployed. The age group with the highest labor force participation rate is 25 to 29 years, with 100.0% or 52 individuals in the labor force. Within the labor force, the 16 to 19 years age range has the highest percentage of unemployed individuals, with 46.7% or 7 of them being unemployed.
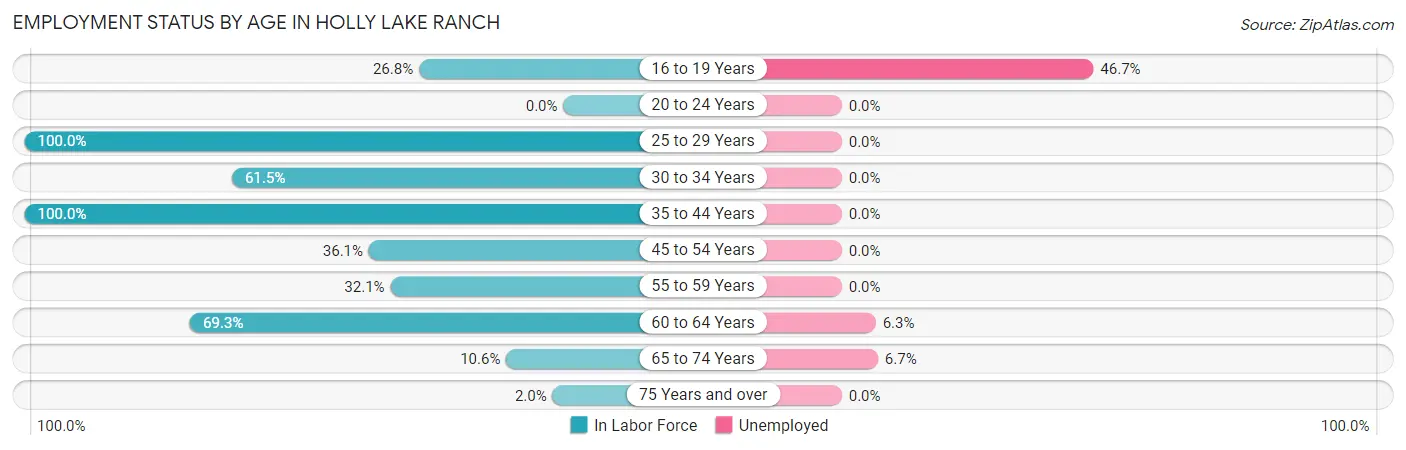
| Age Bracket | In Labor Force | Unemployed |
| 16 to 19 Years | 15 (26.8%) | 7 (46.7%) |
| 20 to 24 Years | 0 (0.0%) | 0 (0.0%) |
| 25 to 29 Years | 52 (100.0%) | 0 (0.0%) |
| 30 to 34 Years | 32 (61.5%) | 0 (0.0%) |
| 35 to 44 Years | 133 (100.0%) | 0 (0.0%) |
| 45 to 54 Years | 109 (36.1%) | 0 (0.0%) |
| 55 to 59 Years | 53 (32.1%) | 0 (0.0%) |
| 60 to 64 Years | 160 (69.3%) | 10 (6.3%) |
| 65 to 74 Years | 60 (10.6%) | 4 (6.7%) |
| 75 Years and over | 12 (2.0%) | 0 (0.0%) |
| Total | 626 (29.1%) | 21 (3.4%) |
Employment Status by Educational Attainment in Holly Lake Ranch
According to labor force statistics for Holly Lake Ranch, 57.6% of individuals (539) out of the total population between 25 and 64 years of age (935) are in the labor force, with 1.9% or 10 of them being unemployed. The group with the highest labor force participation rate are those with the educational attainment of bachelor's degree or higher, with 65.6% or 294 individuals in the labor force. Within the labor force, individuals with high school diploma education have the highest percentage of unemployment, with 12.3% or 10 of them being unemployed.
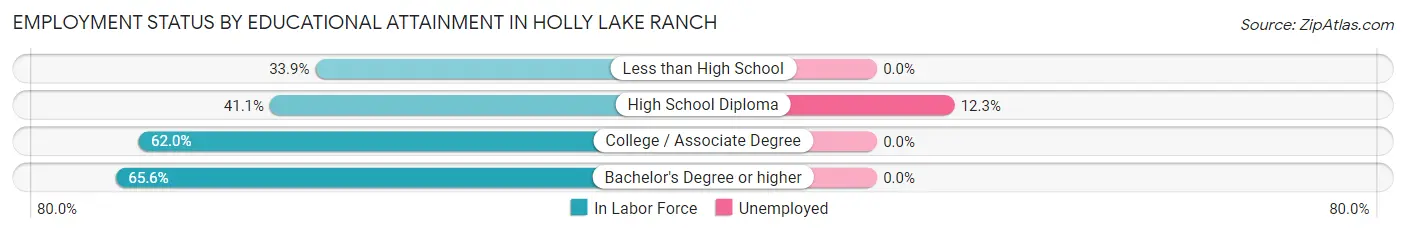
| Educational Attainment | In Labor Force | Unemployed |
| Less than High School | 19 (33.9%) | 0 (0.0%) |
| High School Diploma | 81 (41.1%) | 24 (12.3%) |
| College / Associate Degree | 145 (62.0%) | 0 (0.0%) |
| Bachelor's Degree or higher | 294 (65.6%) | 0 (0.0%) |
| Total | 539 (57.6%) | 18 (1.9%) |
Employment Occupations by Sex in Holly Lake Ranch
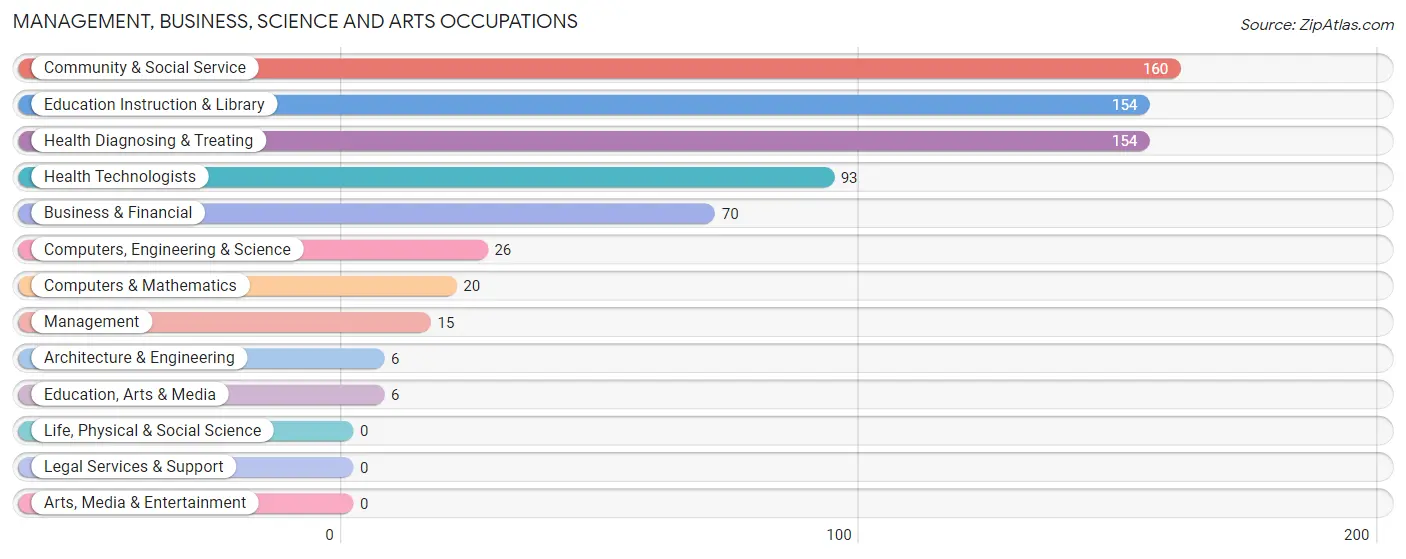
Management, Business, Science and Arts Occupations
The most common Management, Business, Science and Arts occupations in Holly Lake Ranch are Community & Social Service (160 | 26.5%), Education Instruction & Library (154 | 25.5%), Health Diagnosing & Treating (154 | 25.5%), Health Technologists (93 | 15.4%), and Business & Financial (70 | 11.6%).
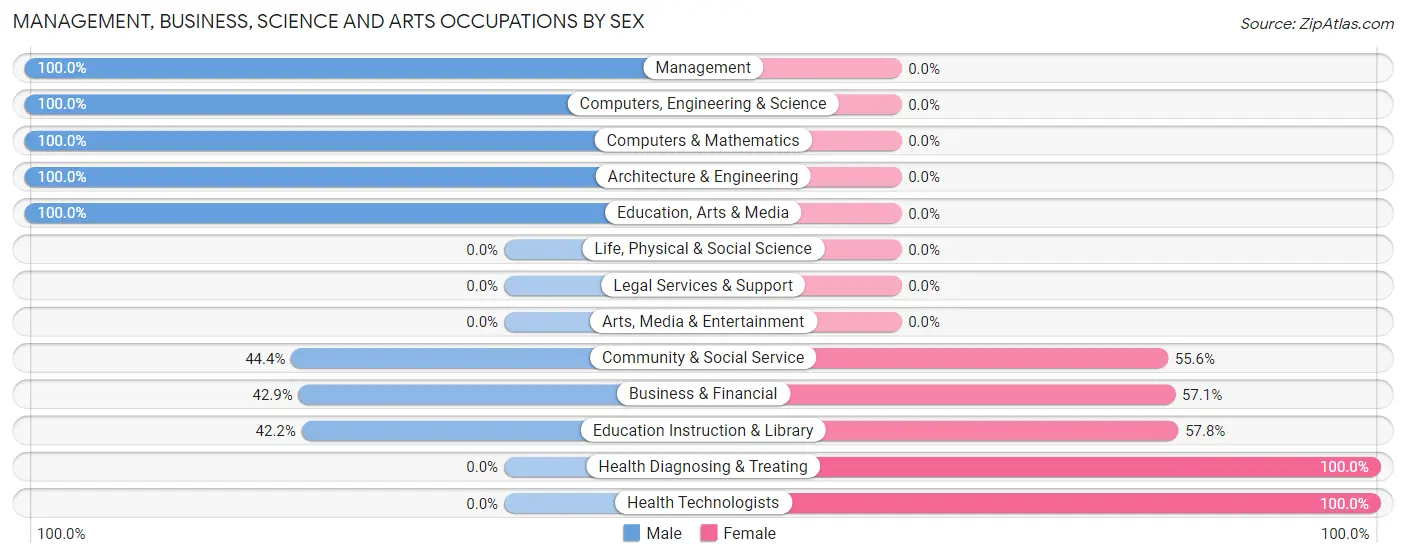
Management, Business, Science and Arts Occupations by Sex
Within the Management, Business, Science and Arts occupations in Holly Lake Ranch, the most male-oriented occupations are Management (100.0%), Computers, Engineering & Science (100.0%), and Computers & Mathematics (100.0%), while the most female-oriented occupations are Health Diagnosing & Treating (100.0%), Health Technologists (100.0%), and Education Instruction & Library (57.8%).
| Occupation | Male | Female |
| Management | 15 (100.0%) | 0 (0.0%) |
| Business & Financial | 30 (42.9%) | 40 (57.1%) |
| Computers, Engineering & Science | 26 (100.0%) | 0 (0.0%) |
| Computers & Mathematics | 20 (100.0%) | 0 (0.0%) |
| Architecture & Engineering | 6 (100.0%) | 0 (0.0%) |
| Life, Physical & Social Science | 0 (0.0%) | 0 (0.0%) |
| Community & Social Service | 71 (44.4%) | 89 (55.6%) |
| Education, Arts & Media | 6 (100.0%) | 0 (0.0%) |
| Legal Services & Support | 0 (0.0%) | 0 (0.0%) |
| Education Instruction & Library | 65 (42.2%) | 89 (57.8%) |
| Arts, Media & Entertainment | 0 (0.0%) | 0 (0.0%) |
| Health Diagnosing & Treating | 0 (0.0%) | 154 (100.0%) |
| Health Technologists | 0 (0.0%) | 93 (100.0%) |
| Total (Category) | 142 (33.4%) | 283 (66.6%) |
| Total (Overall) | 290 (47.9%) | 315 (52.1%) |
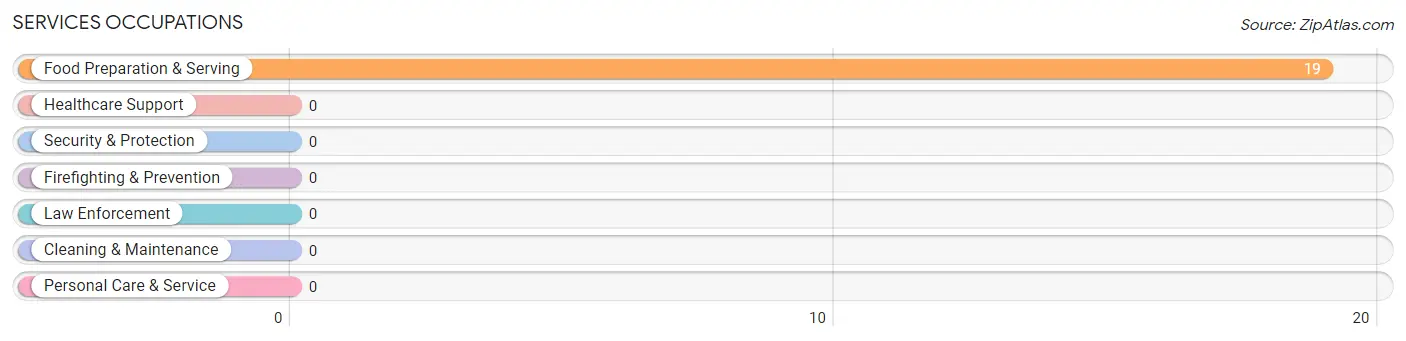
Services Occupations
The most common Services occupations in Holly Lake Ranch are , and Food Preparation & Serving (19 | 3.1%).
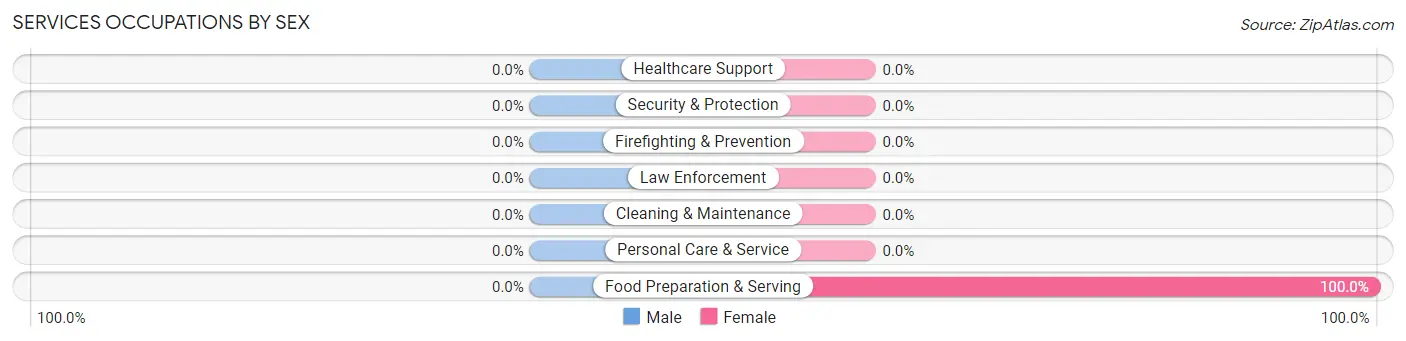
Services Occupations by Sex
| Occupation | Male | Female |
| Healthcare Support | 0 (0.0%) | 0 (0.0%) |
| Security & Protection | 0 (0.0%) | 0 (0.0%) |
| Firefighting & Prevention | 0 (0.0%) | 0 (0.0%) |
| Law Enforcement | 0 (0.0%) | 0 (0.0%) |
| Food Preparation & Serving | 0 (0.0%) | 19 (100.0%) |
| Cleaning & Maintenance | 0 (0.0%) | 0 (0.0%) |
| Personal Care & Service | 0 (0.0%) | 0 (0.0%) |
| Total (Category) | 0 (0.0%) | 19 (100.0%) |
| Total (Overall) | 290 (47.9%) | 315 (52.1%) |
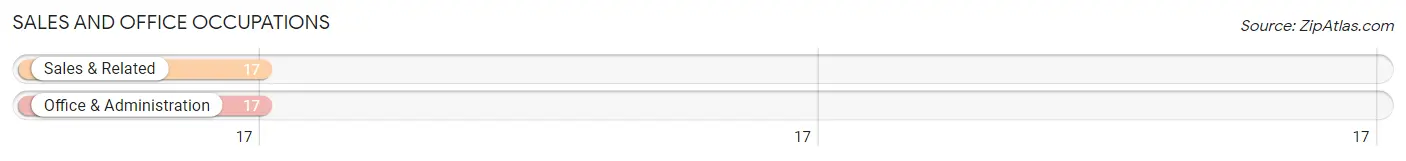
Sales and Office Occupations
The most common Sales and Office occupations in Holly Lake Ranch are Sales & Related (17 | 2.8%), and Office & Administration (17 | 2.8%).
Sales and Office Occupations by Sex
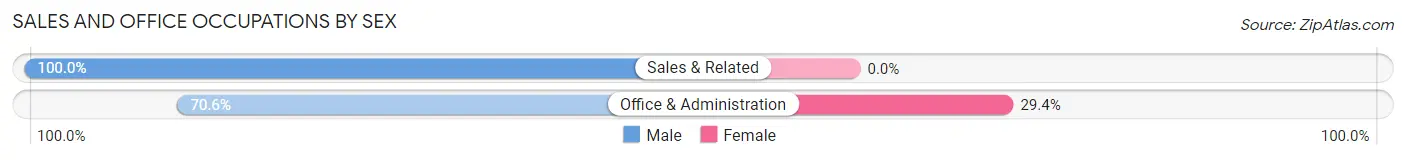
| Occupation | Male | Female |
| Sales & Related | 17 (100.0%) | 0 (0.0%) |
| Office & Administration | 12 (70.6%) | 5 (29.4%) |
| Total (Category) | 29 (85.3%) | 5 (14.7%) |
| Total (Overall) | 290 (47.9%) | 315 (52.1%) |
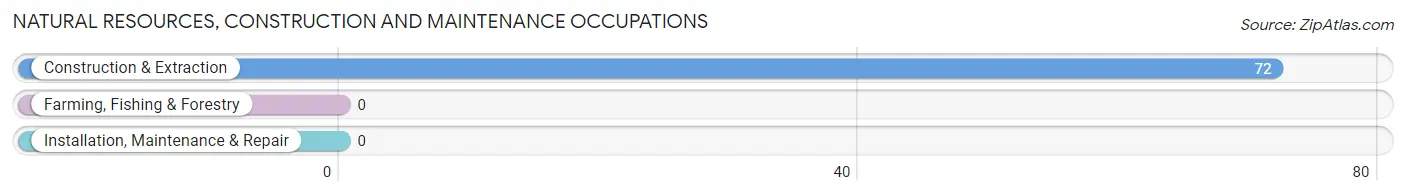
Natural Resources, Construction and Maintenance Occupations
The most common Natural Resources, Construction and Maintenance occupations in Holly Lake Ranch are , and Construction & Extraction (72 | 11.9%).
Natural Resources, Construction and Maintenance Occupations by Sex
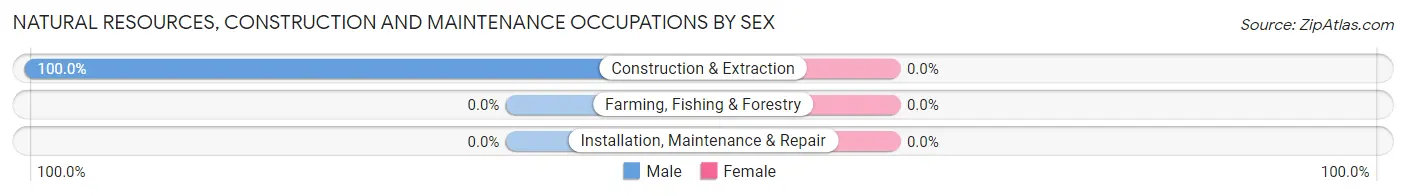
| Occupation | Male | Female |
| Farming, Fishing & Forestry | 0 (0.0%) | 0 (0.0%) |
| Construction & Extraction | 72 (100.0%) | 0 (0.0%) |
| Installation, Maintenance & Repair | 0 (0.0%) | 0 (0.0%) |
| Total (Category) | 72 (100.0%) | 0 (0.0%) |
| Total (Overall) | 290 (47.9%) | 315 (52.1%) |
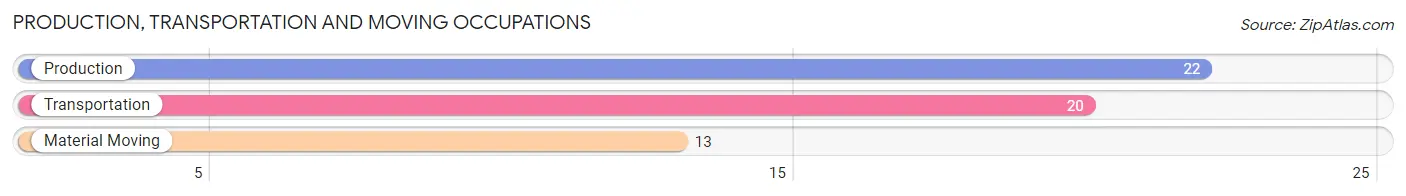
Production, Transportation and Moving Occupations
The most common Production, Transportation and Moving occupations in Holly Lake Ranch are Production (22 | 3.6%), Transportation (20 | 3.3%), and Material Moving (13 | 2.1%).
Production, Transportation and Moving Occupations by Sex
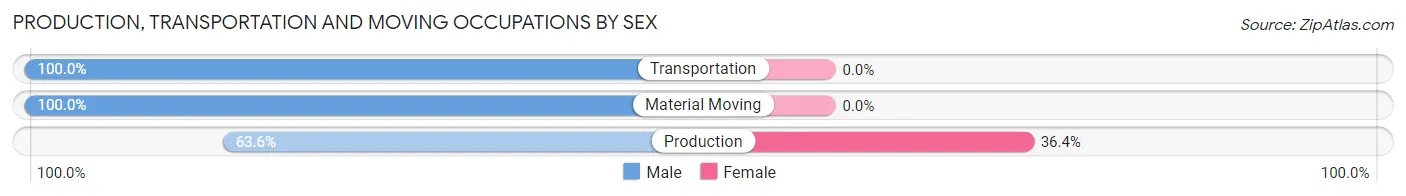
| Occupation | Male | Female |
| Production | 14 (63.6%) | 8 (36.4%) |
| Transportation | 20 (100.0%) | 0 (0.0%) |
| Material Moving | 13 (100.0%) | 0 (0.0%) |
| Total (Category) | 47 (85.5%) | 8 (14.5%) |
| Total (Overall) | 290 (47.9%) | 315 (52.1%) |
Employment Industries by Sex in Holly Lake Ranch
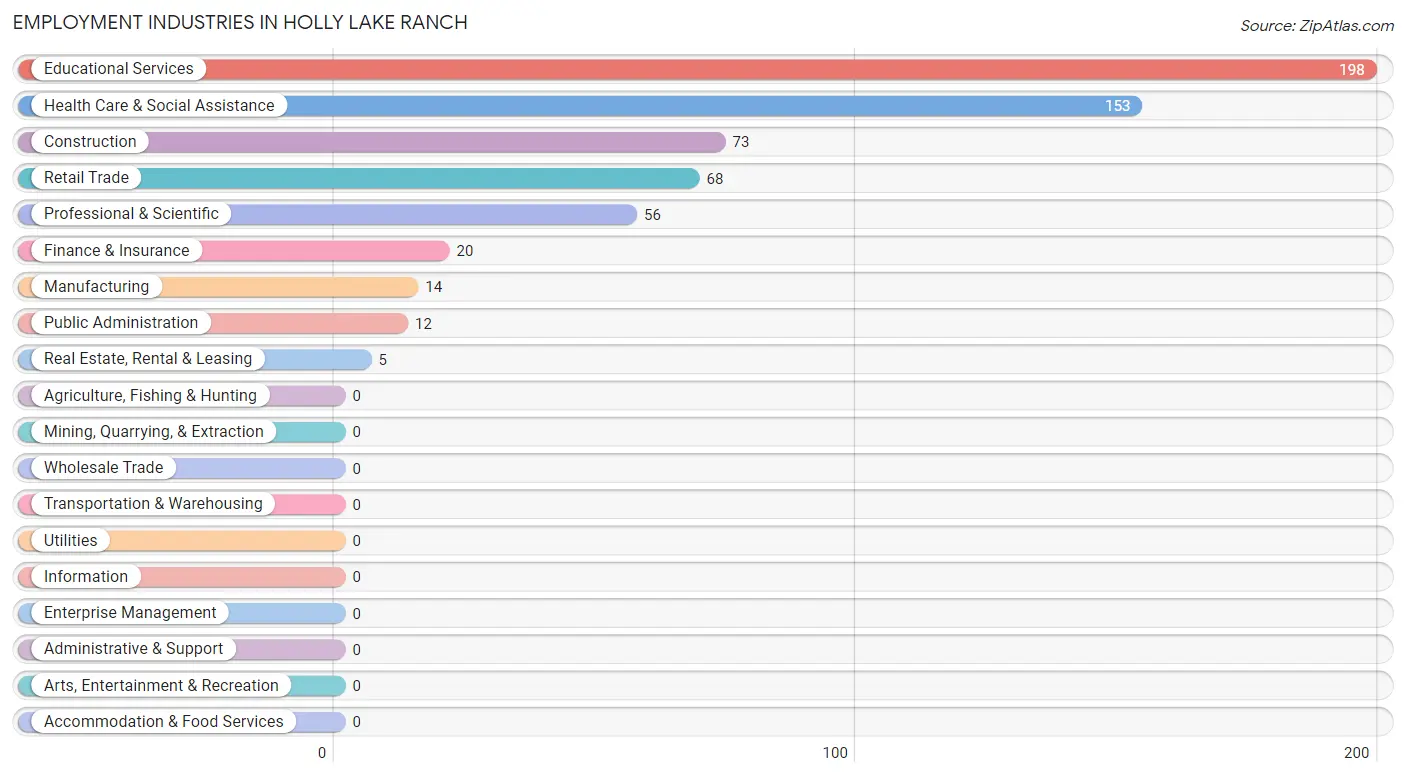
Employment Industries in Holly Lake Ranch
The major employment industries in Holly Lake Ranch include Educational Services (198 | 32.7%), Health Care & Social Assistance (153 | 25.3%), Construction (73 | 12.1%), Retail Trade (68 | 11.2%), and Professional & Scientific (56 | 9.3%).
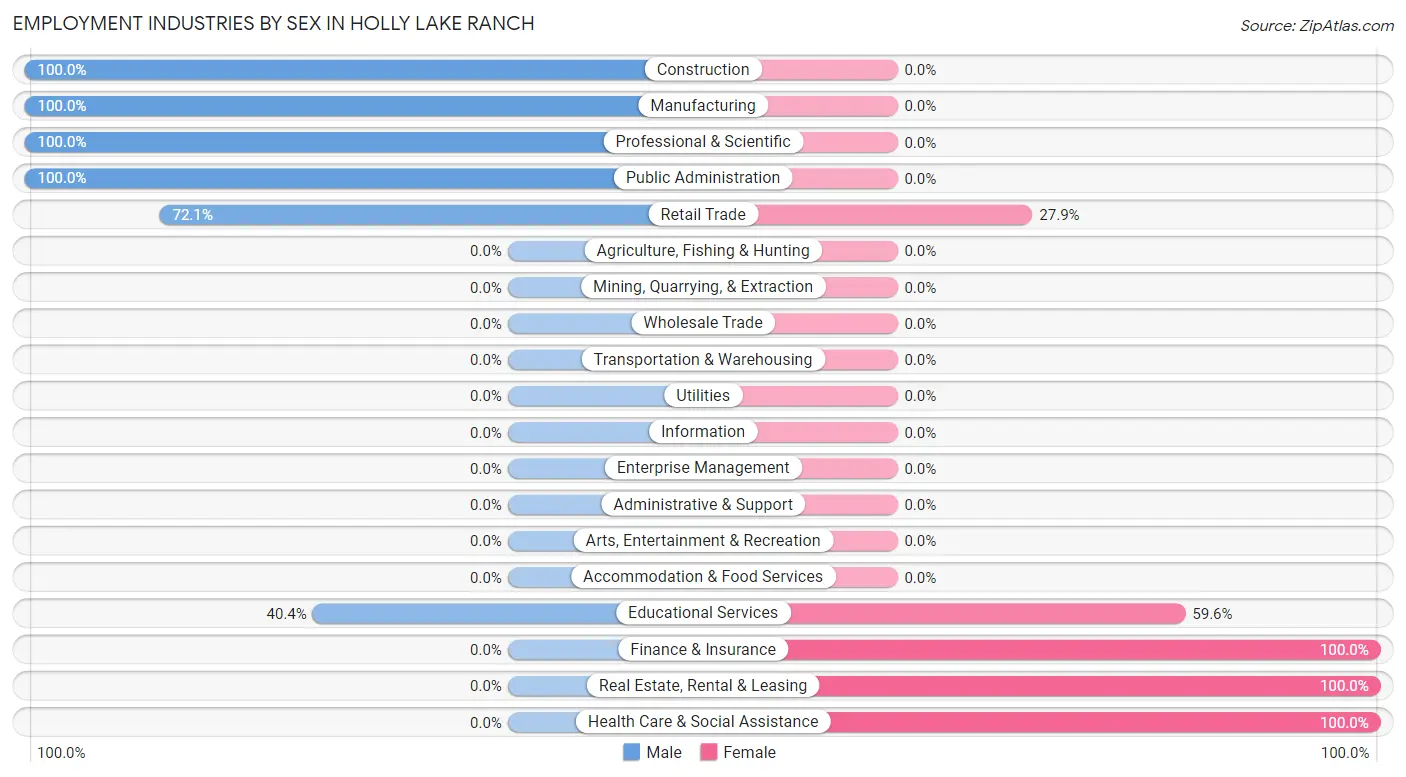
Employment Industries by Sex in Holly Lake Ranch
The Holly Lake Ranch industries that see more men than women are Construction (100.0%), Manufacturing (100.0%), and Professional & Scientific (100.0%), whereas the industries that tend to have a higher number of women are Finance & Insurance (100.0%), Real Estate, Rental & Leasing (100.0%), and Health Care & Social Assistance (100.0%).
| Industry | Male | Female |
| Agriculture, Fishing & Hunting | 0 (0.0%) | 0 (0.0%) |
| Mining, Quarrying, & Extraction | 0 (0.0%) | 0 (0.0%) |
| Construction | 73 (100.0%) | 0 (0.0%) |
| Manufacturing | 14 (100.0%) | 0 (0.0%) |
| Wholesale Trade | 0 (0.0%) | 0 (0.0%) |
| Retail Trade | 49 (72.1%) | 19 (27.9%) |
| Transportation & Warehousing | 0 (0.0%) | 0 (0.0%) |
| Utilities | 0 (0.0%) | 0 (0.0%) |
| Information | 0 (0.0%) | 0 (0.0%) |
| Finance & Insurance | 0 (0.0%) | 20 (100.0%) |
| Real Estate, Rental & Leasing | 0 (0.0%) | 5 (100.0%) |
| Professional & Scientific | 56 (100.0%) | 0 (0.0%) |
| Enterprise Management | 0 (0.0%) | 0 (0.0%) |
| Administrative & Support | 0 (0.0%) | 0 (0.0%) |
| Educational Services | 80 (40.4%) | 118 (59.6%) |
| Health Care & Social Assistance | 0 (0.0%) | 153 (100.0%) |
| Arts, Entertainment & Recreation | 0 (0.0%) | 0 (0.0%) |
| Accommodation & Food Services | 0 (0.0%) | 0 (0.0%) |
| Public Administration | 12 (100.0%) | 0 (0.0%) |
| Total | 290 (47.9%) | 315 (52.1%) |
Education in Holly Lake Ranch
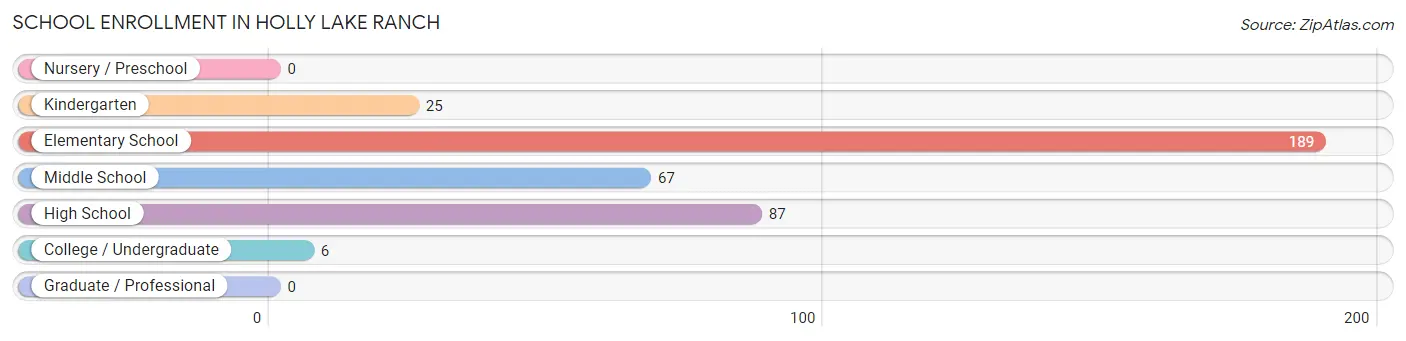
School Enrollment in Holly Lake Ranch
The most common levels of schooling among the 374 students in Holly Lake Ranch are elementary school (189 | 50.5%), high school (87 | 23.3%), and middle school (67 | 17.9%).
| School Level | # Students | % Students |
| Nursery / Preschool | 0 | 0.0% |
| Kindergarten | 25 | 6.7% |
| Elementary School | 189 | 50.5% |
| Middle School | 67 | 17.9% |
| High School | 87 | 23.3% |
| College / Undergraduate | 6 | 1.6% |
| Graduate / Professional | 0 | 0.0% |
| Total | 374 | 100.0% |
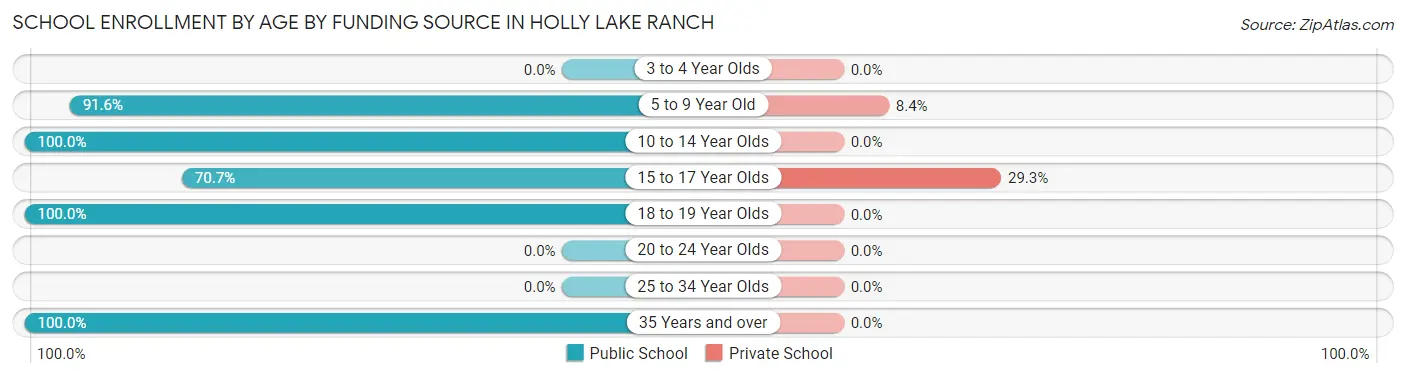
School Enrollment by Age by Funding Source in Holly Lake Ranch
Out of a total of 374 students who are enrolled in schools in Holly Lake Ranch, 35 (9.4%) attend a private institution, while the remaining 339 (90.6%) are enrolled in public schools. The age group of 15 to 17 year olds has the highest likelihood of being enrolled in private schools, with 17 (29.3% in the age bracket) enrolled. Conversely, the age group of 10 to 14 year olds has the lowest likelihood of being enrolled in a private school, with 88 (100.0% in the age bracket) attending a public institution.
| Age Bracket | Public School | Private School |
| 3 to 4 Year Olds | 0 (0.0%) | 0 (0.0%) |
| 5 to 9 Year Old | 196 (91.6%) | 18 (8.4%) |
| 10 to 14 Year Olds | 88 (100.0%) | 0 (0.0%) |
| 15 to 17 Year Olds | 41 (70.7%) | 17 (29.3%) |
| 18 to 19 Year Olds | 8 (100.0%) | 0 (0.0%) |
| 20 to 24 Year Olds | 0 (0.0%) | 0 (0.0%) |
| 25 to 34 Year Olds | 0 (0.0%) | 0 (0.0%) |
| 35 Years and over | 6 (100.0%) | 0 (0.0%) |
| Total | 339 (90.6%) | 35 (9.4%) |
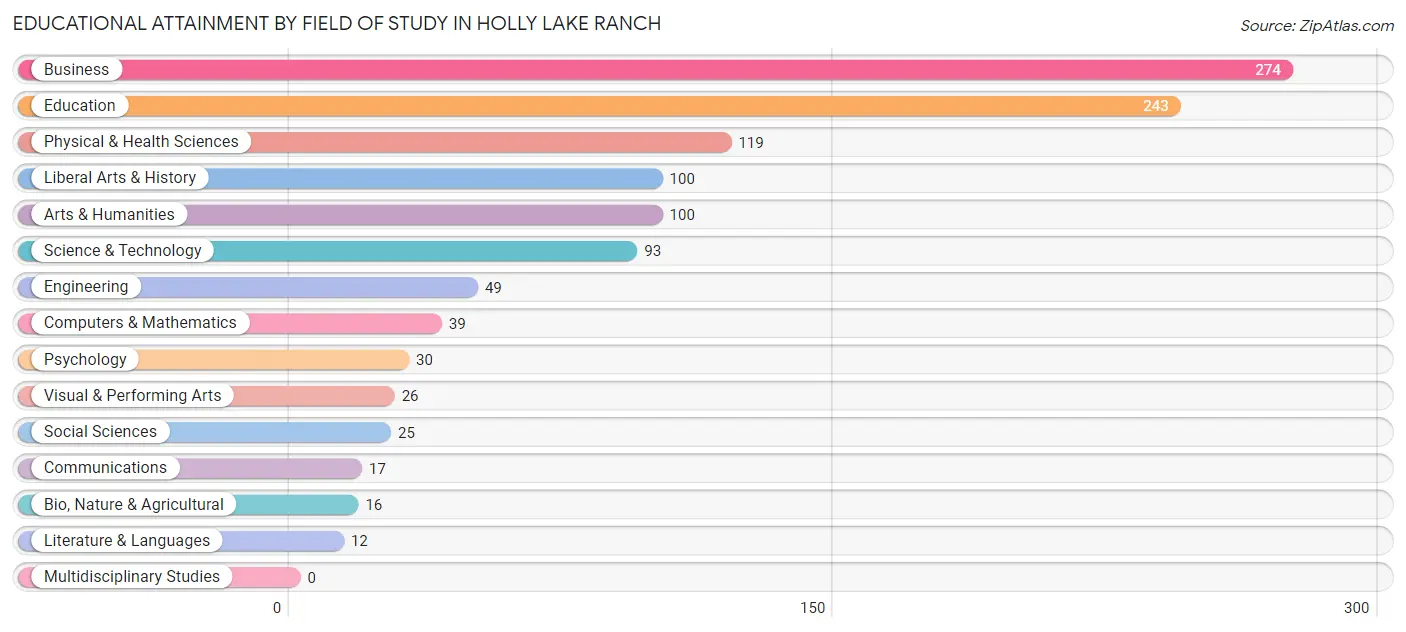
Educational Attainment by Field of Study in Holly Lake Ranch
Business (274 | 24.0%), education (243 | 21.3%), physical & health sciences (119 | 10.4%), liberal arts & history (100 | 8.7%), and arts & humanities (100 | 8.7%) are the most common fields of study among 1,143 individuals in Holly Lake Ranch who have obtained a bachelor's degree or higher.
| Field of Study | # Graduates | % Graduates |
| Computers & Mathematics | 39 | 3.4% |
| Bio, Nature & Agricultural | 16 | 1.4% |
| Physical & Health Sciences | 119 | 10.4% |
| Psychology | 30 | 2.6% |
| Social Sciences | 25 | 2.2% |
| Engineering | 49 | 4.3% |
| Multidisciplinary Studies | 0 | 0.0% |
| Science & Technology | 93 | 8.1% |
| Business | 274 | 24.0% |
| Education | 243 | 21.3% |
| Literature & Languages | 12 | 1.1% |
| Liberal Arts & History | 100 | 8.7% |
| Visual & Performing Arts | 26 | 2.3% |
| Communications | 17 | 1.5% |
| Arts & Humanities | 100 | 8.7% |
| Total | 1,143 | 100.0% |
Transportation & Commute in Holly Lake Ranch
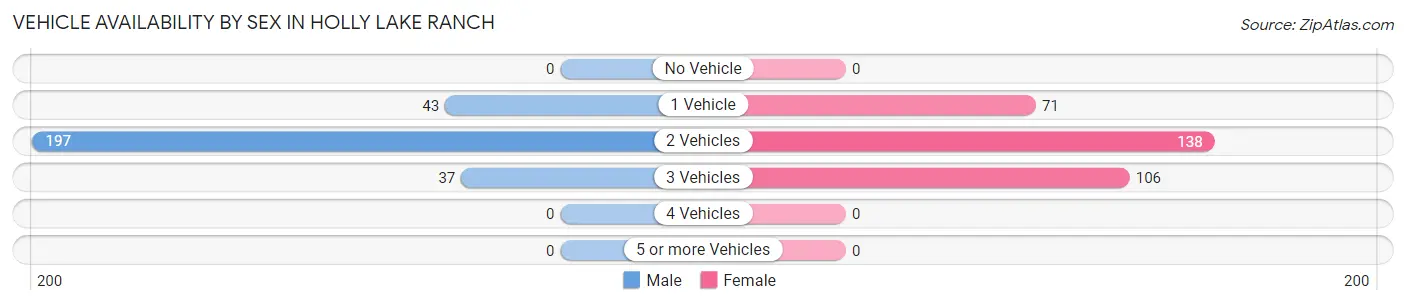
Vehicle Availability by Sex in Holly Lake Ranch
The most prevalent vehicle ownership categories in Holly Lake Ranch are males with 2 vehicles (197, accounting for 71.1%) and females with 2 vehicles (138, making up 62.5%).
| Vehicles Available | Male | Female |
| No Vehicle | 0 (0.0%) | 0 (0.0%) |
| 1 Vehicle | 43 (15.5%) | 71 (22.5%) |
| 2 Vehicles | 197 (71.1%) | 138 (43.8%) |
| 3 Vehicles | 37 (13.4%) | 106 (33.7%) |
| 4 Vehicles | 0 (0.0%) | 0 (0.0%) |
| 5 or more Vehicles | 0 (0.0%) | 0 (0.0%) |
| Total | 277 (100.0%) | 315 (100.0%) |
Commute Time in Holly Lake Ranch
The most frequently occuring commute durations in Holly Lake Ranch are 45 to 59 minutes (83 commuters, 22.2%), 30 to 34 minutes (68 commuters, 18.2%), and 40 to 44 minutes (43 commuters, 11.5%).
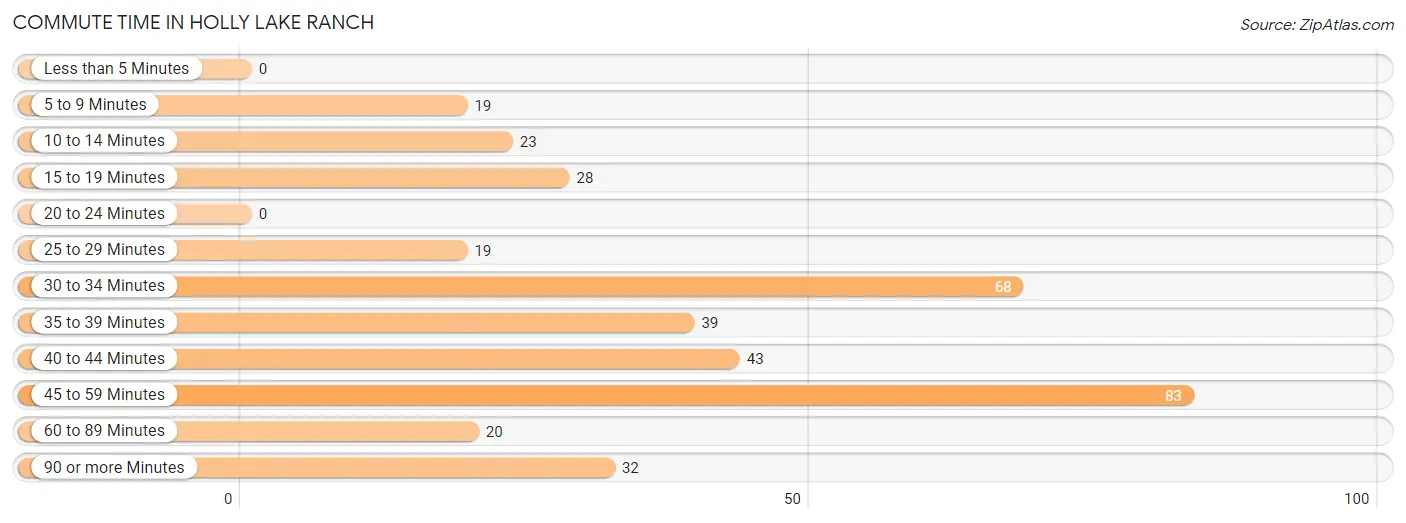
| Commute Time | # Commuters | % Commuters |
| Less than 5 Minutes | 0 | 0.0% |
| 5 to 9 Minutes | 19 | 5.1% |
| 10 to 14 Minutes | 23 | 6.1% |
| 15 to 19 Minutes | 28 | 7.5% |
| 20 to 24 Minutes | 0 | 0.0% |
| 25 to 29 Minutes | 19 | 5.1% |
| 30 to 34 Minutes | 68 | 18.2% |
| 35 to 39 Minutes | 39 | 10.4% |
| 40 to 44 Minutes | 43 | 11.5% |
| 45 to 59 Minutes | 83 | 22.2% |
| 60 to 89 Minutes | 20 | 5.3% |
| 90 or more Minutes | 32 | 8.6% |
Commute Time by Sex in Holly Lake Ranch
The most common commute times in Holly Lake Ranch are 45 to 59 minutes (68 commuters, 32.4%) for males and 30 to 34 minutes (52 commuters, 31.7%) for females.
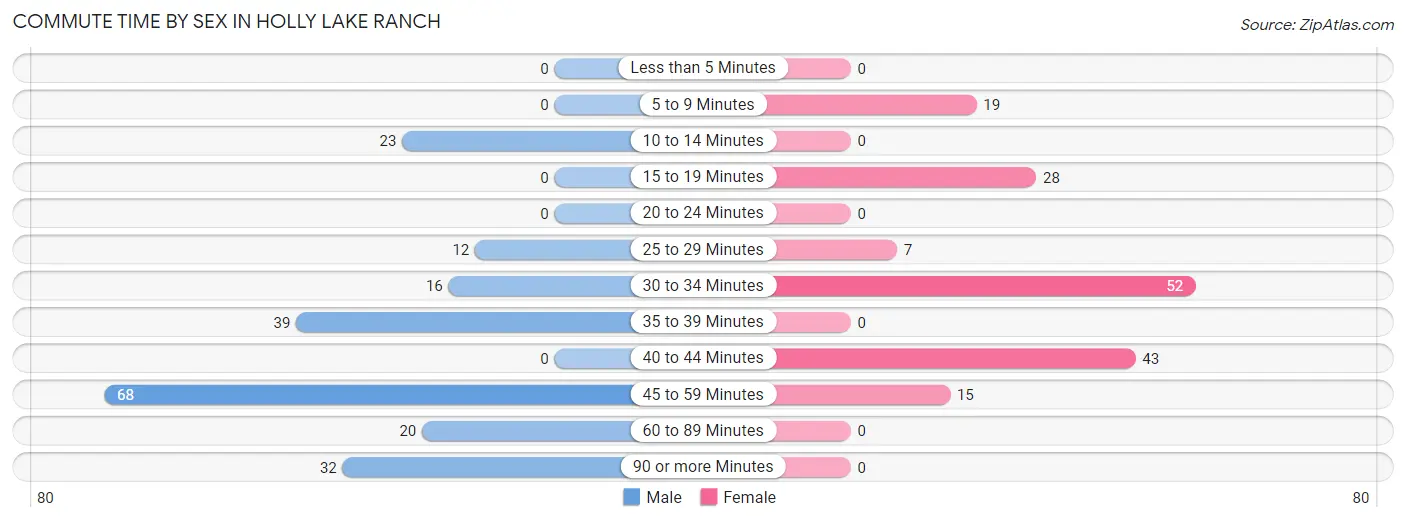
| Commute Time | Male | Female |
| Less than 5 Minutes | 0 (0.0%) | 0 (0.0%) |
| 5 to 9 Minutes | 0 (0.0%) | 19 (11.6%) |
| 10 to 14 Minutes | 23 (11.0%) | 0 (0.0%) |
| 15 to 19 Minutes | 0 (0.0%) | 28 (17.1%) |
| 20 to 24 Minutes | 0 (0.0%) | 0 (0.0%) |
| 25 to 29 Minutes | 12 (5.7%) | 7 (4.3%) |
| 30 to 34 Minutes | 16 (7.6%) | 52 (31.7%) |
| 35 to 39 Minutes | 39 (18.6%) | 0 (0.0%) |
| 40 to 44 Minutes | 0 (0.0%) | 43 (26.2%) |
| 45 to 59 Minutes | 68 (32.4%) | 15 (9.1%) |
| 60 to 89 Minutes | 20 (9.5%) | 0 (0.0%) |
| 90 or more Minutes | 32 (15.2%) | 0 (0.0%) |
Time of Departure to Work by Sex in Holly Lake Ranch
The most frequent times of departure to work in Holly Lake Ranch are 6:30 AM to 6:59 AM (66, 31.4%) for males and 7:00 AM to 7:29 AM (63, 38.4%) for females.
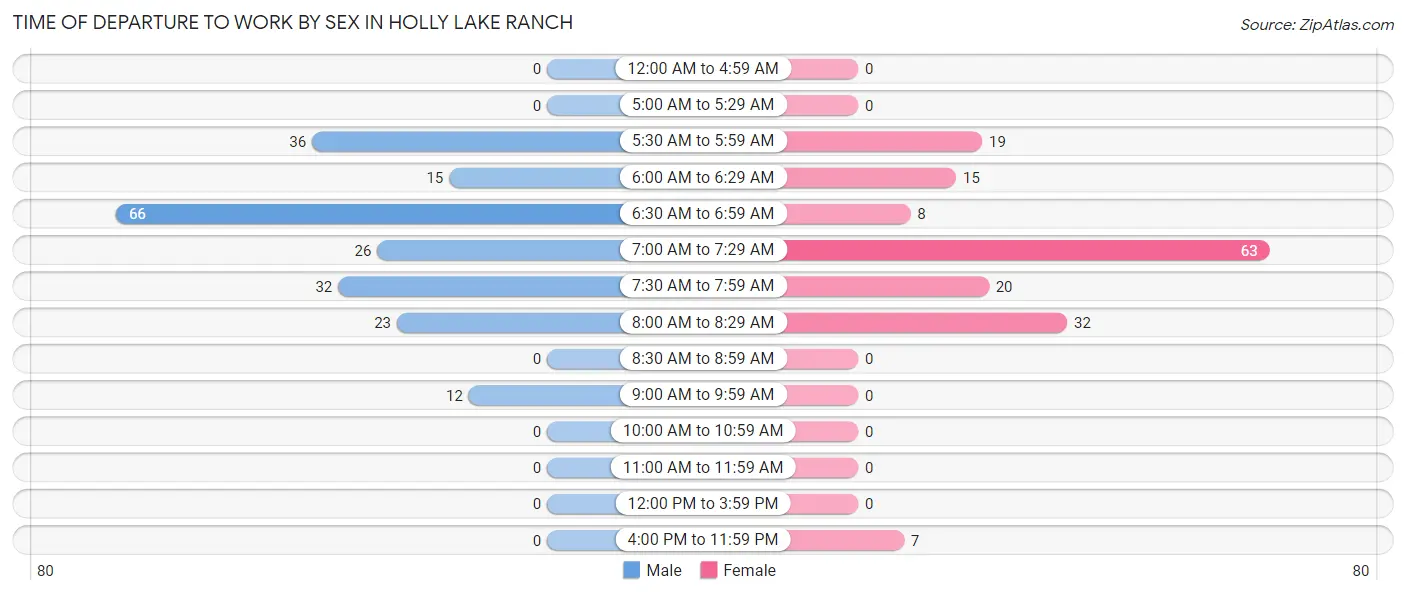
| Time of Departure | Male | Female |
| 12:00 AM to 4:59 AM | 0 (0.0%) | 0 (0.0%) |
| 5:00 AM to 5:29 AM | 0 (0.0%) | 0 (0.0%) |
| 5:30 AM to 5:59 AM | 36 (17.1%) | 19 (11.6%) |
| 6:00 AM to 6:29 AM | 15 (7.1%) | 15 (9.1%) |
| 6:30 AM to 6:59 AM | 66 (31.4%) | 8 (4.9%) |
| 7:00 AM to 7:29 AM | 26 (12.4%) | 63 (38.4%) |
| 7:30 AM to 7:59 AM | 32 (15.2%) | 20 (12.2%) |
| 8:00 AM to 8:29 AM | 23 (11.0%) | 32 (19.5%) |
| 8:30 AM to 8:59 AM | 0 (0.0%) | 0 (0.0%) |
| 9:00 AM to 9:59 AM | 12 (5.7%) | 0 (0.0%) |
| 10:00 AM to 10:59 AM | 0 (0.0%) | 0 (0.0%) |
| 11:00 AM to 11:59 AM | 0 (0.0%) | 0 (0.0%) |
| 12:00 PM to 3:59 PM | 0 (0.0%) | 0 (0.0%) |
| 4:00 PM to 11:59 PM | 0 (0.0%) | 7 (4.3%) |
| Total | 210 (100.0%) | 164 (100.0%) |
Housing Occupancy in Holly Lake Ranch
Occupancy by Ownership in Holly Lake Ranch
Of the total 1,180 dwellings in Holly Lake Ranch, owner-occupied units account for 1,110 (94.1%), while renter-occupied units make up 70 (5.9%).
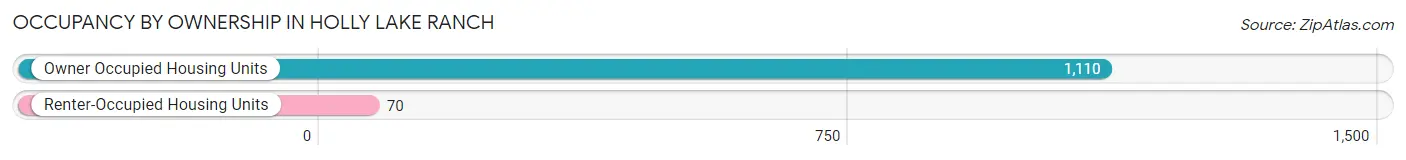
| Occupancy | # Housing Units | % Housing Units |
| Owner Occupied Housing Units | 1,110 | 94.1% |
| Renter-Occupied Housing Units | 70 | 5.9% |
| Total Occupied Housing Units | 1,180 | 100.0% |
Occupancy by Household Size in Holly Lake Ranch
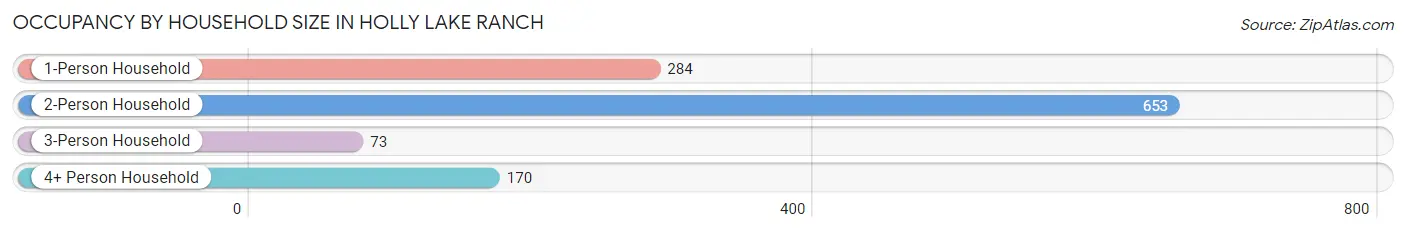
| Household Size | # Housing Units | % Housing Units |
| 1-Person Household | 284 | 24.1% |
| 2-Person Household | 653 | 55.3% |
| 3-Person Household | 73 | 6.2% |
| 4+ Person Household | 170 | 14.4% |
| Total Housing Units | 1,180 | 100.0% |
Occupancy by Ownership by Household Size in Holly Lake Ranch
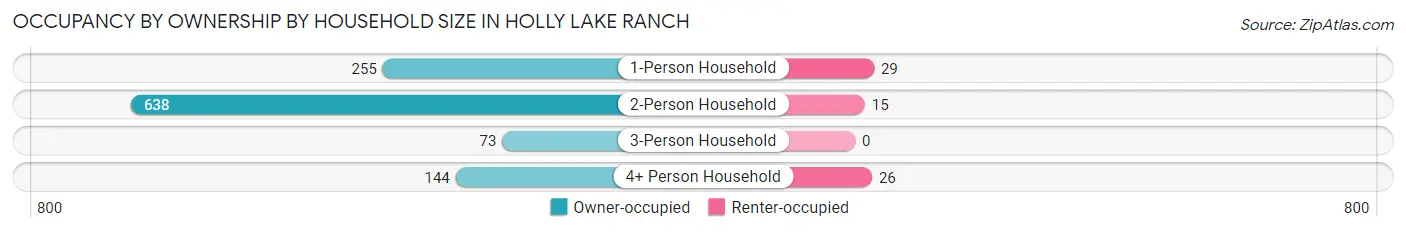
| Household Size | Owner-occupied | Renter-occupied |
| 1-Person Household | 255 (89.8%) | 29 (10.2%) |
| 2-Person Household | 638 (97.7%) | 15 (2.3%) |
| 3-Person Household | 73 (100.0%) | 0 (0.0%) |
| 4+ Person Household | 144 (84.7%) | 26 (15.3%) |
| Total Housing Units | 1,110 (94.1%) | 70 (5.9%) |
Occupancy by Educational Attainment in Holly Lake Ranch
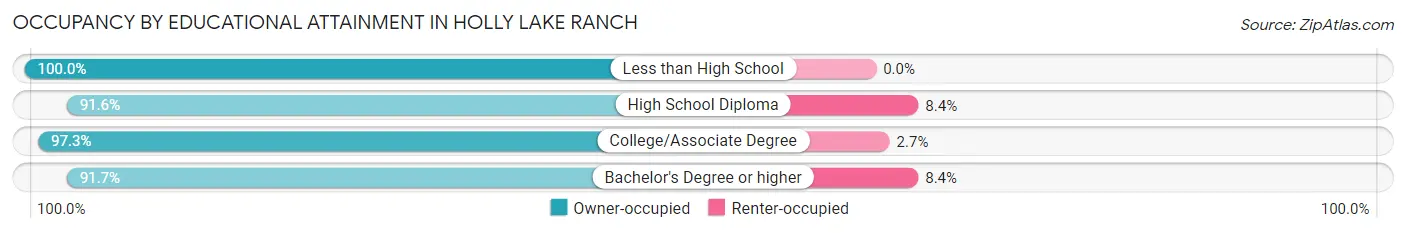
| Household Size | Owner-occupied | Renter-occupied |
| Less than High School | 36 (100.0%) | 0 (0.0%) |
| High School Diploma | 186 (91.6%) | 17 (8.4%) |
| College/Associate Degree | 438 (97.3%) | 12 (2.7%) |
| Bachelor's Degree or higher | 450 (91.6%) | 41 (8.4%) |
Occupancy by Age of Householder in Holly Lake Ranch
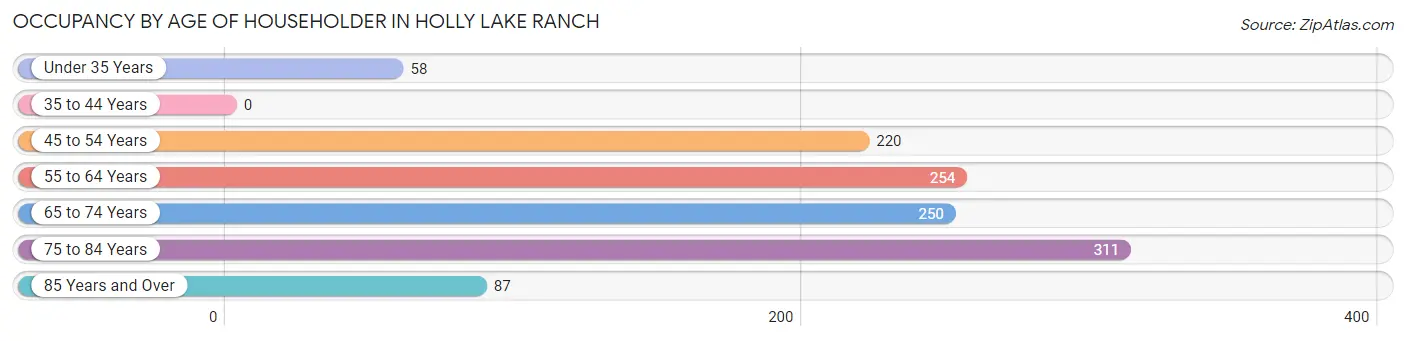
| Age Bracket | # Households | % Households |
| Under 35 Years | 58 | 4.9% |
| 35 to 44 Years | 0 | 0.0% |
| 45 to 54 Years | 220 | 18.6% |
| 55 to 64 Years | 254 | 21.5% |
| 65 to 74 Years | 250 | 21.2% |
| 75 to 84 Years | 311 | 26.4% |
| 85 Years and Over | 87 | 7.4% |
| Total | 1,180 | 100.0% |
Housing Finances in Holly Lake Ranch
Median Income by Occupancy in Holly Lake Ranch
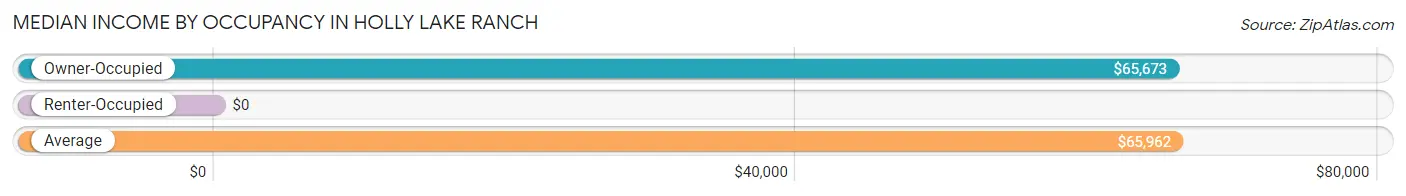
| Occupancy Type | # Households | Median Income |
| Owner-Occupied | 1,110 (94.1%) | $65,673 |
| Renter-Occupied | 70 (5.9%) | $0 |
| Average | 1,180 (100.0%) | $65,962 |
Occupancy by Householder Income Bracket in Holly Lake Ranch
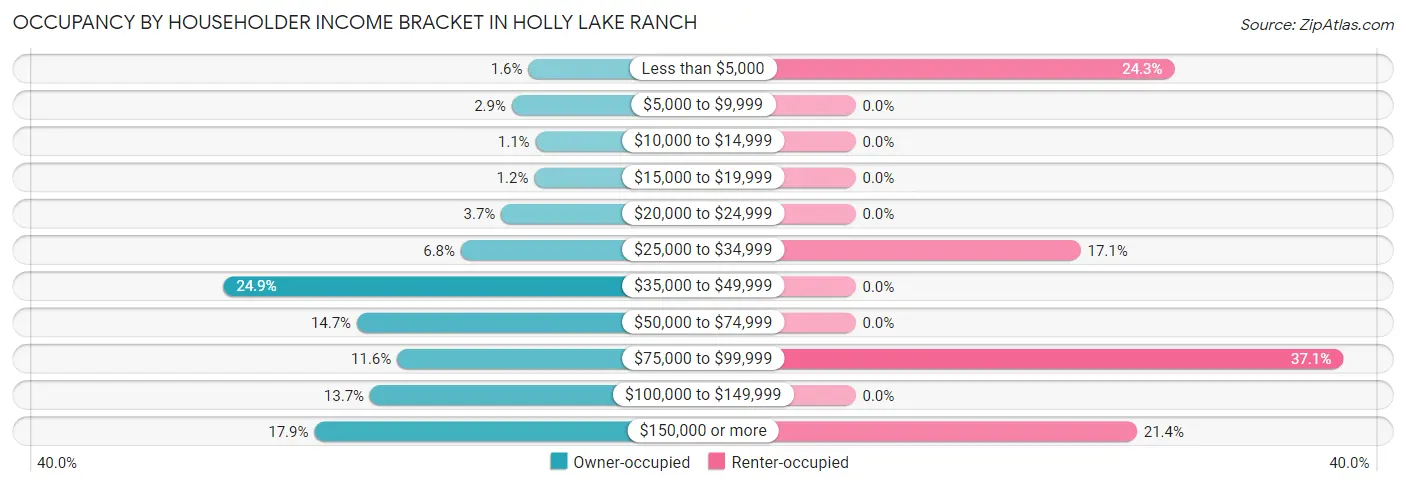
| Income Bracket | Owner-occupied | Renter-occupied |
| Less than $5,000 | 18 (1.6%) | 17 (24.3%) |
| $5,000 to $9,999 | 32 (2.9%) | 0 (0.0%) |
| $10,000 to $14,999 | 12 (1.1%) | 0 (0.0%) |
| $15,000 to $19,999 | 13 (1.2%) | 0 (0.0%) |
| $20,000 to $24,999 | 41 (3.7%) | 0 (0.0%) |
| $25,000 to $34,999 | 75 (6.8%) | 12 (17.1%) |
| $35,000 to $49,999 | 276 (24.9%) | 0 (0.0%) |
| $50,000 to $74,999 | 163 (14.7%) | 0 (0.0%) |
| $75,000 to $99,999 | 129 (11.6%) | 26 (37.1%) |
| $100,000 to $149,999 | 152 (13.7%) | 0 (0.0%) |
| $150,000 or more | 199 (17.9%) | 15 (21.4%) |
| Total | 1,110 (100.0%) | 70 (100.0%) |
Monthly Housing Cost Tiers in Holly Lake Ranch
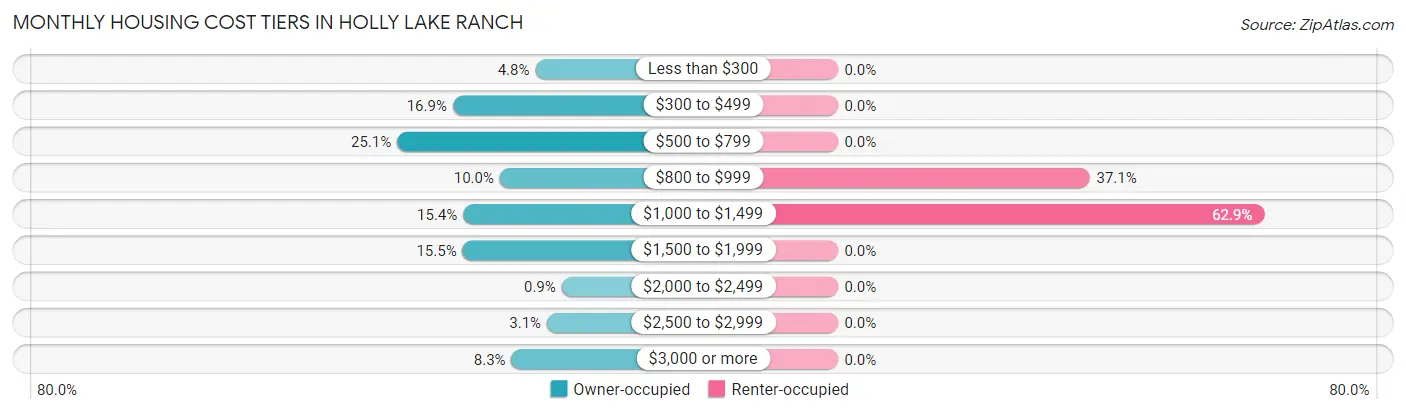
| Monthly Cost | Owner-occupied | Renter-occupied |
| Less than $300 | 53 (4.8%) | 0 (0.0%) |
| $300 to $499 | 188 (16.9%) | 0 (0.0%) |
| $500 to $799 | 279 (25.1%) | 0 (0.0%) |
| $800 to $999 | 111 (10.0%) | 26 (37.1%) |
| $1,000 to $1,499 | 171 (15.4%) | 44 (62.9%) |
| $1,500 to $1,999 | 172 (15.5%) | 0 (0.0%) |
| $2,000 to $2,499 | 10 (0.9%) | 0 (0.0%) |
| $2,500 to $2,999 | 34 (3.1%) | 0 (0.0%) |
| $3,000 or more | 92 (8.3%) | 0 (0.0%) |
| Total | 1,110 (100.0%) | 70 (100.0%) |
Physical Housing Characteristics in Holly Lake Ranch
Housing Structures in Holly Lake Ranch
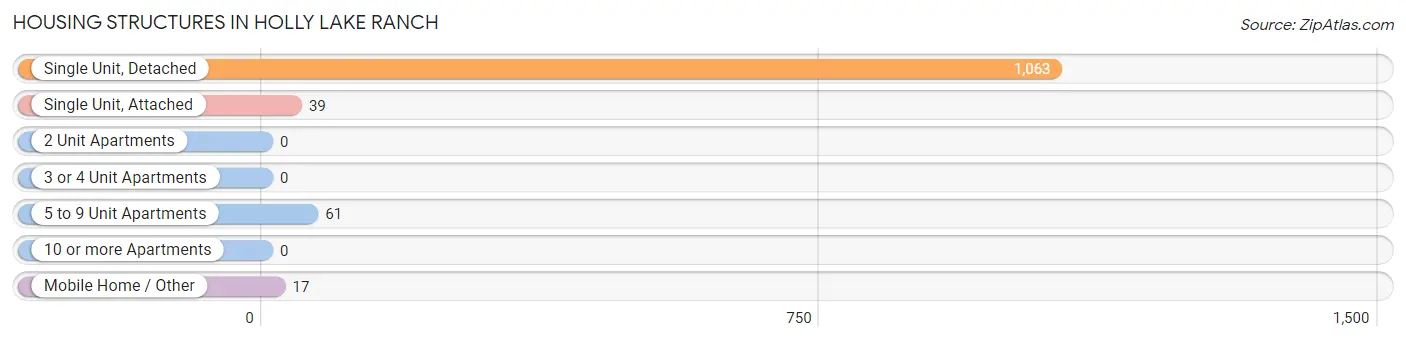
| Structure Type | # Housing Units | % Housing Units |
| Single Unit, Detached | 1,063 | 90.1% |
| Single Unit, Attached | 39 | 3.3% |
| 2 Unit Apartments | 0 | 0.0% |
| 3 or 4 Unit Apartments | 0 | 0.0% |
| 5 to 9 Unit Apartments | 61 | 5.2% |
| 10 or more Apartments | 0 | 0.0% |
| Mobile Home / Other | 17 | 1.4% |
| Total | 1,180 | 100.0% |
Housing Structures by Occupancy in Holly Lake Ranch
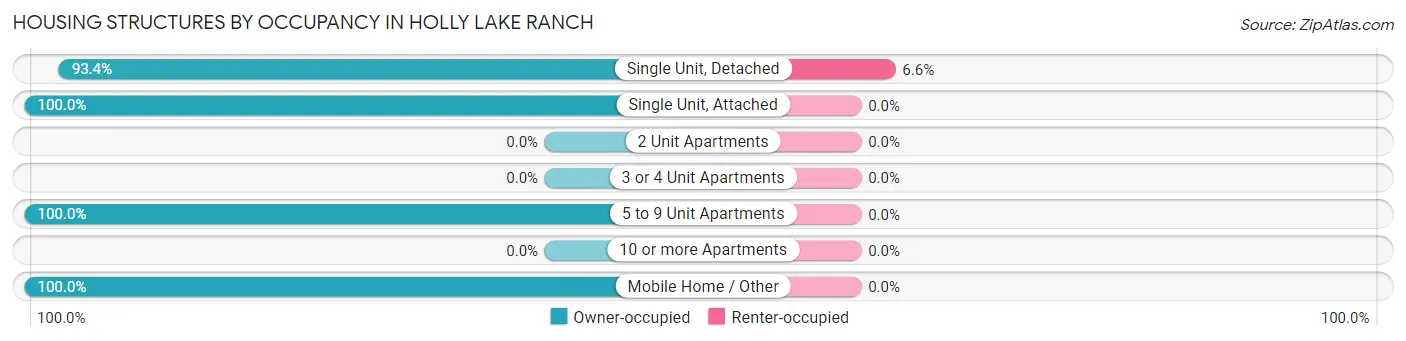
| Structure Type | Owner-occupied | Renter-occupied |
| Single Unit, Detached | 993 (93.4%) | 70 (6.6%) |
| Single Unit, Attached | 39 (100.0%) | 0 (0.0%) |
| 2 Unit Apartments | 0 (0.0%) | 0 (0.0%) |
| 3 or 4 Unit Apartments | 0 (0.0%) | 0 (0.0%) |
| 5 to 9 Unit Apartments | 61 (100.0%) | 0 (0.0%) |
| 10 or more Apartments | 0 (0.0%) | 0 (0.0%) |
| Mobile Home / Other | 17 (100.0%) | 0 (0.0%) |
| Total | 1,110 (94.1%) | 70 (5.9%) |
Housing Structures by Number of Rooms in Holly Lake Ranch
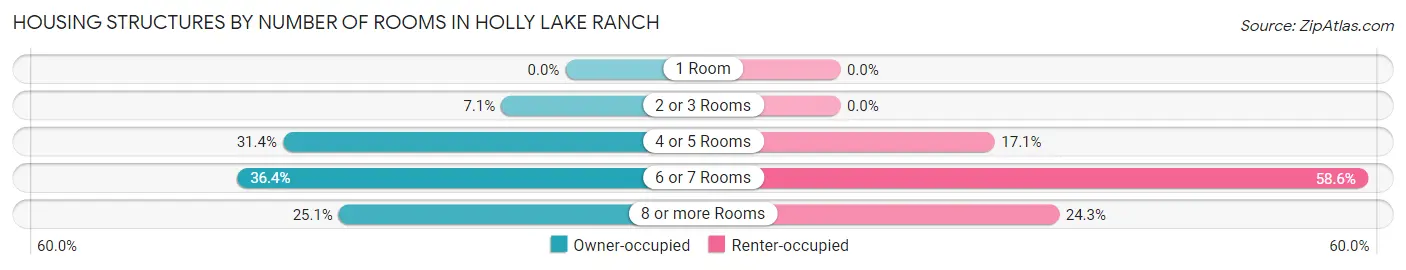
| Number of Rooms | Owner-occupied | Renter-occupied |
| 1 Room | 0 (0.0%) | 0 (0.0%) |
| 2 or 3 Rooms | 79 (7.1%) | 0 (0.0%) |
| 4 or 5 Rooms | 348 (31.4%) | 12 (17.1%) |
| 6 or 7 Rooms | 404 (36.4%) | 41 (58.6%) |
| 8 or more Rooms | 279 (25.1%) | 17 (24.3%) |
| Total | 1,110 (100.0%) | 70 (100.0%) |
Housing Structure by Heating Type in Holly Lake Ranch
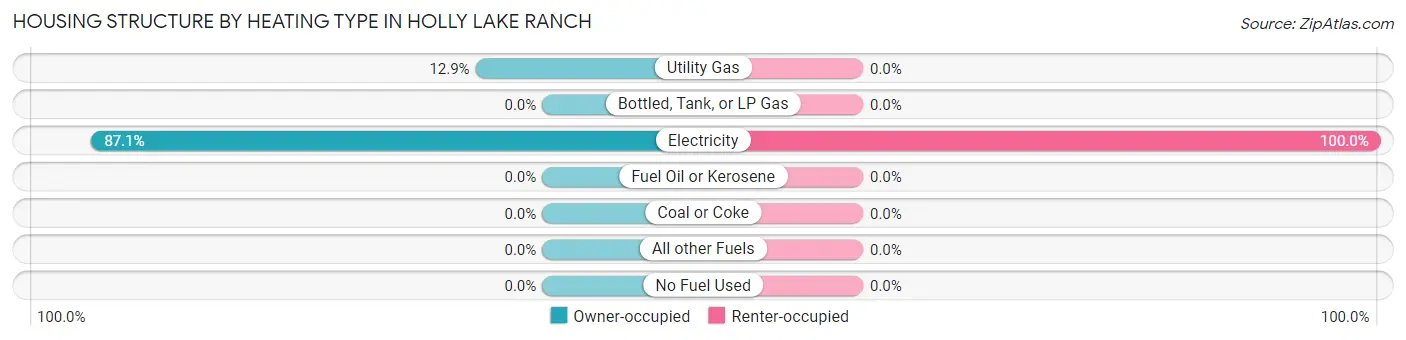
| Heating Type | Owner-occupied | Renter-occupied |
| Utility Gas | 143 (12.9%) | 0 (0.0%) |
| Bottled, Tank, or LP Gas | 0 (0.0%) | 0 (0.0%) |
| Electricity | 967 (87.1%) | 70 (100.0%) |
| Fuel Oil or Kerosene | 0 (0.0%) | 0 (0.0%) |
| Coal or Coke | 0 (0.0%) | 0 (0.0%) |
| All other Fuels | 0 (0.0%) | 0 (0.0%) |
| No Fuel Used | 0 (0.0%) | 0 (0.0%) |
| Total | 1,110 (100.0%) | 70 (100.0%) |
Household Vehicle Usage in Holly Lake Ranch
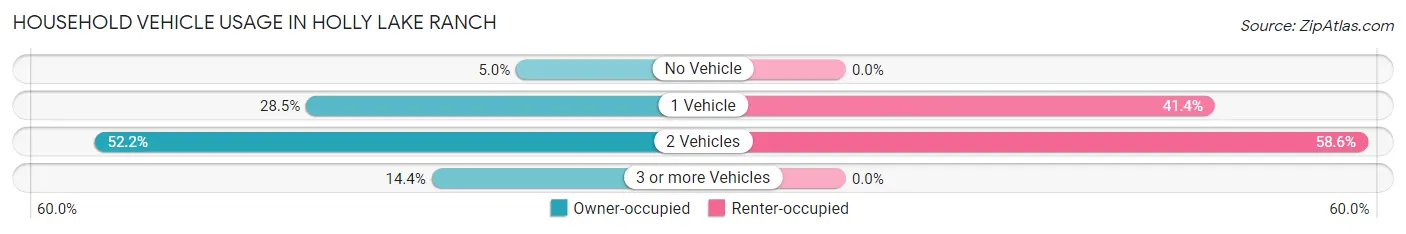
| Vehicles per Household | Owner-occupied | Renter-occupied |
| No Vehicle | 55 (5.0%) | 0 (0.0%) |
| 1 Vehicle | 316 (28.5%) | 29 (41.4%) |
| 2 Vehicles | 579 (52.2%) | 41 (58.6%) |
| 3 or more Vehicles | 160 (14.4%) | 0 (0.0%) |
| Total | 1,110 (100.0%) | 70 (100.0%) |
Real Estate & Mortgages in Holly Lake Ranch
Real Estate and Mortgage Overview in Holly Lake Ranch
| Characteristic | Without Mortgage | With Mortgage |
| Housing Units | 577 | 533 |
| Median Property Value | $191,200 | $242,300 |
| Median Household Income | $59,440 | $142 |
| Monthly Housing Costs | $548 | $92 |
| Real Estate Taxes | $1,809 | $0 |
Property Value by Mortgage Status in Holly Lake Ranch
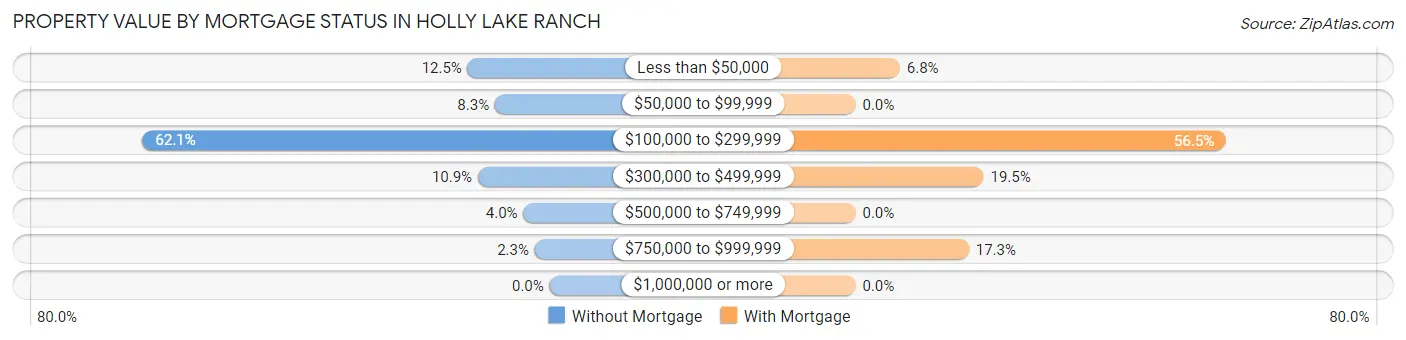
| Property Value | Without Mortgage | With Mortgage |
| Less than $50,000 | 72 (12.5%) | 36 (6.8%) |
| $50,000 to $99,999 | 48 (8.3%) | 0 (0.0%) |
| $100,000 to $299,999 | 358 (62.1%) | 301 (56.5%) |
| $300,000 to $499,999 | 63 (10.9%) | 104 (19.5%) |
| $500,000 to $749,999 | 23 (4.0%) | 0 (0.0%) |
| $750,000 to $999,999 | 13 (2.2%) | 92 (17.3%) |
| $1,000,000 or more | 0 (0.0%) | 0 (0.0%) |
| Total | 577 (100.0%) | 533 (100.0%) |
Household Income by Mortgage Status in Holly Lake Ranch
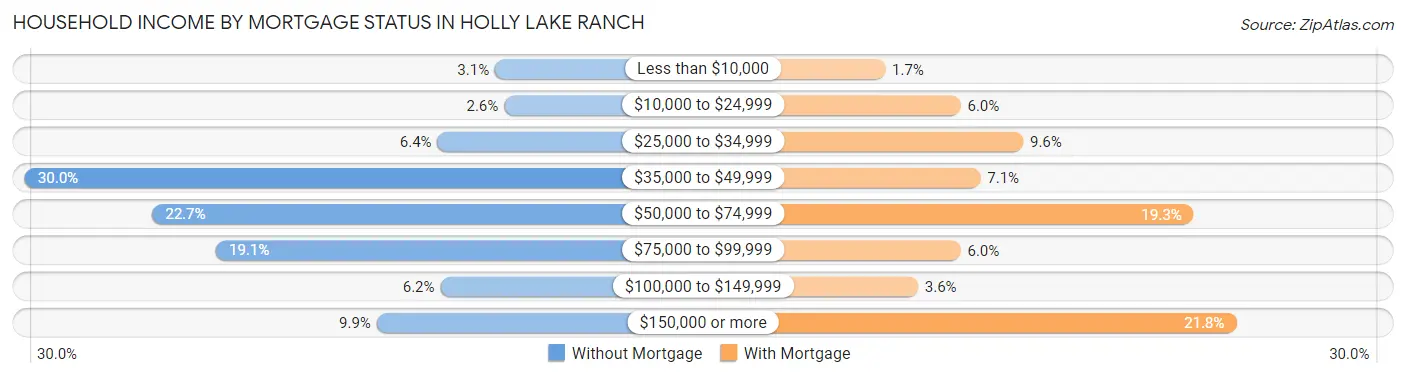
| Household Income | Without Mortgage | With Mortgage |
| Less than $10,000 | 18 (3.1%) | 9 (1.7%) |
| $10,000 to $24,999 | 15 (2.6%) | 32 (6.0%) |
| $25,000 to $34,999 | 37 (6.4%) | 51 (9.6%) |
| $35,000 to $49,999 | 173 (30.0%) | 38 (7.1%) |
| $50,000 to $74,999 | 131 (22.7%) | 103 (19.3%) |
| $75,000 to $99,999 | 110 (19.1%) | 32 (6.0%) |
| $100,000 to $149,999 | 36 (6.2%) | 19 (3.6%) |
| $150,000 or more | 57 (9.9%) | 116 (21.8%) |
| Total | 577 (100.0%) | 533 (100.0%) |
Property Value to Household Income Ratio in Holly Lake Ranch
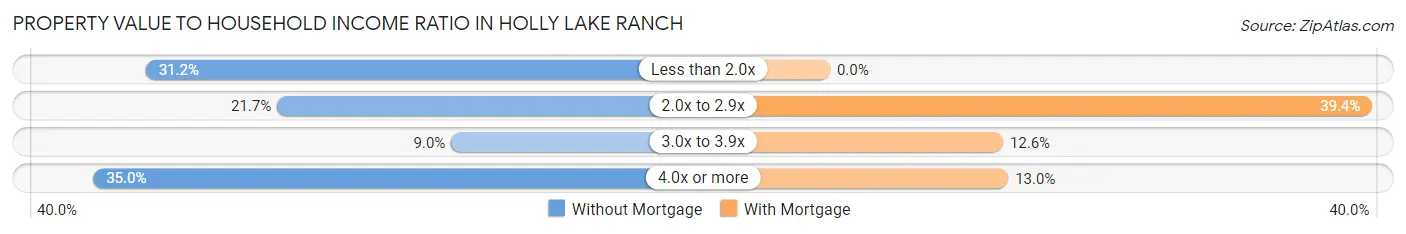
| Value-to-Income Ratio | Without Mortgage | With Mortgage |
| Less than 2.0x | 180 (31.2%) | 0 (0.0%) |
| 2.0x to 2.9x | 125 (21.7%) | 210 (39.4%) |
| 3.0x to 3.9x | 52 (9.0%) | 67 (12.6%) |
| 4.0x or more | 202 (35.0%) | 69 (13.0%) |
| Total | 577 (100.0%) | 533 (100.0%) |
Real Estate Taxes by Mortgage Status in Holly Lake Ranch
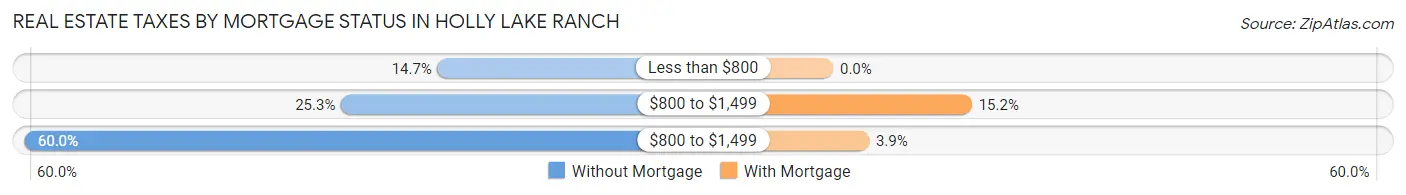
| Property Taxes | Without Mortgage | With Mortgage |
| Less than $800 | 85 (14.7%) | 0 (0.0%) |
| $800 to $1,499 | 146 (25.3%) | 81 (15.2%) |
| $800 to $1,499 | 346 (60.0%) | 21 (3.9%) |
| Total | 577 (100.0%) | 533 (100.0%) |
Health & Disability in Holly Lake Ranch
Health Insurance Coverage by Age in Holly Lake Ranch
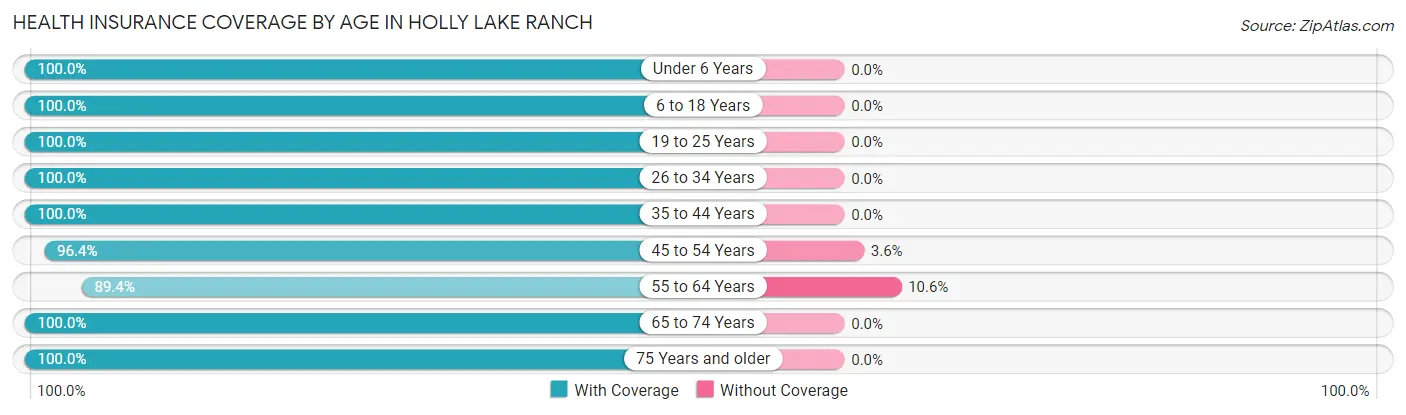
| Age Bracket | With Coverage | Without Coverage |
| Under 6 Years | 79 (100.0%) | 0 (0.0%) |
| 6 to 18 Years | 343 (100.0%) | 0 (0.0%) |
| 19 to 25 Years | 14 (100.0%) | 0 (0.0%) |
| 26 to 34 Years | 97 (100.0%) | 0 (0.0%) |
| 35 to 44 Years | 133 (100.0%) | 0 (0.0%) |
| 45 to 54 Years | 291 (96.4%) | 11 (3.6%) |
| 55 to 64 Years | 354 (89.4%) | 42 (10.6%) |
| 65 to 74 Years | 567 (100.0%) | 0 (0.0%) |
| 75 Years and older | 592 (100.0%) | 0 (0.0%) |
| Total | 2,470 (97.9%) | 53 (2.1%) |
Health Insurance Coverage by Citizenship Status in Holly Lake Ranch
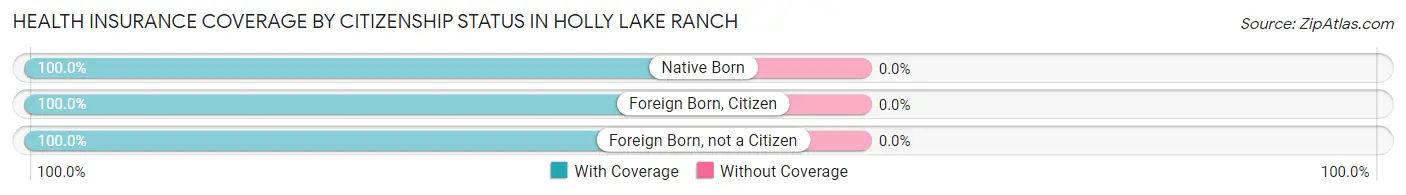
| Citizenship Status | With Coverage | Without Coverage |
| Native Born | 79 (100.0%) | 0 (0.0%) |
| Foreign Born, Citizen | 343 (100.0%) | 0 (0.0%) |
| Foreign Born, not a Citizen | 14 (100.0%) | 0 (0.0%) |
Health Insurance Coverage by Household Income in Holly Lake Ranch
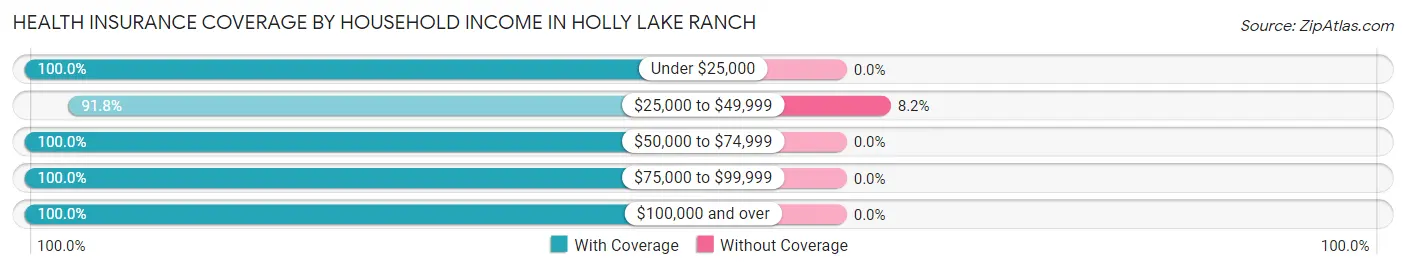
| Household Income | With Coverage | Without Coverage |
| Under $25,000 | 192 (100.0%) | 0 (0.0%) |
| $25,000 to $49,999 | 590 (91.8%) | 53 (8.2%) |
| $50,000 to $74,999 | 285 (100.0%) | 0 (0.0%) |
| $75,000 to $99,999 | 388 (100.0%) | 0 (0.0%) |
| $100,000 and over | 1,015 (100.0%) | 0 (0.0%) |
Public vs Private Health Insurance Coverage by Age in Holly Lake Ranch
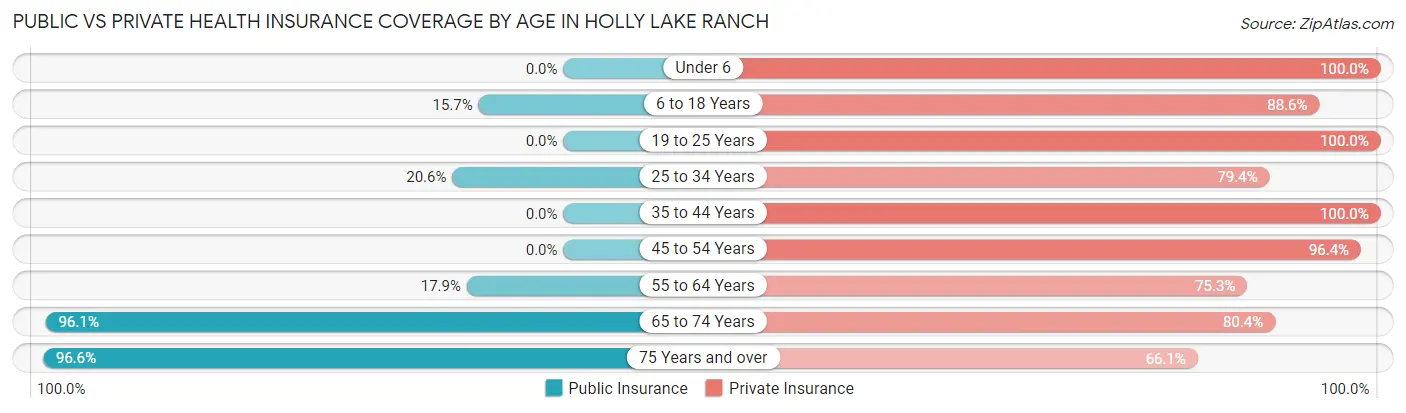
| Age Bracket | Public Insurance | Private Insurance |
| Under 6 | 0 (0.0%) | 79 (100.0%) |
| 6 to 18 Years | 54 (15.7%) | 304 (88.6%) |
| 19 to 25 Years | 0 (0.0%) | 14 (100.0%) |
| 25 to 34 Years | 20 (20.6%) | 77 (79.4%) |
| 35 to 44 Years | 0 (0.0%) | 133 (100.0%) |
| 45 to 54 Years | 0 (0.0%) | 291 (96.4%) |
| 55 to 64 Years | 71 (17.9%) | 298 (75.2%) |
| 65 to 74 Years | 545 (96.1%) | 456 (80.4%) |
| 75 Years and over | 572 (96.6%) | 391 (66.0%) |
| Total | 1,262 (50.0%) | 2,043 (81.0%) |
Disability Status by Sex by Age in Holly Lake Ranch
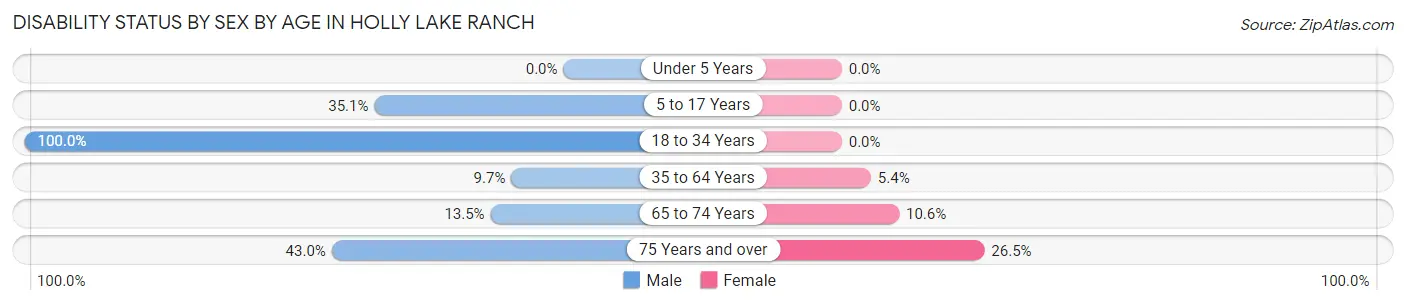
| Age Bracket | Male | Female |
| Under 5 Years | 0 (0.0%) | 0 (0.0%) |
| 5 to 17 Years | 40 (35.1%) | 0 (0.0%) |
| 18 to 34 Years | 26 (100.0%) | 0 (0.0%) |
| 35 to 64 Years | 32 (9.7%) | 27 (5.4%) |
| 65 to 74 Years | 36 (13.5%) | 32 (10.6%) |
| 75 Years and over | 123 (43.0%) | 81 (26.5%) |
Disability Class by Sex by Age in Holly Lake Ranch
Disability Class: Hearing Difficulty
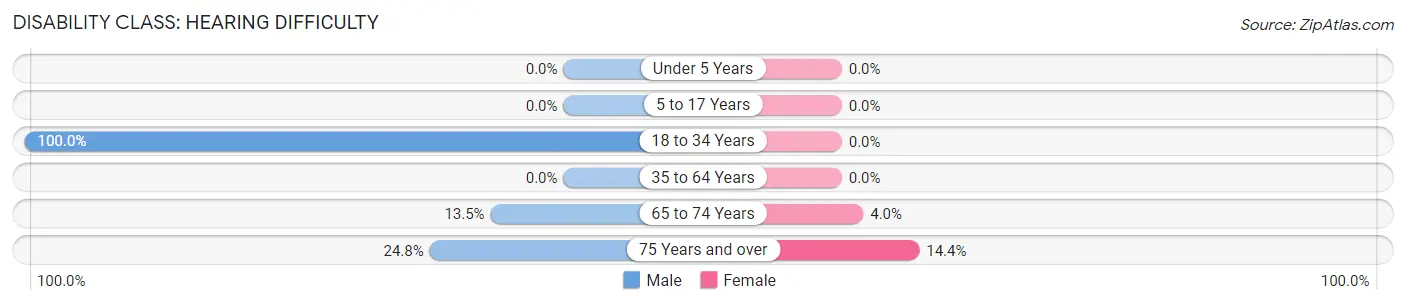
| Age Bracket | Male | Female |
| Under 5 Years | 0 (0.0%) | 0 (0.0%) |
| 5 to 17 Years | 0 (0.0%) | 0 (0.0%) |
| 18 to 34 Years | 26 (100.0%) | 0 (0.0%) |
| 35 to 64 Years | 0 (0.0%) | 0 (0.0%) |
| 65 to 74 Years | 36 (13.5%) | 12 (4.0%) |
| 75 Years and over | 71 (24.8%) | 44 (14.4%) |
Disability Class: Vision Difficulty
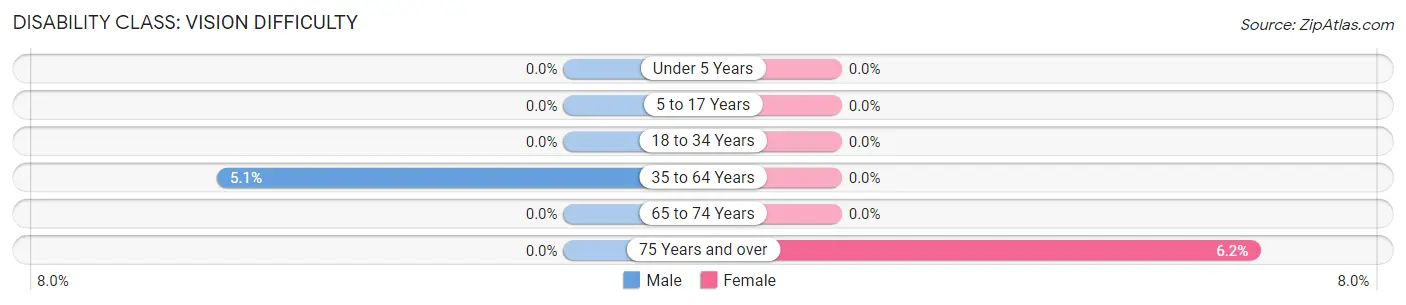
| Age Bracket | Male | Female |
| Under 5 Years | 0 (0.0%) | 0 (0.0%) |
| 5 to 17 Years | 0 (0.0%) | 0 (0.0%) |
| 18 to 34 Years | 0 (0.0%) | 0 (0.0%) |
| 35 to 64 Years | 17 (5.1%) | 0 (0.0%) |
| 65 to 74 Years | 0 (0.0%) | 0 (0.0%) |
| 75 Years and over | 0 (0.0%) | 19 (6.2%) |
Disability Class: Cognitive Difficulty
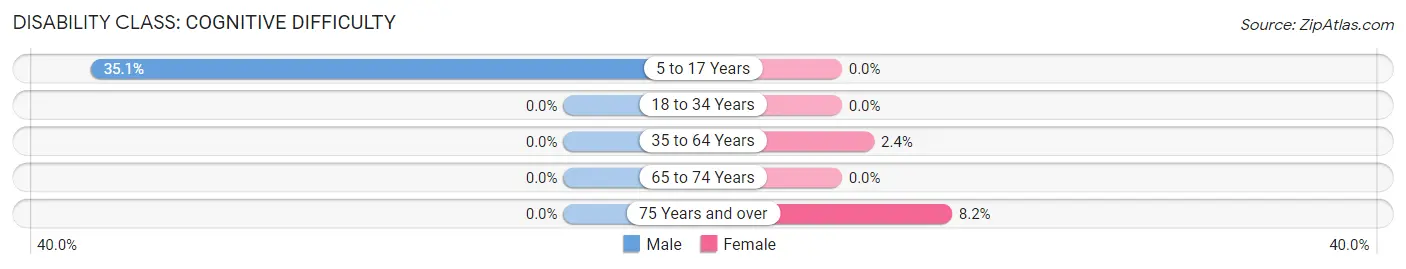
| Age Bracket | Male | Female |
| 5 to 17 Years | 40 (35.1%) | 0 (0.0%) |
| 18 to 34 Years | 0 (0.0%) | 0 (0.0%) |
| 35 to 64 Years | 0 (0.0%) | 12 (2.4%) |
| 65 to 74 Years | 0 (0.0%) | 0 (0.0%) |
| 75 Years and over | 0 (0.0%) | 25 (8.2%) |
Disability Class: Ambulatory Difficulty
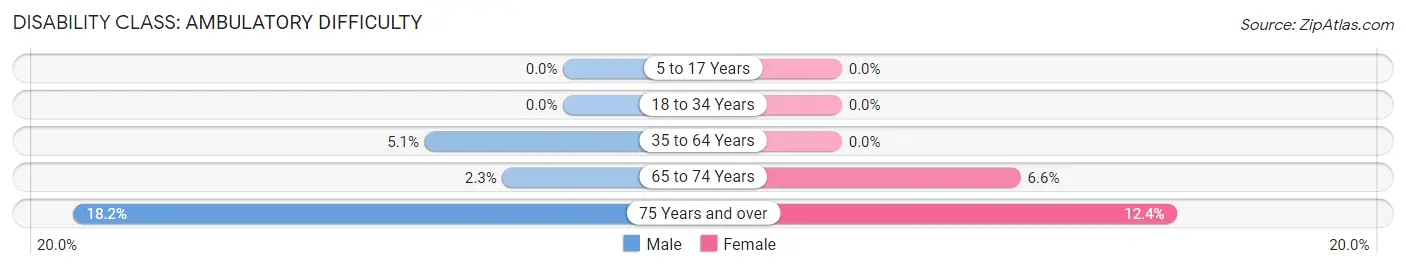
| Age Bracket | Male | Female |
| 5 to 17 Years | 0 (0.0%) | 0 (0.0%) |
| 18 to 34 Years | 0 (0.0%) | 0 (0.0%) |
| 35 to 64 Years | 17 (5.1%) | 0 (0.0%) |
| 65 to 74 Years | 6 (2.3%) | 20 (6.6%) |
| 75 Years and over | 52 (18.2%) | 38 (12.4%) |
Disability Class: Self-Care Difficulty
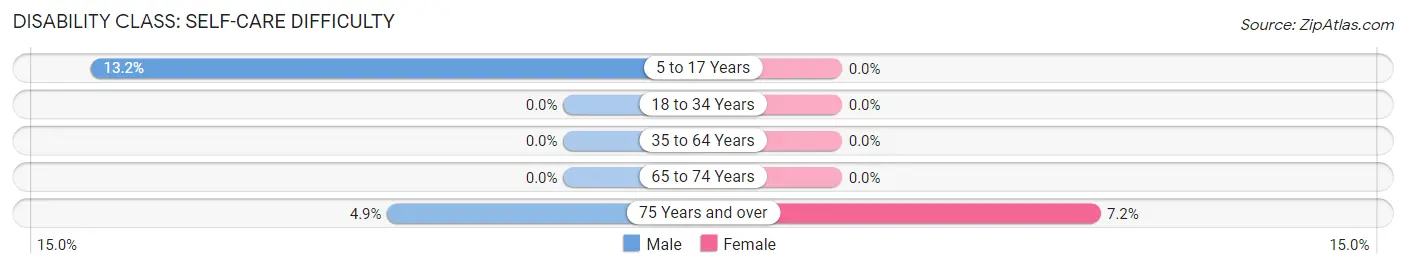
| Age Bracket | Male | Female |
| 5 to 17 Years | 15 (13.2%) | 0 (0.0%) |
| 18 to 34 Years | 0 (0.0%) | 0 (0.0%) |
| 35 to 64 Years | 0 (0.0%) | 0 (0.0%) |
| 65 to 74 Years | 0 (0.0%) | 0 (0.0%) |
| 75 Years and over | 14 (4.9%) | 22 (7.2%) |
Technology Access in Holly Lake Ranch
Computing Device Access in Holly Lake Ranch
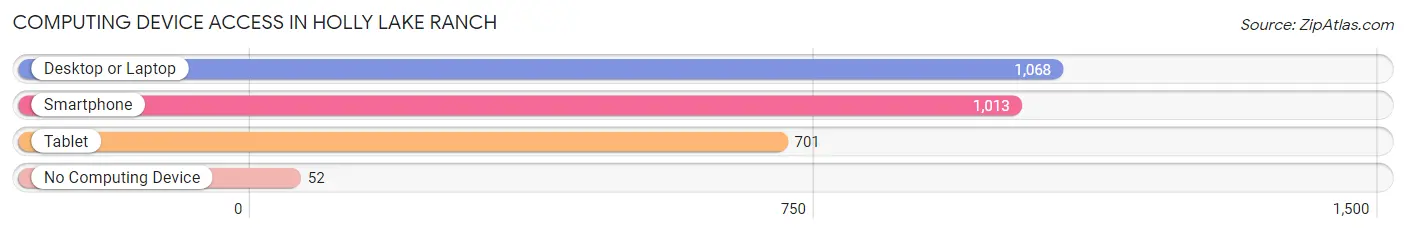
| Device Type | # Households | % Households |
| Desktop or Laptop | 1,068 | 90.5% |
| Smartphone | 1,013 | 85.9% |
| Tablet | 701 | 59.4% |
| No Computing Device | 52 | 4.4% |
| Total | 1,180 | 100.0% |
Internet Access in Holly Lake Ranch
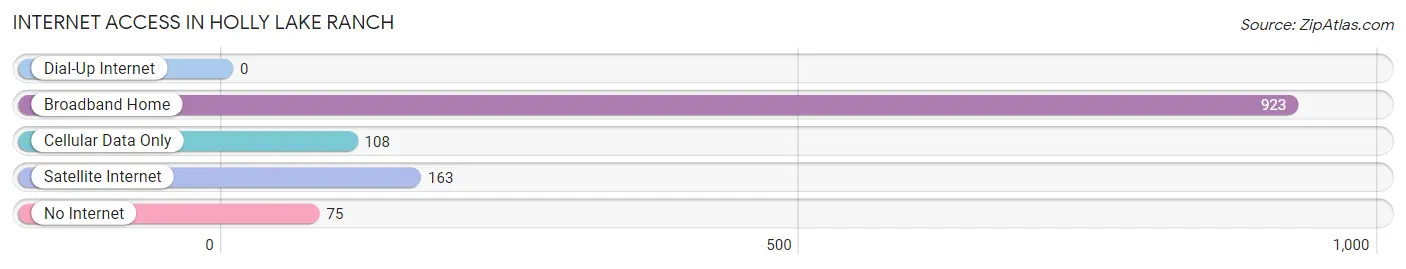
| Internet Type | # Households | % Households |
| Dial-Up Internet | 0 | 0.0% |
| Broadband Home | 923 | 78.2% |
| Cellular Data Only | 108 | 9.1% |
| Satellite Internet | 163 | 13.8% |
| No Internet | 75 | 6.4% |
| Total | 1,180 | 100.0% |
Holly Lake Ranch Summary
Holly Lake Ranch is a census-designated place (CDP) located in Wood County, Texas, United States. It is situated in the Piney Woods region of East Texas, approximately 100 miles east of Dallas. The population was 1,717 at the 2010 census.
History
Holly Lake Ranch was founded in the late 1950s by a group of investors from Dallas. The investors purchased a large tract of land in the Piney Woods of East Texas and developed it into a residential community. The community was named after the nearby Holly Lake, which was named after the holly trees that grew along its banks.
The community was initially developed as a retirement community, and it quickly became popular with retirees from the Dallas area. The community was designed to provide a peaceful and tranquil atmosphere for its residents, and it was also designed to be self-sufficient. The community was equipped with its own water and sewage systems, as well as a post office, grocery store, and other amenities.
In the late 1960s, the community began to attract younger families, and the population began to grow. The community was incorporated in 1972, and it has continued to grow since then.
Geography
Holly Lake Ranch is located at 32 45 25 North 95 17 17 West 32 756944 95 288333
According to the United States Census Bureau, the CDP has a total area of 4.2 square miles (10.8 km2), all of it land.
Economy
Holly Lake Ranch is primarily a residential community, and the majority of its residents are retirees. The community does have a few small businesses, including a grocery store, a post office, and a few restaurants.
Demographics
As of the census of 2000, there were 1,717 people, 745 households, and 545 families residing in the CDP. The population density was 409.2 people per square mile (158.1/km2). There were 845 housing units at an average density of 201.3/sq mi (77.6/km2). The racial makeup of the CDP was 97.45% White, 0.35% African American, 0.35% Native American, 0.12% Asian, 0.12% Pacific Islander, 0.94% from other races, and 0.67% from two or more races. Hispanic or Latino of any race were 2.02% of the population.
There were 745 households, out of which 19.2% had children under the age of 18 living with them, 63.2% were married couples living together, 6.2% had a female householder with no husband present, and 28.3% were non-families. 24.3% of all households were made up of individuals, and 11.2% had someone living alone who was 65 years of age or older. The average household size was 2.30 and the average family size was 2.71.
In the CDP, the population was spread out, with 17.2% under the age of 18, 4.2% from 18 to 24, 19.2% from 25 to 44, 33.2% from 45 to 64, and 26.2% who were 65 years of age or older. The median age was 51 years. For every 100 females, there were 97.2 males. For every 100 females age 18 and over, there were 94.2 males.
The median income for a household in the CDP was $41,250, and the median income for a family was $48,750. Males had a median income of $31,250 versus $25,000 for females. The per capita income for the CDP was $22,945. About 4.2% of families and 6.2% of the population were below the poverty line, including 8.2% of those under age 18 and 4.2% of those age 65 or over.
Common Questions
What is the Total Population of Holly Lake Ranch?
Total Population of Holly Lake Ranch is 2,523.
What is the Total Male Population of Holly Lake Ranch?
Total Male Population of Holly Lake Ranch is 1,050.
What is the Total Female Population of Holly Lake Ranch?
Total Female Population of Holly Lake Ranch is 1,473.
What is the Ratio of Males per 100 Females in Holly Lake Ranch?
There are 71.28 Males per 100 Females in Holly Lake Ranch.
What is the Ratio of Females per 100 Males in Holly Lake Ranch?
There are 140.29 Females per 100 Males in Holly Lake Ranch.
What is the Median Population Age in Holly Lake Ranch?
Median Population Age in Holly Lake Ranch is 62.6 Years.
What is the Average Family Size in Holly Lake Ranch
Average Family Size in Holly Lake Ranch is 2.5 People.
What is the Average Household Size in Holly Lake Ranch
Average Household Size in Holly Lake Ranch is 2.1 People.
What is Per Capita Income in Holly Lake Ranch?
Per Capita income in Holly Lake Ranch is $54,787.
What is the Median Family Income in Holly Lake Ranch?
Median Family Income in Holly Lake Ranch is $90,425.
What is the Median Household income in Holly Lake Ranch?
Median Household Income in Holly Lake Ranch is $65,962.
What is Income or Wage Gap in Holly Lake Ranch?
Income or Wage Gap in Holly Lake Ranch is 17.8%.
Women in Holly Lake Ranch earn 82.2 cents for every dollar earned by a man.
What is Inequality or Gini Index in Holly Lake Ranch?
Inequality or Gini Index in Holly Lake Ranch is 0.54.
How Large is the Labor Force in Holly Lake Ranch?
There are 626 People in the Labor Forcein in Holly Lake Ranch.
What is the Percentage of People in the Labor Force in Holly Lake Ranch?
29.1% of People are in the Labor Force in Holly Lake Ranch.
What is the Unemployment Rate in Holly Lake Ranch?
Unemployment Rate in Holly Lake Ranch is 3.4%.