Gunter, TX
Gunter Map
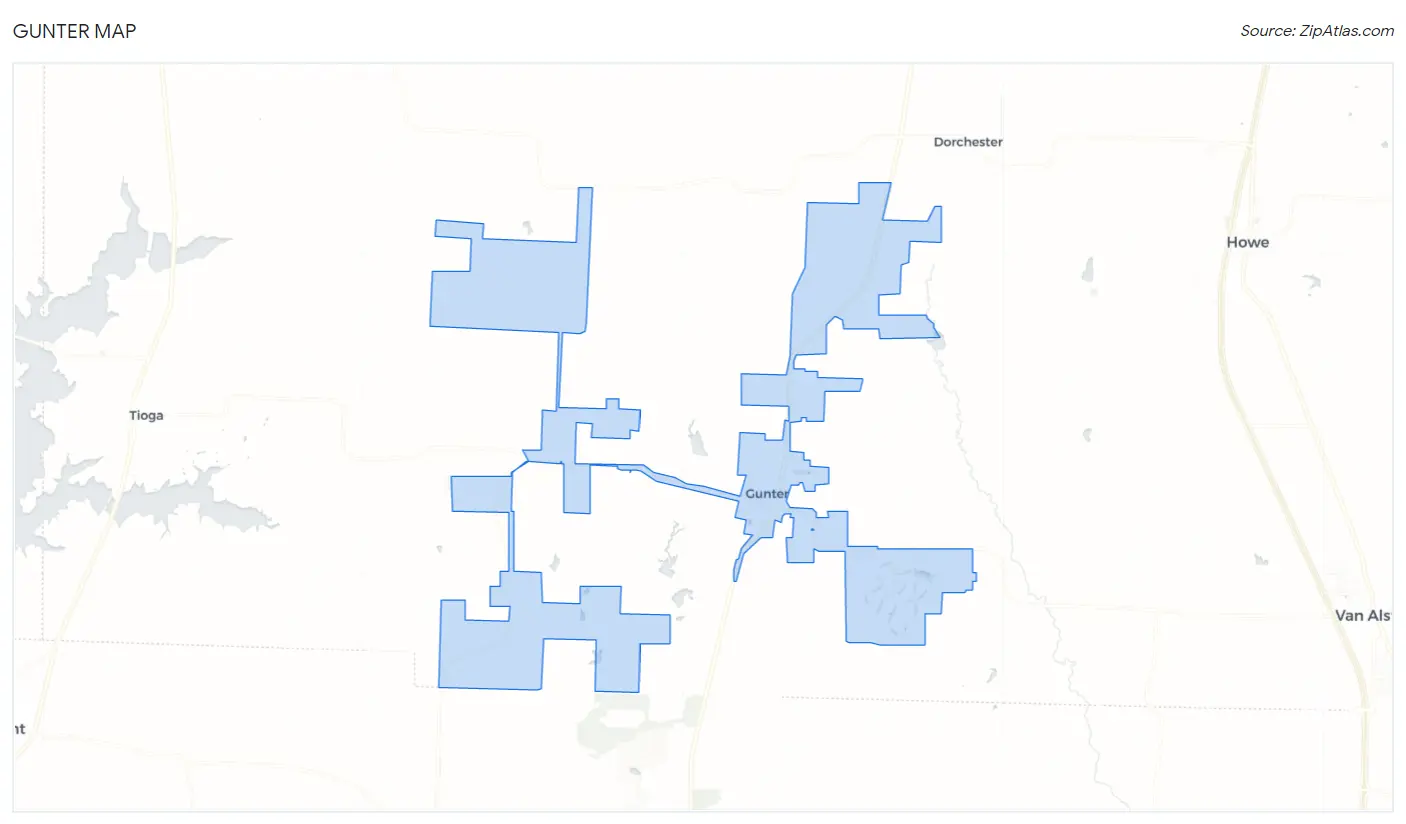
Gunter Overview
2,279
TOTAL POPULATION
1,104
MALE POPULATION
1,175
FEMALE POPULATION
93.96
MALES / 100 FEMALES
106.43
FEMALES / 100 MALES
33.6
MEDIAN AGE
3.8
AVG FAMILY SIZE
3.5
AVG HOUSEHOLD SIZE
$37,947
PER CAPITA INCOME
$116,034
AVG FAMILY INCOME
$106,700
AVG HOUSEHOLD INCOME
46.1%
WAGE / INCOME GAP [ % ]
53.9¢/ $1
WAGE / INCOME GAP [ $ ]
0.41
INEQUALITY / GINI INDEX
1,217
LABOR FORCE [ PEOPLE ]
67.0%
PERCENT IN LABOR FORCE
4.6%
UNEMPLOYMENT RATE
Gunter Zip Codes
Gunter Area Codes
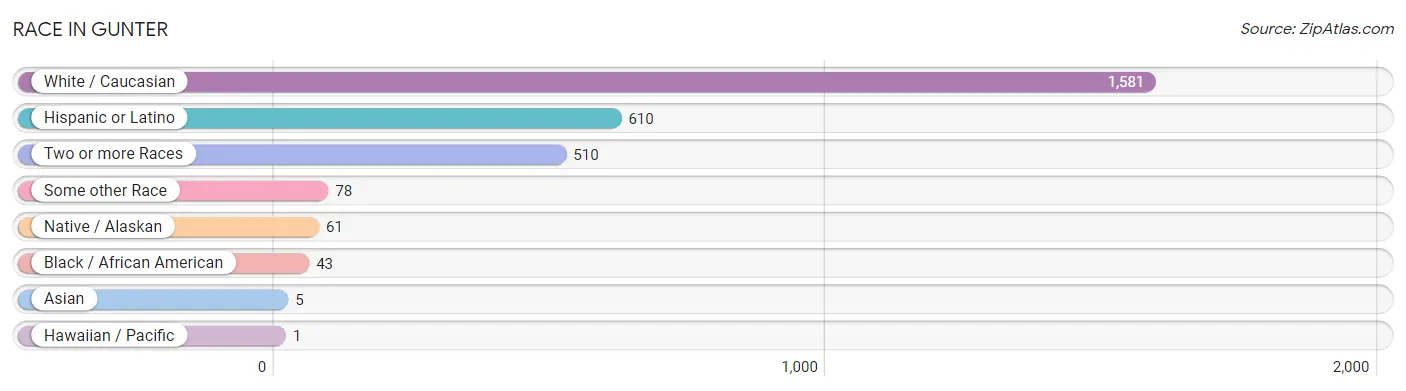
Race in Gunter
The most populous races in Gunter are White / Caucasian (1,581 | 69.4%), Hispanic or Latino (610 | 26.8%), and Two or more Races (510 | 22.4%).
| Race | # Population | % Population |
| Asian | 5 | 0.2% |
| Black / African American | 43 | 1.9% |
| Hawaiian / Pacific | 1 | 0.0% |
| Hispanic or Latino | 610 | 26.8% |
| Native / Alaskan | 61 | 2.7% |
| White / Caucasian | 1,581 | 69.4% |
| Two or more Races | 510 | 22.4% |
| Some other Race | 78 | 3.4% |
| Total | 2,279 | 100.0% |
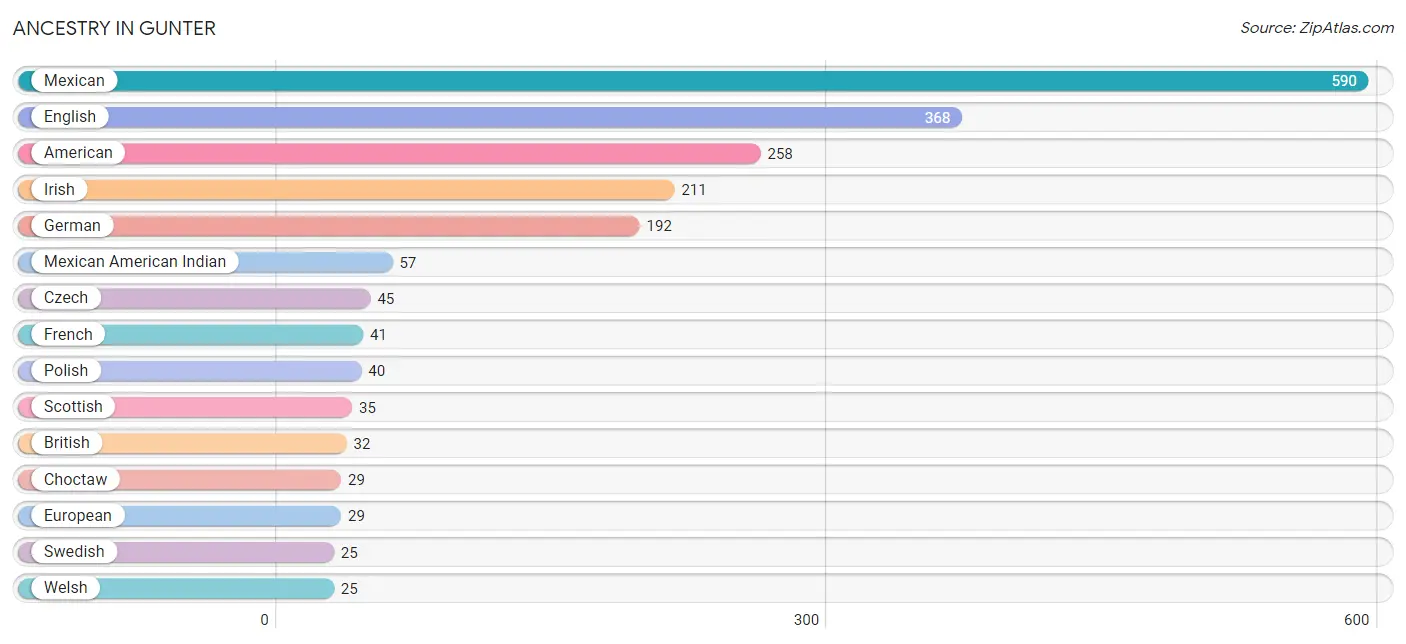
Ancestry in Gunter
The most populous ancestries reported in Gunter are Mexican (590 | 25.9%), English (368 | 16.2%), American (258 | 11.3%), Irish (211 | 9.3%), and German (192 | 8.4%), together accounting for 71.0% of all Gunter residents.
| Ancestry | # Population | % Population |
| American | 258 | 11.3% |
| British | 32 | 1.4% |
| Cambodian | 3 | 0.1% |
| Cherokee | 2 | 0.1% |
| Chippewa | 10 | 0.4% |
| Choctaw | 29 | 1.3% |
| Croatian | 7 | 0.3% |
| Czech | 45 | 2.0% |
| Danish | 3 | 0.1% |
| Dutch | 18 | 0.8% |
| Dutch West Indian | 1 | 0.0% |
| Eastern European | 9 | 0.4% |
| English | 368 | 16.2% |
| European | 29 | 1.3% |
| French | 41 | 1.8% |
| German | 192 | 8.4% |
| Greek | 3 | 0.1% |
| Indian (Asian) | 8 | 0.4% |
| Irish | 211 | 9.3% |
| Italian | 22 | 1.0% |
| Mexican | 590 | 25.9% |
| Mexican American Indian | 57 | 2.5% |
| Northern European | 7 | 0.3% |
| Norwegian | 20 | 0.9% |
| Pakistani | 2 | 0.1% |
| Polish | 40 | 1.8% |
| Portuguese | 9 | 0.4% |
| Scotch-Irish | 15 | 0.7% |
| Scottish | 35 | 1.5% |
| Swedish | 25 | 1.1% |
| Welsh | 25 | 1.1% | View All 31 Rows |
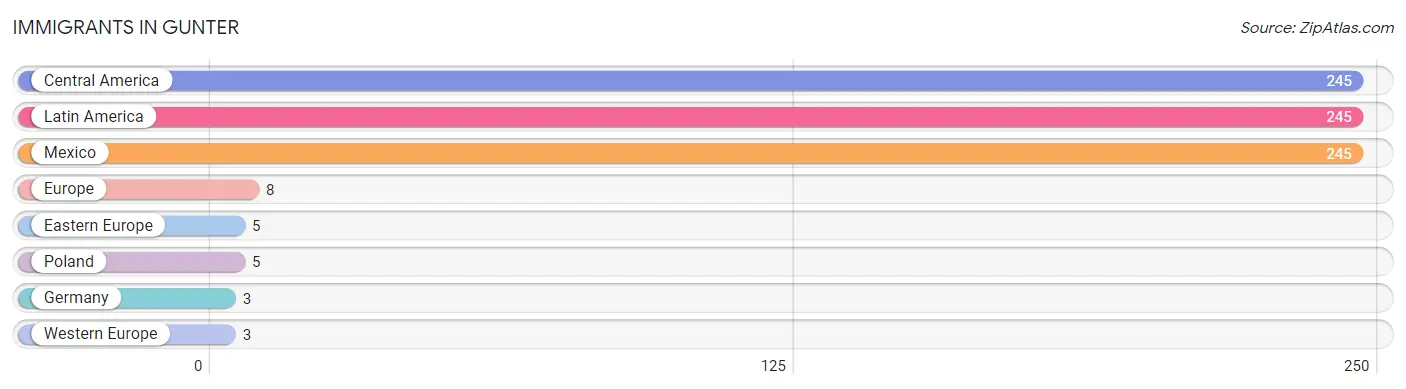
Immigrants in Gunter
The most numerous immigrant groups reported in Gunter came from Central America (245 | 10.7%), Latin America (245 | 10.7%), Mexico (245 | 10.7%), Europe (8 | 0.4%), and Eastern Europe (5 | 0.2%), together accounting for 32.8% of all Gunter residents.
| Immigration Origin | # Population | % Population |
| Central America | 245 | 10.7% |
| Eastern Europe | 5 | 0.2% |
| Europe | 8 | 0.4% |
| Germany | 3 | 0.1% |
| Latin America | 245 | 10.7% |
| Mexico | 245 | 10.7% |
| Poland | 5 | 0.2% |
| Western Europe | 3 | 0.1% | View All 8 Rows |
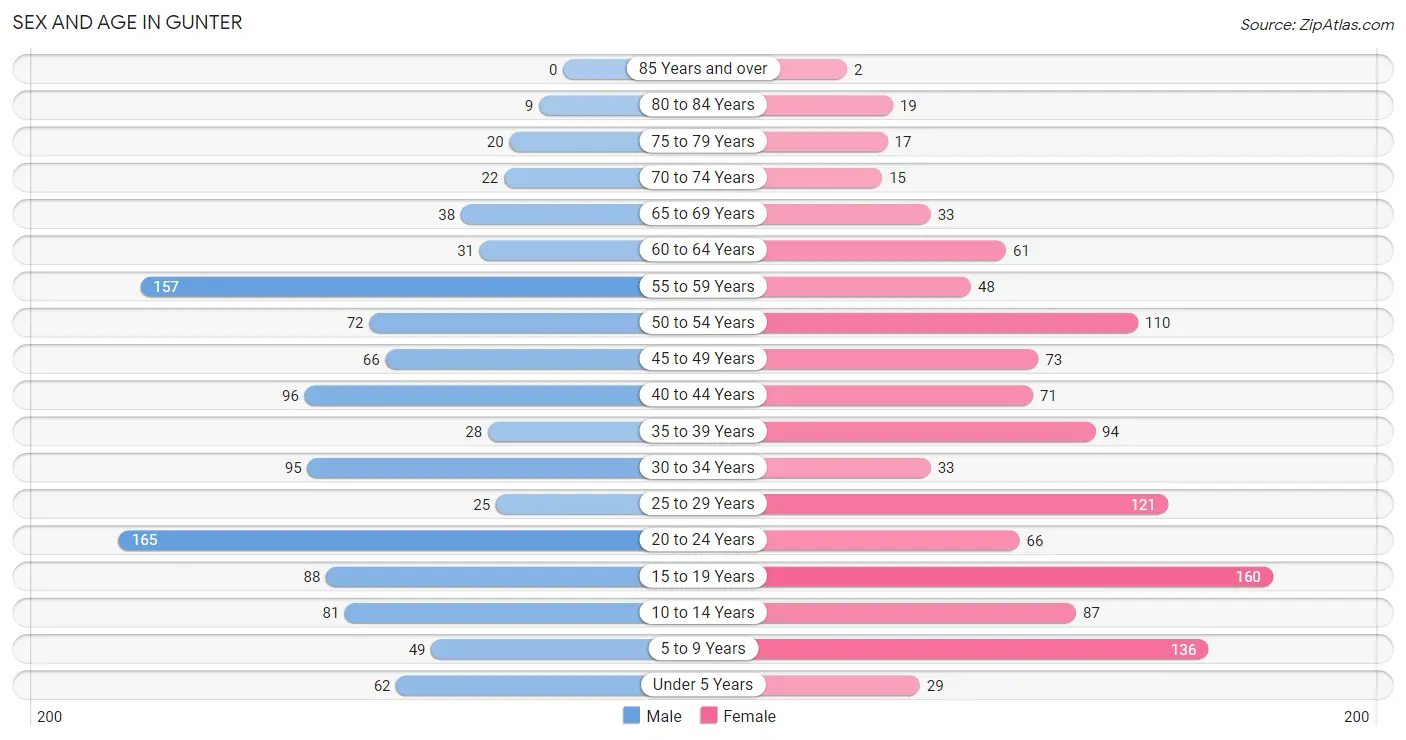
Sex and Age in Gunter
Sex and Age in Gunter
The most populous age groups in Gunter are 20 to 24 Years (165 | 14.9%) for men and 15 to 19 Years (160 | 13.6%) for women.
| Age Bracket | Male | Female |
| Under 5 Years | 62 (5.6%) | 29 (2.5%) |
| 5 to 9 Years | 49 (4.4%) | 136 (11.6%) |
| 10 to 14 Years | 81 (7.3%) | 87 (7.4%) |
| 15 to 19 Years | 88 (8.0%) | 160 (13.6%) |
| 20 to 24 Years | 165 (14.9%) | 66 (5.6%) |
| 25 to 29 Years | 25 (2.3%) | 121 (10.3%) |
| 30 to 34 Years | 95 (8.6%) | 33 (2.8%) |
| 35 to 39 Years | 28 (2.5%) | 94 (8.0%) |
| 40 to 44 Years | 96 (8.7%) | 71 (6.0%) |
| 45 to 49 Years | 66 (6.0%) | 73 (6.2%) |
| 50 to 54 Years | 72 (6.5%) | 110 (9.4%) |
| 55 to 59 Years | 157 (14.2%) | 48 (4.1%) |
| 60 to 64 Years | 31 (2.8%) | 61 (5.2%) |
| 65 to 69 Years | 38 (3.4%) | 33 (2.8%) |
| 70 to 74 Years | 22 (2.0%) | 15 (1.3%) |
| 75 to 79 Years | 20 (1.8%) | 17 (1.5%) |
| 80 to 84 Years | 9 (0.8%) | 19 (1.6%) |
| 85 Years and over | 0 (0.0%) | 2 (0.2%) |
| Total | 1,104 (100.0%) | 1,175 (100.0%) |
Families and Households in Gunter
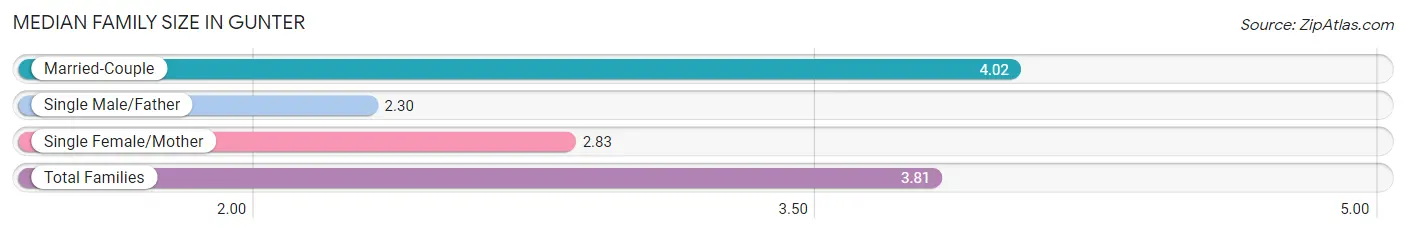
Median Family Size in Gunter
The median family size in Gunter is 3.81 persons per family, with married-couple families (469 | 84.1%) accounting for the largest median family size of 4.02 persons per family. On the other hand, single male/father families (20 | 3.6%) represent the smallest median family size with 2.30 persons per family.
| Family Type | # Families | Family Size |
| Married-Couple | 469 (84.1%) | 4.02 |
| Single Male/Father | 20 (3.6%) | 2.30 |
| Single Female/Mother | 69 (12.4%) | 2.83 |
| Total Families | 558 (100.0%) | 3.81 |
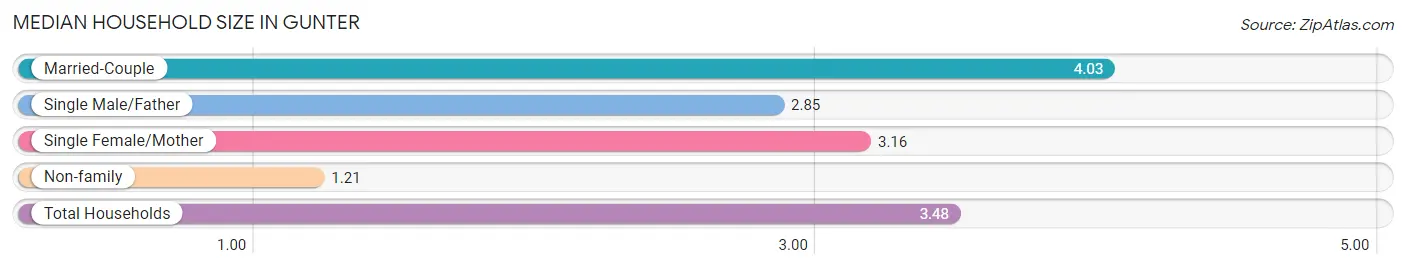
Median Household Size in Gunter
The median household size in Gunter is 3.48 persons per household, with married-couple households (469 | 71.7%) accounting for the largest median household size of 4.03 persons per household. non-family households (96 | 14.7%) represent the smallest median household size with 1.21 persons per household.
| Household Type | # Households | Household Size |
| Married-Couple | 469 (71.7%) | 4.03 |
| Single Male/Father | 20 (3.1%) | 2.85 |
| Single Female/Mother | 69 (10.5%) | 3.16 |
| Non-family | 96 (14.7%) | 1.21 |
| Total Households | 654 (100.0%) | 3.48 |
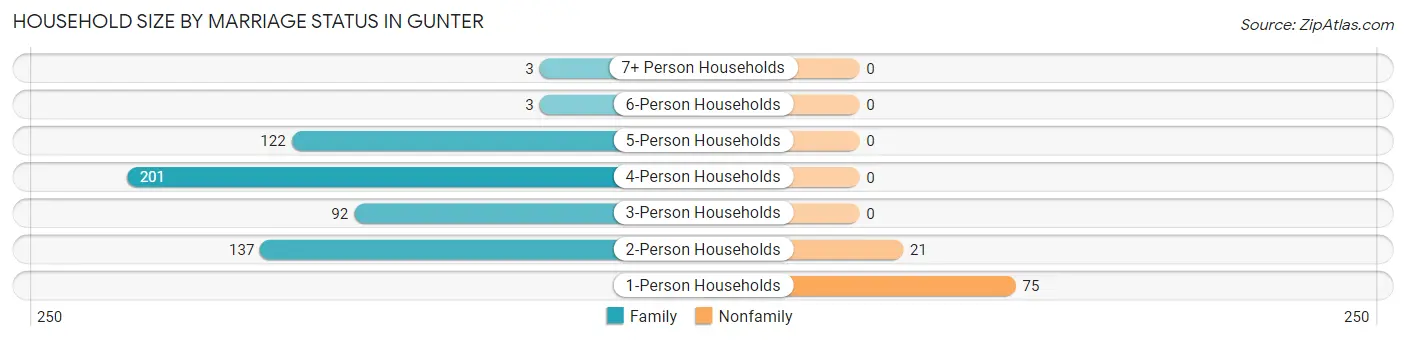
Household Size by Marriage Status in Gunter
Out of a total of 654 households in Gunter, 558 (85.3%) are family households, while 96 (14.7%) are nonfamily households. The most numerous type of family households are 4-person households, comprising 201, and the most common type of nonfamily households are 1-person households, comprising 75.
| Household Size | Family Households | Nonfamily Households |
| 1-Person Households | - | 75 (11.5%) |
| 2-Person Households | 137 (20.9%) | 21 (3.2%) |
| 3-Person Households | 92 (14.1%) | 0 (0.0%) |
| 4-Person Households | 201 (30.7%) | 0 (0.0%) |
| 5-Person Households | 122 (18.6%) | 0 (0.0%) |
| 6-Person Households | 3 (0.5%) | 0 (0.0%) |
| 7+ Person Households | 3 (0.5%) | 0 (0.0%) |
| Total | 558 (85.3%) | 96 (14.7%) |
Female Fertility in Gunter
Fertility by Age in Gunter
Average fertility rate in Gunter is 14.0 births per 1,000 women. Women in the age bracket of 35 to 50 years have the highest fertility rate with 24.0 births per 1,000 women. Women in the age bracket of 35 to 50 years acount for 66.7% of all women with births.
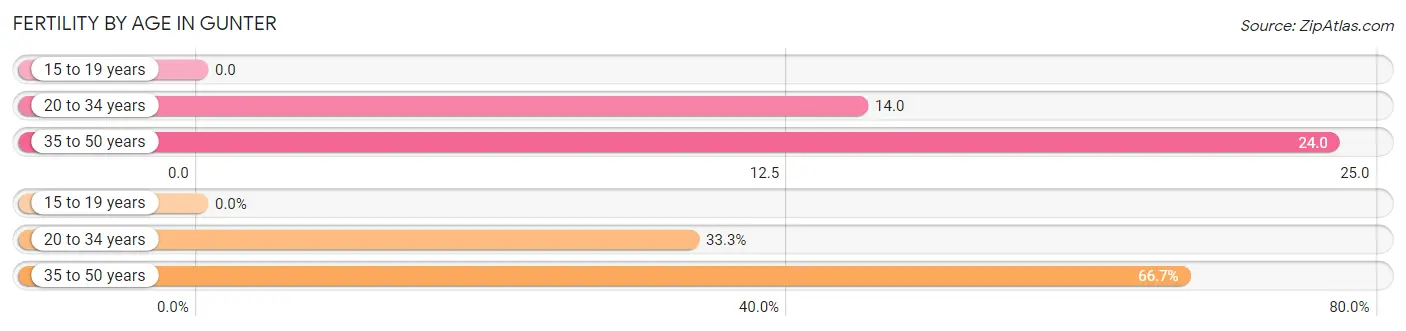
| Age Bracket | Women with Births | Births / 1,000 Women |
| 15 to 19 years | 0 (0.0%) | 0.0 |
| 20 to 34 years | 3 (33.3%) | 14.0 |
| 35 to 50 years | 6 (66.7%) | 24.0 |
| Total | 9 (100.0%) | 14.0 |
Fertility by Age by Marriage Status in Gunter
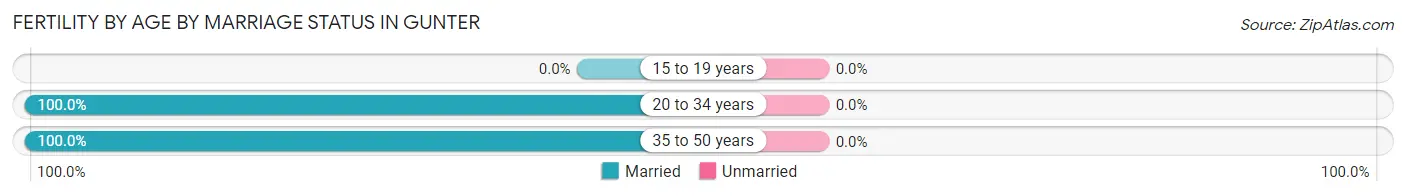
| Age Bracket | Married | Unmarried |
| 15 to 19 years | 0 (0.0%) | 0 (0.0%) |
| 20 to 34 years | 3 (100.0%) | 0 (0.0%) |
| 35 to 50 years | 6 (100.0%) | 0 (0.0%) |
| Total | 9 (100.0%) | 0 (0.0%) |
Fertility by Education in Gunter
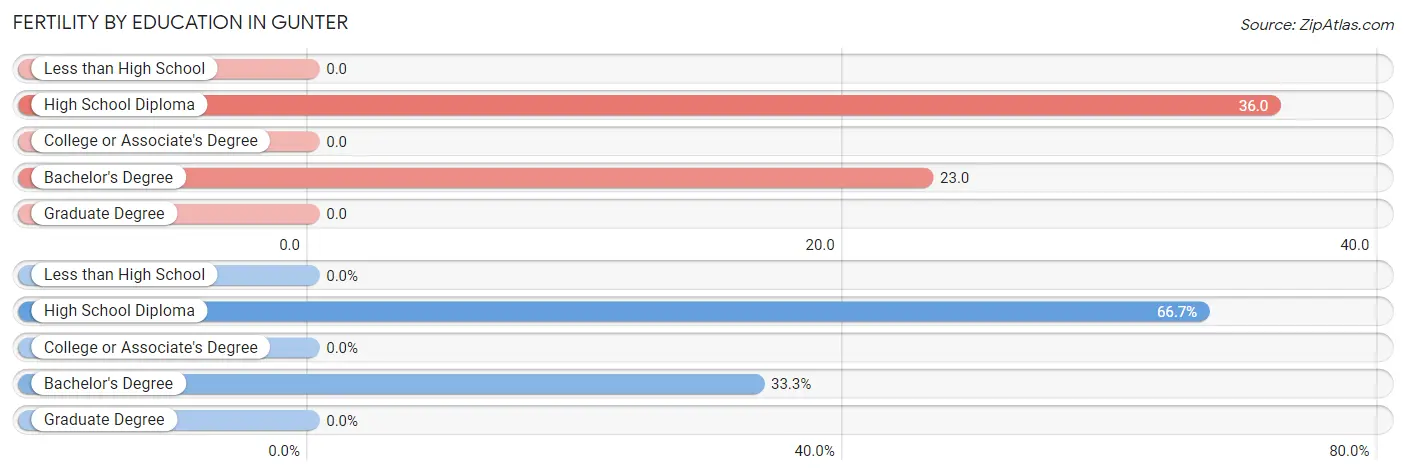
| Educational Attainment | Women with Births | Births / 1,000 Women |
| Less than High School | 0 (0.0%) | 0.0 |
| High School Diploma | 6 (66.7%) | 36.0 |
| College or Associate's Degree | 0 (0.0%) | 0.0 |
| Bachelor's Degree | 3 (33.3%) | 23.0 |
| Graduate Degree | 0 (0.0%) | 0.0 |
| Total | 9 (100.0%) | 14.0 |
Fertility by Education by Marriage Status in Gunter
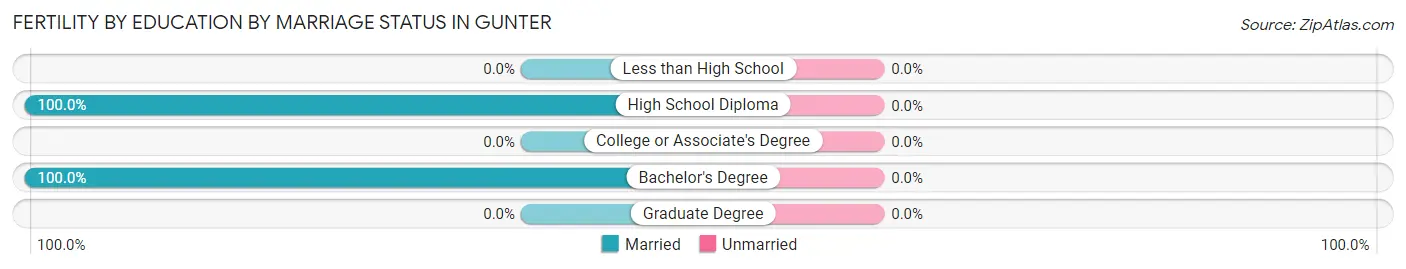
| Educational Attainment | Married | Unmarried |
| Less than High School | 0 (0.0%) | 0 (0.0%) |
| High School Diploma | 6 (100.0%) | 0 (0.0%) |
| College or Associate's Degree | 0 (0.0%) | 0 (0.0%) |
| Bachelor's Degree | 3 (100.0%) | 0 (0.0%) |
| Graduate Degree | 0 (0.0%) | 0 (0.0%) |
| Total | 9 (100.0%) | 0 (0.0%) |
Income in Gunter
Income Overview in Gunter
Per Capita Income in Gunter is $37,947, while median incomes of families and households are $116,034 and $106,700 respectively.
| Characteristic | Number | Measure |
| Per Capita Income | 2,279 | $37,947 |
| Median Family Income | 558 | $116,034 |
| Mean Family Income | 558 | $142,195 |
| Median Household Income | 654 | $106,700 |
| Mean Household Income | 654 | $132,860 |
| Income Deficit | 558 | $0 |
| Wage / Income Gap (%) | 2,279 | 46.07% |
| Wage / Income Gap ($) | 2,279 | 53.93¢ per $1 |
| Gini / Inequality Index | 2,279 | 0.41 |
Earnings by Sex in Gunter
Average Earnings in Gunter are $32,899, $41,000 for men and $22,113 for women, a difference of 46.1%.
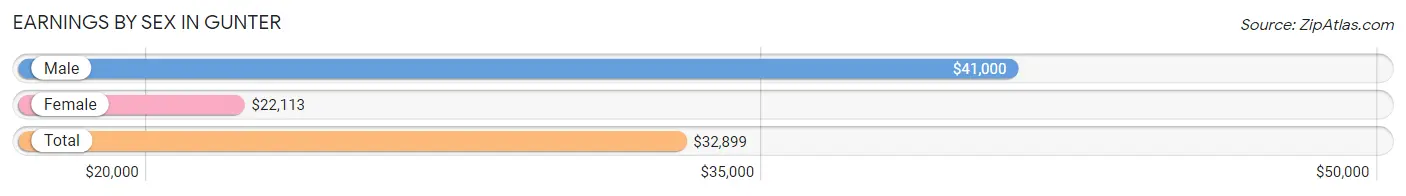
| Sex | Number | Average Earnings |
| Male | 740 (58.8%) | $41,000 |
| Female | 518 (41.2%) | $22,113 |
| Total | 1,258 (100.0%) | $32,899 |
Earnings by Sex by Income Bracket in Gunter
The most common earnings brackets in Gunter are $100,000+ for men (156 | 21.1%) and $20,000 to $22,499 for women (97 | 18.7%).
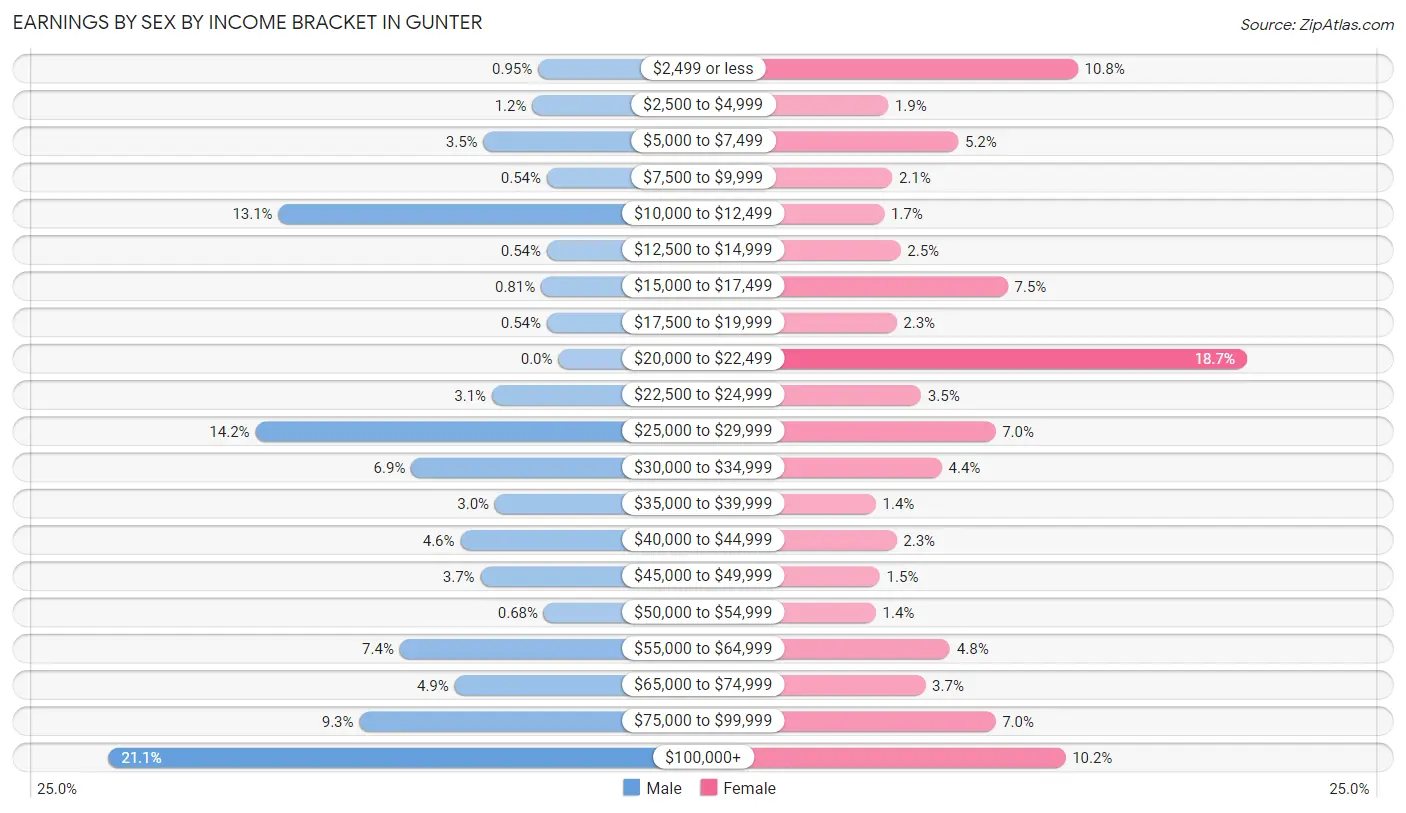
| Income | Male | Female |
| $2,499 or less | 7 (0.9%) | 56 (10.8%) |
| $2,500 to $4,999 | 9 (1.2%) | 10 (1.9%) |
| $5,000 to $7,499 | 26 (3.5%) | 27 (5.2%) |
| $7,500 to $9,999 | 4 (0.5%) | 11 (2.1%) |
| $10,000 to $12,499 | 97 (13.1%) | 9 (1.7%) |
| $12,500 to $14,999 | 4 (0.5%) | 13 (2.5%) |
| $15,000 to $17,499 | 6 (0.8%) | 39 (7.5%) |
| $17,500 to $19,999 | 4 (0.5%) | 12 (2.3%) |
| $20,000 to $22,499 | 0 (0.0%) | 97 (18.7%) |
| $22,500 to $24,999 | 23 (3.1%) | 18 (3.5%) |
| $25,000 to $29,999 | 105 (14.2%) | 36 (7.0%) |
| $30,000 to $34,999 | 51 (6.9%) | 23 (4.4%) |
| $35,000 to $39,999 | 22 (3.0%) | 7 (1.3%) |
| $40,000 to $44,999 | 34 (4.6%) | 12 (2.3%) |
| $45,000 to $49,999 | 27 (3.6%) | 8 (1.5%) |
| $50,000 to $54,999 | 5 (0.7%) | 7 (1.3%) |
| $55,000 to $64,999 | 55 (7.4%) | 25 (4.8%) |
| $65,000 to $74,999 | 36 (4.9%) | 19 (3.7%) |
| $75,000 to $99,999 | 69 (9.3%) | 36 (7.0%) |
| $100,000+ | 156 (21.1%) | 53 (10.2%) |
| Total | 740 (100.0%) | 518 (100.0%) |
Earnings by Sex by Educational Attainment in Gunter
Average earnings in Gunter are $57,063 for men and $24,615 for women, a difference of 56.9%. Men with an educational attainment of bachelor's degree enjoy the highest average annual earnings of $110,909, while those with less than high school education earn the least with $11,540. Women with an educational attainment of graduate degree earn the most with the average annual earnings of $70,000, while those with less than high school education have the smallest earnings of $20,978.
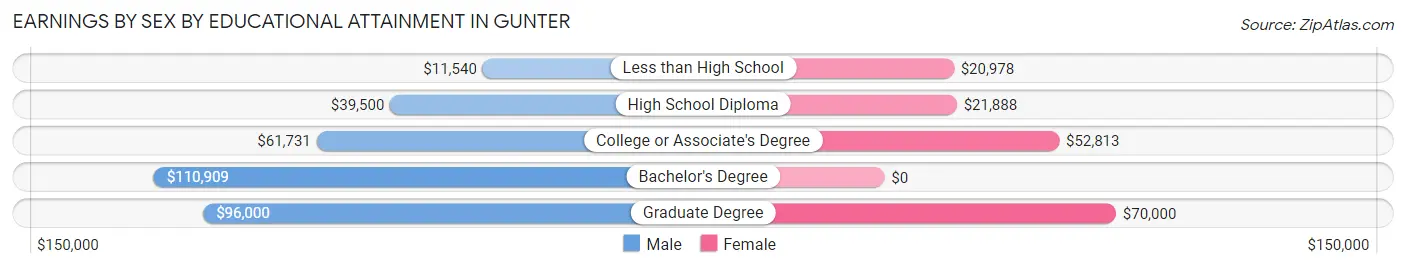
| Educational Attainment | Male Income | Female Income |
| Less than High School | $11,540 | $20,978 |
| High School Diploma | $39,500 | $21,888 |
| College or Associate's Degree | $61,731 | $52,813 |
| Bachelor's Degree | $110,909 | $0 |
| Graduate Degree | $96,000 | $70,000 |
| Total | $57,063 | $24,615 |
Family Income in Gunter
Family Income Brackets in Gunter
According to the Gunter family income data, there are 139 families falling into the $100,000 to $149,999 income range, which is the most common income bracket and makes up 24.9% of all families. Conversely, the $25,000 to $34,999 income bracket is the least frequent group with only 3 families (0.5%) belonging to this category.
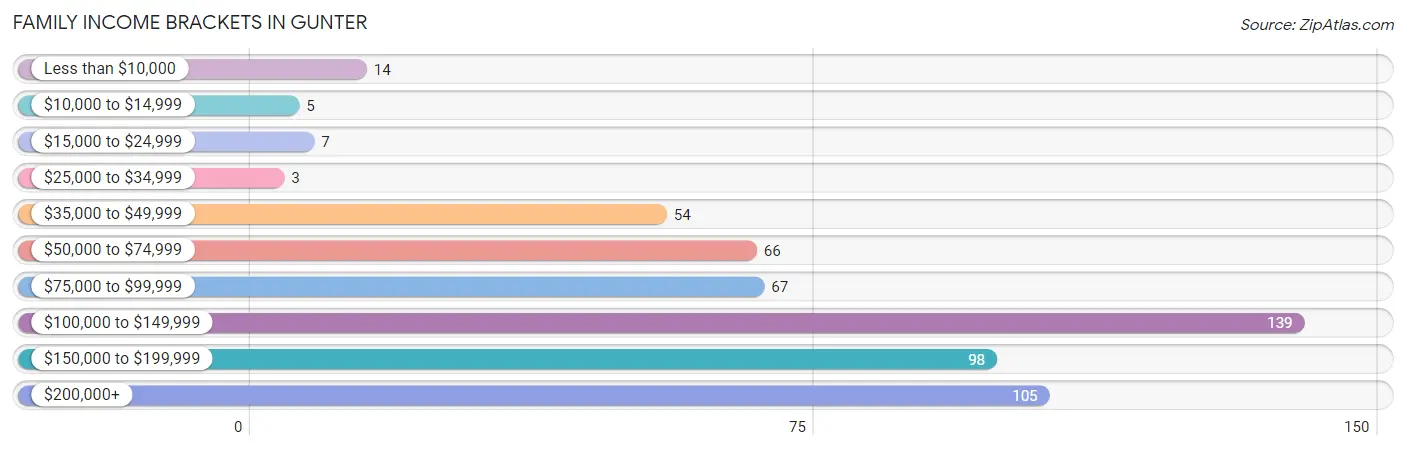
| Income Bracket | # Families | % Families |
| Less than $10,000 | 14 | 2.5% |
| $10,000 to $14,999 | 5 | 0.9% |
| $15,000 to $24,999 | 7 | 1.3% |
| $25,000 to $34,999 | 3 | 0.5% |
| $35,000 to $49,999 | 54 | 9.7% |
| $50,000 to $74,999 | 66 | 11.8% |
| $75,000 to $99,999 | 67 | 12.0% |
| $100,000 to $149,999 | 139 | 24.9% |
| $150,000 to $199,999 | 98 | 17.6% |
| $200,000+ | 105 | 18.8% |
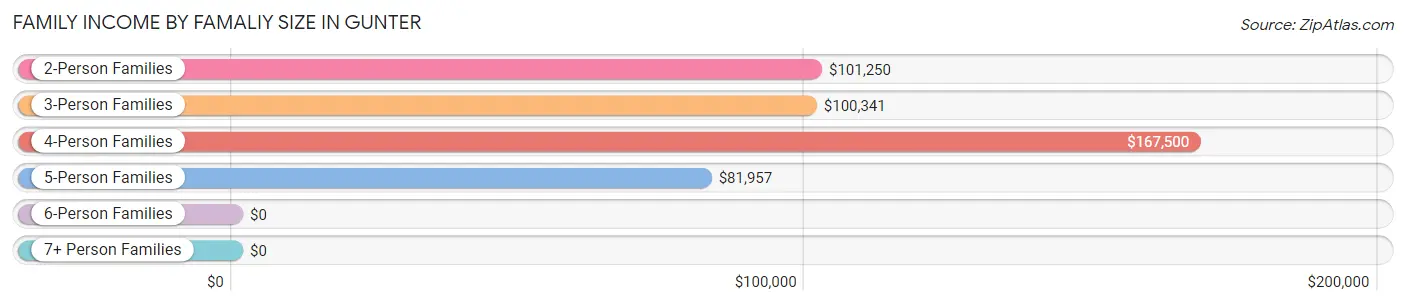
Family Income by Famaliy Size in Gunter
4-person families (194 | 34.8%) account for the highest median family income in Gunter with $167,500 per family, while 2-person families (147 | 26.3%) have the highest median income of $50,625 per family member.
| Income Bracket | # Families | Median Income |
| 2-Person Families | 147 (26.3%) | $101,250 |
| 3-Person Families | 97 (17.4%) | $100,341 |
| 4-Person Families | 194 (34.8%) | $167,500 |
| 5-Person Families | 114 (20.4%) | $81,957 |
| 6-Person Families | 3 (0.5%) | $0 |
| 7+ Person Families | 3 (0.5%) | $0 |
| Total | 558 (100.0%) | $116,034 |
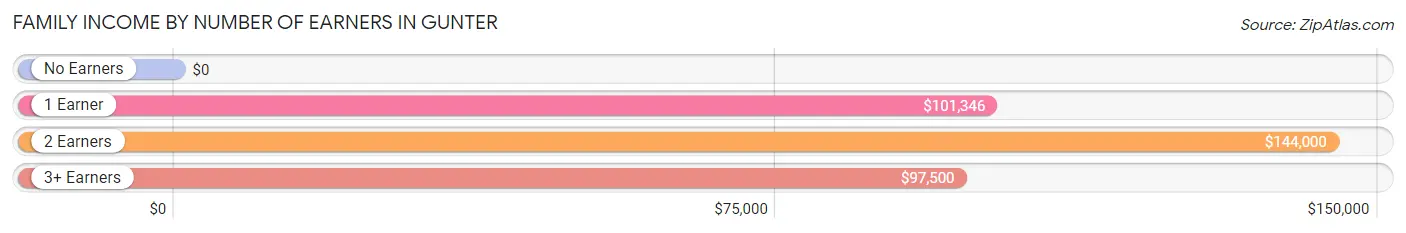
Family Income by Number of Earners in Gunter
| Number of Earners | # Families | Median Income |
| No Earners | 20 (3.6%) | $0 |
| 1 Earner | 208 (37.3%) | $101,346 |
| 2 Earners | 196 (35.1%) | $144,000 |
| 3+ Earners | 134 (24.0%) | $97,500 |
| Total | 558 (100.0%) | $116,034 |
Household Income in Gunter
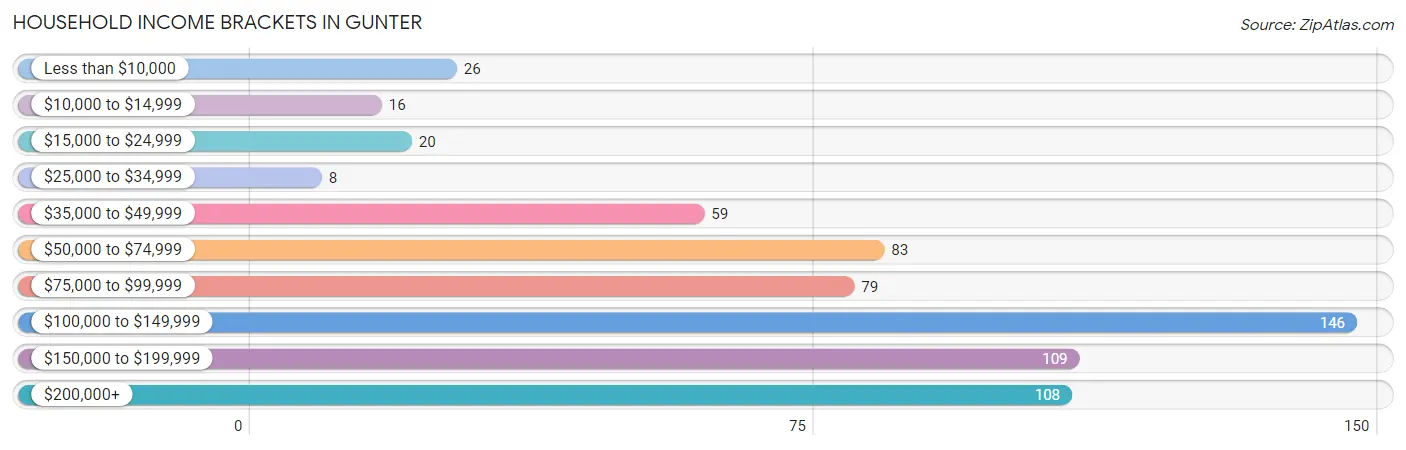
Household Income Brackets in Gunter
With 146 households falling in the category, the $100,000 to $149,999 income range is the most frequent in Gunter, accounting for 22.3% of all households. In contrast, only 8 households (1.2%) fall into the $25,000 to $34,999 income bracket, making it the least populous group.
| Income Bracket | # Households | % Households |
| Less than $10,000 | 26 | 4.0% |
| $10,000 to $14,999 | 16 | 2.4% |
| $15,000 to $24,999 | 20 | 3.1% |
| $25,000 to $34,999 | 8 | 1.2% |
| $35,000 to $49,999 | 59 | 9.0% |
| $50,000 to $74,999 | 83 | 12.7% |
| $75,000 to $99,999 | 79 | 12.1% |
| $100,000 to $149,999 | 146 | 22.3% |
| $150,000 to $199,999 | 109 | 16.7% |
| $200,000+ | 108 | 16.5% |
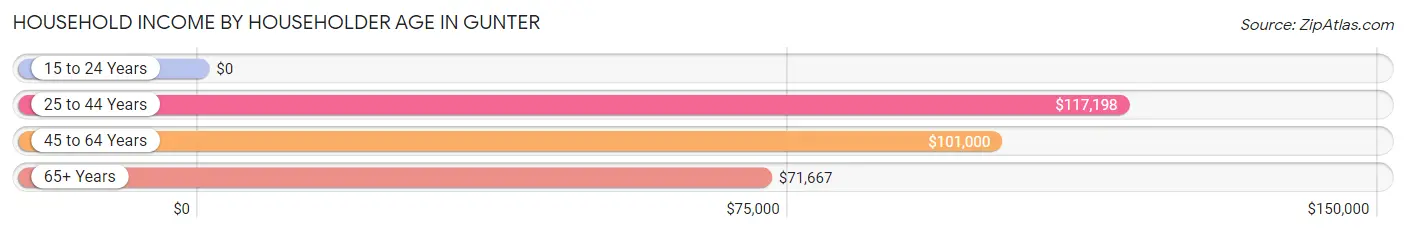
Household Income by Householder Age in Gunter
The median household income in Gunter is $106,700, with the highest median household income of $117,198 found in the 25 to 44 years age bracket for the primary householder. A total of 225 households (34.4%) fall into this category. Meanwhile, the 15 to 24 years age bracket for the primary householder has the lowest median household income of $0, with 7 households (1.1%) in this group.
| Income Bracket | # Households | Median Income |
| 15 to 24 Years | 7 (1.1%) | $0 |
| 25 to 44 Years | 225 (34.4%) | $117,198 |
| 45 to 64 Years | 298 (45.6%) | $101,000 |
| 65+ Years | 124 (19.0%) | $71,667 |
| Total | 654 (100.0%) | $106,700 |
Poverty in Gunter
Income Below Poverty by Sex and Age in Gunter
With 2.8% poverty level for males and 7.3% for females among the residents of Gunter, under 5 year old males and 75 year old and over females are the most vulnerable to poverty, with 9 males (14.5%) and 18 females (47.4%) in their respective age groups living below the poverty level.
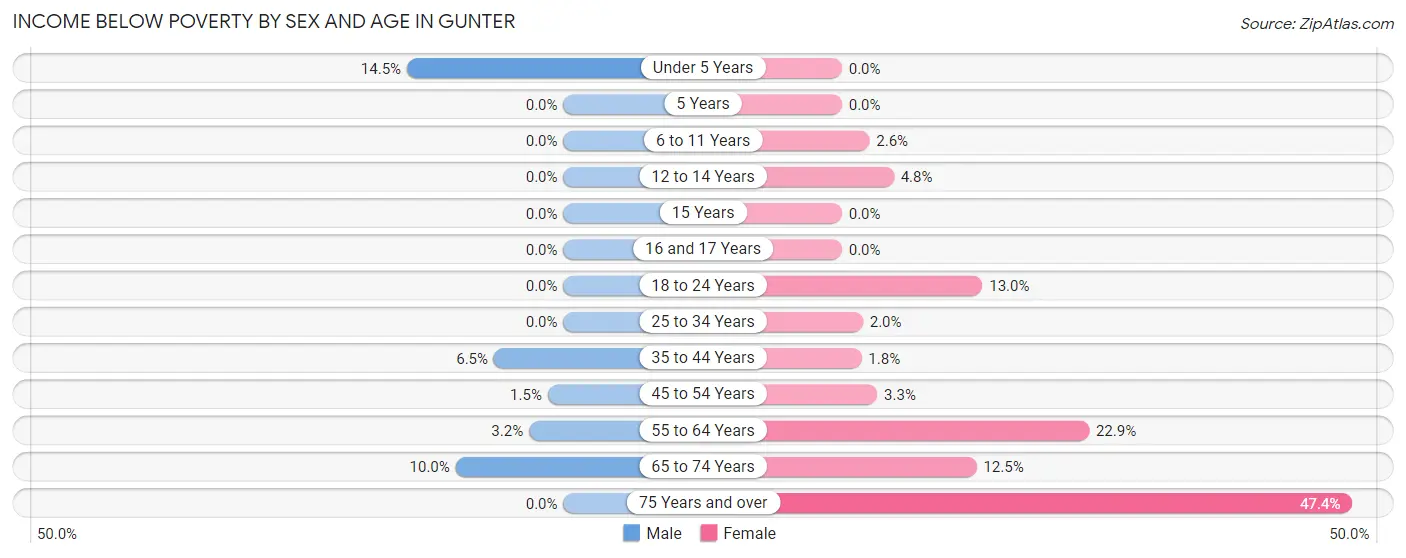
| Age Bracket | Male | Female |
| Under 5 Years | 9 (14.5%) | 0 (0.0%) |
| 5 Years | 0 (0.0%) | 0 (0.0%) |
| 6 to 11 Years | 0 (0.0%) | 3 (2.6%) |
| 12 to 14 Years | 0 (0.0%) | 4 (4.8%) |
| 15 Years | 0 (0.0%) | 0 (0.0%) |
| 16 and 17 Years | 0 (0.0%) | 0 (0.0%) |
| 18 to 24 Years | 0 (0.0%) | 18 (13.0%) |
| 25 to 34 Years | 0 (0.0%) | 3 (1.9%) |
| 35 to 44 Years | 8 (6.5%) | 3 (1.8%) |
| 45 to 54 Years | 2 (1.5%) | 6 (3.3%) |
| 55 to 64 Years | 6 (3.2%) | 25 (22.9%) |
| 65 to 74 Years | 6 (10.0%) | 6 (12.5%) |
| 75 Years and over | 0 (0.0%) | 18 (47.4%) |
| Total | 31 (2.8%) | 86 (7.3%) |
Income Above Poverty by Sex and Age in Gunter
According to the poverty statistics in Gunter, males aged 5 years and females aged under 5 years are the age groups that are most secure financially, with 100.0% of males and 100.0% of females in these age groups living above the poverty line.
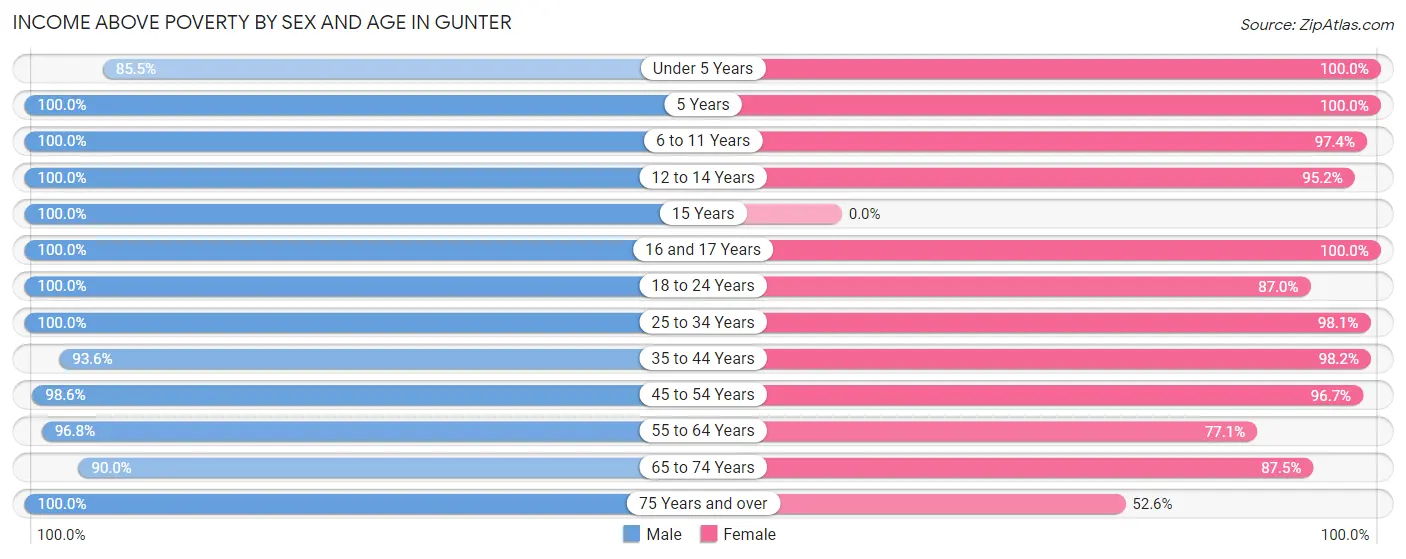
| Age Bracket | Male | Female |
| Under 5 Years | 53 (85.5%) | 29 (100.0%) |
| 5 Years | 23 (100.0%) | 23 (100.0%) |
| 6 to 11 Years | 57 (100.0%) | 114 (97.4%) |
| 12 to 14 Years | 50 (100.0%) | 79 (95.2%) |
| 15 Years | 19 (100.0%) | 0 (0.0%) |
| 16 and 17 Years | 51 (100.0%) | 88 (100.0%) |
| 18 to 24 Years | 183 (100.0%) | 120 (87.0%) |
| 25 to 34 Years | 120 (100.0%) | 151 (98.1%) |
| 35 to 44 Years | 116 (93.5%) | 162 (98.2%) |
| 45 to 54 Years | 136 (98.6%) | 177 (96.7%) |
| 55 to 64 Years | 182 (96.8%) | 84 (77.1%) |
| 65 to 74 Years | 54 (90.0%) | 42 (87.5%) |
| 75 Years and over | 29 (100.0%) | 20 (52.6%) |
| Total | 1,073 (97.2%) | 1,089 (92.7%) |
Income Below Poverty Among Married-Couple Families in Gunter
The poverty statistics for married-couple families in Gunter show that 2.4% or 11 of the total 469 families live below the poverty line. Families with 3 or 4 children have the highest poverty rate of 15.8%, comprising of 3 families. On the other hand, families with 1 or 2 children have the lowest poverty rate of 0.0%, which includes 0 families.
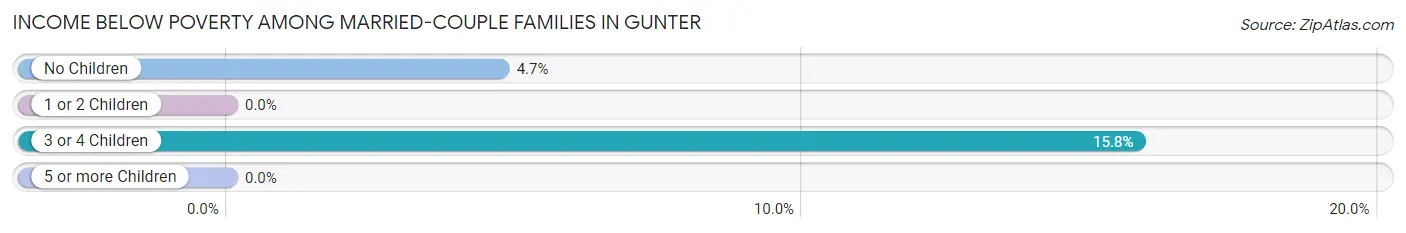
| Children | Above Poverty | Below Poverty |
| No Children | 161 (95.3%) | 8 (4.7%) |
| 1 or 2 Children | 281 (100.0%) | 0 (0.0%) |
| 3 or 4 Children | 16 (84.2%) | 3 (15.8%) |
| 5 or more Children | 0 (0.0%) | 0 (0.0%) |
| Total | 458 (97.7%) | 11 (2.4%) |
Income Below Poverty Among Single-Parent Households in Gunter
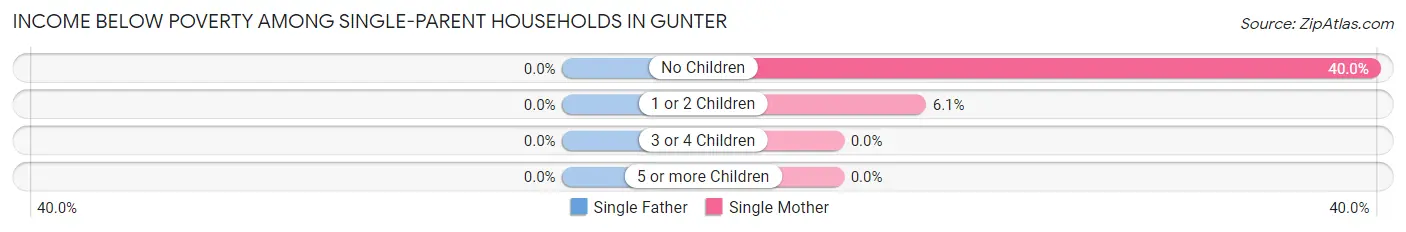
| Children | Single Father | Single Mother |
| No Children | 0 (0.0%) | 8 (40.0%) |
| 1 or 2 Children | 0 (0.0%) | 3 (6.1%) |
| 3 or 4 Children | 0 (0.0%) | 0 (0.0%) |
| 5 or more Children | 0 (0.0%) | 0 (0.0%) |
| Total | 0 (0.0%) | 11 (15.9%) |
Income Below Poverty Among Married-Couple vs Single-Parent Households in Gunter
The poverty data for Gunter shows that 11 of the married-couple family households (2.4%) and 11 of the single-parent households (12.4%) are living below the poverty level. Within the married-couple family households, those with 3 or 4 children have the highest poverty rate, with 3 households (15.8%) falling below the poverty line. Among the single-parent households, those with no children have the highest poverty rate, with 8 household (20.0%) living below poverty.
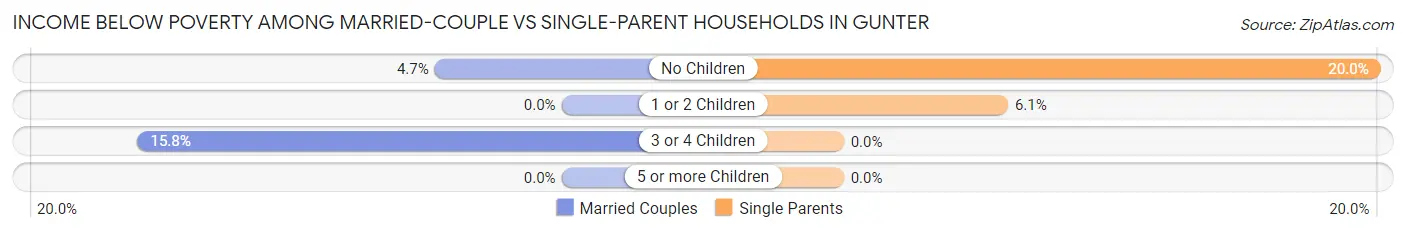
| Children | Married-Couple Families | Single-Parent Households |
| No Children | 8 (4.7%) | 8 (20.0%) |
| 1 or 2 Children | 0 (0.0%) | 3 (6.1%) |
| 3 or 4 Children | 3 (15.8%) | 0 (0.0%) |
| 5 or more Children | 0 (0.0%) | 0 (0.0%) |
| Total | 11 (2.4%) | 11 (12.4%) |
Employment Characteristics in Gunter
Employment by Class of Employer in Gunter
Among the 1,148 employed individuals in Gunter, private company employees (916 | 79.8%), local government employees (74 | 6.5%), and self-employed (not incorporated) (53 | 4.6%) make up the most common classes of employment.
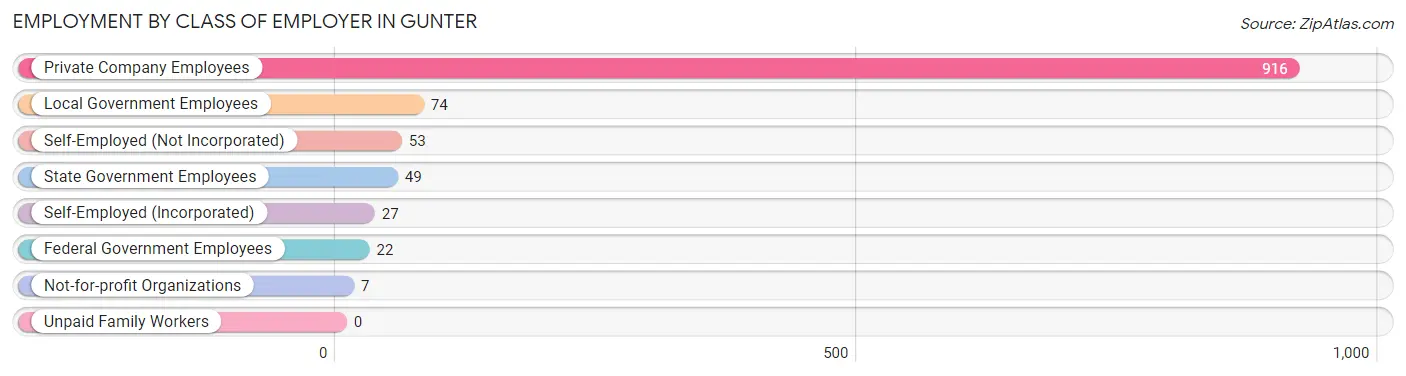
| Employer Class | # Employees | % Employees |
| Private Company Employees | 916 | 79.8% |
| Self-Employed (Incorporated) | 27 | 2.4% |
| Self-Employed (Not Incorporated) | 53 | 4.6% |
| Not-for-profit Organizations | 7 | 0.6% |
| Local Government Employees | 74 | 6.5% |
| State Government Employees | 49 | 4.3% |
| Federal Government Employees | 22 | 1.9% |
| Unpaid Family Workers | 0 | 0.0% |
| Total | 1,148 | 100.0% |
Employment Status by Age in Gunter
According to the labor force statistics for Gunter, out of the total population over 16 years of age (1,816), 67.0% or 1,217 individuals are in the labor force, with 4.6% or 56 of them unemployed. The age group with the highest labor force participation rate is 30 to 34 years, with 96.1% or 123 individuals in the labor force. Within the labor force, the 16 to 19 years age range has the highest percentage of unemployed individuals, with 40.7% or 11 of them being unemployed.
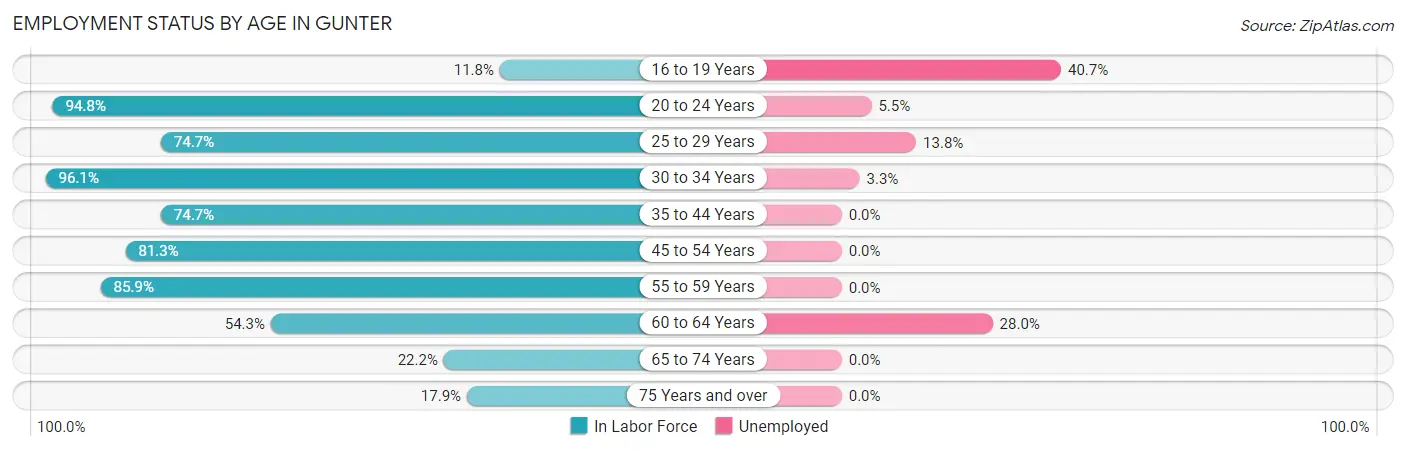
| Age Bracket | In Labor Force | Unemployed |
| 16 to 19 Years | 27 (11.8%) | 11 (40.7%) |
| 20 to 24 Years | 219 (94.8%) | 12 (5.5%) |
| 25 to 29 Years | 109 (74.7%) | 15 (13.8%) |
| 30 to 34 Years | 123 (96.1%) | 4 (3.3%) |
| 35 to 44 Years | 216 (74.7%) | 0 (0.0%) |
| 45 to 54 Years | 261 (81.3%) | 0 (0.0%) |
| 55 to 59 Years | 176 (85.9%) | 0 (0.0%) |
| 60 to 64 Years | 50 (54.3%) | 14 (28.0%) |
| 65 to 74 Years | 24 (22.2%) | 0 (0.0%) |
| 75 Years and over | 12 (17.9%) | 0 (0.0%) |
| Total | 1,217 (67.0%) | 56 (4.6%) |
Employment Status by Educational Attainment in Gunter
According to labor force statistics for Gunter, 79.2% of individuals (935) out of the total population between 25 and 64 years of age (1,181) are in the labor force, with 3.5% or 33 of them being unemployed. The group with the highest labor force participation rate are those with the educational attainment of less than high school, with 90.3% or 168 individuals in the labor force. Within the labor force, individuals with less than high school education have the highest percentage of unemployment, with 8.9% or 15 of them being unemployed.
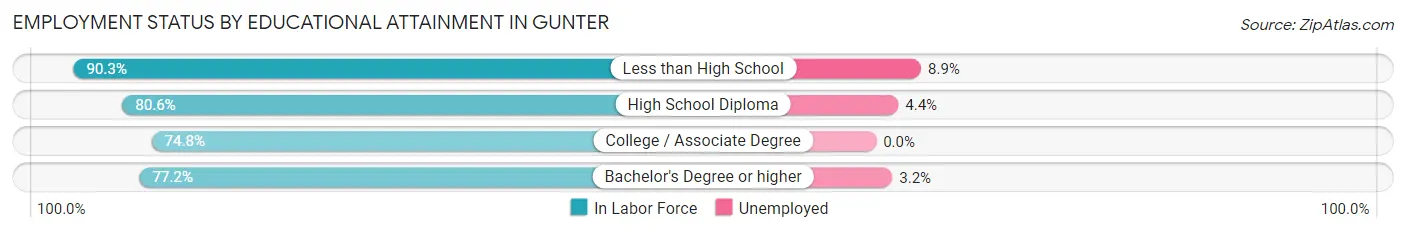
| Educational Attainment | In Labor Force | Unemployed |
| Less than High School | 168 (90.3%) | 17 (8.9%) |
| High School Diploma | 183 (80.6%) | 10 (4.4%) |
| College / Associate Degree | 276 (74.8%) | 0 (0.0%) |
| Bachelor's Degree or higher | 308 (77.2%) | 13 (3.2%) |
| Total | 935 (79.2%) | 41 (3.5%) |
Employment Occupations by Sex in Gunter
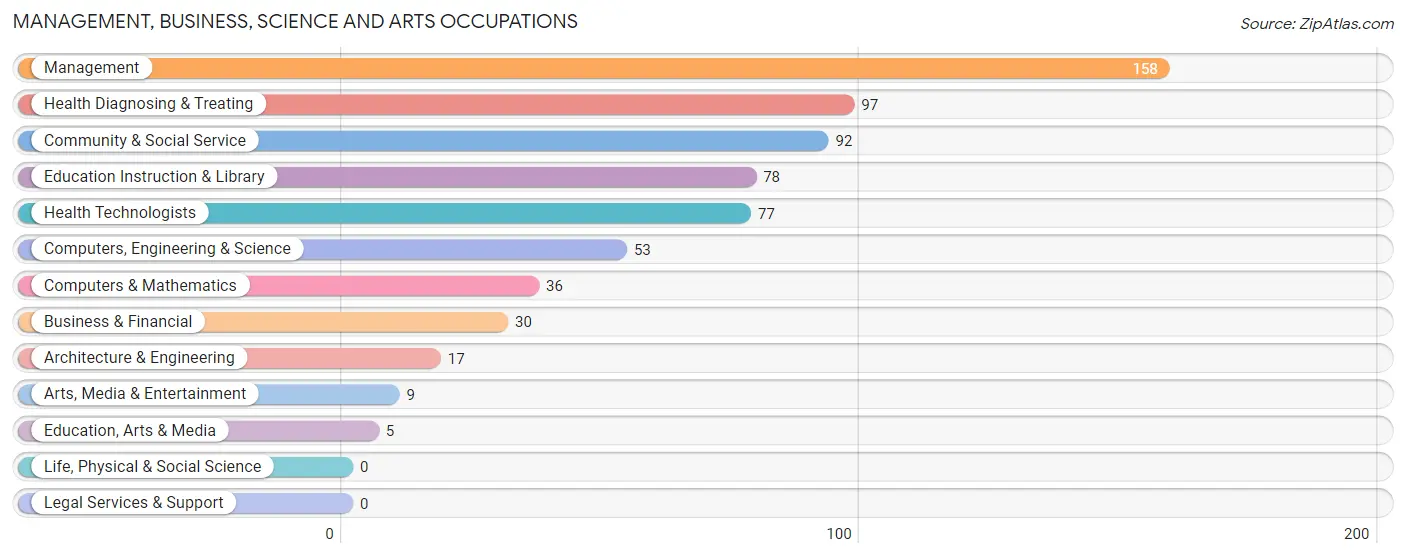
Management, Business, Science and Arts Occupations
The most common Management, Business, Science and Arts occupations in Gunter are Management (158 | 13.6%), Health Diagnosing & Treating (97 | 8.4%), Community & Social Service (92 | 7.9%), Education Instruction & Library (78 | 6.7%), and Health Technologists (77 | 6.6%).
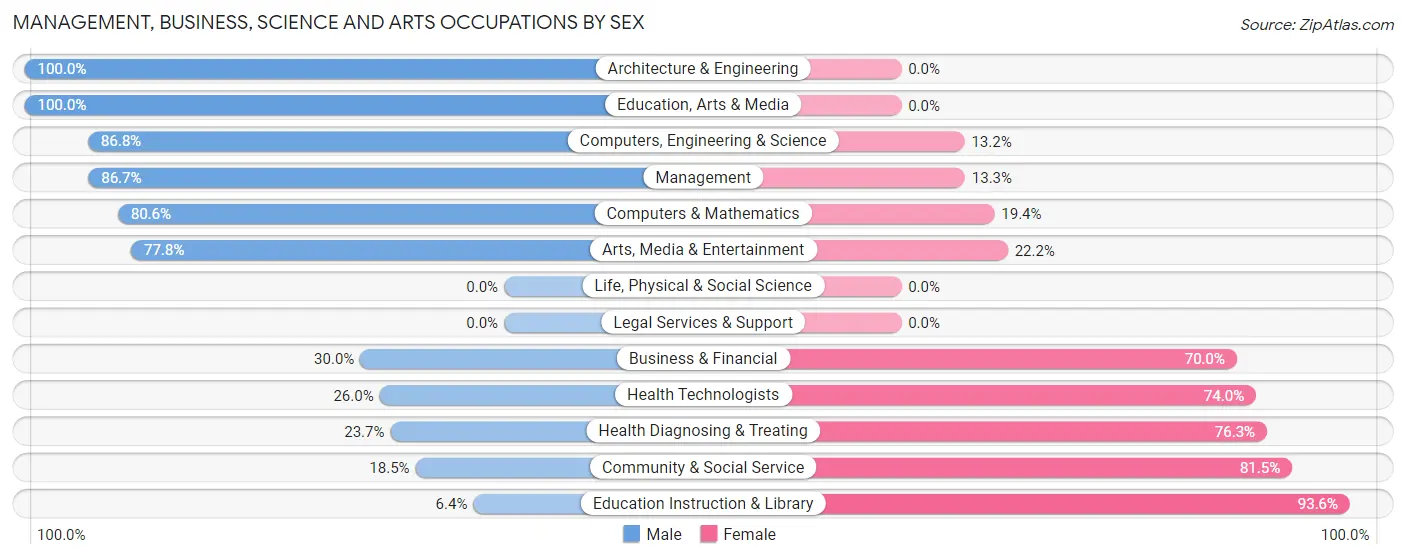
Management, Business, Science and Arts Occupations by Sex
Within the Management, Business, Science and Arts occupations in Gunter, the most male-oriented occupations are Architecture & Engineering (100.0%), Education, Arts & Media (100.0%), and Computers, Engineering & Science (86.8%), while the most female-oriented occupations are Education Instruction & Library (93.6%), Community & Social Service (81.5%), and Health Diagnosing & Treating (76.3%).
| Occupation | Male | Female |
| Management | 137 (86.7%) | 21 (13.3%) |
| Business & Financial | 9 (30.0%) | 21 (70.0%) |
| Computers, Engineering & Science | 46 (86.8%) | 7 (13.2%) |
| Computers & Mathematics | 29 (80.6%) | 7 (19.4%) |
| Architecture & Engineering | 17 (100.0%) | 0 (0.0%) |
| Life, Physical & Social Science | 0 (0.0%) | 0 (0.0%) |
| Community & Social Service | 17 (18.5%) | 75 (81.5%) |
| Education, Arts & Media | 5 (100.0%) | 0 (0.0%) |
| Legal Services & Support | 0 (0.0%) | 0 (0.0%) |
| Education Instruction & Library | 5 (6.4%) | 73 (93.6%) |
| Arts, Media & Entertainment | 7 (77.8%) | 2 (22.2%) |
| Health Diagnosing & Treating | 23 (23.7%) | 74 (76.3%) |
| Health Technologists | 20 (26.0%) | 57 (74.0%) |
| Total (Category) | 232 (53.9%) | 198 (46.1%) |
| Total (Overall) | 729 (62.8%) | 432 (37.2%) |
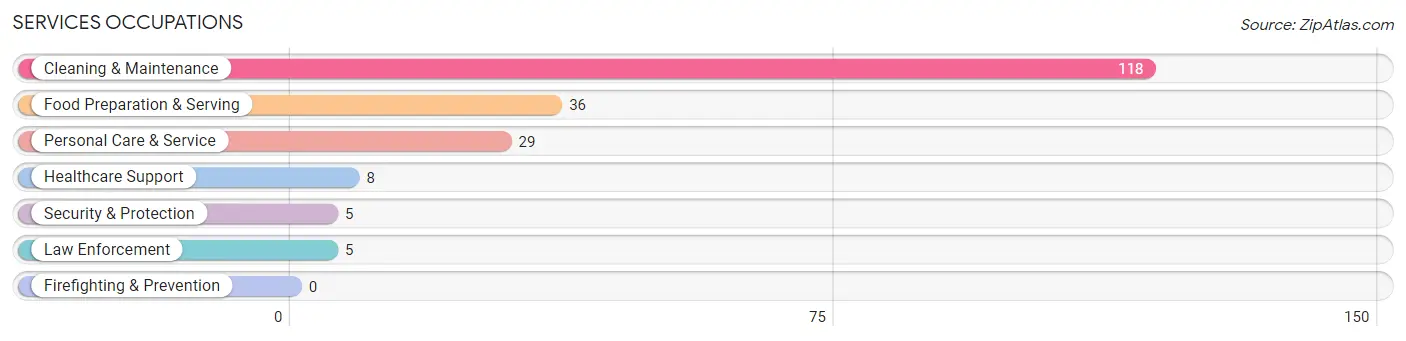
Services Occupations
The most common Services occupations in Gunter are Cleaning & Maintenance (118 | 10.2%), Food Preparation & Serving (36 | 3.1%), Personal Care & Service (29 | 2.5%), Healthcare Support (8 | 0.7%), and Security & Protection (5 | 0.4%).
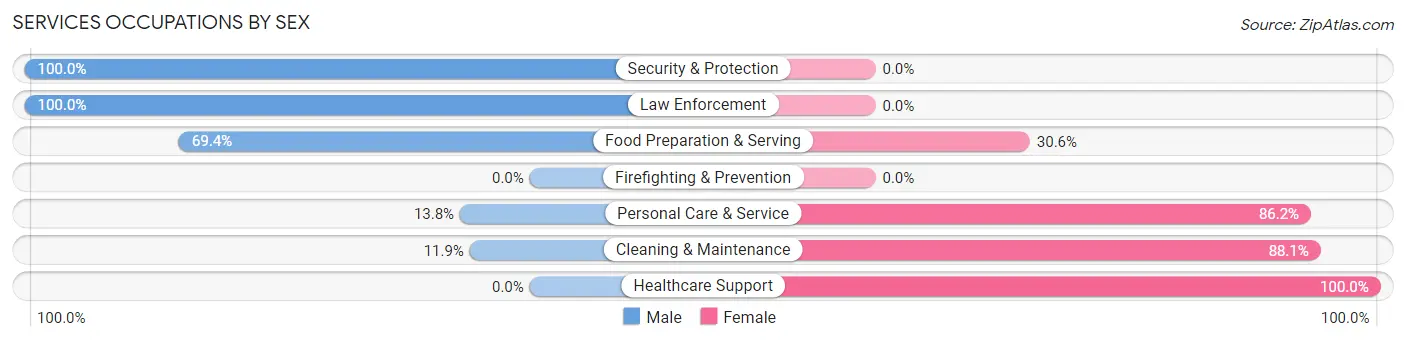
Services Occupations by Sex
Within the Services occupations in Gunter, the most male-oriented occupations are Security & Protection (100.0%), Law Enforcement (100.0%), and Food Preparation & Serving (69.4%), while the most female-oriented occupations are Healthcare Support (100.0%), Cleaning & Maintenance (88.1%), and Personal Care & Service (86.2%).
| Occupation | Male | Female |
| Healthcare Support | 0 (0.0%) | 8 (100.0%) |
| Security & Protection | 5 (100.0%) | 0 (0.0%) |
| Firefighting & Prevention | 0 (0.0%) | 0 (0.0%) |
| Law Enforcement | 5 (100.0%) | 0 (0.0%) |
| Food Preparation & Serving | 25 (69.4%) | 11 (30.6%) |
| Cleaning & Maintenance | 14 (11.9%) | 104 (88.1%) |
| Personal Care & Service | 4 (13.8%) | 25 (86.2%) |
| Total (Category) | 48 (24.5%) | 148 (75.5%) |
| Total (Overall) | 729 (62.8%) | 432 (37.2%) |
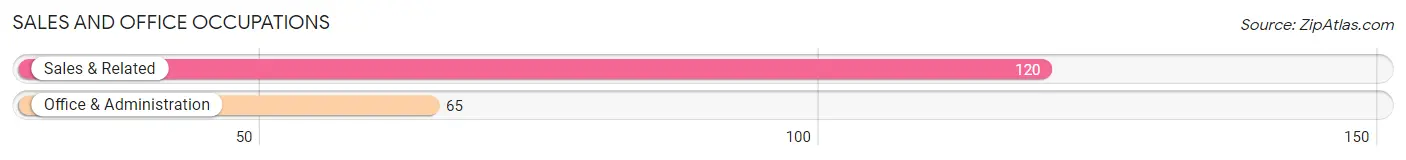
Sales and Office Occupations
The most common Sales and Office occupations in Gunter are Sales & Related (120 | 10.3%), and Office & Administration (65 | 5.6%).
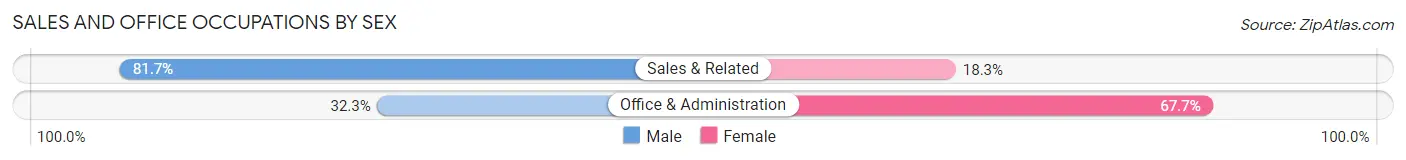
Sales and Office Occupations by Sex
| Occupation | Male | Female |
| Sales & Related | 98 (81.7%) | 22 (18.3%) |
| Office & Administration | 21 (32.3%) | 44 (67.7%) |
| Total (Category) | 119 (64.3%) | 66 (35.7%) |
| Total (Overall) | 729 (62.8%) | 432 (37.2%) |
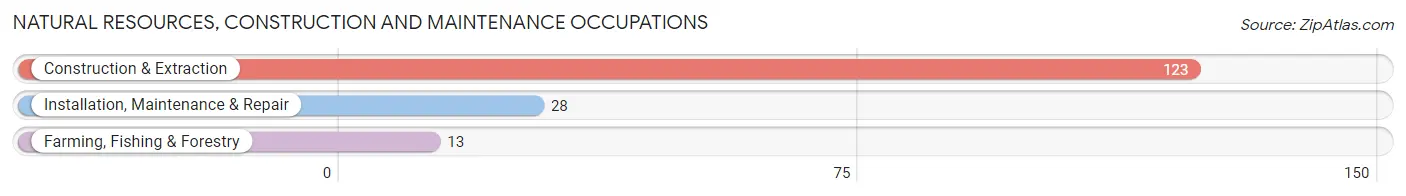
Natural Resources, Construction and Maintenance Occupations
The most common Natural Resources, Construction and Maintenance occupations in Gunter are Construction & Extraction (123 | 10.6%), Installation, Maintenance & Repair (28 | 2.4%), and Farming, Fishing & Forestry (13 | 1.1%).
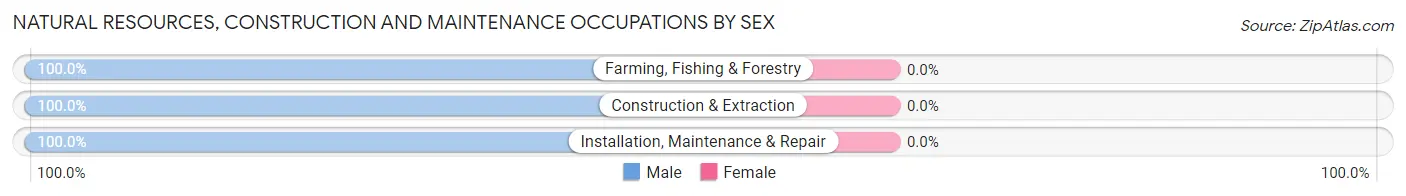
Natural Resources, Construction and Maintenance Occupations by Sex
| Occupation | Male | Female |
| Farming, Fishing & Forestry | 13 (100.0%) | 0 (0.0%) |
| Construction & Extraction | 123 (100.0%) | 0 (0.0%) |
| Installation, Maintenance & Repair | 28 (100.0%) | 0 (0.0%) |
| Total (Category) | 164 (100.0%) | 0 (0.0%) |
| Total (Overall) | 729 (62.8%) | 432 (37.2%) |
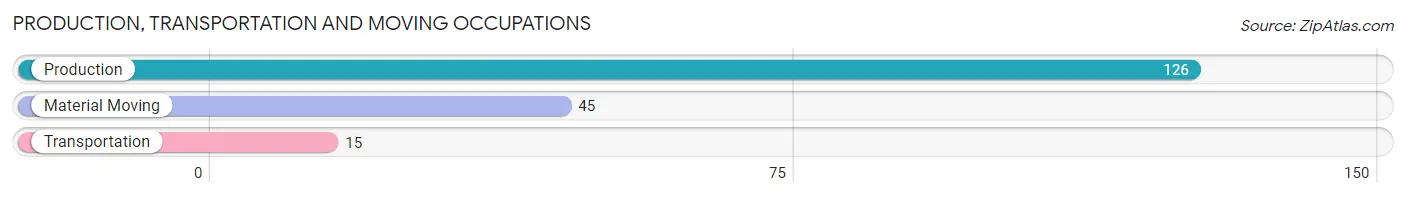
Production, Transportation and Moving Occupations
The most common Production, Transportation and Moving occupations in Gunter are Production (126 | 10.8%), Material Moving (45 | 3.9%), and Transportation (15 | 1.3%).
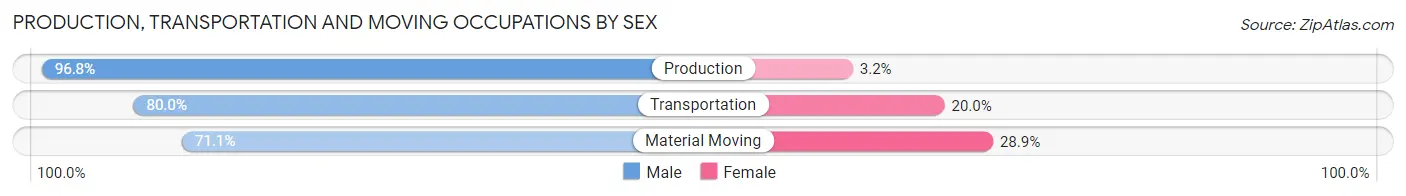
Production, Transportation and Moving Occupations by Sex
| Occupation | Male | Female |
| Production | 122 (96.8%) | 4 (3.2%) |
| Transportation | 12 (80.0%) | 3 (20.0%) |
| Material Moving | 32 (71.1%) | 13 (28.9%) |
| Total (Category) | 166 (89.2%) | 20 (10.7%) |
| Total (Overall) | 729 (62.8%) | 432 (37.2%) |
Employment Industries by Sex in Gunter
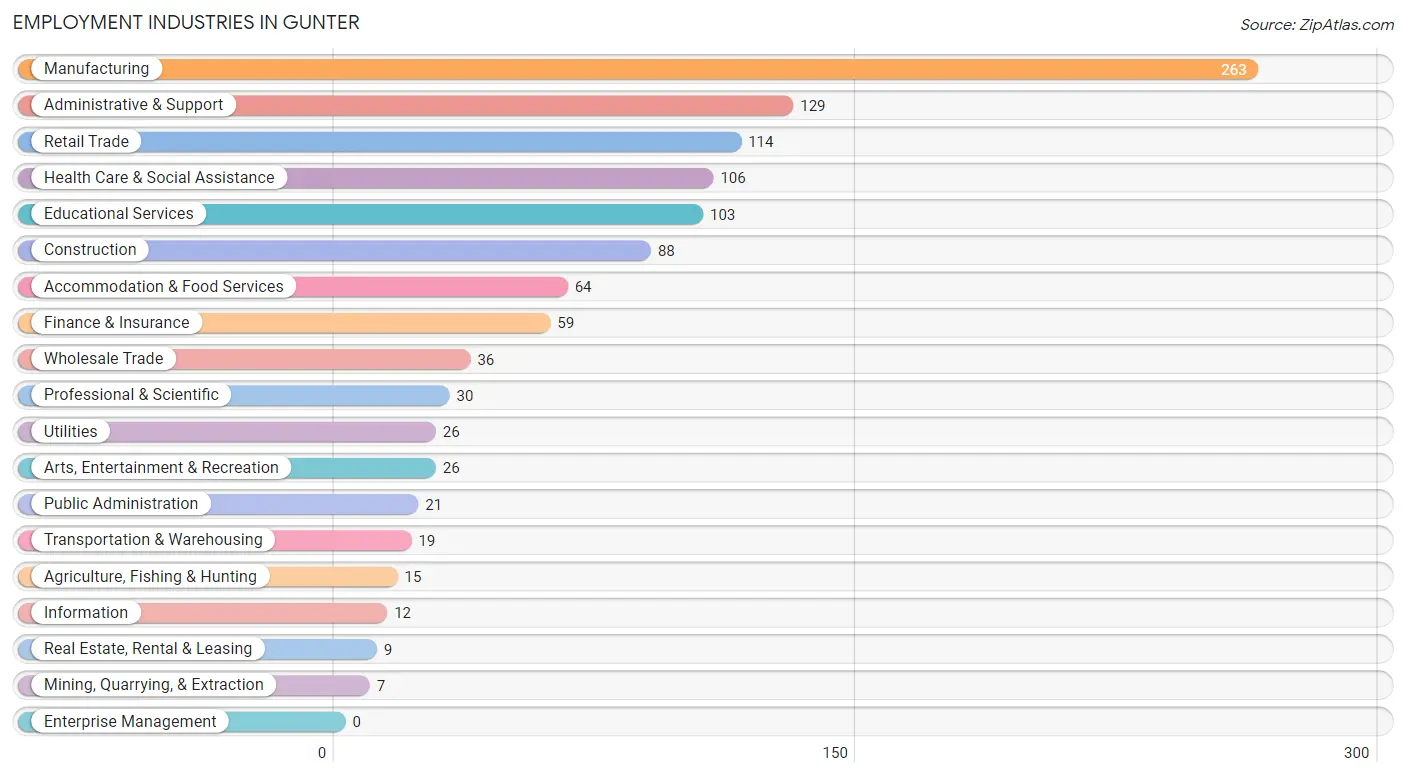
Employment Industries in Gunter
The major employment industries in Gunter include Manufacturing (263 | 22.7%), Administrative & Support (129 | 11.1%), Retail Trade (114 | 9.8%), Health Care & Social Assistance (106 | 9.1%), and Educational Services (103 | 8.9%).
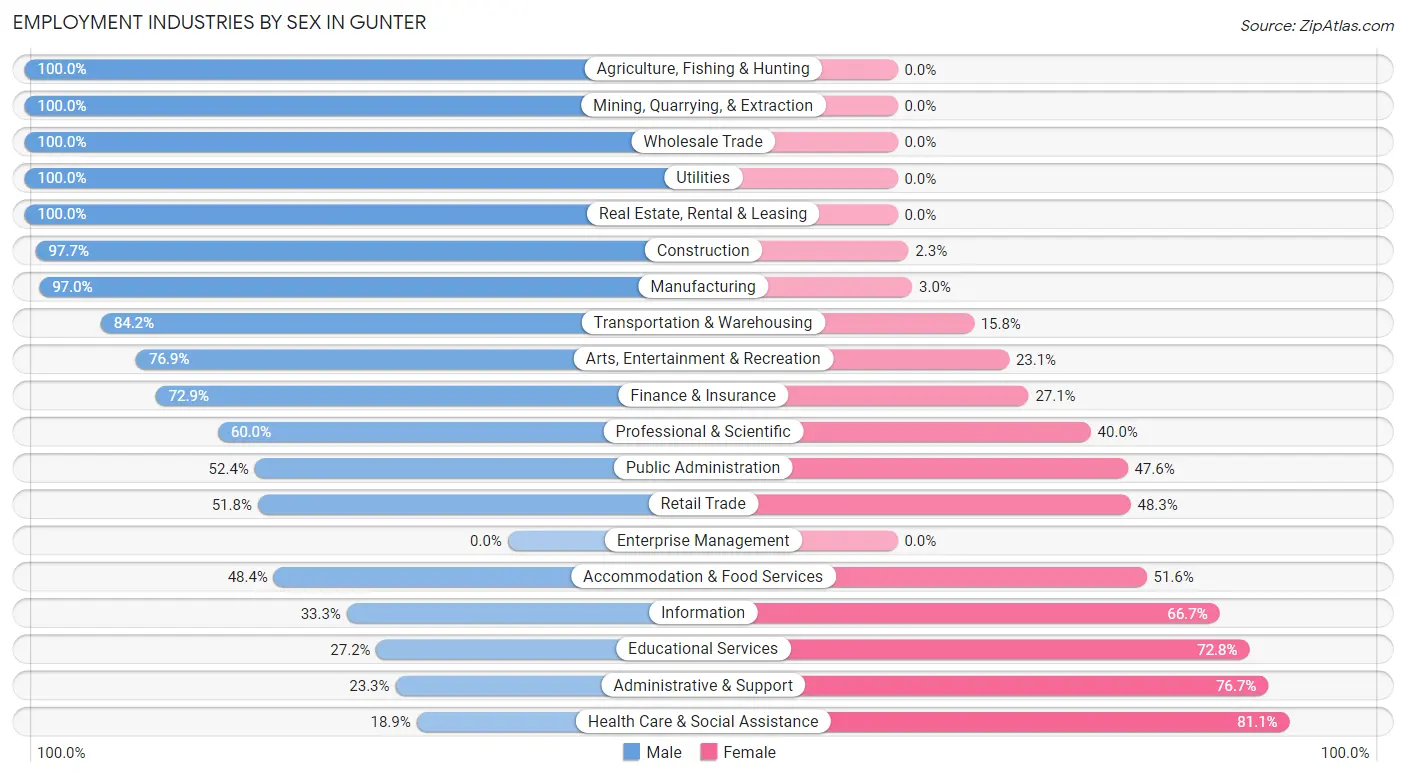
Employment Industries by Sex in Gunter
The Gunter industries that see more men than women are Agriculture, Fishing & Hunting (100.0%), Mining, Quarrying, & Extraction (100.0%), and Wholesale Trade (100.0%), whereas the industries that tend to have a higher number of women are Health Care & Social Assistance (81.1%), Administrative & Support (76.7%), and Educational Services (72.8%).
| Industry | Male | Female |
| Agriculture, Fishing & Hunting | 15 (100.0%) | 0 (0.0%) |
| Mining, Quarrying, & Extraction | 7 (100.0%) | 0 (0.0%) |
| Construction | 86 (97.7%) | 2 (2.3%) |
| Manufacturing | 255 (97.0%) | 8 (3.0%) |
| Wholesale Trade | 36 (100.0%) | 0 (0.0%) |
| Retail Trade | 59 (51.7%) | 55 (48.2%) |
| Transportation & Warehousing | 16 (84.2%) | 3 (15.8%) |
| Utilities | 26 (100.0%) | 0 (0.0%) |
| Information | 4 (33.3%) | 8 (66.7%) |
| Finance & Insurance | 43 (72.9%) | 16 (27.1%) |
| Real Estate, Rental & Leasing | 9 (100.0%) | 0 (0.0%) |
| Professional & Scientific | 18 (60.0%) | 12 (40.0%) |
| Enterprise Management | 0 (0.0%) | 0 (0.0%) |
| Administrative & Support | 30 (23.3%) | 99 (76.7%) |
| Educational Services | 28 (27.2%) | 75 (72.8%) |
| Health Care & Social Assistance | 20 (18.9%) | 86 (81.1%) |
| Arts, Entertainment & Recreation | 20 (76.9%) | 6 (23.1%) |
| Accommodation & Food Services | 31 (48.4%) | 33 (51.6%) |
| Public Administration | 11 (52.4%) | 10 (47.6%) |
| Total | 729 (62.8%) | 432 (37.2%) |
Education in Gunter
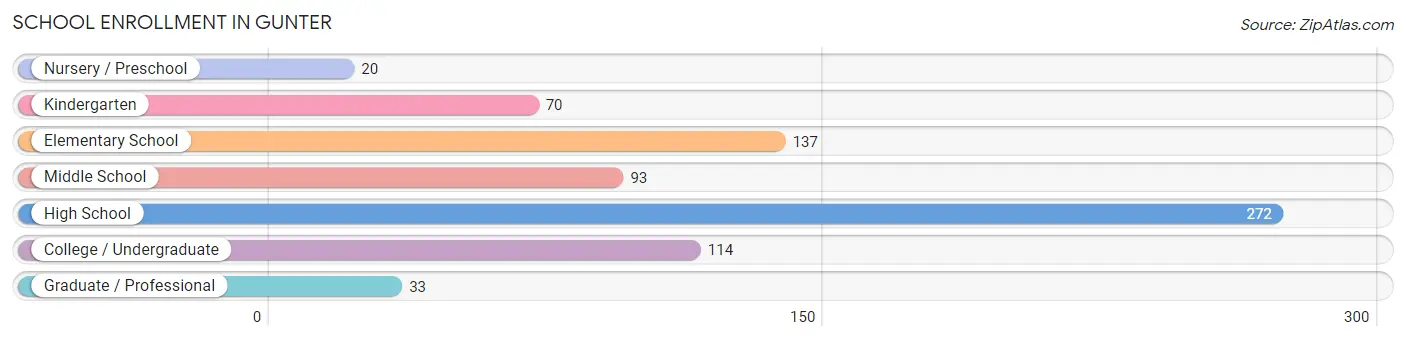
School Enrollment in Gunter
The most common levels of schooling among the 739 students in Gunter are high school (272 | 36.8%), elementary school (137 | 18.5%), and college / undergraduate (114 | 15.4%).
| School Level | # Students | % Students |
| Nursery / Preschool | 20 | 2.7% |
| Kindergarten | 70 | 9.5% |
| Elementary School | 137 | 18.5% |
| Middle School | 93 | 12.6% |
| High School | 272 | 36.8% |
| College / Undergraduate | 114 | 15.4% |
| Graduate / Professional | 33 | 4.5% |
| Total | 739 | 100.0% |
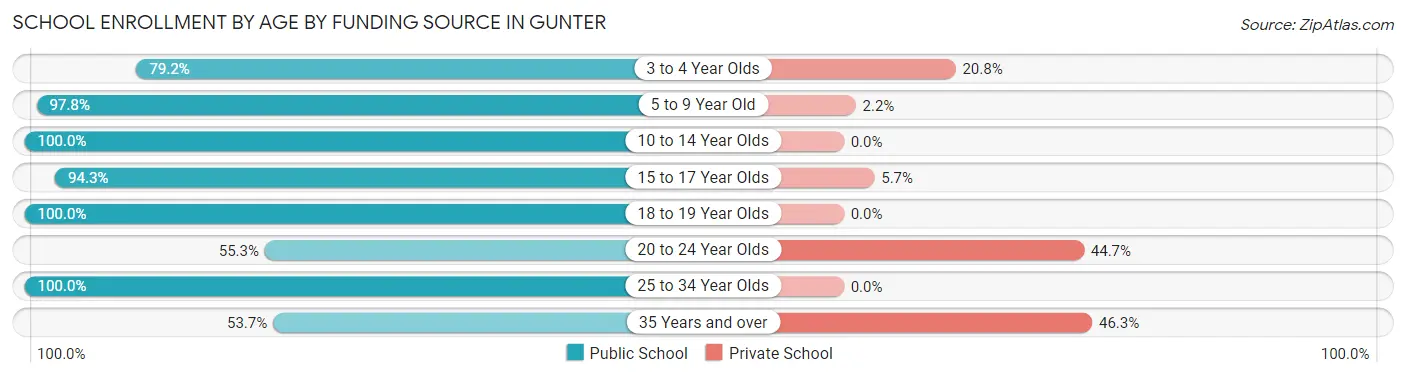
School Enrollment by Age by Funding Source in Gunter
Out of a total of 739 students who are enrolled in schools in Gunter, 66 (8.9%) attend a private institution, while the remaining 673 (91.1%) are enrolled in public schools. The age group of 35 years and over has the highest likelihood of being enrolled in private schools, with 31 (46.3% in the age bracket) enrolled. Conversely, the age group of 10 to 14 year olds has the lowest likelihood of being enrolled in a private school, with 168 (100.0% in the age bracket) attending a public institution.
| Age Bracket | Public School | Private School |
| 3 to 4 Year Olds | 19 (79.2%) | 5 (20.8%) |
| 5 to 9 Year Old | 176 (97.8%) | 4 (2.2%) |
| 10 to 14 Year Olds | 168 (100.0%) | 0 (0.0%) |
| 15 to 17 Year Olds | 149 (94.3%) | 9 (5.7%) |
| 18 to 19 Year Olds | 76 (100.0%) | 0 (0.0%) |
| 20 to 24 Year Olds | 21 (55.3%) | 17 (44.7%) |
| 25 to 34 Year Olds | 28 (100.0%) | 0 (0.0%) |
| 35 Years and over | 36 (53.7%) | 31 (46.3%) |
| Total | 673 (91.1%) | 66 (8.9%) |
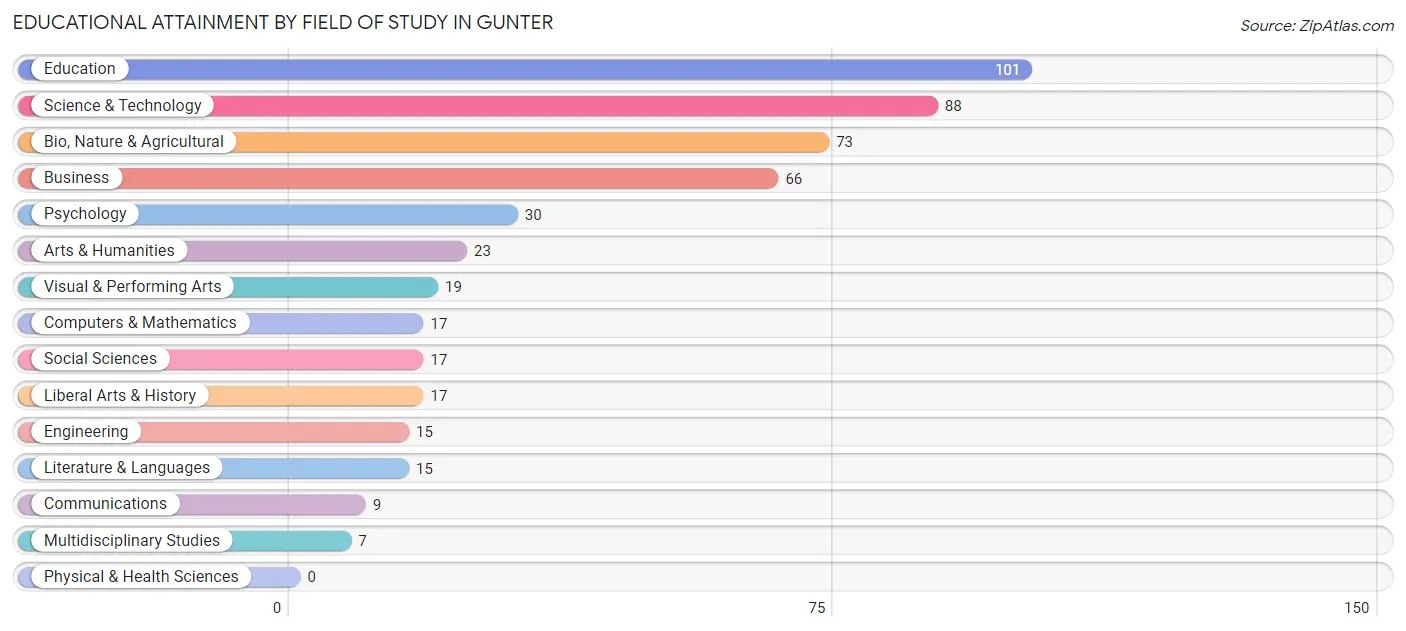
Educational Attainment by Field of Study in Gunter
Education (101 | 20.3%), science & technology (88 | 17.7%), bio, nature & agricultural (73 | 14.7%), business (66 | 13.3%), and psychology (30 | 6.0%) are the most common fields of study among 497 individuals in Gunter who have obtained a bachelor's degree or higher.
| Field of Study | # Graduates | % Graduates |
| Computers & Mathematics | 17 | 3.4% |
| Bio, Nature & Agricultural | 73 | 14.7% |
| Physical & Health Sciences | 0 | 0.0% |
| Psychology | 30 | 6.0% |
| Social Sciences | 17 | 3.4% |
| Engineering | 15 | 3.0% |
| Multidisciplinary Studies | 7 | 1.4% |
| Science & Technology | 88 | 17.7% |
| Business | 66 | 13.3% |
| Education | 101 | 20.3% |
| Literature & Languages | 15 | 3.0% |
| Liberal Arts & History | 17 | 3.4% |
| Visual & Performing Arts | 19 | 3.8% |
| Communications | 9 | 1.8% |
| Arts & Humanities | 23 | 4.6% |
| Total | 497 | 100.0% |
Transportation & Commute in Gunter
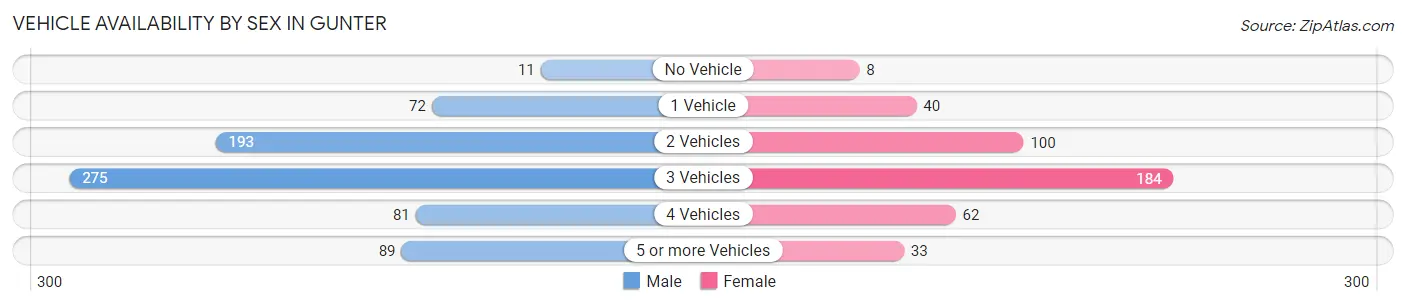
Vehicle Availability by Sex in Gunter
The most prevalent vehicle ownership categories in Gunter are males with 3 vehicles (275, accounting for 38.1%) and females with 3 vehicles (184, making up 64.4%).
| Vehicles Available | Male | Female |
| No Vehicle | 11 (1.5%) | 8 (1.9%) |
| 1 Vehicle | 72 (10.0%) | 40 (9.4%) |
| 2 Vehicles | 193 (26.8%) | 100 (23.4%) |
| 3 Vehicles | 275 (38.1%) | 184 (43.1%) |
| 4 Vehicles | 81 (11.2%) | 62 (14.5%) |
| 5 or more Vehicles | 89 (12.3%) | 33 (7.7%) |
| Total | 721 (100.0%) | 427 (100.0%) |
Commute Time in Gunter
The most frequently occuring commute durations in Gunter are 45 to 59 minutes (173 commuters, 16.2%), less than 5 minutes (153 commuters, 14.3%), and 30 to 34 minutes (142 commuters, 13.3%).
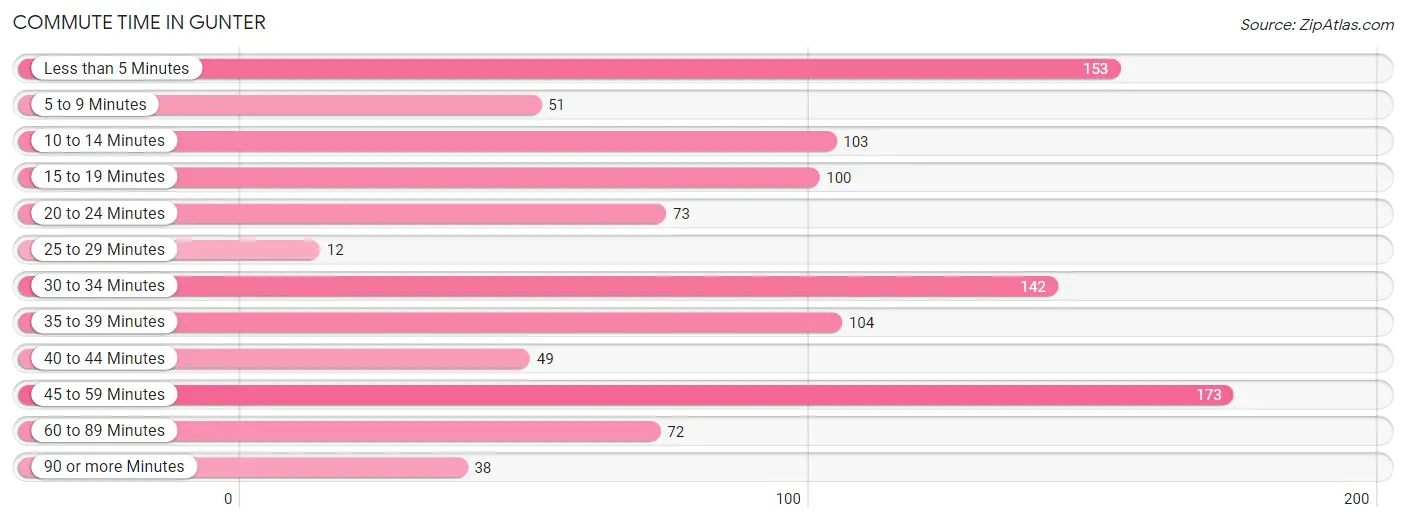
| Commute Time | # Commuters | % Commuters |
| Less than 5 Minutes | 153 | 14.3% |
| 5 to 9 Minutes | 51 | 4.8% |
| 10 to 14 Minutes | 103 | 9.6% |
| 15 to 19 Minutes | 100 | 9.3% |
| 20 to 24 Minutes | 73 | 6.8% |
| 25 to 29 Minutes | 12 | 1.1% |
| 30 to 34 Minutes | 142 | 13.3% |
| 35 to 39 Minutes | 104 | 9.7% |
| 40 to 44 Minutes | 49 | 4.6% |
| 45 to 59 Minutes | 173 | 16.2% |
| 60 to 89 Minutes | 72 | 6.7% |
| 90 or more Minutes | 38 | 3.5% |
Commute Time by Sex in Gunter
The most common commute times in Gunter are 45 to 59 minutes (124 commuters, 17.8%) for males and less than 5 minutes (124 commuters, 33.3%) for females.
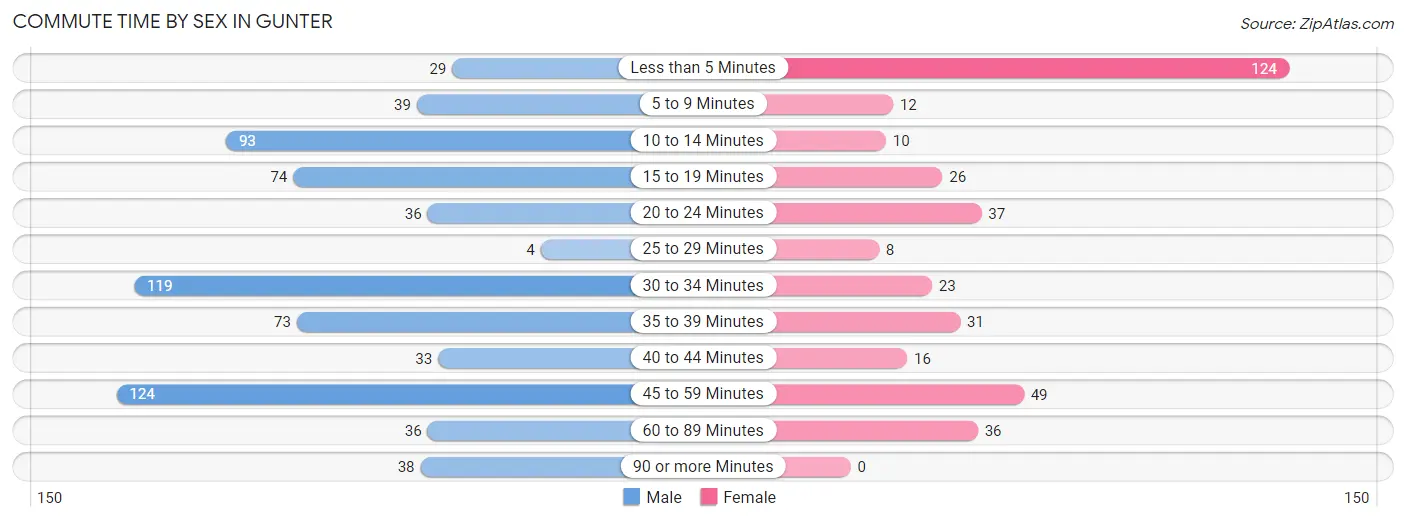
| Commute Time | Male | Female |
| Less than 5 Minutes | 29 (4.2%) | 124 (33.3%) |
| 5 to 9 Minutes | 39 (5.6%) | 12 (3.2%) |
| 10 to 14 Minutes | 93 (13.3%) | 10 (2.7%) |
| 15 to 19 Minutes | 74 (10.6%) | 26 (7.0%) |
| 20 to 24 Minutes | 36 (5.2%) | 37 (10.0%) |
| 25 to 29 Minutes | 4 (0.6%) | 8 (2.1%) |
| 30 to 34 Minutes | 119 (17.1%) | 23 (6.2%) |
| 35 to 39 Minutes | 73 (10.5%) | 31 (8.3%) |
| 40 to 44 Minutes | 33 (4.7%) | 16 (4.3%) |
| 45 to 59 Minutes | 124 (17.8%) | 49 (13.2%) |
| 60 to 89 Minutes | 36 (5.2%) | 36 (9.7%) |
| 90 or more Minutes | 38 (5.4%) | 0 (0.0%) |
Time of Departure to Work by Sex in Gunter
The most frequent times of departure to work in Gunter are 7:00 AM to 7:29 AM (145, 20.8%) for males and 8:00 AM to 8:29 AM (126, 33.9%) for females.
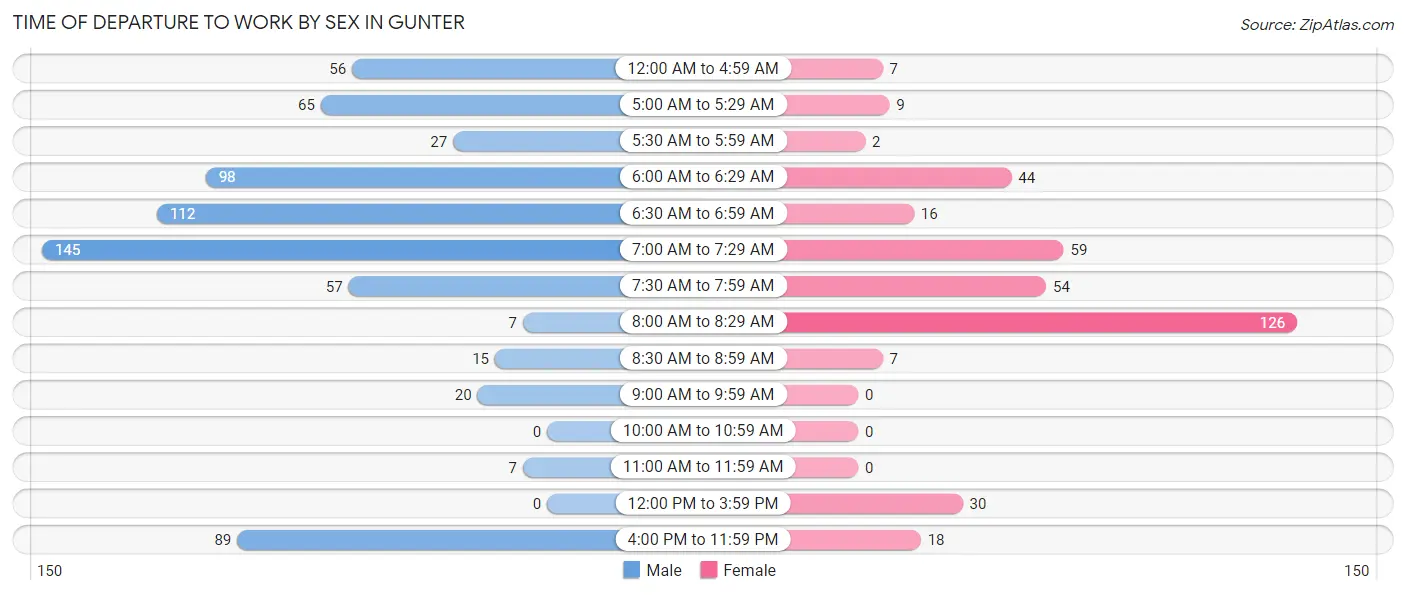
| Time of Departure | Male | Female |
| 12:00 AM to 4:59 AM | 56 (8.0%) | 7 (1.9%) |
| 5:00 AM to 5:29 AM | 65 (9.3%) | 9 (2.4%) |
| 5:30 AM to 5:59 AM | 27 (3.9%) | 2 (0.5%) |
| 6:00 AM to 6:29 AM | 98 (14.0%) | 44 (11.8%) |
| 6:30 AM to 6:59 AM | 112 (16.1%) | 16 (4.3%) |
| 7:00 AM to 7:29 AM | 145 (20.8%) | 59 (15.9%) |
| 7:30 AM to 7:59 AM | 57 (8.2%) | 54 (14.5%) |
| 8:00 AM to 8:29 AM | 7 (1.0%) | 126 (33.9%) |
| 8:30 AM to 8:59 AM | 15 (2.1%) | 7 (1.9%) |
| 9:00 AM to 9:59 AM | 20 (2.9%) | 0 (0.0%) |
| 10:00 AM to 10:59 AM | 0 (0.0%) | 0 (0.0%) |
| 11:00 AM to 11:59 AM | 7 (1.0%) | 0 (0.0%) |
| 12:00 PM to 3:59 PM | 0 (0.0%) | 30 (8.1%) |
| 4:00 PM to 11:59 PM | 89 (12.8%) | 18 (4.8%) |
| Total | 698 (100.0%) | 372 (100.0%) |
Housing Occupancy in Gunter
Occupancy by Ownership in Gunter
Of the total 654 dwellings in Gunter, owner-occupied units account for 471 (72.0%), while renter-occupied units make up 183 (28.0%).
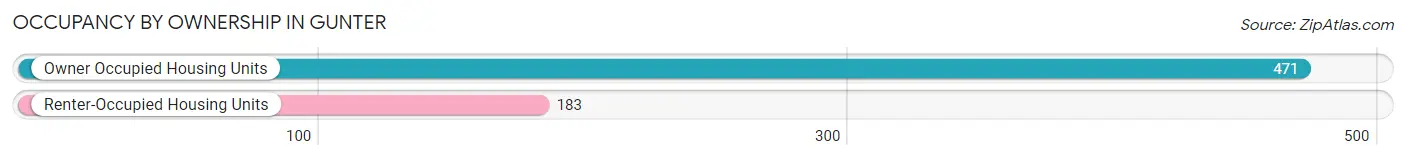
| Occupancy | # Housing Units | % Housing Units |
| Owner Occupied Housing Units | 471 | 72.0% |
| Renter-Occupied Housing Units | 183 | 28.0% |
| Total Occupied Housing Units | 654 | 100.0% |
Occupancy by Household Size in Gunter
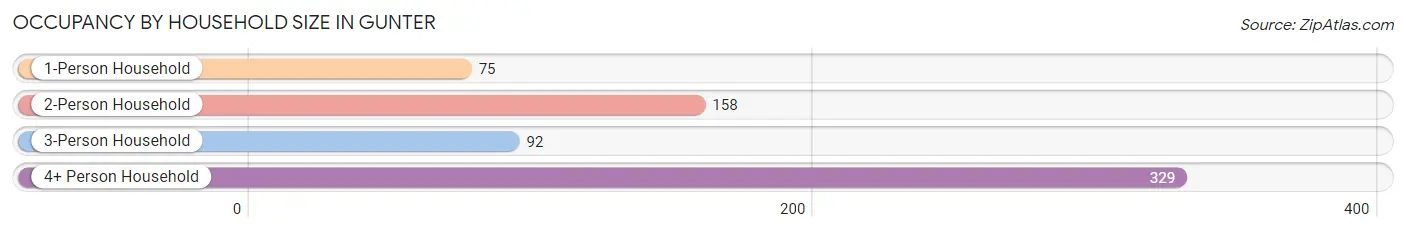
| Household Size | # Housing Units | % Housing Units |
| 1-Person Household | 75 | 11.5% |
| 2-Person Household | 158 | 24.2% |
| 3-Person Household | 92 | 14.1% |
| 4+ Person Household | 329 | 50.3% |
| Total Housing Units | 654 | 100.0% |
Occupancy by Ownership by Household Size in Gunter
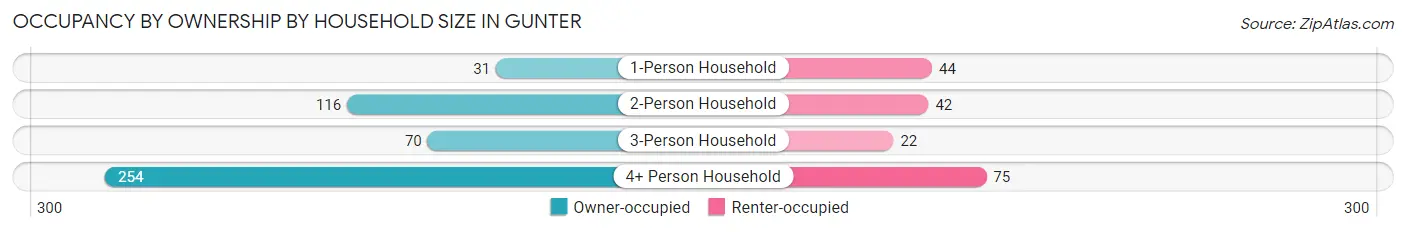
| Household Size | Owner-occupied | Renter-occupied |
| 1-Person Household | 31 (41.3%) | 44 (58.7%) |
| 2-Person Household | 116 (73.4%) | 42 (26.6%) |
| 3-Person Household | 70 (76.1%) | 22 (23.9%) |
| 4+ Person Household | 254 (77.2%) | 75 (22.8%) |
| Total Housing Units | 471 (72.0%) | 183 (28.0%) |
Occupancy by Educational Attainment in Gunter
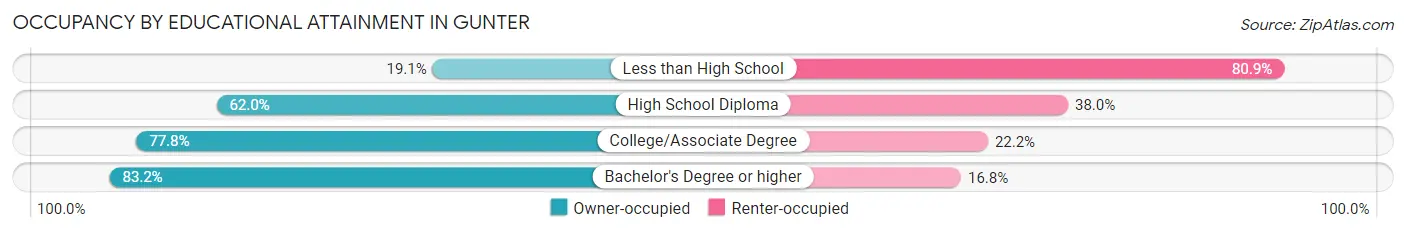
| Household Size | Owner-occupied | Renter-occupied |
| Less than High School | 13 (19.1%) | 55 (80.9%) |
| High School Diploma | 57 (62.0%) | 35 (38.0%) |
| College/Associate Degree | 144 (77.8%) | 41 (22.2%) |
| Bachelor's Degree or higher | 257 (83.2%) | 52 (16.8%) |
Occupancy by Age of Householder in Gunter
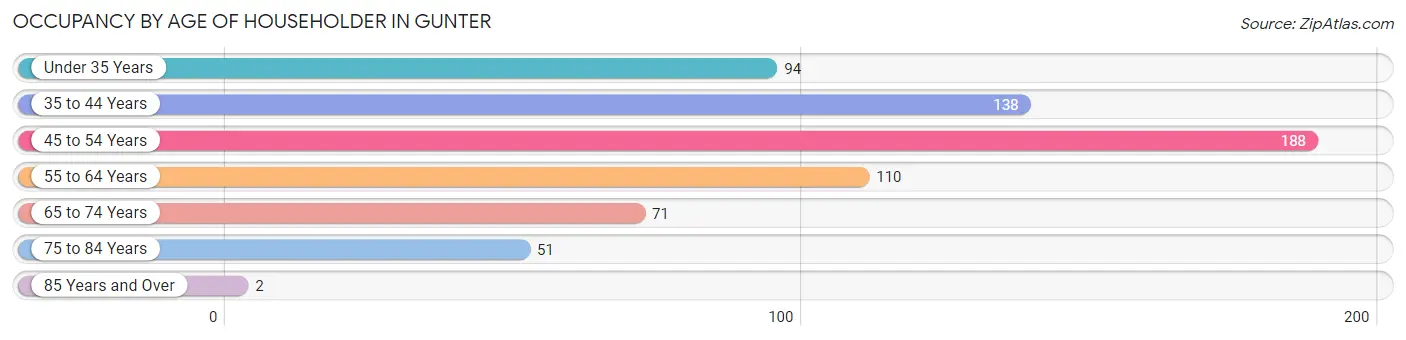
| Age Bracket | # Households | % Households |
| Under 35 Years | 94 | 14.4% |
| 35 to 44 Years | 138 | 21.1% |
| 45 to 54 Years | 188 | 28.7% |
| 55 to 64 Years | 110 | 16.8% |
| 65 to 74 Years | 71 | 10.9% |
| 75 to 84 Years | 51 | 7.8% |
| 85 Years and Over | 2 | 0.3% |
| Total | 654 | 100.0% |
Housing Finances in Gunter
Median Income by Occupancy in Gunter
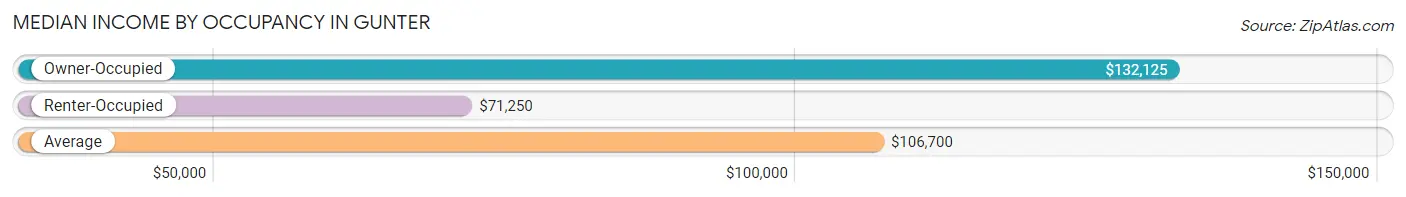
| Occupancy Type | # Households | Median Income |
| Owner-Occupied | 471 (72.0%) | $132,125 |
| Renter-Occupied | 183 (28.0%) | $71,250 |
| Average | 654 (100.0%) | $106,700 |
Occupancy by Householder Income Bracket in Gunter
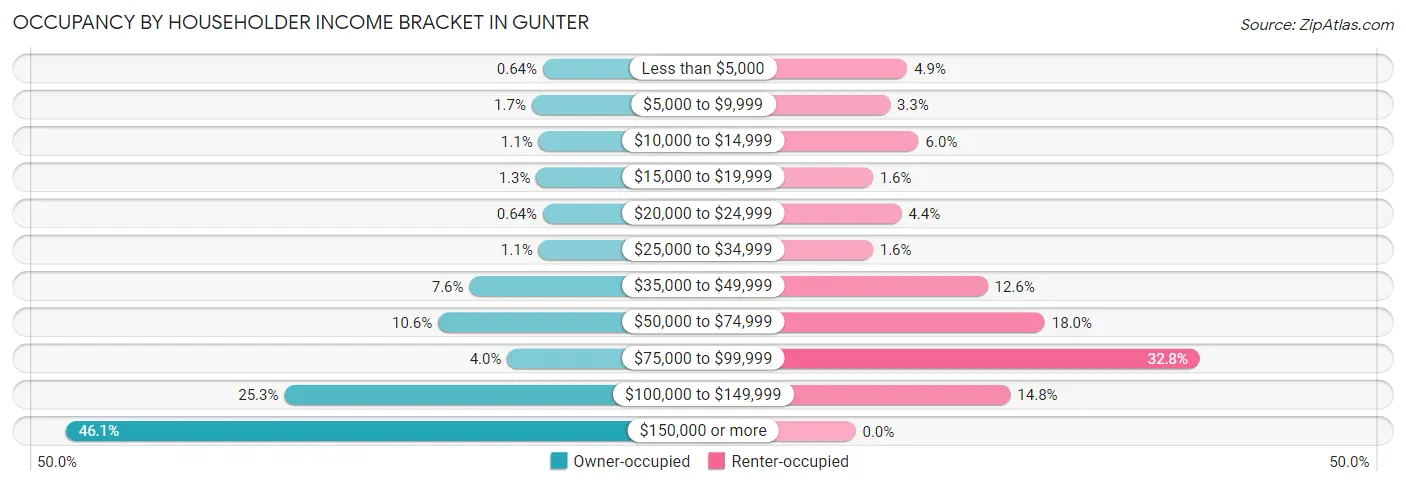
| Income Bracket | Owner-occupied | Renter-occupied |
| Less than $5,000 | 3 (0.6%) | 9 (4.9%) |
| $5,000 to $9,999 | 8 (1.7%) | 6 (3.3%) |
| $10,000 to $14,999 | 5 (1.1%) | 11 (6.0%) |
| $15,000 to $19,999 | 6 (1.3%) | 3 (1.6%) |
| $20,000 to $24,999 | 3 (0.6%) | 8 (4.4%) |
| $25,000 to $34,999 | 5 (1.1%) | 3 (1.6%) |
| $35,000 to $49,999 | 36 (7.6%) | 23 (12.6%) |
| $50,000 to $74,999 | 50 (10.6%) | 33 (18.0%) |
| $75,000 to $99,999 | 19 (4.0%) | 60 (32.8%) |
| $100,000 to $149,999 | 119 (25.3%) | 27 (14.7%) |
| $150,000 or more | 217 (46.1%) | 0 (0.0%) |
| Total | 471 (100.0%) | 183 (100.0%) |
Monthly Housing Cost Tiers in Gunter
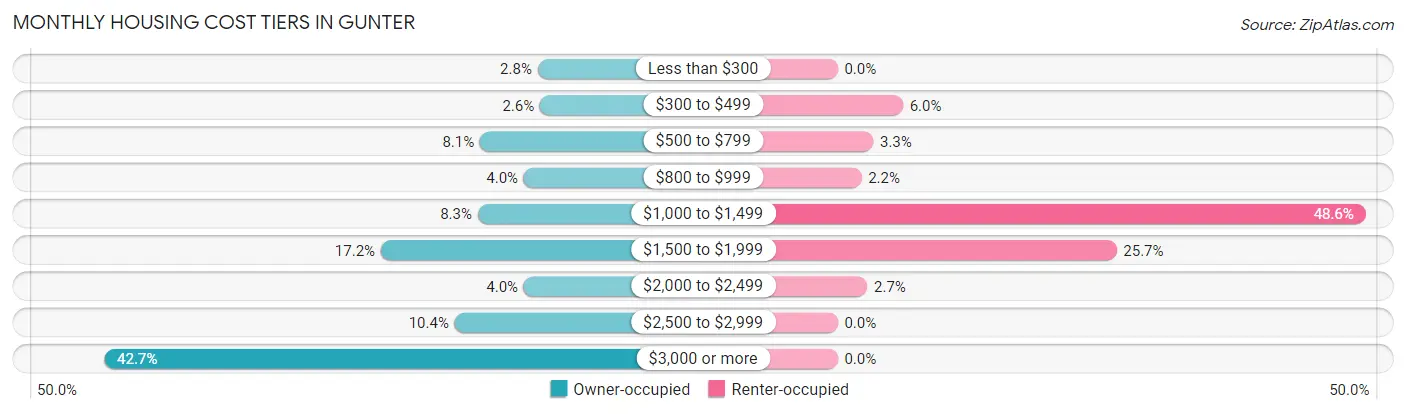
| Monthly Cost | Owner-occupied | Renter-occupied |
| Less than $300 | 13 (2.8%) | 0 (0.0%) |
| $300 to $499 | 12 (2.5%) | 11 (6.0%) |
| $500 to $799 | 38 (8.1%) | 6 (3.3%) |
| $800 to $999 | 19 (4.0%) | 4 (2.2%) |
| $1,000 to $1,499 | 39 (8.3%) | 89 (48.6%) |
| $1,500 to $1,999 | 81 (17.2%) | 47 (25.7%) |
| $2,000 to $2,499 | 19 (4.0%) | 5 (2.7%) |
| $2,500 to $2,999 | 49 (10.4%) | 0 (0.0%) |
| $3,000 or more | 201 (42.7%) | 0 (0.0%) |
| Total | 471 (100.0%) | 183 (100.0%) |
Physical Housing Characteristics in Gunter
Housing Structures in Gunter
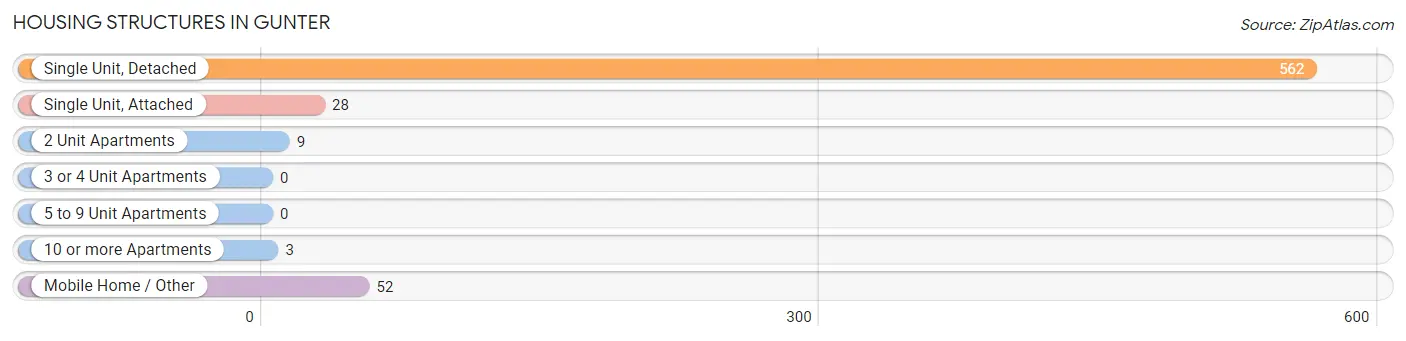
| Structure Type | # Housing Units | % Housing Units |
| Single Unit, Detached | 562 | 85.9% |
| Single Unit, Attached | 28 | 4.3% |
| 2 Unit Apartments | 9 | 1.4% |
| 3 or 4 Unit Apartments | 0 | 0.0% |
| 5 to 9 Unit Apartments | 0 | 0.0% |
| 10 or more Apartments | 3 | 0.5% |
| Mobile Home / Other | 52 | 8.0% |
| Total | 654 | 100.0% |
Housing Structures by Occupancy in Gunter
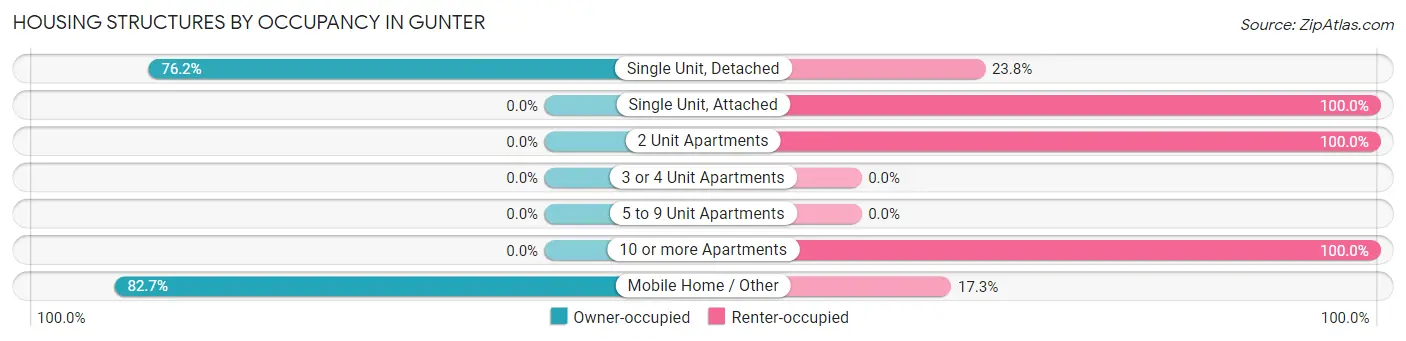
| Structure Type | Owner-occupied | Renter-occupied |
| Single Unit, Detached | 428 (76.2%) | 134 (23.8%) |
| Single Unit, Attached | 0 (0.0%) | 28 (100.0%) |
| 2 Unit Apartments | 0 (0.0%) | 9 (100.0%) |
| 3 or 4 Unit Apartments | 0 (0.0%) | 0 (0.0%) |
| 5 to 9 Unit Apartments | 0 (0.0%) | 0 (0.0%) |
| 10 or more Apartments | 0 (0.0%) | 3 (100.0%) |
| Mobile Home / Other | 43 (82.7%) | 9 (17.3%) |
| Total | 471 (72.0%) | 183 (28.0%) |
Housing Structures by Number of Rooms in Gunter
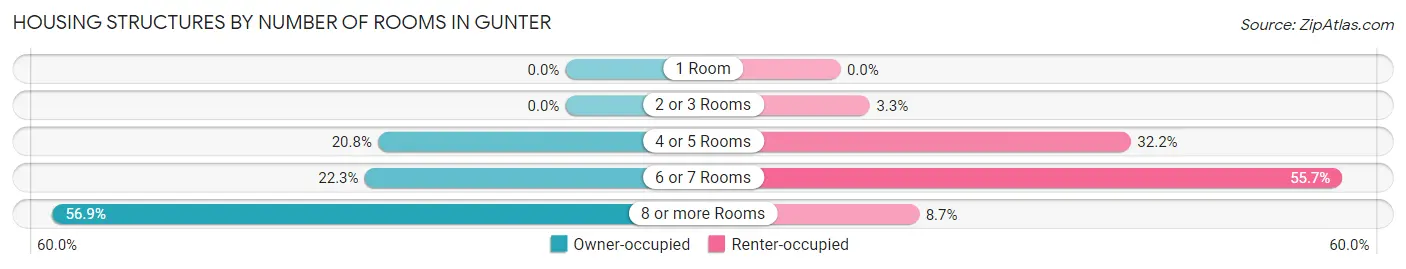
| Number of Rooms | Owner-occupied | Renter-occupied |
| 1 Room | 0 (0.0%) | 0 (0.0%) |
| 2 or 3 Rooms | 0 (0.0%) | 6 (3.3%) |
| 4 or 5 Rooms | 98 (20.8%) | 59 (32.2%) |
| 6 or 7 Rooms | 105 (22.3%) | 102 (55.7%) |
| 8 or more Rooms | 268 (56.9%) | 16 (8.7%) |
| Total | 471 (100.0%) | 183 (100.0%) |
Housing Structure by Heating Type in Gunter
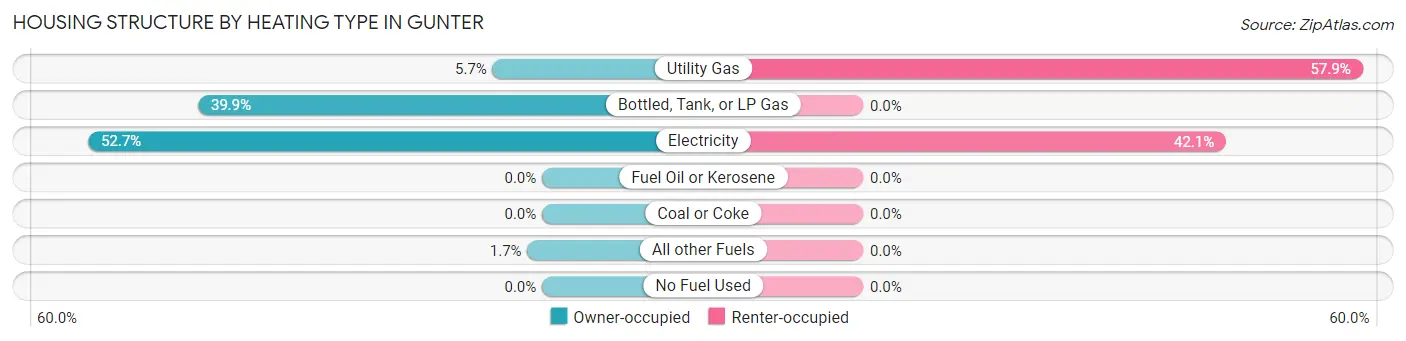
| Heating Type | Owner-occupied | Renter-occupied |
| Utility Gas | 27 (5.7%) | 106 (57.9%) |
| Bottled, Tank, or LP Gas | 188 (39.9%) | 0 (0.0%) |
| Electricity | 248 (52.6%) | 77 (42.1%) |
| Fuel Oil or Kerosene | 0 (0.0%) | 0 (0.0%) |
| Coal or Coke | 0 (0.0%) | 0 (0.0%) |
| All other Fuels | 8 (1.7%) | 0 (0.0%) |
| No Fuel Used | 0 (0.0%) | 0 (0.0%) |
| Total | 471 (100.0%) | 183 (100.0%) |
Household Vehicle Usage in Gunter
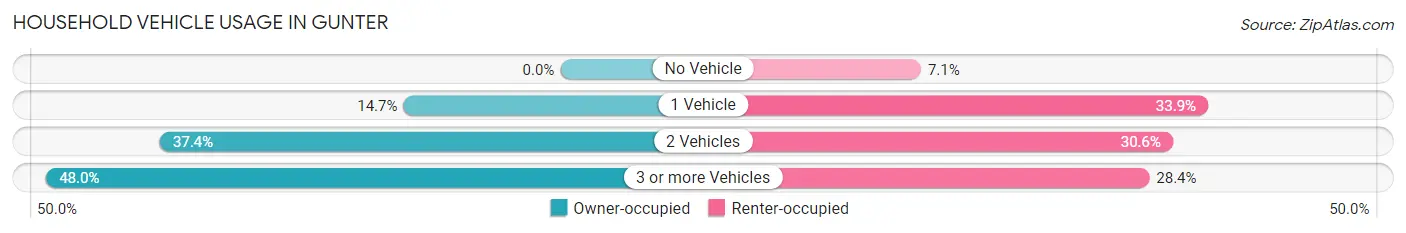
| Vehicles per Household | Owner-occupied | Renter-occupied |
| No Vehicle | 0 (0.0%) | 13 (7.1%) |
| 1 Vehicle | 69 (14.6%) | 62 (33.9%) |
| 2 Vehicles | 176 (37.4%) | 56 (30.6%) |
| 3 or more Vehicles | 226 (48.0%) | 52 (28.4%) |
| Total | 471 (100.0%) | 183 (100.0%) |
Real Estate & Mortgages in Gunter
Real Estate and Mortgage Overview in Gunter
| Characteristic | Without Mortgage | With Mortgage |
| Housing Units | 147 | 324 |
| Median Property Value | $326,900 | $488,100 |
| Median Household Income | $69,297 | $185 |
| Monthly Housing Costs | $950 | $188 |
| Real Estate Taxes | - | - |
Property Value by Mortgage Status in Gunter
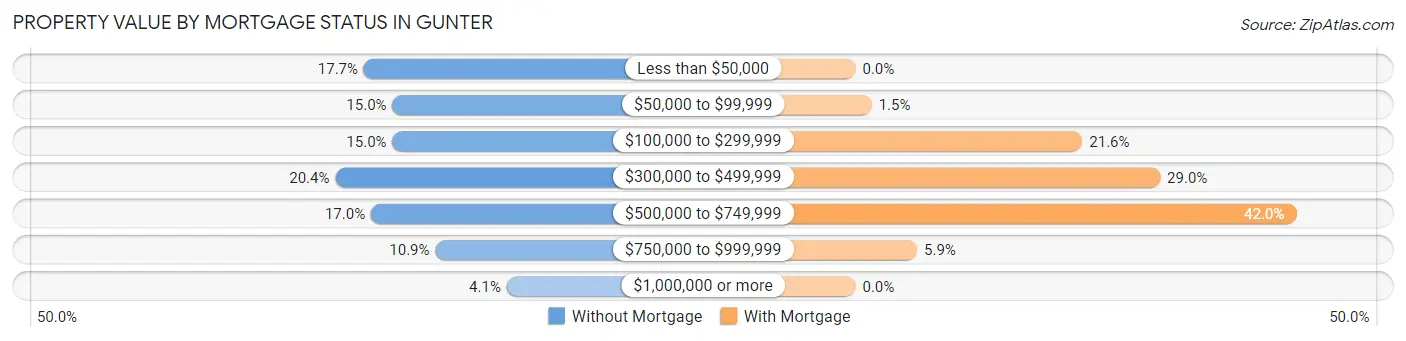
| Property Value | Without Mortgage | With Mortgage |
| Less than $50,000 | 26 (17.7%) | 0 (0.0%) |
| $50,000 to $99,999 | 22 (15.0%) | 5 (1.5%) |
| $100,000 to $299,999 | 22 (15.0%) | 70 (21.6%) |
| $300,000 to $499,999 | 30 (20.4%) | 94 (29.0%) |
| $500,000 to $749,999 | 25 (17.0%) | 136 (42.0%) |
| $750,000 to $999,999 | 16 (10.9%) | 19 (5.9%) |
| $1,000,000 or more | 6 (4.1%) | 0 (0.0%) |
| Total | 147 (100.0%) | 324 (100.0%) |
Household Income by Mortgage Status in Gunter
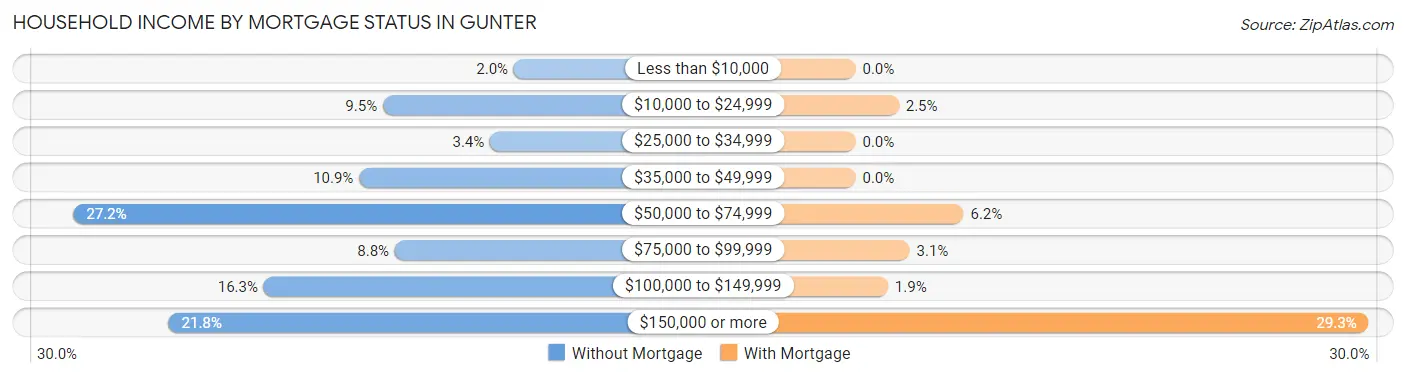
| Household Income | Without Mortgage | With Mortgage |
| Less than $10,000 | 3 (2.0%) | 0 (0.0%) |
| $10,000 to $24,999 | 14 (9.5%) | 8 (2.5%) |
| $25,000 to $34,999 | 5 (3.4%) | 0 (0.0%) |
| $35,000 to $49,999 | 16 (10.9%) | 0 (0.0%) |
| $50,000 to $74,999 | 40 (27.2%) | 20 (6.2%) |
| $75,000 to $99,999 | 13 (8.8%) | 10 (3.1%) |
| $100,000 to $149,999 | 24 (16.3%) | 6 (1.8%) |
| $150,000 or more | 32 (21.8%) | 95 (29.3%) |
| Total | 147 (100.0%) | 324 (100.0%) |
Property Value to Household Income Ratio in Gunter
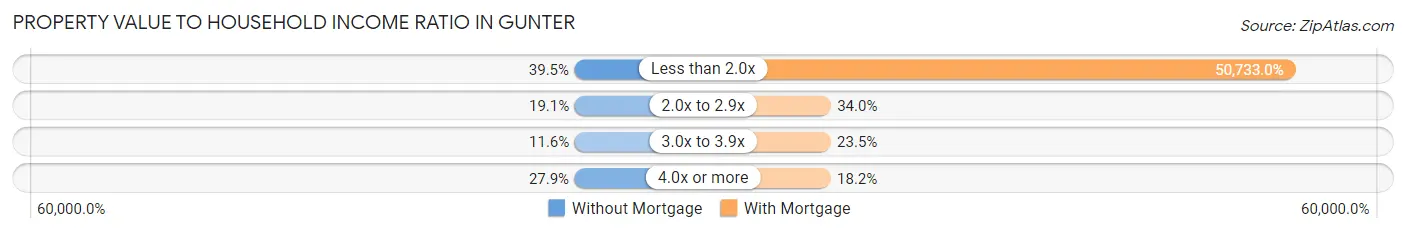
| Value-to-Income Ratio | Without Mortgage | With Mortgage |
| Less than 2.0x | 58 (39.5%) | 164,375 (50,733.0%) |
| 2.0x to 2.9x | 28 (19.1%) | 110 (34.0%) |
| 3.0x to 3.9x | 17 (11.6%) | 76 (23.5%) |
| 4.0x or more | 41 (27.9%) | 59 (18.2%) |
| Total | 147 (100.0%) | 324 (100.0%) |
Real Estate Taxes by Mortgage Status in Gunter
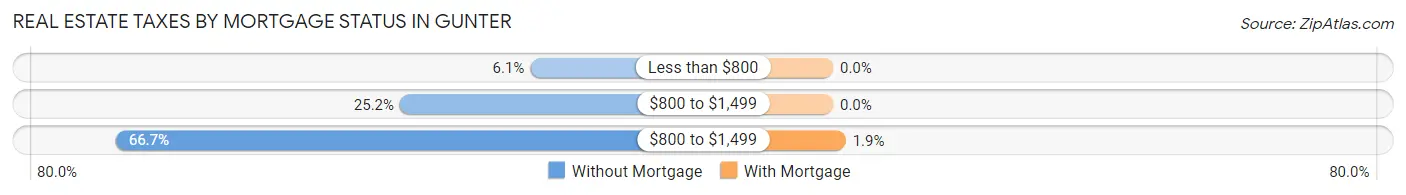
| Property Taxes | Without Mortgage | With Mortgage |
| Less than $800 | 9 (6.1%) | 0 (0.0%) |
| $800 to $1,499 | 37 (25.2%) | 0 (0.0%) |
| $800 to $1,499 | 98 (66.7%) | 6 (1.8%) |
| Total | 147 (100.0%) | 324 (100.0%) |
Health & Disability in Gunter
Health Insurance Coverage by Age in Gunter
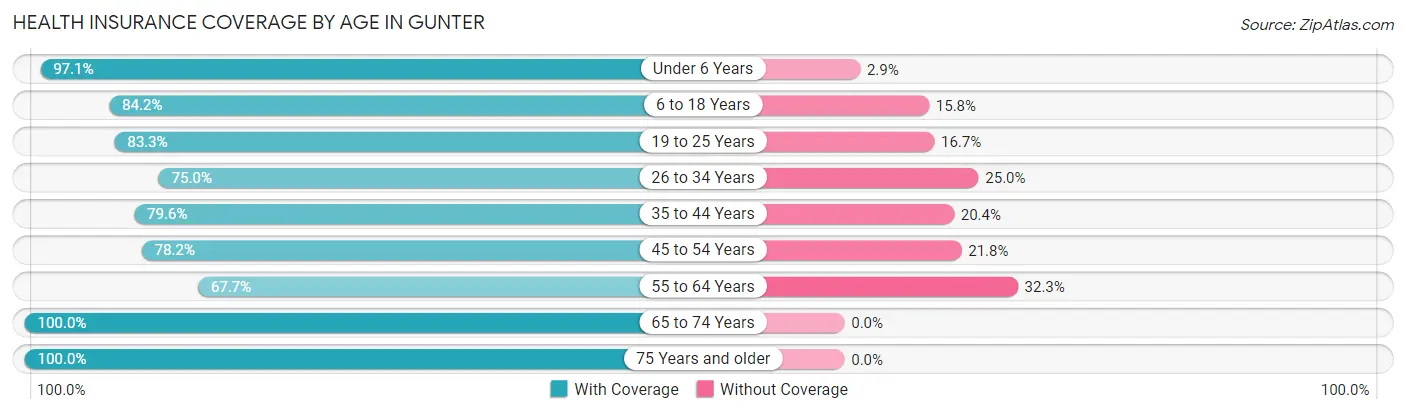
| Age Bracket | With Coverage | Without Coverage |
| Under 6 Years | 133 (97.1%) | 4 (2.9%) |
| 6 to 18 Years | 454 (84.2%) | 85 (15.8%) |
| 19 to 25 Years | 224 (83.3%) | 45 (16.7%) |
| 26 to 34 Years | 189 (75.0%) | 63 (25.0%) |
| 35 to 44 Years | 230 (79.6%) | 59 (20.4%) |
| 45 to 54 Years | 251 (78.2%) | 70 (21.8%) |
| 55 to 64 Years | 201 (67.7%) | 96 (32.3%) |
| 65 to 74 Years | 108 (100.0%) | 0 (0.0%) |
| 75 Years and older | 67 (100.0%) | 0 (0.0%) |
| Total | 1,857 (81.5%) | 422 (18.5%) |
Health Insurance Coverage by Citizenship Status in Gunter
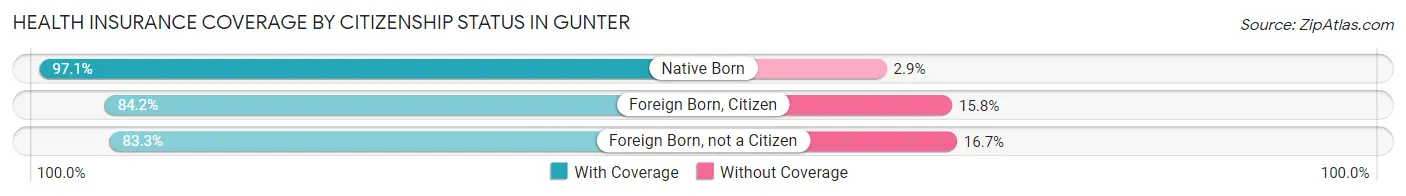
| Citizenship Status | With Coverage | Without Coverage |
| Native Born | 133 (97.1%) | 4 (2.9%) |
| Foreign Born, Citizen | 454 (84.2%) | 85 (15.8%) |
| Foreign Born, not a Citizen | 224 (83.3%) | 45 (16.7%) |
Health Insurance Coverage by Household Income in Gunter
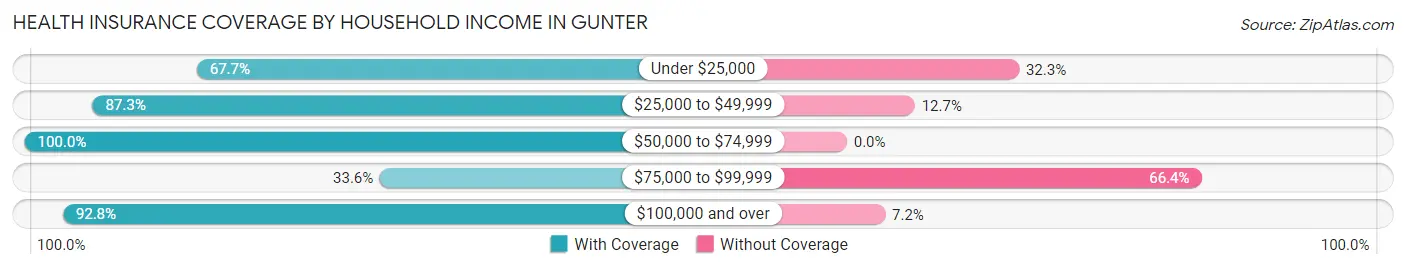
| Household Income | With Coverage | Without Coverage |
| Under $25,000 | 63 (67.7%) | 30 (32.3%) |
| $25,000 to $49,999 | 233 (87.3%) | 34 (12.7%) |
| $50,000 to $74,999 | 248 (100.0%) | 0 (0.0%) |
| $75,000 to $99,999 | 135 (33.6%) | 267 (66.4%) |
| $100,000 and over | 1,178 (92.8%) | 91 (7.2%) |
Public vs Private Health Insurance Coverage by Age in Gunter
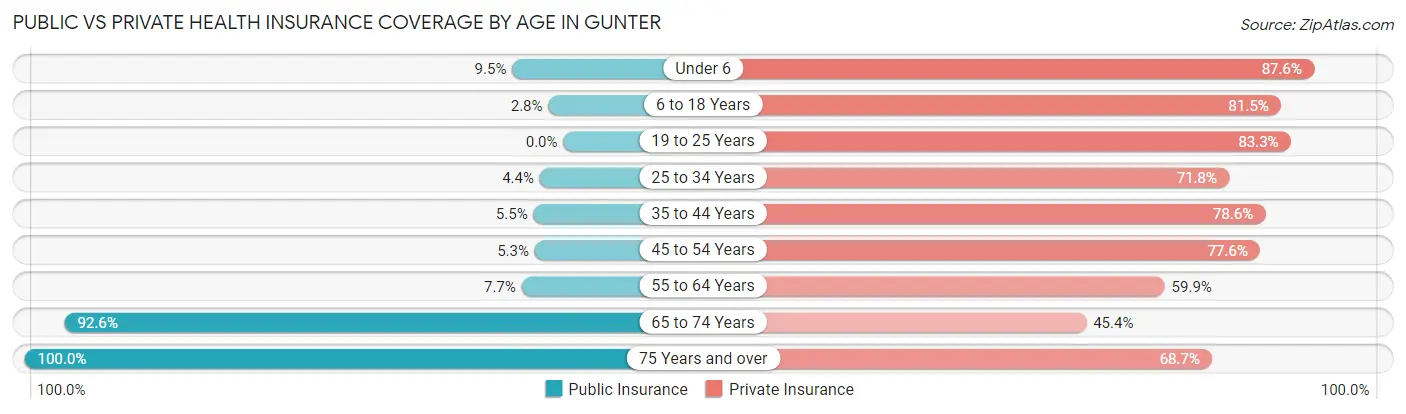
| Age Bracket | Public Insurance | Private Insurance |
| Under 6 | 13 (9.5%) | 120 (87.6%) |
| 6 to 18 Years | 15 (2.8%) | 439 (81.5%) |
| 19 to 25 Years | 0 (0.0%) | 224 (83.3%) |
| 25 to 34 Years | 11 (4.4%) | 181 (71.8%) |
| 35 to 44 Years | 16 (5.5%) | 227 (78.5%) |
| 45 to 54 Years | 17 (5.3%) | 249 (77.6%) |
| 55 to 64 Years | 23 (7.7%) | 178 (59.9%) |
| 65 to 74 Years | 100 (92.6%) | 49 (45.4%) |
| 75 Years and over | 67 (100.0%) | 46 (68.7%) |
| Total | 262 (11.5%) | 1,713 (75.2%) |
Disability Status by Sex by Age in Gunter
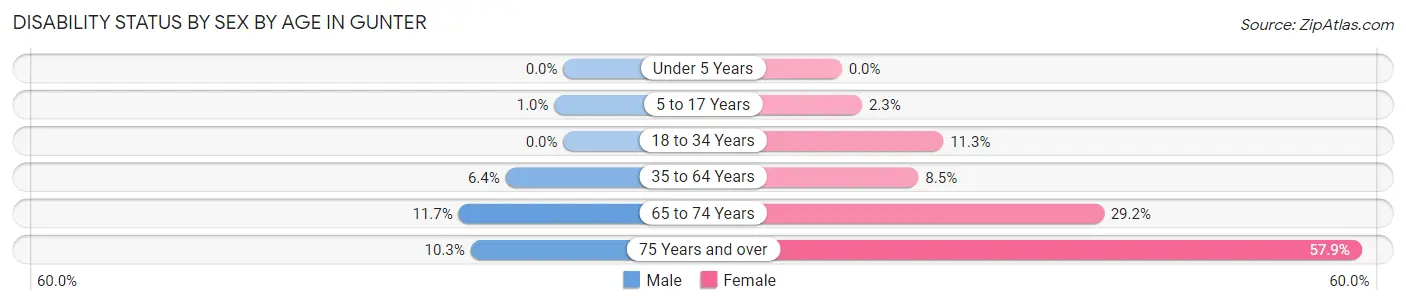
| Age Bracket | Male | Female |
| Under 5 Years | 0 (0.0%) | 0 (0.0%) |
| 5 to 17 Years | 2 (1.0%) | 7 (2.2%) |
| 18 to 34 Years | 0 (0.0%) | 33 (11.3%) |
| 35 to 64 Years | 29 (6.4%) | 39 (8.5%) |
| 65 to 74 Years | 7 (11.7%) | 14 (29.2%) |
| 75 Years and over | 3 (10.3%) | 22 (57.9%) |
Disability Class by Sex by Age in Gunter
Disability Class: Hearing Difficulty
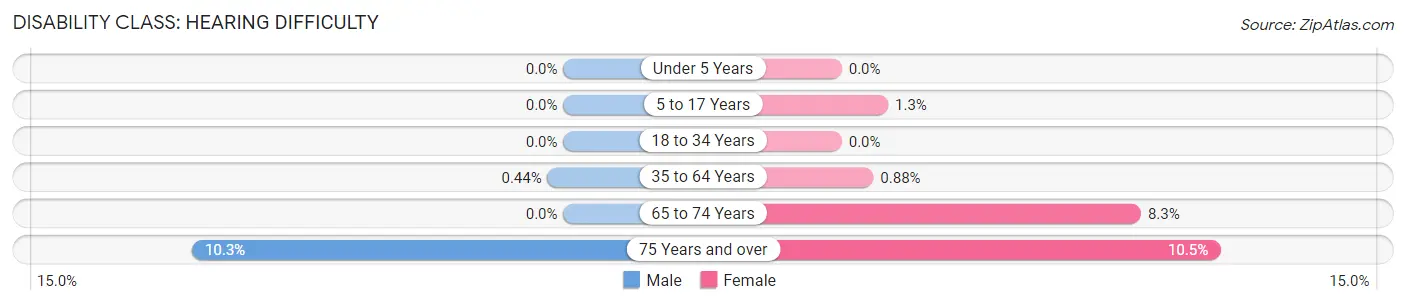
| Age Bracket | Male | Female |
| Under 5 Years | 0 (0.0%) | 0 (0.0%) |
| 5 to 17 Years | 0 (0.0%) | 4 (1.3%) |
| 18 to 34 Years | 0 (0.0%) | 0 (0.0%) |
| 35 to 64 Years | 2 (0.4%) | 4 (0.9%) |
| 65 to 74 Years | 0 (0.0%) | 4 (8.3%) |
| 75 Years and over | 3 (10.3%) | 4 (10.5%) |
Disability Class: Vision Difficulty
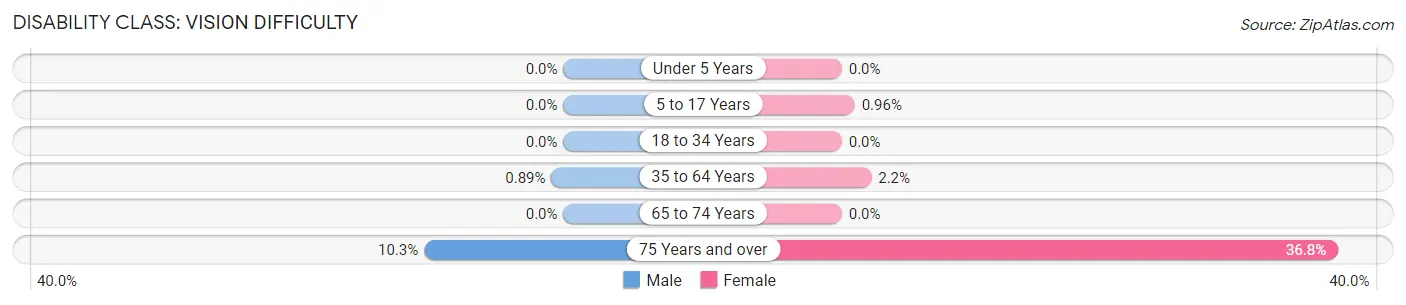
| Age Bracket | Male | Female |
| Under 5 Years | 0 (0.0%) | 0 (0.0%) |
| 5 to 17 Years | 0 (0.0%) | 3 (1.0%) |
| 18 to 34 Years | 0 (0.0%) | 0 (0.0%) |
| 35 to 64 Years | 4 (0.9%) | 10 (2.2%) |
| 65 to 74 Years | 0 (0.0%) | 0 (0.0%) |
| 75 Years and over | 3 (10.3%) | 14 (36.8%) |
Disability Class: Cognitive Difficulty
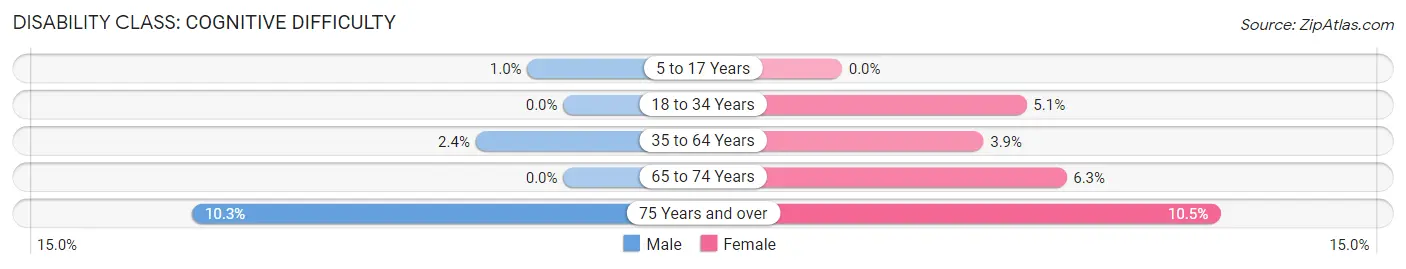
| Age Bracket | Male | Female |
| 5 to 17 Years | 2 (1.0%) | 0 (0.0%) |
| 18 to 34 Years | 0 (0.0%) | 15 (5.1%) |
| 35 to 64 Years | 11 (2.4%) | 18 (3.9%) |
| 65 to 74 Years | 0 (0.0%) | 3 (6.2%) |
| 75 Years and over | 3 (10.3%) | 4 (10.5%) |
Disability Class: Ambulatory Difficulty
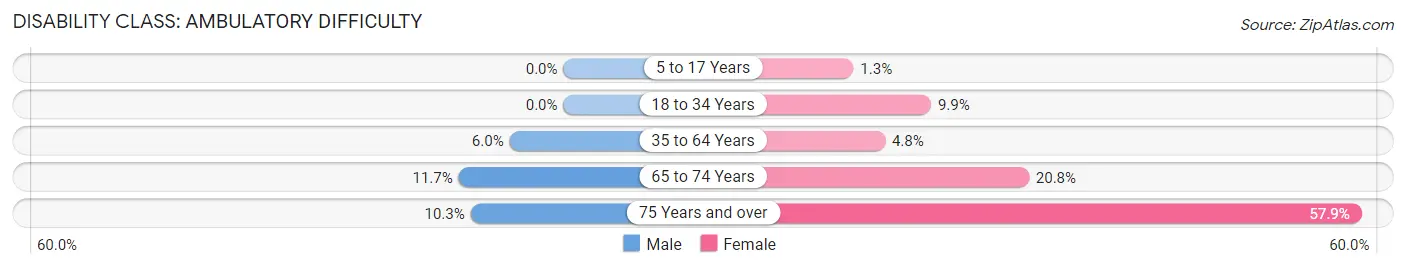
| Age Bracket | Male | Female |
| 5 to 17 Years | 0 (0.0%) | 4 (1.3%) |
| 18 to 34 Years | 0 (0.0%) | 29 (9.9%) |
| 35 to 64 Years | 27 (6.0%) | 22 (4.8%) |
| 65 to 74 Years | 7 (11.7%) | 10 (20.8%) |
| 75 Years and over | 3 (10.3%) | 22 (57.9%) |
Disability Class: Self-Care Difficulty
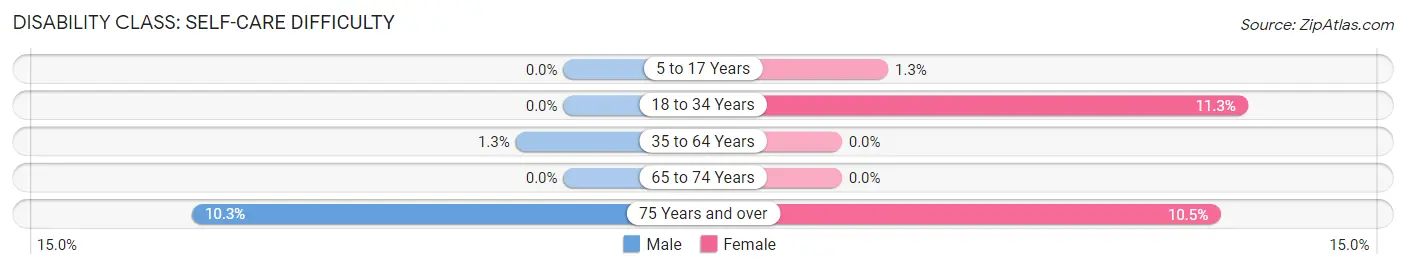
| Age Bracket | Male | Female |
| 5 to 17 Years | 0 (0.0%) | 4 (1.3%) |
| 18 to 34 Years | 0 (0.0%) | 33 (11.3%) |
| 35 to 64 Years | 6 (1.3%) | 0 (0.0%) |
| 65 to 74 Years | 0 (0.0%) | 0 (0.0%) |
| 75 Years and over | 3 (10.3%) | 4 (10.5%) |
Technology Access in Gunter
Computing Device Access in Gunter
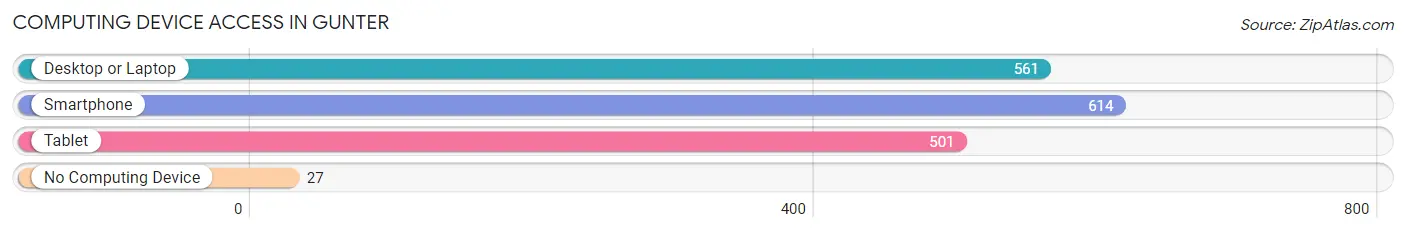
| Device Type | # Households | % Households |
| Desktop or Laptop | 561 | 85.8% |
| Smartphone | 614 | 93.9% |
| Tablet | 501 | 76.6% |
| No Computing Device | 27 | 4.1% |
| Total | 654 | 100.0% |
Internet Access in Gunter
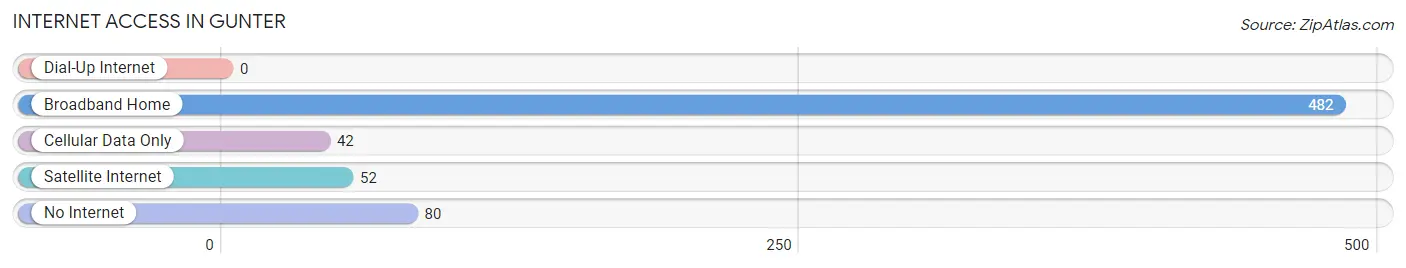
| Internet Type | # Households | % Households |
| Dial-Up Internet | 0 | 0.0% |
| Broadband Home | 482 | 73.7% |
| Cellular Data Only | 42 | 6.4% |
| Satellite Internet | 52 | 8.0% |
| No Internet | 80 | 12.2% |
| Total | 654 | 100.0% |
Gunter Summary
Introduction
Gunter, Texas is a small town located in Grayson County, Texas. It is situated about 60 miles north of Dallas and is part of the Sherman-Denison Metropolitan Statistical Area. The town was founded in 1887 and has a population of 1,541 as of the 2010 census. Gunter is known for its rural charm and is a popular destination for tourists and outdoor enthusiasts.
History
The town of Gunter was founded in 1887 by a group of settlers from Missouri. The town was named after a local rancher, William Gunter, who owned a large amount of land in the area. The town was originally a farming community and the main crops grown were cotton, corn, and wheat.
In the early 1900s, the town began to grow and the population increased. The town was incorporated in 1909 and the first mayor was elected in 1910. The town continued to grow and by the 1950s, it had become a popular tourist destination.
Geography
Gunter is located in Grayson County, Texas. It is situated about 60 miles north of Dallas and is part of the Sherman-Denison Metropolitan Statistical Area. The town is located on the banks of the Red River and is surrounded by rolling hills and farmland. The climate in Gunter is mild and the average temperature is around 70 degrees Fahrenheit.
Economy
The economy of Gunter is largely based on agriculture and tourism. The town is home to several farms and ranches that produce a variety of crops, including cotton, corn, and wheat. The town is also a popular destination for tourists and outdoor enthusiasts. There are several parks and recreational areas in the area, including Lake Texoma, which is a popular spot for fishing and boating.
Demographics
As of the 2010 census, the population of Gunter was 1,541. The racial makeup of the town was 94.3% White, 0.7% African American, 0.3% Native American, 0.2% Asian, 0.1% Pacific Islander, 2.7% from other races, and 1.9% from two or more races. The median household income was $45,938 and the median family income was $50,938.
Conclusion
Gunter, Texas is a small town located in Grayson County, Texas. It is situated about 60 miles north of Dallas and is part of the Sherman-Denison Metropolitan Statistical Area. The town was founded in 1887 and has a population of 1,541 as of the 2010 census. Gunter is known for its rural charm and is a popular destination for tourists and outdoor enthusiasts. The economy of Gunter is largely based on agriculture and tourism. The town is home to several farms and ranches that produce a variety of crops, including cotton, corn, and wheat. The town is also a popular destination for tourists and outdoor enthusiasts. The racial makeup of the town was 94.3% White, 0.7% African American, 0.3% Native American, 0.2% Asian, 0.1% Pacific Islander, 2.7% from other races, and 1.9% from two or more races. The median household income was $45,938 and the median family income was $50,938. Gunter is a charming town with a rich history and a vibrant economy.
Common Questions
What is the Total Population of Gunter?
Total Population of Gunter is 2,279.
What is the Total Male Population of Gunter?
Total Male Population of Gunter is 1,104.
What is the Total Female Population of Gunter?
Total Female Population of Gunter is 1,175.
What is the Ratio of Males per 100 Females in Gunter?
There are 93.96 Males per 100 Females in Gunter.
What is the Ratio of Females per 100 Males in Gunter?
There are 106.43 Females per 100 Males in Gunter.
What is the Median Population Age in Gunter?
Median Population Age in Gunter is 33.6 Years.
What is the Average Family Size in Gunter
Average Family Size in Gunter is 3.8 People.
What is the Average Household Size in Gunter
Average Household Size in Gunter is 3.5 People.
What is Per Capita Income in Gunter?
Per Capita income in Gunter is $37,947.
What is the Median Family Income in Gunter?
Median Family Income in Gunter is $116,034.
What is the Median Household income in Gunter?
Median Household Income in Gunter is $106,700.
What is Income or Wage Gap in Gunter?
Income or Wage Gap in Gunter is 46.1%.
Women in Gunter earn 53.9 cents for every dollar earned by a man.
What is Inequality or Gini Index in Gunter?
Inequality or Gini Index in Gunter is 0.41.
How Large is the Labor Force in Gunter?
There are 1,217 People in the Labor Forcein in Gunter.
What is the Percentage of People in the Labor Force in Gunter?
67.0% of People are in the Labor Force in Gunter.
What is the Unemployment Rate in Gunter?
Unemployment Rate in Gunter is 4.6%.