Garden City, TX
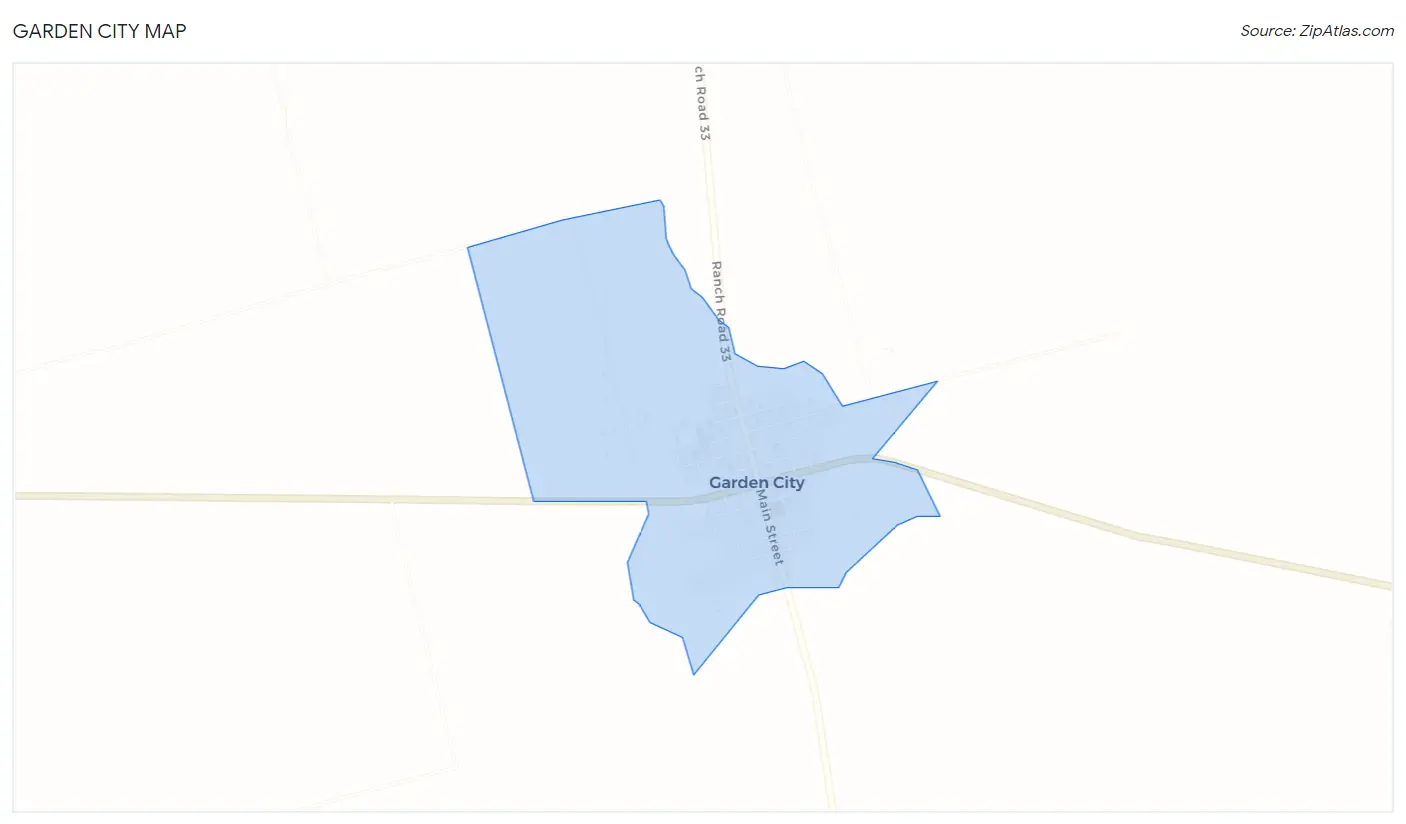
Garden City Map
Garden City Overview
214
TOTAL POPULATION
131
MALE POPULATION
83
FEMALE POPULATION
157.83
MALES / 100 FEMALES
63.36
FEMALES / 100 MALES
35.8
MEDIAN AGE
3.3
AVG FAMILY SIZE
3.3
AVG HOUSEHOLD SIZE
$55,466
PER CAPITA INCOME
$134,659
AVG FAMILY INCOME
$134,659
AVG HOUSEHOLD INCOME
93.8%
WAGE / INCOME GAP [ % ]
6.2¢/ $1
WAGE / INCOME GAP [ $ ]
0.28
INEQUALITY / GINI INDEX
99
LABOR FORCE [ PEOPLE ]
55.0%
PERCENT IN LABOR FORCE
Garden City Zip Codes
Garden City Area Codes
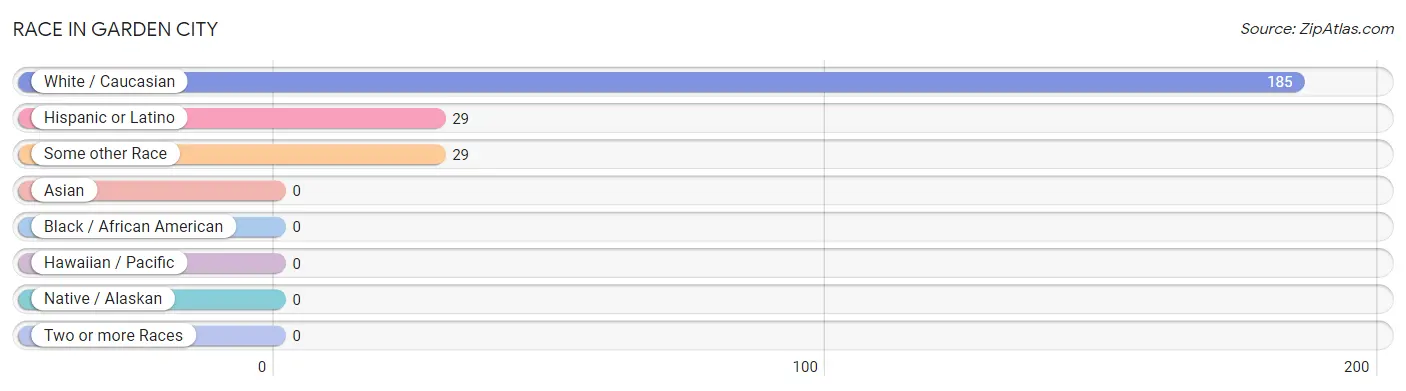
Race in Garden City
The most populous races in Garden City are White / Caucasian (185 | 86.5%), Hispanic or Latino (29 | 13.6%), and Some other Race (29 | 13.6%).
| Race | # Population | % Population |
| Asian | 0 | 0.0% |
| Black / African American | 0 | 0.0% |
| Hawaiian / Pacific | 0 | 0.0% |
| Hispanic or Latino | 29 | 13.6% |
| Native / Alaskan | 0 | 0.0% |
| White / Caucasian | 185 | 86.5% |
| Two or more Races | 0 | 0.0% |
| Some other Race | 29 | 13.6% |
| Total | 214 | 100.0% |
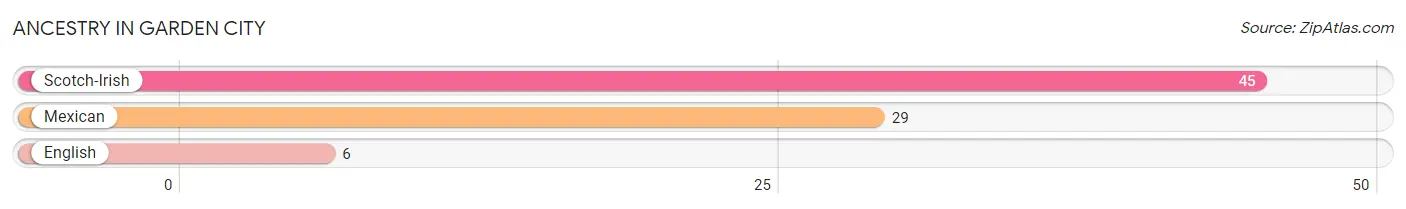
Ancestry in Garden City
The most populous ancestries reported in Garden City are Scotch-Irish (45 | 21.0%), Mexican (29 | 13.6%), and English (6 | 2.8%), together accounting for 37.4% of all Garden City residents.
| Ancestry | # Population | % Population |
| English | 6 | 2.8% |
| Mexican | 29 | 13.6% |
| Scotch-Irish | 45 | 21.0% | View All 3 Rows |
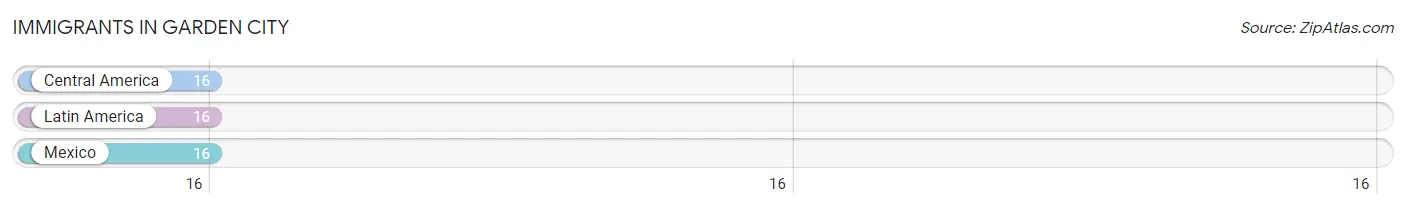
Immigrants in Garden City
The most numerous immigrant groups reported in Garden City came from Central America (16 | 7.5%), Latin America (16 | 7.5%), and Mexico (16 | 7.5%), together accounting for 22.4% of all Garden City residents.
| Immigration Origin | # Population | % Population |
| Central America | 16 | 7.5% |
| Latin America | 16 | 7.5% |
| Mexico | 16 | 7.5% | View All 3 Rows |
Sex and Age in Garden City
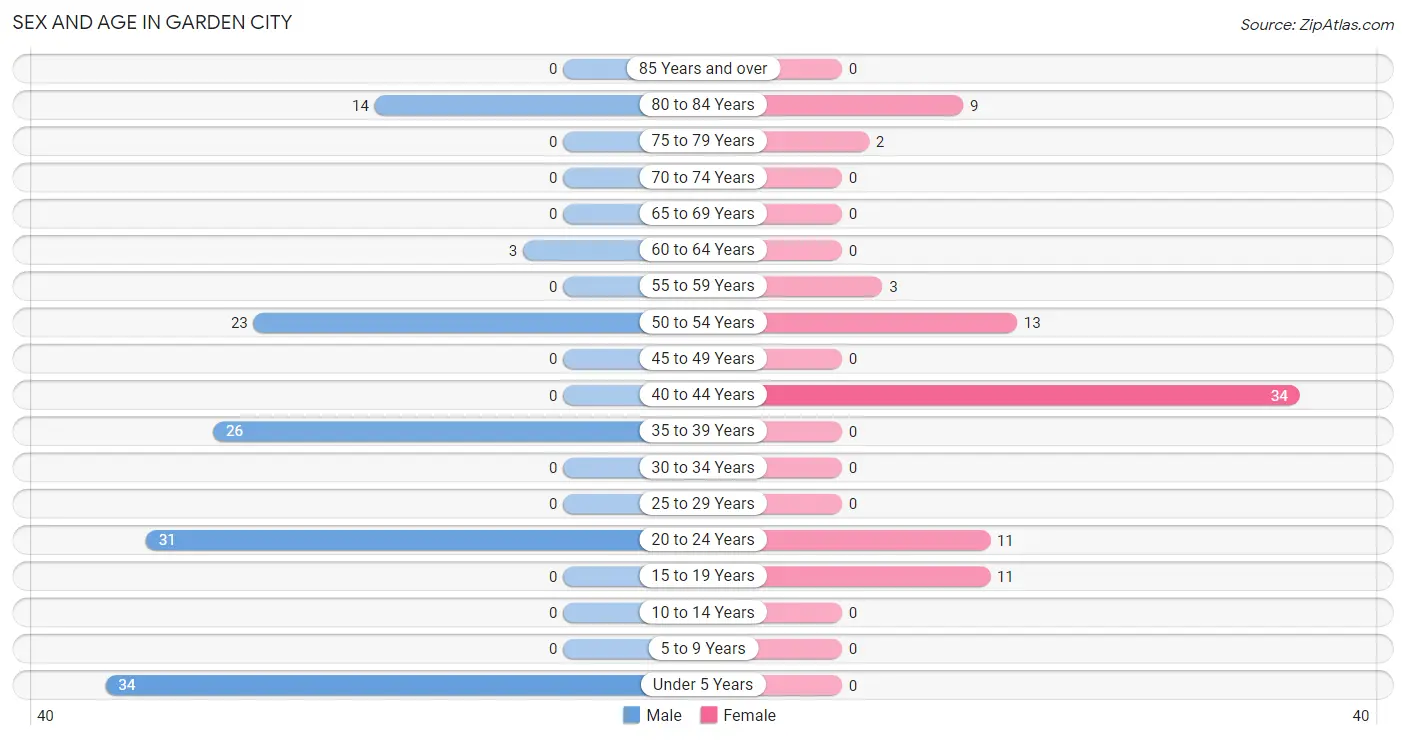
Sex and Age in Garden City
The most populous age groups in Garden City are Under 5 Years (34 | 26.0%) for men and 40 to 44 Years (34 | 41.0%) for women.
| Age Bracket | Male | Female |
| Under 5 Years | 34 (26.0%) | 0 (0.0%) |
| 5 to 9 Years | 0 (0.0%) | 0 (0.0%) |
| 10 to 14 Years | 0 (0.0%) | 0 (0.0%) |
| 15 to 19 Years | 0 (0.0%) | 11 (13.3%) |
| 20 to 24 Years | 31 (23.7%) | 11 (13.3%) |
| 25 to 29 Years | 0 (0.0%) | 0 (0.0%) |
| 30 to 34 Years | 0 (0.0%) | 0 (0.0%) |
| 35 to 39 Years | 26 (19.9%) | 0 (0.0%) |
| 40 to 44 Years | 0 (0.0%) | 34 (41.0%) |
| 45 to 49 Years | 0 (0.0%) | 0 (0.0%) |
| 50 to 54 Years | 23 (17.6%) | 13 (15.7%) |
| 55 to 59 Years | 0 (0.0%) | 3 (3.6%) |
| 60 to 64 Years | 3 (2.3%) | 0 (0.0%) |
| 65 to 69 Years | 0 (0.0%) | 0 (0.0%) |
| 70 to 74 Years | 0 (0.0%) | 0 (0.0%) |
| 75 to 79 Years | 0 (0.0%) | 2 (2.4%) |
| 80 to 84 Years | 14 (10.7%) | 9 (10.8%) |
| 85 Years and over | 0 (0.0%) | 0 (0.0%) |
| Total | 131 (100.0%) | 83 (100.0%) |
Families and Households in Garden City
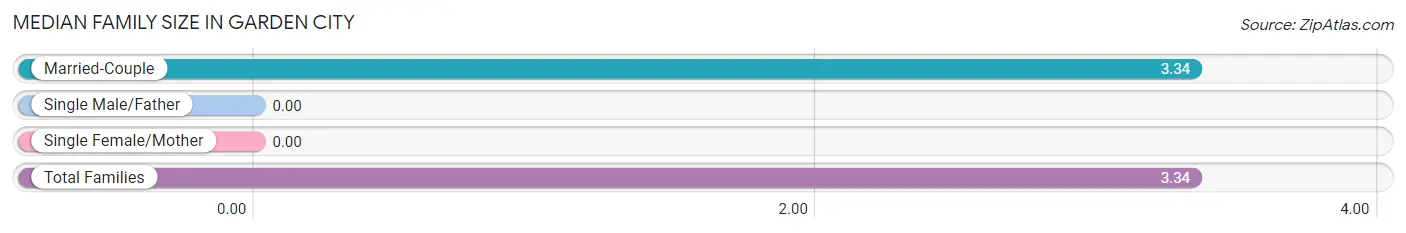
Median Family Size in Garden City
| Family Type | # Families | Family Size |
| Married-Couple | 64 (100.0%) | 3.34 |
| Single Male/Father | 0 (0.0%) | - |
| Single Female/Mother | 0 (0.0%) | - |
| Total Families | 64 (100.0%) | 3.34 |
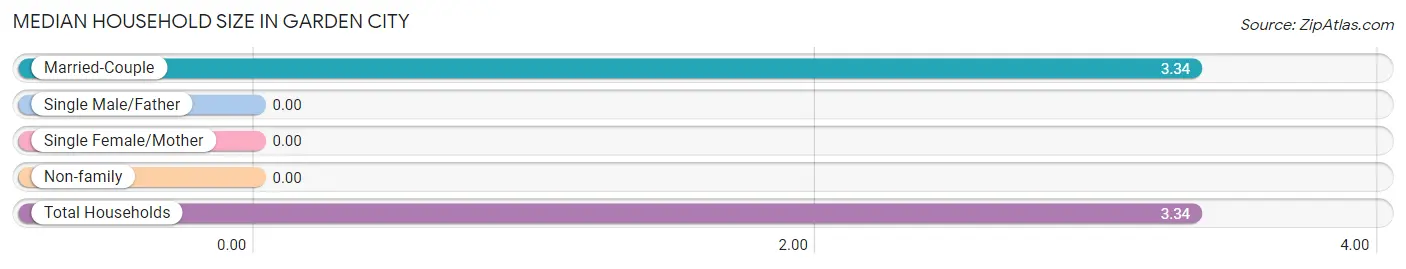
Median Household Size in Garden City
| Household Type | # Households | Household Size |
| Married-Couple | 64 (100.0%) | 3.34 |
| Single Male/Father | 0 (0.0%) | - |
| Single Female/Mother | 0 (0.0%) | - |
| Non-family | 0 (0.0%) | - |
| Total Households | 64 (100.0%) | 3.34 |
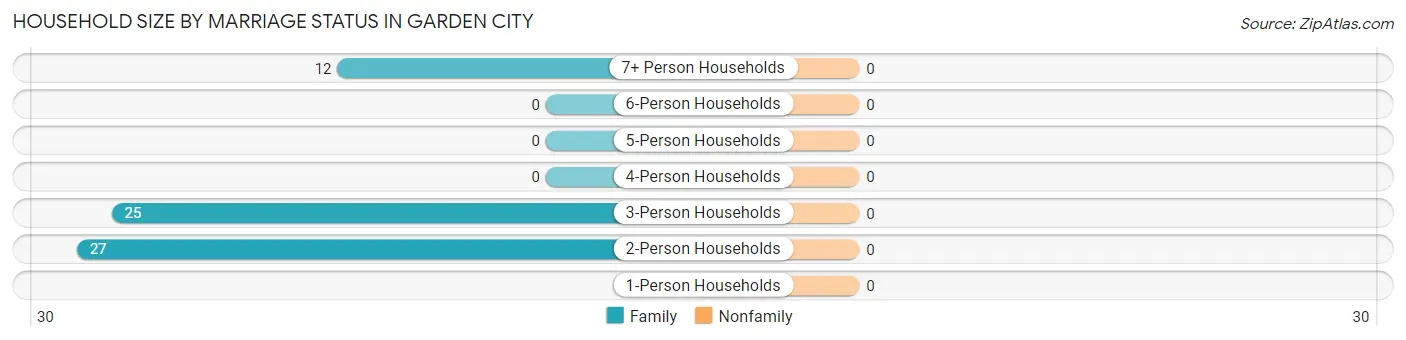
Household Size by Marriage Status in Garden City
| Household Size | Family Households | Nonfamily Households |
| 1-Person Households | - | 0 (0.0%) |
| 2-Person Households | 27 (42.2%) | 0 (0.0%) |
| 3-Person Households | 25 (39.1%) | 0 (0.0%) |
| 4-Person Households | 0 (0.0%) | 0 (0.0%) |
| 5-Person Households | 0 (0.0%) | 0 (0.0%) |
| 6-Person Households | 0 (0.0%) | 0 (0.0%) |
| 7+ Person Households | 12 (18.8%) | 0 (0.0%) |
| Total | 64 (100.0%) | 0 (0.0%) |
Female Fertility in Garden City
Fertility by Age in Garden City
| Age Bracket | Women with Births | Births / 1,000 Women |
| 15 to 19 years | 0 (0.0%) | 0.0 |
| 20 to 34 years | 0 (0.0%) | 0.0 |
| 35 to 50 years | 0 (0.0%) | 0.0 |
| Total | 0 (0.0%) | 0.0 |
Fertility by Age by Marriage Status in Garden City
| Age Bracket | Married | Unmarried |
| 15 to 19 years | 0 (0.0%) | 0 (0.0%) |
| 20 to 34 years | 0 (0.0%) | 0 (0.0%) |
| 35 to 50 years | 0 (0.0%) | 0 (0.0%) |
| Total | 0 (0.0%) | 0 (0.0%) |
Fertility by Education in Garden City
| Educational Attainment | Women with Births | Births / 1,000 Women |
| Less than High School | 0 (0.0%) | 0.0 |
| High School Diploma | 0 (0.0%) | 0.0 |
| College or Associate's Degree | 0 (0.0%) | 0.0 |
| Bachelor's Degree | 0 (0.0%) | 0.0 |
| Graduate Degree | 0 (0.0%) | 0.0 |
| Total | 0 (0.0%) | 0.0 |
Fertility by Education by Marriage Status in Garden City
| Educational Attainment | Married | Unmarried |
| Less than High School | 0 (0.0%) | 0 (0.0%) |
| High School Diploma | 0 (0.0%) | 0 (0.0%) |
| College or Associate's Degree | 0 (0.0%) | 0 (0.0%) |
| Bachelor's Degree | 0 (0.0%) | 0 (0.0%) |
| Graduate Degree | 0 (0.0%) | 0 (0.0%) |
| Total | 0 (0.0%) | 0 (0.0%) |
Income in Garden City
Income Overview in Garden City
Per Capita Income in Garden City is $55,466, while median incomes of families and households are $134,659 and $134,659 respectively.
| Characteristic | Number | Measure |
| Per Capita Income | 214 | $55,466 |
| Median Family Income | 64 | $134,659 |
| Mean Family Income | 64 | $186,492 |
| Median Household Income | 64 | $134,659 |
| Mean Household Income | 64 | $186,492 |
| Income Deficit | 64 | $0 |
| Wage / Income Gap (%) | 214 | 93.76% |
| Wage / Income Gap ($) | 214 | 6.24¢ per $1 |
| Gini / Inequality Index | 214 | 0.28 |
Earnings by Sex in Garden City
Average Earnings in Garden City are $39,471, $40,078 for men and $2,499 for women, a difference of 93.8%.
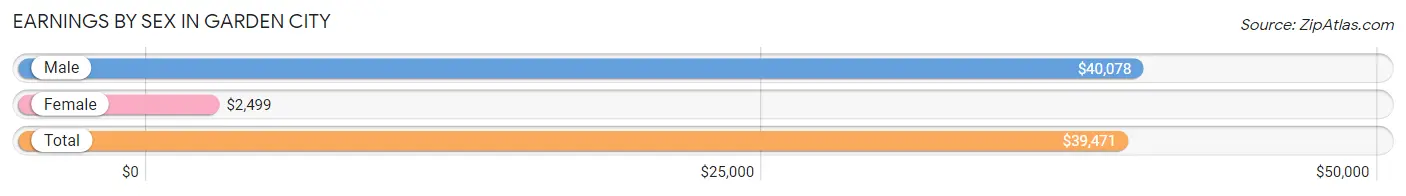
| Sex | Number | Average Earnings |
| Male | 83 (68.6%) | $40,078 |
| Female | 38 (31.4%) | $2,499 |
| Total | 121 (100.0%) | $39,471 |
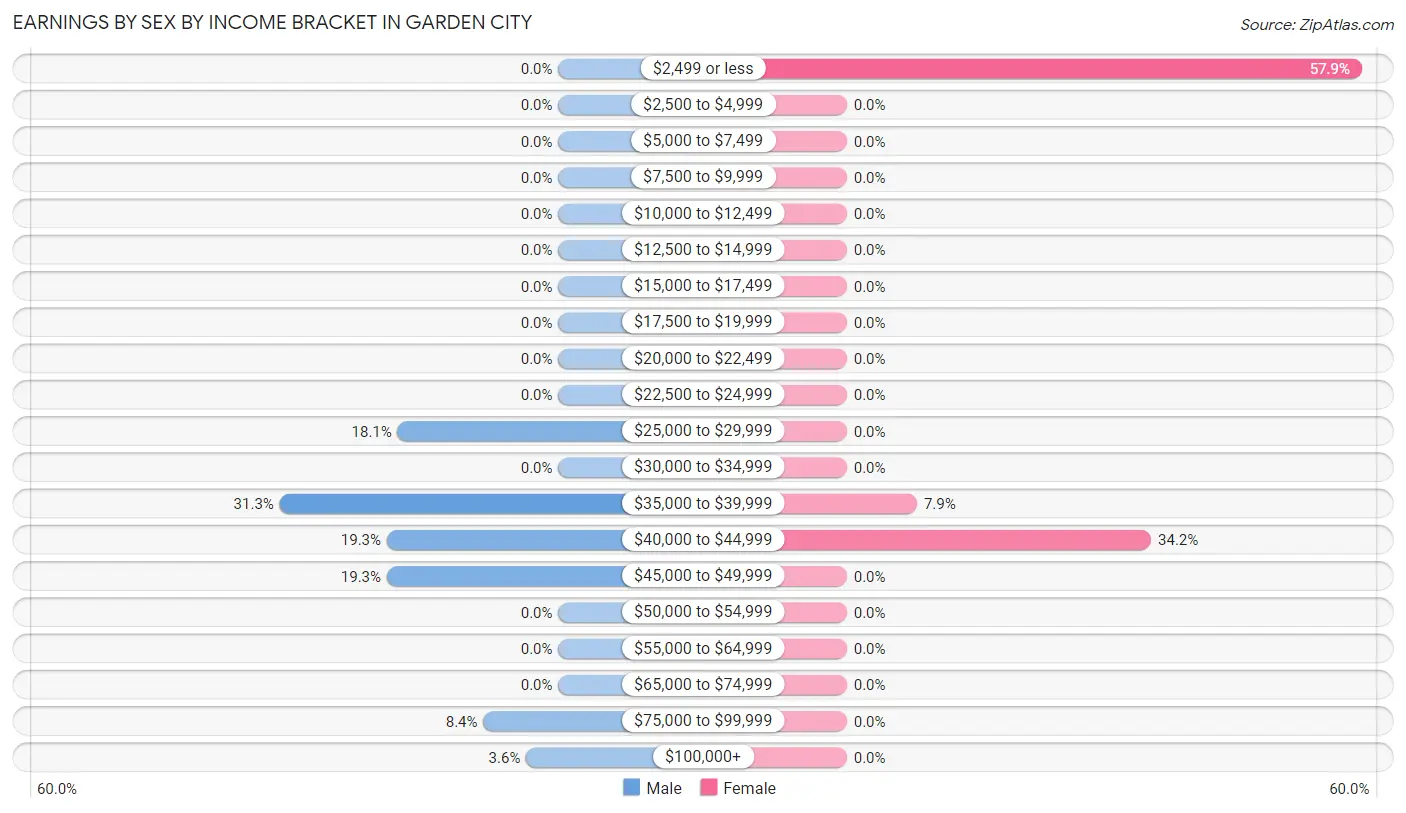
Earnings by Sex by Income Bracket in Garden City
The most common earnings brackets in Garden City are $35,000 to $39,999 for men (26 | 31.3%) and $2,499 or less for women (22 | 57.9%).
| Income | Male | Female |
| $2,499 or less | 0 (0.0%) | 22 (57.9%) |
| $2,500 to $4,999 | 0 (0.0%) | 0 (0.0%) |
| $5,000 to $7,499 | 0 (0.0%) | 0 (0.0%) |
| $7,500 to $9,999 | 0 (0.0%) | 0 (0.0%) |
| $10,000 to $12,499 | 0 (0.0%) | 0 (0.0%) |
| $12,500 to $14,999 | 0 (0.0%) | 0 (0.0%) |
| $15,000 to $17,499 | 0 (0.0%) | 0 (0.0%) |
| $17,500 to $19,999 | 0 (0.0%) | 0 (0.0%) |
| $20,000 to $22,499 | 0 (0.0%) | 0 (0.0%) |
| $22,500 to $24,999 | 0 (0.0%) | 0 (0.0%) |
| $25,000 to $29,999 | 15 (18.1%) | 0 (0.0%) |
| $30,000 to $34,999 | 0 (0.0%) | 0 (0.0%) |
| $35,000 to $39,999 | 26 (31.3%) | 3 (7.9%) |
| $40,000 to $44,999 | 16 (19.3%) | 13 (34.2%) |
| $45,000 to $49,999 | 16 (19.3%) | 0 (0.0%) |
| $50,000 to $54,999 | 0 (0.0%) | 0 (0.0%) |
| $55,000 to $64,999 | 0 (0.0%) | 0 (0.0%) |
| $65,000 to $74,999 | 0 (0.0%) | 0 (0.0%) |
| $75,000 to $99,999 | 7 (8.4%) | 0 (0.0%) |
| $100,000+ | 3 (3.6%) | 0 (0.0%) |
| Total | 83 (100.0%) | 38 (100.0%) |
Earnings by Sex by Educational Attainment in Garden City
| Educational Attainment | Male Income | Female Income |
| Less than High School | - | - |
| High School Diploma | - | - |
| College or Associate's Degree | - | - |
| Bachelor's Degree | - | - |
| Graduate Degree | - | - |
| Total | $40,000 | $2,499 |
Family Income in Garden City
Family Income Brackets in Garden City
According to the Garden City family income data, there are 22 families falling into the $100,000 to $149,999 income range, which is the most common income bracket and makes up 34.4% of all families.
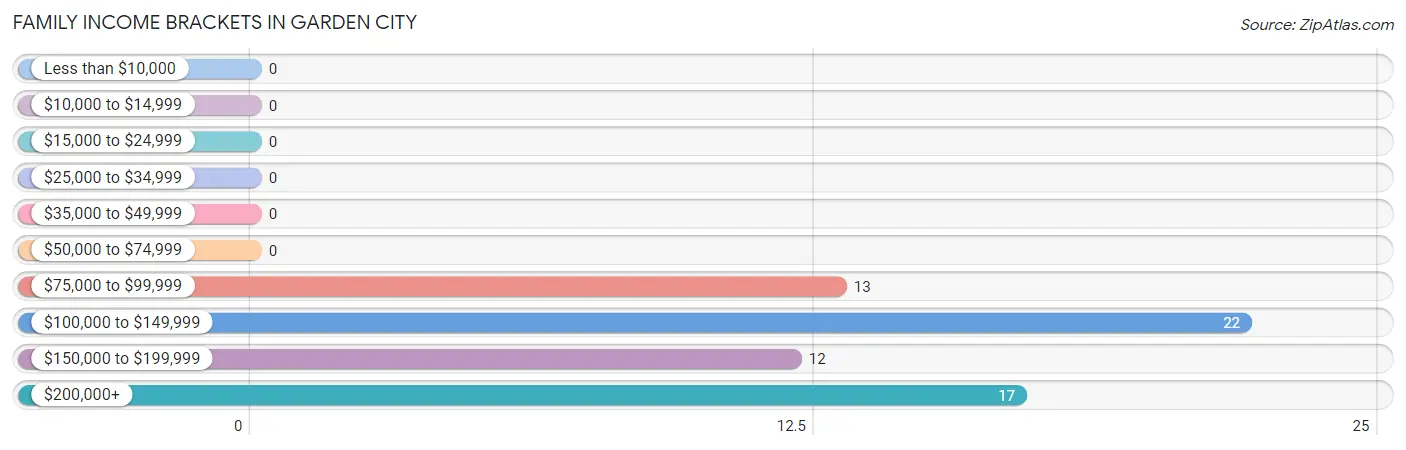
| Income Bracket | # Families | % Families |
| Less than $10,000 | 0 | 0.0% |
| $10,000 to $14,999 | 0 | 0.0% |
| $15,000 to $24,999 | 0 | 0.0% |
| $25,000 to $34,999 | 0 | 0.0% |
| $35,000 to $49,999 | 0 | 0.0% |
| $50,000 to $74,999 | 0 | 0.0% |
| $75,000 to $99,999 | 13 | 20.3% |
| $100,000 to $149,999 | 22 | 34.4% |
| $150,000 to $199,999 | 12 | 18.8% |
| $200,000+ | 17 | 26.6% |
Family Income by Famaliy Size in Garden City
| Income Bracket | # Families | Median Income |
| 2-Person Families | 27 (42.2%) | $0 |
| 3-Person Families | 25 (39.1%) | $0 |
| 4-Person Families | 0 (0.0%) | $0 |
| 5-Person Families | 0 (0.0%) | $0 |
| 6-Person Families | 0 (0.0%) | $0 |
| 7+ Person Families | 12 (18.8%) | $0 |
| Total | 64 (100.0%) | $134,659 |
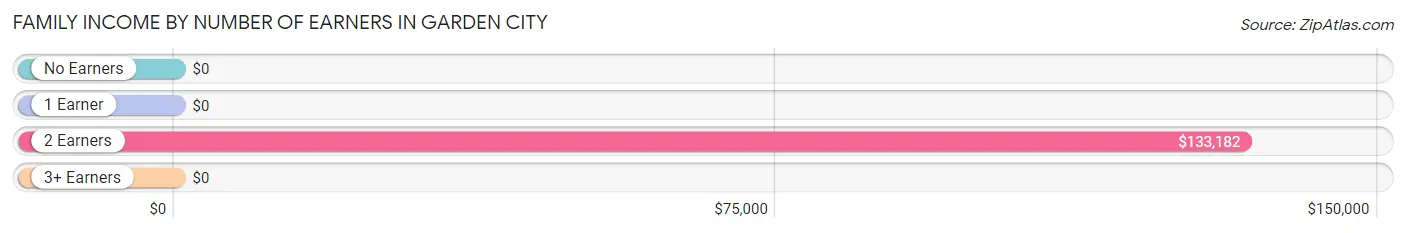
Family Income by Number of Earners in Garden City
| Number of Earners | # Families | Median Income |
| No Earners | 14 (21.9%) | $0 |
| 1 Earner | 0 (0.0%) | $0 |
| 2 Earners | 38 (59.4%) | $133,182 |
| 3+ Earners | 12 (18.8%) | $0 |
| Total | 64 (100.0%) | $134,659 |
Household Income in Garden City
Household Income Brackets in Garden City
With 22 households falling in the category, the $100,000 to $149,999 income range is the most frequent in Garden City, accounting for 34.4% of all households.
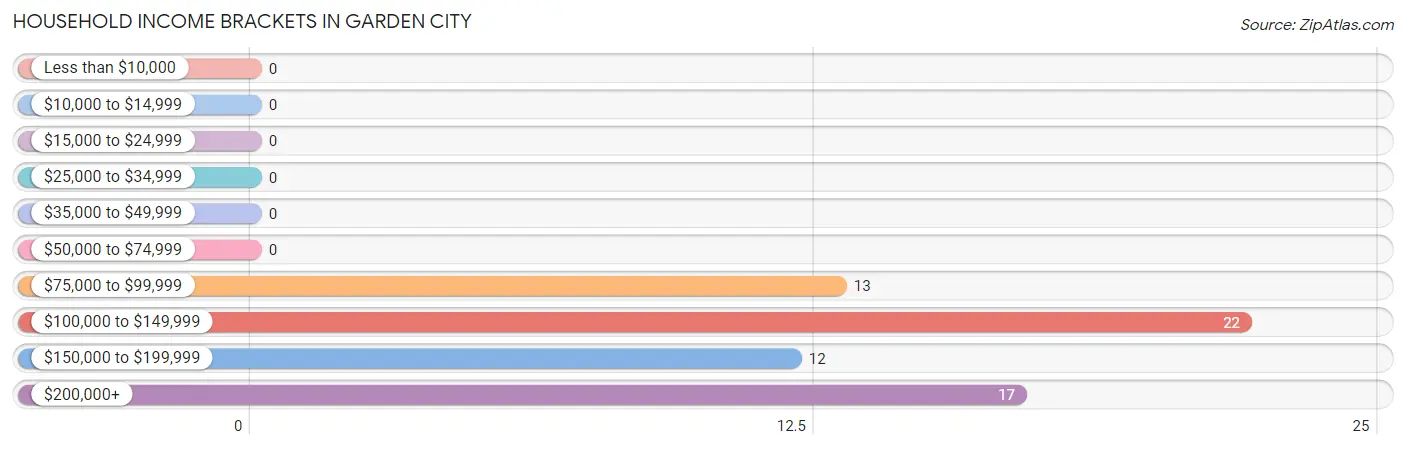
| Income Bracket | # Households | % Households |
| Less than $10,000 | 0 | 0.0% |
| $10,000 to $14,999 | 0 | 0.0% |
| $15,000 to $24,999 | 0 | 0.0% |
| $25,000 to $34,999 | 0 | 0.0% |
| $35,000 to $49,999 | 0 | 0.0% |
| $50,000 to $74,999 | 0 | 0.0% |
| $75,000 to $99,999 | 13 | 20.3% |
| $100,000 to $149,999 | 22 | 34.4% |
| $150,000 to $199,999 | 12 | 18.8% |
| $200,000+ | 17 | 26.6% |
Household Income by Householder Age in Garden City
| Income Bracket | # Households | Median Income |
| 15 to 24 Years | 0 (0.0%) | $0 |
| 25 to 44 Years | 34 (53.1%) | $0 |
| 45 to 64 Years | 16 (25.0%) | $0 |
| 65+ Years | 14 (21.9%) | $0 |
| Total | 64 (100.0%) | $134,659 |
Poverty in Garden City
Income Below Poverty by Sex and Age in Garden City
| Age Bracket | Male | Female |
| Under 5 Years | 0 (0.0%) | 0 (0.0%) |
| 5 Years | 0 (0.0%) | 0 (0.0%) |
| 6 to 11 Years | 0 (0.0%) | 0 (0.0%) |
| 12 to 14 Years | 0 (0.0%) | 0 (0.0%) |
| 15 Years | 0 (0.0%) | 0 (0.0%) |
| 16 and 17 Years | 0 (0.0%) | 0 (0.0%) |
| 18 to 24 Years | 0 (0.0%) | 0 (0.0%) |
| 25 to 34 Years | 0 (0.0%) | 0 (0.0%) |
| 35 to 44 Years | 0 (0.0%) | 0 (0.0%) |
| 45 to 54 Years | 0 (0.0%) | 0 (0.0%) |
| 55 to 64 Years | 0 (0.0%) | 0 (0.0%) |
| 65 to 74 Years | 0 (0.0%) | 0 (0.0%) |
| 75 Years and over | 0 (0.0%) | 0 (0.0%) |
| Total | 0 (0.0%) | 0 (0.0%) |
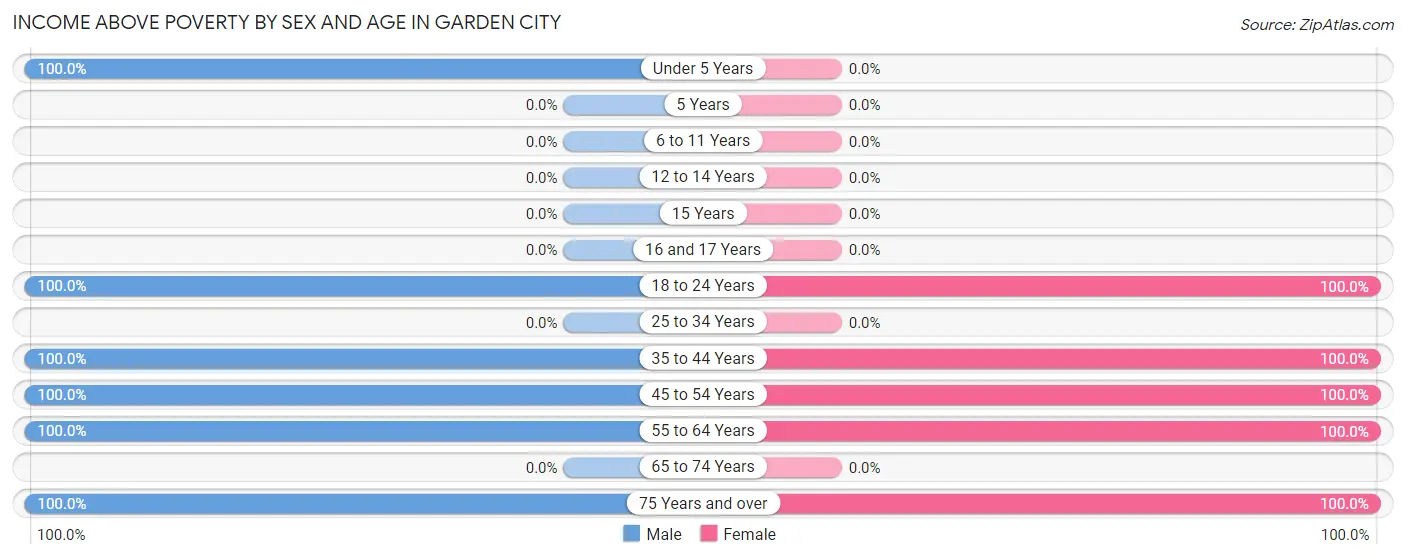
Income Above Poverty by Sex and Age in Garden City
According to the poverty statistics in Garden City, males aged under 5 years and females aged 18 to 24 years are the age groups that are most secure financially, with 100.0% of males and 100.0% of females in these age groups living above the poverty line.
| Age Bracket | Male | Female |
| Under 5 Years | 34 (100.0%) | 0 (0.0%) |
| 5 Years | 0 (0.0%) | 0 (0.0%) |
| 6 to 11 Years | 0 (0.0%) | 0 (0.0%) |
| 12 to 14 Years | 0 (0.0%) | 0 (0.0%) |
| 15 Years | 0 (0.0%) | 0 (0.0%) |
| 16 and 17 Years | 0 (0.0%) | 0 (0.0%) |
| 18 to 24 Years | 31 (100.0%) | 22 (100.0%) |
| 25 to 34 Years | 0 (0.0%) | 0 (0.0%) |
| 35 to 44 Years | 26 (100.0%) | 34 (100.0%) |
| 45 to 54 Years | 23 (100.0%) | 13 (100.0%) |
| 55 to 64 Years | 3 (100.0%) | 3 (100.0%) |
| 65 to 74 Years | 0 (0.0%) | 0 (0.0%) |
| 75 Years and over | 14 (100.0%) | 11 (100.0%) |
| Total | 131 (100.0%) | 83 (100.0%) |
Income Below Poverty Among Married-Couple Families in Garden City
| Children | Above Poverty | Below Poverty |
| No Children | 30 (100.0%) | 0 (0.0%) |
| 1 or 2 Children | 34 (100.0%) | 0 (0.0%) |
| 3 or 4 Children | 0 (0.0%) | 0 (0.0%) |
| 5 or more Children | 0 (0.0%) | 0 (0.0%) |
| Total | 64 (100.0%) | 0 (0.0%) |
Income Below Poverty Among Single-Parent Households in Garden City
| Children | Single Father | Single Mother |
| No Children | 0 (0.0%) | 0 (0.0%) |
| 1 or 2 Children | 0 (0.0%) | 0 (0.0%) |
| 3 or 4 Children | 0 (0.0%) | 0 (0.0%) |
| 5 or more Children | 0 (0.0%) | 0 (0.0%) |
| Total | 0 (0.0%) | 0 (0.0%) |
Income Below Poverty Among Married-Couple vs Single-Parent Households in Garden City
| Children | Married-Couple Families | Single-Parent Households |
| No Children | 0 (0.0%) | 0 (0.0%) |
| 1 or 2 Children | 0 (0.0%) | 0 (0.0%) |
| 3 or 4 Children | 0 (0.0%) | 0 (0.0%) |
| 5 or more Children | 0 (0.0%) | 0 (0.0%) |
| Total | 0 (0.0%) | 0 (0.0%) |
Employment Characteristics in Garden City
Employment by Class of Employer in Garden City
Among the 99 employed individuals in Garden City, private company employees (44 | 44.4%), state government employees (36 | 36.4%), and local government employees (16 | 16.2%) make up the most common classes of employment.
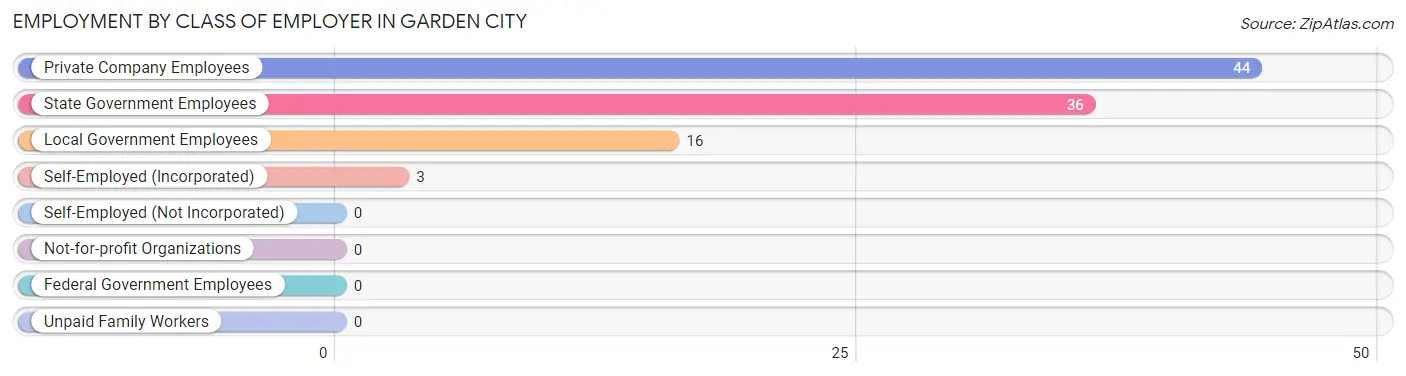
| Employer Class | # Employees | % Employees |
| Private Company Employees | 44 | 44.4% |
| Self-Employed (Incorporated) | 3 | 3.0% |
| Self-Employed (Not Incorporated) | 0 | 0.0% |
| Not-for-profit Organizations | 0 | 0.0% |
| Local Government Employees | 16 | 16.2% |
| State Government Employees | 36 | 36.4% |
| Federal Government Employees | 0 | 0.0% |
| Unpaid Family Workers | 0 | 0.0% |
| Total | 99 | 100.0% |
Employment Status by Age in Garden City
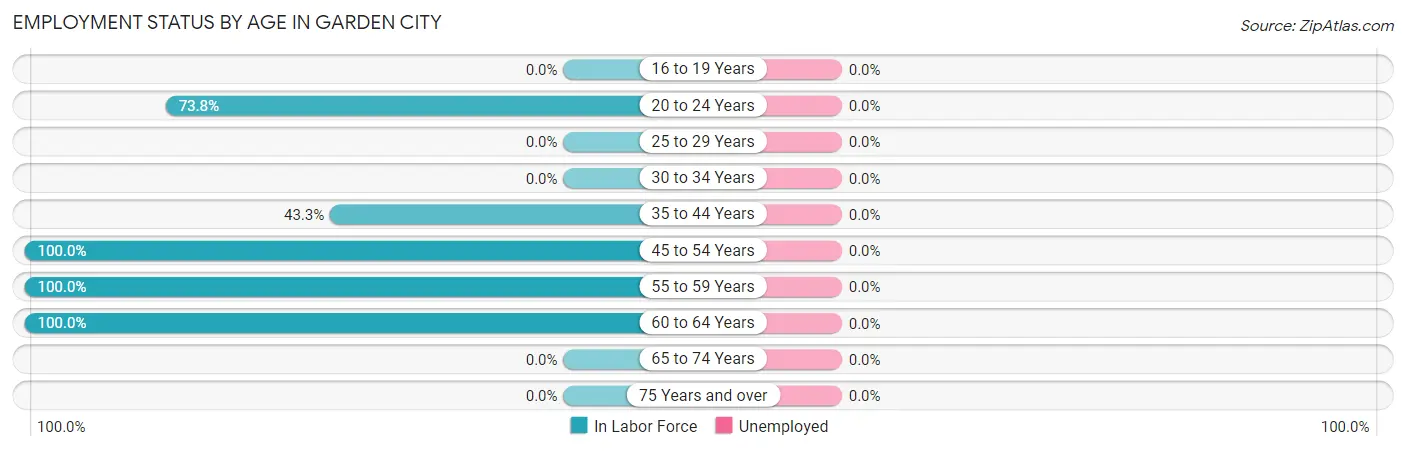
| Age Bracket | In Labor Force | Unemployed |
| 16 to 19 Years | 0 (0.0%) | 0 (0.0%) |
| 20 to 24 Years | 31 (73.8%) | 0 (0.0%) |
| 25 to 29 Years | 0 (0.0%) | 0 (0.0%) |
| 30 to 34 Years | 0 (0.0%) | 0 (0.0%) |
| 35 to 44 Years | 26 (43.3%) | 0 (0.0%) |
| 45 to 54 Years | 36 (100.0%) | 0 (0.0%) |
| 55 to 59 Years | 3 (100.0%) | 0 (0.0%) |
| 60 to 64 Years | 3 (100.0%) | 0 (0.0%) |
| 65 to 74 Years | 0 (0.0%) | 0 (0.0%) |
| 75 Years and over | 0 (0.0%) | 0 (0.0%) |
| Total | 99 (55.0%) | 0 (0.0%) |
Employment Status by Educational Attainment in Garden City
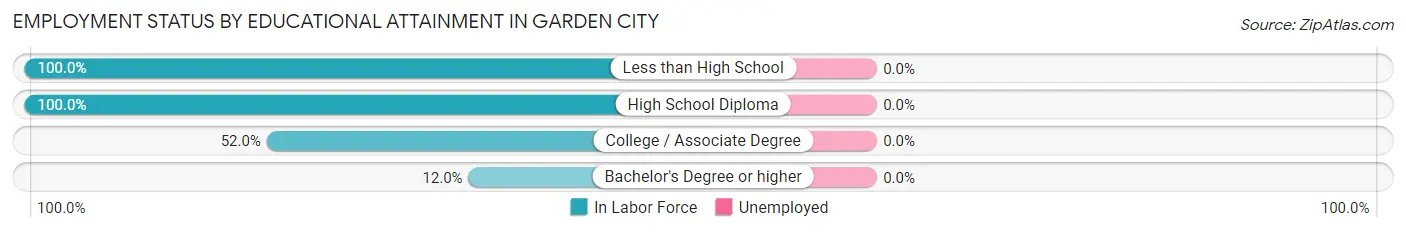
| Educational Attainment | In Labor Force | Unemployed |
| Less than High School | 23 (100.0%) | 0 (0.0%) |
| High School Diploma | 29 (100.0%) | 0 (0.0%) |
| College / Associate Degree | 13 (52.0%) | 0 (0.0%) |
| Bachelor's Degree or higher | 3 (12.0%) | 0 (0.0%) |
| Total | 68 (66.7%) | 0 (0.0%) |
Employment Occupations by Sex in Garden City
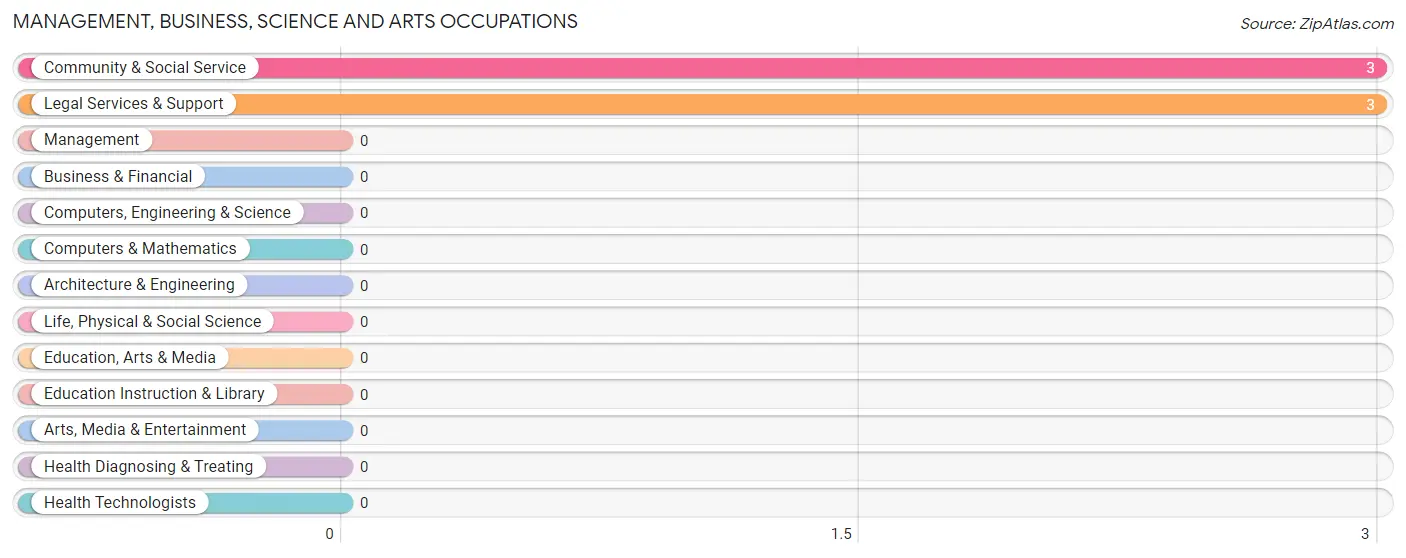
Management, Business, Science and Arts Occupations
The most common Management, Business, Science and Arts occupations in Garden City are Community & Social Service (3 | 3.0%), and Legal Services & Support (3 | 3.0%).
Management, Business, Science and Arts Occupations by Sex
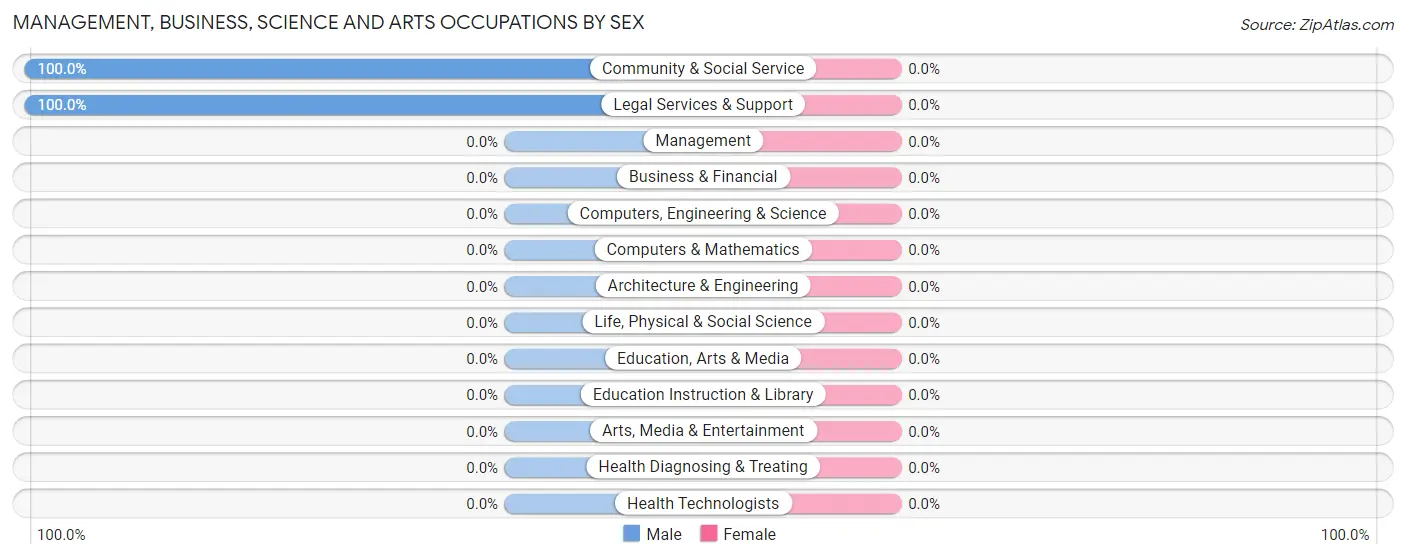
| Occupation | Male | Female |
| Management | 0 (0.0%) | 0 (0.0%) |
| Business & Financial | 0 (0.0%) | 0 (0.0%) |
| Computers, Engineering & Science | 0 (0.0%) | 0 (0.0%) |
| Computers & Mathematics | 0 (0.0%) | 0 (0.0%) |
| Architecture & Engineering | 0 (0.0%) | 0 (0.0%) |
| Life, Physical & Social Science | 0 (0.0%) | 0 (0.0%) |
| Community & Social Service | 3 (100.0%) | 0 (0.0%) |
| Education, Arts & Media | 0 (0.0%) | 0 (0.0%) |
| Legal Services & Support | 3 (100.0%) | 0 (0.0%) |
| Education Instruction & Library | 0 (0.0%) | 0 (0.0%) |
| Arts, Media & Entertainment | 0 (0.0%) | 0 (0.0%) |
| Health Diagnosing & Treating | 0 (0.0%) | 0 (0.0%) |
| Health Technologists | 0 (0.0%) | 0 (0.0%) |
| Total (Category) | 3 (100.0%) | 0 (0.0%) |
| Total (Overall) | 83 (83.8%) | 16 (16.2%) |
Services Occupations
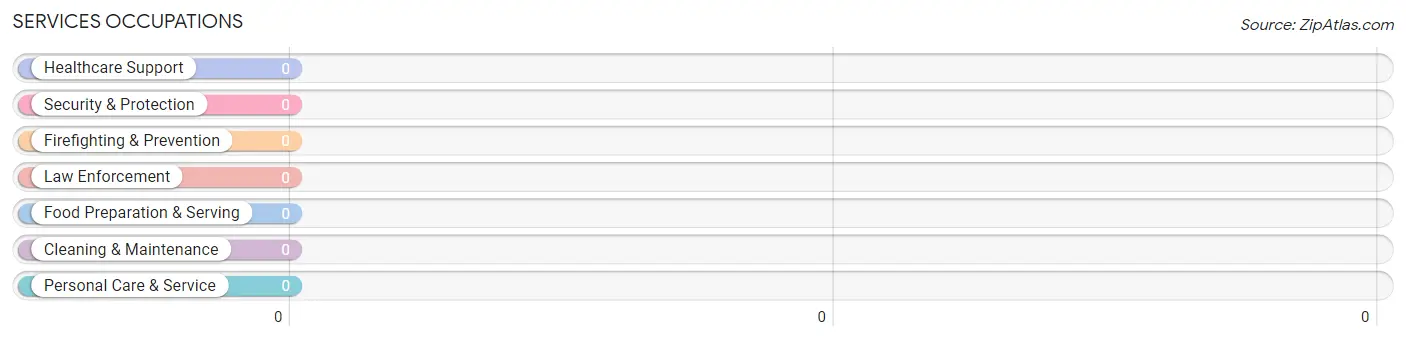
Services Occupations by Sex
| Occupation | Male | Female |
| Healthcare Support | 0 (0.0%) | 0 (0.0%) |
| Security & Protection | 0 (0.0%) | 0 (0.0%) |
| Firefighting & Prevention | 0 (0.0%) | 0 (0.0%) |
| Law Enforcement | 0 (0.0%) | 0 (0.0%) |
| Food Preparation & Serving | 0 (0.0%) | 0 (0.0%) |
| Cleaning & Maintenance | 0 (0.0%) | 0 (0.0%) |
| Personal Care & Service | 0 (0.0%) | 0 (0.0%) |
| Total (Category) | 0 (0.0%) | 0 (0.0%) |
| Total (Overall) | 83 (83.8%) | 16 (16.2%) |
Sales and Office Occupations
The most common Sales and Office occupations in Garden City are , and Office & Administration (3 | 3.0%).
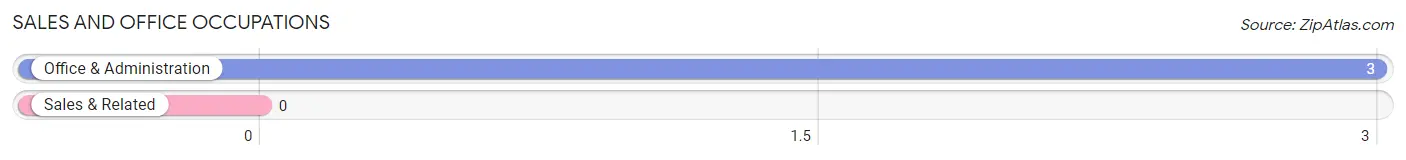
Sales and Office Occupations by Sex
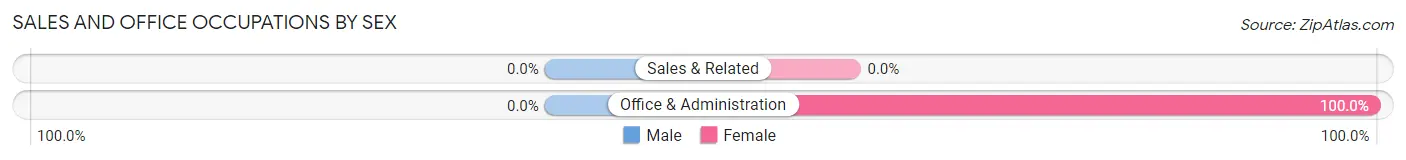
| Occupation | Male | Female |
| Sales & Related | 0 (0.0%) | 0 (0.0%) |
| Office & Administration | 0 (0.0%) | 3 (100.0%) |
| Total (Category) | 0 (0.0%) | 3 (100.0%) |
| Total (Overall) | 83 (83.8%) | 16 (16.2%) |
Natural Resources, Construction and Maintenance Occupations
The most common Natural Resources, Construction and Maintenance occupations in Garden City are Construction & Extraction (31 | 31.3%), and Installation, Maintenance & Repair (26 | 26.3%).
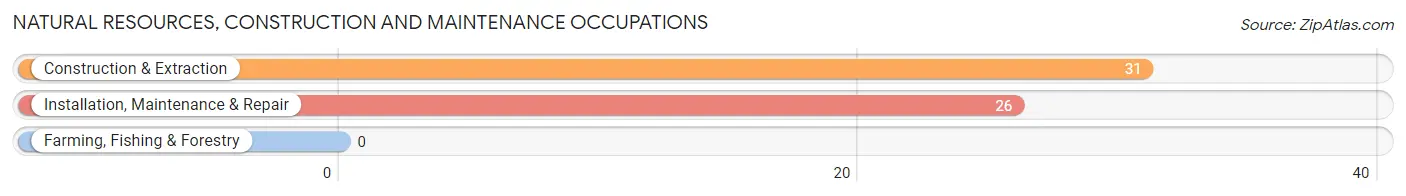
Natural Resources, Construction and Maintenance Occupations by Sex
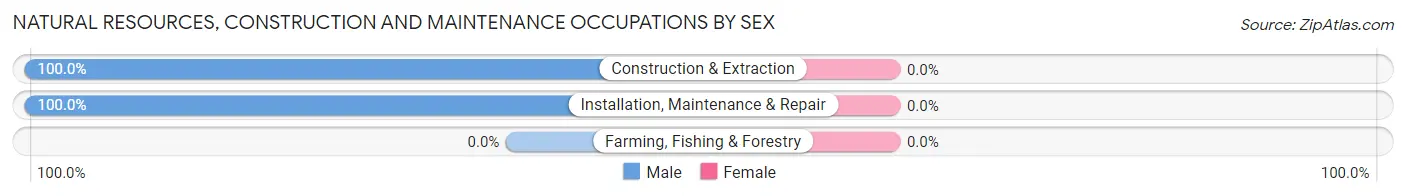
| Occupation | Male | Female |
| Farming, Fishing & Forestry | 0 (0.0%) | 0 (0.0%) |
| Construction & Extraction | 31 (100.0%) | 0 (0.0%) |
| Installation, Maintenance & Repair | 26 (100.0%) | 0 (0.0%) |
| Total (Category) | 57 (100.0%) | 0 (0.0%) |
| Total (Overall) | 83 (83.8%) | 16 (16.2%) |
Production, Transportation and Moving Occupations
The most common Production, Transportation and Moving occupations in Garden City are Transportation (20 | 20.2%), and Production (16 | 16.2%).
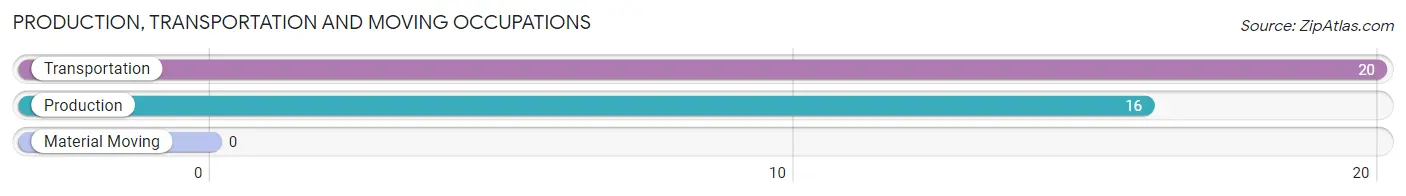
Production, Transportation and Moving Occupations by Sex
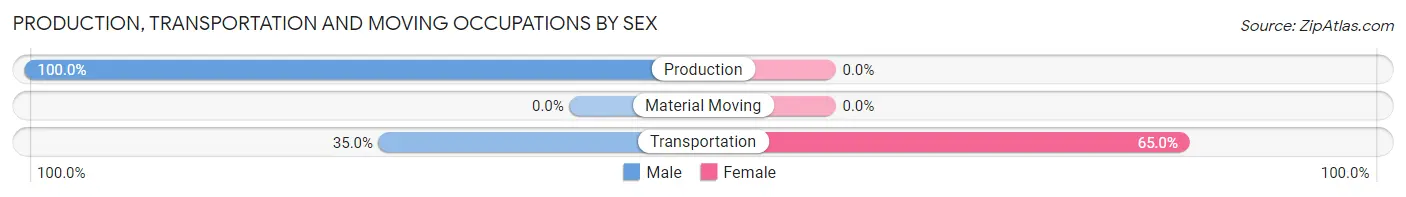
| Occupation | Male | Female |
| Production | 16 (100.0%) | 0 (0.0%) |
| Transportation | 7 (35.0%) | 13 (65.0%) |
| Material Moving | 0 (0.0%) | 0 (0.0%) |
| Total (Category) | 23 (63.9%) | 13 (36.1%) |
| Total (Overall) | 83 (83.8%) | 16 (16.2%) |
Employment Industries by Sex in Garden City
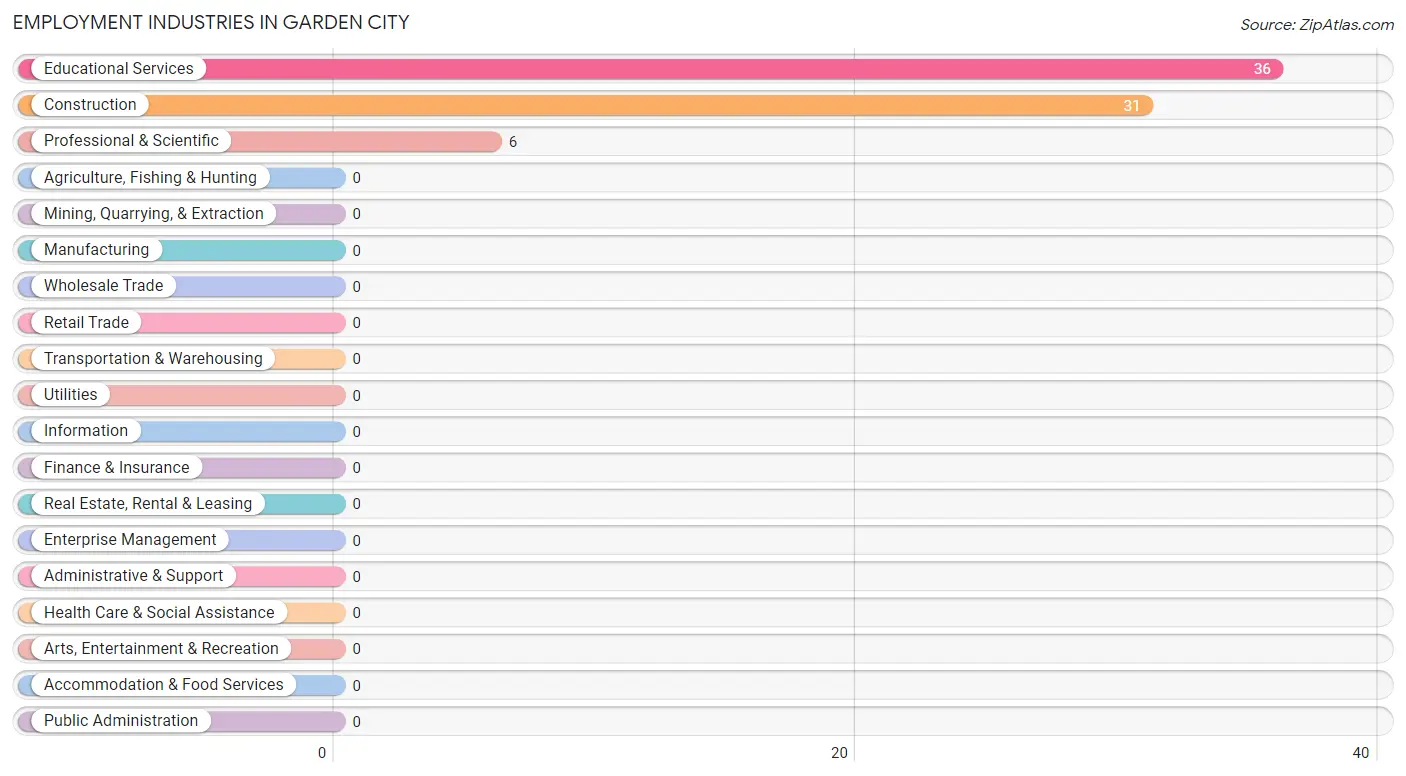
Employment Industries in Garden City
The major employment industries in Garden City include Educational Services (36 | 36.4%), Construction (31 | 31.3%), and Professional & Scientific (6 | 6.1%).
Employment Industries by Sex in Garden City
The Garden City industries that see more men than women are Construction (100.0%), Educational Services (63.9%), and Professional & Scientific (50.0%), whereas the industries that tend to have a higher number of women are Professional & Scientific (50.0%), and Educational Services (36.1%).
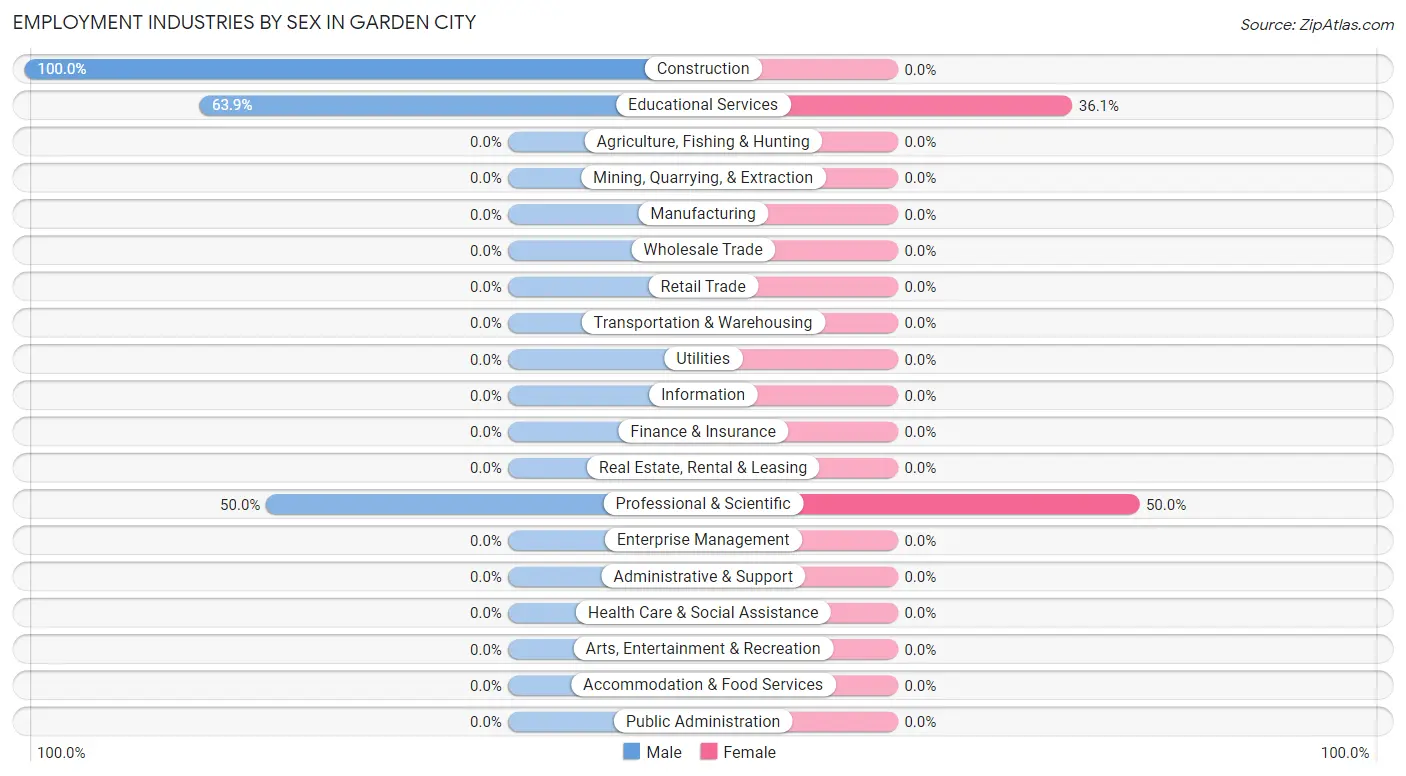
| Industry | Male | Female |
| Agriculture, Fishing & Hunting | 0 (0.0%) | 0 (0.0%) |
| Mining, Quarrying, & Extraction | 0 (0.0%) | 0 (0.0%) |
| Construction | 31 (100.0%) | 0 (0.0%) |
| Manufacturing | 0 (0.0%) | 0 (0.0%) |
| Wholesale Trade | 0 (0.0%) | 0 (0.0%) |
| Retail Trade | 0 (0.0%) | 0 (0.0%) |
| Transportation & Warehousing | 0 (0.0%) | 0 (0.0%) |
| Utilities | 0 (0.0%) | 0 (0.0%) |
| Information | 0 (0.0%) | 0 (0.0%) |
| Finance & Insurance | 0 (0.0%) | 0 (0.0%) |
| Real Estate, Rental & Leasing | 0 (0.0%) | 0 (0.0%) |
| Professional & Scientific | 3 (50.0%) | 3 (50.0%) |
| Enterprise Management | 0 (0.0%) | 0 (0.0%) |
| Administrative & Support | 0 (0.0%) | 0 (0.0%) |
| Educational Services | 23 (63.9%) | 13 (36.1%) |
| Health Care & Social Assistance | 0 (0.0%) | 0 (0.0%) |
| Arts, Entertainment & Recreation | 0 (0.0%) | 0 (0.0%) |
| Accommodation & Food Services | 0 (0.0%) | 0 (0.0%) |
| Public Administration | 0 (0.0%) | 0 (0.0%) |
| Total | 83 (83.8%) | 16 (16.2%) |
Education in Garden City
School Enrollment in Garden City
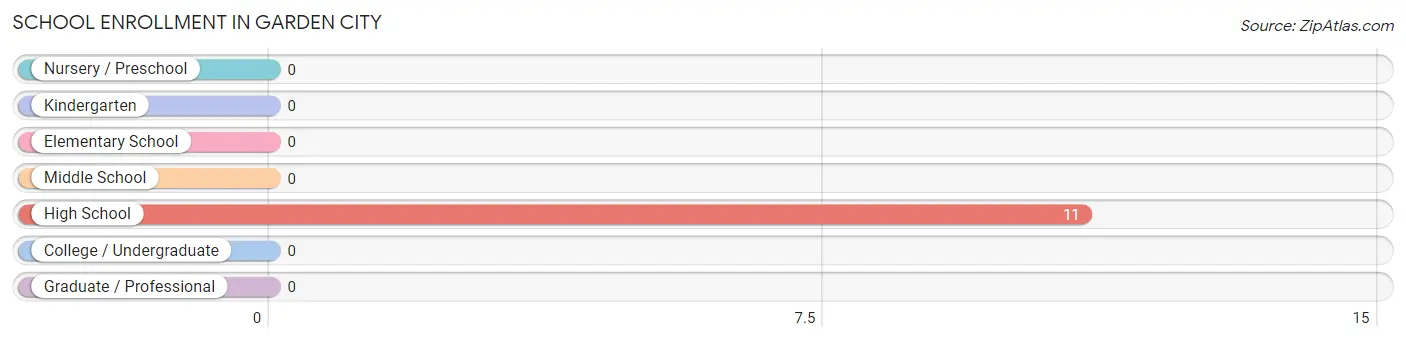
| School Level | # Students | % Students |
| Nursery / Preschool | 0 | 0.0% |
| Kindergarten | 0 | 0.0% |
| Elementary School | 0 | 0.0% |
| Middle School | 0 | 0.0% |
| High School | 11 | 100.0% |
| College / Undergraduate | 0 | 0.0% |
| Graduate / Professional | 0 | 0.0% |
| Total | 11 | 100.0% |
School Enrollment by Age by Funding Source in Garden City
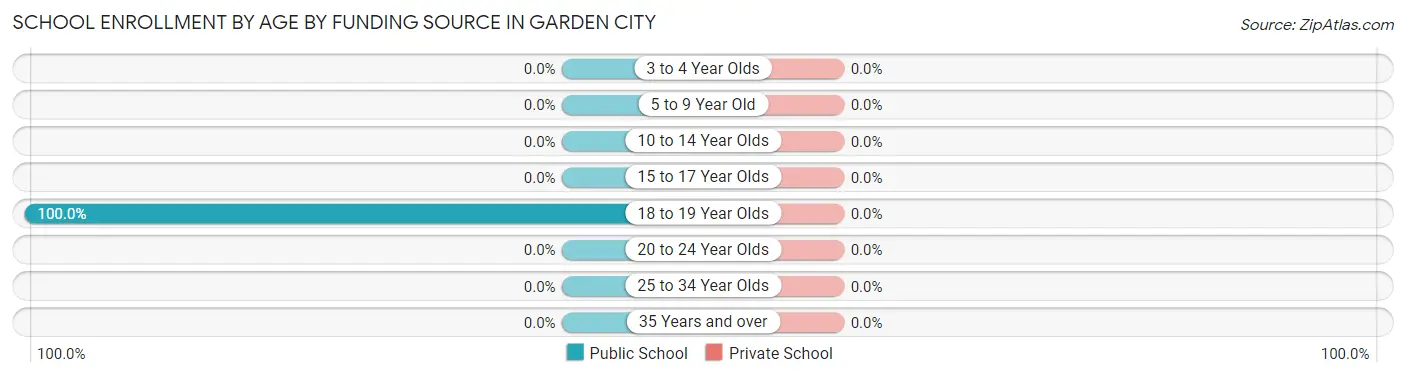
| Age Bracket | Public School | Private School |
| 3 to 4 Year Olds | 0 (0.0%) | 0 (0.0%) |
| 5 to 9 Year Old | 0 (0.0%) | 0 (0.0%) |
| 10 to 14 Year Olds | 0 (0.0%) | 0 (0.0%) |
| 15 to 17 Year Olds | 0 (0.0%) | 0 (0.0%) |
| 18 to 19 Year Olds | 11 (100.0%) | 0 (0.0%) |
| 20 to 24 Year Olds | 0 (0.0%) | 0 (0.0%) |
| 25 to 34 Year Olds | 0 (0.0%) | 0 (0.0%) |
| 35 Years and over | 0 (0.0%) | 0 (0.0%) |
| Total | 11 (100.0%) | 0 (0.0%) |
Educational Attainment by Field of Study in Garden City
Literature & languages (22 | 53.7%), bio, nature & agricultural (14 | 34.2%), business (3 | 7.3%), and education (2 | 4.9%) are the most common fields of study among 41 individuals in Garden City who have obtained a bachelor's degree or higher.
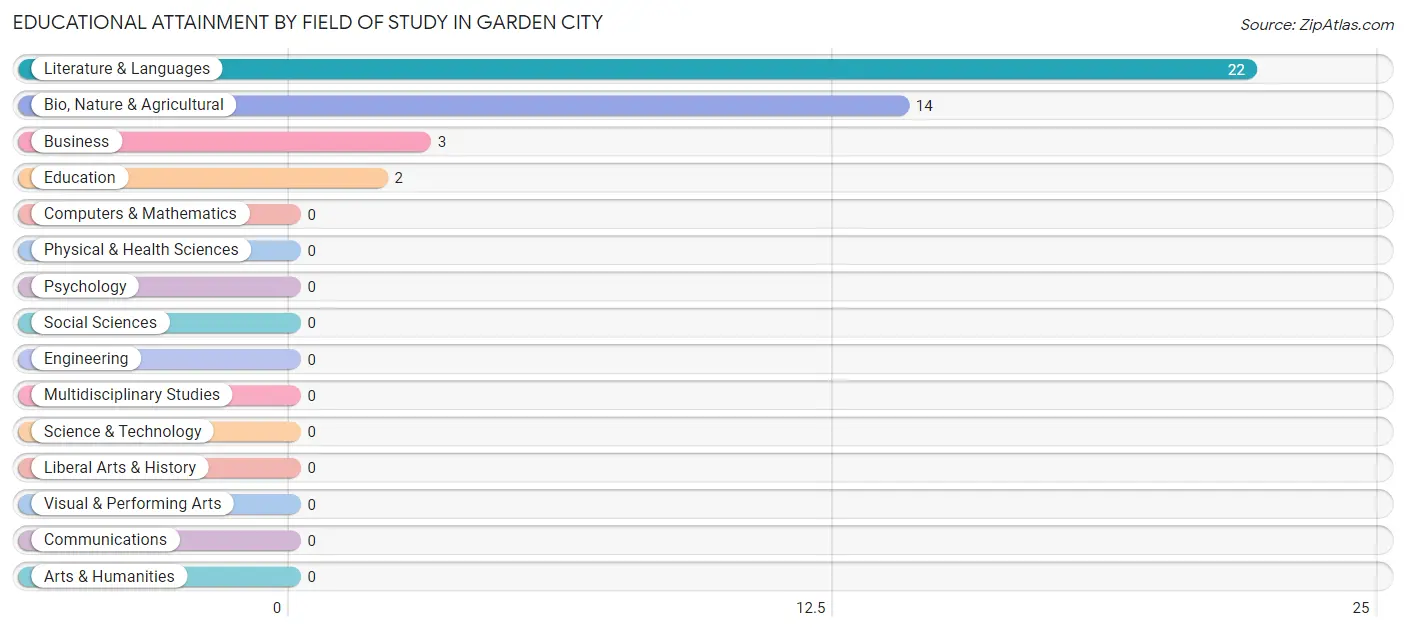
| Field of Study | # Graduates | % Graduates |
| Computers & Mathematics | 0 | 0.0% |
| Bio, Nature & Agricultural | 14 | 34.2% |
| Physical & Health Sciences | 0 | 0.0% |
| Psychology | 0 | 0.0% |
| Social Sciences | 0 | 0.0% |
| Engineering | 0 | 0.0% |
| Multidisciplinary Studies | 0 | 0.0% |
| Science & Technology | 0 | 0.0% |
| Business | 3 | 7.3% |
| Education | 2 | 4.9% |
| Literature & Languages | 22 | 53.7% |
| Liberal Arts & History | 0 | 0.0% |
| Visual & Performing Arts | 0 | 0.0% |
| Communications | 0 | 0.0% |
| Arts & Humanities | 0 | 0.0% |
| Total | 41 | 100.0% |
Transportation & Commute in Garden City
Vehicle Availability by Sex in Garden City
The most prevalent vehicle ownership categories in Garden City are males with 2 vehicles (45, accounting for 54.2%) and females with 2 vehicles (16, making up 281.2%).
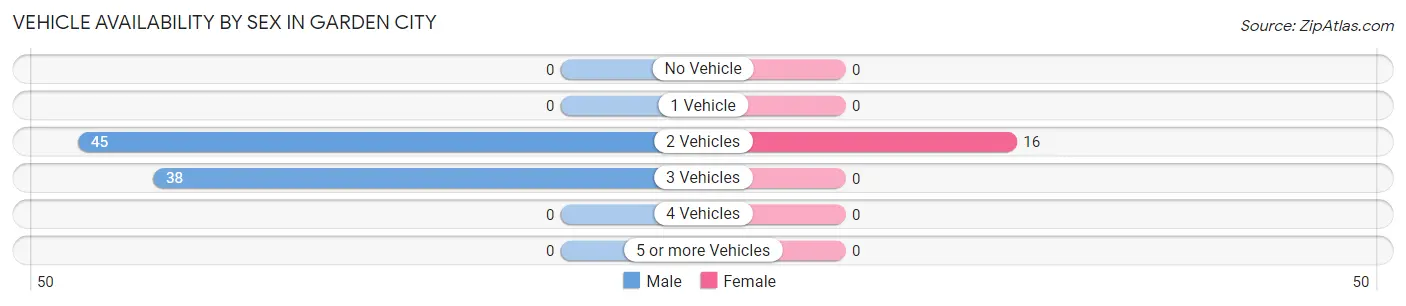
| Vehicles Available | Male | Female |
| No Vehicle | 0 (0.0%) | 0 (0.0%) |
| 1 Vehicle | 0 (0.0%) | 0 (0.0%) |
| 2 Vehicles | 45 (54.2%) | 16 (100.0%) |
| 3 Vehicles | 38 (45.8%) | 0 (0.0%) |
| 4 Vehicles | 0 (0.0%) | 0 (0.0%) |
| 5 or more Vehicles | 0 (0.0%) | 0 (0.0%) |
| Total | 83 (100.0%) | 16 (100.0%) |
Commute Time in Garden City
The most frequently occuring commute durations in Garden City are less than 5 minutes (45 commuters, 45.5%), 40 to 44 minutes (32 commuters, 32.3%), and 30 to 34 minutes (15 commuters, 15.1%).
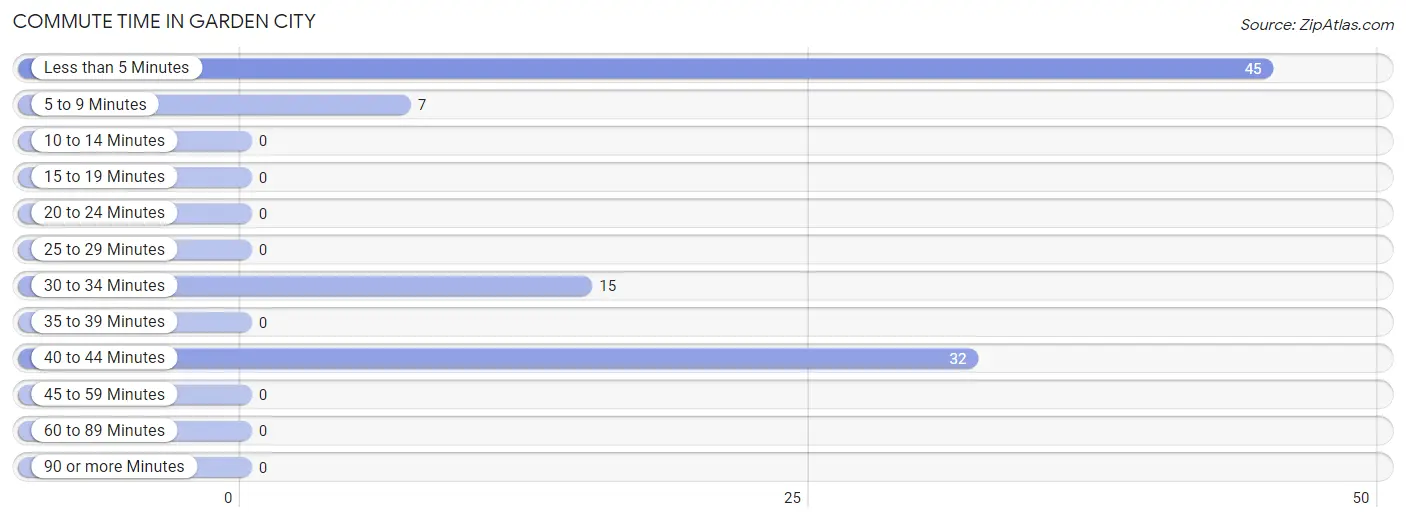
| Commute Time | # Commuters | % Commuters |
| Less than 5 Minutes | 45 | 45.5% |
| 5 to 9 Minutes | 7 | 7.1% |
| 10 to 14 Minutes | 0 | 0.0% |
| 15 to 19 Minutes | 0 | 0.0% |
| 20 to 24 Minutes | 0 | 0.0% |
| 25 to 29 Minutes | 0 | 0.0% |
| 30 to 34 Minutes | 15 | 15.1% |
| 35 to 39 Minutes | 0 | 0.0% |
| 40 to 44 Minutes | 32 | 32.3% |
| 45 to 59 Minutes | 0 | 0.0% |
| 60 to 89 Minutes | 0 | 0.0% |
| 90 or more Minutes | 0 | 0.0% |
Commute Time by Sex in Garden City
The most common commute times in Garden City are less than 5 minutes (32 commuters, 38.6%) for males and less than 5 minutes (13 commuters, 81.2%) for females.
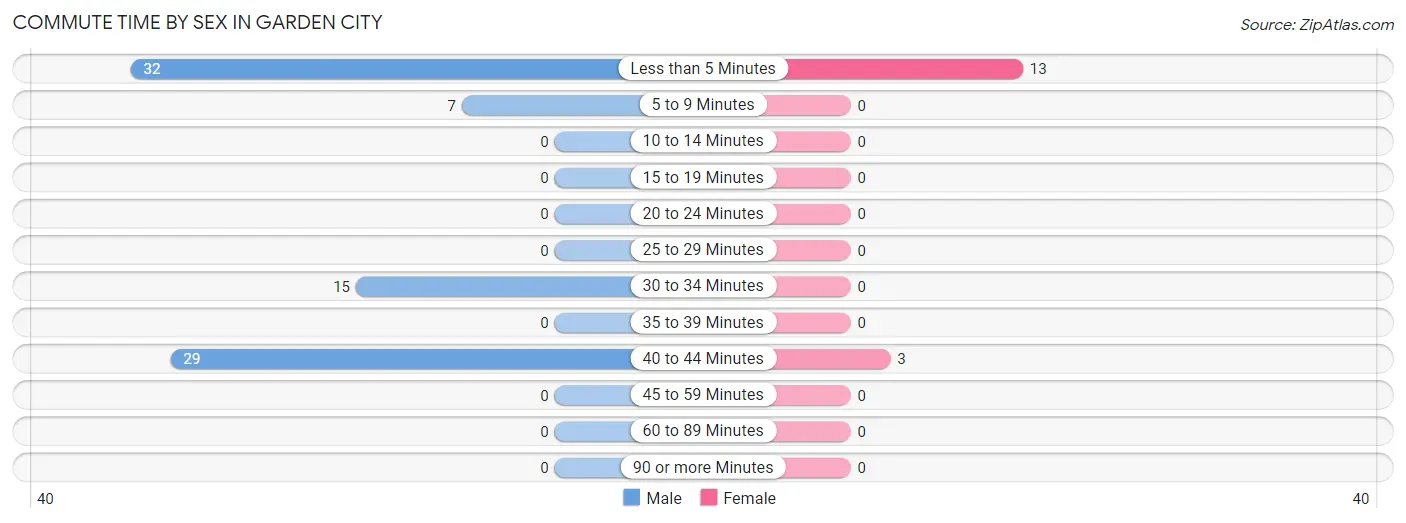
| Commute Time | Male | Female |
| Less than 5 Minutes | 32 (38.6%) | 13 (81.2%) |
| 5 to 9 Minutes | 7 (8.4%) | 0 (0.0%) |
| 10 to 14 Minutes | 0 (0.0%) | 0 (0.0%) |
| 15 to 19 Minutes | 0 (0.0%) | 0 (0.0%) |
| 20 to 24 Minutes | 0 (0.0%) | 0 (0.0%) |
| 25 to 29 Minutes | 0 (0.0%) | 0 (0.0%) |
| 30 to 34 Minutes | 15 (18.1%) | 0 (0.0%) |
| 35 to 39 Minutes | 0 (0.0%) | 0 (0.0%) |
| 40 to 44 Minutes | 29 (34.9%) | 3 (18.8%) |
| 45 to 59 Minutes | 0 (0.0%) | 0 (0.0%) |
| 60 to 89 Minutes | 0 (0.0%) | 0 (0.0%) |
| 90 or more Minutes | 0 (0.0%) | 0 (0.0%) |
Time of Departure to Work by Sex in Garden City
The most frequent times of departure to work in Garden City are 7:00 AM to 7:29 AM (42, 50.6%) for males and 6:00 AM to 6:29 AM (13, 81.2%) for females.
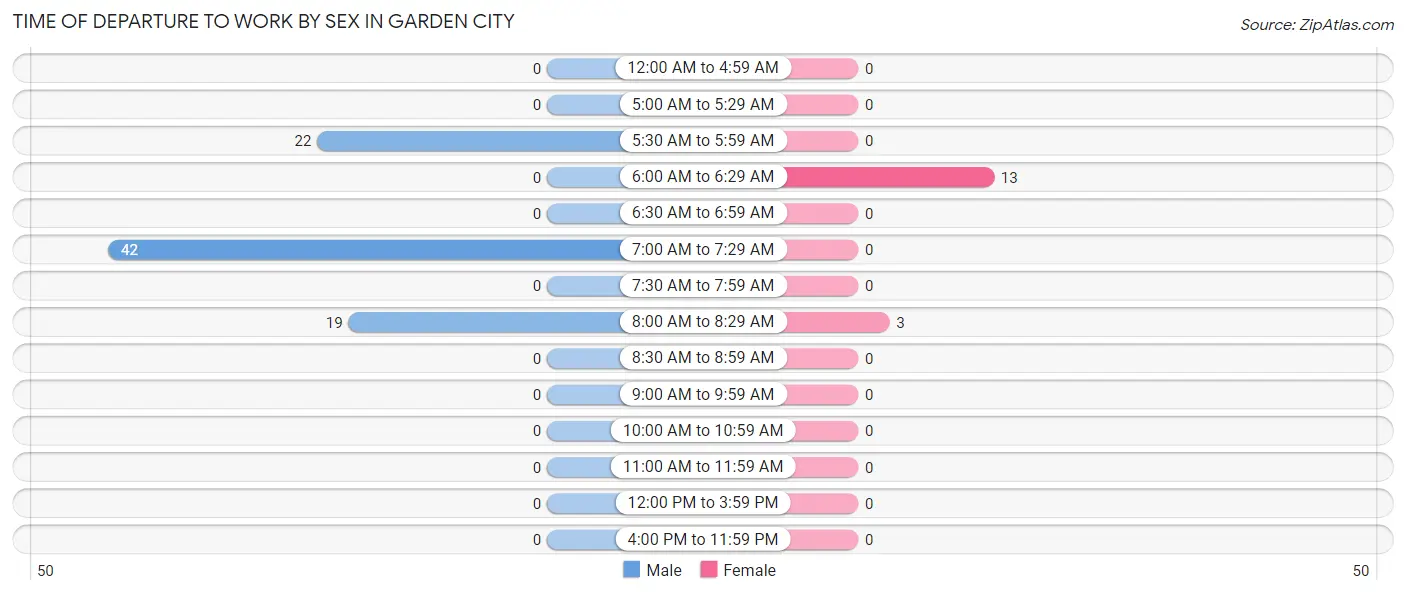
| Time of Departure | Male | Female |
| 12:00 AM to 4:59 AM | 0 (0.0%) | 0 (0.0%) |
| 5:00 AM to 5:29 AM | 0 (0.0%) | 0 (0.0%) |
| 5:30 AM to 5:59 AM | 22 (26.5%) | 0 (0.0%) |
| 6:00 AM to 6:29 AM | 0 (0.0%) | 13 (81.2%) |
| 6:30 AM to 6:59 AM | 0 (0.0%) | 0 (0.0%) |
| 7:00 AM to 7:29 AM | 42 (50.6%) | 0 (0.0%) |
| 7:30 AM to 7:59 AM | 0 (0.0%) | 0 (0.0%) |
| 8:00 AM to 8:29 AM | 19 (22.9%) | 3 (18.8%) |
| 8:30 AM to 8:59 AM | 0 (0.0%) | 0 (0.0%) |
| 9:00 AM to 9:59 AM | 0 (0.0%) | 0 (0.0%) |
| 10:00 AM to 10:59 AM | 0 (0.0%) | 0 (0.0%) |
| 11:00 AM to 11:59 AM | 0 (0.0%) | 0 (0.0%) |
| 12:00 PM to 3:59 PM | 0 (0.0%) | 0 (0.0%) |
| 4:00 PM to 11:59 PM | 0 (0.0%) | 0 (0.0%) |
| Total | 83 (100.0%) | 16 (100.0%) |
Housing Occupancy in Garden City
Occupancy by Ownership in Garden City
Of the total 64 dwellings in Garden City, owner-occupied units account for 30 (46.9%), while renter-occupied units make up 34 (53.1%).
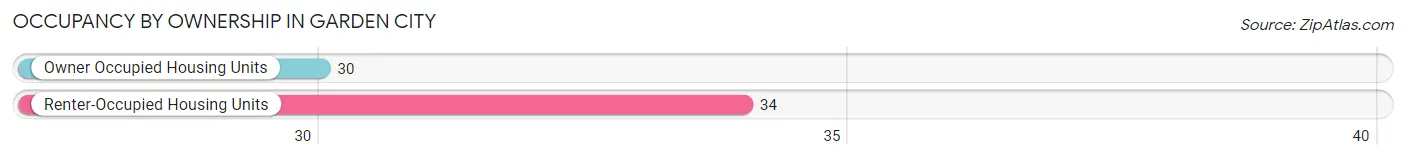
| Occupancy | # Housing Units | % Housing Units |
| Owner Occupied Housing Units | 30 | 46.9% |
| Renter-Occupied Housing Units | 34 | 53.1% |
| Total Occupied Housing Units | 64 | 100.0% |
Occupancy by Household Size in Garden City
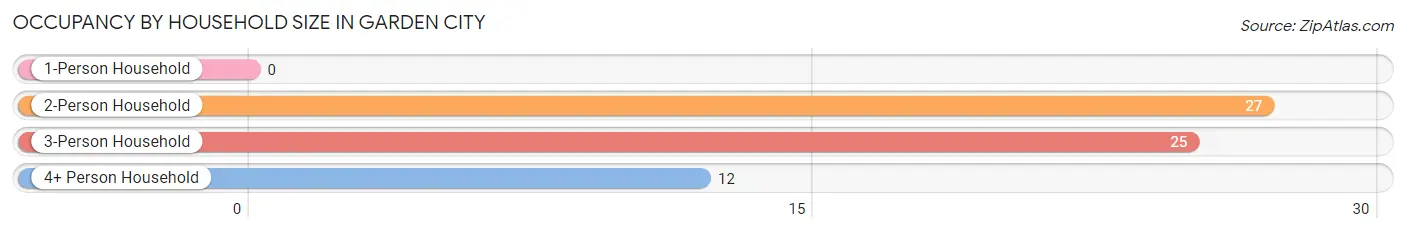
| Household Size | # Housing Units | % Housing Units |
| 1-Person Household | 0 | 0.0% |
| 2-Person Household | 27 | 42.2% |
| 3-Person Household | 25 | 39.1% |
| 4+ Person Household | 12 | 18.8% |
| Total Housing Units | 64 | 100.0% |
Occupancy by Ownership by Household Size in Garden City
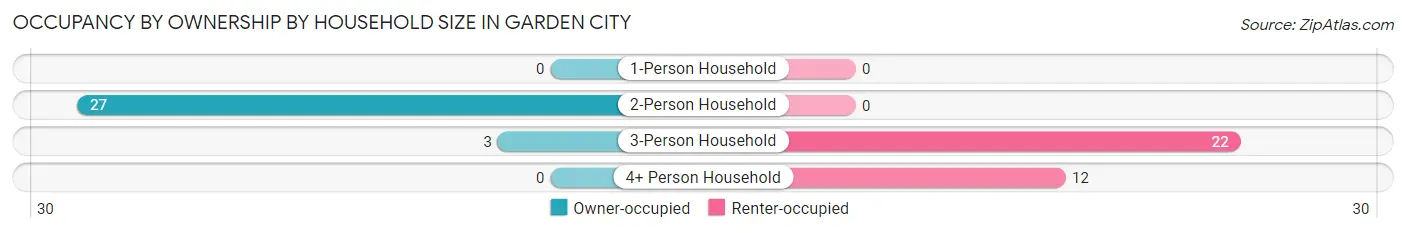
| Household Size | Owner-occupied | Renter-occupied |
| 1-Person Household | 0 (0.0%) | 0 (0.0%) |
| 2-Person Household | 27 (100.0%) | 0 (0.0%) |
| 3-Person Household | 3 (12.0%) | 22 (88.0%) |
| 4+ Person Household | 0 (0.0%) | 12 (100.0%) |
| Total Housing Units | 30 (46.9%) | 34 (53.1%) |
Occupancy by Educational Attainment in Garden City
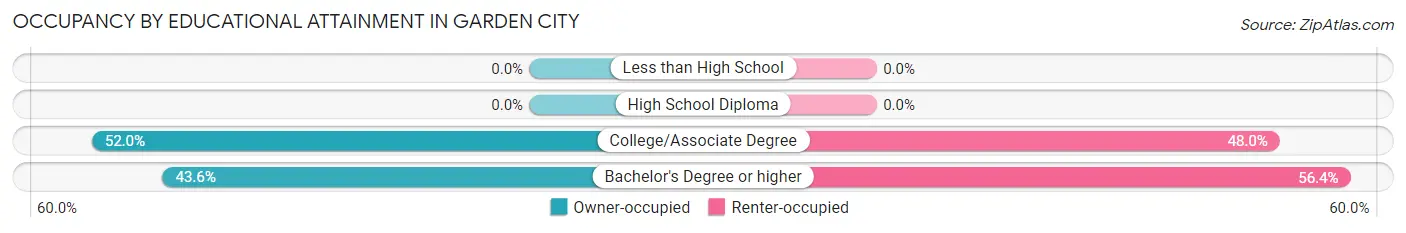
| Household Size | Owner-occupied | Renter-occupied |
| Less than High School | 0 (0.0%) | 0 (0.0%) |
| High School Diploma | 0 (0.0%) | 0 (0.0%) |
| College/Associate Degree | 13 (52.0%) | 12 (48.0%) |
| Bachelor's Degree or higher | 17 (43.6%) | 22 (56.4%) |
Occupancy by Age of Householder in Garden City
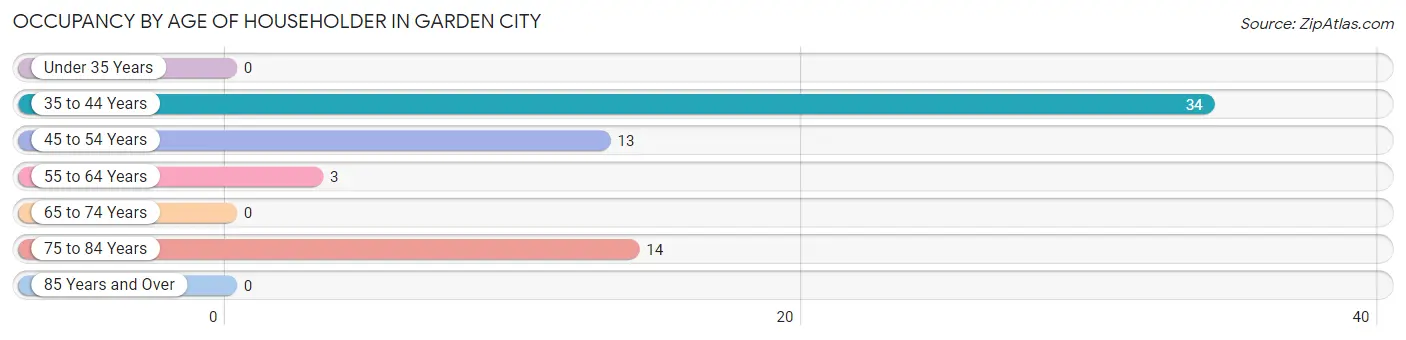
| Age Bracket | # Households | % Households |
| Under 35 Years | 0 | 0.0% |
| 35 to 44 Years | 34 | 53.1% |
| 45 to 54 Years | 13 | 20.3% |
| 55 to 64 Years | 3 | 4.7% |
| 65 to 74 Years | 0 | 0.0% |
| 75 to 84 Years | 14 | 21.9% |
| 85 Years and Over | 0 | 0.0% |
| Total | 64 | 100.0% |
Housing Finances in Garden City
Median Income by Occupancy in Garden City
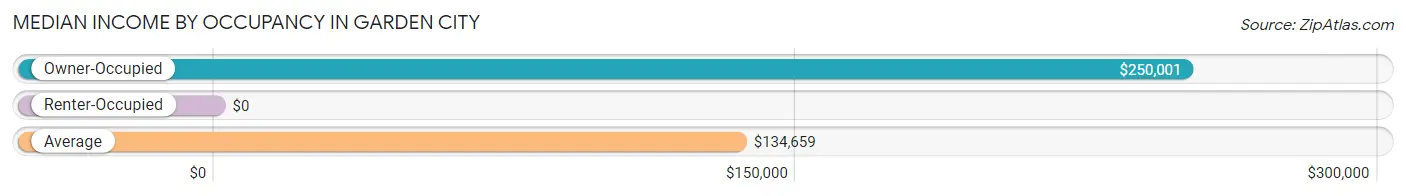
| Occupancy Type | # Households | Median Income |
| Owner-Occupied | 30 (46.9%) | $250,001 |
| Renter-Occupied | 34 (53.1%) | $0 |
| Average | 64 (100.0%) | $134,659 |
Occupancy by Householder Income Bracket in Garden City
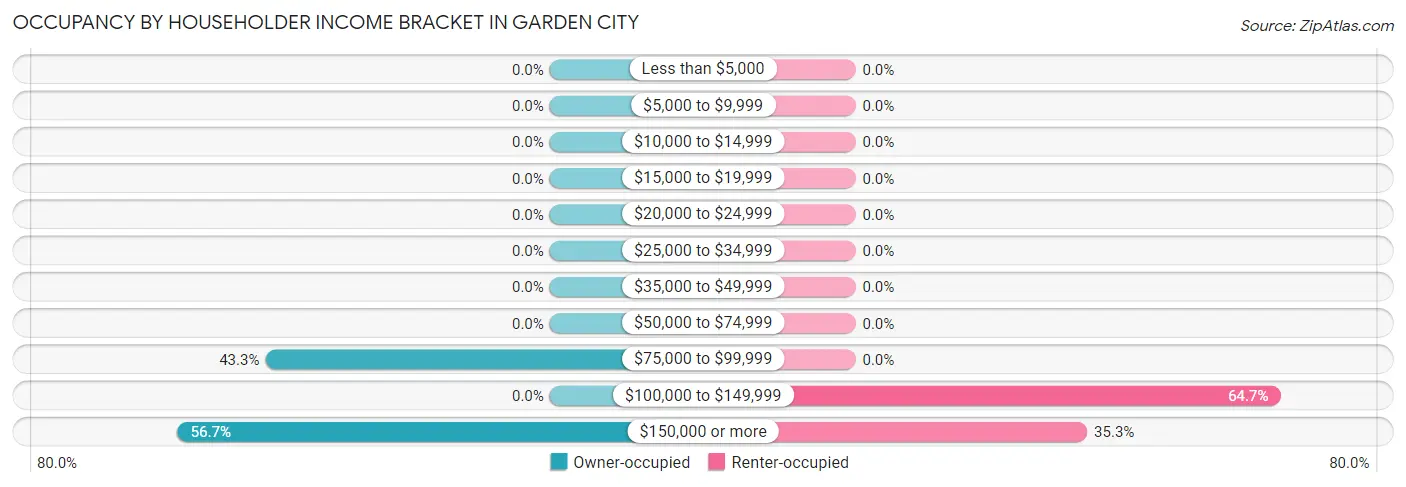
| Income Bracket | Owner-occupied | Renter-occupied |
| Less than $5,000 | 0 (0.0%) | 0 (0.0%) |
| $5,000 to $9,999 | 0 (0.0%) | 0 (0.0%) |
| $10,000 to $14,999 | 0 (0.0%) | 0 (0.0%) |
| $15,000 to $19,999 | 0 (0.0%) | 0 (0.0%) |
| $20,000 to $24,999 | 0 (0.0%) | 0 (0.0%) |
| $25,000 to $34,999 | 0 (0.0%) | 0 (0.0%) |
| $35,000 to $49,999 | 0 (0.0%) | 0 (0.0%) |
| $50,000 to $74,999 | 0 (0.0%) | 0 (0.0%) |
| $75,000 to $99,999 | 13 (43.3%) | 0 (0.0%) |
| $100,000 to $149,999 | 0 (0.0%) | 22 (64.7%) |
| $150,000 or more | 17 (56.7%) | 12 (35.3%) |
| Total | 30 (100.0%) | 34 (100.0%) |
Monthly Housing Cost Tiers in Garden City
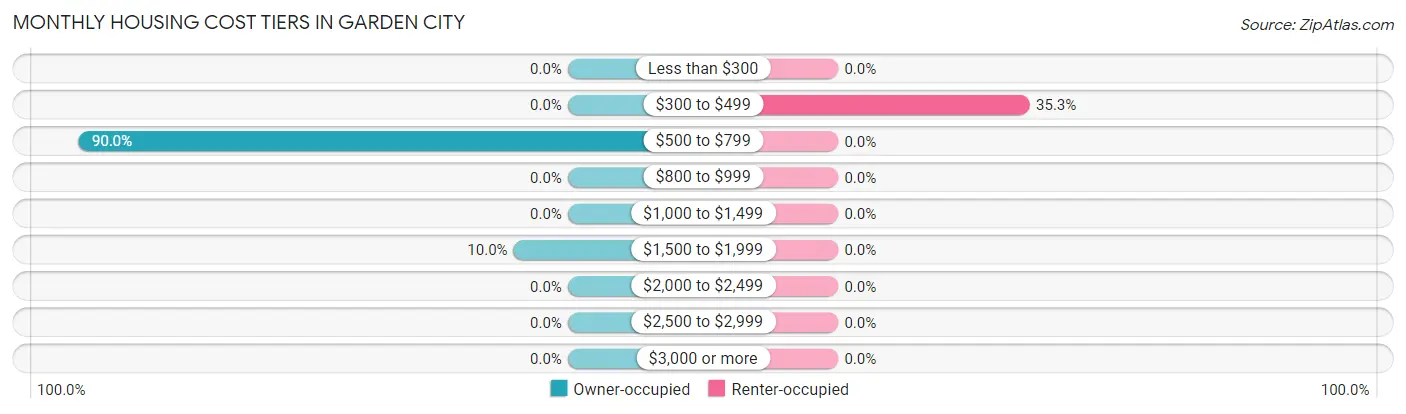
| Monthly Cost | Owner-occupied | Renter-occupied |
| Less than $300 | 0 (0.0%) | 0 (0.0%) |
| $300 to $499 | 0 (0.0%) | 12 (35.3%) |
| $500 to $799 | 27 (90.0%) | 0 (0.0%) |
| $800 to $999 | 0 (0.0%) | 0 (0.0%) |
| $1,000 to $1,499 | 0 (0.0%) | 0 (0.0%) |
| $1,500 to $1,999 | 3 (10.0%) | 0 (0.0%) |
| $2,000 to $2,499 | 0 (0.0%) | 0 (0.0%) |
| $2,500 to $2,999 | 0 (0.0%) | 0 (0.0%) |
| $3,000 or more | 0 (0.0%) | 0 (0.0%) |
| Total | 30 (100.0%) | 34 (100.0%) |
Physical Housing Characteristics in Garden City
Housing Structures in Garden City
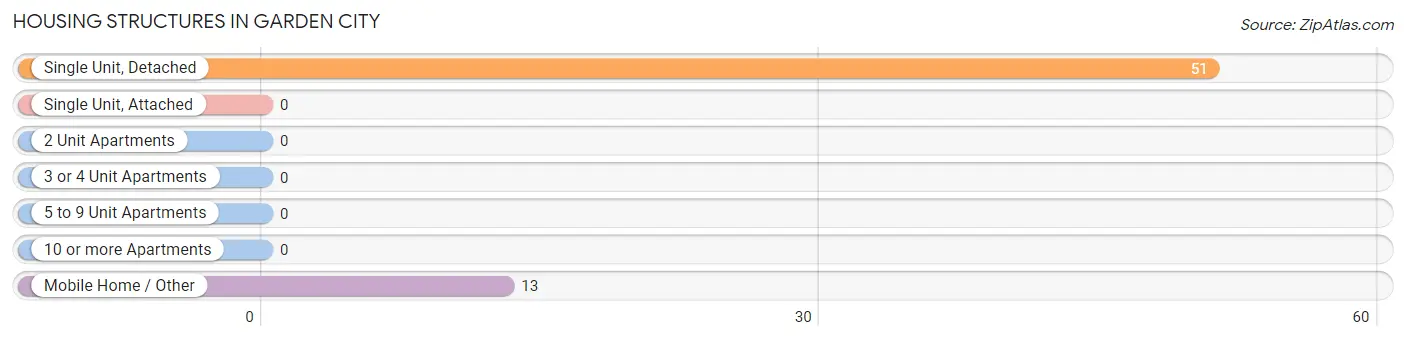
| Structure Type | # Housing Units | % Housing Units |
| Single Unit, Detached | 51 | 79.7% |
| Single Unit, Attached | 0 | 0.0% |
| 2 Unit Apartments | 0 | 0.0% |
| 3 or 4 Unit Apartments | 0 | 0.0% |
| 5 to 9 Unit Apartments | 0 | 0.0% |
| 10 or more Apartments | 0 | 0.0% |
| Mobile Home / Other | 13 | 20.3% |
| Total | 64 | 100.0% |
Housing Structures by Occupancy in Garden City
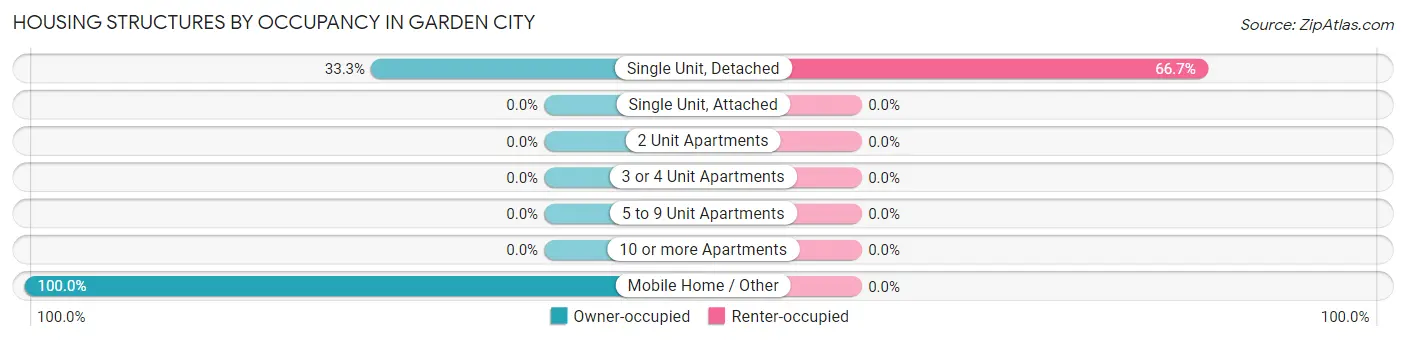
| Structure Type | Owner-occupied | Renter-occupied |
| Single Unit, Detached | 17 (33.3%) | 34 (66.7%) |
| Single Unit, Attached | 0 (0.0%) | 0 (0.0%) |
| 2 Unit Apartments | 0 (0.0%) | 0 (0.0%) |
| 3 or 4 Unit Apartments | 0 (0.0%) | 0 (0.0%) |
| 5 to 9 Unit Apartments | 0 (0.0%) | 0 (0.0%) |
| 10 or more Apartments | 0 (0.0%) | 0 (0.0%) |
| Mobile Home / Other | 13 (100.0%) | 0 (0.0%) |
| Total | 30 (46.9%) | 34 (53.1%) |
Housing Structures by Number of Rooms in Garden City
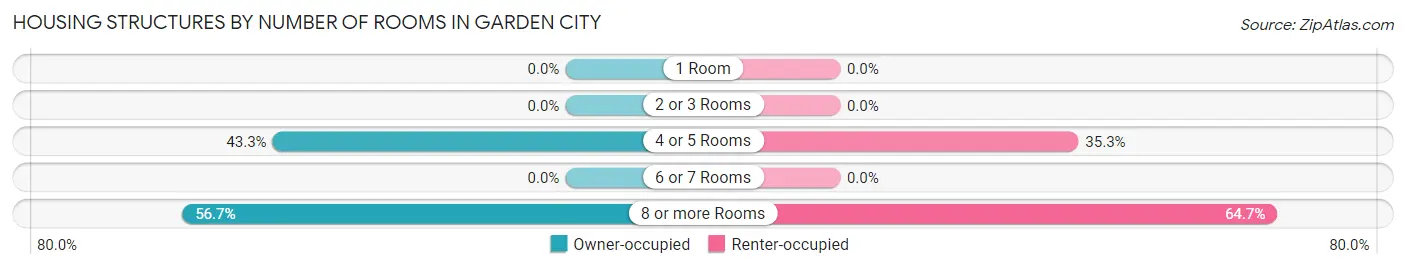
| Number of Rooms | Owner-occupied | Renter-occupied |
| 1 Room | 0 (0.0%) | 0 (0.0%) |
| 2 or 3 Rooms | 0 (0.0%) | 0 (0.0%) |
| 4 or 5 Rooms | 13 (43.3%) | 12 (35.3%) |
| 6 or 7 Rooms | 0 (0.0%) | 0 (0.0%) |
| 8 or more Rooms | 17 (56.7%) | 22 (64.7%) |
| Total | 30 (100.0%) | 34 (100.0%) |
Housing Structure by Heating Type in Garden City
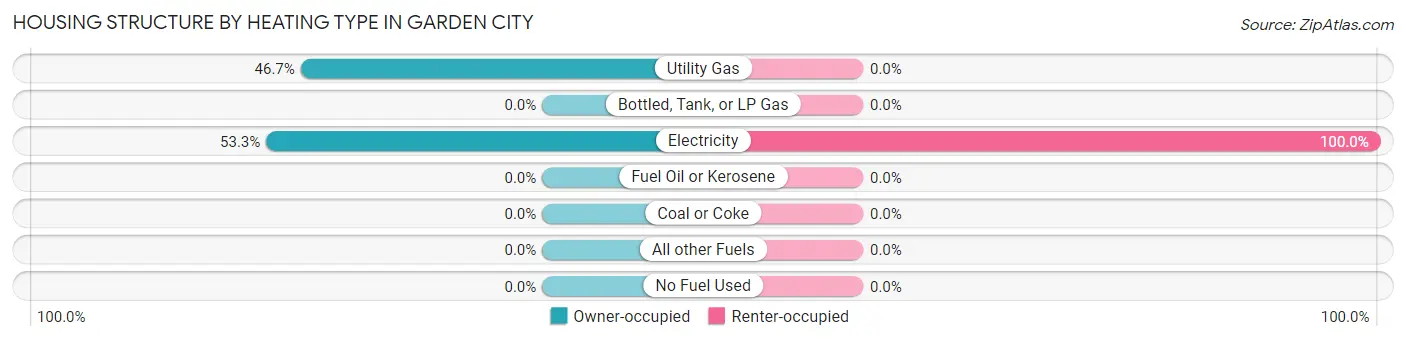
| Heating Type | Owner-occupied | Renter-occupied |
| Utility Gas | 14 (46.7%) | 0 (0.0%) |
| Bottled, Tank, or LP Gas | 0 (0.0%) | 0 (0.0%) |
| Electricity | 16 (53.3%) | 34 (100.0%) |
| Fuel Oil or Kerosene | 0 (0.0%) | 0 (0.0%) |
| Coal or Coke | 0 (0.0%) | 0 (0.0%) |
| All other Fuels | 0 (0.0%) | 0 (0.0%) |
| No Fuel Used | 0 (0.0%) | 0 (0.0%) |
| Total | 30 (100.0%) | 34 (100.0%) |
Household Vehicle Usage in Garden City
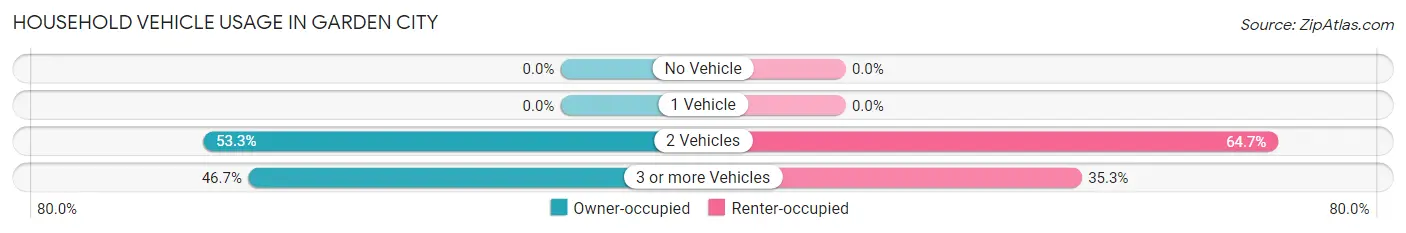
| Vehicles per Household | Owner-occupied | Renter-occupied |
| No Vehicle | 0 (0.0%) | 0 (0.0%) |
| 1 Vehicle | 0 (0.0%) | 0 (0.0%) |
| 2 Vehicles | 16 (53.3%) | 22 (64.7%) |
| 3 or more Vehicles | 14 (46.7%) | 12 (35.3%) |
| Total | 30 (100.0%) | 34 (100.0%) |
Real Estate & Mortgages in Garden City
Real Estate and Mortgage Overview in Garden City
| Characteristic | Without Mortgage | With Mortgage |
| Housing Units | 17 | 13 |
| Median Property Value | - | - |
| Median Household Income | - | - |
| Monthly Housing Costs | - | - |
| Real Estate Taxes | - | - |
Property Value by Mortgage Status in Garden City
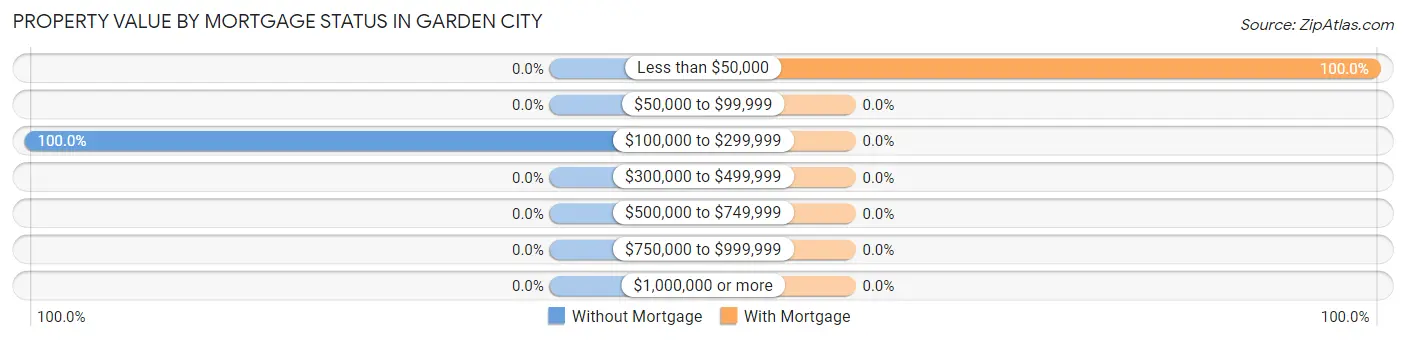
| Property Value | Without Mortgage | With Mortgage |
| Less than $50,000 | 0 (0.0%) | 13 (100.0%) |
| $50,000 to $99,999 | 0 (0.0%) | 0 (0.0%) |
| $100,000 to $299,999 | 17 (100.0%) | 0 (0.0%) |
| $300,000 to $499,999 | 0 (0.0%) | 0 (0.0%) |
| $500,000 to $749,999 | 0 (0.0%) | 0 (0.0%) |
| $750,000 to $999,999 | 0 (0.0%) | 0 (0.0%) |
| $1,000,000 or more | 0 (0.0%) | 0 (0.0%) |
| Total | 17 (100.0%) | 13 (100.0%) |
Household Income by Mortgage Status in Garden City
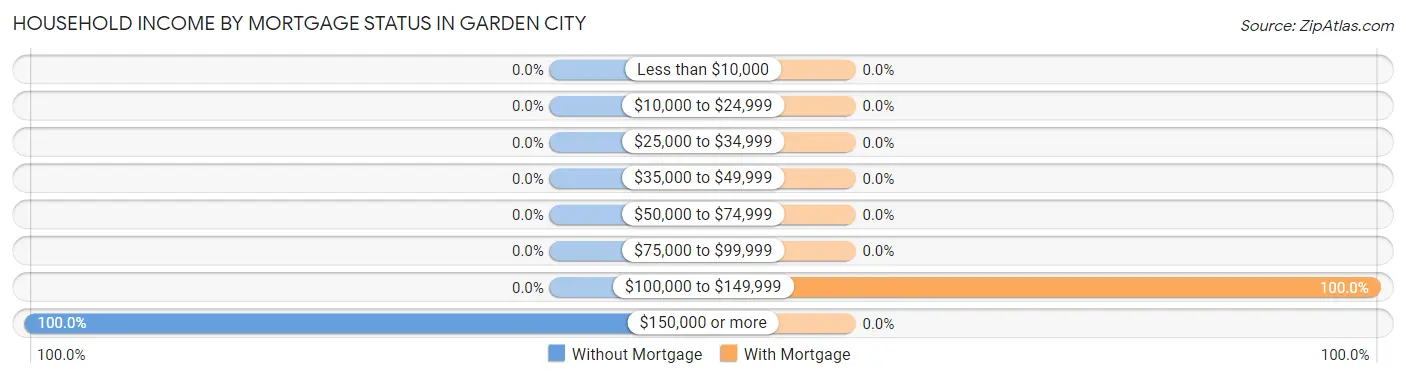
| Household Income | Without Mortgage | With Mortgage |
| Less than $10,000 | 0 (0.0%) | 0 (0.0%) |
| $10,000 to $24,999 | 0 (0.0%) | 0 (0.0%) |
| $25,000 to $34,999 | 0 (0.0%) | 0 (0.0%) |
| $35,000 to $49,999 | 0 (0.0%) | 0 (0.0%) |
| $50,000 to $74,999 | 0 (0.0%) | 0 (0.0%) |
| $75,000 to $99,999 | 0 (0.0%) | 0 (0.0%) |
| $100,000 to $149,999 | 0 (0.0%) | 13 (100.0%) |
| $150,000 or more | 17 (100.0%) | 0 (0.0%) |
| Total | 17 (100.0%) | 13 (100.0%) |
Property Value to Household Income Ratio in Garden City
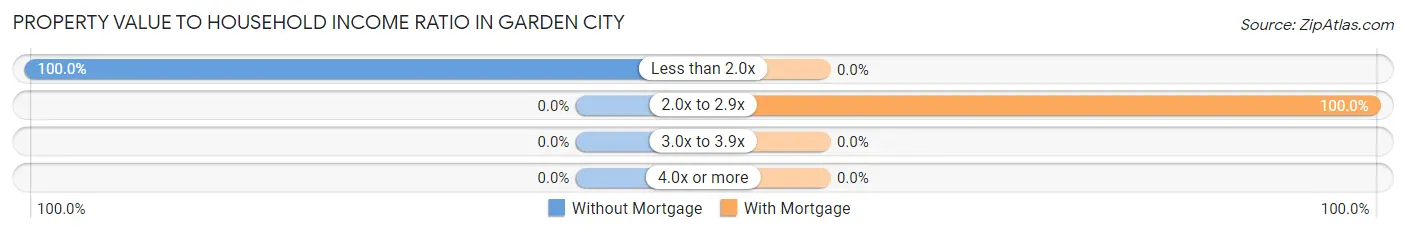
| Value-to-Income Ratio | Without Mortgage | With Mortgage |
| Less than 2.0x | 17 (100.0%) | 0 (0.0%) |
| 2.0x to 2.9x | 0 (0.0%) | 13 (100.0%) |
| 3.0x to 3.9x | 0 (0.0%) | 0 (0.0%) |
| 4.0x or more | 0 (0.0%) | 0 (0.0%) |
| Total | 17 (100.0%) | 13 (100.0%) |
Real Estate Taxes by Mortgage Status in Garden City
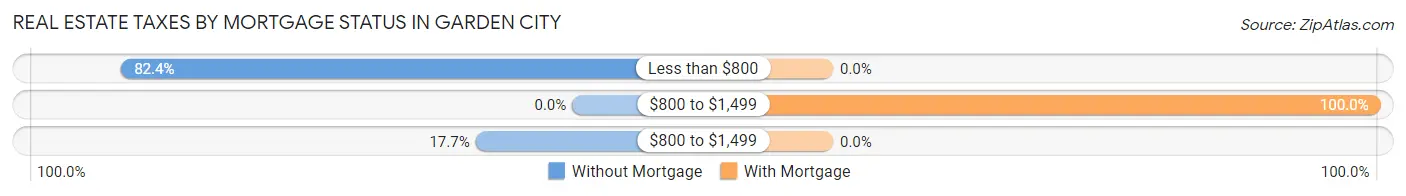
| Property Taxes | Without Mortgage | With Mortgage |
| Less than $800 | 14 (82.4%) | 0 (0.0%) |
| $800 to $1,499 | 0 (0.0%) | 13 (100.0%) |
| $800 to $1,499 | 3 (17.6%) | 0 (0.0%) |
| Total | 17 (100.0%) | 13 (100.0%) |
Health & Disability in Garden City
Health Insurance Coverage by Age in Garden City
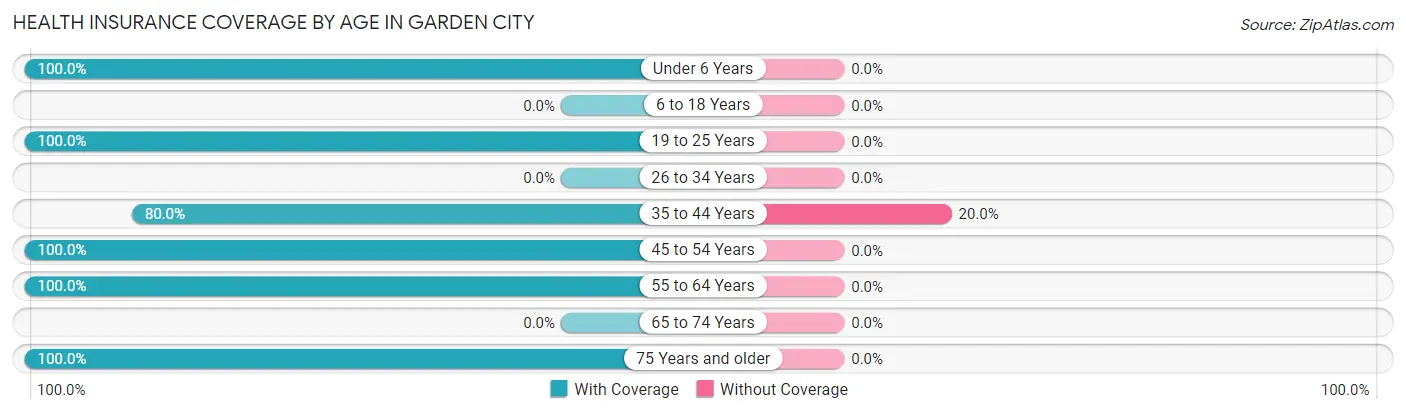
| Age Bracket | With Coverage | Without Coverage |
| Under 6 Years | 34 (100.0%) | 0 (0.0%) |
| 6 to 18 Years | 0 (0.0%) | 0 (0.0%) |
| 19 to 25 Years | 53 (100.0%) | 0 (0.0%) |
| 26 to 34 Years | 0 (0.0%) | 0 (0.0%) |
| 35 to 44 Years | 48 (80.0%) | 12 (20.0%) |
| 45 to 54 Years | 36 (100.0%) | 0 (0.0%) |
| 55 to 64 Years | 6 (100.0%) | 0 (0.0%) |
| 65 to 74 Years | 0 (0.0%) | 0 (0.0%) |
| 75 Years and older | 25 (100.0%) | 0 (0.0%) |
| Total | 202 (94.4%) | 12 (5.6%) |
Health Insurance Coverage by Citizenship Status in Garden City
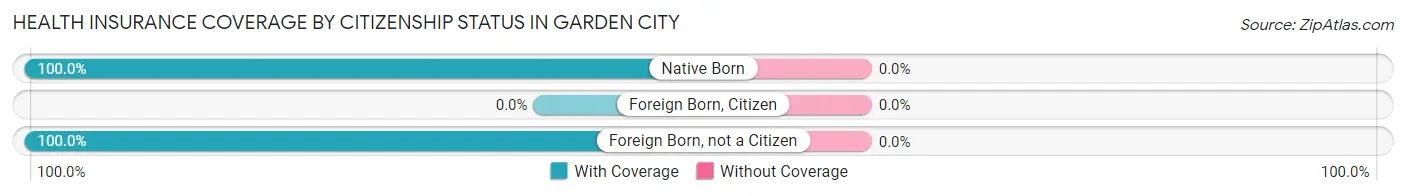
| Citizenship Status | With Coverage | Without Coverage |
| Native Born | 34 (100.0%) | 0 (0.0%) |
| Foreign Born, Citizen | 0 (0.0%) | 0 (0.0%) |
| Foreign Born, not a Citizen | 53 (100.0%) | 0 (0.0%) |
Health Insurance Coverage by Household Income in Garden City
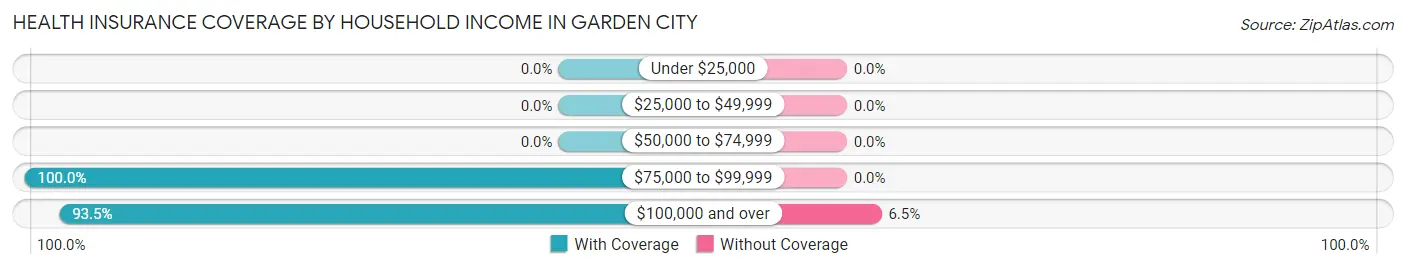
| Household Income | With Coverage | Without Coverage |
| Under $25,000 | 0 (0.0%) | 0 (0.0%) |
| $25,000 to $49,999 | 0 (0.0%) | 0 (0.0%) |
| $50,000 to $74,999 | 0 (0.0%) | 0 (0.0%) |
| $75,000 to $99,999 | 29 (100.0%) | 0 (0.0%) |
| $100,000 and over | 173 (93.5%) | 12 (6.5%) |
Public vs Private Health Insurance Coverage by Age in Garden City
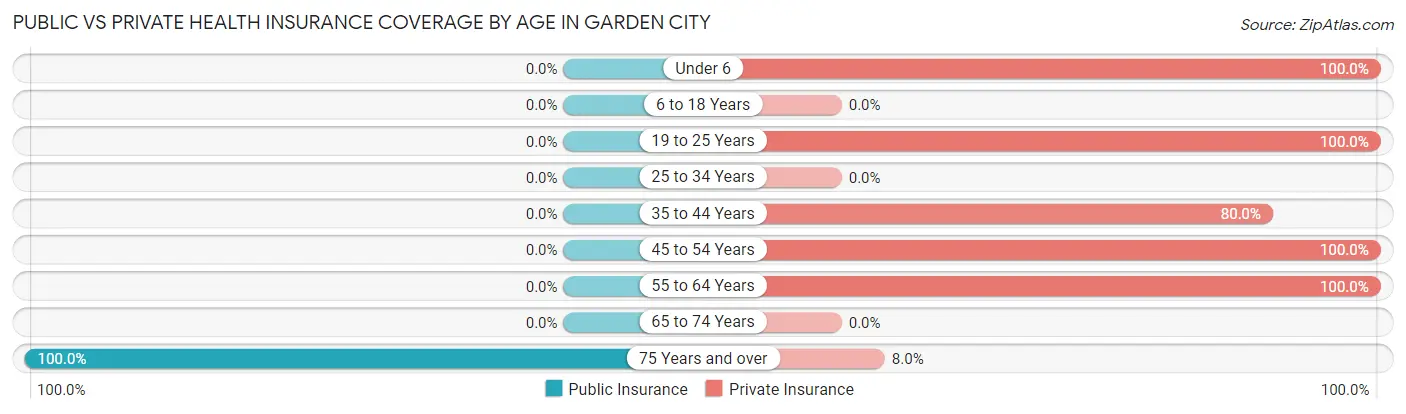
| Age Bracket | Public Insurance | Private Insurance |
| Under 6 | 0 (0.0%) | 34 (100.0%) |
| 6 to 18 Years | 0 (0.0%) | 0 (0.0%) |
| 19 to 25 Years | 0 (0.0%) | 53 (100.0%) |
| 25 to 34 Years | 0 (0.0%) | 0 (0.0%) |
| 35 to 44 Years | 0 (0.0%) | 48 (80.0%) |
| 45 to 54 Years | 0 (0.0%) | 36 (100.0%) |
| 55 to 64 Years | 0 (0.0%) | 6 (100.0%) |
| 65 to 74 Years | 0 (0.0%) | 0 (0.0%) |
| 75 Years and over | 25 (100.0%) | 2 (8.0%) |
| Total | 25 (11.7%) | 179 (83.6%) |
Disability Status by Sex by Age in Garden City
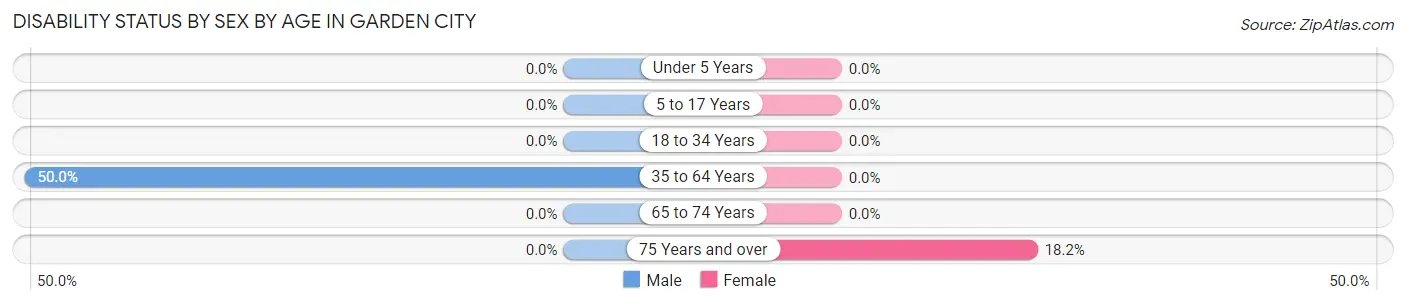
| Age Bracket | Male | Female |
| Under 5 Years | 0 (0.0%) | 0 (0.0%) |
| 5 to 17 Years | 0 (0.0%) | 0 (0.0%) |
| 18 to 34 Years | 0 (0.0%) | 0 (0.0%) |
| 35 to 64 Years | 26 (50.0%) | 0 (0.0%) |
| 65 to 74 Years | 0 (0.0%) | 0 (0.0%) |
| 75 Years and over | 0 (0.0%) | 2 (18.2%) |
Disability Class by Sex by Age in Garden City
Disability Class: Hearing Difficulty
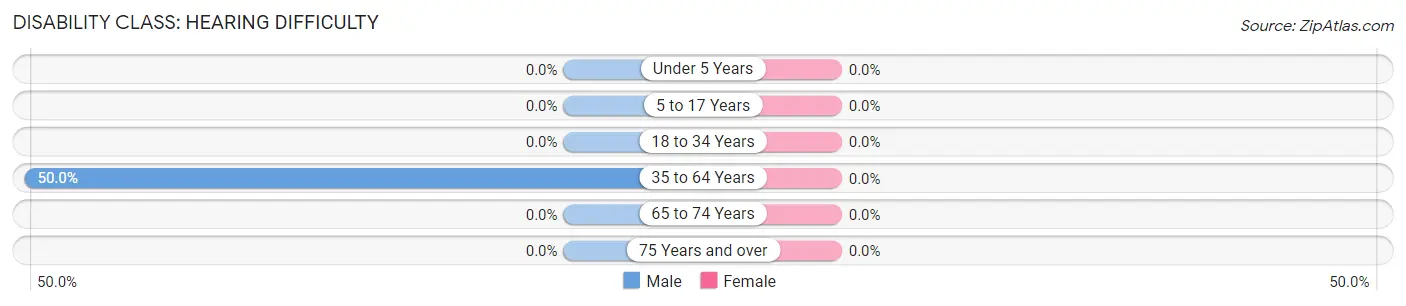
| Age Bracket | Male | Female |
| Under 5 Years | 0 (0.0%) | 0 (0.0%) |
| 5 to 17 Years | 0 (0.0%) | 0 (0.0%) |
| 18 to 34 Years | 0 (0.0%) | 0 (0.0%) |
| 35 to 64 Years | 26 (50.0%) | 0 (0.0%) |
| 65 to 74 Years | 0 (0.0%) | 0 (0.0%) |
| 75 Years and over | 0 (0.0%) | 0 (0.0%) |
Disability Class: Vision Difficulty
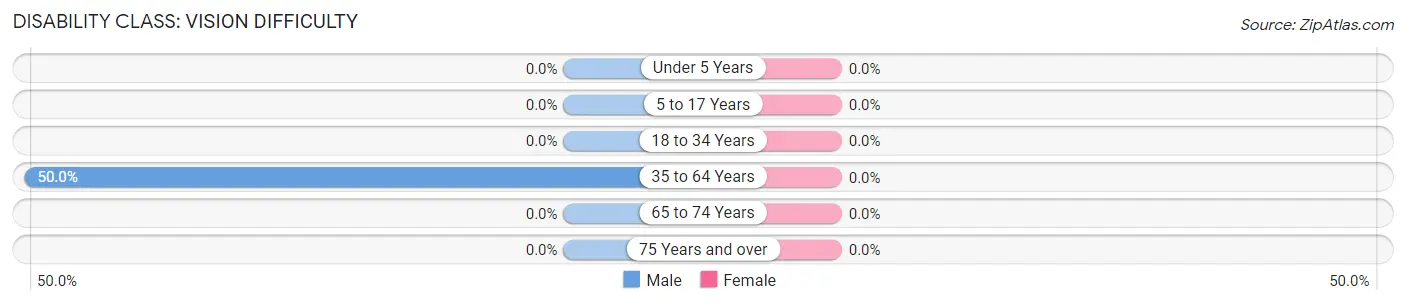
| Age Bracket | Male | Female |
| Under 5 Years | 0 (0.0%) | 0 (0.0%) |
| 5 to 17 Years | 0 (0.0%) | 0 (0.0%) |
| 18 to 34 Years | 0 (0.0%) | 0 (0.0%) |
| 35 to 64 Years | 26 (50.0%) | 0 (0.0%) |
| 65 to 74 Years | 0 (0.0%) | 0 (0.0%) |
| 75 Years and over | 0 (0.0%) | 0 (0.0%) |
Disability Class: Cognitive Difficulty
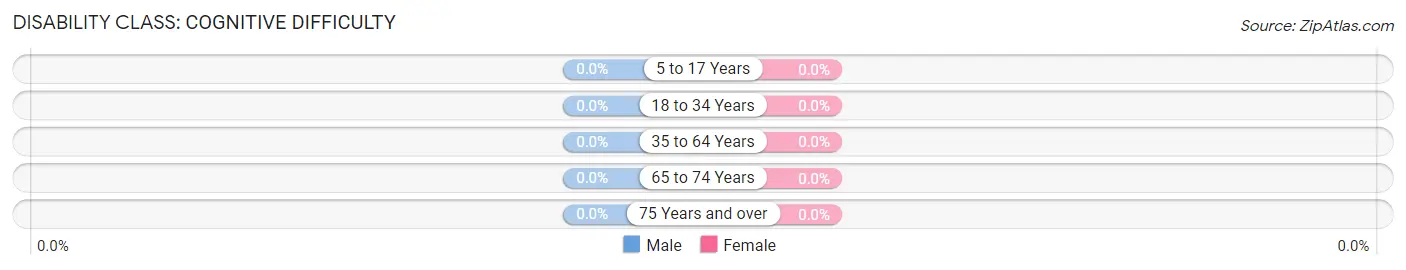
| Age Bracket | Male | Female |
| 5 to 17 Years | 0 (0.0%) | 0 (0.0%) |
| 18 to 34 Years | 0 (0.0%) | 0 (0.0%) |
| 35 to 64 Years | 0 (0.0%) | 0 (0.0%) |
| 65 to 74 Years | 0 (0.0%) | 0 (0.0%) |
| 75 Years and over | 0 (0.0%) | 0 (0.0%) |
Disability Class: Ambulatory Difficulty
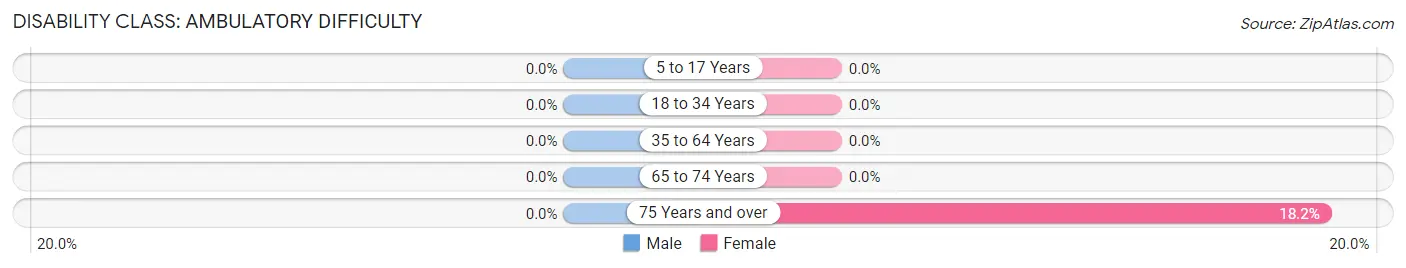
| Age Bracket | Male | Female |
| 5 to 17 Years | 0 (0.0%) | 0 (0.0%) |
| 18 to 34 Years | 0 (0.0%) | 0 (0.0%) |
| 35 to 64 Years | 0 (0.0%) | 0 (0.0%) |
| 65 to 74 Years | 0 (0.0%) | 0 (0.0%) |
| 75 Years and over | 0 (0.0%) | 2 (18.2%) |
Disability Class: Self-Care Difficulty
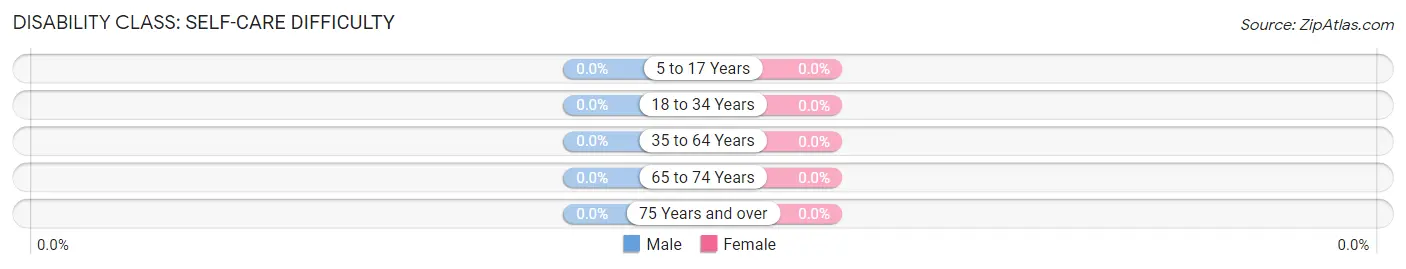
| Age Bracket | Male | Female |
| 5 to 17 Years | 0 (0.0%) | 0 (0.0%) |
| 18 to 34 Years | 0 (0.0%) | 0 (0.0%) |
| 35 to 64 Years | 0 (0.0%) | 0 (0.0%) |
| 65 to 74 Years | 0 (0.0%) | 0 (0.0%) |
| 75 Years and over | 0 (0.0%) | 0 (0.0%) |
Technology Access in Garden City
Computing Device Access in Garden City
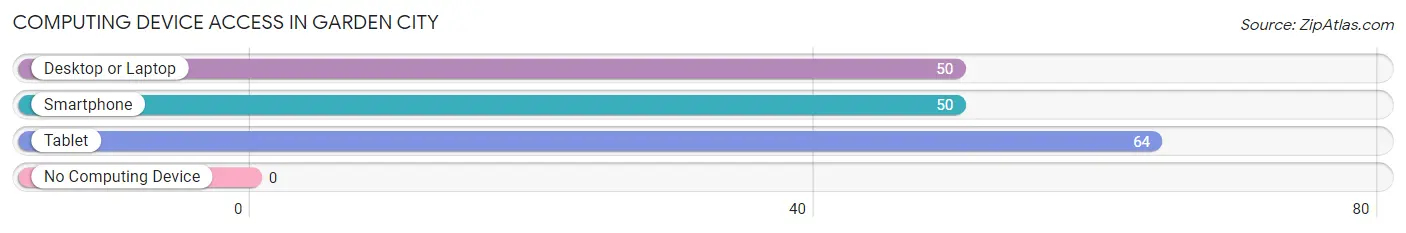
| Device Type | # Households | % Households |
| Desktop or Laptop | 50 | 78.1% |
| Smartphone | 50 | 78.1% |
| Tablet | 64 | 100.0% |
| No Computing Device | 0 | 0.0% |
| Total | 64 | 100.0% |
Internet Access in Garden City
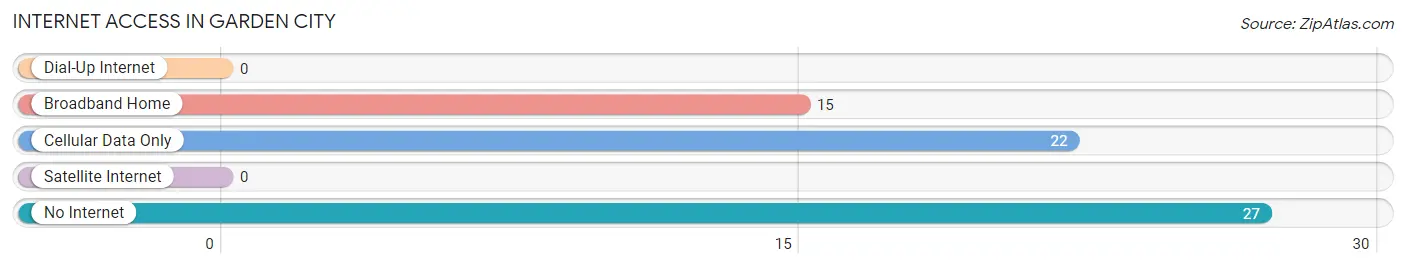
| Internet Type | # Households | % Households |
| Dial-Up Internet | 0 | 0.0% |
| Broadband Home | 15 | 23.4% |
| Cellular Data Only | 22 | 34.4% |
| Satellite Internet | 0 | 0.0% |
| No Internet | 27 | 42.2% |
| Total | 64 | 100.0% |
Garden City Summary
Garden City is a small town located in Glasscock County, Texas. It is situated about 25 miles south of Big Spring and about 25 miles east of Midland. The town was founded in 1891 and was named after the nearby Garden City Lake. The population of Garden City was estimated to be 1,072 in 2019.
Geography
Garden City is located in the High Plains region of Texas. The town is situated at an elevation of 2,845 feet above sea level. The terrain is mostly flat with some rolling hills. The climate is semi-arid with hot summers and mild winters. The average annual precipitation is about 17 inches.
Economy
Garden City’s economy is largely based on agriculture. The town is home to several farms and ranches that produce cotton, wheat, sorghum, and other crops. The town also has a few small businesses, including a grocery store, a hardware store, and a few restaurants.
Demographics
Garden City is a predominantly white town. According to the 2019 census, the population was estimated to be 1,072. Of this population, 94.3% were white, 2.2% were Hispanic or Latino, 1.2% were African American, 0.7% were Asian, and 1.6% were from other races. The median household income was $41,250 and the median home value was $90,000.
History
Garden City was founded in 1891 by a group of settlers from Missouri. The town was named after the nearby Garden City Lake. The town grew slowly over the years and by the early 1900s, it had a population of about 500. The town was incorporated in 1909 and the first mayor was elected in 1910.
In the 1920s, the town experienced a period of growth due to the discovery of oil in the area. The population increased to over 1,000 by the 1930s. The town continued to grow throughout the 20th century and by the 2000s, the population had reached 1,072.
Today, Garden City is a small but vibrant town. The town is home to several businesses, including a grocery store, a hardware store, and a few restaurants. The town also has a few churches and a museum. The town is a popular destination for tourists who come to enjoy the peaceful atmosphere and the beautiful scenery.
Common Questions
What is the Total Population of Garden City?
Total Population of Garden City is 214.
What is the Total Male Population of Garden City?
Total Male Population of Garden City is 131.
What is the Total Female Population of Garden City?
Total Female Population of Garden City is 83.
What is the Ratio of Males per 100 Females in Garden City?
There are 157.83 Males per 100 Females in Garden City.
What is the Ratio of Females per 100 Males in Garden City?
There are 63.36 Females per 100 Males in Garden City.
What is the Median Population Age in Garden City?
Median Population Age in Garden City is 35.8 Years.
What is the Average Family Size in Garden City
Average Family Size in Garden City is 3.3 People.
What is the Average Household Size in Garden City
Average Household Size in Garden City is 3.3 People.
What is Per Capita Income in Garden City?
Per Capita income in Garden City is $55,466.
What is the Median Family Income in Garden City?
Median Family Income in Garden City is $134,659.
What is the Median Household income in Garden City?
Median Household Income in Garden City is $134,659.
What is Income or Wage Gap in Garden City?
Income or Wage Gap in Garden City is 93.8%.
Women in Garden City earn 6.2 cents for every dollar earned by a man.
What is Inequality or Gini Index in Garden City?
Inequality or Gini Index in Garden City is 0.28.
How Large is the Labor Force in Garden City?
There are 99 People in the Labor Forcein in Garden City.
What is the Percentage of People in the Labor Force in Garden City?
55.0% of People are in the Labor Force in Garden City.