East Tawakoni, TX
East Tawakoni Map
East Tawakoni Overview
893
TOTAL POPULATION
445
MALE POPULATION
448
FEMALE POPULATION
99.33
MALES / 100 FEMALES
100.67
FEMALES / 100 MALES
49.0
MEDIAN AGE
3.0
AVG FAMILY SIZE
2.5
AVG HOUSEHOLD SIZE
$35,536
PER CAPITA INCOME
$61,250
AVG FAMILY INCOME
$48,992
AVG HOUSEHOLD INCOME
3.0%
WAGE / INCOME GAP [ % ]
97.0¢/ $1
WAGE / INCOME GAP [ $ ]
0.42
INEQUALITY / GINI INDEX
460
LABOR FORCE [ PEOPLE ]
58.5%
PERCENT IN LABOR FORCE
5.2%
UNEMPLOYMENT RATE
East Tawakoni Area Codes
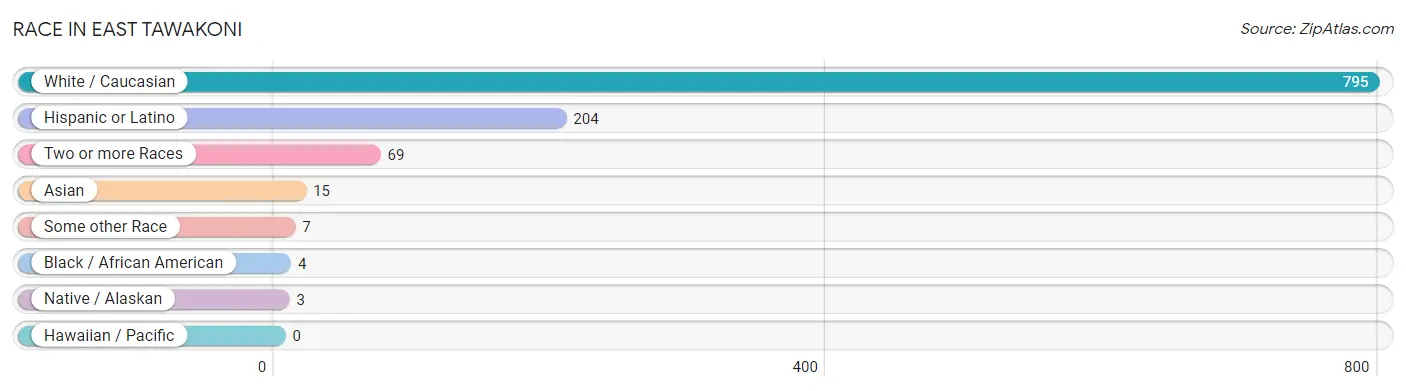
Race in East Tawakoni
The most populous races in East Tawakoni are White / Caucasian (795 | 89.0%), Hispanic or Latino (204 | 22.8%), and Two or more Races (69 | 7.7%).
| Race | # Population | % Population |
| Asian | 15 | 1.7% |
| Black / African American | 4 | 0.4% |
| Hawaiian / Pacific | 0 | 0.0% |
| Hispanic or Latino | 204 | 22.8% |
| Native / Alaskan | 3 | 0.3% |
| White / Caucasian | 795 | 89.0% |
| Two or more Races | 69 | 7.7% |
| Some other Race | 7 | 0.8% |
| Total | 893 | 100.0% |
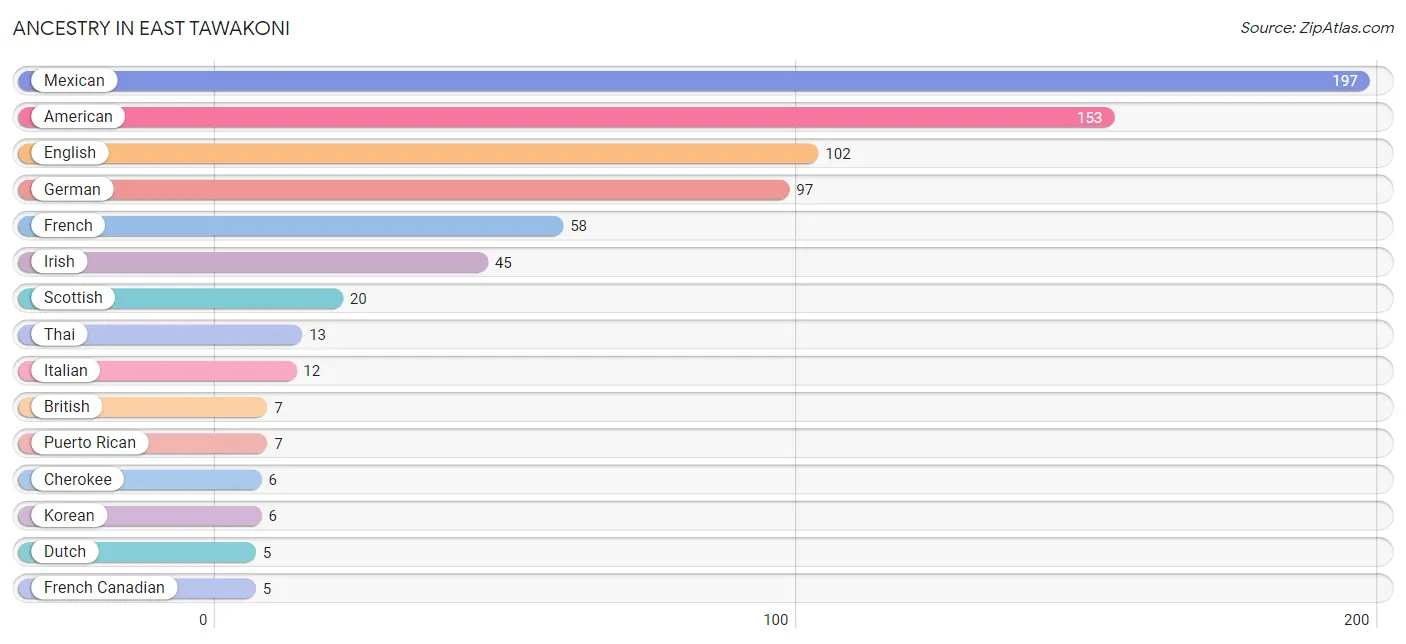
Ancestry in East Tawakoni
The most populous ancestries reported in East Tawakoni are Mexican (197 | 22.1%), American (153 | 17.1%), English (102 | 11.4%), German (97 | 10.9%), and French (58 | 6.5%), together accounting for 68.0% of all East Tawakoni residents.
| Ancestry | # Population | % Population |
| American | 153 | 17.1% |
| Austrian | 4 | 0.4% |
| British | 7 | 0.8% |
| Cherokee | 6 | 0.7% |
| Choctaw | 2 | 0.2% |
| Creek | 4 | 0.4% |
| Czech | 2 | 0.2% |
| Danish | 1 | 0.1% |
| Dutch | 5 | 0.6% |
| English | 102 | 11.4% |
| European | 3 | 0.3% |
| Finnish | 2 | 0.2% |
| French | 58 | 6.5% |
| French Canadian | 5 | 0.6% |
| German | 97 | 10.9% |
| Guamanian / Chamorro | 4 | 0.4% |
| Hungarian | 4 | 0.4% |
| Irish | 45 | 5.0% |
| Italian | 12 | 1.3% |
| Japanese | 2 | 0.2% |
| Korean | 6 | 0.7% |
| Maltese | 1 | 0.1% |
| Mexican | 197 | 22.1% |
| Polish | 4 | 0.4% |
| Puerto Rican | 7 | 0.8% |
| Scandinavian | 4 | 0.4% |
| Scotch-Irish | 3 | 0.3% |
| Scottish | 20 | 2.2% |
| Sioux | 1 | 0.1% |
| Thai | 13 | 1.5% |
| Welsh | 3 | 0.3% | View All 31 Rows |
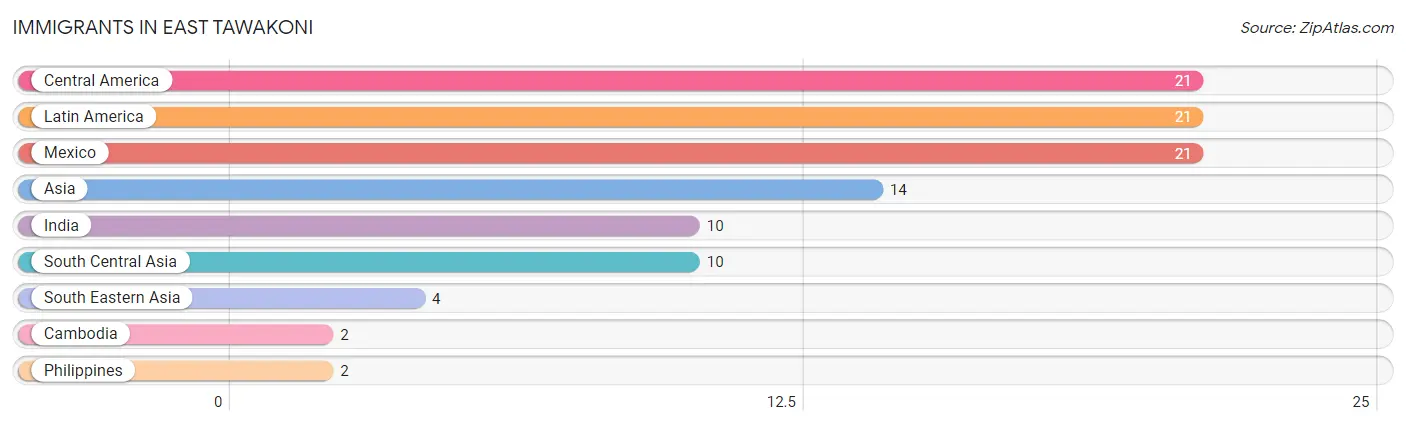
Immigrants in East Tawakoni
The most numerous immigrant groups reported in East Tawakoni came from Central America (21 | 2.4%), Latin America (21 | 2.4%), Mexico (21 | 2.4%), Asia (14 | 1.6%), and India (10 | 1.1%), together accounting for 9.7% of all East Tawakoni residents.
| Immigration Origin | # Population | % Population |
| Asia | 14 | 1.6% |
| Cambodia | 2 | 0.2% |
| Central America | 21 | 2.4% |
| India | 10 | 1.1% |
| Latin America | 21 | 2.4% |
| Mexico | 21 | 2.4% |
| Philippines | 2 | 0.2% |
| South Central Asia | 10 | 1.1% |
| South Eastern Asia | 4 | 0.4% | View All 9 Rows |
Sex and Age in East Tawakoni
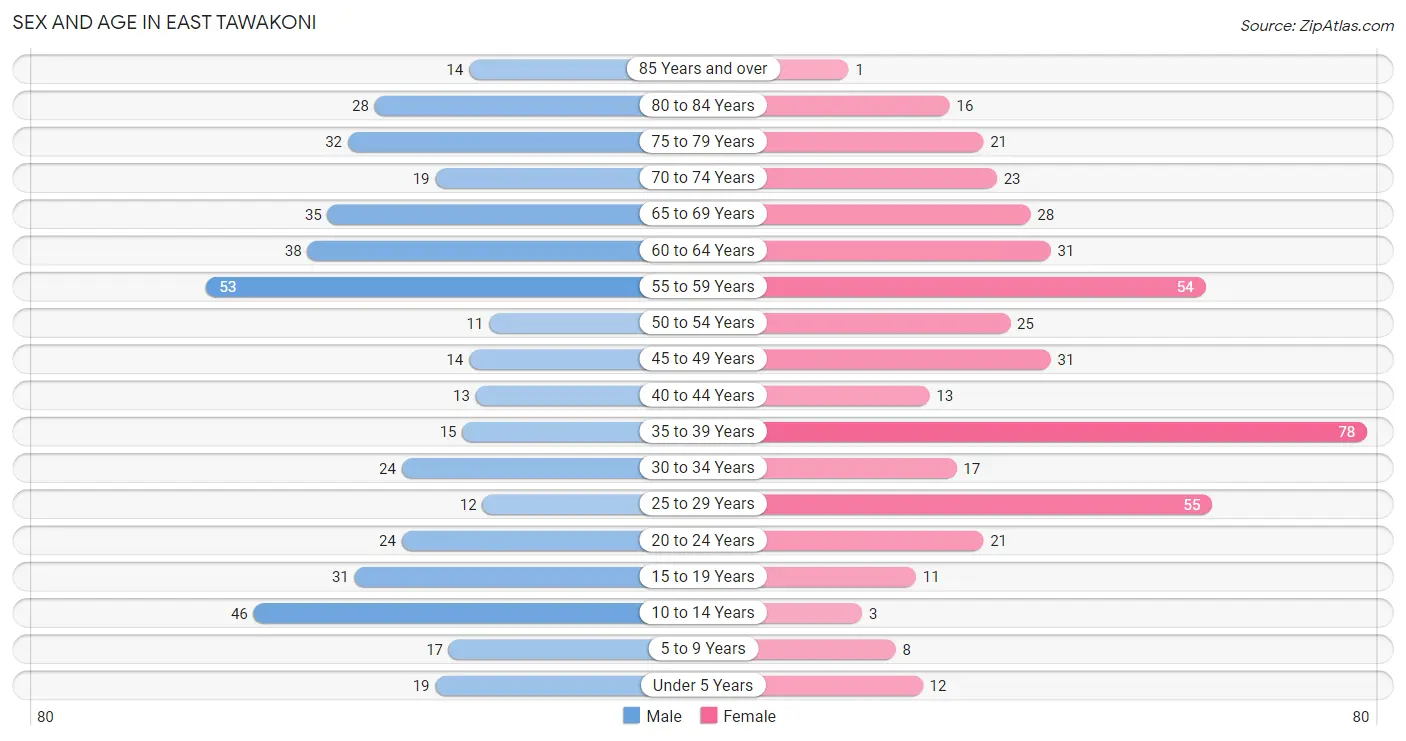
Sex and Age in East Tawakoni
The most populous age groups in East Tawakoni are 55 to 59 Years (53 | 11.9%) for men and 35 to 39 Years (78 | 17.4%) for women.
| Age Bracket | Male | Female |
| Under 5 Years | 19 (4.3%) | 12 (2.7%) |
| 5 to 9 Years | 17 (3.8%) | 8 (1.8%) |
| 10 to 14 Years | 46 (10.3%) | 3 (0.7%) |
| 15 to 19 Years | 31 (7.0%) | 11 (2.5%) |
| 20 to 24 Years | 24 (5.4%) | 21 (4.7%) |
| 25 to 29 Years | 12 (2.7%) | 55 (12.3%) |
| 30 to 34 Years | 24 (5.4%) | 17 (3.8%) |
| 35 to 39 Years | 15 (3.4%) | 78 (17.4%) |
| 40 to 44 Years | 13 (2.9%) | 13 (2.9%) |
| 45 to 49 Years | 14 (3.2%) | 31 (6.9%) |
| 50 to 54 Years | 11 (2.5%) | 25 (5.6%) |
| 55 to 59 Years | 53 (11.9%) | 54 (12.0%) |
| 60 to 64 Years | 38 (8.5%) | 31 (6.9%) |
| 65 to 69 Years | 35 (7.9%) | 28 (6.2%) |
| 70 to 74 Years | 19 (4.3%) | 23 (5.1%) |
| 75 to 79 Years | 32 (7.2%) | 21 (4.7%) |
| 80 to 84 Years | 28 (6.3%) | 16 (3.6%) |
| 85 Years and over | 14 (3.2%) | 1 (0.2%) |
| Total | 445 (100.0%) | 448 (100.0%) |
Families and Households in East Tawakoni
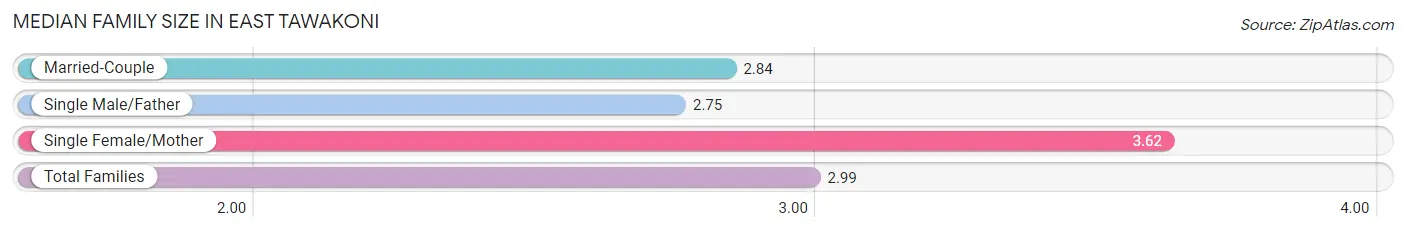
Median Family Size in East Tawakoni
The median family size in East Tawakoni is 2.99 persons per family, with single female/mother families (47 | 19.8%) accounting for the largest median family size of 3.62 persons per family. On the other hand, single male/father families (24 | 10.1%) represent the smallest median family size with 2.75 persons per family.
| Family Type | # Families | Family Size |
| Married-Couple | 167 (70.2%) | 2.84 |
| Single Male/Father | 24 (10.1%) | 2.75 |
| Single Female/Mother | 47 (19.8%) | 3.62 |
| Total Families | 238 (100.0%) | 2.99 |
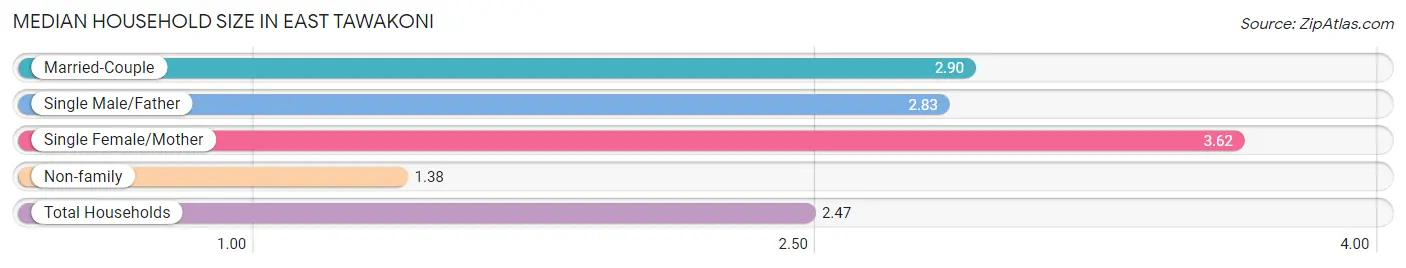
Median Household Size in East Tawakoni
The median household size in East Tawakoni is 2.47 persons per household, with single female/mother households (47 | 13.0%) accounting for the largest median household size of 3.62 persons per household. non-family households (123 | 34.1%) represent the smallest median household size with 1.38 persons per household.
| Household Type | # Households | Household Size |
| Married-Couple | 167 (46.3%) | 2.90 |
| Single Male/Father | 24 (6.7%) | 2.83 |
| Single Female/Mother | 47 (13.0%) | 3.62 |
| Non-family | 123 (34.1%) | 1.38 |
| Total Households | 361 (100.0%) | 2.47 |
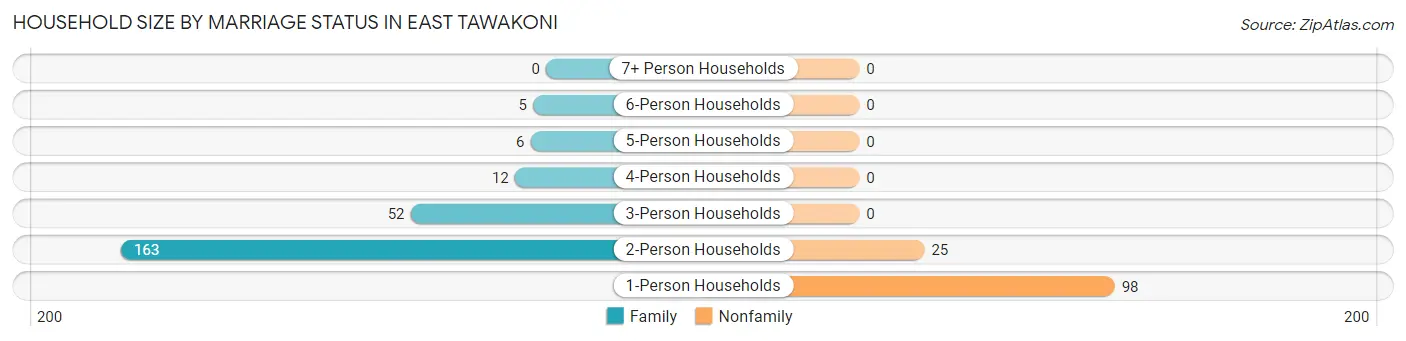
Household Size by Marriage Status in East Tawakoni
Out of a total of 361 households in East Tawakoni, 238 (65.9%) are family households, while 123 (34.1%) are nonfamily households. The most numerous type of family households are 2-person households, comprising 163, and the most common type of nonfamily households are 1-person households, comprising 98.
| Household Size | Family Households | Nonfamily Households |
| 1-Person Households | - | 98 (27.2%) |
| 2-Person Households | 163 (45.2%) | 25 (6.9%) |
| 3-Person Households | 52 (14.4%) | 0 (0.0%) |
| 4-Person Households | 12 (3.3%) | 0 (0.0%) |
| 5-Person Households | 6 (1.7%) | 0 (0.0%) |
| 6-Person Households | 5 (1.4%) | 0 (0.0%) |
| 7+ Person Households | 0 (0.0%) | 0 (0.0%) |
| Total | 238 (65.9%) | 123 (34.1%) |
Female Fertility in East Tawakoni
Fertility by Age in East Tawakoni
Average fertility rate in East Tawakoni is 31.0 births per 1,000 women. Women in the age bracket of 35 to 50 years have the highest fertility rate with 41.0 births per 1,000 women. Women in the age bracket of 35 to 50 years acount for 71.4% of all women with births.
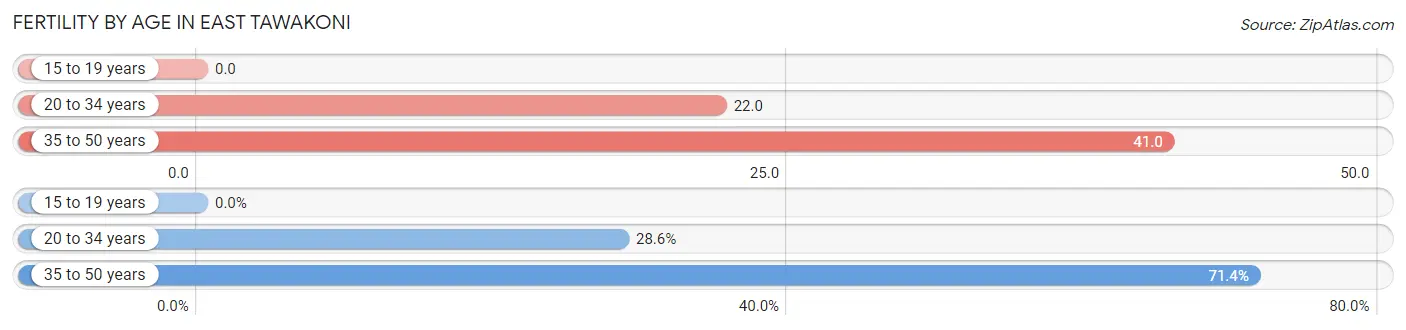
| Age Bracket | Women with Births | Births / 1,000 Women |
| 15 to 19 years | 0 (0.0%) | 0.0 |
| 20 to 34 years | 2 (28.6%) | 22.0 |
| 35 to 50 years | 5 (71.4%) | 41.0 |
| Total | 7 (100.0%) | 31.0 |
Fertility by Age by Marriage Status in East Tawakoni
28.6% of women with births (7) in East Tawakoni are married. The highest percentage of unmarried women with births falls into 35 to 50 years age bracket with 100.0% of them unmarried at the time of birth, while the lowest percentage of unmarried women with births belong to 20 to 34 years age bracket with 0.0% of them unmarried.
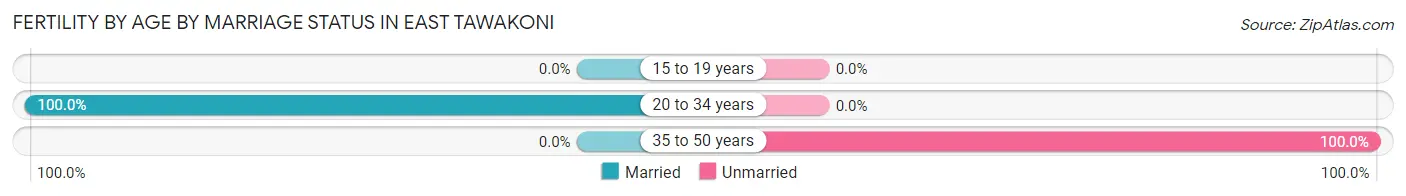
| Age Bracket | Married | Unmarried |
| 15 to 19 years | 0 (0.0%) | 0 (0.0%) |
| 20 to 34 years | 2 (100.0%) | 0 (0.0%) |
| 35 to 50 years | 0 (0.0%) | 5 (100.0%) |
| Total | 2 (28.6%) | 5 (71.4%) |
Fertility by Education in East Tawakoni
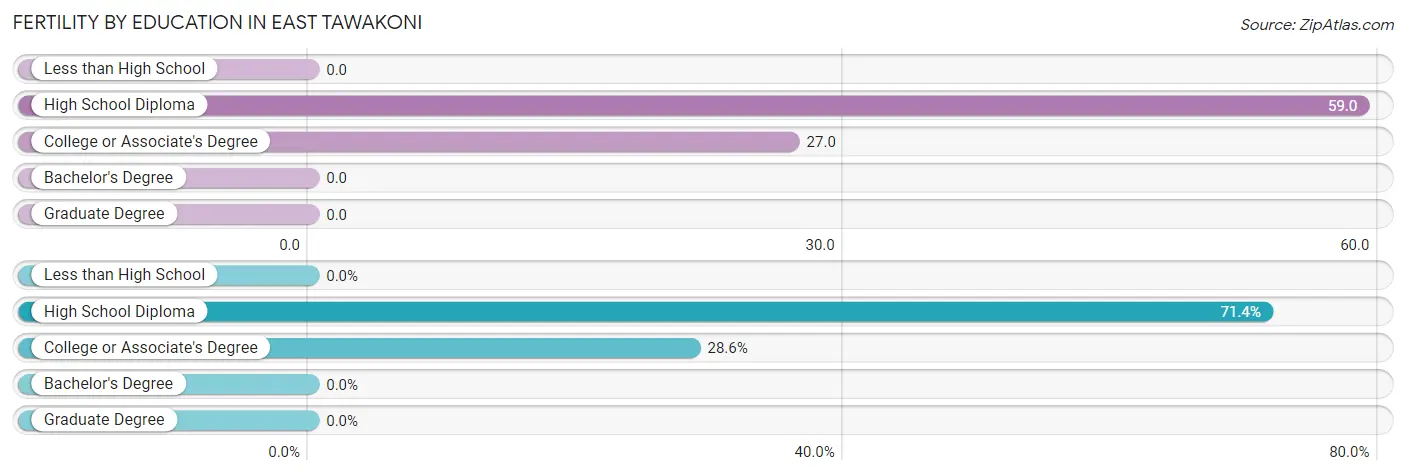
| Educational Attainment | Women with Births | Births / 1,000 Women |
| Less than High School | 0 (0.0%) | 0.0 |
| High School Diploma | 5 (71.4%) | 59.0 |
| College or Associate's Degree | 2 (28.6%) | 27.0 |
| Bachelor's Degree | 0 (0.0%) | 0.0 |
| Graduate Degree | 0 (0.0%) | 0.0 |
| Total | 7 (100.0%) | 31.0 |
Fertility by Education by Marriage Status in East Tawakoni
71.4% of women with births in East Tawakoni are unmarried. Women with the educational attainment of college or associate's degree are most likely to be married with 100.0% of them married at childbirth, while women with the educational attainment of high school diploma are least likely to be married with 100.0% of them unmarried at childbirth.
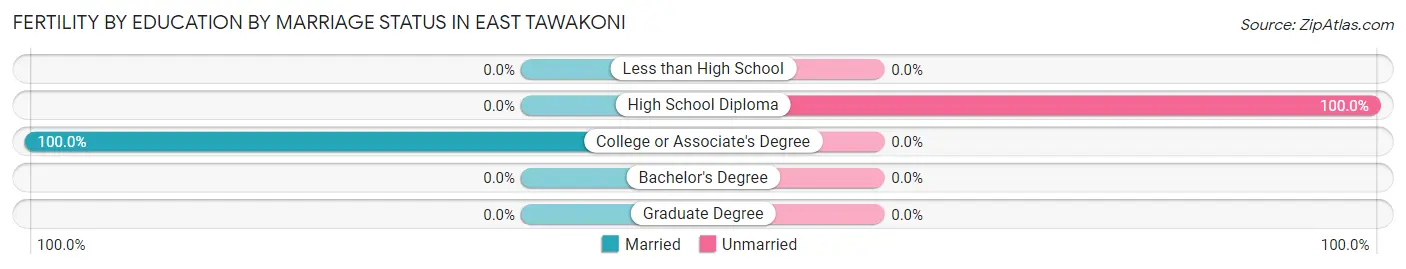
| Educational Attainment | Married | Unmarried |
| Less than High School | 0 (0.0%) | 0 (0.0%) |
| High School Diploma | 0 (0.0%) | 5 (100.0%) |
| College or Associate's Degree | 2 (100.0%) | 0 (0.0%) |
| Bachelor's Degree | 0 (0.0%) | 0 (0.0%) |
| Graduate Degree | 0 (0.0%) | 0 (0.0%) |
| Total | 2 (28.6%) | 5 (71.4%) |
Income in East Tawakoni
Income Overview in East Tawakoni
Per Capita Income in East Tawakoni is $35,536, while median incomes of families and households are $61,250 and $48,992 respectively.
| Characteristic | Number | Measure |
| Per Capita Income | 893 | $35,536 |
| Median Family Income | 238 | $61,250 |
| Mean Family Income | 238 | $83,529 |
| Median Household Income | 361 | $48,992 |
| Mean Household Income | 361 | $72,093 |
| Income Deficit | 238 | $0 |
| Wage / Income Gap (%) | 893 | 3.03% |
| Wage / Income Gap ($) | 893 | 96.97¢ per $1 |
| Gini / Inequality Index | 893 | 0.42 |
Earnings by Sex in East Tawakoni
Average Earnings in East Tawakoni are $34,861, $34,545 for men and $35,625 for women, a difference of 3.0%.
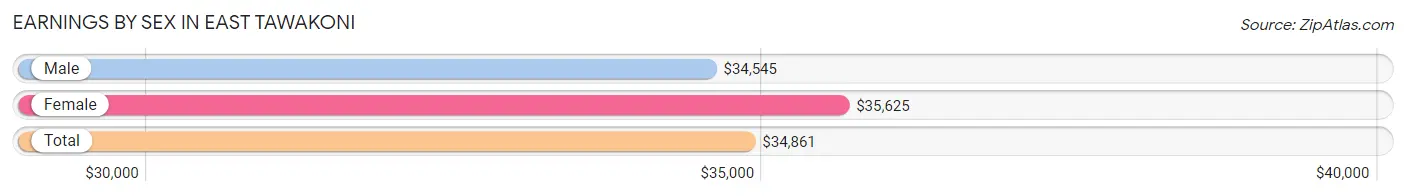
| Sex | Number | Average Earnings |
| Male | 194 (40.8%) | $34,545 |
| Female | 281 (59.2%) | $35,625 |
| Total | 475 (100.0%) | $34,861 |
Earnings by Sex by Income Bracket in East Tawakoni
The most common earnings brackets in East Tawakoni are $75,000 to $99,999 for men (28 | 14.4%) and $30,000 to $34,999 for women (38 | 13.5%).
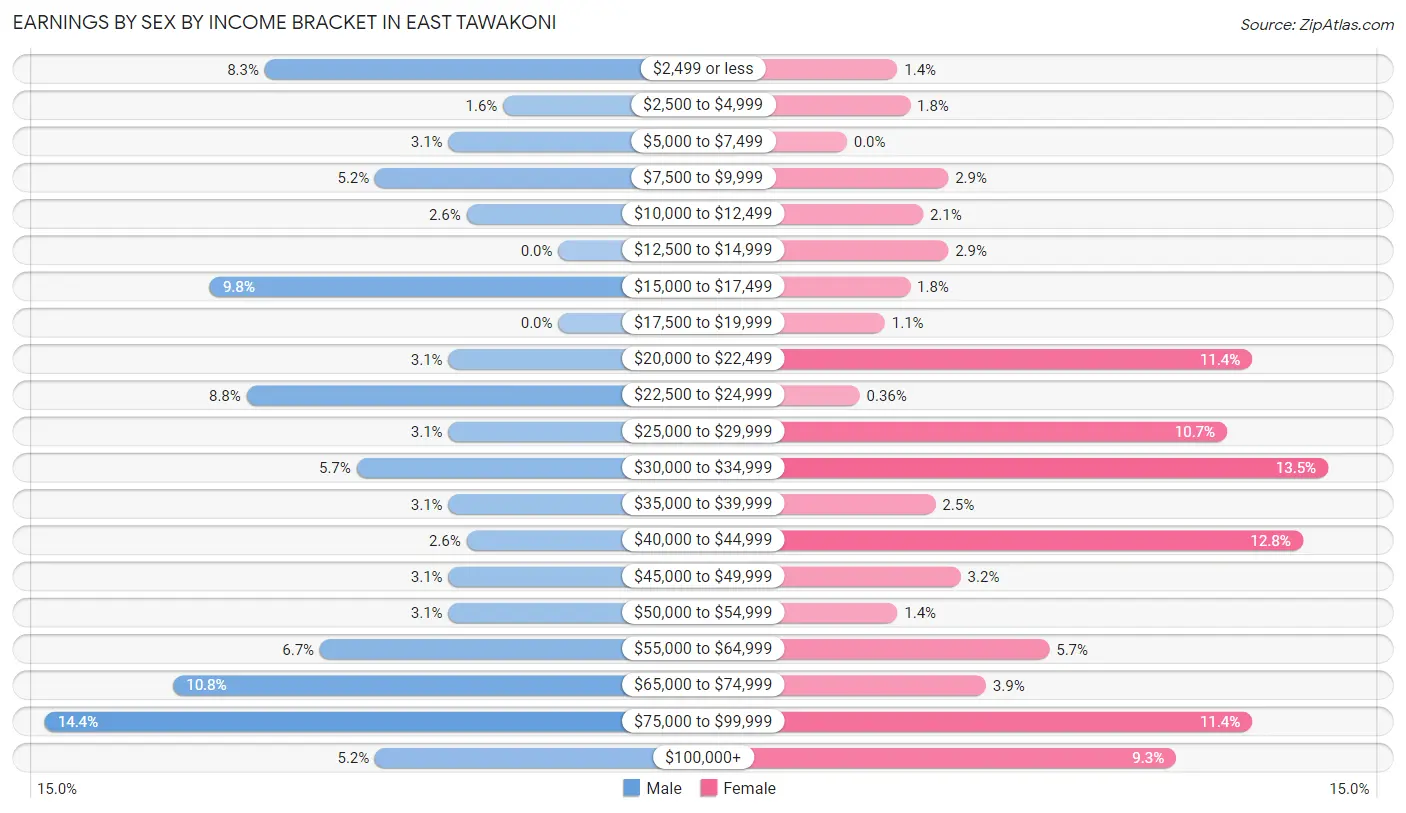
| Income | Male | Female |
| $2,499 or less | 16 (8.3%) | 4 (1.4%) |
| $2,500 to $4,999 | 3 (1.5%) | 5 (1.8%) |
| $5,000 to $7,499 | 6 (3.1%) | 0 (0.0%) |
| $7,500 to $9,999 | 10 (5.1%) | 8 (2.9%) |
| $10,000 to $12,499 | 5 (2.6%) | 6 (2.1%) |
| $12,500 to $14,999 | 0 (0.0%) | 8 (2.9%) |
| $15,000 to $17,499 | 19 (9.8%) | 5 (1.8%) |
| $17,500 to $19,999 | 0 (0.0%) | 3 (1.1%) |
| $20,000 to $22,499 | 6 (3.1%) | 32 (11.4%) |
| $22,500 to $24,999 | 17 (8.8%) | 1 (0.4%) |
| $25,000 to $29,999 | 6 (3.1%) | 30 (10.7%) |
| $30,000 to $34,999 | 11 (5.7%) | 38 (13.5%) |
| $35,000 to $39,999 | 6 (3.1%) | 7 (2.5%) |
| $40,000 to $44,999 | 5 (2.6%) | 36 (12.8%) |
| $45,000 to $49,999 | 6 (3.1%) | 9 (3.2%) |
| $50,000 to $54,999 | 6 (3.1%) | 4 (1.4%) |
| $55,000 to $64,999 | 13 (6.7%) | 16 (5.7%) |
| $65,000 to $74,999 | 21 (10.8%) | 11 (3.9%) |
| $75,000 to $99,999 | 28 (14.4%) | 32 (11.4%) |
| $100,000+ | 10 (5.1%) | 26 (9.2%) |
| Total | 194 (100.0%) | 281 (100.0%) |
Earnings by Sex by Educational Attainment in East Tawakoni
Average earnings in East Tawakoni are $41,875 for men and $41,964 for women, a difference of 0.2%. Men with an educational attainment of college or associate's degree enjoy the highest average annual earnings of $55,000, while those with less than high school education earn the least with $34,091. Women with an educational attainment of college or associate's degree earn the most with the average annual earnings of $42,143, while those with less than high school education have the smallest earnings of $32,841.
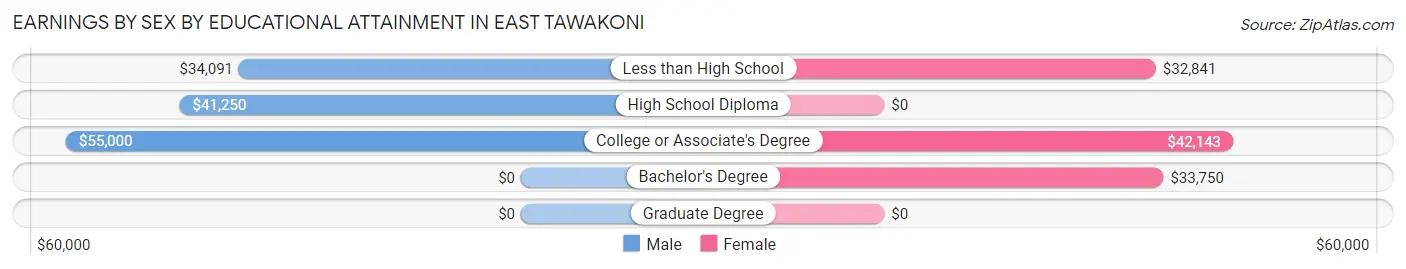
| Educational Attainment | Male Income | Female Income |
| Less than High School | $34,091 | $32,841 |
| High School Diploma | $41,250 | $0 |
| College or Associate's Degree | $55,000 | $42,143 |
| Bachelor's Degree | - | - |
| Graduate Degree | - | - |
| Total | $41,875 | $41,964 |
Family Income in East Tawakoni
Family Income Brackets in East Tawakoni
According to the East Tawakoni family income data, there are 80 families falling into the $35,000 to $49,999 income range, which is the most common income bracket and makes up 33.6% of all families. Conversely, the $15,000 to $24,999 income bracket is the least frequent group with only 3 families (1.3%) belonging to this category.
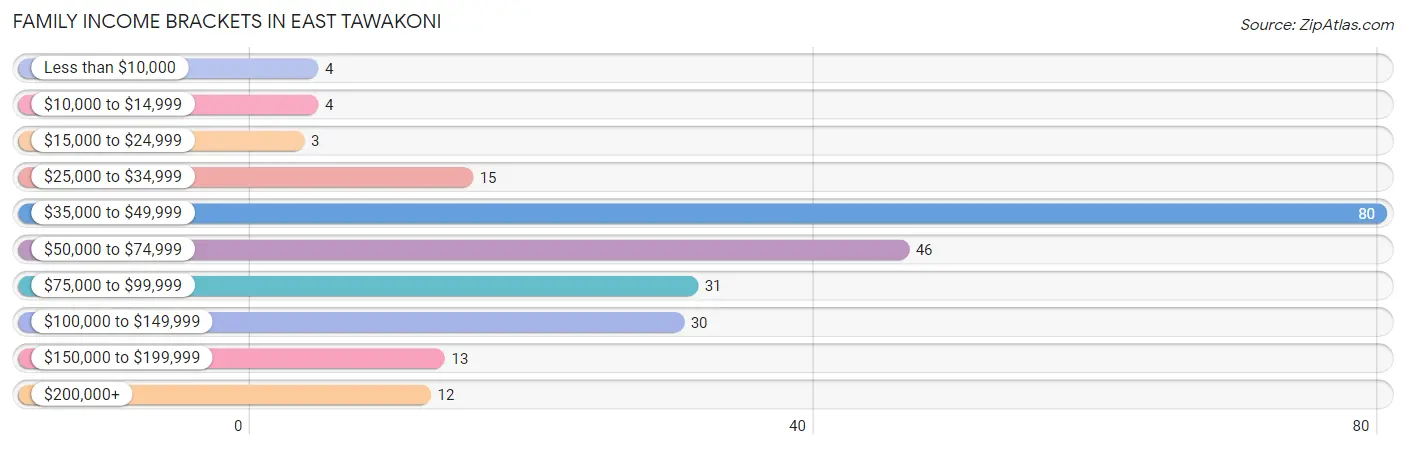
| Income Bracket | # Families | % Families |
| Less than $10,000 | 4 | 1.7% |
| $10,000 to $14,999 | 4 | 1.7% |
| $15,000 to $24,999 | 3 | 1.3% |
| $25,000 to $34,999 | 15 | 6.3% |
| $35,000 to $49,999 | 80 | 33.6% |
| $50,000 to $74,999 | 46 | 19.3% |
| $75,000 to $99,999 | 31 | 13.0% |
| $100,000 to $149,999 | 30 | 12.6% |
| $150,000 to $199,999 | 13 | 5.5% |
| $200,000+ | 12 | 5.0% |
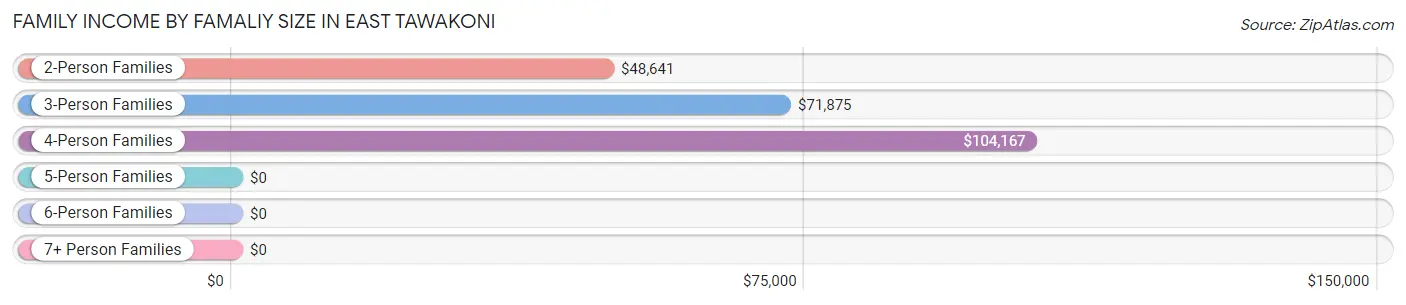
Family Income by Famaliy Size in East Tawakoni
4-person families (10 | 4.2%) account for the highest median family income in East Tawakoni with $104,167 per family, while 4-person families (10 | 4.2%) have the highest median income of $26,042 per family member.
| Income Bracket | # Families | Median Income |
| 2-Person Families | 167 (70.2%) | $48,641 |
| 3-Person Families | 51 (21.4%) | $71,875 |
| 4-Person Families | 10 (4.2%) | $104,167 |
| 5-Person Families | 5 (2.1%) | $0 |
| 6-Person Families | 5 (2.1%) | $0 |
| 7+ Person Families | 0 (0.0%) | $0 |
| Total | 238 (100.0%) | $61,250 |
Family Income by Number of Earners in East Tawakoni
The median family income in East Tawakoni is $61,250, with families comprising 3+ earners (8) having the highest median family income of $250,001, while families with no earners (44) have the lowest median family income of $41,667, accounting for 3.4% and 18.5% of families, respectively.
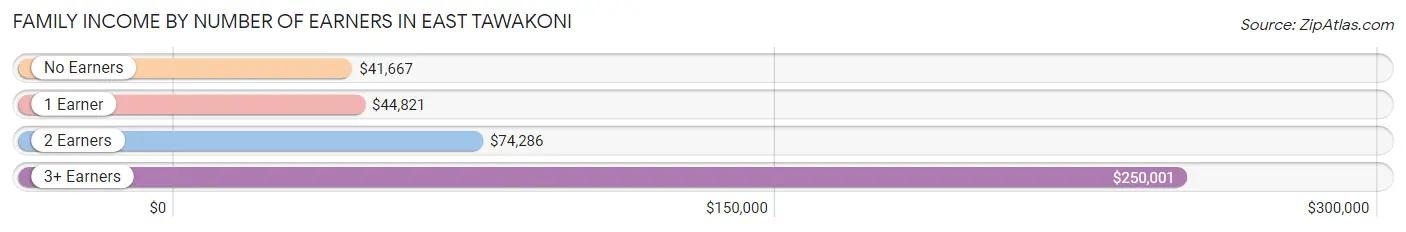
| Number of Earners | # Families | Median Income |
| No Earners | 44 (18.5%) | $41,667 |
| 1 Earner | 80 (33.6%) | $44,821 |
| 2 Earners | 106 (44.5%) | $74,286 |
| 3+ Earners | 8 (3.4%) | $250,001 |
| Total | 238 (100.0%) | $61,250 |
Household Income in East Tawakoni
Household Income Brackets in East Tawakoni
With 105 households falling in the category, the $35,000 to $49,999 income range is the most frequent in East Tawakoni, accounting for 29.1% of all households. In contrast, only 4 households (1.1%) fall into the less than $10,000 income bracket, making it the least populous group.
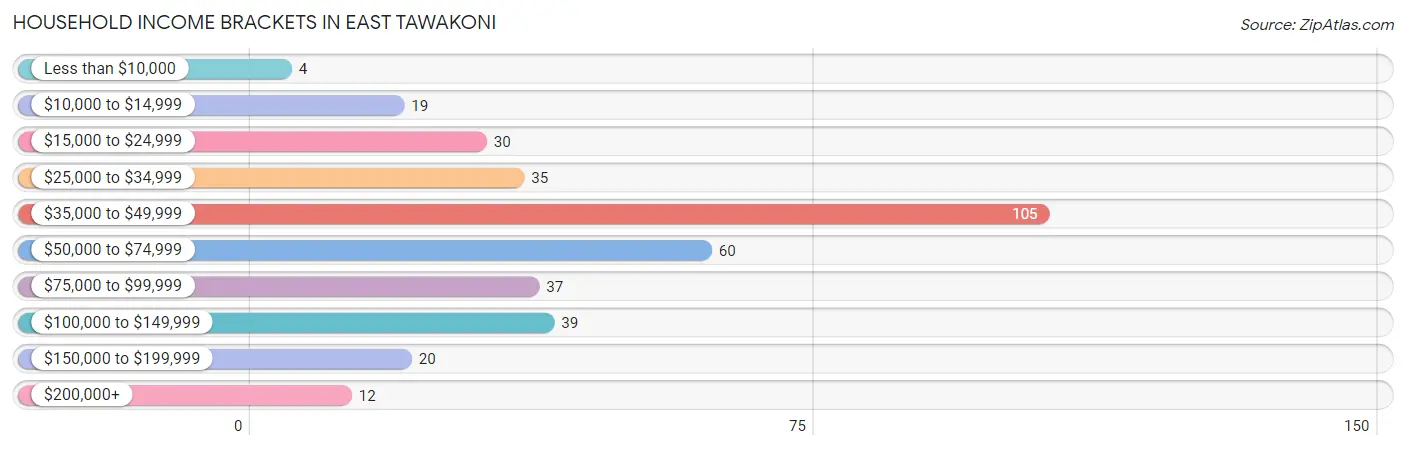
| Income Bracket | # Households | % Households |
| Less than $10,000 | 4 | 1.1% |
| $10,000 to $14,999 | 19 | 5.3% |
| $15,000 to $24,999 | 30 | 8.3% |
| $25,000 to $34,999 | 35 | 9.7% |
| $35,000 to $49,999 | 105 | 29.1% |
| $50,000 to $74,999 | 60 | 16.6% |
| $75,000 to $99,999 | 37 | 10.2% |
| $100,000 to $149,999 | 39 | 10.8% |
| $150,000 to $199,999 | 20 | 5.5% |
| $200,000+ | 12 | 3.3% |
Household Income by Householder Age in East Tawakoni
The median household income in East Tawakoni is $48,992, with the highest median household income of $67,273 found in the 45 to 64 years age bracket for the primary householder. A total of 136 households (37.7%) fall into this category. Meanwhile, the 65+ years age bracket for the primary householder has the lowest median household income of $41,458, with 115 households (31.9%) in this group.
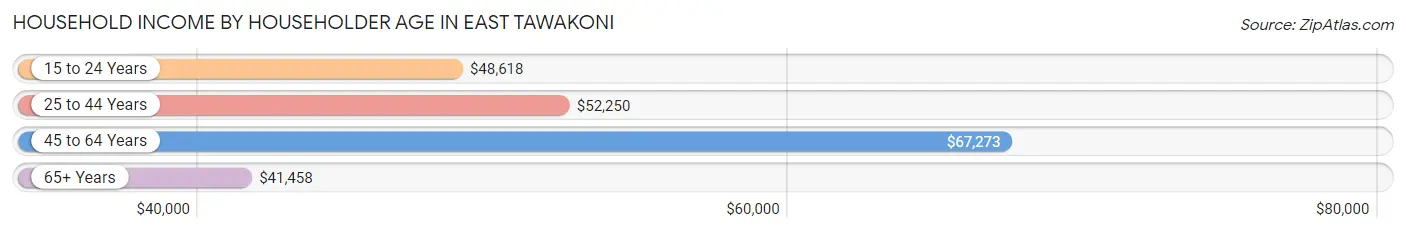
| Income Bracket | # Households | Median Income |
| 15 to 24 Years | 27 (7.5%) | $48,618 |
| 25 to 44 Years | 83 (23.0%) | $52,250 |
| 45 to 64 Years | 136 (37.7%) | $67,273 |
| 65+ Years | 115 (31.9%) | $41,458 |
| Total | 361 (100.0%) | $48,992 |
Poverty in East Tawakoni
Income Below Poverty by Sex and Age in East Tawakoni
With 5.4% poverty level for males and 7.6% for females among the residents of East Tawakoni, 75 year old and over males and 65 to 74 year old females are the most vulnerable to poverty, with 11 males (14.9%) and 11 females (21.6%) in their respective age groups living below the poverty level.
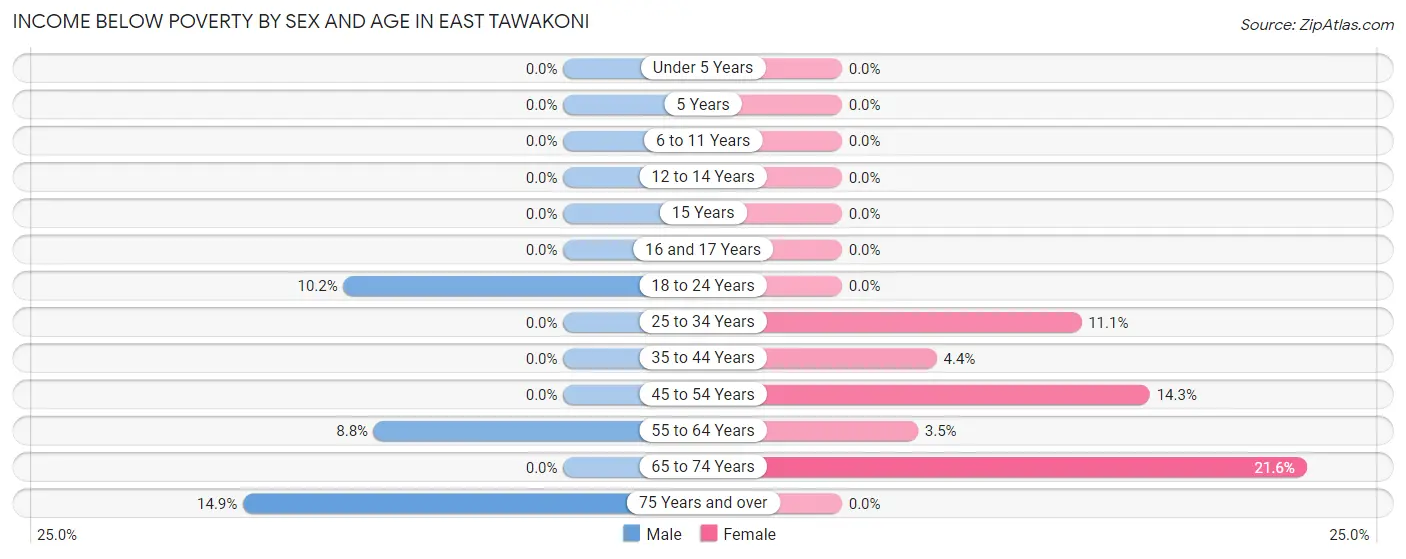
| Age Bracket | Male | Female |
| Under 5 Years | 0 (0.0%) | 0 (0.0%) |
| 5 Years | 0 (0.0%) | 0 (0.0%) |
| 6 to 11 Years | 0 (0.0%) | 0 (0.0%) |
| 12 to 14 Years | 0 (0.0%) | 0 (0.0%) |
| 15 Years | 0 (0.0%) | 0 (0.0%) |
| 16 and 17 Years | 0 (0.0%) | 0 (0.0%) |
| 18 to 24 Years | 5 (10.2%) | 0 (0.0%) |
| 25 to 34 Years | 0 (0.0%) | 8 (11.1%) |
| 35 to 44 Years | 0 (0.0%) | 4 (4.4%) |
| 45 to 54 Years | 0 (0.0%) | 8 (14.3%) |
| 55 to 64 Years | 8 (8.8%) | 3 (3.5%) |
| 65 to 74 Years | 0 (0.0%) | 11 (21.6%) |
| 75 Years and over | 11 (14.9%) | 0 (0.0%) |
| Total | 24 (5.4%) | 34 (7.6%) |
Income Above Poverty by Sex and Age in East Tawakoni
According to the poverty statistics in East Tawakoni, males aged under 5 years and females aged under 5 years are the age groups that are most secure financially, with 100.0% of males and 100.0% of females in these age groups living above the poverty line.
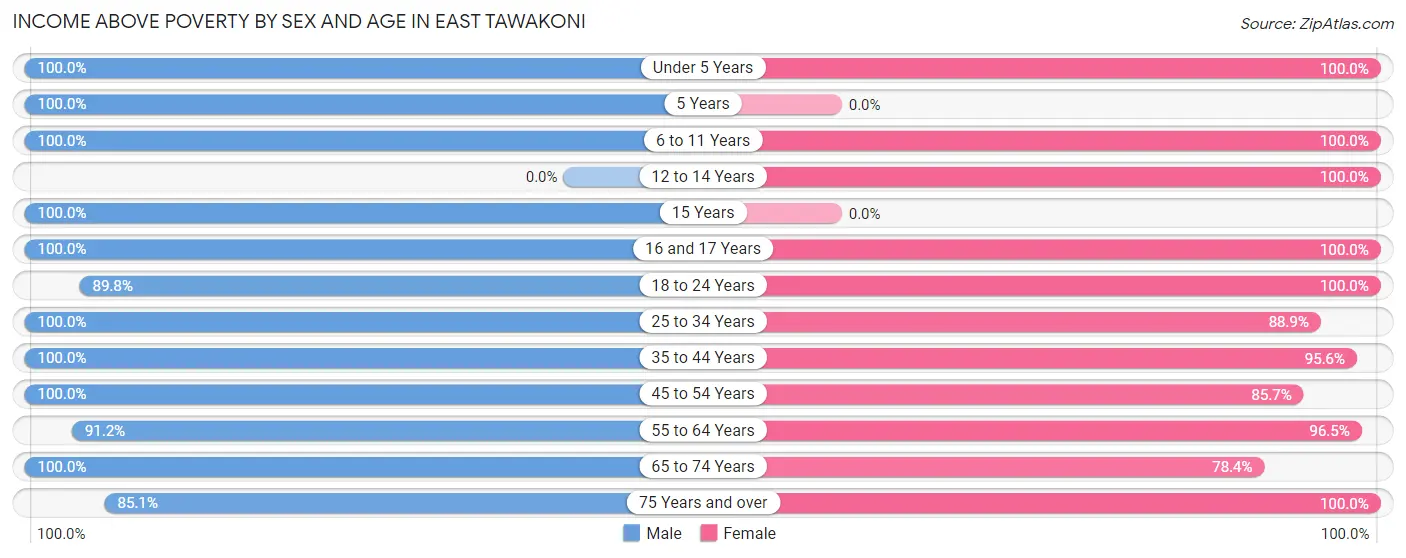
| Age Bracket | Male | Female |
| Under 5 Years | 19 (100.0%) | 12 (100.0%) |
| 5 Years | 3 (100.0%) | 0 (0.0%) |
| 6 to 11 Years | 60 (100.0%) | 8 (100.0%) |
| 12 to 14 Years | 0 (0.0%) | 3 (100.0%) |
| 15 Years | 2 (100.0%) | 0 (0.0%) |
| 16 and 17 Years | 4 (100.0%) | 5 (100.0%) |
| 18 to 24 Years | 44 (89.8%) | 27 (100.0%) |
| 25 to 34 Years | 36 (100.0%) | 64 (88.9%) |
| 35 to 44 Years | 28 (100.0%) | 87 (95.6%) |
| 45 to 54 Years | 25 (100.0%) | 48 (85.7%) |
| 55 to 64 Years | 83 (91.2%) | 82 (96.5%) |
| 65 to 74 Years | 54 (100.0%) | 40 (78.4%) |
| 75 Years and over | 63 (85.1%) | 38 (100.0%) |
| Total | 421 (94.6%) | 414 (92.4%) |
Income Below Poverty Among Married-Couple Families in East Tawakoni
The poverty statistics for married-couple families in East Tawakoni show that 2.4% or 4 of the total 167 families live below the poverty line. Families with no children have the highest poverty rate of 2.9%, comprising of 4 families. On the other hand, families with 1 or 2 children have the lowest poverty rate of 0.0%, which includes 0 families.
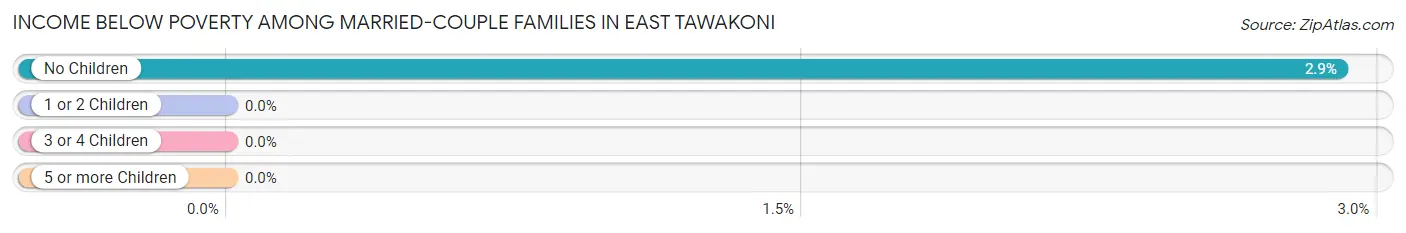
| Children | Above Poverty | Below Poverty |
| No Children | 134 (97.1%) | 4 (2.9%) |
| 1 or 2 Children | 24 (100.0%) | 0 (0.0%) |
| 3 or 4 Children | 5 (100.0%) | 0 (0.0%) |
| 5 or more Children | 0 (0.0%) | 0 (0.0%) |
| Total | 163 (97.6%) | 4 (2.4%) |
Income Below Poverty Among Single-Parent Households in East Tawakoni
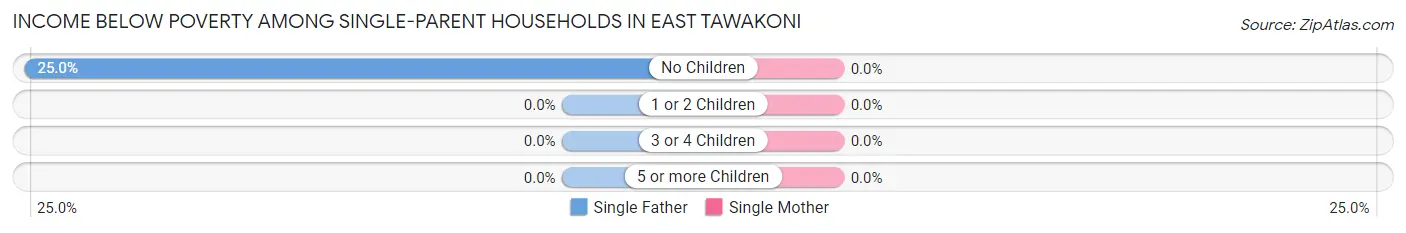
| Children | Single Father | Single Mother |
| No Children | 4 (25.0%) | 0 (0.0%) |
| 1 or 2 Children | 0 (0.0%) | 0 (0.0%) |
| 3 or 4 Children | 0 (0.0%) | 0 (0.0%) |
| 5 or more Children | 0 (0.0%) | 0 (0.0%) |
| Total | 4 (16.7%) | 0 (0.0%) |
Income Below Poverty Among Married-Couple vs Single-Parent Households in East Tawakoni
The poverty data for East Tawakoni shows that 4 of the married-couple family households (2.4%) and 4 of the single-parent households (5.6%) are living below the poverty level. Within the married-couple family households, those with no children have the highest poverty rate, with 4 households (2.9%) falling below the poverty line. Among the single-parent households, those with no children have the highest poverty rate, with 4 household (16.7%) living below poverty.
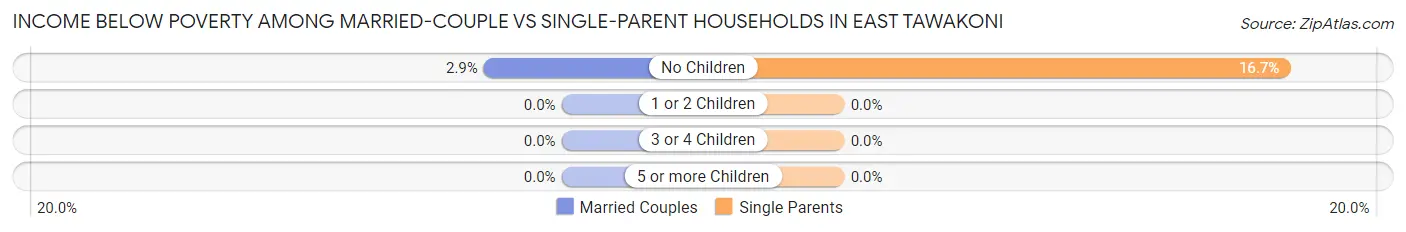
| Children | Married-Couple Families | Single-Parent Households |
| No Children | 4 (2.9%) | 4 (16.7%) |
| 1 or 2 Children | 0 (0.0%) | 0 (0.0%) |
| 3 or 4 Children | 0 (0.0%) | 0 (0.0%) |
| 5 or more Children | 0 (0.0%) | 0 (0.0%) |
| Total | 4 (2.4%) | 4 (5.6%) |
Employment Characteristics in East Tawakoni
Employment by Class of Employer in East Tawakoni
Among the 431 employed individuals in East Tawakoni, private company employees (308 | 71.5%), federal government employees (40 | 9.3%), and self-employed (not incorporated) (35 | 8.1%) make up the most common classes of employment.
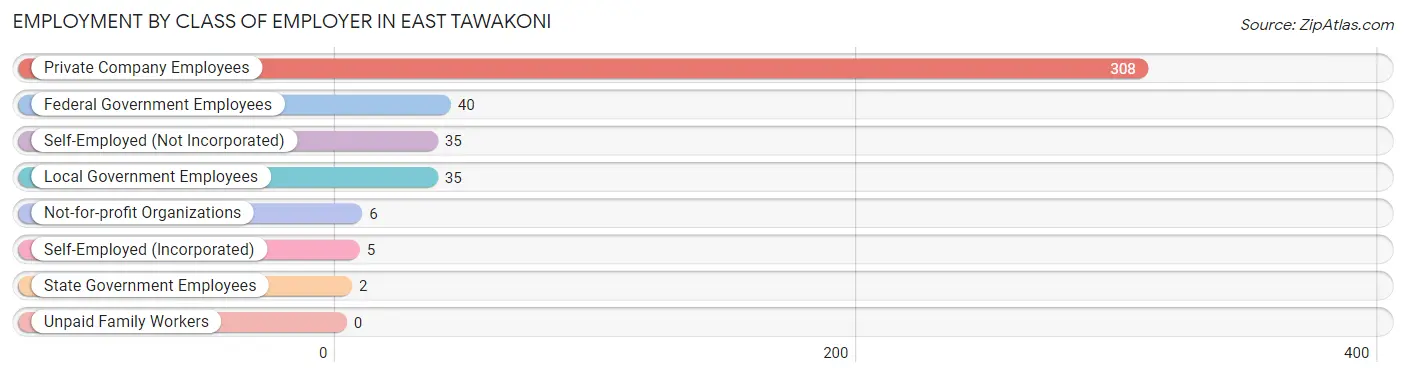
| Employer Class | # Employees | % Employees |
| Private Company Employees | 308 | 71.5% |
| Self-Employed (Incorporated) | 5 | 1.2% |
| Self-Employed (Not Incorporated) | 35 | 8.1% |
| Not-for-profit Organizations | 6 | 1.4% |
| Local Government Employees | 35 | 8.1% |
| State Government Employees | 2 | 0.5% |
| Federal Government Employees | 40 | 9.3% |
| Unpaid Family Workers | 0 | 0.0% |
| Total | 431 | 100.0% |
Employment Status by Age in East Tawakoni
According to the labor force statistics for East Tawakoni, out of the total population over 16 years of age (786), 58.5% or 460 individuals are in the labor force, with 5.2% or 24 of them unemployed. The age group with the highest labor force participation rate is 20 to 24 years, with 100.0% or 45 individuals in the labor force. Within the labor force, the 20 to 24 years age range has the highest percentage of unemployed individuals, with 13.3% or 6 of them being unemployed.
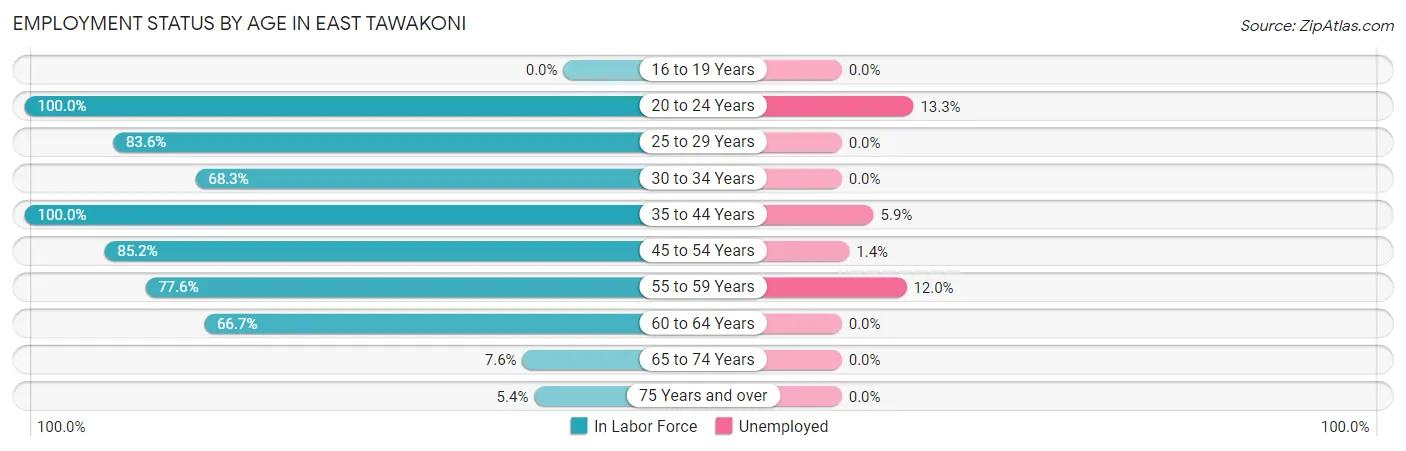
| Age Bracket | In Labor Force | Unemployed |
| 16 to 19 Years | 0 (0.0%) | 0 (0.0%) |
| 20 to 24 Years | 45 (100.0%) | 6 (13.3%) |
| 25 to 29 Years | 56 (83.6%) | 0 (0.0%) |
| 30 to 34 Years | 28 (68.3%) | 0 (0.0%) |
| 35 to 44 Years | 119 (100.0%) | 7 (5.9%) |
| 45 to 54 Years | 69 (85.2%) | 1 (1.4%) |
| 55 to 59 Years | 83 (77.6%) | 10 (12.0%) |
| 60 to 64 Years | 46 (66.7%) | 0 (0.0%) |
| 65 to 74 Years | 8 (7.6%) | 0 (0.0%) |
| 75 Years and over | 6 (5.4%) | 0 (0.0%) |
| Total | 460 (58.5%) | 24 (5.2%) |
Employment Status by Educational Attainment in East Tawakoni
According to labor force statistics for East Tawakoni, 82.9% of individuals (401) out of the total population between 25 and 64 years of age (484) are in the labor force, with 4.5% or 18 of them being unemployed. The group with the highest labor force participation rate are those with the educational attainment of high school diploma, with 91.9% or 125 individuals in the labor force. Within the labor force, individuals with high school diploma education have the highest percentage of unemployment, with 8.0% or 10 of them being unemployed.
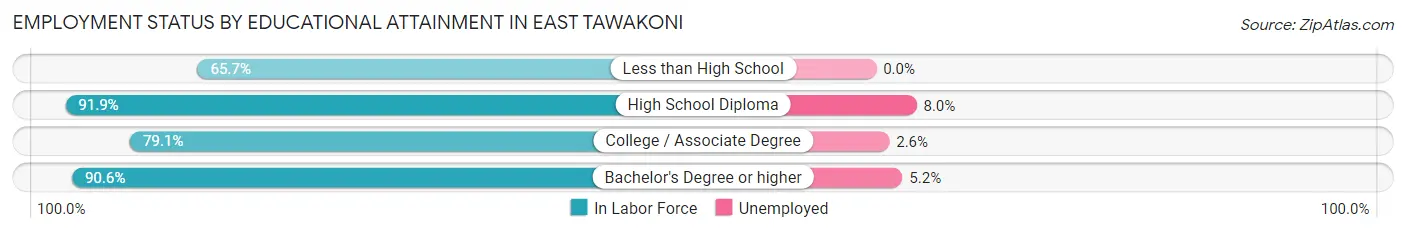
| Educational Attainment | In Labor Force | Unemployed |
| Less than High School | 44 (65.7%) | 0 (0.0%) |
| High School Diploma | 125 (91.9%) | 11 (8.0%) |
| College / Associate Degree | 155 (79.1%) | 5 (2.6%) |
| Bachelor's Degree or higher | 77 (90.6%) | 4 (5.2%) |
| Total | 401 (82.9%) | 22 (4.5%) |
Employment Occupations by Sex in East Tawakoni
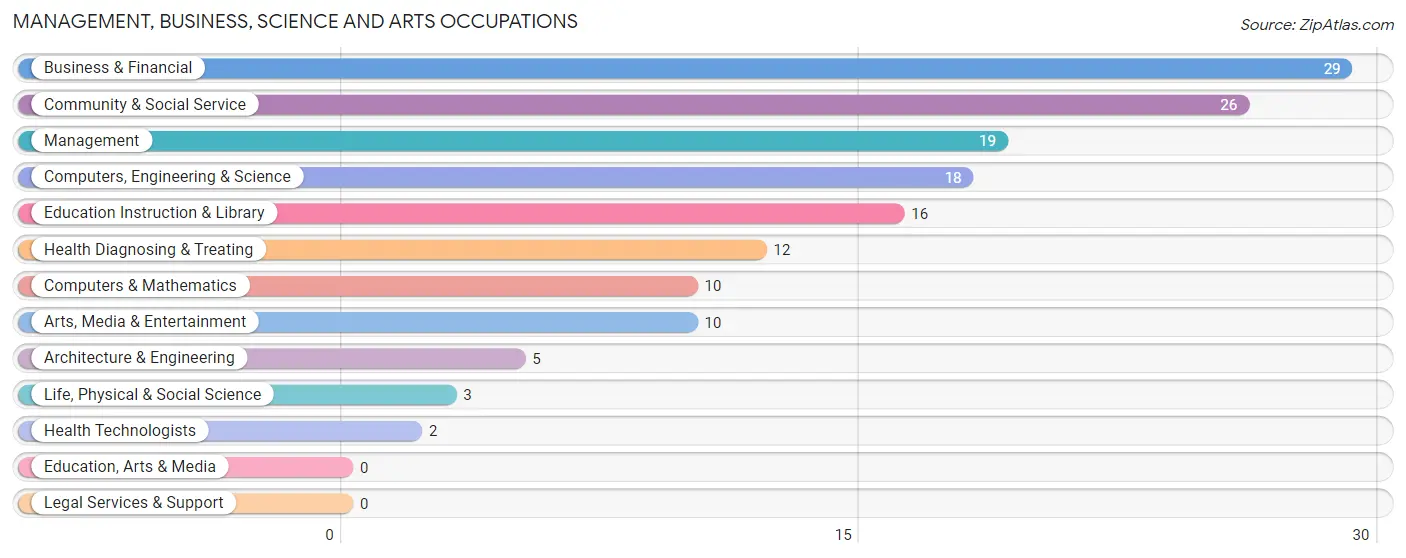
Management, Business, Science and Arts Occupations
The most common Management, Business, Science and Arts occupations in East Tawakoni are Business & Financial (29 | 6.7%), Community & Social Service (26 | 6.0%), Management (19 | 4.4%), Computers, Engineering & Science (18 | 4.1%), and Education Instruction & Library (16 | 3.7%).
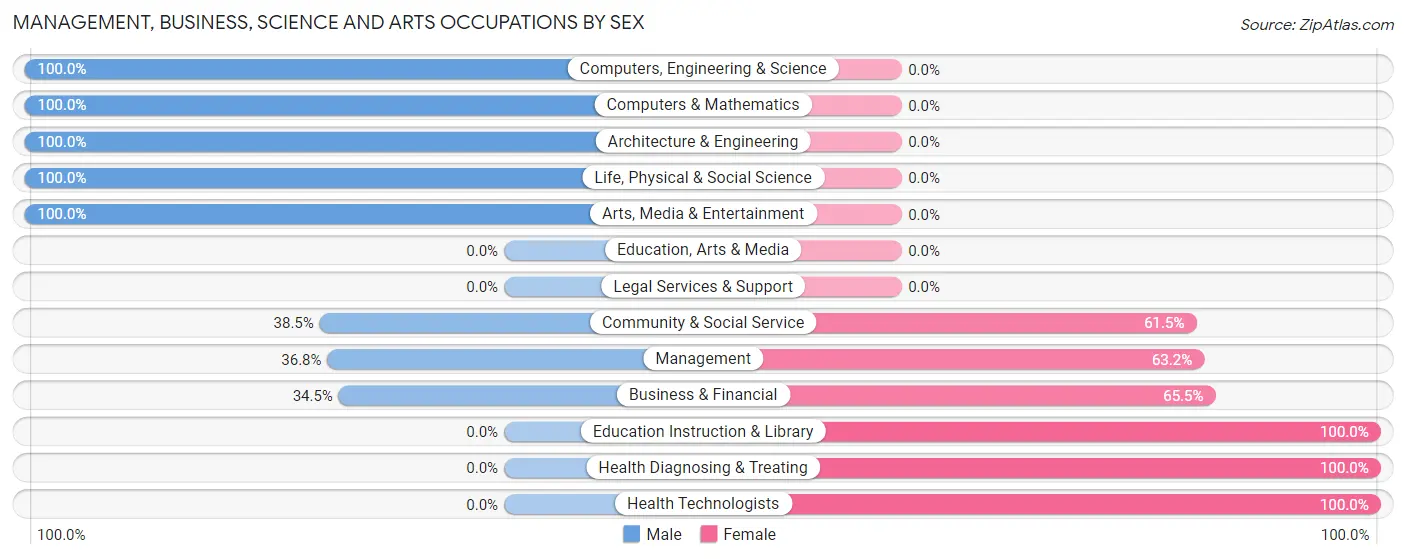
Management, Business, Science and Arts Occupations by Sex
Within the Management, Business, Science and Arts occupations in East Tawakoni, the most male-oriented occupations are Computers, Engineering & Science (100.0%), Computers & Mathematics (100.0%), and Architecture & Engineering (100.0%), while the most female-oriented occupations are Education Instruction & Library (100.0%), Health Diagnosing & Treating (100.0%), and Health Technologists (100.0%).
| Occupation | Male | Female |
| Management | 7 (36.8%) | 12 (63.2%) |
| Business & Financial | 10 (34.5%) | 19 (65.5%) |
| Computers, Engineering & Science | 18 (100.0%) | 0 (0.0%) |
| Computers & Mathematics | 10 (100.0%) | 0 (0.0%) |
| Architecture & Engineering | 5 (100.0%) | 0 (0.0%) |
| Life, Physical & Social Science | 3 (100.0%) | 0 (0.0%) |
| Community & Social Service | 10 (38.5%) | 16 (61.5%) |
| Education, Arts & Media | 0 (0.0%) | 0 (0.0%) |
| Legal Services & Support | 0 (0.0%) | 0 (0.0%) |
| Education Instruction & Library | 0 (0.0%) | 16 (100.0%) |
| Arts, Media & Entertainment | 10 (100.0%) | 0 (0.0%) |
| Health Diagnosing & Treating | 0 (0.0%) | 12 (100.0%) |
| Health Technologists | 0 (0.0%) | 2 (100.0%) |
| Total (Category) | 45 (43.3%) | 59 (56.7%) |
| Total (Overall) | 162 (37.2%) | 274 (62.8%) |
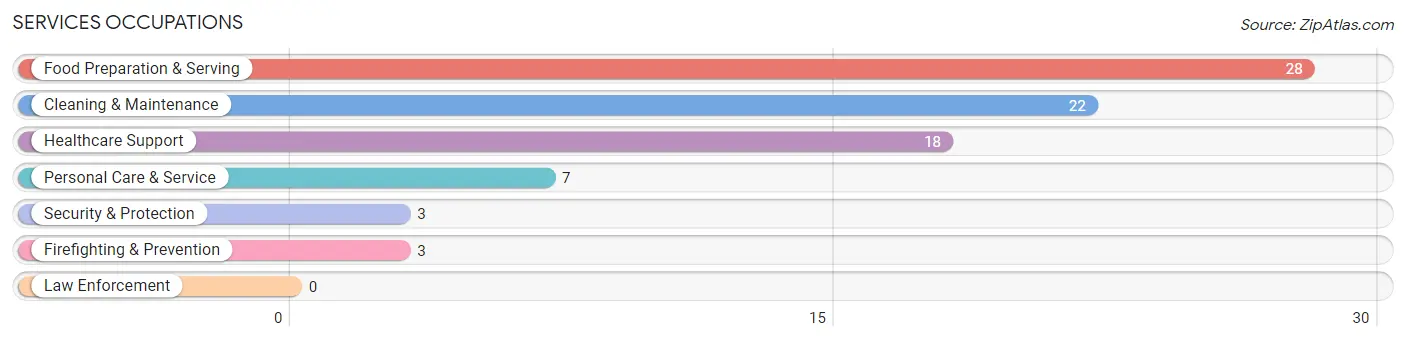
Services Occupations
The most common Services occupations in East Tawakoni are Food Preparation & Serving (28 | 6.4%), Cleaning & Maintenance (22 | 5.1%), Healthcare Support (18 | 4.1%), Personal Care & Service (7 | 1.6%), and Security & Protection (3 | 0.7%).
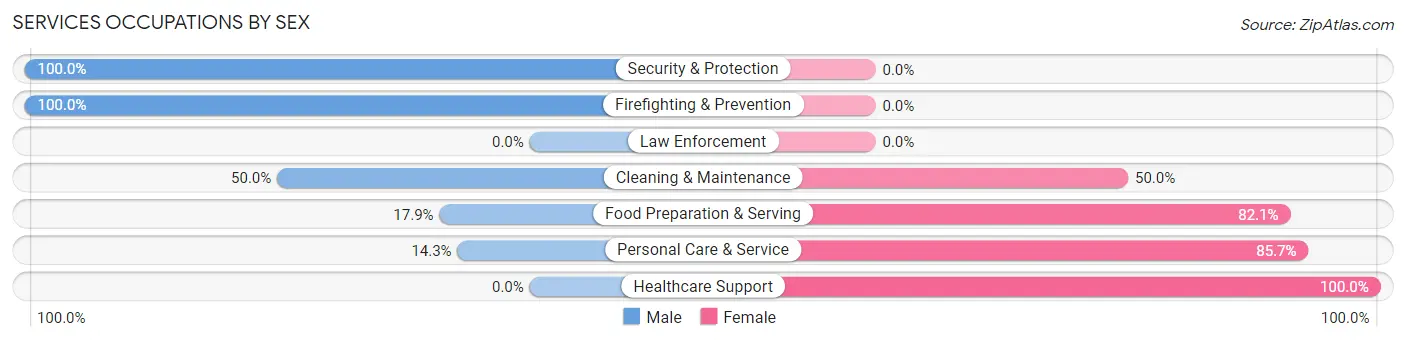
Services Occupations by Sex
Within the Services occupations in East Tawakoni, the most male-oriented occupations are Security & Protection (100.0%), Firefighting & Prevention (100.0%), and Cleaning & Maintenance (50.0%), while the most female-oriented occupations are Healthcare Support (100.0%), Personal Care & Service (85.7%), and Food Preparation & Serving (82.1%).
| Occupation | Male | Female |
| Healthcare Support | 0 (0.0%) | 18 (100.0%) |
| Security & Protection | 3 (100.0%) | 0 (0.0%) |
| Firefighting & Prevention | 3 (100.0%) | 0 (0.0%) |
| Law Enforcement | 0 (0.0%) | 0 (0.0%) |
| Food Preparation & Serving | 5 (17.9%) | 23 (82.1%) |
| Cleaning & Maintenance | 11 (50.0%) | 11 (50.0%) |
| Personal Care & Service | 1 (14.3%) | 6 (85.7%) |
| Total (Category) | 20 (25.6%) | 58 (74.4%) |
| Total (Overall) | 162 (37.2%) | 274 (62.8%) |
Sales and Office Occupations
The most common Sales and Office occupations in East Tawakoni are Sales & Related (88 | 20.2%), and Office & Administration (83 | 19.0%).
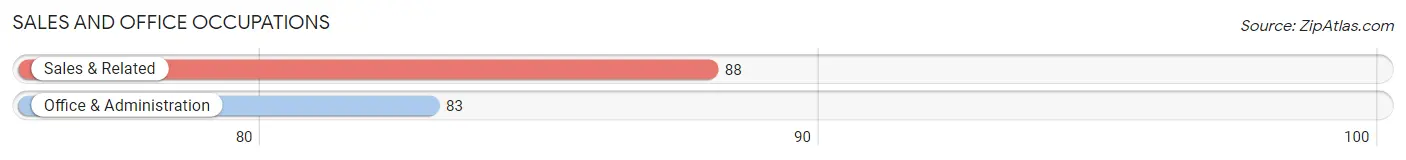
Sales and Office Occupations by Sex

| Occupation | Male | Female |
| Sales & Related | 21 (23.9%) | 67 (76.1%) |
| Office & Administration | 0 (0.0%) | 83 (100.0%) |
| Total (Category) | 21 (12.3%) | 150 (87.7%) |
| Total (Overall) | 162 (37.2%) | 274 (62.8%) |
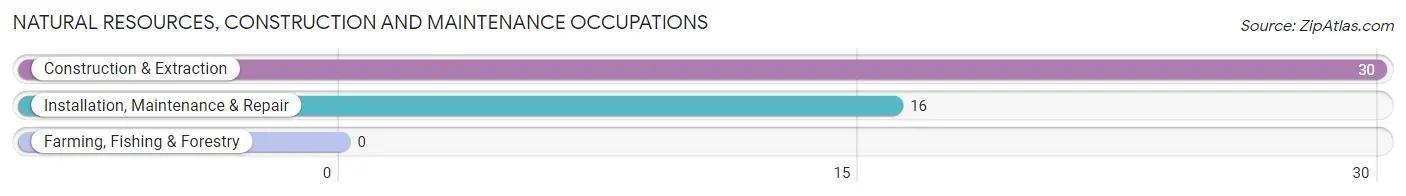
Natural Resources, Construction and Maintenance Occupations
The most common Natural Resources, Construction and Maintenance occupations in East Tawakoni are Construction & Extraction (30 | 6.9%), and Installation, Maintenance & Repair (16 | 3.7%).
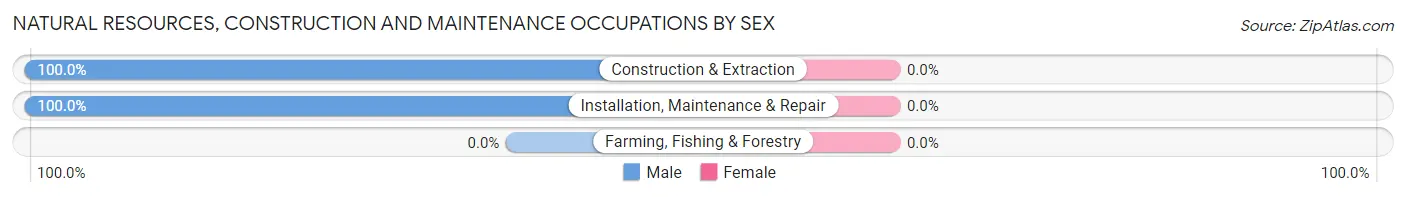
Natural Resources, Construction and Maintenance Occupations by Sex
| Occupation | Male | Female |
| Farming, Fishing & Forestry | 0 (0.0%) | 0 (0.0%) |
| Construction & Extraction | 30 (100.0%) | 0 (0.0%) |
| Installation, Maintenance & Repair | 16 (100.0%) | 0 (0.0%) |
| Total (Category) | 46 (100.0%) | 0 (0.0%) |
| Total (Overall) | 162 (37.2%) | 274 (62.8%) |
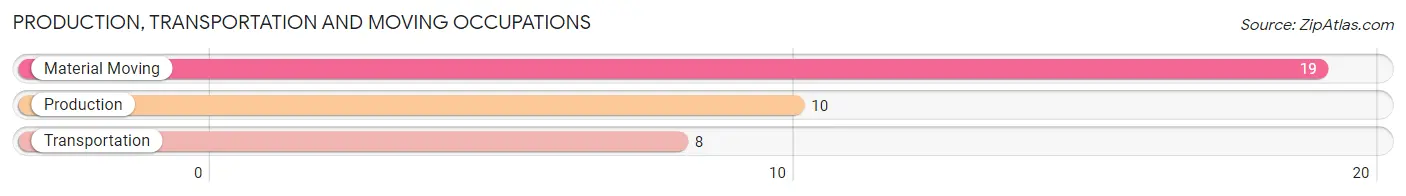
Production, Transportation and Moving Occupations
The most common Production, Transportation and Moving occupations in East Tawakoni are Material Moving (19 | 4.4%), Production (10 | 2.3%), and Transportation (8 | 1.8%).
Production, Transportation and Moving Occupations by Sex
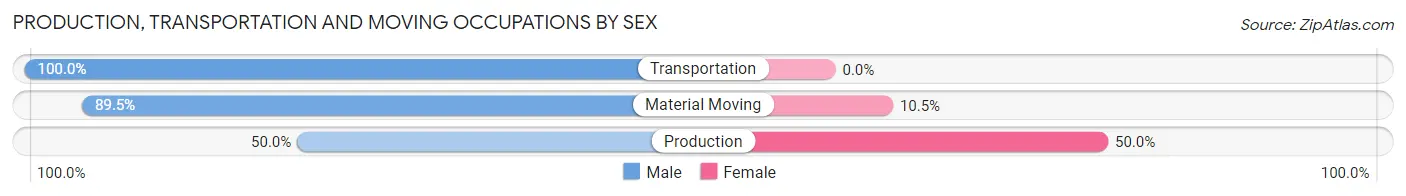
| Occupation | Male | Female |
| Production | 5 (50.0%) | 5 (50.0%) |
| Transportation | 8 (100.0%) | 0 (0.0%) |
| Material Moving | 17 (89.5%) | 2 (10.5%) |
| Total (Category) | 30 (81.1%) | 7 (18.9%) |
| Total (Overall) | 162 (37.2%) | 274 (62.8%) |
Employment Industries by Sex in East Tawakoni
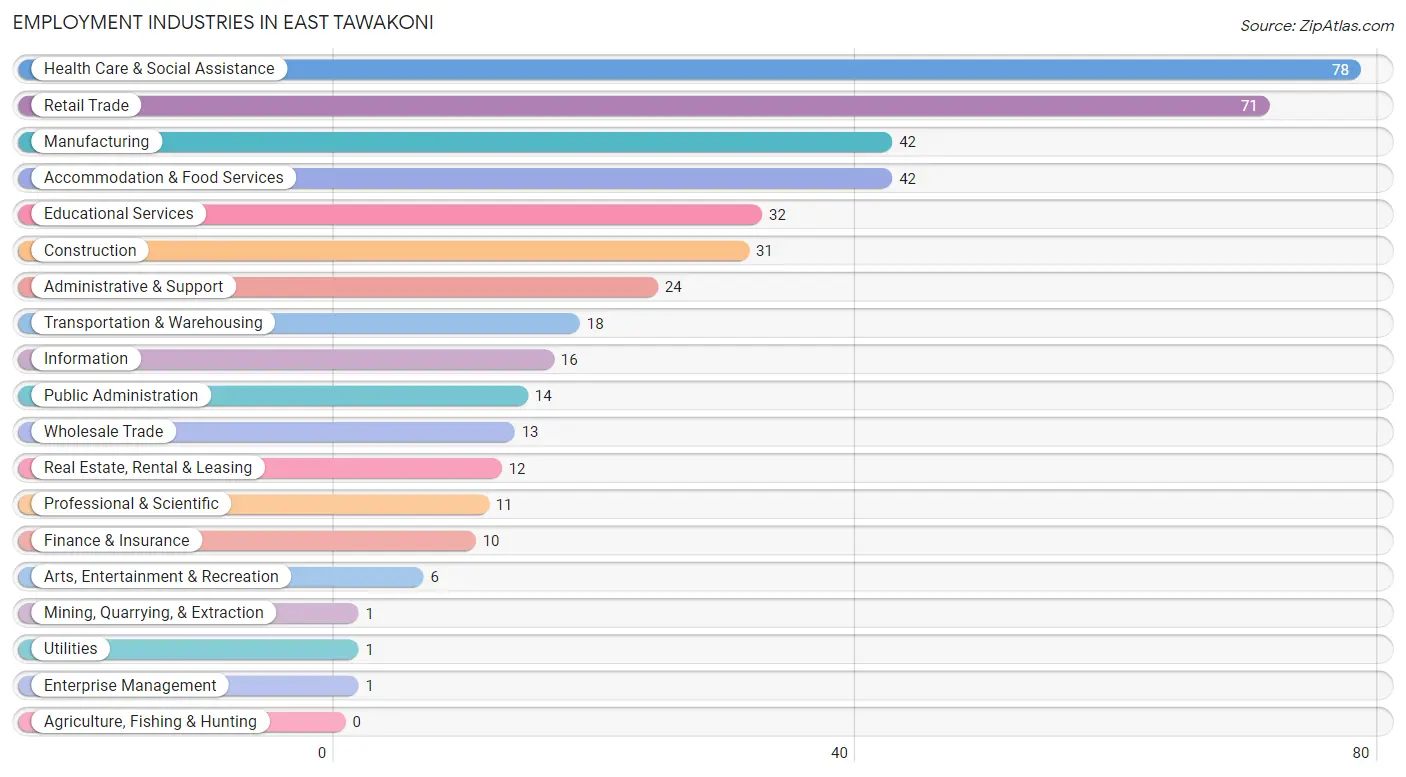
Employment Industries in East Tawakoni
The major employment industries in East Tawakoni include Health Care & Social Assistance (78 | 17.9%), Retail Trade (71 | 16.3%), Manufacturing (42 | 9.6%), Accommodation & Food Services (42 | 9.6%), and Educational Services (32 | 7.3%).
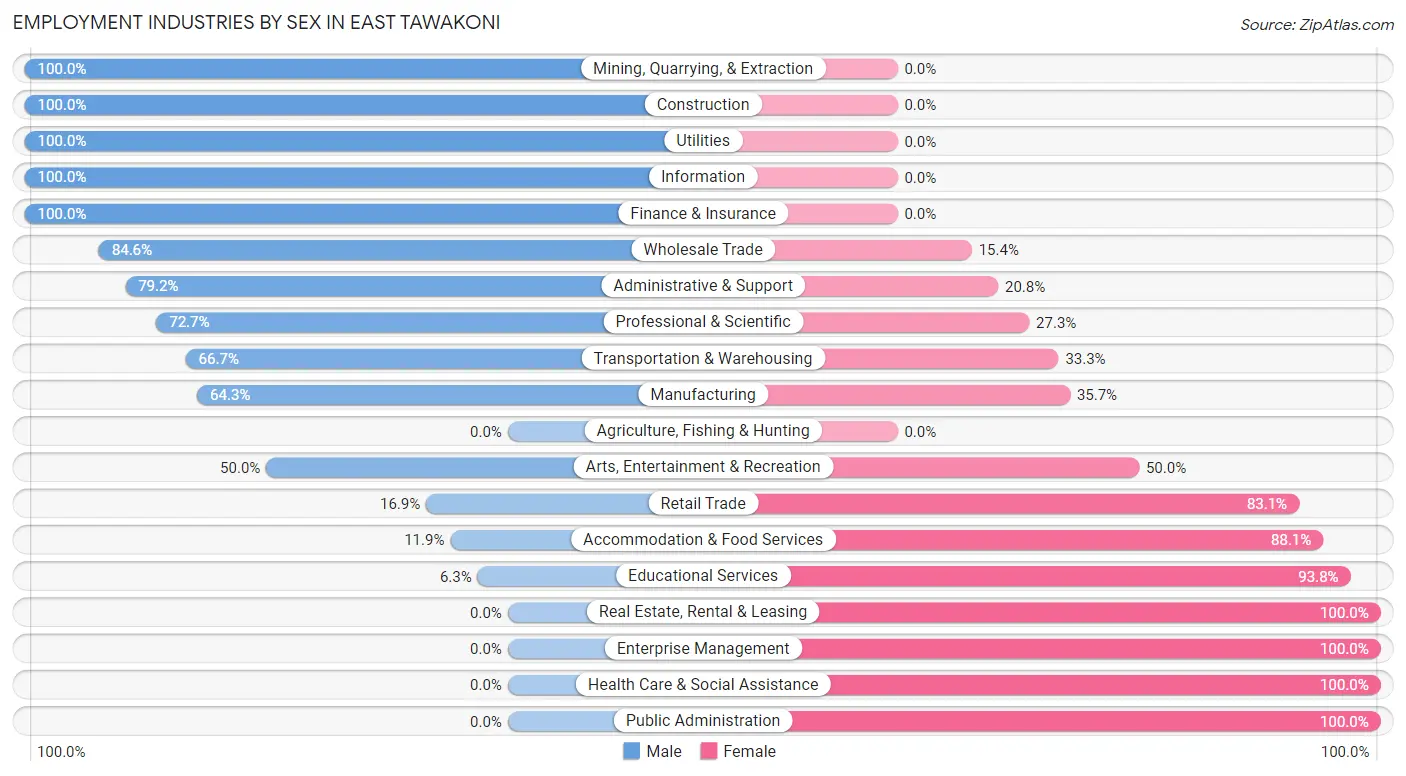
Employment Industries by Sex in East Tawakoni
The East Tawakoni industries that see more men than women are Mining, Quarrying, & Extraction (100.0%), Construction (100.0%), and Utilities (100.0%), whereas the industries that tend to have a higher number of women are Real Estate, Rental & Leasing (100.0%), Enterprise Management (100.0%), and Health Care & Social Assistance (100.0%).
| Industry | Male | Female |
| Agriculture, Fishing & Hunting | 0 (0.0%) | 0 (0.0%) |
| Mining, Quarrying, & Extraction | 1 (100.0%) | 0 (0.0%) |
| Construction | 31 (100.0%) | 0 (0.0%) |
| Manufacturing | 27 (64.3%) | 15 (35.7%) |
| Wholesale Trade | 11 (84.6%) | 2 (15.4%) |
| Retail Trade | 12 (16.9%) | 59 (83.1%) |
| Transportation & Warehousing | 12 (66.7%) | 6 (33.3%) |
| Utilities | 1 (100.0%) | 0 (0.0%) |
| Information | 16 (100.0%) | 0 (0.0%) |
| Finance & Insurance | 10 (100.0%) | 0 (0.0%) |
| Real Estate, Rental & Leasing | 0 (0.0%) | 12 (100.0%) |
| Professional & Scientific | 8 (72.7%) | 3 (27.3%) |
| Enterprise Management | 0 (0.0%) | 1 (100.0%) |
| Administrative & Support | 19 (79.2%) | 5 (20.8%) |
| Educational Services | 2 (6.2%) | 30 (93.8%) |
| Health Care & Social Assistance | 0 (0.0%) | 78 (100.0%) |
| Arts, Entertainment & Recreation | 3 (50.0%) | 3 (50.0%) |
| Accommodation & Food Services | 5 (11.9%) | 37 (88.1%) |
| Public Administration | 0 (0.0%) | 14 (100.0%) |
| Total | 162 (37.2%) | 274 (62.8%) |
Education in East Tawakoni
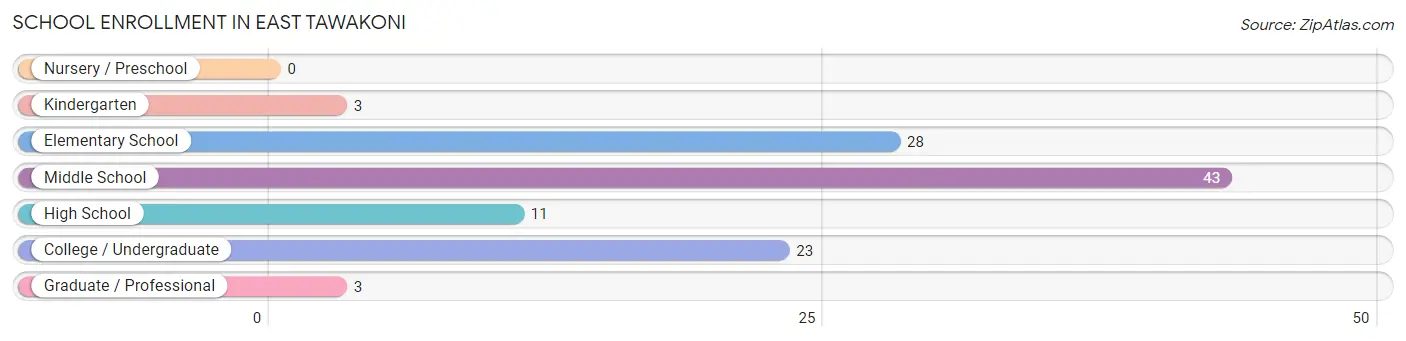
School Enrollment in East Tawakoni
The most common levels of schooling among the 111 students in East Tawakoni are middle school (43 | 38.7%), elementary school (28 | 25.2%), and college / undergraduate (23 | 20.7%).
| School Level | # Students | % Students |
| Nursery / Preschool | 0 | 0.0% |
| Kindergarten | 3 | 2.7% |
| Elementary School | 28 | 25.2% |
| Middle School | 43 | 38.7% |
| High School | 11 | 9.9% |
| College / Undergraduate | 23 | 20.7% |
| Graduate / Professional | 3 | 2.7% |
| Total | 111 | 100.0% |
School Enrollment by Age by Funding Source in East Tawakoni
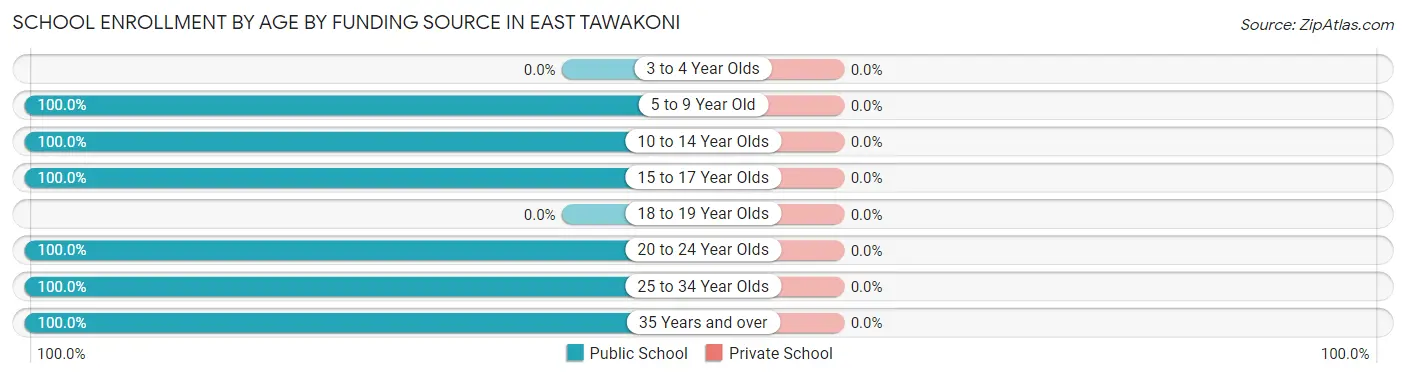
| Age Bracket | Public School | Private School |
| 3 to 4 Year Olds | 0 (0.0%) | 0 (0.0%) |
| 5 to 9 Year Old | 25 (100.0%) | 0 (0.0%) |
| 10 to 14 Year Olds | 49 (100.0%) | 0 (0.0%) |
| 15 to 17 Year Olds | 11 (100.0%) | 0 (0.0%) |
| 18 to 19 Year Olds | 0 (0.0%) | 0 (0.0%) |
| 20 to 24 Year Olds | 2 (100.0%) | 0 (0.0%) |
| 25 to 34 Year Olds | 11 (100.0%) | 0 (0.0%) |
| 35 Years and over | 13 (100.0%) | 0 (0.0%) |
| Total | 111 (100.0%) | 0 (0.0%) |
Educational Attainment by Field of Study in East Tawakoni
Business (52 | 40.0%), education (18 | 13.9%), bio, nature & agricultural (11 | 8.5%), engineering (10 | 7.7%), and visual & performing arts (8 | 6.1%) are the most common fields of study among 130 individuals in East Tawakoni who have obtained a bachelor's degree or higher.
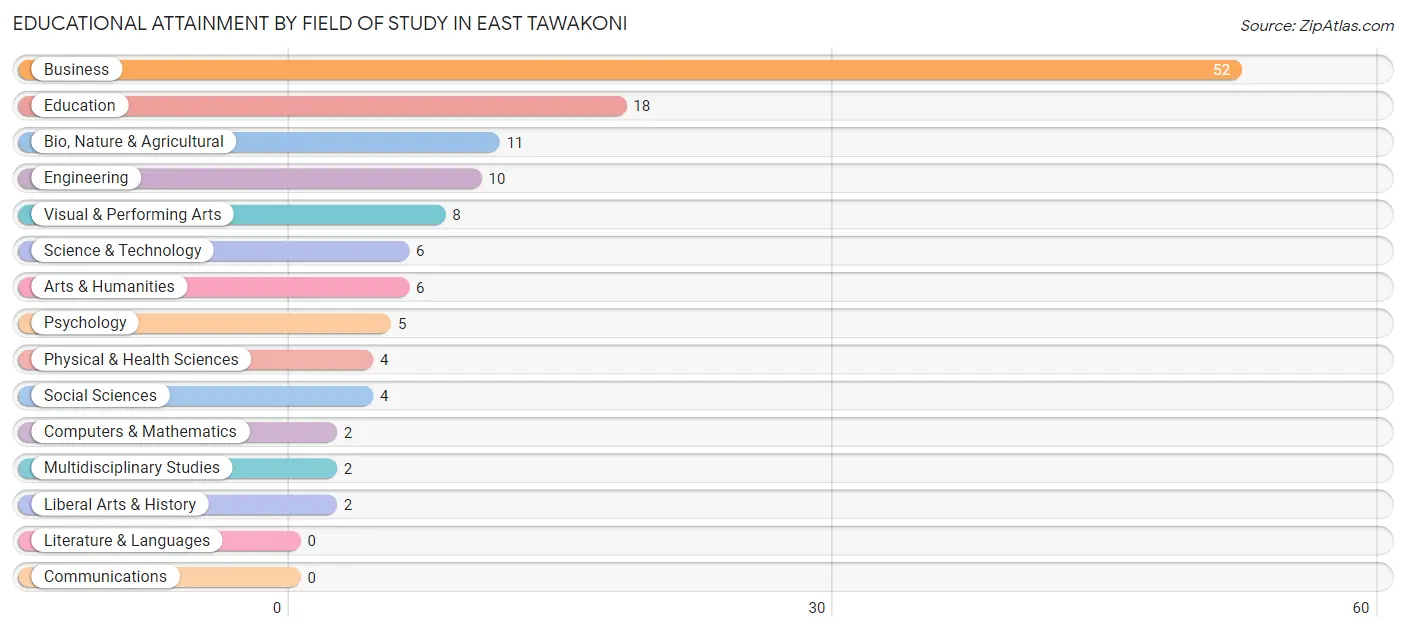
| Field of Study | # Graduates | % Graduates |
| Computers & Mathematics | 2 | 1.5% |
| Bio, Nature & Agricultural | 11 | 8.5% |
| Physical & Health Sciences | 4 | 3.1% |
| Psychology | 5 | 3.8% |
| Social Sciences | 4 | 3.1% |
| Engineering | 10 | 7.7% |
| Multidisciplinary Studies | 2 | 1.5% |
| Science & Technology | 6 | 4.6% |
| Business | 52 | 40.0% |
| Education | 18 | 13.9% |
| Literature & Languages | 0 | 0.0% |
| Liberal Arts & History | 2 | 1.5% |
| Visual & Performing Arts | 8 | 6.1% |
| Communications | 0 | 0.0% |
| Arts & Humanities | 6 | 4.6% |
| Total | 130 | 100.0% |
Transportation & Commute in East Tawakoni
Vehicle Availability by Sex in East Tawakoni
The most prevalent vehicle ownership categories in East Tawakoni are males with 2 vehicles (85, accounting for 52.5%) and females with 2 vehicles (140, making up 31.6%).
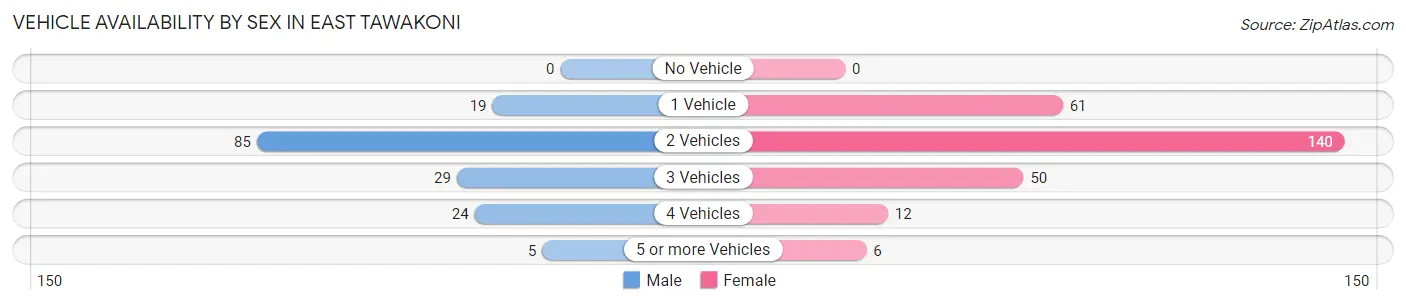
| Vehicles Available | Male | Female |
| No Vehicle | 0 (0.0%) | 0 (0.0%) |
| 1 Vehicle | 19 (11.7%) | 61 (22.7%) |
| 2 Vehicles | 85 (52.5%) | 140 (52.0%) |
| 3 Vehicles | 29 (17.9%) | 50 (18.6%) |
| 4 Vehicles | 24 (14.8%) | 12 (4.5%) |
| 5 or more Vehicles | 5 (3.1%) | 6 (2.2%) |
| Total | 162 (100.0%) | 269 (100.0%) |
Commute Time in East Tawakoni
The most frequently occuring commute durations in East Tawakoni are 30 to 34 minutes (108 commuters, 25.6%), 5 to 9 minutes (49 commuters, 11.6%), and 90 or more minutes (49 commuters, 11.6%).
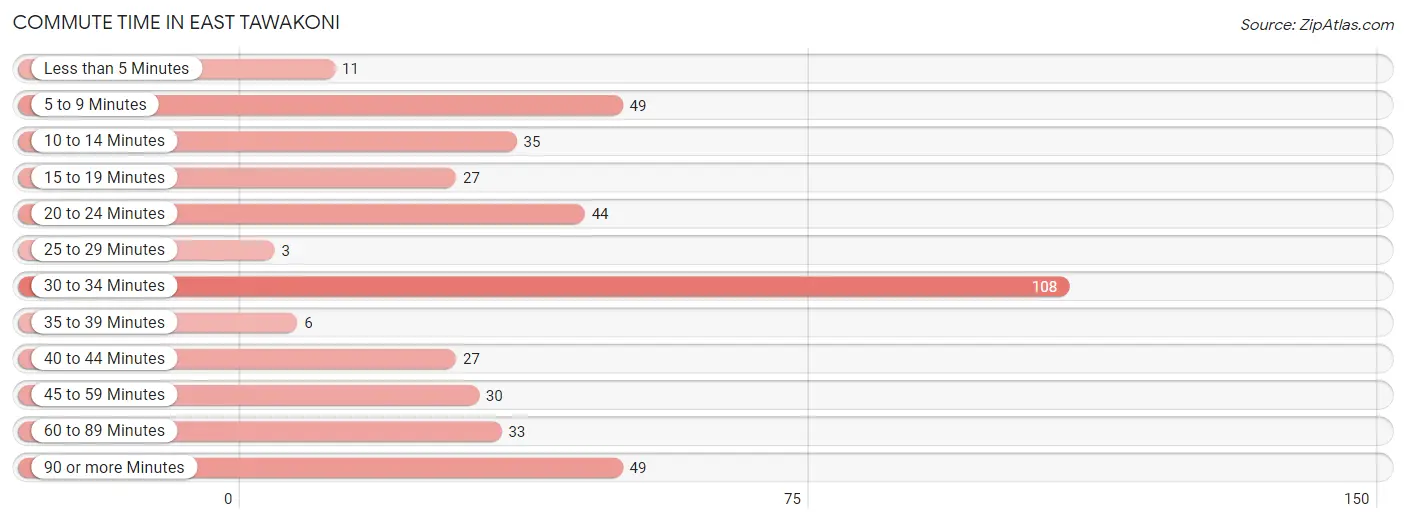
| Commute Time | # Commuters | % Commuters |
| Less than 5 Minutes | 11 | 2.6% |
| 5 to 9 Minutes | 49 | 11.6% |
| 10 to 14 Minutes | 35 | 8.3% |
| 15 to 19 Minutes | 27 | 6.4% |
| 20 to 24 Minutes | 44 | 10.4% |
| 25 to 29 Minutes | 3 | 0.7% |
| 30 to 34 Minutes | 108 | 25.6% |
| 35 to 39 Minutes | 6 | 1.4% |
| 40 to 44 Minutes | 27 | 6.4% |
| 45 to 59 Minutes | 30 | 7.1% |
| 60 to 89 Minutes | 33 | 7.8% |
| 90 or more Minutes | 49 | 11.6% |
Commute Time by Sex in East Tawakoni
The most common commute times in East Tawakoni are 90 or more minutes (32 commuters, 20.3%) for males and 30 to 34 minutes (88 commuters, 33.3%) for females.
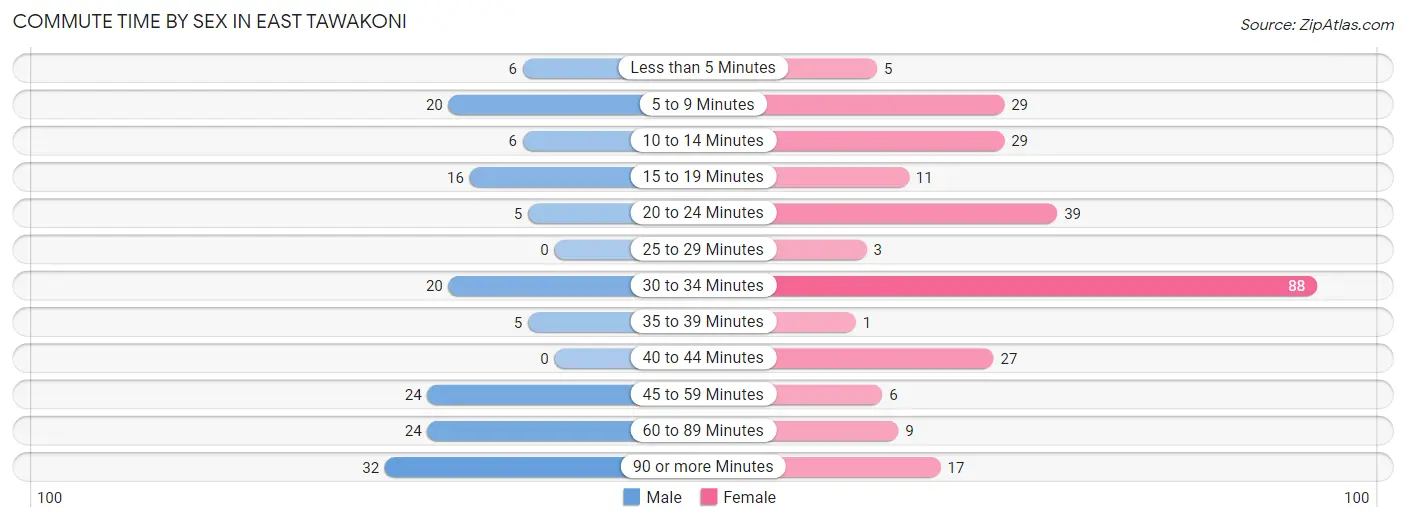
| Commute Time | Male | Female |
| Less than 5 Minutes | 6 (3.8%) | 5 (1.9%) |
| 5 to 9 Minutes | 20 (12.7%) | 29 (11.0%) |
| 10 to 14 Minutes | 6 (3.8%) | 29 (11.0%) |
| 15 to 19 Minutes | 16 (10.1%) | 11 (4.2%) |
| 20 to 24 Minutes | 5 (3.2%) | 39 (14.8%) |
| 25 to 29 Minutes | 0 (0.0%) | 3 (1.1%) |
| 30 to 34 Minutes | 20 (12.7%) | 88 (33.3%) |
| 35 to 39 Minutes | 5 (3.2%) | 1 (0.4%) |
| 40 to 44 Minutes | 0 (0.0%) | 27 (10.2%) |
| 45 to 59 Minutes | 24 (15.2%) | 6 (2.3%) |
| 60 to 89 Minutes | 24 (15.2%) | 9 (3.4%) |
| 90 or more Minutes | 32 (20.3%) | 17 (6.4%) |
Time of Departure to Work by Sex in East Tawakoni
The most frequent times of departure to work in East Tawakoni are 7:00 AM to 7:29 AM (27, 17.1%) for males and 6:00 AM to 6:29 AM (52, 19.7%) for females.
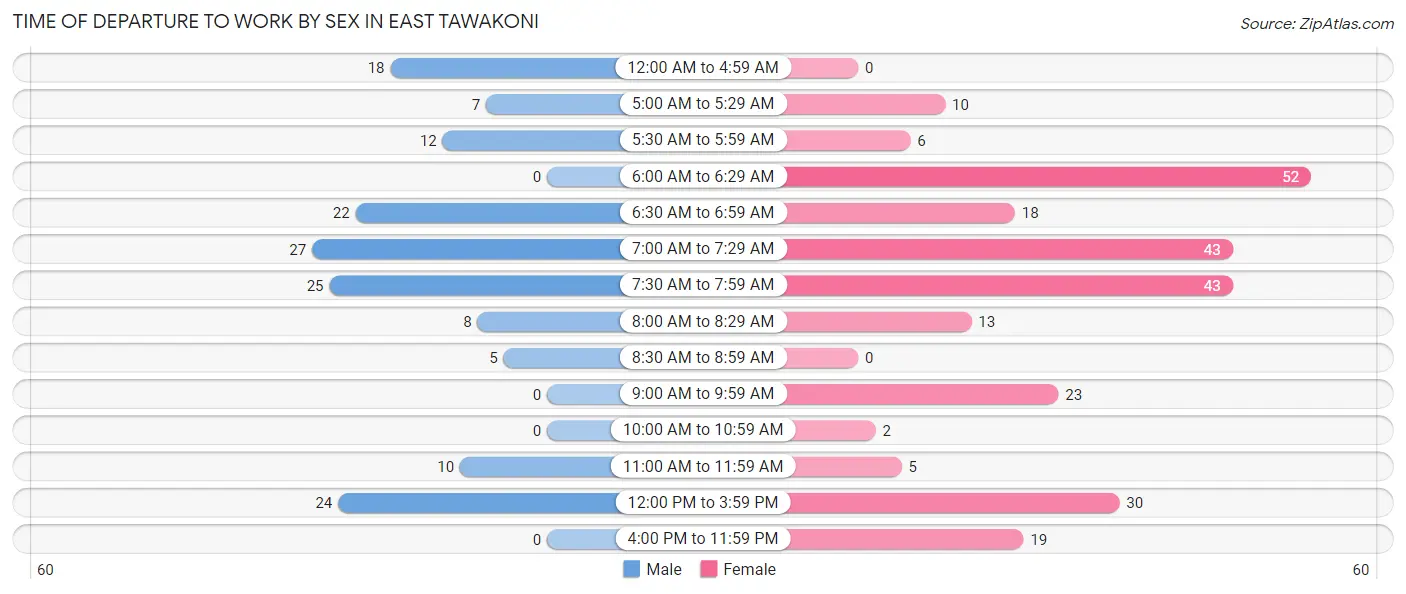
| Time of Departure | Male | Female |
| 12:00 AM to 4:59 AM | 18 (11.4%) | 0 (0.0%) |
| 5:00 AM to 5:29 AM | 7 (4.4%) | 10 (3.8%) |
| 5:30 AM to 5:59 AM | 12 (7.6%) | 6 (2.3%) |
| 6:00 AM to 6:29 AM | 0 (0.0%) | 52 (19.7%) |
| 6:30 AM to 6:59 AM | 22 (13.9%) | 18 (6.8%) |
| 7:00 AM to 7:29 AM | 27 (17.1%) | 43 (16.3%) |
| 7:30 AM to 7:59 AM | 25 (15.8%) | 43 (16.3%) |
| 8:00 AM to 8:29 AM | 8 (5.1%) | 13 (4.9%) |
| 8:30 AM to 8:59 AM | 5 (3.2%) | 0 (0.0%) |
| 9:00 AM to 9:59 AM | 0 (0.0%) | 23 (8.7%) |
| 10:00 AM to 10:59 AM | 0 (0.0%) | 2 (0.8%) |
| 11:00 AM to 11:59 AM | 10 (6.3%) | 5 (1.9%) |
| 12:00 PM to 3:59 PM | 24 (15.2%) | 30 (11.4%) |
| 4:00 PM to 11:59 PM | 0 (0.0%) | 19 (7.2%) |
| Total | 158 (100.0%) | 264 (100.0%) |
Housing Occupancy in East Tawakoni
Occupancy by Ownership in East Tawakoni
Of the total 361 dwellings in East Tawakoni, owner-occupied units account for 245 (67.9%), while renter-occupied units make up 116 (32.1%).
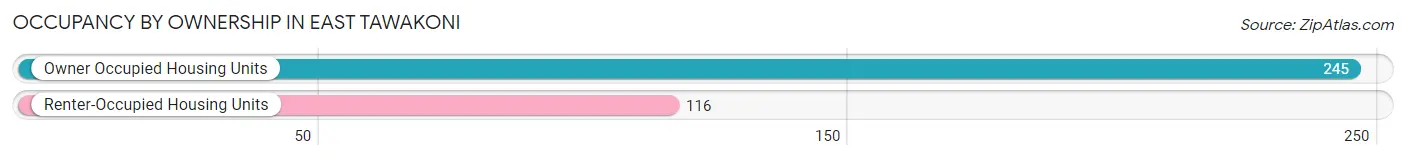
| Occupancy | # Housing Units | % Housing Units |
| Owner Occupied Housing Units | 245 | 67.9% |
| Renter-Occupied Housing Units | 116 | 32.1% |
| Total Occupied Housing Units | 361 | 100.0% |
Occupancy by Household Size in East Tawakoni
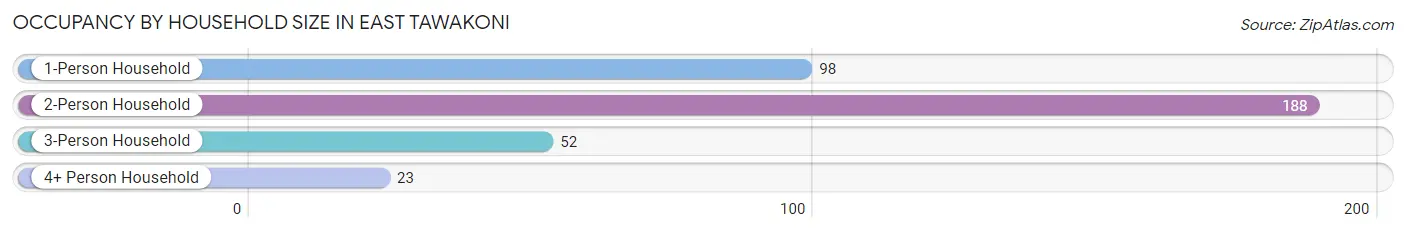
| Household Size | # Housing Units | % Housing Units |
| 1-Person Household | 98 | 27.2% |
| 2-Person Household | 188 | 52.1% |
| 3-Person Household | 52 | 14.4% |
| 4+ Person Household | 23 | 6.4% |
| Total Housing Units | 361 | 100.0% |
Occupancy by Ownership by Household Size in East Tawakoni
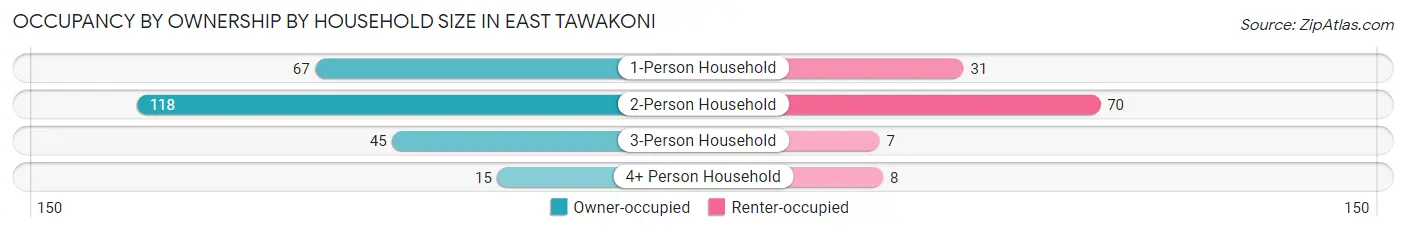
| Household Size | Owner-occupied | Renter-occupied |
| 1-Person Household | 67 (68.4%) | 31 (31.6%) |
| 2-Person Household | 118 (62.8%) | 70 (37.2%) |
| 3-Person Household | 45 (86.5%) | 7 (13.5%) |
| 4+ Person Household | 15 (65.2%) | 8 (34.8%) |
| Total Housing Units | 245 (67.9%) | 116 (32.1%) |
Occupancy by Educational Attainment in East Tawakoni
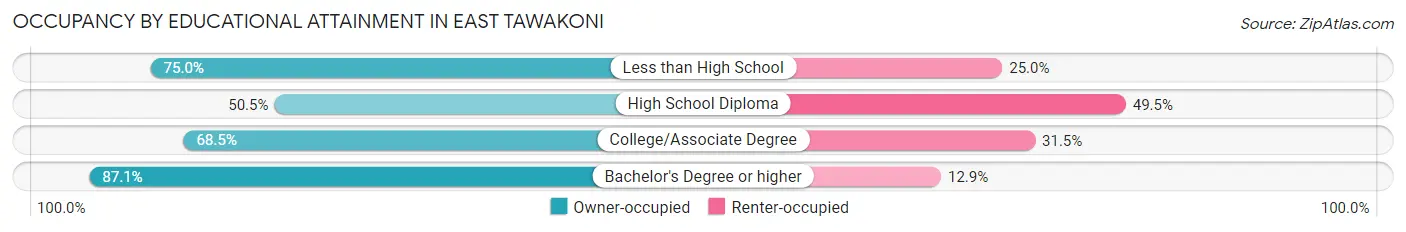
| Household Size | Owner-occupied | Renter-occupied |
| Less than High School | 33 (75.0%) | 11 (25.0%) |
| High School Diploma | 51 (50.5%) | 50 (49.5%) |
| College/Associate Degree | 100 (68.5%) | 46 (31.5%) |
| Bachelor's Degree or higher | 61 (87.1%) | 9 (12.9%) |
Occupancy by Age of Householder in East Tawakoni
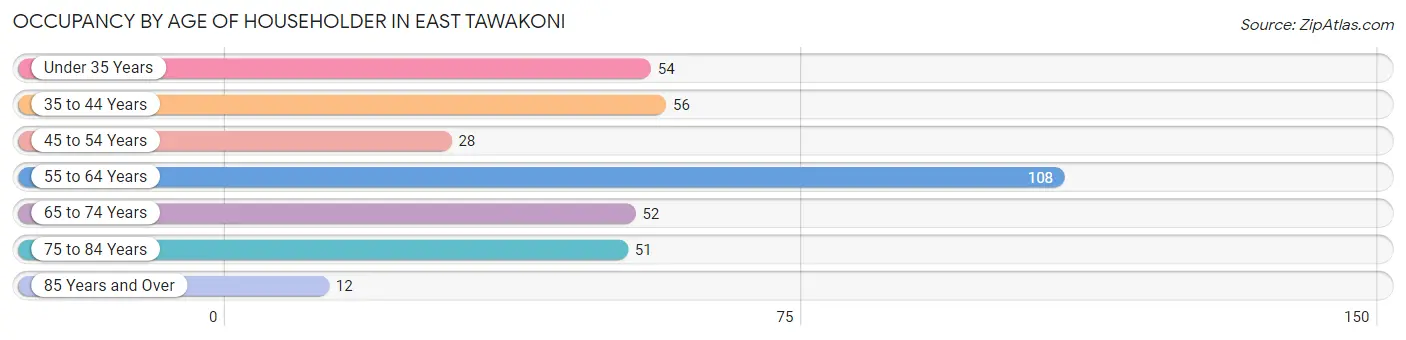
| Age Bracket | # Households | % Households |
| Under 35 Years | 54 | 15.0% |
| 35 to 44 Years | 56 | 15.5% |
| 45 to 54 Years | 28 | 7.8% |
| 55 to 64 Years | 108 | 29.9% |
| 65 to 74 Years | 52 | 14.4% |
| 75 to 84 Years | 51 | 14.1% |
| 85 Years and Over | 12 | 3.3% |
| Total | 361 | 100.0% |
Housing Finances in East Tawakoni
Median Income by Occupancy in East Tawakoni
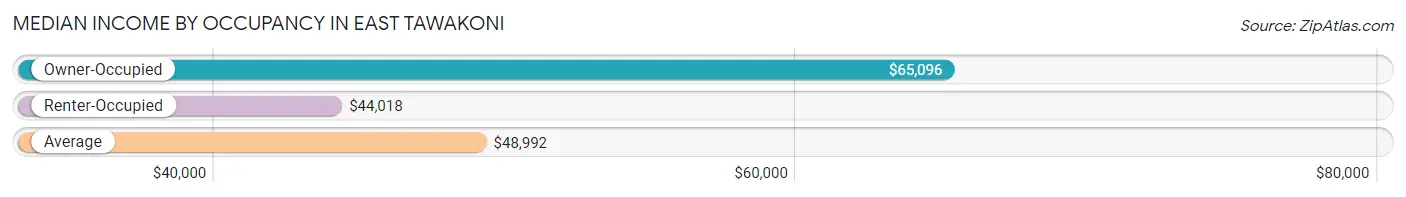
| Occupancy Type | # Households | Median Income |
| Owner-Occupied | 245 (67.9%) | $65,096 |
| Renter-Occupied | 116 (32.1%) | $44,018 |
| Average | 361 (100.0%) | $48,992 |
Occupancy by Householder Income Bracket in East Tawakoni
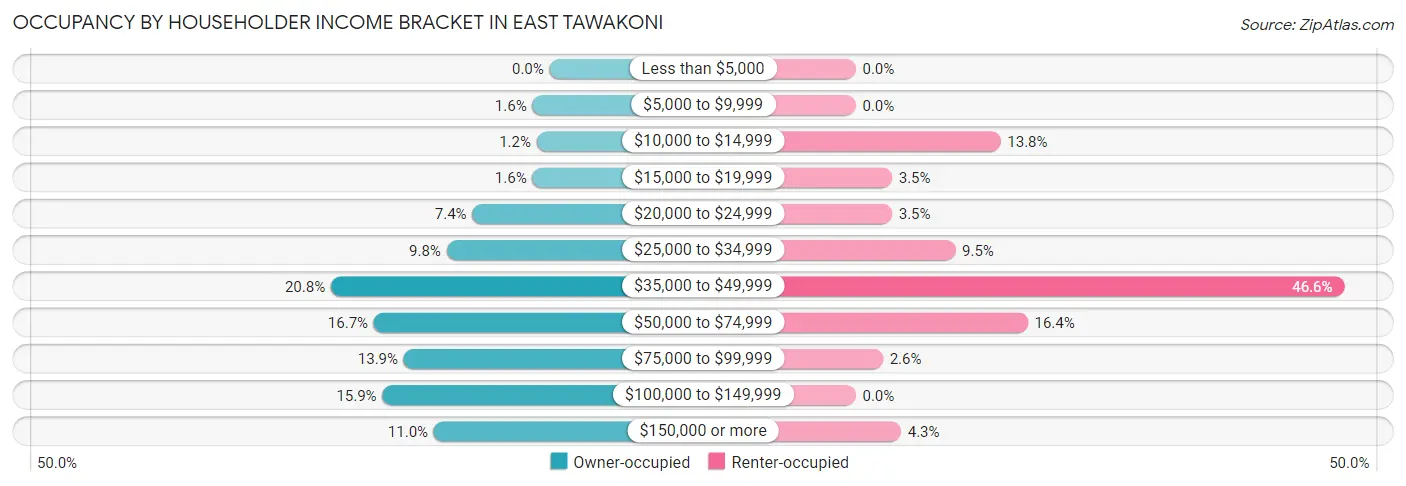
| Income Bracket | Owner-occupied | Renter-occupied |
| Less than $5,000 | 0 (0.0%) | 0 (0.0%) |
| $5,000 to $9,999 | 4 (1.6%) | 0 (0.0%) |
| $10,000 to $14,999 | 3 (1.2%) | 16 (13.8%) |
| $15,000 to $19,999 | 4 (1.6%) | 4 (3.5%) |
| $20,000 to $24,999 | 18 (7.3%) | 4 (3.5%) |
| $25,000 to $34,999 | 24 (9.8%) | 11 (9.5%) |
| $35,000 to $49,999 | 51 (20.8%) | 54 (46.6%) |
| $50,000 to $74,999 | 41 (16.7%) | 19 (16.4%) |
| $75,000 to $99,999 | 34 (13.9%) | 3 (2.6%) |
| $100,000 to $149,999 | 39 (15.9%) | 0 (0.0%) |
| $150,000 or more | 27 (11.0%) | 5 (4.3%) |
| Total | 245 (100.0%) | 116 (100.0%) |
Monthly Housing Cost Tiers in East Tawakoni
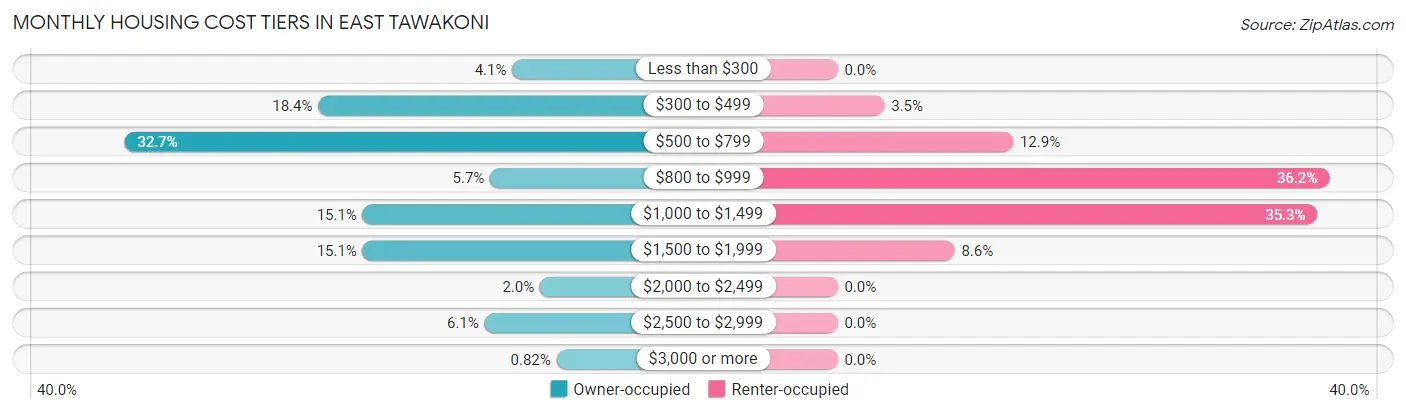
| Monthly Cost | Owner-occupied | Renter-occupied |
| Less than $300 | 10 (4.1%) | 0 (0.0%) |
| $300 to $499 | 45 (18.4%) | 4 (3.5%) |
| $500 to $799 | 80 (32.7%) | 15 (12.9%) |
| $800 to $999 | 14 (5.7%) | 42 (36.2%) |
| $1,000 to $1,499 | 37 (15.1%) | 41 (35.3%) |
| $1,500 to $1,999 | 37 (15.1%) | 10 (8.6%) |
| $2,000 to $2,499 | 5 (2.0%) | 0 (0.0%) |
| $2,500 to $2,999 | 15 (6.1%) | 0 (0.0%) |
| $3,000 or more | 2 (0.8%) | 0 (0.0%) |
| Total | 245 (100.0%) | 116 (100.0%) |
Physical Housing Characteristics in East Tawakoni
Housing Structures in East Tawakoni
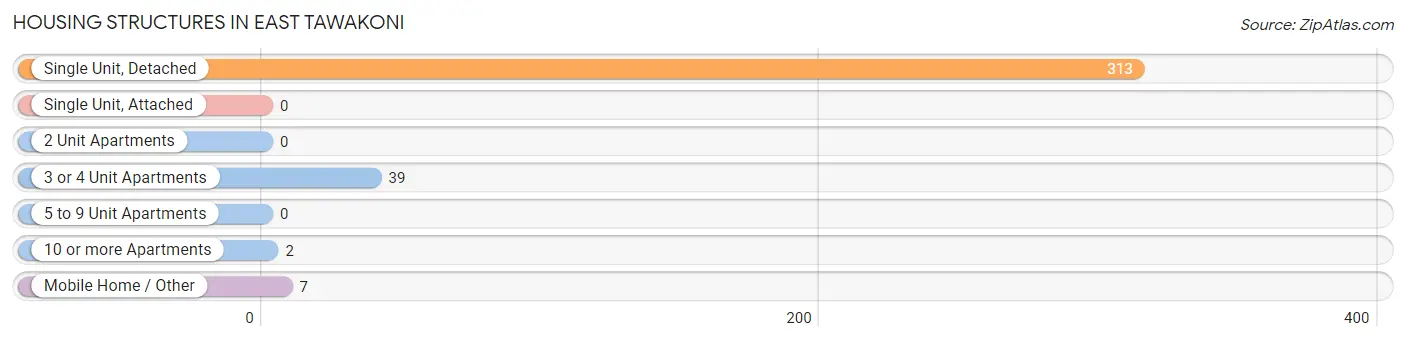
| Structure Type | # Housing Units | % Housing Units |
| Single Unit, Detached | 313 | 86.7% |
| Single Unit, Attached | 0 | 0.0% |
| 2 Unit Apartments | 0 | 0.0% |
| 3 or 4 Unit Apartments | 39 | 10.8% |
| 5 to 9 Unit Apartments | 0 | 0.0% |
| 10 or more Apartments | 2 | 0.5% |
| Mobile Home / Other | 7 | 1.9% |
| Total | 361 | 100.0% |
Housing Structures by Occupancy in East Tawakoni
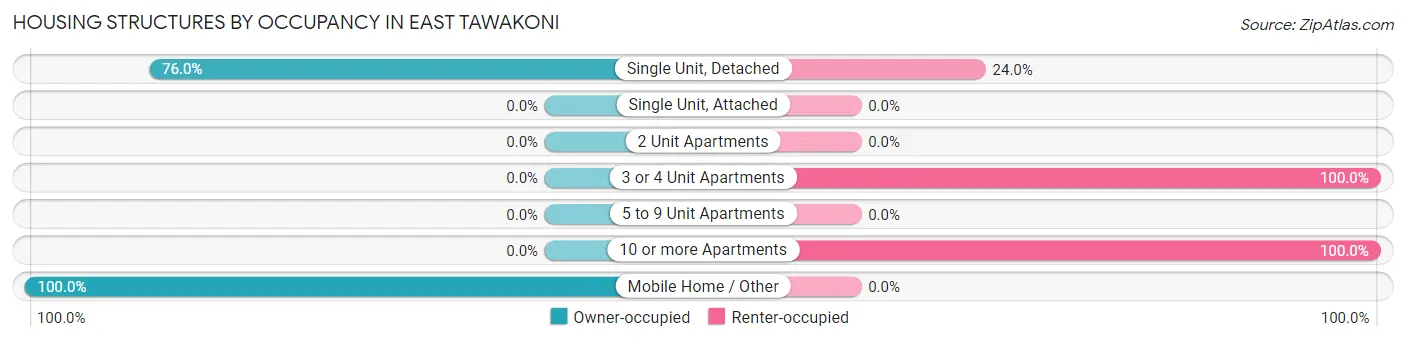
| Structure Type | Owner-occupied | Renter-occupied |
| Single Unit, Detached | 238 (76.0%) | 75 (24.0%) |
| Single Unit, Attached | 0 (0.0%) | 0 (0.0%) |
| 2 Unit Apartments | 0 (0.0%) | 0 (0.0%) |
| 3 or 4 Unit Apartments | 0 (0.0%) | 39 (100.0%) |
| 5 to 9 Unit Apartments | 0 (0.0%) | 0 (0.0%) |
| 10 or more Apartments | 0 (0.0%) | 2 (100.0%) |
| Mobile Home / Other | 7 (100.0%) | 0 (0.0%) |
| Total | 245 (67.9%) | 116 (32.1%) |
Housing Structures by Number of Rooms in East Tawakoni
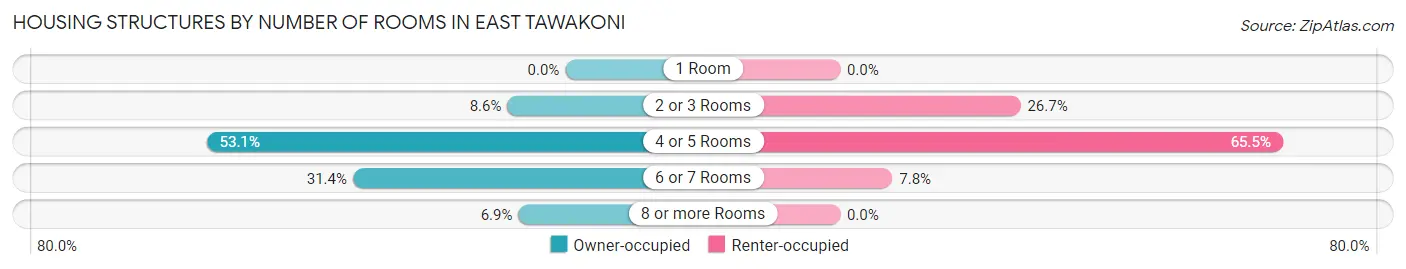
| Number of Rooms | Owner-occupied | Renter-occupied |
| 1 Room | 0 (0.0%) | 0 (0.0%) |
| 2 or 3 Rooms | 21 (8.6%) | 31 (26.7%) |
| 4 or 5 Rooms | 130 (53.1%) | 76 (65.5%) |
| 6 or 7 Rooms | 77 (31.4%) | 9 (7.8%) |
| 8 or more Rooms | 17 (6.9%) | 0 (0.0%) |
| Total | 245 (100.0%) | 116 (100.0%) |
Housing Structure by Heating Type in East Tawakoni
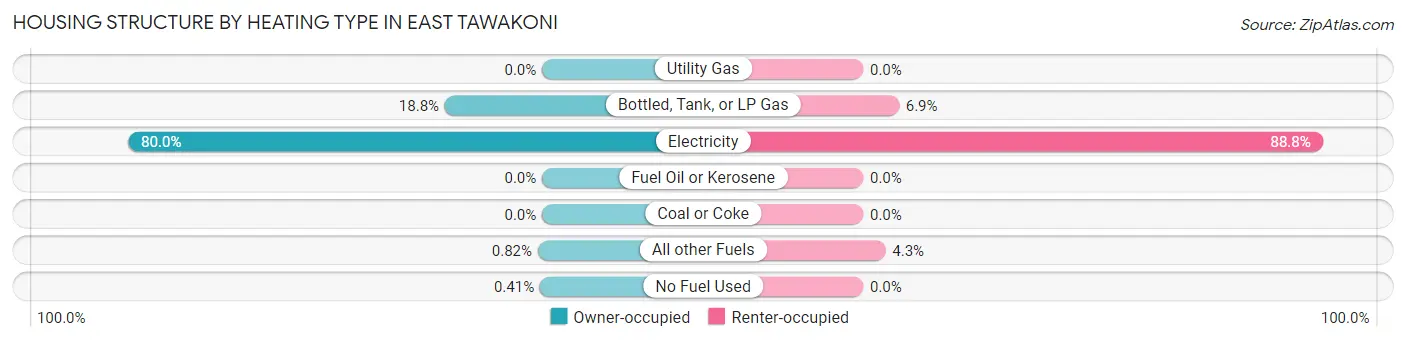
| Heating Type | Owner-occupied | Renter-occupied |
| Utility Gas | 0 (0.0%) | 0 (0.0%) |
| Bottled, Tank, or LP Gas | 46 (18.8%) | 8 (6.9%) |
| Electricity | 196 (80.0%) | 103 (88.8%) |
| Fuel Oil or Kerosene | 0 (0.0%) | 0 (0.0%) |
| Coal or Coke | 0 (0.0%) | 0 (0.0%) |
| All other Fuels | 2 (0.8%) | 5 (4.3%) |
| No Fuel Used | 1 (0.4%) | 0 (0.0%) |
| Total | 245 (100.0%) | 116 (100.0%) |
Household Vehicle Usage in East Tawakoni
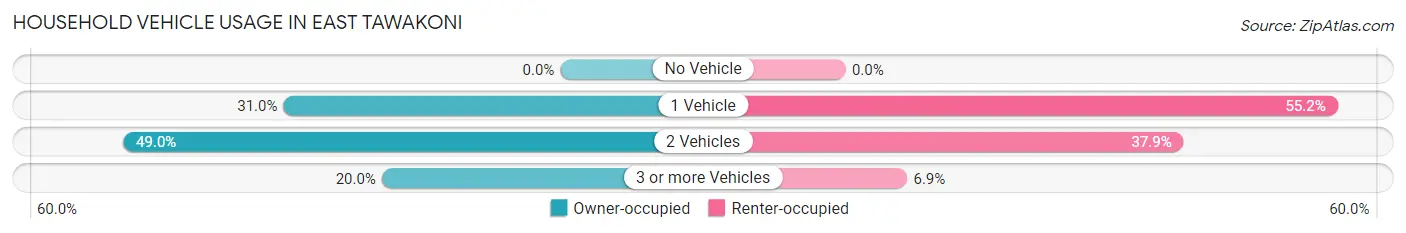
| Vehicles per Household | Owner-occupied | Renter-occupied |
| No Vehicle | 0 (0.0%) | 0 (0.0%) |
| 1 Vehicle | 76 (31.0%) | 64 (55.2%) |
| 2 Vehicles | 120 (49.0%) | 44 (37.9%) |
| 3 or more Vehicles | 49 (20.0%) | 8 (6.9%) |
| Total | 245 (100.0%) | 116 (100.0%) |
Real Estate & Mortgages in East Tawakoni
Real Estate and Mortgage Overview in East Tawakoni
| Characteristic | Without Mortgage | With Mortgage |
| Housing Units | 132 | 113 |
| Median Property Value | $100,000 | $165,100 |
| Median Household Income | $48,750 | $23 |
| Monthly Housing Costs | $539 | $2 |
| Real Estate Taxes | $1,363 | $3 |
Property Value by Mortgage Status in East Tawakoni
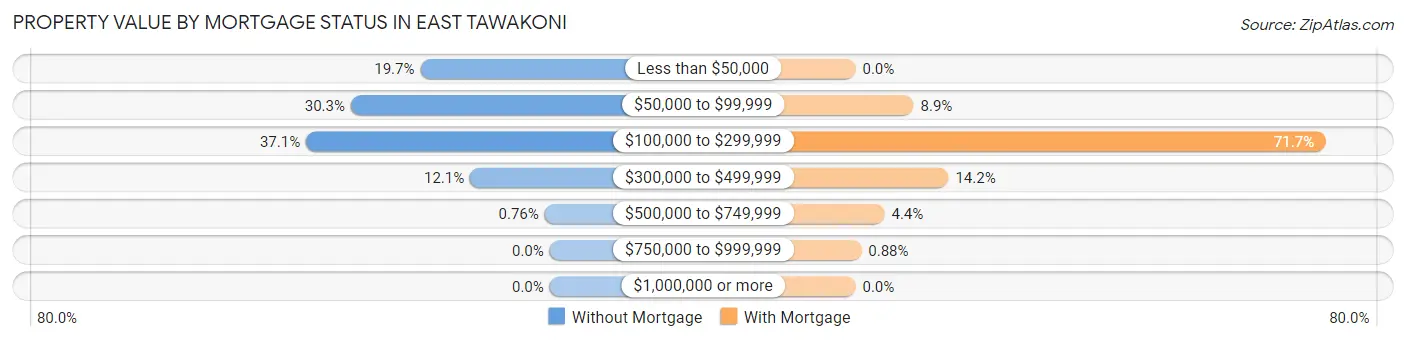
| Property Value | Without Mortgage | With Mortgage |
| Less than $50,000 | 26 (19.7%) | 0 (0.0%) |
| $50,000 to $99,999 | 40 (30.3%) | 10 (8.8%) |
| $100,000 to $299,999 | 49 (37.1%) | 81 (71.7%) |
| $300,000 to $499,999 | 16 (12.1%) | 16 (14.2%) |
| $500,000 to $749,999 | 1 (0.8%) | 5 (4.4%) |
| $750,000 to $999,999 | 0 (0.0%) | 1 (0.9%) |
| $1,000,000 or more | 0 (0.0%) | 0 (0.0%) |
| Total | 132 (100.0%) | 113 (100.0%) |
Household Income by Mortgage Status in East Tawakoni
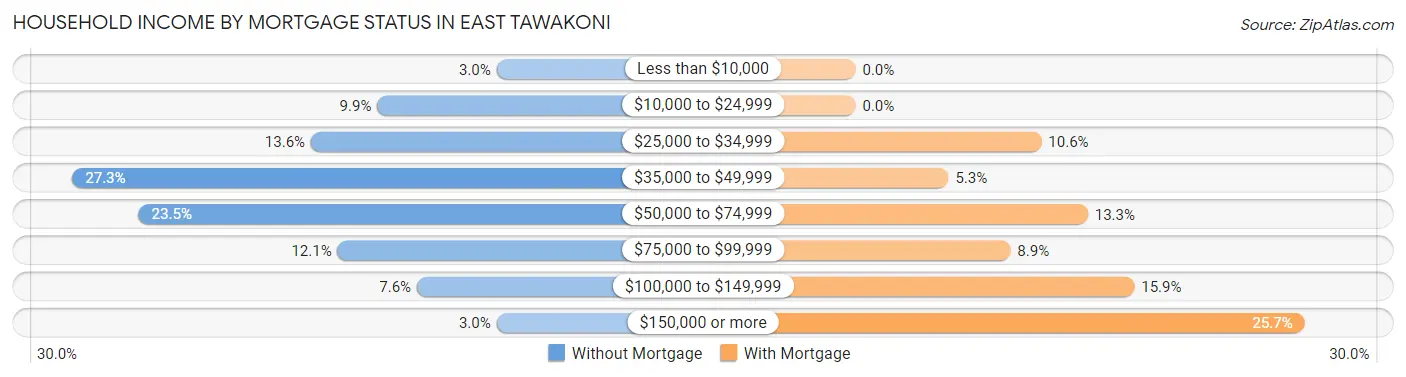
| Household Income | Without Mortgage | With Mortgage |
| Less than $10,000 | 4 (3.0%) | 0 (0.0%) |
| $10,000 to $24,999 | 13 (9.9%) | 0 (0.0%) |
| $25,000 to $34,999 | 18 (13.6%) | 12 (10.6%) |
| $35,000 to $49,999 | 36 (27.3%) | 6 (5.3%) |
| $50,000 to $74,999 | 31 (23.5%) | 15 (13.3%) |
| $75,000 to $99,999 | 16 (12.1%) | 10 (8.8%) |
| $100,000 to $149,999 | 10 (7.6%) | 18 (15.9%) |
| $150,000 or more | 4 (3.0%) | 29 (25.7%) |
| Total | 132 (100.0%) | 113 (100.0%) |
Property Value to Household Income Ratio in East Tawakoni
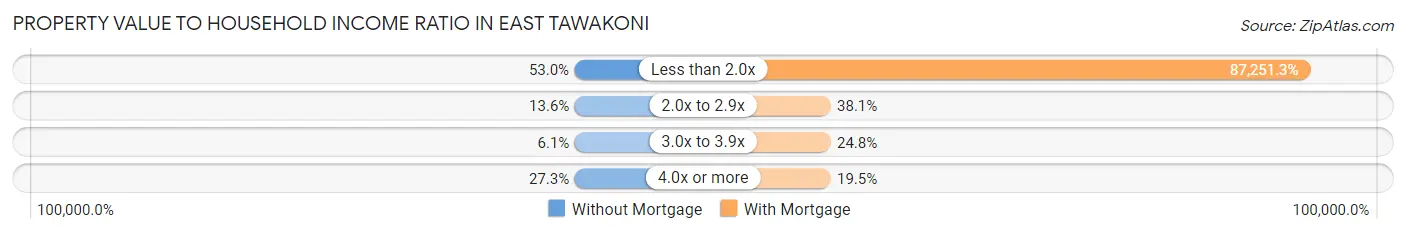
| Value-to-Income Ratio | Without Mortgage | With Mortgage |
| Less than 2.0x | 70 (53.0%) | 98,594 (87,251.3%) |
| 2.0x to 2.9x | 18 (13.6%) | 43 (38.1%) |
| 3.0x to 3.9x | 8 (6.1%) | 28 (24.8%) |
| 4.0x or more | 36 (27.3%) | 22 (19.5%) |
| Total | 132 (100.0%) | 113 (100.0%) |
Real Estate Taxes by Mortgage Status in East Tawakoni
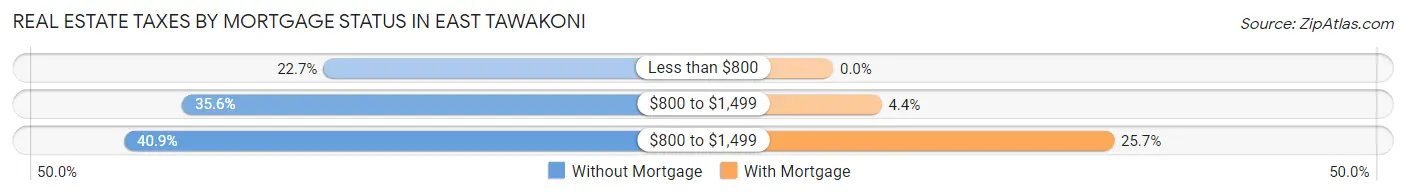
| Property Taxes | Without Mortgage | With Mortgage |
| Less than $800 | 30 (22.7%) | 0 (0.0%) |
| $800 to $1,499 | 47 (35.6%) | 5 (4.4%) |
| $800 to $1,499 | 54 (40.9%) | 29 (25.7%) |
| Total | 132 (100.0%) | 113 (100.0%) |
Health & Disability in East Tawakoni
Health Insurance Coverage by Age in East Tawakoni
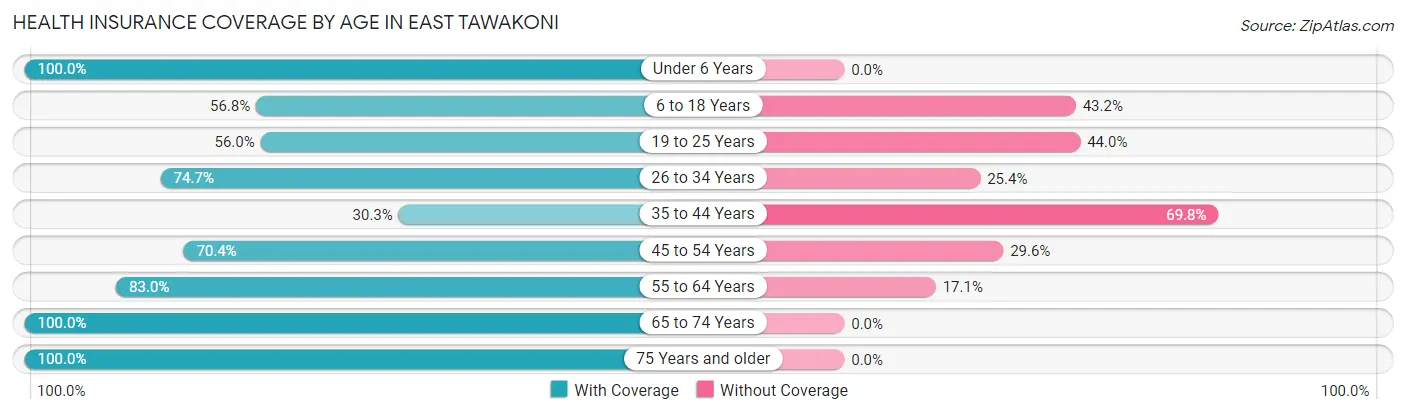
| Age Bracket | With Coverage | Without Coverage |
| Under 6 Years | 34 (100.0%) | 0 (0.0%) |
| 6 to 18 Years | 54 (56.8%) | 41 (43.2%) |
| 19 to 25 Years | 56 (56.0%) | 44 (44.0%) |
| 26 to 34 Years | 53 (74.7%) | 18 (25.4%) |
| 35 to 44 Years | 36 (30.2%) | 83 (69.8%) |
| 45 to 54 Years | 57 (70.4%) | 24 (29.6%) |
| 55 to 64 Years | 146 (83.0%) | 30 (17.1%) |
| 65 to 74 Years | 105 (100.0%) | 0 (0.0%) |
| 75 Years and older | 112 (100.0%) | 0 (0.0%) |
| Total | 653 (73.1%) | 240 (26.9%) |
Health Insurance Coverage by Citizenship Status in East Tawakoni
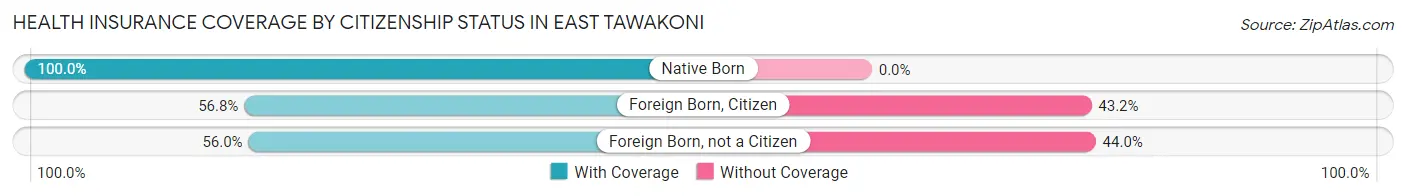
| Citizenship Status | With Coverage | Without Coverage |
| Native Born | 34 (100.0%) | 0 (0.0%) |
| Foreign Born, Citizen | 54 (56.8%) | 41 (43.2%) |
| Foreign Born, not a Citizen | 56 (56.0%) | 44 (44.0%) |
Health Insurance Coverage by Household Income in East Tawakoni
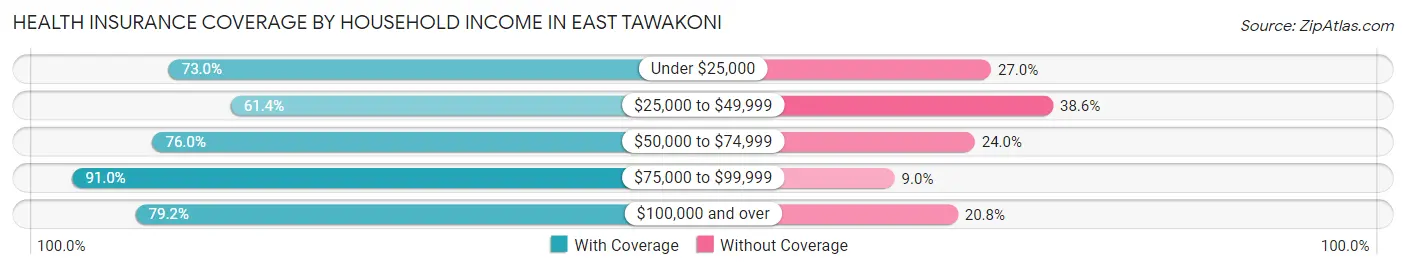
| Household Income | With Coverage | Without Coverage |
| Under $25,000 | 54 (73.0%) | 20 (27.0%) |
| $25,000 to $49,999 | 181 (61.4%) | 114 (38.6%) |
| $50,000 to $74,999 | 149 (76.0%) | 47 (24.0%) |
| $75,000 to $99,999 | 71 (91.0%) | 7 (9.0%) |
| $100,000 and over | 198 (79.2%) | 52 (20.8%) |
Public vs Private Health Insurance Coverage by Age in East Tawakoni
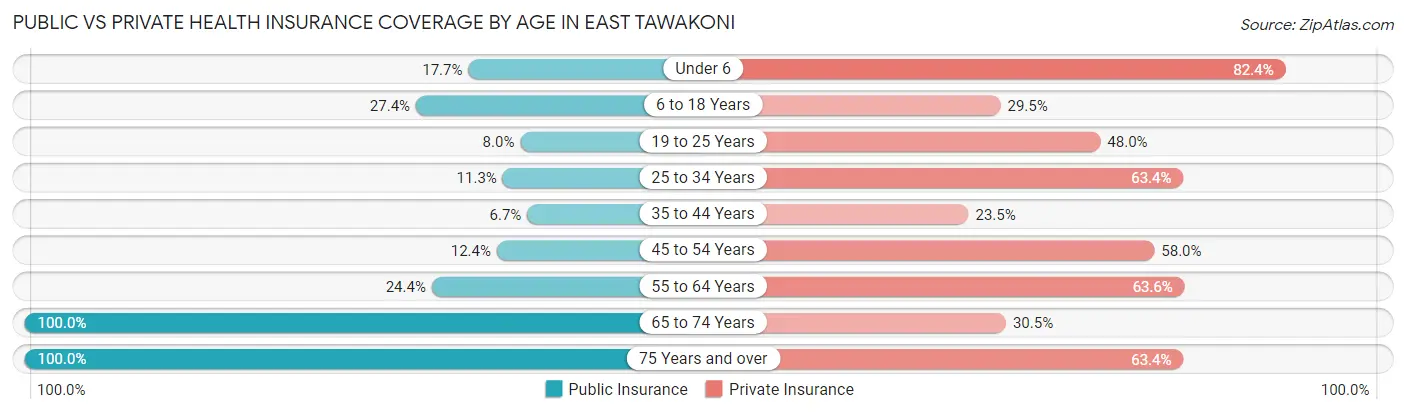
| Age Bracket | Public Insurance | Private Insurance |
| Under 6 | 6 (17.6%) | 28 (82.4%) |
| 6 to 18 Years | 26 (27.4%) | 28 (29.5%) |
| 19 to 25 Years | 8 (8.0%) | 48 (48.0%) |
| 25 to 34 Years | 8 (11.3%) | 45 (63.4%) |
| 35 to 44 Years | 8 (6.7%) | 28 (23.5%) |
| 45 to 54 Years | 10 (12.3%) | 47 (58.0%) |
| 55 to 64 Years | 43 (24.4%) | 112 (63.6%) |
| 65 to 74 Years | 105 (100.0%) | 32 (30.5%) |
| 75 Years and over | 112 (100.0%) | 71 (63.4%) |
| Total | 326 (36.5%) | 439 (49.2%) |
Disability Status by Sex by Age in East Tawakoni
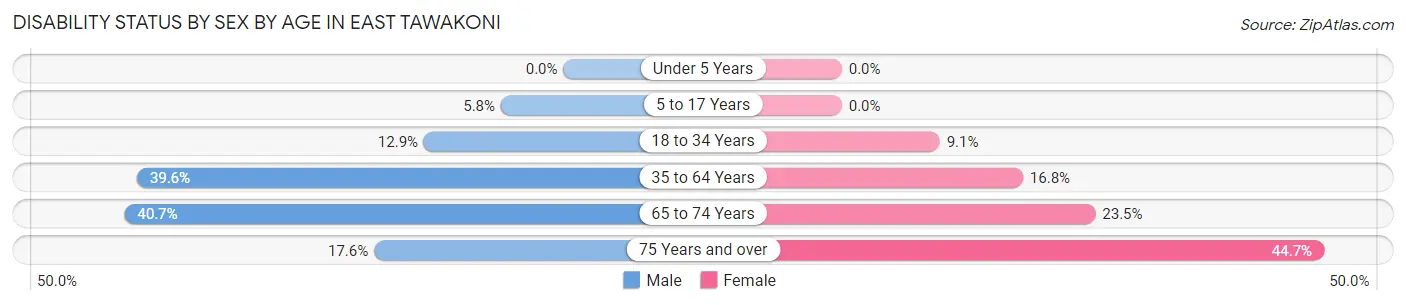
| Age Bracket | Male | Female |
| Under 5 Years | 0 (0.0%) | 0 (0.0%) |
| 5 to 17 Years | 4 (5.8%) | 0 (0.0%) |
| 18 to 34 Years | 11 (12.9%) | 9 (9.1%) |
| 35 to 64 Years | 57 (39.6%) | 39 (16.8%) |
| 65 to 74 Years | 22 (40.7%) | 12 (23.5%) |
| 75 Years and over | 13 (17.6%) | 17 (44.7%) |
Disability Class by Sex by Age in East Tawakoni
Disability Class: Hearing Difficulty
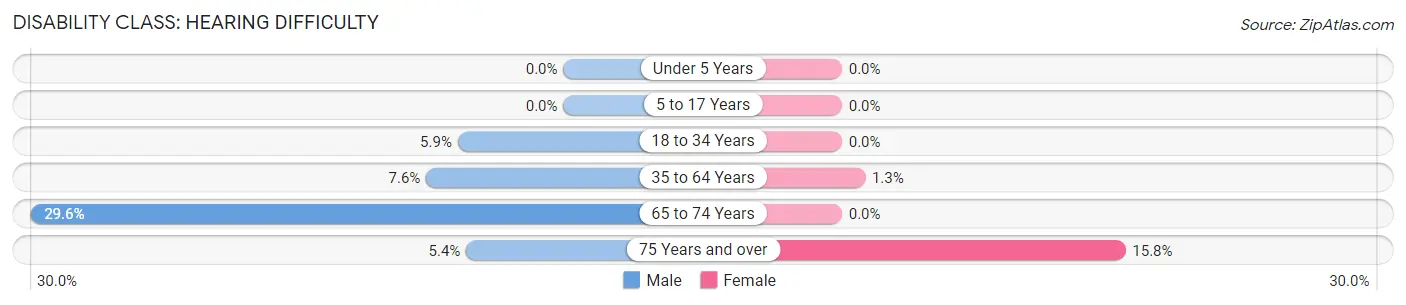
| Age Bracket | Male | Female |
| Under 5 Years | 0 (0.0%) | 0 (0.0%) |
| 5 to 17 Years | 0 (0.0%) | 0 (0.0%) |
| 18 to 34 Years | 5 (5.9%) | 0 (0.0%) |
| 35 to 64 Years | 11 (7.6%) | 3 (1.3%) |
| 65 to 74 Years | 16 (29.6%) | 0 (0.0%) |
| 75 Years and over | 4 (5.4%) | 6 (15.8%) |
Disability Class: Vision Difficulty
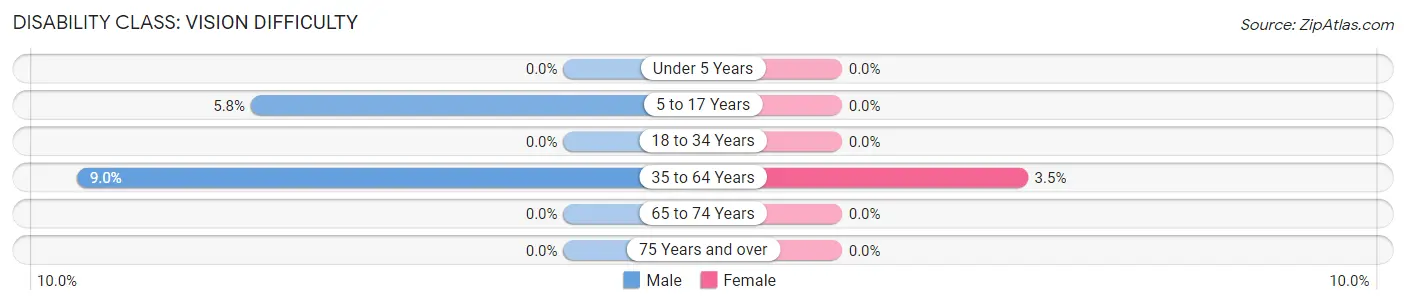
| Age Bracket | Male | Female |
| Under 5 Years | 0 (0.0%) | 0 (0.0%) |
| 5 to 17 Years | 4 (5.8%) | 0 (0.0%) |
| 18 to 34 Years | 0 (0.0%) | 0 (0.0%) |
| 35 to 64 Years | 13 (9.0%) | 8 (3.5%) |
| 65 to 74 Years | 0 (0.0%) | 0 (0.0%) |
| 75 Years and over | 0 (0.0%) | 0 (0.0%) |
Disability Class: Cognitive Difficulty
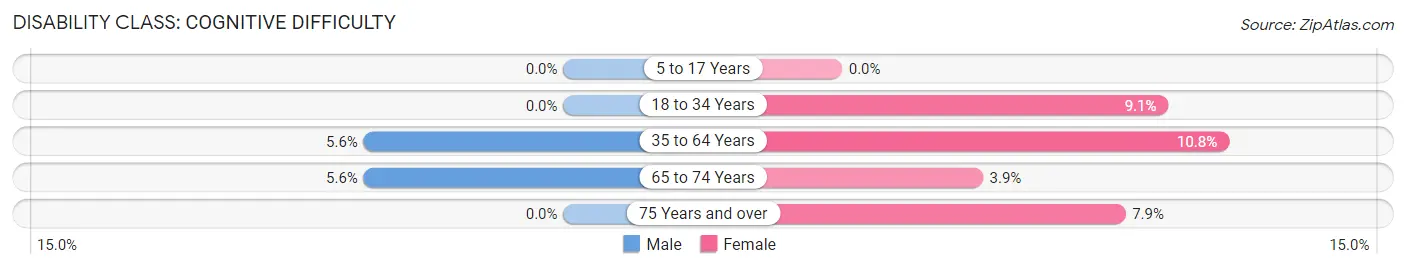
| Age Bracket | Male | Female |
| 5 to 17 Years | 0 (0.0%) | 0 (0.0%) |
| 18 to 34 Years | 0 (0.0%) | 9 (9.1%) |
| 35 to 64 Years | 8 (5.6%) | 25 (10.8%) |
| 65 to 74 Years | 3 (5.6%) | 2 (3.9%) |
| 75 Years and over | 0 (0.0%) | 3 (7.9%) |
Disability Class: Ambulatory Difficulty
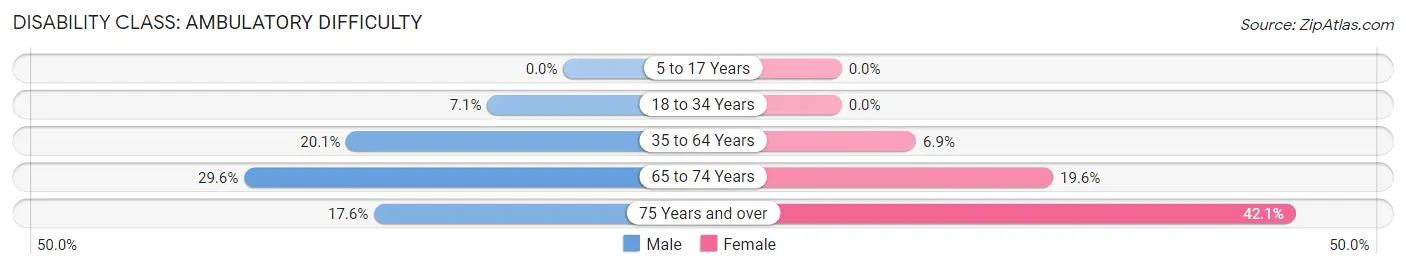
| Age Bracket | Male | Female |
| 5 to 17 Years | 0 (0.0%) | 0 (0.0%) |
| 18 to 34 Years | 6 (7.1%) | 0 (0.0%) |
| 35 to 64 Years | 29 (20.1%) | 16 (6.9%) |
| 65 to 74 Years | 16 (29.6%) | 10 (19.6%) |
| 75 Years and over | 13 (17.6%) | 16 (42.1%) |
Disability Class: Self-Care Difficulty
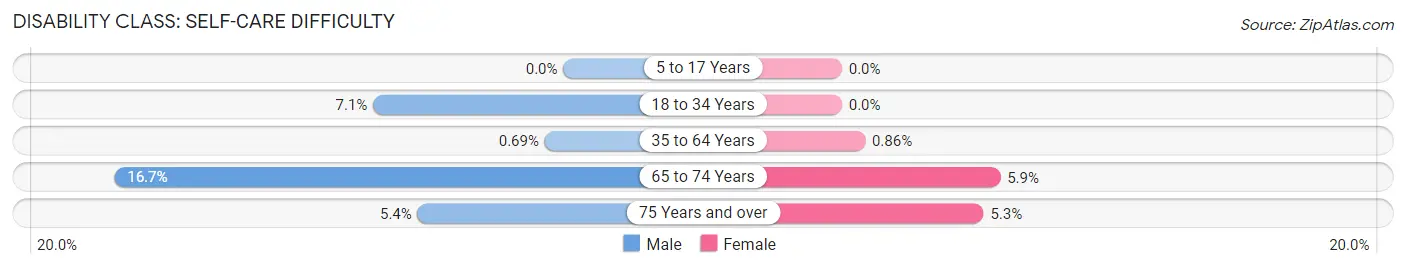
| Age Bracket | Male | Female |
| 5 to 17 Years | 0 (0.0%) | 0 (0.0%) |
| 18 to 34 Years | 6 (7.1%) | 0 (0.0%) |
| 35 to 64 Years | 1 (0.7%) | 2 (0.9%) |
| 65 to 74 Years | 9 (16.7%) | 3 (5.9%) |
| 75 Years and over | 4 (5.4%) | 2 (5.3%) |
Technology Access in East Tawakoni
Computing Device Access in East Tawakoni
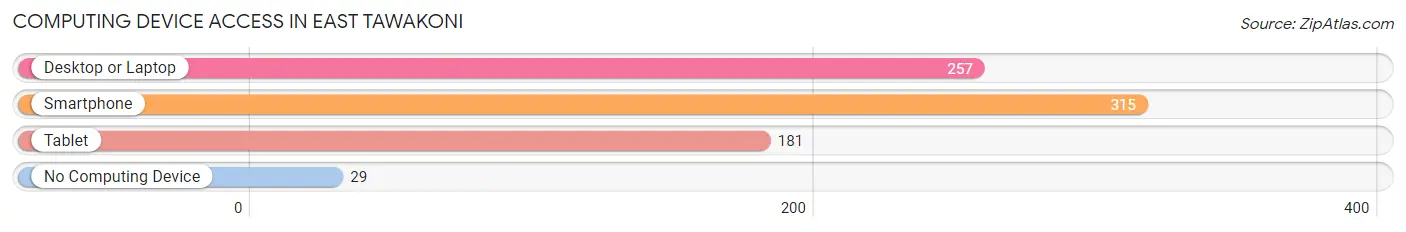
| Device Type | # Households | % Households |
| Desktop or Laptop | 257 | 71.2% |
| Smartphone | 315 | 87.3% |
| Tablet | 181 | 50.1% |
| No Computing Device | 29 | 8.0% |
| Total | 361 | 100.0% |
Internet Access in East Tawakoni
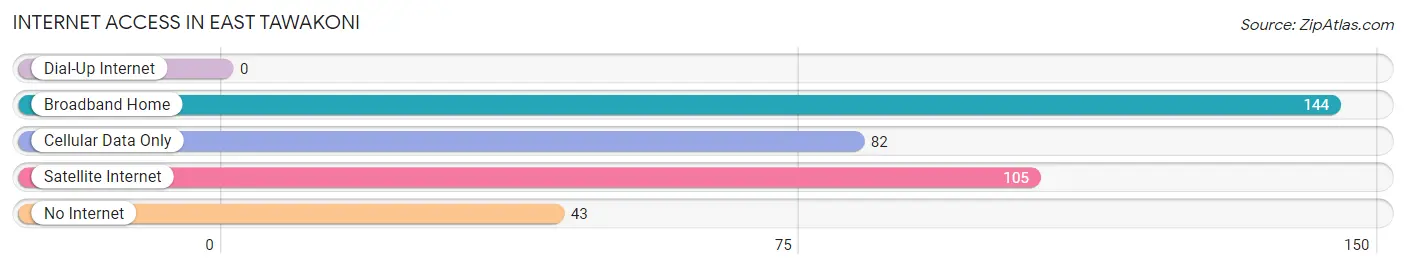
| Internet Type | # Households | % Households |
| Dial-Up Internet | 0 | 0.0% |
| Broadband Home | 144 | 39.9% |
| Cellular Data Only | 82 | 22.7% |
| Satellite Internet | 105 | 29.1% |
| No Internet | 43 | 11.9% |
| Total | 361 | 100.0% |
East Tawakoni Summary
East Tawakoni is a small town located in Hunt County, Texas, United States. It is situated on the eastern shore of Lake Tawakoni, approximately 50 miles east of Dallas. The town was founded in the late 1800s and has a population of approximately 1,000 people.
History
East Tawakoni was founded in the late 1800s by settlers from the nearby town of Tawakoni. The town was originally known as East Tawakoni, but the name was changed to East Tawakoni in the early 1900s. The town was incorporated in 1909 and has remained a small, rural community ever since.
The town was originally a farming community, but in the 1950s, the town began to experience a population boom due to the construction of Lake Tawakoni. The lake was created by the U.S. Army Corps of Engineers in order to provide a water supply for the area. The lake also provided recreational opportunities for the town, such as fishing, boating, and swimming.
In the late 1970s, the town began to experience a decline in population due to the closure of several local businesses. However, in the early 2000s, the town began to experience a resurgence in population due to the construction of several new housing developments.
Geography
East Tawakoni is located in Hunt County, Texas, approximately 50 miles east of Dallas. The town is situated on the eastern shore of Lake Tawakoni, which was created by the U.S. Army Corps of Engineers in the 1950s. The lake provides recreational opportunities for the town, such as fishing, boating, and swimming.
The town is located in a rural area and is surrounded by farmland. The town is also located near several small towns, such as Quinlan, Emory, and Point.
Economy
East Tawakoni is a small, rural community and the economy is largely based on agriculture. The town is home to several small businesses, such as convenience stores, restaurants, and gas stations. The town is also home to several small manufacturing companies, such as a furniture factory and a plastics factory.
The town is also home to several recreational businesses, such as marinas, boat rentals, and fishing guides. The town is also home to several campgrounds, which attract visitors from all over the state.
Demographics
As of the 2010 census, the population of East Tawakoni was 1,000 people. The town is predominantly white, with approximately 95% of the population being white. The town is also home to a small Hispanic population, with approximately 5% of the population being Hispanic.
The median household income in East Tawakoni is approximately $35,000, which is slightly lower than the national average. The town also has a higher than average poverty rate, with approximately 20% of the population living below the poverty line.
Conclusion
East Tawakoni is a small, rural town located in Hunt County, Texas. The town was founded in the late 1800s and has a population of approximately 1,000 people. The town is predominantly white and the economy is largely based on agriculture. The town is also home to several small businesses and recreational businesses, such as marinas and campgrounds. The town has a median household income of approximately $35,000 and a higher than average poverty rate.
Common Questions
What is the Total Population of East Tawakoni?
Total Population of East Tawakoni is 893.
What is the Total Male Population of East Tawakoni?
Total Male Population of East Tawakoni is 445.
What is the Total Female Population of East Tawakoni?
Total Female Population of East Tawakoni is 448.
What is the Ratio of Males per 100 Females in East Tawakoni?
There are 99.33 Males per 100 Females in East Tawakoni.
What is the Ratio of Females per 100 Males in East Tawakoni?
There are 100.67 Females per 100 Males in East Tawakoni.
What is the Median Population Age in East Tawakoni?
Median Population Age in East Tawakoni is 49.0 Years.
What is the Average Family Size in East Tawakoni
Average Family Size in East Tawakoni is 3.0 People.
What is the Average Household Size in East Tawakoni
Average Household Size in East Tawakoni is 2.5 People.
What is Per Capita Income in East Tawakoni?
Per Capita income in East Tawakoni is $35,536.
What is the Median Family Income in East Tawakoni?
Median Family Income in East Tawakoni is $61,250.
What is the Median Household income in East Tawakoni?
Median Household Income in East Tawakoni is $48,992.
What is Income or Wage Gap in East Tawakoni?
Income or Wage Gap in East Tawakoni is 3.0%.
Women in East Tawakoni earn 97.0 cents for every dollar earned by a man.
What is Inequality or Gini Index in East Tawakoni?
Inequality or Gini Index in East Tawakoni is 0.42.
How Large is the Labor Force in East Tawakoni?
There are 460 People in the Labor Forcein in East Tawakoni.
What is the Percentage of People in the Labor Force in East Tawakoni?
58.5% of People are in the Labor Force in East Tawakoni.
What is the Unemployment Rate in East Tawakoni?
Unemployment Rate in East Tawakoni is 5.2%.