Driscoll, TX
Driscoll Map
Driscoll Overview
722
TOTAL POPULATION
217
MALE POPULATION
505
FEMALE POPULATION
42.97
MALES / 100 FEMALES
232.72
FEMALES / 100 MALES
24.3
MEDIAN AGE
3.8
AVG FAMILY SIZE
3.5
AVG HOUSEHOLD SIZE
$10,081
PER CAPITA INCOME
$35,599
AVG FAMILY INCOME
$35,246
AVG HOUSEHOLD INCOME
0.37
INEQUALITY / GINI INDEX
271
LABOR FORCE [ PEOPLE ]
55.3%
PERCENT IN LABOR FORCE
3.7%
UNEMPLOYMENT RATE
Driscoll Zip Codes
Driscoll Area Codes
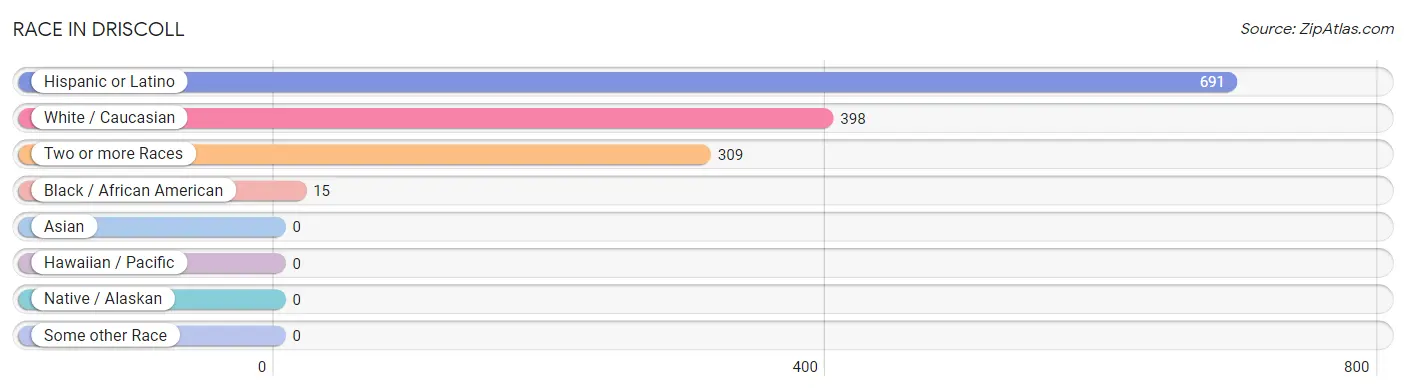
Race in Driscoll
The most populous races in Driscoll are Hispanic or Latino (691 | 95.7%), White / Caucasian (398 | 55.1%), and Two or more Races (309 | 42.8%).
| Race | # Population | % Population |
| Asian | 0 | 0.0% |
| Black / African American | 15 | 2.1% |
| Hawaiian / Pacific | 0 | 0.0% |
| Hispanic or Latino | 691 | 95.7% |
| Native / Alaskan | 0 | 0.0% |
| White / Caucasian | 398 | 55.1% |
| Two or more Races | 309 | 42.8% |
| Some other Race | 0 | 0.0% |
| Total | 722 | 100.0% |
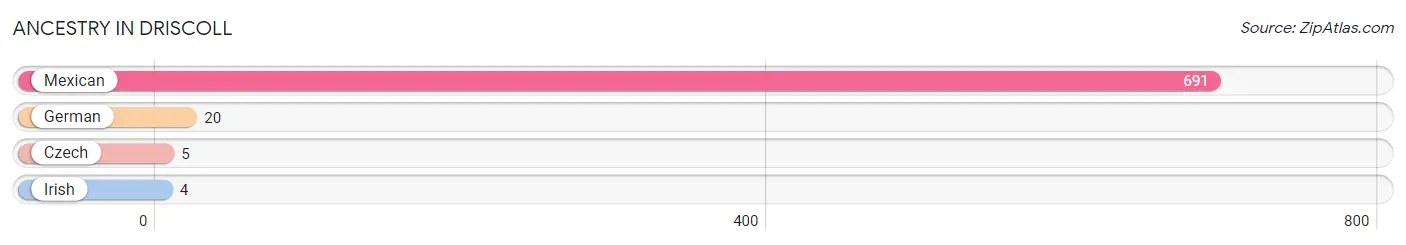
Ancestry in Driscoll
The most populous ancestries reported in Driscoll are Mexican (691 | 95.7%), German (20 | 2.8%), Czech (5 | 0.7%), and Irish (4 | 0.5%), together accounting for 99.7% of all Driscoll residents.
| Ancestry | # Population | % Population |
| Czech | 5 | 0.7% |
| German | 20 | 2.8% |
| Irish | 4 | 0.5% |
| Mexican | 691 | 95.7% | View All 4 Rows |
Immigrants in Driscoll

| Immigration Origin | # Population | % Population | View All 0 Rows |
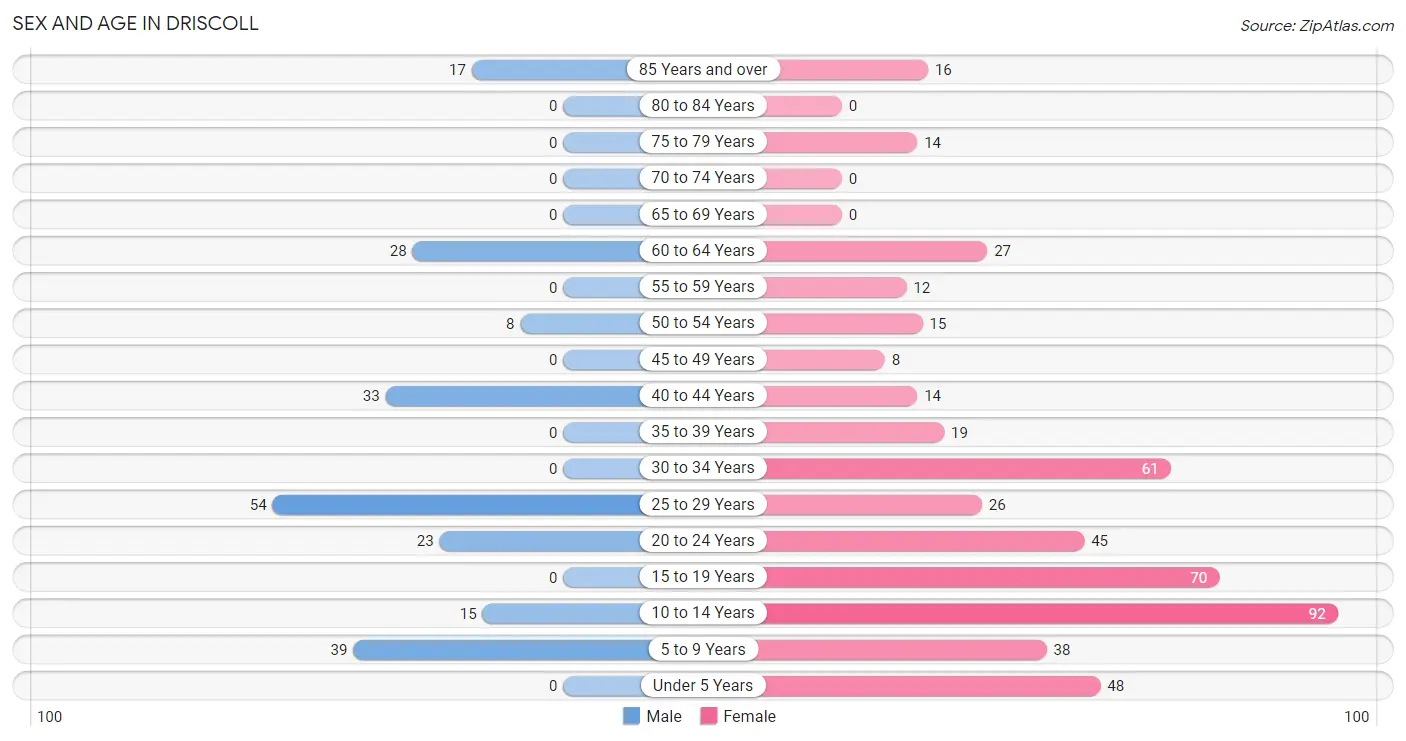
Sex and Age in Driscoll
Sex and Age in Driscoll
The most populous age groups in Driscoll are 25 to 29 Years (54 | 24.9%) for men and 10 to 14 Years (92 | 18.2%) for women.
| Age Bracket | Male | Female |
| Under 5 Years | 0 (0.0%) | 48 (9.5%) |
| 5 to 9 Years | 39 (18.0%) | 38 (7.5%) |
| 10 to 14 Years | 15 (6.9%) | 92 (18.2%) |
| 15 to 19 Years | 0 (0.0%) | 70 (13.9%) |
| 20 to 24 Years | 23 (10.6%) | 45 (8.9%) |
| 25 to 29 Years | 54 (24.9%) | 26 (5.1%) |
| 30 to 34 Years | 0 (0.0%) | 61 (12.1%) |
| 35 to 39 Years | 0 (0.0%) | 19 (3.8%) |
| 40 to 44 Years | 33 (15.2%) | 14 (2.8%) |
| 45 to 49 Years | 0 (0.0%) | 8 (1.6%) |
| 50 to 54 Years | 8 (3.7%) | 15 (3.0%) |
| 55 to 59 Years | 0 (0.0%) | 12 (2.4%) |
| 60 to 64 Years | 28 (12.9%) | 27 (5.3%) |
| 65 to 69 Years | 0 (0.0%) | 0 (0.0%) |
| 70 to 74 Years | 0 (0.0%) | 0 (0.0%) |
| 75 to 79 Years | 0 (0.0%) | 14 (2.8%) |
| 80 to 84 Years | 0 (0.0%) | 0 (0.0%) |
| 85 Years and over | 17 (7.8%) | 16 (3.2%) |
| Total | 217 (100.0%) | 505 (100.0%) |
Families and Households in Driscoll
Median Family Size in Driscoll
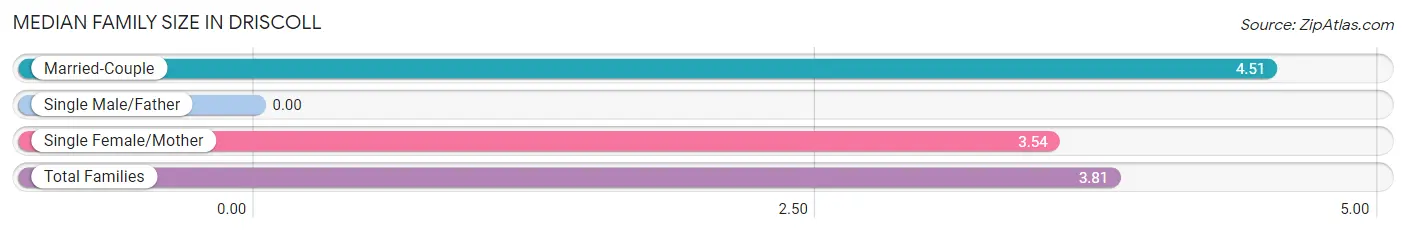
| Family Type | # Families | Family Size |
| Married-Couple | 51 (28.2%) | 4.51 |
| Single Male/Father | 0 (0.0%) | - |
| Single Female/Mother | 130 (71.8%) | 3.54 |
| Total Families | 181 (100.0%) | 3.81 |
Median Household Size in Driscoll
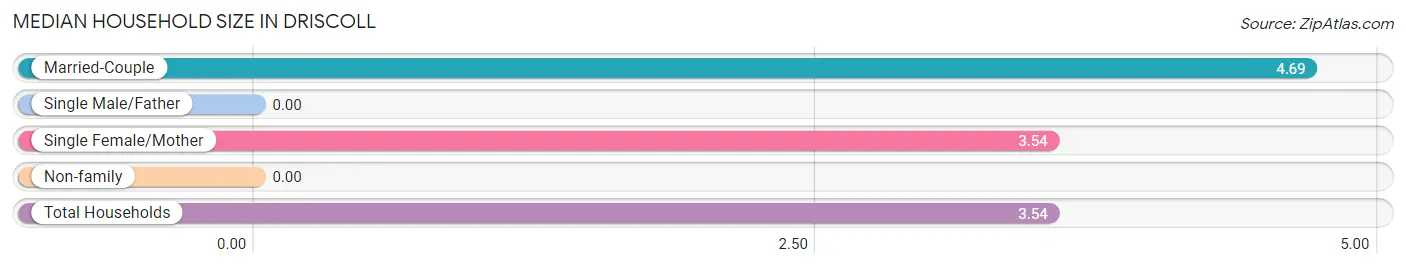
| Household Type | # Households | Household Size |
| Married-Couple | 51 (25.0%) | 4.69 |
| Single Male/Father | 0 (0.0%) | - |
| Single Female/Mother | 130 (63.7%) | 3.54 |
| Non-family | 23 (11.3%) | - |
| Total Households | 204 (100.0%) | 3.54 |
Household Size by Marriage Status in Driscoll
Out of a total of 204 households in Driscoll, 181 (88.7%) are family households, while 23 (11.3%) are nonfamily households. The most numerous type of family households are 4-person households, comprising 83, and the most common type of nonfamily households are 1-person households, comprising 23.
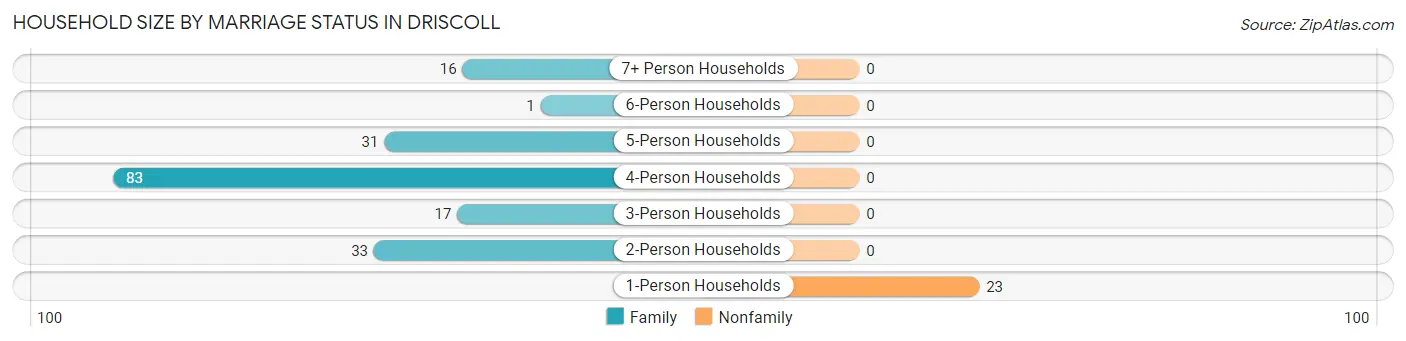
| Household Size | Family Households | Nonfamily Households |
| 1-Person Households | - | 23 (11.3%) |
| 2-Person Households | 33 (16.2%) | 0 (0.0%) |
| 3-Person Households | 17 (8.3%) | 0 (0.0%) |
| 4-Person Households | 83 (40.7%) | 0 (0.0%) |
| 5-Person Households | 31 (15.2%) | 0 (0.0%) |
| 6-Person Households | 1 (0.5%) | 0 (0.0%) |
| 7+ Person Households | 16 (7.8%) | 0 (0.0%) |
| Total | 181 (88.7%) | 23 (11.3%) |
Female Fertility in Driscoll
Fertility by Age in Driscoll
Average fertility rate in Driscoll is 70.0 births per 1,000 women. Women in the age bracket of 20 to 34 years have the highest fertility rate with 129.0 births per 1,000 women. Women in the age bracket of 20 to 34 years acount for 100.0% of all women with births.
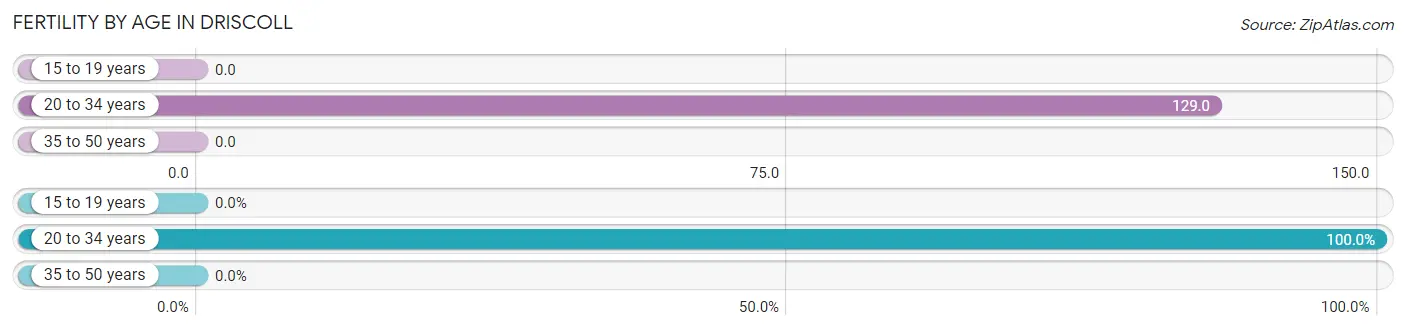
| Age Bracket | Women with Births | Births / 1,000 Women |
| 15 to 19 years | 0 (0.0%) | 0.0 |
| 20 to 34 years | 17 (100.0%) | 129.0 |
| 35 to 50 years | 0 (0.0%) | 0.0 |
| Total | 17 (100.0%) | 70.0 |
Fertility by Age by Marriage Status in Driscoll
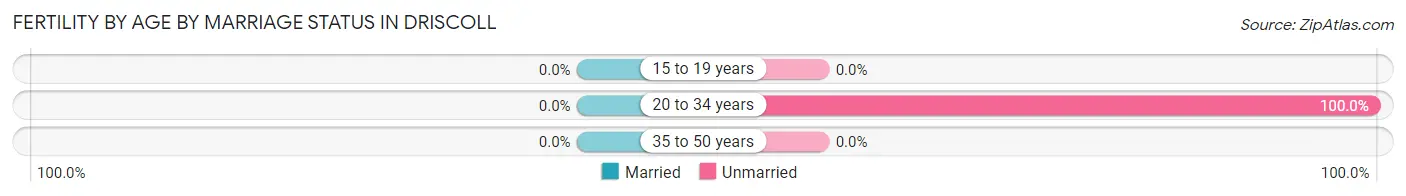
| Age Bracket | Married | Unmarried |
| 15 to 19 years | 0 (0.0%) | 0 (0.0%) |
| 20 to 34 years | 0 (0.0%) | 17 (100.0%) |
| 35 to 50 years | 0 (0.0%) | 0 (0.0%) |
| Total | 0 (0.0%) | 17 (100.0%) |
Fertility by Education in Driscoll
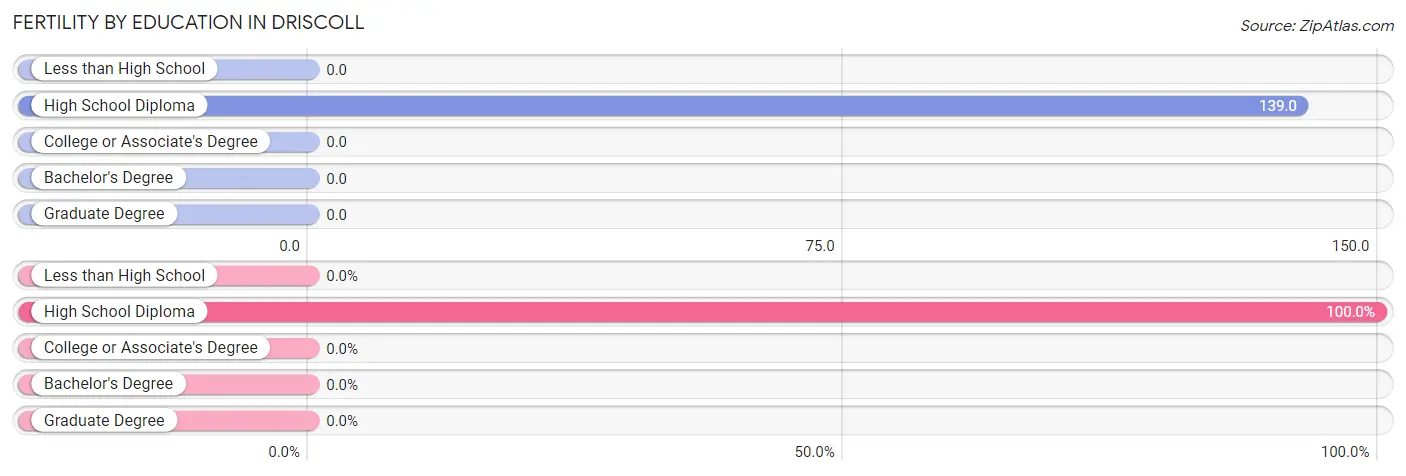
| Educational Attainment | Women with Births | Births / 1,000 Women |
| Less than High School | 0 (0.0%) | 0.0 |
| High School Diploma | 17 (100.0%) | 139.0 |
| College or Associate's Degree | 0 (0.0%) | 0.0 |
| Bachelor's Degree | 0 (0.0%) | 0.0 |
| Graduate Degree | 0 (0.0%) | 0.0 |
| Total | 17 (100.0%) | 70.0 |
Fertility by Education by Marriage Status in Driscoll
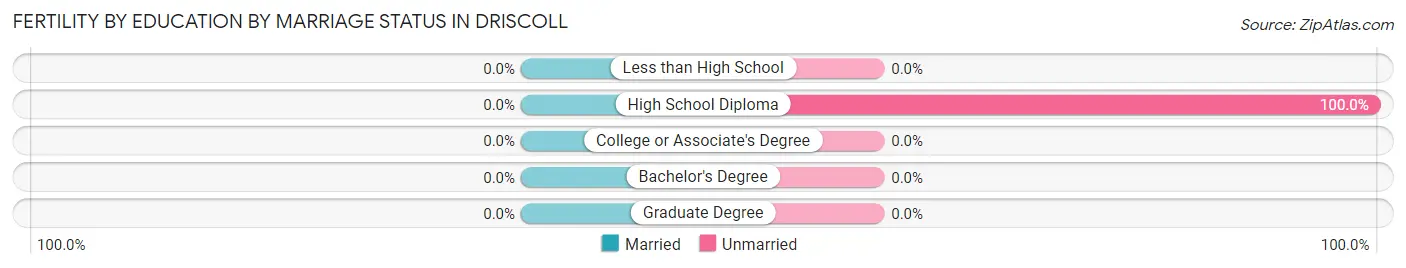
| Educational Attainment | Married | Unmarried |
| Less than High School | 0 (0.0%) | 0 (0.0%) |
| High School Diploma | 0 (0.0%) | 17 (100.0%) |
| College or Associate's Degree | 0 (0.0%) | 0 (0.0%) |
| Bachelor's Degree | 0 (0.0%) | 0 (0.0%) |
| Graduate Degree | 0 (0.0%) | 0 (0.0%) |
| Total | 0 (0.0%) | 17 (100.0%) |
Income in Driscoll
Income Overview in Driscoll
Per Capita Income in Driscoll is $10,081, while median incomes of families and households are $35,599 and $35,246 respectively.
| Characteristic | Number | Measure |
| Per Capita Income | 722 | $10,081 |
| Median Family Income | 181 | $35,599 |
| Mean Family Income | 181 | $36,886 |
| Median Household Income | 204 | $35,246 |
| Mean Household Income | 204 | $34,482 |
| Income Deficit | 181 | $0 |
| Wage / Income Gap (%) | 722 | 0.00% |
| Wage / Income Gap ($) | 722 | 100.00¢ per $1 |
| Gini / Inequality Index | 722 | 0.37 |
Earnings by Sex in Driscoll
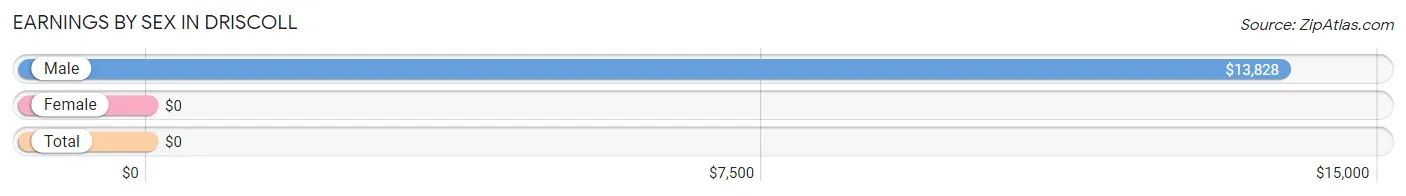
| Sex | Number | Average Earnings |
| Male | 93 (34.3%) | $13,828 |
| Female | 178 (65.7%) | $0 |
| Total | 271 (100.0%) | $0 |
Earnings by Sex by Income Bracket in Driscoll
The most common earnings brackets in Driscoll are $10,000 to $12,499 for men (28 | 30.1%) and $25,000 to $29,999 for women (87 | 48.9%).
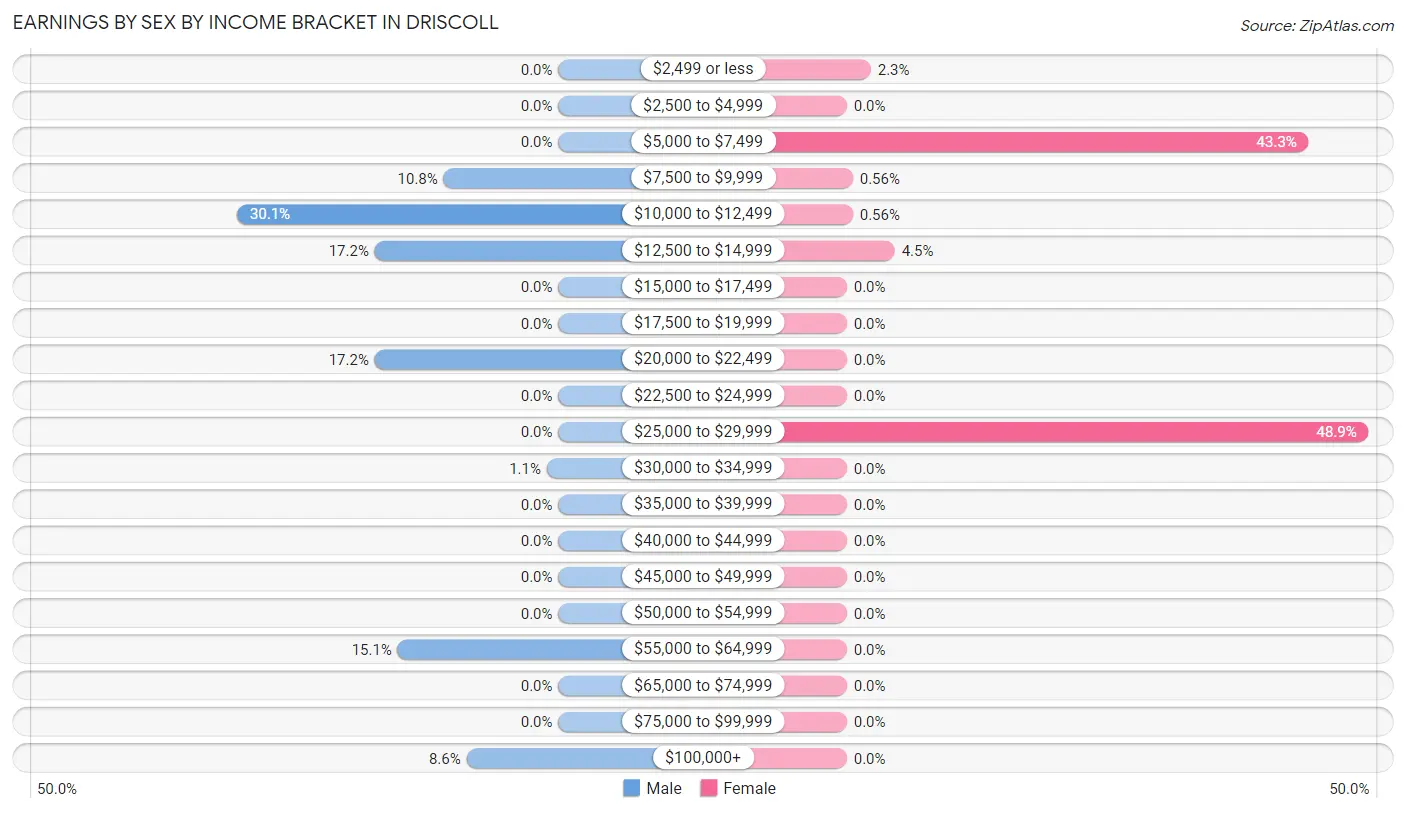
| Income | Male | Female |
| $2,499 or less | 0 (0.0%) | 4 (2.2%) |
| $2,500 to $4,999 | 0 (0.0%) | 0 (0.0%) |
| $5,000 to $7,499 | 0 (0.0%) | 77 (43.3%) |
| $7,500 to $9,999 | 10 (10.7%) | 1 (0.6%) |
| $10,000 to $12,499 | 28 (30.1%) | 1 (0.6%) |
| $12,500 to $14,999 | 16 (17.2%) | 8 (4.5%) |
| $15,000 to $17,499 | 0 (0.0%) | 0 (0.0%) |
| $17,500 to $19,999 | 0 (0.0%) | 0 (0.0%) |
| $20,000 to $22,499 | 16 (17.2%) | 0 (0.0%) |
| $22,500 to $24,999 | 0 (0.0%) | 0 (0.0%) |
| $25,000 to $29,999 | 0 (0.0%) | 87 (48.9%) |
| $30,000 to $34,999 | 1 (1.1%) | 0 (0.0%) |
| $35,000 to $39,999 | 0 (0.0%) | 0 (0.0%) |
| $40,000 to $44,999 | 0 (0.0%) | 0 (0.0%) |
| $45,000 to $49,999 | 0 (0.0%) | 0 (0.0%) |
| $50,000 to $54,999 | 0 (0.0%) | 0 (0.0%) |
| $55,000 to $64,999 | 14 (15.0%) | 0 (0.0%) |
| $65,000 to $74,999 | 0 (0.0%) | 0 (0.0%) |
| $75,000 to $99,999 | 0 (0.0%) | 0 (0.0%) |
| $100,000+ | 8 (8.6%) | 0 (0.0%) |
| Total | 93 (100.0%) | 178 (100.0%) |
Earnings by Sex by Educational Attainment in Driscoll
Average earnings in Driscoll are $14,453 for men and $28,175 for women, a difference of 48.7%. Men with an educational attainment of high school diploma enjoy the highest average annual earnings of $12,578, while those with high school diploma education earn the least with $12,578. Women with an educational attainment of high school diploma earn the most with the average annual earnings of $28,635, while those with high school diploma education have the smallest earnings of $28,635.
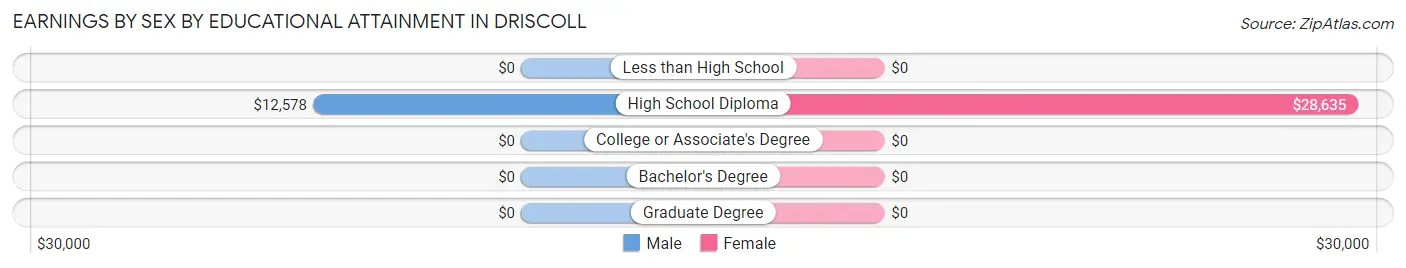
| Educational Attainment | Male Income | Female Income |
| Less than High School | - | - |
| High School Diploma | $12,578 | $28,635 |
| College or Associate's Degree | - | - |
| Bachelor's Degree | - | - |
| Graduate Degree | - | - |
| Total | $14,453 | $28,175 |
Family Income in Driscoll
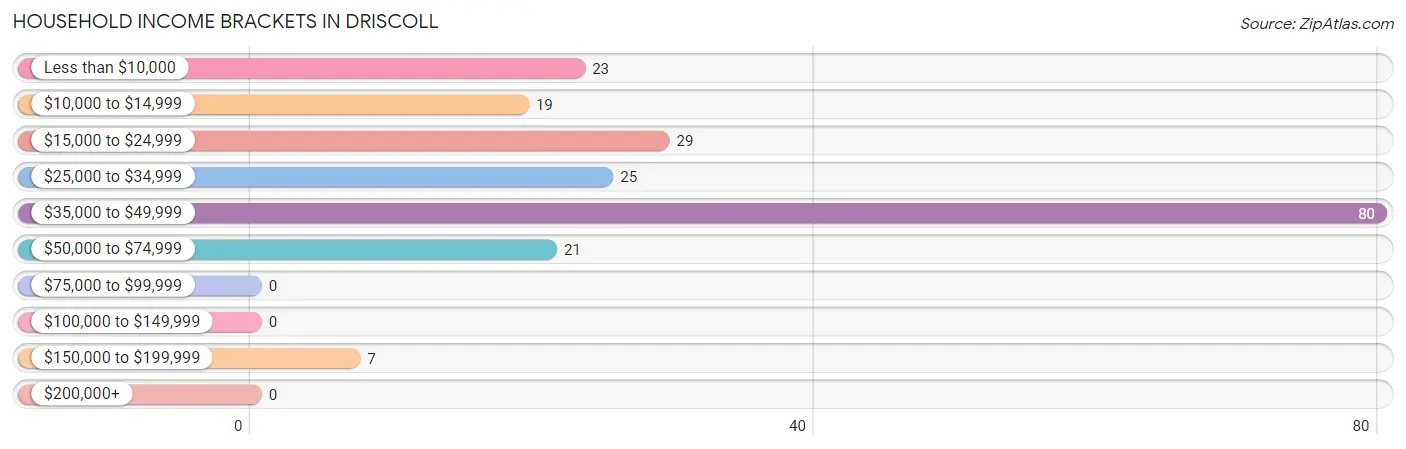
Family Income Brackets in Driscoll
According to the Driscoll family income data, there are 80 families falling into the $35,000 to $49,999 income range, which is the most common income bracket and makes up 44.2% of all families.
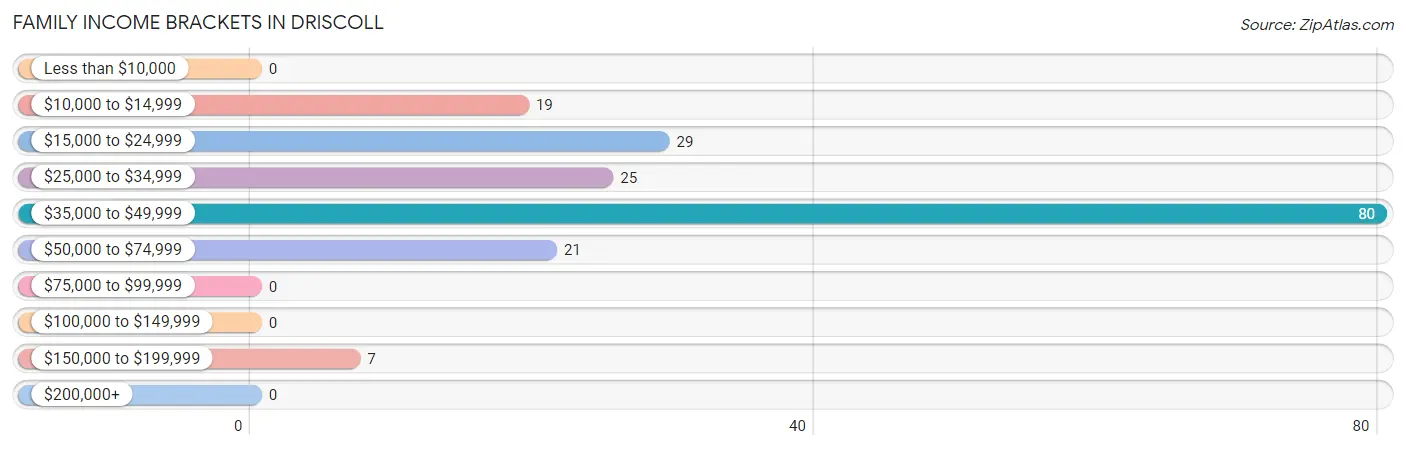
| Income Bracket | # Families | % Families |
| Less than $10,000 | 0 | 0.0% |
| $10,000 to $14,999 | 19 | 10.5% |
| $15,000 to $24,999 | 29 | 16.0% |
| $25,000 to $34,999 | 25 | 13.8% |
| $35,000 to $49,999 | 80 | 44.2% |
| $50,000 to $74,999 | 21 | 11.6% |
| $75,000 to $99,999 | 0 | 0.0% |
| $100,000 to $149,999 | 0 | 0.0% |
| $150,000 to $199,999 | 7 | 3.9% |
| $200,000+ | 0 | 0.0% |
Family Income by Famaliy Size in Driscoll
4-person families (95 | 52.5%) account for the highest median family income in Driscoll with $36,627 per family, while 2-person families (33 | 18.2%) have the highest median income of $13,047 per family member.
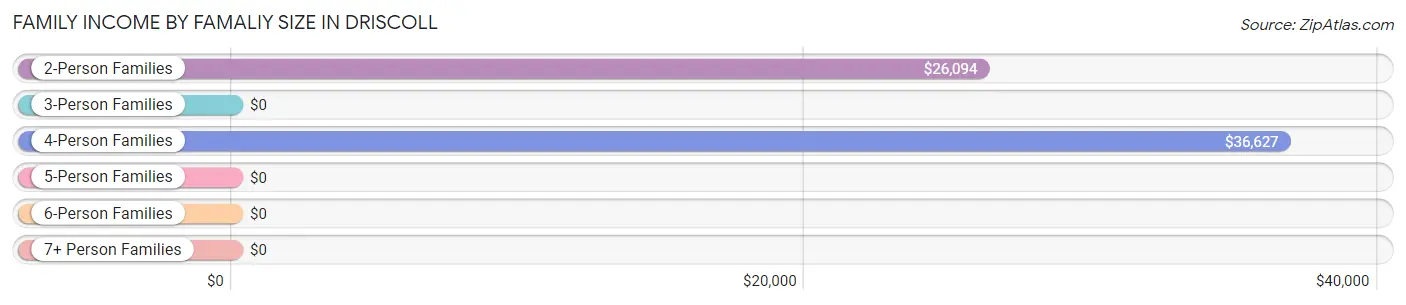
| Income Bracket | # Families | Median Income |
| 2-Person Families | 33 (18.2%) | $26,094 |
| 3-Person Families | 17 (9.4%) | $0 |
| 4-Person Families | 95 (52.5%) | $36,627 |
| 5-Person Families | 20 (11.1%) | $0 |
| 6-Person Families | 0 (0.0%) | $0 |
| 7+ Person Families | 16 (8.8%) | $0 |
| Total | 181 (100.0%) | $35,599 |
Family Income by Number of Earners in Driscoll
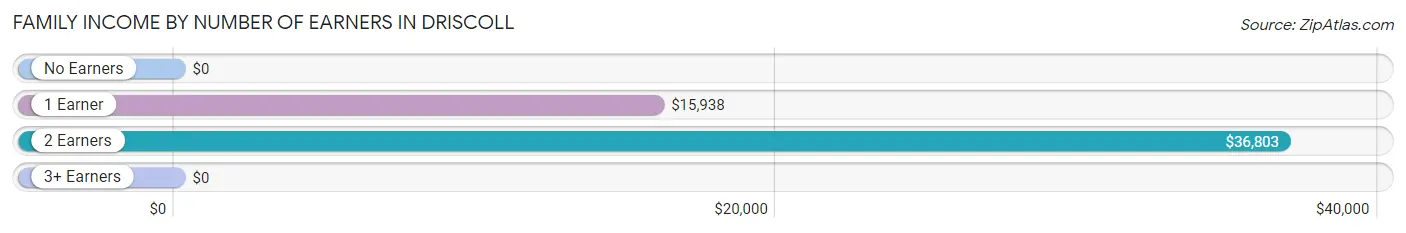
| Number of Earners | # Families | Median Income |
| No Earners | 30 (16.6%) | $0 |
| 1 Earner | 50 (27.6%) | $15,938 |
| 2 Earners | 88 (48.6%) | $36,803 |
| 3+ Earners | 13 (7.2%) | $0 |
| Total | 181 (100.0%) | $35,599 |
Household Income in Driscoll
Household Income Brackets in Driscoll
With 80 households falling in the category, the $35,000 to $49,999 income range is the most frequent in Driscoll, accounting for 39.2% of all households.
| Income Bracket | # Households | % Households |
| Less than $10,000 | 23 | 11.3% |
| $10,000 to $14,999 | 19 | 9.3% |
| $15,000 to $24,999 | 29 | 14.2% |
| $25,000 to $34,999 | 25 | 12.3% |
| $35,000 to $49,999 | 80 | 39.2% |
| $50,000 to $74,999 | 21 | 10.3% |
| $75,000 to $99,999 | 0 | 0.0% |
| $100,000 to $149,999 | 0 | 0.0% |
| $150,000 to $199,999 | 7 | 3.4% |
| $200,000+ | 0 | 0.0% |
Household Income by Householder Age in Driscoll
The median household income in Driscoll is $35,246, with the highest median household income of $36,045 found in the 25 to 44 years age bracket for the primary householder. A total of 121 households (59.3%) fall into this category.
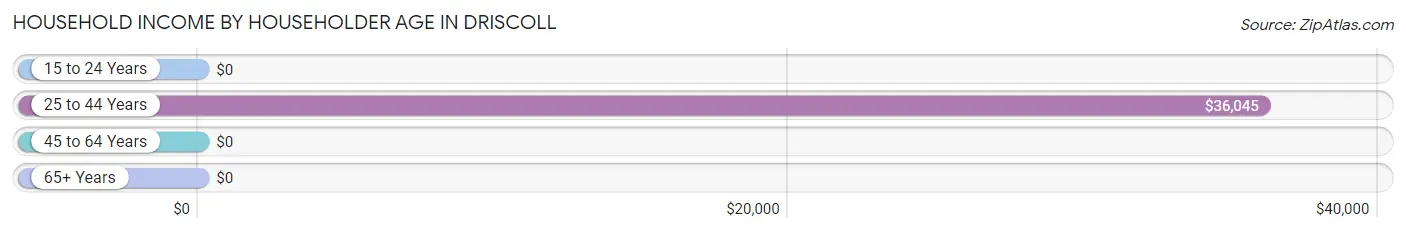
| Income Bracket | # Households | Median Income |
| 15 to 24 Years | 0 (0.0%) | $0 |
| 25 to 44 Years | 121 (59.3%) | $36,045 |
| 45 to 64 Years | 53 (26.0%) | $0 |
| 65+ Years | 30 (14.7%) | $0 |
| Total | 204 (100.0%) | $35,246 |
Poverty in Driscoll
Income Below Poverty by Sex and Age in Driscoll
With 35.5% poverty level for males and 47.7% for females among the residents of Driscoll, 6 to 11 year old males and under 5 year old females are the most vulnerable to poverty, with 23 males (59.0%) and 48 females (100.0%) in their respective age groups living below the poverty level.
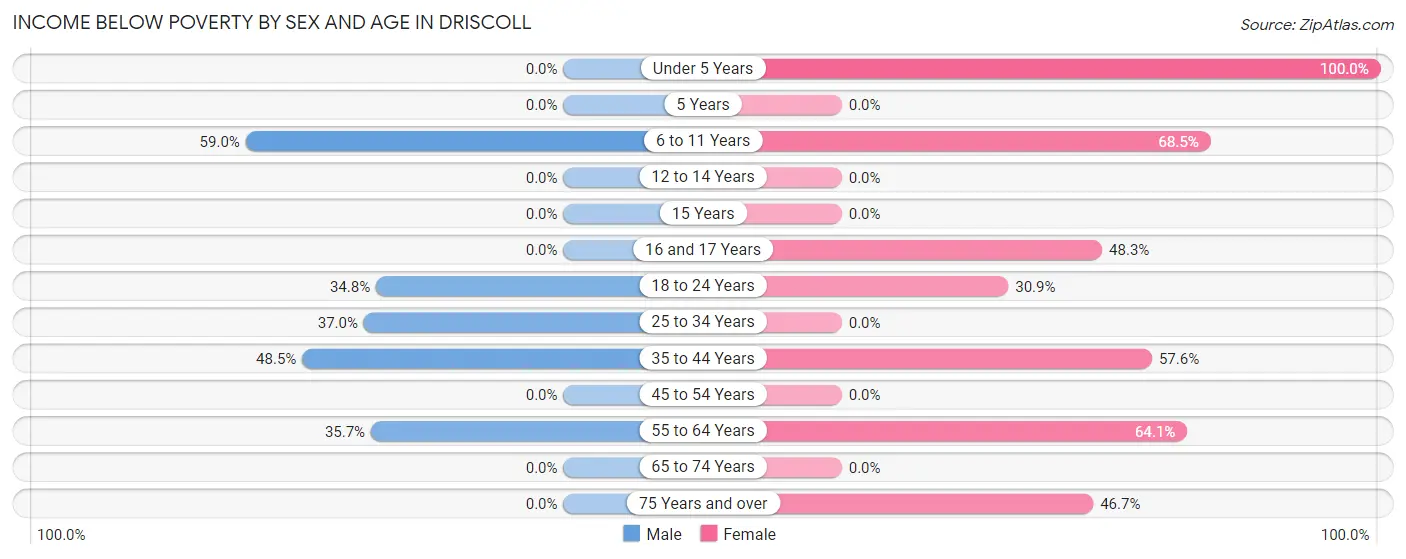
| Age Bracket | Male | Female |
| Under 5 Years | 0 (0.0%) | 48 (100.0%) |
| 5 Years | 0 (0.0%) | 0 (0.0%) |
| 6 to 11 Years | 23 (59.0%) | 89 (68.5%) |
| 12 to 14 Years | 0 (0.0%) | 0 (0.0%) |
| 15 Years | 0 (0.0%) | 0 (0.0%) |
| 16 and 17 Years | 0 (0.0%) | 29 (48.3%) |
| 18 to 24 Years | 8 (34.8%) | 17 (30.9%) |
| 25 to 34 Years | 20 (37.0%) | 0 (0.0%) |
| 35 to 44 Years | 16 (48.5%) | 19 (57.6%) |
| 45 to 54 Years | 0 (0.0%) | 0 (0.0%) |
| 55 to 64 Years | 10 (35.7%) | 25 (64.1%) |
| 65 to 74 Years | 0 (0.0%) | 0 (0.0%) |
| 75 Years and over | 0 (0.0%) | 14 (46.7%) |
| Total | 77 (35.5%) | 241 (47.7%) |
Income Above Poverty by Sex and Age in Driscoll
According to the poverty statistics in Driscoll, males aged 12 to 14 years and females aged 25 to 34 years are the age groups that are most secure financially, with 100.0% of males and 100.0% of females in these age groups living above the poverty line.
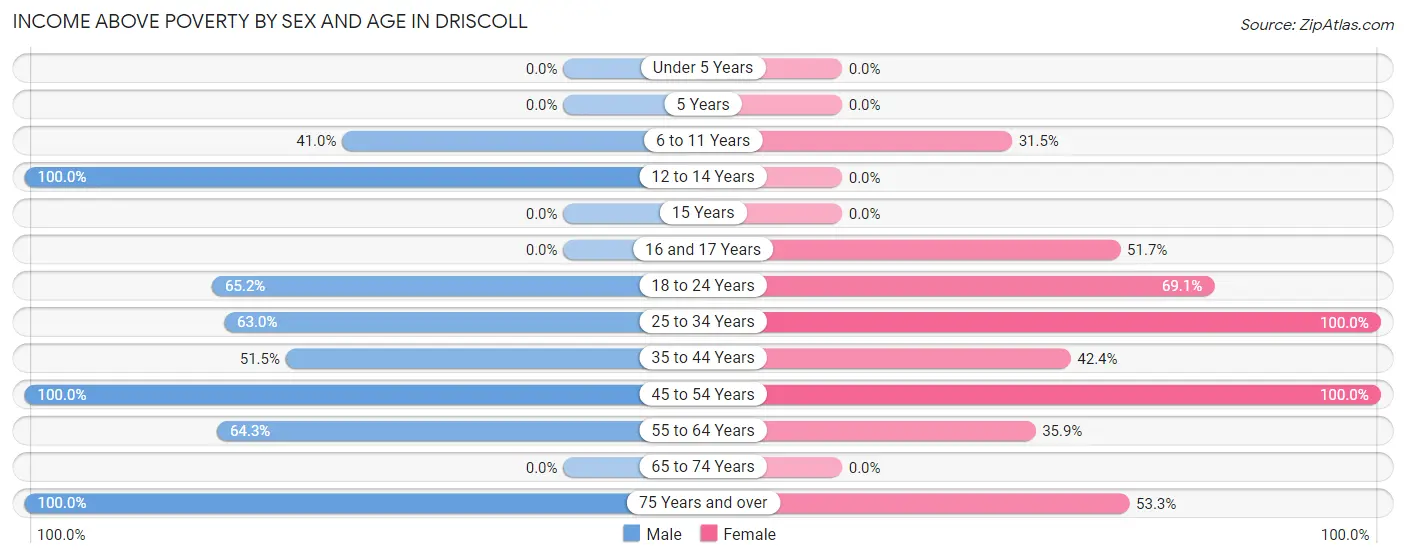
| Age Bracket | Male | Female |
| Under 5 Years | 0 (0.0%) | 0 (0.0%) |
| 5 Years | 0 (0.0%) | 0 (0.0%) |
| 6 to 11 Years | 16 (41.0%) | 41 (31.5%) |
| 12 to 14 Years | 15 (100.0%) | 0 (0.0%) |
| 15 Years | 0 (0.0%) | 0 (0.0%) |
| 16 and 17 Years | 0 (0.0%) | 31 (51.7%) |
| 18 to 24 Years | 15 (65.2%) | 38 (69.1%) |
| 25 to 34 Years | 34 (63.0%) | 87 (100.0%) |
| 35 to 44 Years | 17 (51.5%) | 14 (42.4%) |
| 45 to 54 Years | 8 (100.0%) | 23 (100.0%) |
| 55 to 64 Years | 18 (64.3%) | 14 (35.9%) |
| 65 to 74 Years | 0 (0.0%) | 0 (0.0%) |
| 75 Years and over | 17 (100.0%) | 16 (53.3%) |
| Total | 140 (64.5%) | 264 (52.3%) |
Income Below Poverty Among Married-Couple Families in Driscoll
The poverty statistics for married-couple families in Driscoll show that 31.4% or 16 of the total 51 families live below the poverty line. Families with 3 or 4 children have the highest poverty rate of 100.0%, comprising of 16 families. On the other hand, families with no children have the lowest poverty rate of 0.0%, which includes 0 families.
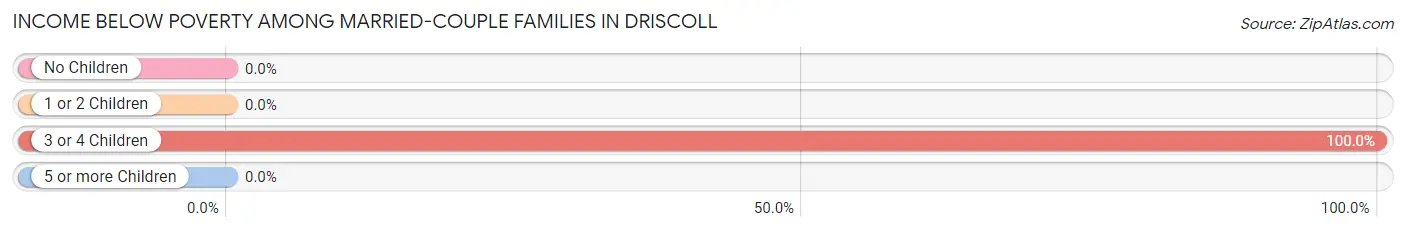
| Children | Above Poverty | Below Poverty |
| No Children | 35 (100.0%) | 0 (0.0%) |
| 1 or 2 Children | 0 (0.0%) | 0 (0.0%) |
| 3 or 4 Children | 0 (0.0%) | 16 (100.0%) |
| 5 or more Children | 0 (0.0%) | 0 (0.0%) |
| Total | 35 (68.6%) | 16 (31.4%) |
Income Below Poverty Among Single-Parent Households in Driscoll
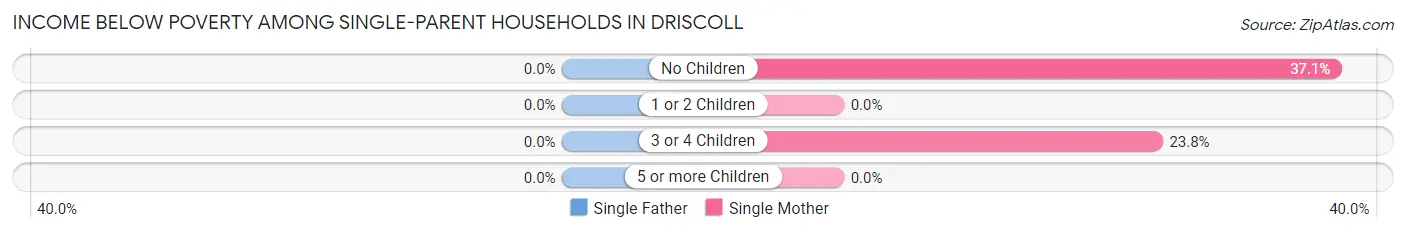
| Children | Single Father | Single Mother |
| No Children | 0 (0.0%) | 13 (37.1%) |
| 1 or 2 Children | 0 (0.0%) | 0 (0.0%) |
| 3 or 4 Children | 0 (0.0%) | 19 (23.7%) |
| 5 or more Children | 0 (0.0%) | 0 (0.0%) |
| Total | 0 (0.0%) | 32 (24.6%) |
Income Below Poverty Among Married-Couple vs Single-Parent Households in Driscoll
The poverty data for Driscoll shows that 16 of the married-couple family households (31.4%) and 32 of the single-parent households (24.6%) are living below the poverty level. Within the married-couple family households, those with 3 or 4 children have the highest poverty rate, with 16 households (100.0%) falling below the poverty line. Among the single-parent households, those with no children have the highest poverty rate, with 13 household (37.1%) living below poverty.
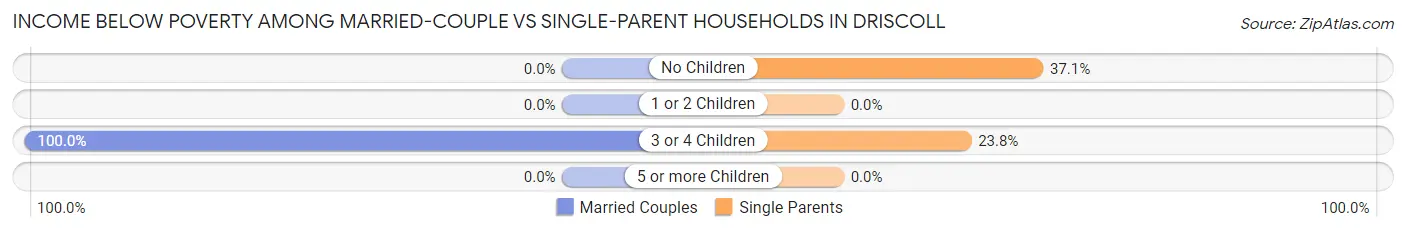
| Children | Married-Couple Families | Single-Parent Households |
| No Children | 0 (0.0%) | 13 (37.1%) |
| 1 or 2 Children | 0 (0.0%) | 0 (0.0%) |
| 3 or 4 Children | 16 (100.0%) | 19 (23.7%) |
| 5 or more Children | 0 (0.0%) | 0 (0.0%) |
| Total | 16 (31.4%) | 32 (24.6%) |
Employment Characteristics in Driscoll
Employment by Class of Employer in Driscoll
Among the 200 employed individuals in Driscoll, private company employees (153 | 76.5%), self-employed (not incorporated) (43 | 21.5%), and local government employees (4 | 2.0%) make up the most common classes of employment.
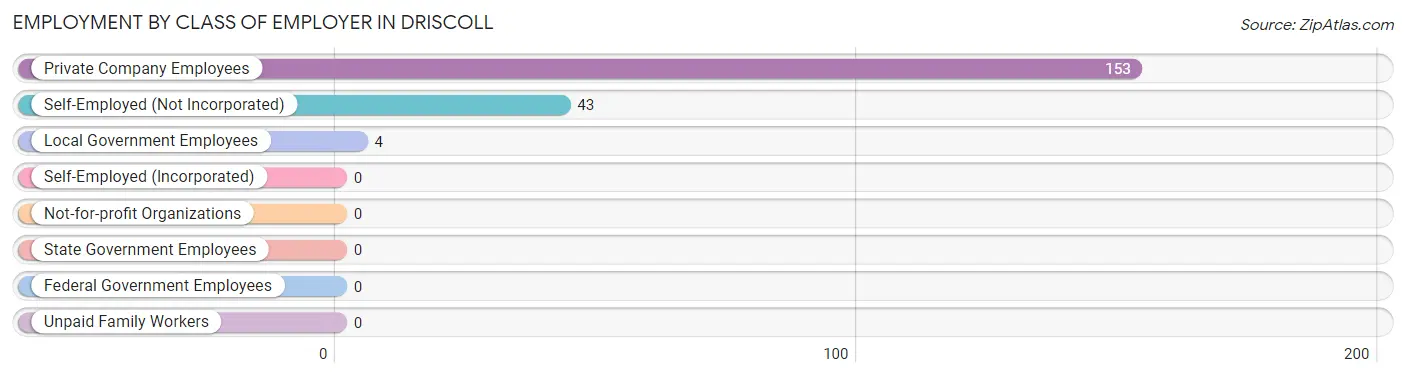
| Employer Class | # Employees | % Employees |
| Private Company Employees | 153 | 76.5% |
| Self-Employed (Incorporated) | 0 | 0.0% |
| Self-Employed (Not Incorporated) | 43 | 21.5% |
| Not-for-profit Organizations | 0 | 0.0% |
| Local Government Employees | 4 | 2.0% |
| State Government Employees | 0 | 0.0% |
| Federal Government Employees | 0 | 0.0% |
| Unpaid Family Workers | 0 | 0.0% |
| Total | 200 | 100.0% |
Employment Status by Age in Driscoll
According to the labor force statistics for Driscoll, out of the total population over 16 years of age (490), 55.3% or 271 individuals are in the labor force, with 3.7% or 10 of them unemployed. The age group with the highest labor force participation rate is 30 to 34 years, with 100.0% or 61 individuals in the labor force. Within the labor force, the 60 to 64 years age range has the highest percentage of unemployed individuals, with 100.0% or 10 of them being unemployed.
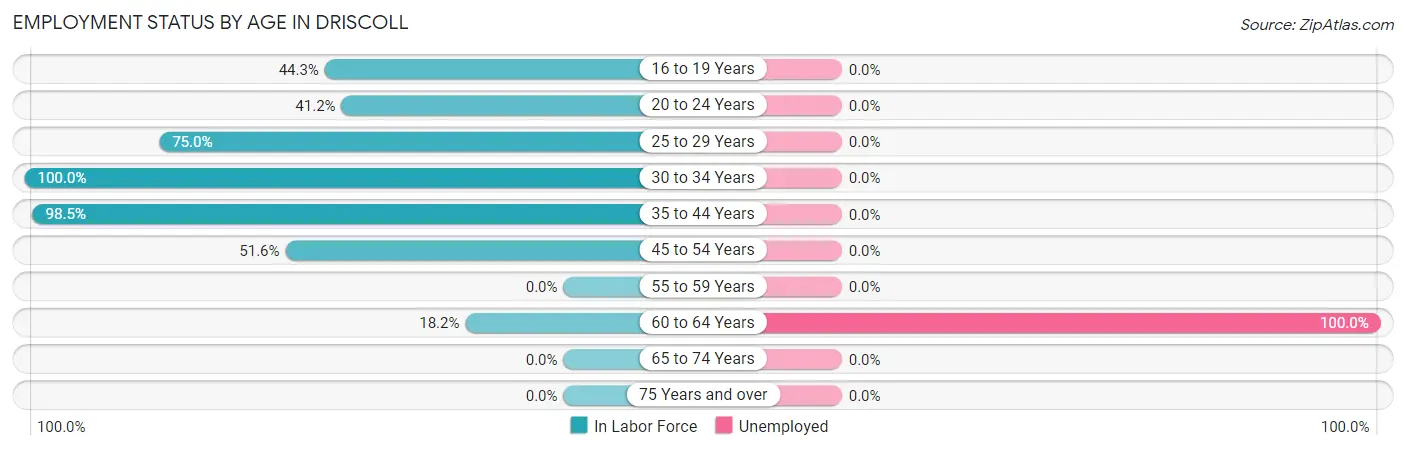
| Age Bracket | In Labor Force | Unemployed |
| 16 to 19 Years | 31 (44.3%) | 0 (0.0%) |
| 20 to 24 Years | 28 (41.2%) | 0 (0.0%) |
| 25 to 29 Years | 60 (75.0%) | 0 (0.0%) |
| 30 to 34 Years | 61 (100.0%) | 0 (0.0%) |
| 35 to 44 Years | 65 (98.5%) | 0 (0.0%) |
| 45 to 54 Years | 16 (51.6%) | 0 (0.0%) |
| 55 to 59 Years | 0 (0.0%) | 0 (0.0%) |
| 60 to 64 Years | 10 (18.2%) | 10 (100.0%) |
| 65 to 74 Years | 0 (0.0%) | 0 (0.0%) |
| 75 Years and over | 0 (0.0%) | 0 (0.0%) |
| Total | 271 (55.3%) | 10 (3.7%) |
Employment Status by Educational Attainment in Driscoll
According to labor force statistics for Driscoll, 69.5% of individuals (212) out of the total population between 25 and 64 years of age (305) are in the labor force, with 4.7% or 10 of them being unemployed. The group with the highest labor force participation rate are those with the educational attainment of high school diploma, with 78.0% or 156 individuals in the labor force. Within the labor force, individuals with high school diploma education have the highest percentage of unemployment, with 6.4% or 10 of them being unemployed.
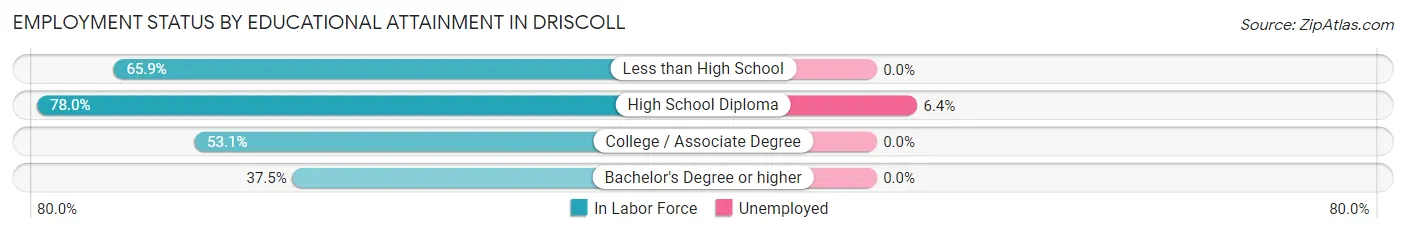
| Educational Attainment | In Labor Force | Unemployed |
| Less than High School | 27 (65.9%) | 0 (0.0%) |
| High School Diploma | 156 (78.0%) | 13 (6.4%) |
| College / Associate Degree | 17 (53.1%) | 0 (0.0%) |
| Bachelor's Degree or higher | 12 (37.5%) | 0 (0.0%) |
| Total | 212 (69.5%) | 14 (4.7%) |
Employment Occupations by Sex in Driscoll
Management, Business, Science and Arts Occupations
The most common Management, Business, Science and Arts occupations in Driscoll are Community & Social Service (4 | 1.5%), and Education Instruction & Library (4 | 1.5%).
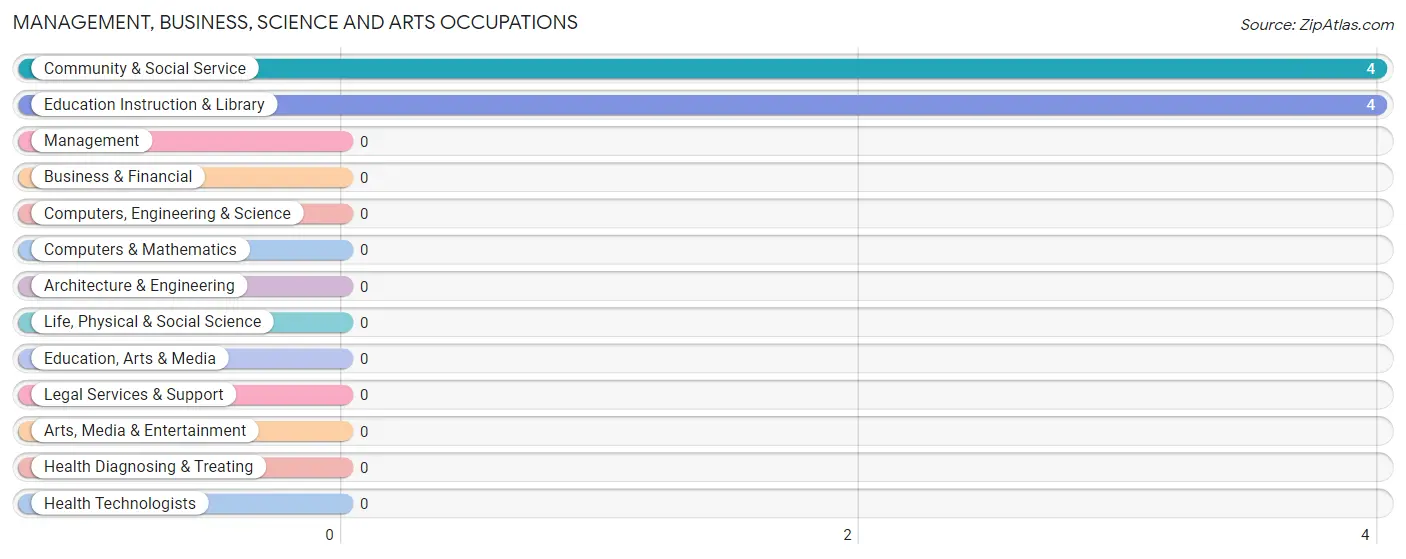
Management, Business, Science and Arts Occupations by Sex
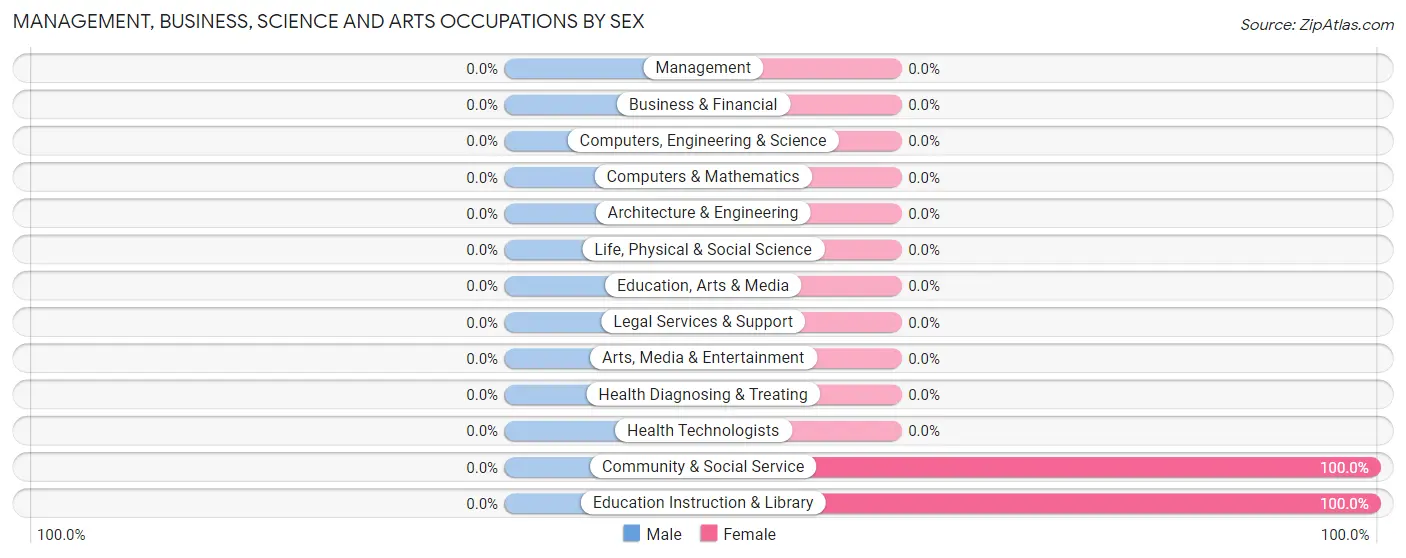
| Occupation | Male | Female |
| Management | 0 (0.0%) | 0 (0.0%) |
| Business & Financial | 0 (0.0%) | 0 (0.0%) |
| Computers, Engineering & Science | 0 (0.0%) | 0 (0.0%) |
| Computers & Mathematics | 0 (0.0%) | 0 (0.0%) |
| Architecture & Engineering | 0 (0.0%) | 0 (0.0%) |
| Life, Physical & Social Science | 0 (0.0%) | 0 (0.0%) |
| Community & Social Service | 0 (0.0%) | 4 (100.0%) |
| Education, Arts & Media | 0 (0.0%) | 0 (0.0%) |
| Legal Services & Support | 0 (0.0%) | 0 (0.0%) |
| Education Instruction & Library | 0 (0.0%) | 4 (100.0%) |
| Arts, Media & Entertainment | 0 (0.0%) | 0 (0.0%) |
| Health Diagnosing & Treating | 0 (0.0%) | 0 (0.0%) |
| Health Technologists | 0 (0.0%) | 0 (0.0%) |
| Total (Category) | 0 (0.0%) | 4 (100.0%) |
| Total (Overall) | 83 (31.8%) | 178 (68.2%) |
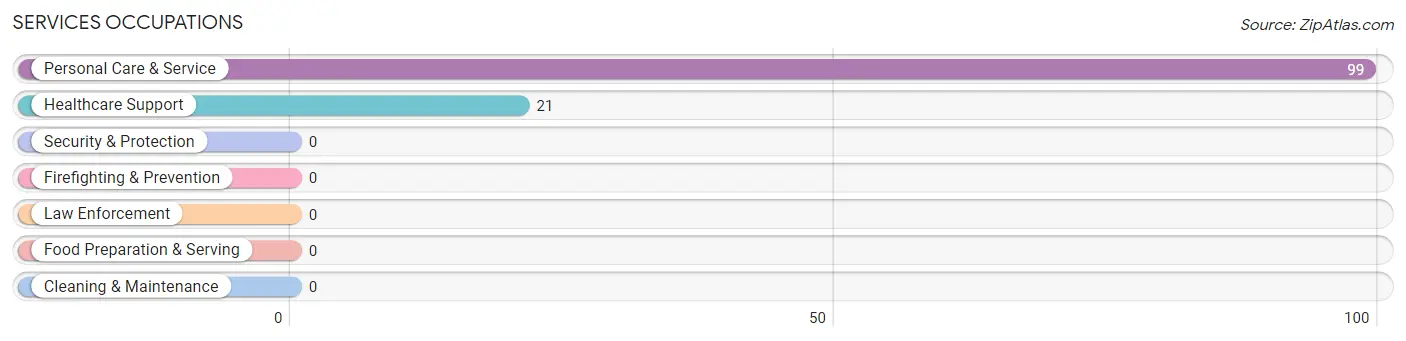
Services Occupations
The most common Services occupations in Driscoll are Personal Care & Service (99 | 37.9%), and Healthcare Support (21 | 8.1%).
Services Occupations by Sex
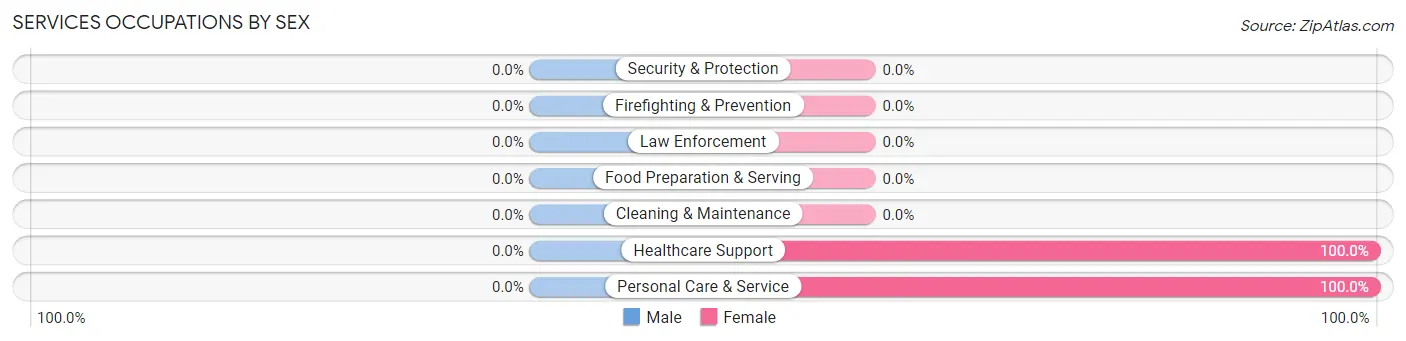
| Occupation | Male | Female |
| Healthcare Support | 0 (0.0%) | 21 (100.0%) |
| Security & Protection | 0 (0.0%) | 0 (0.0%) |
| Firefighting & Prevention | 0 (0.0%) | 0 (0.0%) |
| Law Enforcement | 0 (0.0%) | 0 (0.0%) |
| Food Preparation & Serving | 0 (0.0%) | 0 (0.0%) |
| Cleaning & Maintenance | 0 (0.0%) | 0 (0.0%) |
| Personal Care & Service | 0 (0.0%) | 99 (100.0%) |
| Total (Category) | 0 (0.0%) | 120 (100.0%) |
| Total (Overall) | 83 (31.8%) | 178 (68.2%) |
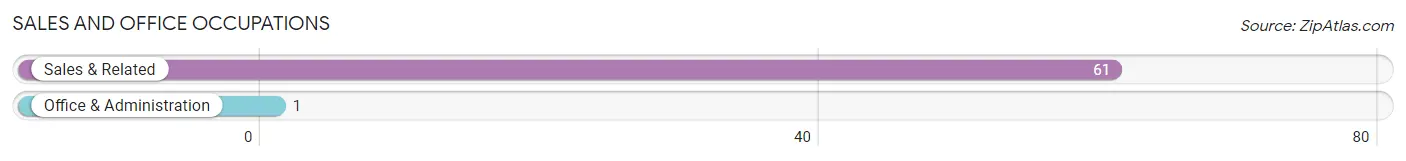
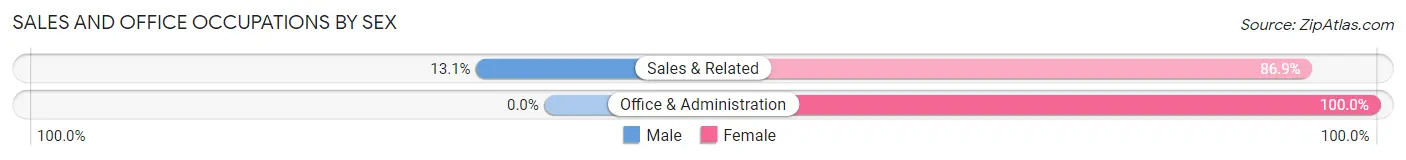
Sales and Office Occupations
The most common Sales and Office occupations in Driscoll are Sales & Related (61 | 23.4%), and Office & Administration (1 | 0.4%).
Sales and Office Occupations by Sex
| Occupation | Male | Female |
| Sales & Related | 8 (13.1%) | 53 (86.9%) |
| Office & Administration | 0 (0.0%) | 1 (100.0%) |
| Total (Category) | 8 (12.9%) | 54 (87.1%) |
| Total (Overall) | 83 (31.8%) | 178 (68.2%) |
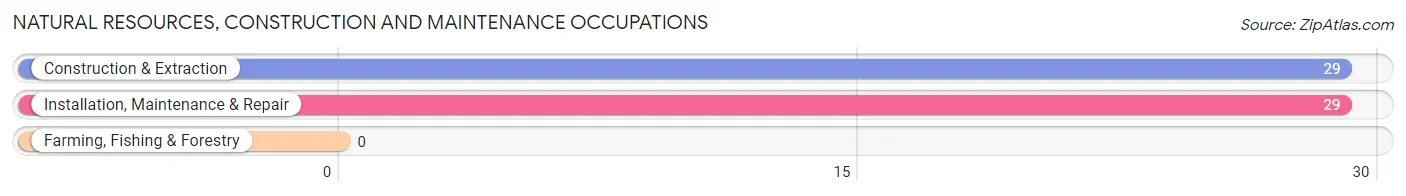
Natural Resources, Construction and Maintenance Occupations
The most common Natural Resources, Construction and Maintenance occupations in Driscoll are Construction & Extraction (29 | 11.1%), and Installation, Maintenance & Repair (29 | 11.1%).
Natural Resources, Construction and Maintenance Occupations by Sex
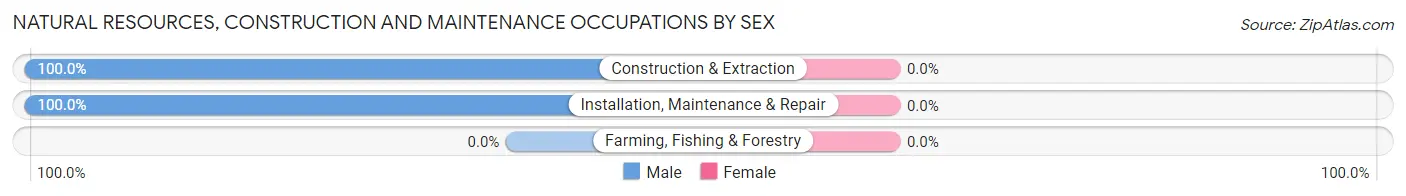
| Occupation | Male | Female |
| Farming, Fishing & Forestry | 0 (0.0%) | 0 (0.0%) |
| Construction & Extraction | 29 (100.0%) | 0 (0.0%) |
| Installation, Maintenance & Repair | 29 (100.0%) | 0 (0.0%) |
| Total (Category) | 58 (100.0%) | 0 (0.0%) |
| Total (Overall) | 83 (31.8%) | 178 (68.2%) |
Production, Transportation and Moving Occupations
The most common Production, Transportation and Moving occupations in Driscoll are , and Transportation (17 | 6.5%).
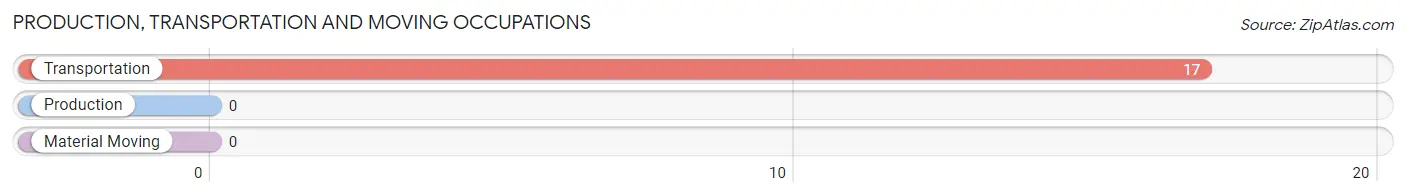
Production, Transportation and Moving Occupations by Sex
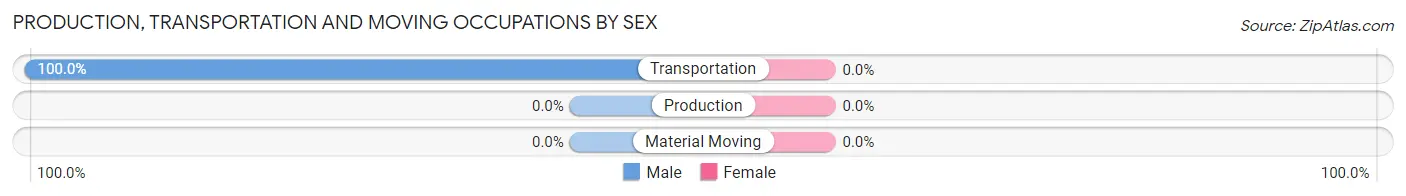
| Occupation | Male | Female |
| Production | 0 (0.0%) | 0 (0.0%) |
| Transportation | 17 (100.0%) | 0 (0.0%) |
| Material Moving | 0 (0.0%) | 0 (0.0%) |
| Total (Category) | 17 (100.0%) | 0 (0.0%) |
| Total (Overall) | 83 (31.8%) | 178 (68.2%) |
Employment Industries by Sex in Driscoll
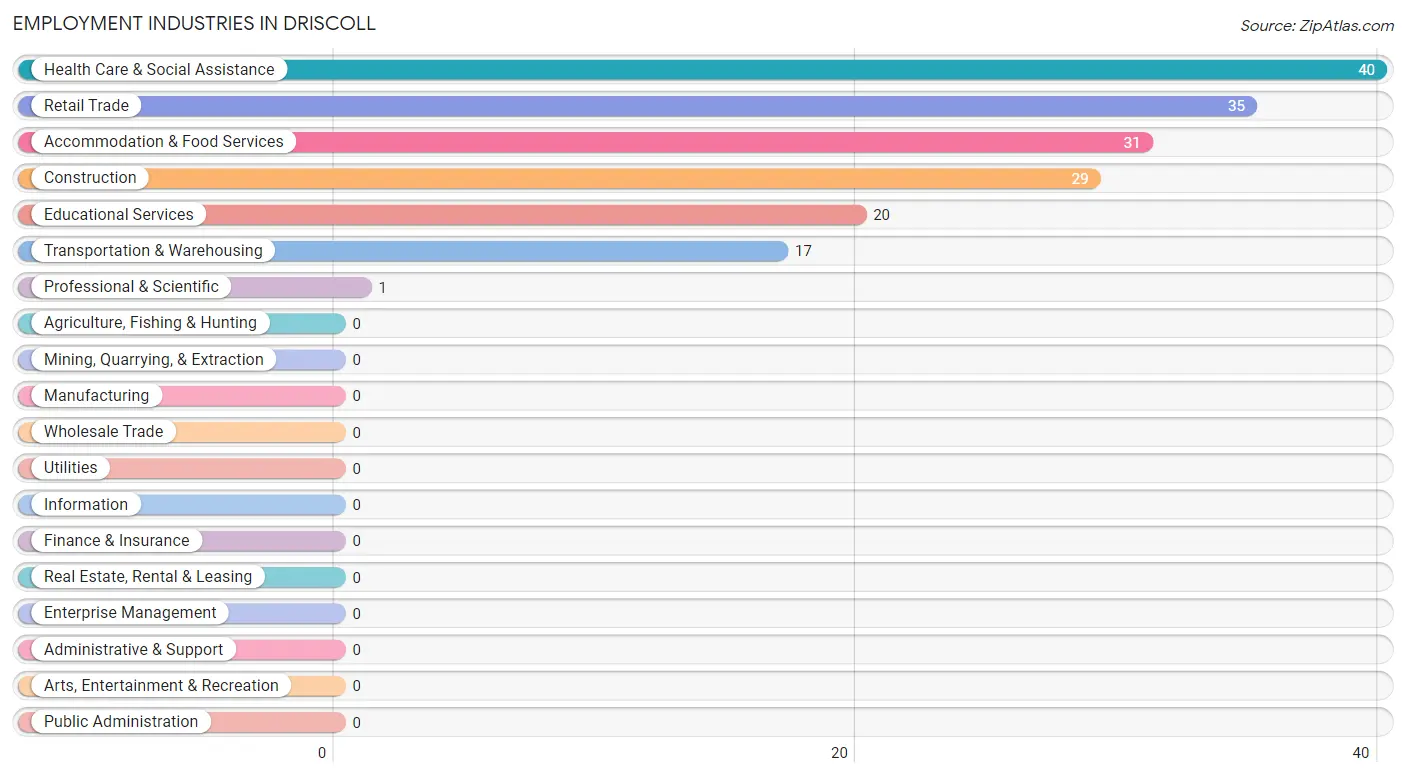
Employment Industries in Driscoll
The major employment industries in Driscoll include Health Care & Social Assistance (40 | 15.3%), Retail Trade (35 | 13.4%), Accommodation & Food Services (31 | 11.9%), Construction (29 | 11.1%), and Educational Services (20 | 7.7%).
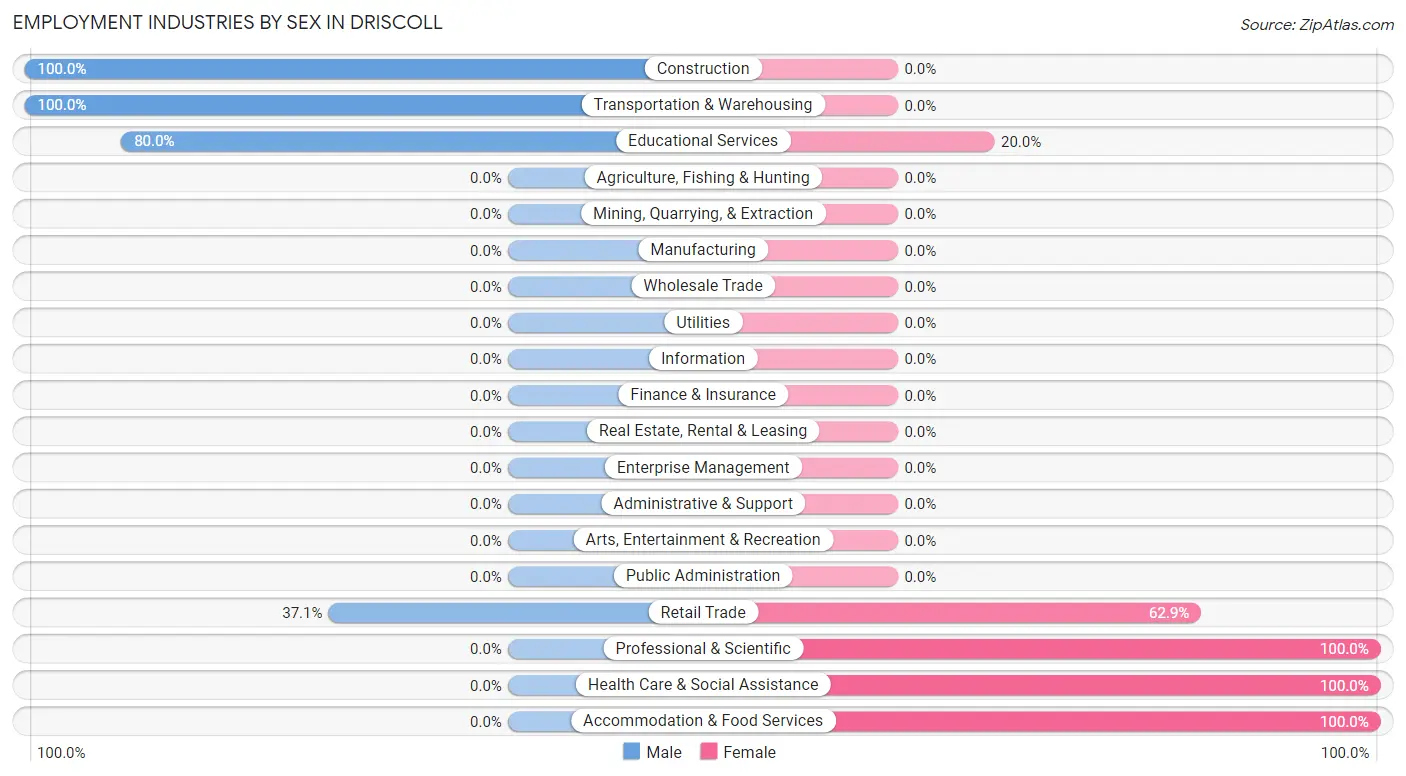
Employment Industries by Sex in Driscoll
The Driscoll industries that see more men than women are Construction (100.0%), Transportation & Warehousing (100.0%), and Educational Services (80.0%), whereas the industries that tend to have a higher number of women are Professional & Scientific (100.0%), Health Care & Social Assistance (100.0%), and Accommodation & Food Services (100.0%).
| Industry | Male | Female |
| Agriculture, Fishing & Hunting | 0 (0.0%) | 0 (0.0%) |
| Mining, Quarrying, & Extraction | 0 (0.0%) | 0 (0.0%) |
| Construction | 29 (100.0%) | 0 (0.0%) |
| Manufacturing | 0 (0.0%) | 0 (0.0%) |
| Wholesale Trade | 0 (0.0%) | 0 (0.0%) |
| Retail Trade | 13 (37.1%) | 22 (62.9%) |
| Transportation & Warehousing | 17 (100.0%) | 0 (0.0%) |
| Utilities | 0 (0.0%) | 0 (0.0%) |
| Information | 0 (0.0%) | 0 (0.0%) |
| Finance & Insurance | 0 (0.0%) | 0 (0.0%) |
| Real Estate, Rental & Leasing | 0 (0.0%) | 0 (0.0%) |
| Professional & Scientific | 0 (0.0%) | 1 (100.0%) |
| Enterprise Management | 0 (0.0%) | 0 (0.0%) |
| Administrative & Support | 0 (0.0%) | 0 (0.0%) |
| Educational Services | 16 (80.0%) | 4 (20.0%) |
| Health Care & Social Assistance | 0 (0.0%) | 40 (100.0%) |
| Arts, Entertainment & Recreation | 0 (0.0%) | 0 (0.0%) |
| Accommodation & Food Services | 0 (0.0%) | 31 (100.0%) |
| Public Administration | 0 (0.0%) | 0 (0.0%) |
| Total | 83 (31.8%) | 178 (68.2%) |
Education in Driscoll
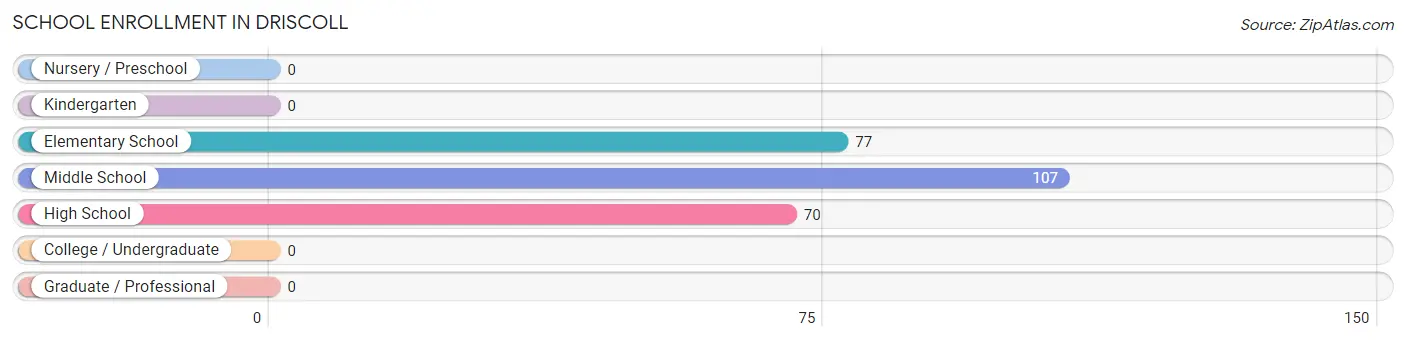
School Enrollment in Driscoll
The most common levels of schooling among the 254 students in Driscoll are middle school (107 | 42.1%), elementary school (77 | 30.3%), and high school (70 | 27.6%).
| School Level | # Students | % Students |
| Nursery / Preschool | 0 | 0.0% |
| Kindergarten | 0 | 0.0% |
| Elementary School | 77 | 30.3% |
| Middle School | 107 | 42.1% |
| High School | 70 | 27.6% |
| College / Undergraduate | 0 | 0.0% |
| Graduate / Professional | 0 | 0.0% |
| Total | 254 | 100.0% |
School Enrollment by Age by Funding Source in Driscoll
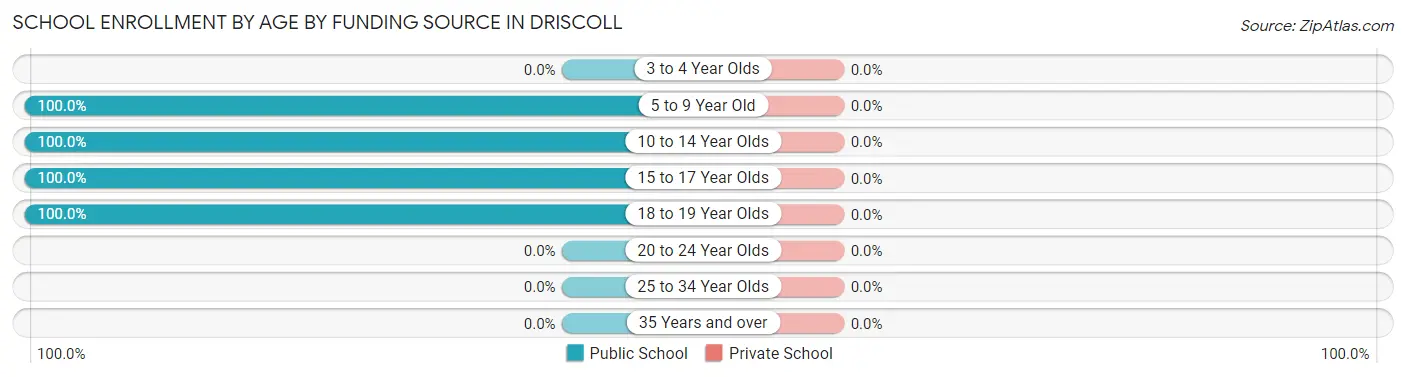
| Age Bracket | Public School | Private School |
| 3 to 4 Year Olds | 0 (0.0%) | 0 (0.0%) |
| 5 to 9 Year Old | 77 (100.0%) | 0 (0.0%) |
| 10 to 14 Year Olds | 107 (100.0%) | 0 (0.0%) |
| 15 to 17 Year Olds | 60 (100.0%) | 0 (0.0%) |
| 18 to 19 Year Olds | 10 (100.0%) | 0 (0.0%) |
| 20 to 24 Year Olds | 0 (0.0%) | 0 (0.0%) |
| 25 to 34 Year Olds | 0 (0.0%) | 0 (0.0%) |
| 35 Years and over | 0 (0.0%) | 0 (0.0%) |
| Total | 254 (100.0%) | 0 (0.0%) |
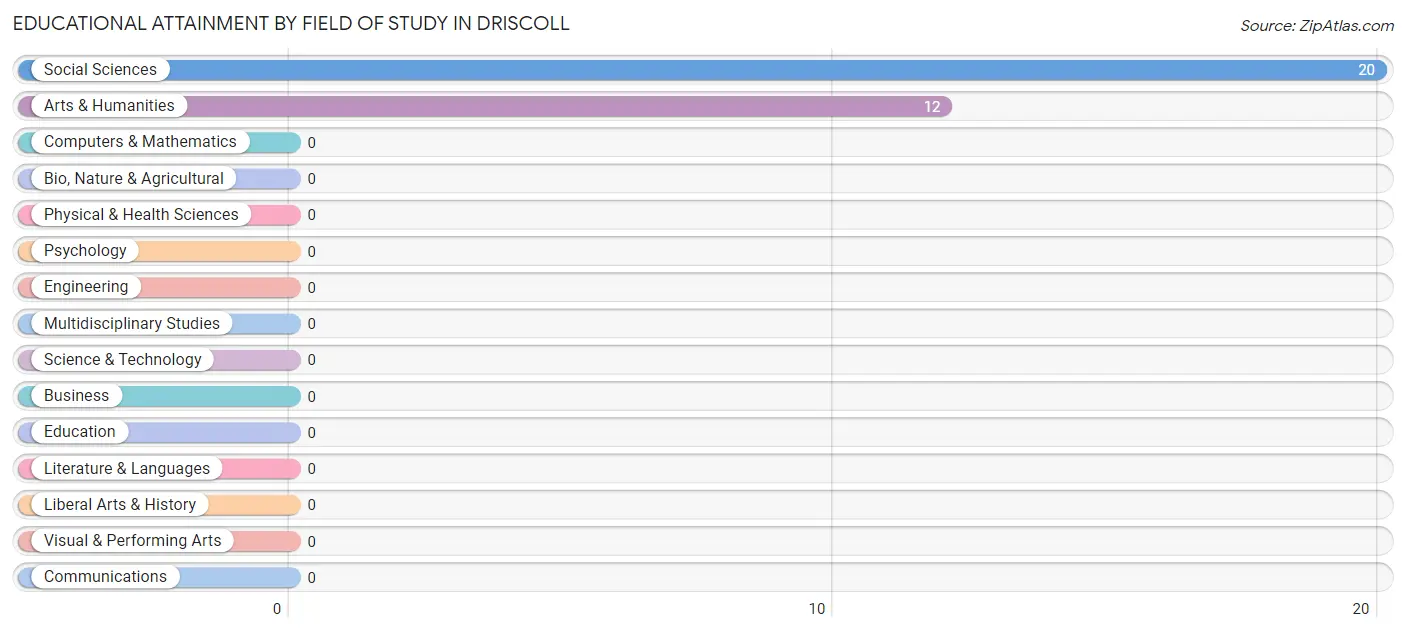
Educational Attainment by Field of Study in Driscoll
Social sciences (20 | 62.5%), and arts & humanities (12 | 37.5%) are the most common fields of study among 32 individuals in Driscoll who have obtained a bachelor's degree or higher.
| Field of Study | # Graduates | % Graduates |
| Computers & Mathematics | 0 | 0.0% |
| Bio, Nature & Agricultural | 0 | 0.0% |
| Physical & Health Sciences | 0 | 0.0% |
| Psychology | 0 | 0.0% |
| Social Sciences | 20 | 62.5% |
| Engineering | 0 | 0.0% |
| Multidisciplinary Studies | 0 | 0.0% |
| Science & Technology | 0 | 0.0% |
| Business | 0 | 0.0% |
| Education | 0 | 0.0% |
| Literature & Languages | 0 | 0.0% |
| Liberal Arts & History | 0 | 0.0% |
| Visual & Performing Arts | 0 | 0.0% |
| Communications | 0 | 0.0% |
| Arts & Humanities | 12 | 37.5% |
| Total | 32 | 100.0% |
Transportation & Commute in Driscoll
Vehicle Availability by Sex in Driscoll
The most prevalent vehicle ownership categories in Driscoll are males with 2 vehicles (29, accounting for 34.9%) and females with 2 vehicles (31, making up 24.8%).
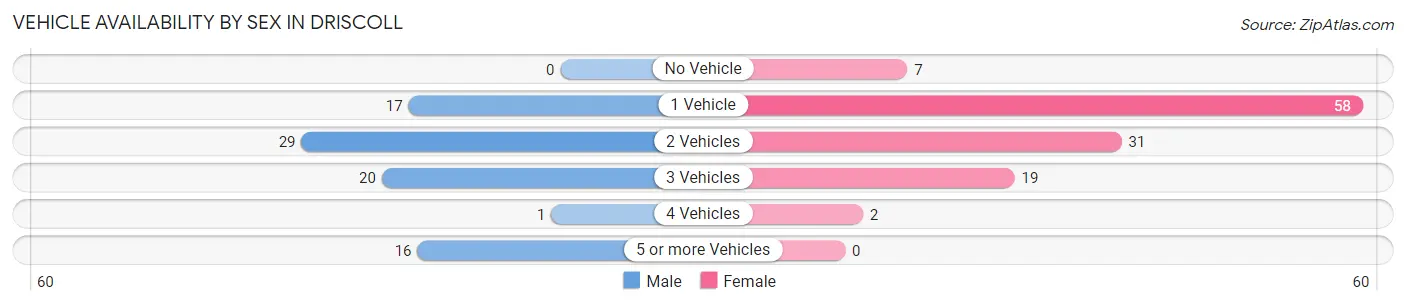
| Vehicles Available | Male | Female |
| No Vehicle | 0 (0.0%) | 7 (6.0%) |
| 1 Vehicle | 17 (20.5%) | 58 (49.6%) |
| 2 Vehicles | 29 (34.9%) | 31 (26.5%) |
| 3 Vehicles | 20 (24.1%) | 19 (16.2%) |
| 4 Vehicles | 1 (1.2%) | 2 (1.7%) |
| 5 or more Vehicles | 16 (19.3%) | 0 (0.0%) |
| Total | 83 (100.0%) | 117 (100.0%) |
Commute Time in Driscoll
The most frequently occuring commute durations in Driscoll are 30 to 34 minutes (48 commuters, 27.8%), 5 to 9 minutes (39 commuters, 22.5%), and 20 to 24 minutes (23 commuters, 13.3%).
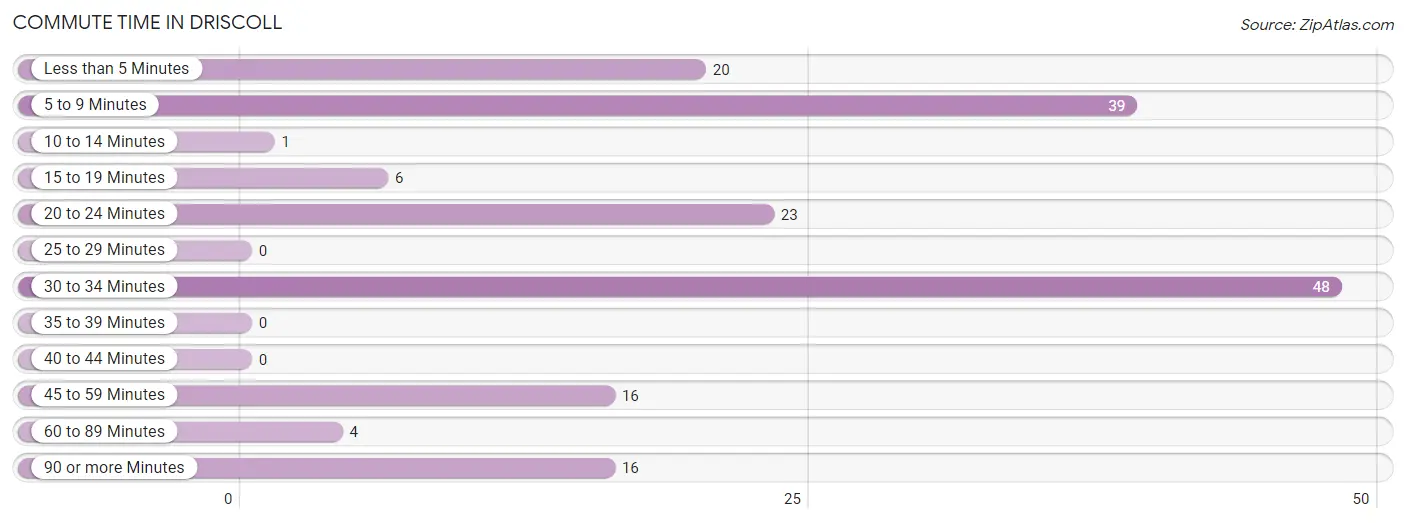
| Commute Time | # Commuters | % Commuters |
| Less than 5 Minutes | 20 | 11.6% |
| 5 to 9 Minutes | 39 | 22.5% |
| 10 to 14 Minutes | 1 | 0.6% |
| 15 to 19 Minutes | 6 | 3.5% |
| 20 to 24 Minutes | 23 | 13.3% |
| 25 to 29 Minutes | 0 | 0.0% |
| 30 to 34 Minutes | 48 | 27.8% |
| 35 to 39 Minutes | 0 | 0.0% |
| 40 to 44 Minutes | 0 | 0.0% |
| 45 to 59 Minutes | 16 | 9.2% |
| 60 to 89 Minutes | 4 | 2.3% |
| 90 or more Minutes | 16 | 9.2% |
Commute Time by Sex in Driscoll
The most common commute times in Driscoll are 30 to 34 minutes (29 commuters, 34.9%) for males and 5 to 9 minutes (31 commuters, 34.4%) for females.
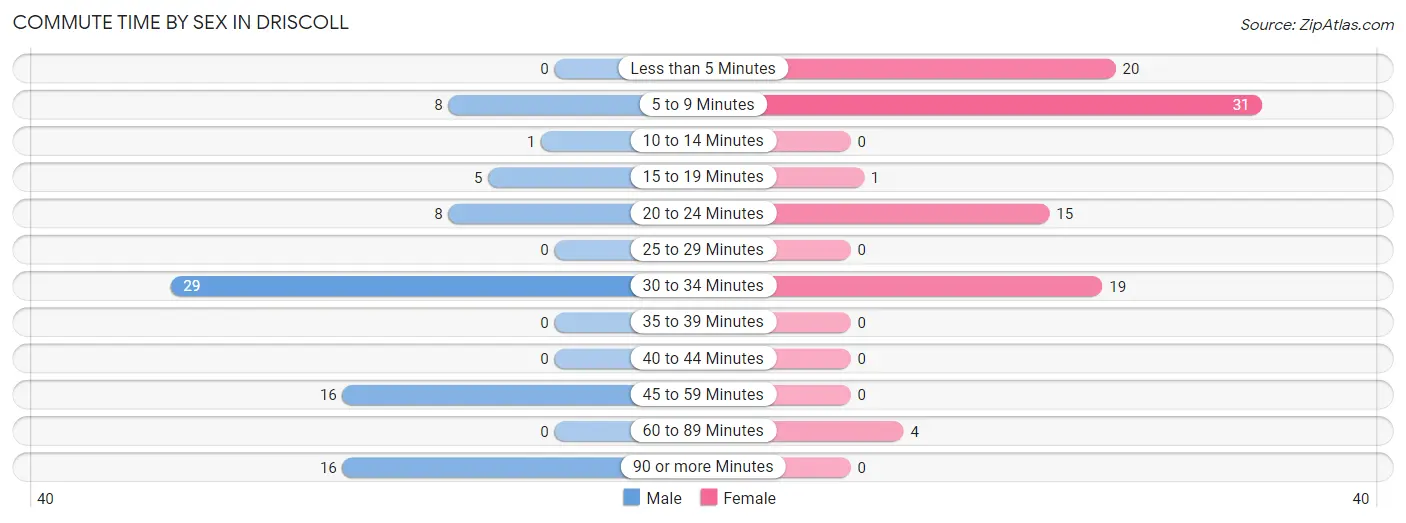
| Commute Time | Male | Female |
| Less than 5 Minutes | 0 (0.0%) | 20 (22.2%) |
| 5 to 9 Minutes | 8 (9.6%) | 31 (34.4%) |
| 10 to 14 Minutes | 1 (1.2%) | 0 (0.0%) |
| 15 to 19 Minutes | 5 (6.0%) | 1 (1.1%) |
| 20 to 24 Minutes | 8 (9.6%) | 15 (16.7%) |
| 25 to 29 Minutes | 0 (0.0%) | 0 (0.0%) |
| 30 to 34 Minutes | 29 (34.9%) | 19 (21.1%) |
| 35 to 39 Minutes | 0 (0.0%) | 0 (0.0%) |
| 40 to 44 Minutes | 0 (0.0%) | 0 (0.0%) |
| 45 to 59 Minutes | 16 (19.3%) | 0 (0.0%) |
| 60 to 89 Minutes | 0 (0.0%) | 4 (4.4%) |
| 90 or more Minutes | 16 (19.3%) | 0 (0.0%) |
Time of Departure to Work by Sex in Driscoll
The most frequent times of departure to work in Driscoll are 7:00 AM to 7:29 AM (52, 62.6%) for males and 8:00 AM to 8:29 AM (31, 34.4%) for females.
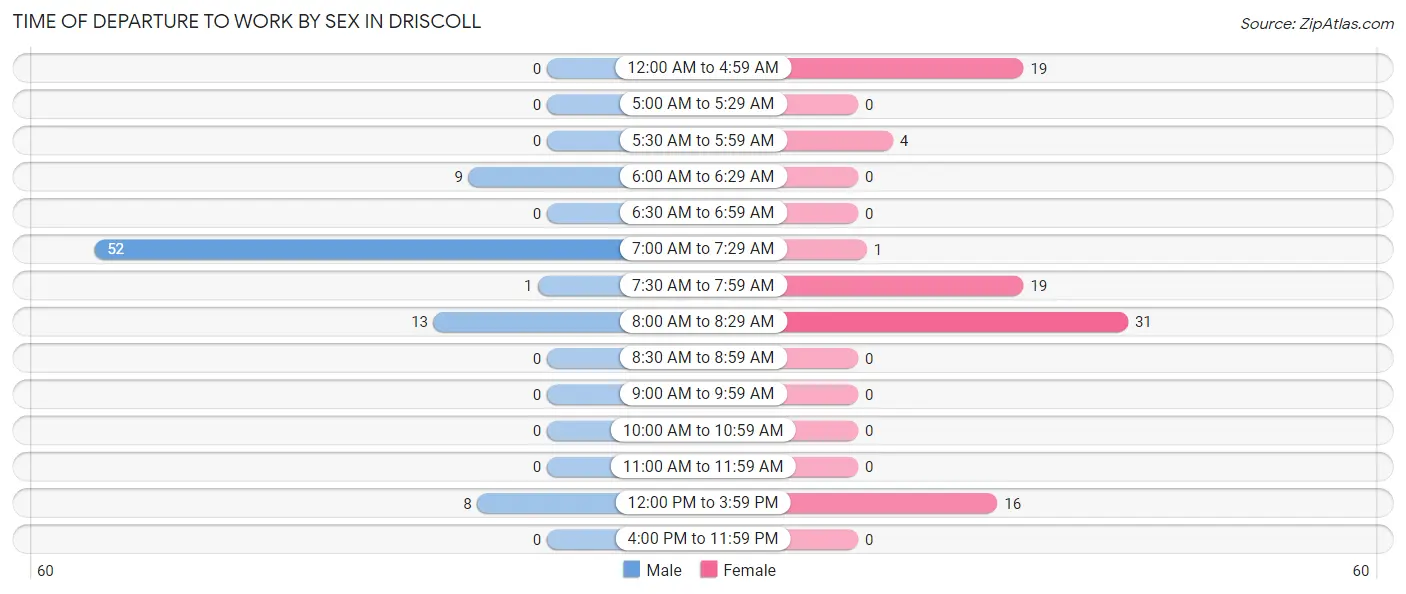
| Time of Departure | Male | Female |
| 12:00 AM to 4:59 AM | 0 (0.0%) | 19 (21.1%) |
| 5:00 AM to 5:29 AM | 0 (0.0%) | 0 (0.0%) |
| 5:30 AM to 5:59 AM | 0 (0.0%) | 4 (4.4%) |
| 6:00 AM to 6:29 AM | 9 (10.8%) | 0 (0.0%) |
| 6:30 AM to 6:59 AM | 0 (0.0%) | 0 (0.0%) |
| 7:00 AM to 7:29 AM | 52 (62.6%) | 1 (1.1%) |
| 7:30 AM to 7:59 AM | 1 (1.2%) | 19 (21.1%) |
| 8:00 AM to 8:29 AM | 13 (15.7%) | 31 (34.4%) |
| 8:30 AM to 8:59 AM | 0 (0.0%) | 0 (0.0%) |
| 9:00 AM to 9:59 AM | 0 (0.0%) | 0 (0.0%) |
| 10:00 AM to 10:59 AM | 0 (0.0%) | 0 (0.0%) |
| 11:00 AM to 11:59 AM | 0 (0.0%) | 0 (0.0%) |
| 12:00 PM to 3:59 PM | 8 (9.6%) | 16 (17.8%) |
| 4:00 PM to 11:59 PM | 0 (0.0%) | 0 (0.0%) |
| Total | 83 (100.0%) | 90 (100.0%) |
Housing Occupancy in Driscoll
Occupancy by Ownership in Driscoll
Of the total 204 dwellings in Driscoll, owner-occupied units account for 68 (33.3%), while renter-occupied units make up 136 (66.7%).
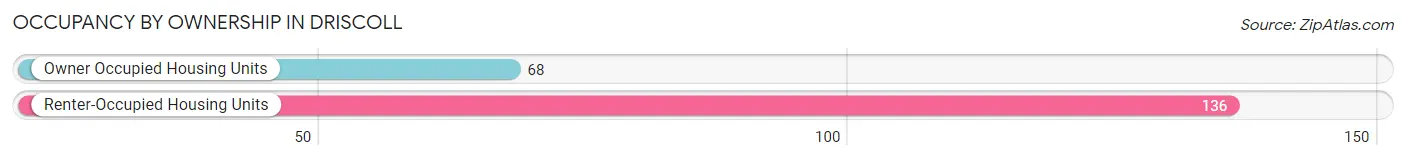
| Occupancy | # Housing Units | % Housing Units |
| Owner Occupied Housing Units | 68 | 33.3% |
| Renter-Occupied Housing Units | 136 | 66.7% |
| Total Occupied Housing Units | 204 | 100.0% |
Occupancy by Household Size in Driscoll
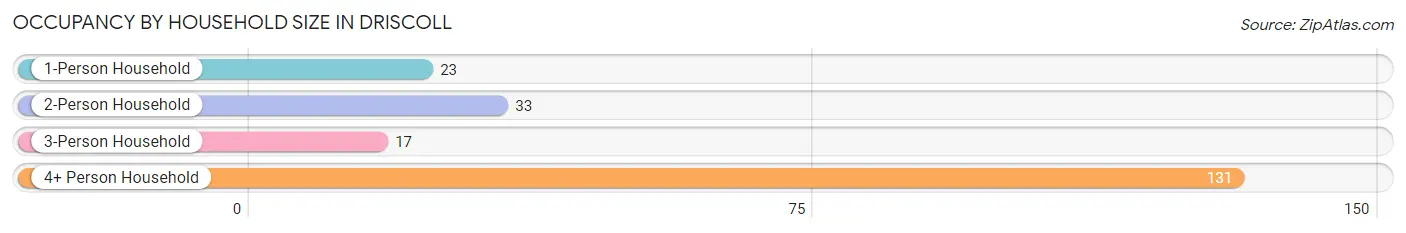
| Household Size | # Housing Units | % Housing Units |
| 1-Person Household | 23 | 11.3% |
| 2-Person Household | 33 | 16.2% |
| 3-Person Household | 17 | 8.3% |
| 4+ Person Household | 131 | 64.2% |
| Total Housing Units | 204 | 100.0% |
Occupancy by Ownership by Household Size in Driscoll
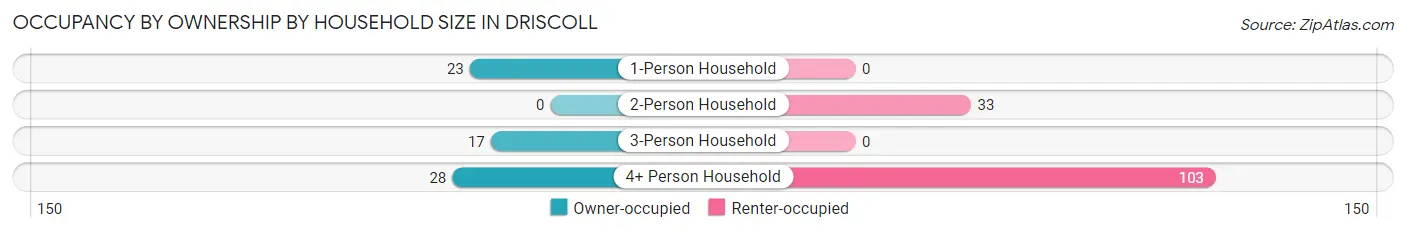
| Household Size | Owner-occupied | Renter-occupied |
| 1-Person Household | 23 (100.0%) | 0 (0.0%) |
| 2-Person Household | 0 (0.0%) | 33 (100.0%) |
| 3-Person Household | 17 (100.0%) | 0 (0.0%) |
| 4+ Person Household | 28 (21.4%) | 103 (78.6%) |
| Total Housing Units | 68 (33.3%) | 136 (66.7%) |
Occupancy by Educational Attainment in Driscoll
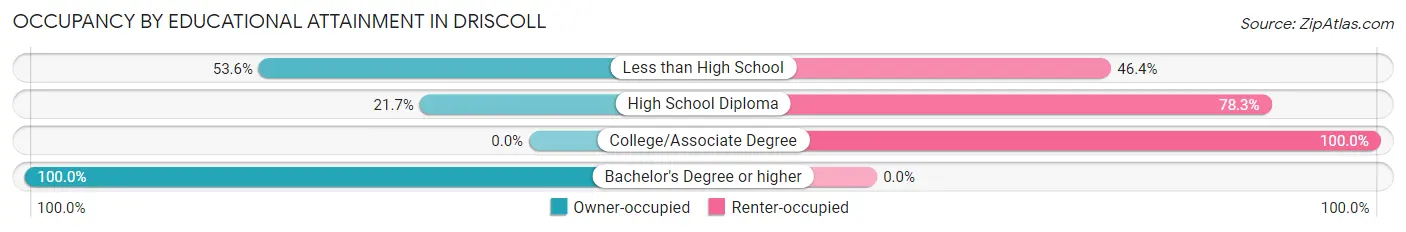
| Household Size | Owner-occupied | Renter-occupied |
| Less than High School | 30 (53.6%) | 26 (46.4%) |
| High School Diploma | 26 (21.7%) | 94 (78.3%) |
| College/Associate Degree | 0 (0.0%) | 16 (100.0%) |
| Bachelor's Degree or higher | 12 (100.0%) | 0 (0.0%) |
Occupancy by Age of Householder in Driscoll
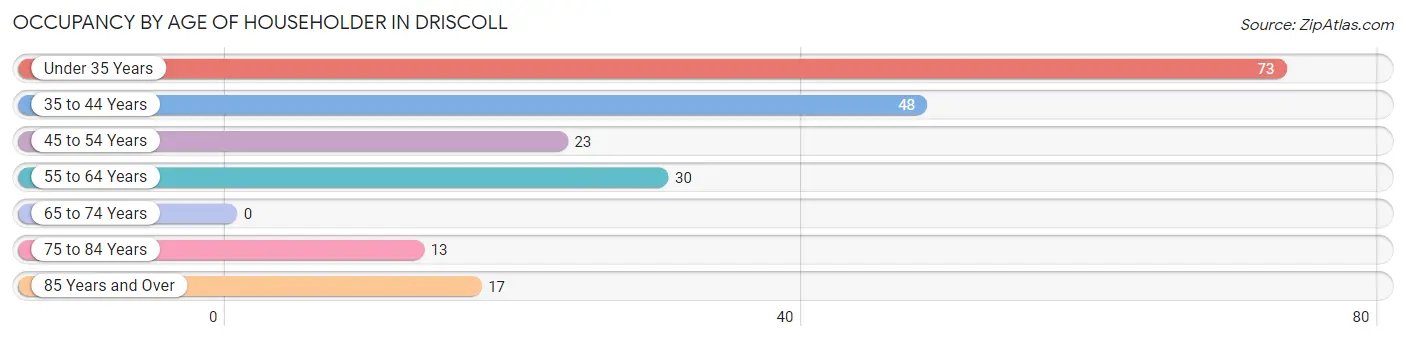
| Age Bracket | # Households | % Households |
| Under 35 Years | 73 | 35.8% |
| 35 to 44 Years | 48 | 23.5% |
| 45 to 54 Years | 23 | 11.3% |
| 55 to 64 Years | 30 | 14.7% |
| 65 to 74 Years | 0 | 0.0% |
| 75 to 84 Years | 13 | 6.4% |
| 85 Years and Over | 17 | 8.3% |
| Total | 204 | 100.0% |
Housing Finances in Driscoll
Median Income by Occupancy in Driscoll
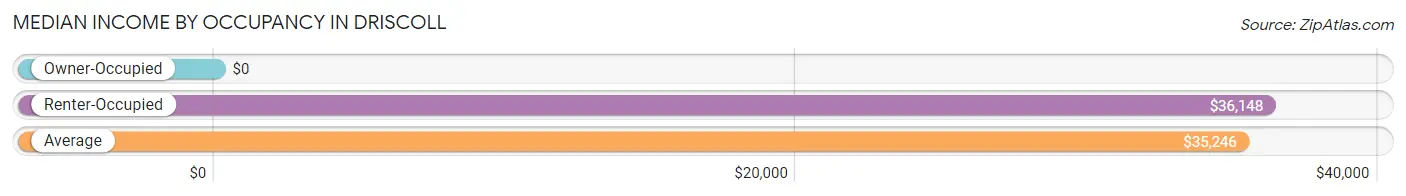
| Occupancy Type | # Households | Median Income |
| Owner-Occupied | 68 (33.3%) | $0 |
| Renter-Occupied | 136 (66.7%) | $36,148 |
| Average | 204 (100.0%) | $35,246 |
Occupancy by Householder Income Bracket in Driscoll
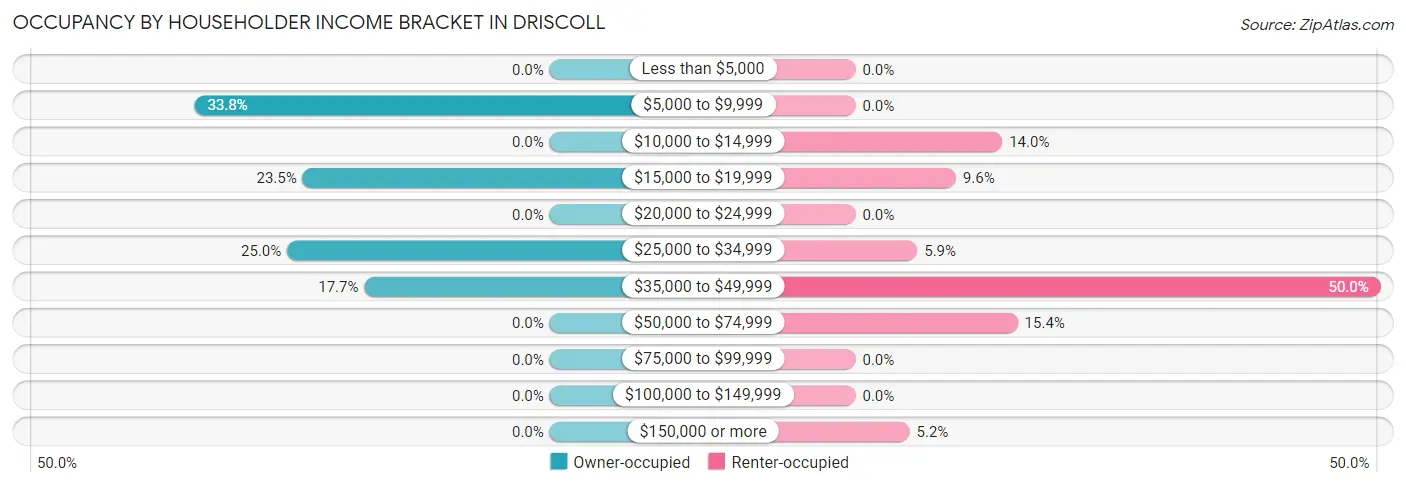
| Income Bracket | Owner-occupied | Renter-occupied |
| Less than $5,000 | 0 (0.0%) | 0 (0.0%) |
| $5,000 to $9,999 | 23 (33.8%) | 0 (0.0%) |
| $10,000 to $14,999 | 0 (0.0%) | 19 (14.0%) |
| $15,000 to $19,999 | 16 (23.5%) | 13 (9.6%) |
| $20,000 to $24,999 | 0 (0.0%) | 0 (0.0%) |
| $25,000 to $34,999 | 17 (25.0%) | 8 (5.9%) |
| $35,000 to $49,999 | 12 (17.6%) | 68 (50.0%) |
| $50,000 to $74,999 | 0 (0.0%) | 21 (15.4%) |
| $75,000 to $99,999 | 0 (0.0%) | 0 (0.0%) |
| $100,000 to $149,999 | 0 (0.0%) | 0 (0.0%) |
| $150,000 or more | 0 (0.0%) | 7 (5.1%) |
| Total | 68 (100.0%) | 136 (100.0%) |
Monthly Housing Cost Tiers in Driscoll
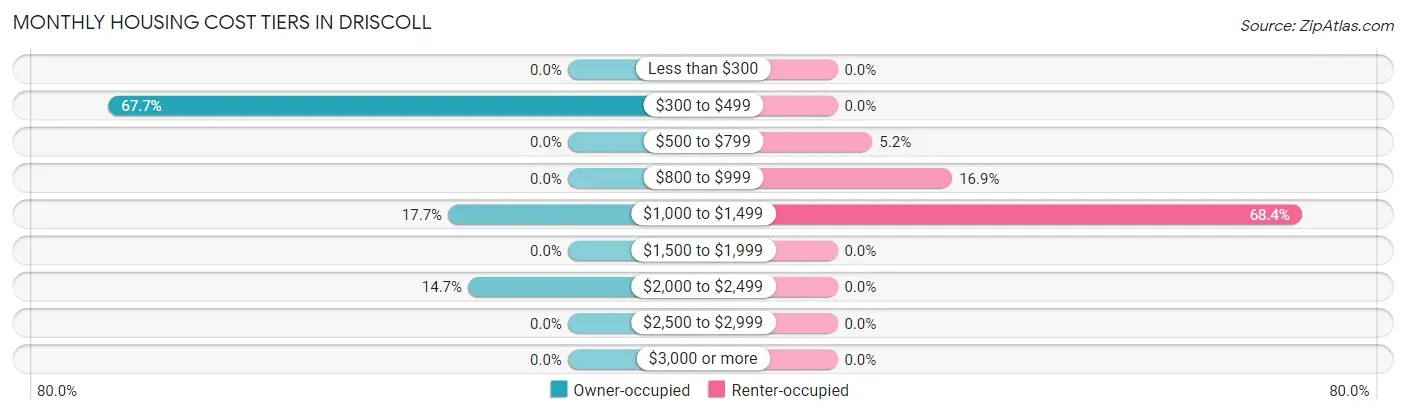
| Monthly Cost | Owner-occupied | Renter-occupied |
| Less than $300 | 0 (0.0%) | 0 (0.0%) |
| $300 to $499 | 46 (67.6%) | 0 (0.0%) |
| $500 to $799 | 0 (0.0%) | 7 (5.1%) |
| $800 to $999 | 0 (0.0%) | 23 (16.9%) |
| $1,000 to $1,499 | 12 (17.6%) | 93 (68.4%) |
| $1,500 to $1,999 | 0 (0.0%) | 0 (0.0%) |
| $2,000 to $2,499 | 10 (14.7%) | 0 (0.0%) |
| $2,500 to $2,999 | 0 (0.0%) | 0 (0.0%) |
| $3,000 or more | 0 (0.0%) | 0 (0.0%) |
| Total | 68 (100.0%) | 136 (100.0%) |
Physical Housing Characteristics in Driscoll
Housing Structures in Driscoll
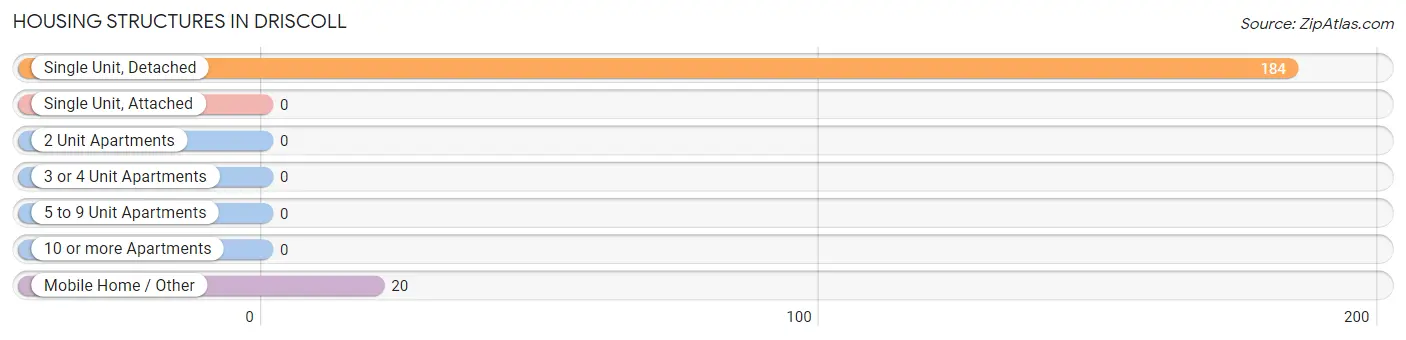
| Structure Type | # Housing Units | % Housing Units |
| Single Unit, Detached | 184 | 90.2% |
| Single Unit, Attached | 0 | 0.0% |
| 2 Unit Apartments | 0 | 0.0% |
| 3 or 4 Unit Apartments | 0 | 0.0% |
| 5 to 9 Unit Apartments | 0 | 0.0% |
| 10 or more Apartments | 0 | 0.0% |
| Mobile Home / Other | 20 | 9.8% |
| Total | 204 | 100.0% |
Housing Structures by Occupancy in Driscoll
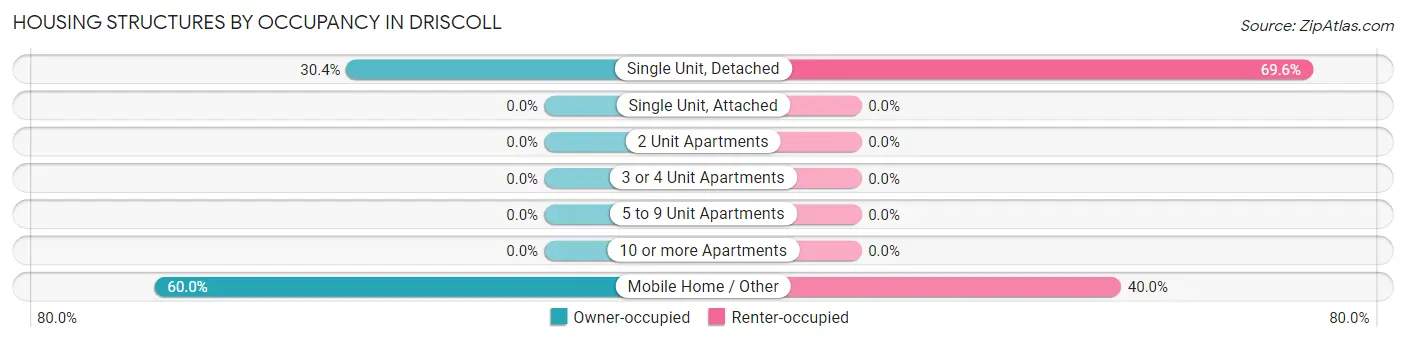
| Structure Type | Owner-occupied | Renter-occupied |
| Single Unit, Detached | 56 (30.4%) | 128 (69.6%) |
| Single Unit, Attached | 0 (0.0%) | 0 (0.0%) |
| 2 Unit Apartments | 0 (0.0%) | 0 (0.0%) |
| 3 or 4 Unit Apartments | 0 (0.0%) | 0 (0.0%) |
| 5 to 9 Unit Apartments | 0 (0.0%) | 0 (0.0%) |
| 10 or more Apartments | 0 (0.0%) | 0 (0.0%) |
| Mobile Home / Other | 12 (60.0%) | 8 (40.0%) |
| Total | 68 (33.3%) | 136 (66.7%) |
Housing Structures by Number of Rooms in Driscoll
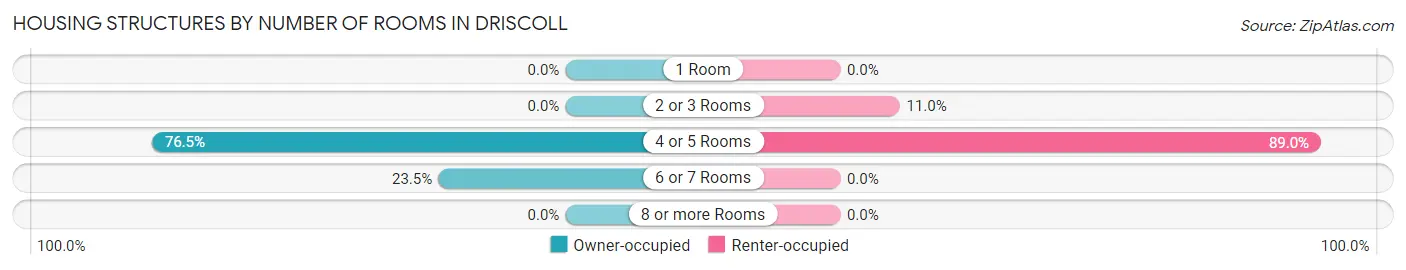
| Number of Rooms | Owner-occupied | Renter-occupied |
| 1 Room | 0 (0.0%) | 0 (0.0%) |
| 2 or 3 Rooms | 0 (0.0%) | 15 (11.0%) |
| 4 or 5 Rooms | 52 (76.5%) | 121 (89.0%) |
| 6 or 7 Rooms | 16 (23.5%) | 0 (0.0%) |
| 8 or more Rooms | 0 (0.0%) | 0 (0.0%) |
| Total | 68 (100.0%) | 136 (100.0%) |
Housing Structure by Heating Type in Driscoll
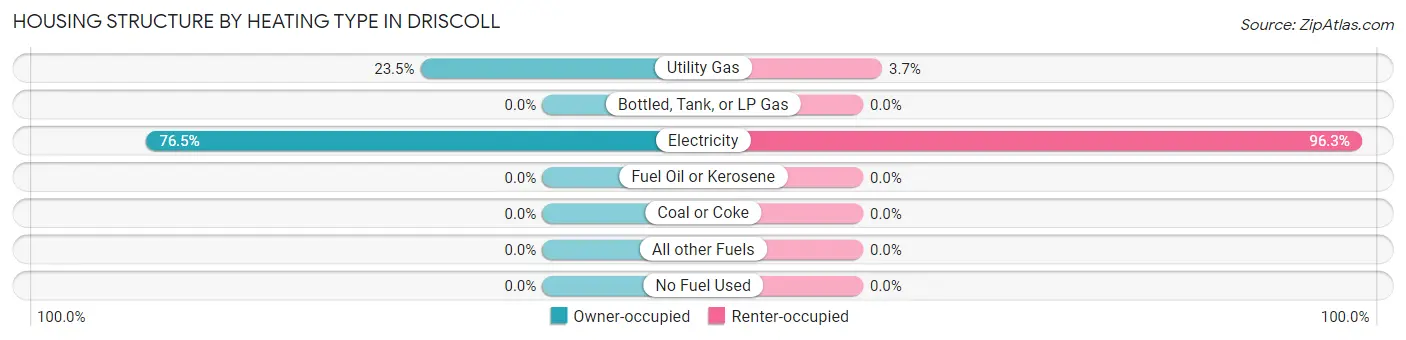
| Heating Type | Owner-occupied | Renter-occupied |
| Utility Gas | 16 (23.5%) | 5 (3.7%) |
| Bottled, Tank, or LP Gas | 0 (0.0%) | 0 (0.0%) |
| Electricity | 52 (76.5%) | 131 (96.3%) |
| Fuel Oil or Kerosene | 0 (0.0%) | 0 (0.0%) |
| Coal or Coke | 0 (0.0%) | 0 (0.0%) |
| All other Fuels | 0 (0.0%) | 0 (0.0%) |
| No Fuel Used | 0 (0.0%) | 0 (0.0%) |
| Total | 68 (100.0%) | 136 (100.0%) |
Household Vehicle Usage in Driscoll
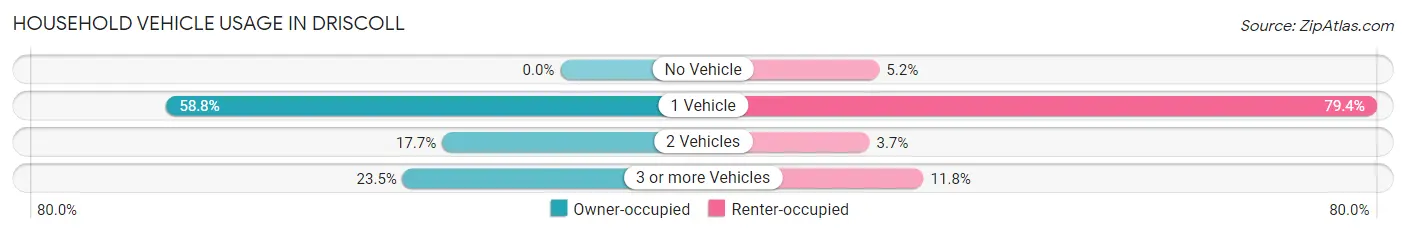
| Vehicles per Household | Owner-occupied | Renter-occupied |
| No Vehicle | 0 (0.0%) | 7 (5.1%) |
| 1 Vehicle | 40 (58.8%) | 108 (79.4%) |
| 2 Vehicles | 12 (17.6%) | 5 (3.7%) |
| 3 or more Vehicles | 16 (23.5%) | 16 (11.8%) |
| Total | 68 (100.0%) | 136 (100.0%) |
Real Estate & Mortgages in Driscoll
Real Estate and Mortgage Overview in Driscoll
| Characteristic | Without Mortgage | With Mortgage |
| Housing Units | 46 | 22 |
| Median Property Value | $74,600 | $0 |
| Median Household Income | - | - |
| Monthly Housing Costs | $430 | $0 |
| Real Estate Taxes | - | - |
Property Value by Mortgage Status in Driscoll
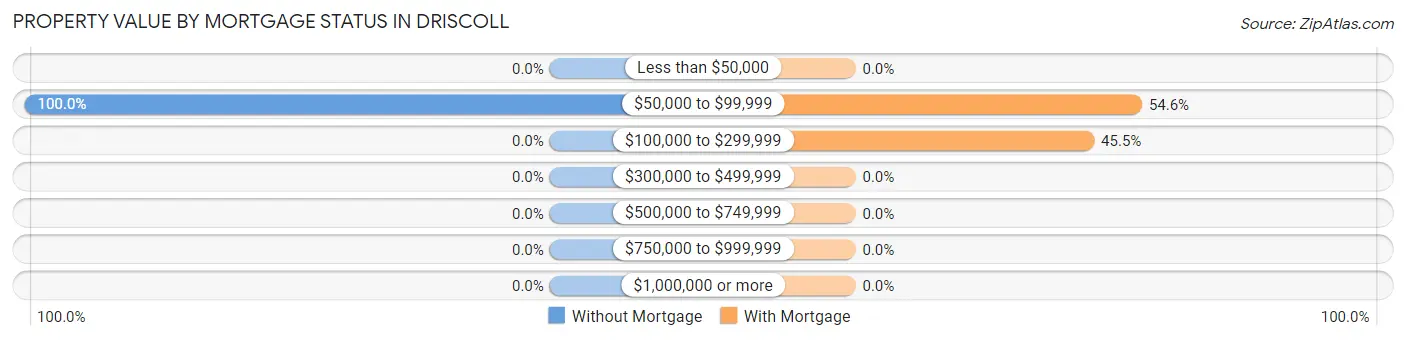
| Property Value | Without Mortgage | With Mortgage |
| Less than $50,000 | 0 (0.0%) | 0 (0.0%) |
| $50,000 to $99,999 | 46 (100.0%) | 12 (54.5%) |
| $100,000 to $299,999 | 0 (0.0%) | 10 (45.5%) |
| $300,000 to $499,999 | 0 (0.0%) | 0 (0.0%) |
| $500,000 to $749,999 | 0 (0.0%) | 0 (0.0%) |
| $750,000 to $999,999 | 0 (0.0%) | 0 (0.0%) |
| $1,000,000 or more | 0 (0.0%) | 0 (0.0%) |
| Total | 46 (100.0%) | 22 (100.0%) |
Household Income by Mortgage Status in Driscoll
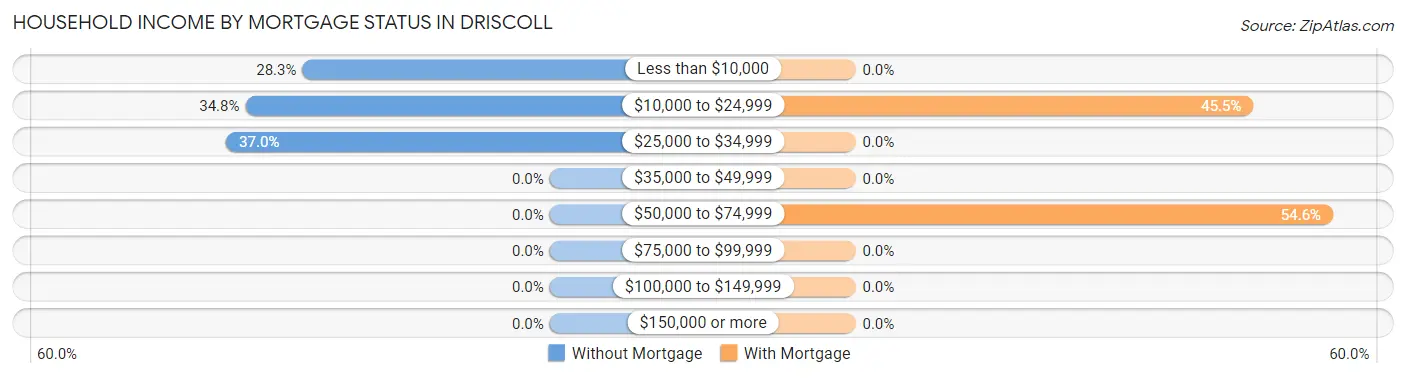
| Household Income | Without Mortgage | With Mortgage |
| Less than $10,000 | 13 (28.3%) | 0 (0.0%) |
| $10,000 to $24,999 | 16 (34.8%) | 10 (45.5%) |
| $25,000 to $34,999 | 17 (37.0%) | 0 (0.0%) |
| $35,000 to $49,999 | 0 (0.0%) | 0 (0.0%) |
| $50,000 to $74,999 | 0 (0.0%) | 12 (54.5%) |
| $75,000 to $99,999 | 0 (0.0%) | 0 (0.0%) |
| $100,000 to $149,999 | 0 (0.0%) | 0 (0.0%) |
| $150,000 or more | 0 (0.0%) | 0 (0.0%) |
| Total | 46 (100.0%) | 22 (100.0%) |
Property Value to Household Income Ratio in Driscoll
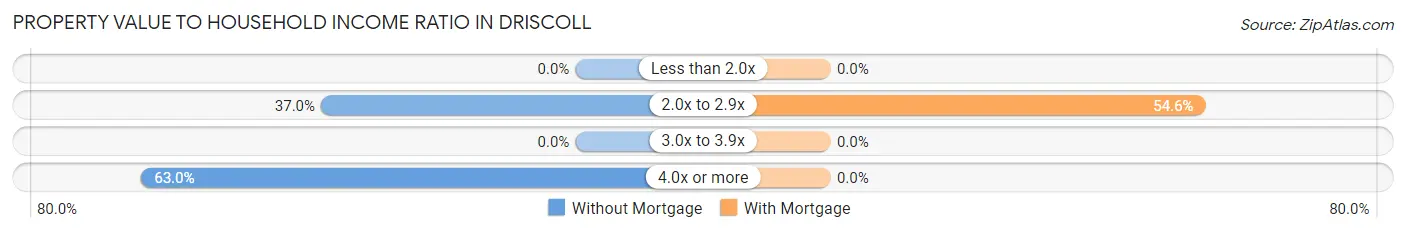
| Value-to-Income Ratio | Without Mortgage | With Mortgage |
| Less than 2.0x | 0 (0.0%) | 0 (0.0%) |
| 2.0x to 2.9x | 17 (37.0%) | 12 (54.5%) |
| 3.0x to 3.9x | 0 (0.0%) | 0 (0.0%) |
| 4.0x or more | 29 (63.0%) | 0 (0.0%) |
| Total | 46 (100.0%) | 22 (100.0%) |
Real Estate Taxes by Mortgage Status in Driscoll
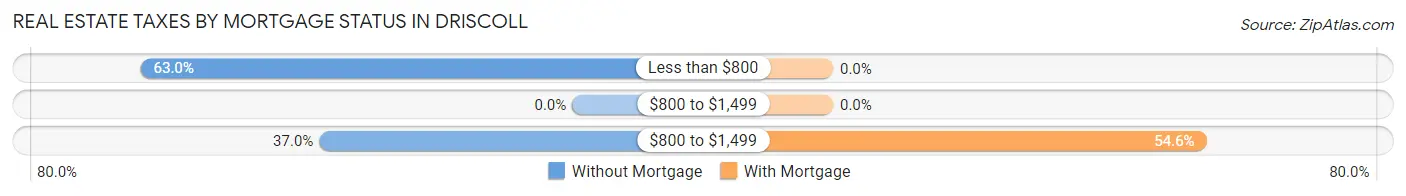
| Property Taxes | Without Mortgage | With Mortgage |
| Less than $800 | 29 (63.0%) | 0 (0.0%) |
| $800 to $1,499 | 0 (0.0%) | 0 (0.0%) |
| $800 to $1,499 | 17 (37.0%) | 12 (54.5%) |
| Total | 46 (100.0%) | 22 (100.0%) |
Health & Disability in Driscoll
Health Insurance Coverage by Age in Driscoll
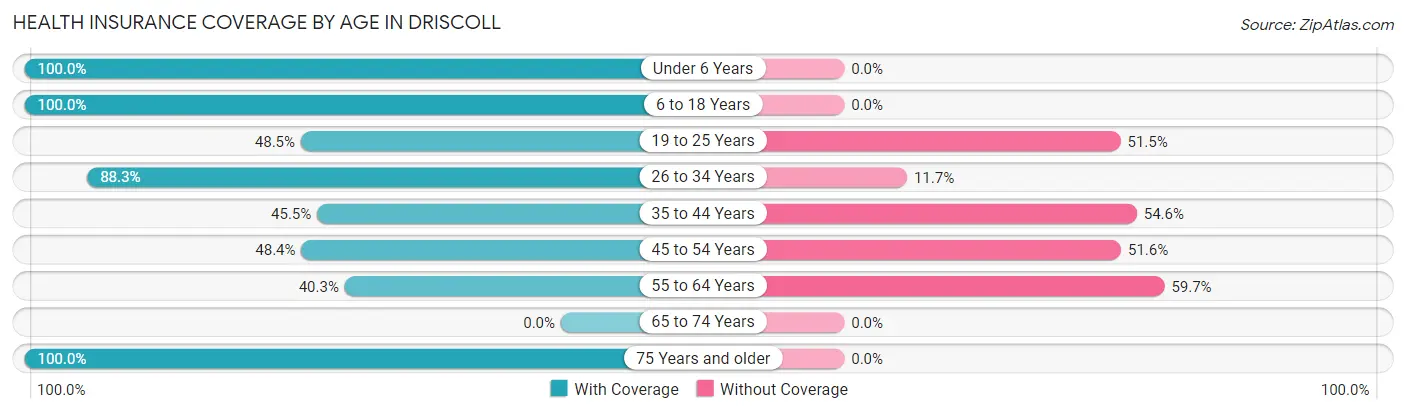
| Age Bracket | With Coverage | Without Coverage |
| Under 6 Years | 48 (100.0%) | 0 (0.0%) |
| 6 to 18 Years | 254 (100.0%) | 0 (0.0%) |
| 19 to 25 Years | 64 (48.5%) | 68 (51.5%) |
| 26 to 34 Years | 68 (88.3%) | 9 (11.7%) |
| 35 to 44 Years | 30 (45.5%) | 36 (54.5%) |
| 45 to 54 Years | 15 (48.4%) | 16 (51.6%) |
| 55 to 64 Years | 27 (40.3%) | 40 (59.7%) |
| 65 to 74 Years | 0 (0.0%) | 0 (0.0%) |
| 75 Years and older | 47 (100.0%) | 0 (0.0%) |
| Total | 553 (76.6%) | 169 (23.4%) |
Health Insurance Coverage by Citizenship Status in Driscoll
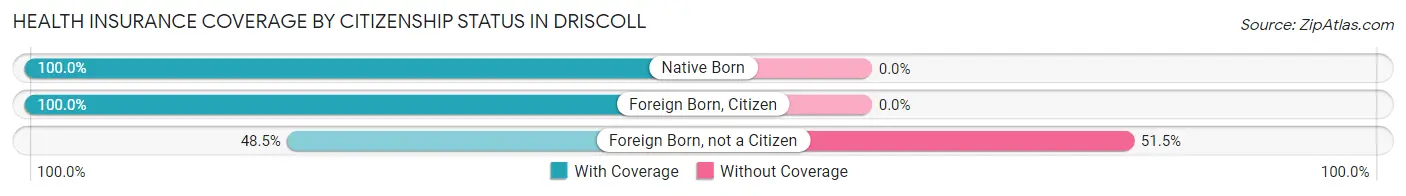
| Citizenship Status | With Coverage | Without Coverage |
| Native Born | 48 (100.0%) | 0 (0.0%) |
| Foreign Born, Citizen | 254 (100.0%) | 0 (0.0%) |
| Foreign Born, not a Citizen | 64 (48.5%) | 68 (51.5%) |
Health Insurance Coverage by Household Income in Driscoll
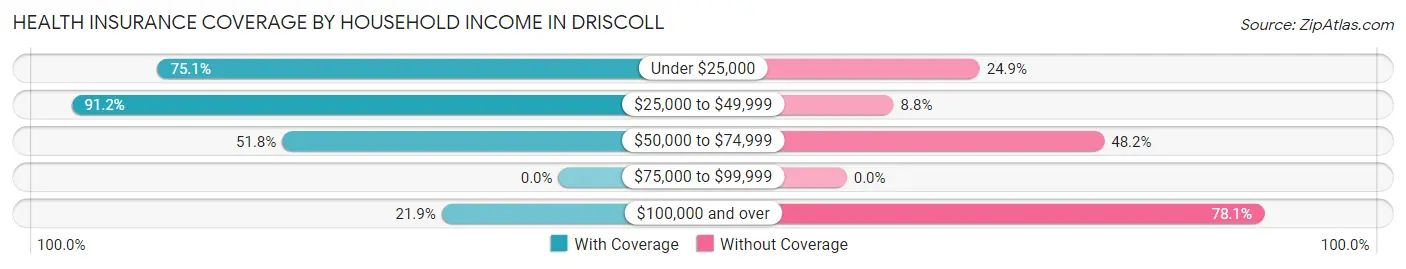
| Household Income | With Coverage | Without Coverage |
| Under $25,000 | 232 (75.1%) | 77 (24.9%) |
| $25,000 to $49,999 | 270 (91.2%) | 26 (8.8%) |
| $50,000 to $74,999 | 44 (51.8%) | 41 (48.2%) |
| $75,000 to $99,999 | 0 (0.0%) | 0 (0.0%) |
| $100,000 and over | 7 (21.9%) | 25 (78.1%) |
Public vs Private Health Insurance Coverage by Age in Driscoll
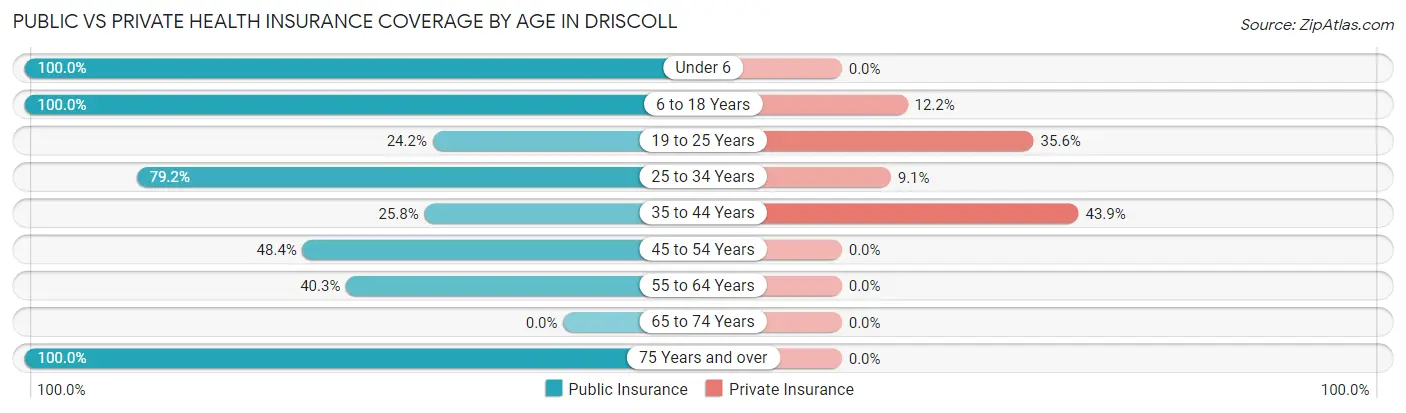
| Age Bracket | Public Insurance | Private Insurance |
| Under 6 | 48 (100.0%) | 0 (0.0%) |
| 6 to 18 Years | 254 (100.0%) | 31 (12.2%) |
| 19 to 25 Years | 32 (24.2%) | 47 (35.6%) |
| 25 to 34 Years | 61 (79.2%) | 7 (9.1%) |
| 35 to 44 Years | 17 (25.8%) | 29 (43.9%) |
| 45 to 54 Years | 15 (48.4%) | 0 (0.0%) |
| 55 to 64 Years | 27 (40.3%) | 0 (0.0%) |
| 65 to 74 Years | 0 (0.0%) | 0 (0.0%) |
| 75 Years and over | 47 (100.0%) | 0 (0.0%) |
| Total | 501 (69.4%) | 114 (15.8%) |
Disability Status by Sex by Age in Driscoll
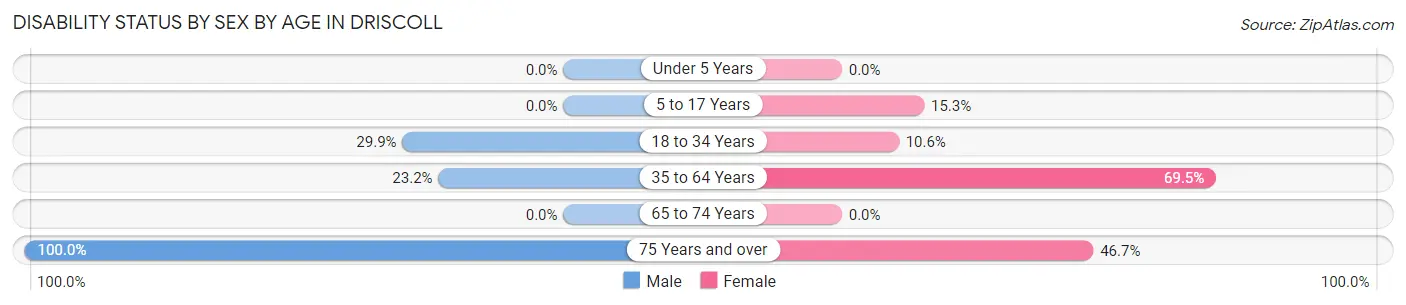
| Age Bracket | Male | Female |
| Under 5 Years | 0 (0.0%) | 0 (0.0%) |
| 5 to 17 Years | 0 (0.0%) | 29 (15.3%) |
| 18 to 34 Years | 23 (29.9%) | 15 (10.6%) |
| 35 to 64 Years | 16 (23.2%) | 66 (69.5%) |
| 65 to 74 Years | 0 (0.0%) | 0 (0.0%) |
| 75 Years and over | 17 (100.0%) | 14 (46.7%) |
Disability Class by Sex by Age in Driscoll
Disability Class: Hearing Difficulty
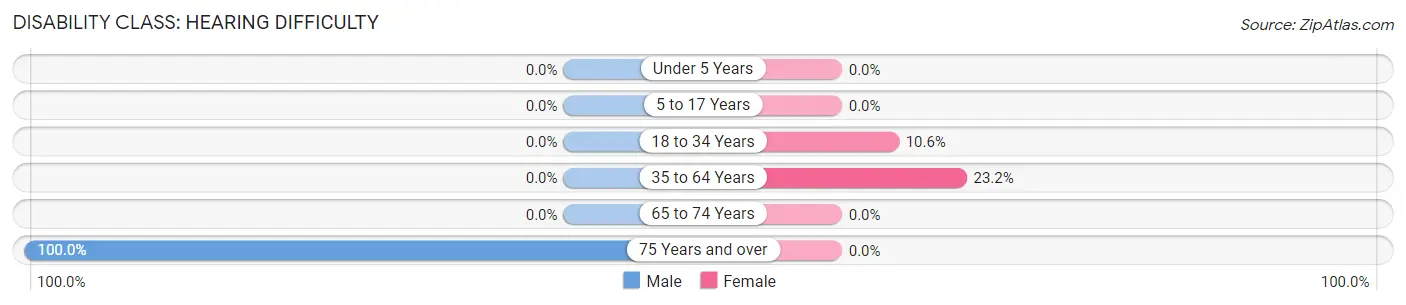
| Age Bracket | Male | Female |
| Under 5 Years | 0 (0.0%) | 0 (0.0%) |
| 5 to 17 Years | 0 (0.0%) | 0 (0.0%) |
| 18 to 34 Years | 0 (0.0%) | 15 (10.6%) |
| 35 to 64 Years | 0 (0.0%) | 22 (23.2%) |
| 65 to 74 Years | 0 (0.0%) | 0 (0.0%) |
| 75 Years and over | 17 (100.0%) | 0 (0.0%) |
Disability Class: Vision Difficulty
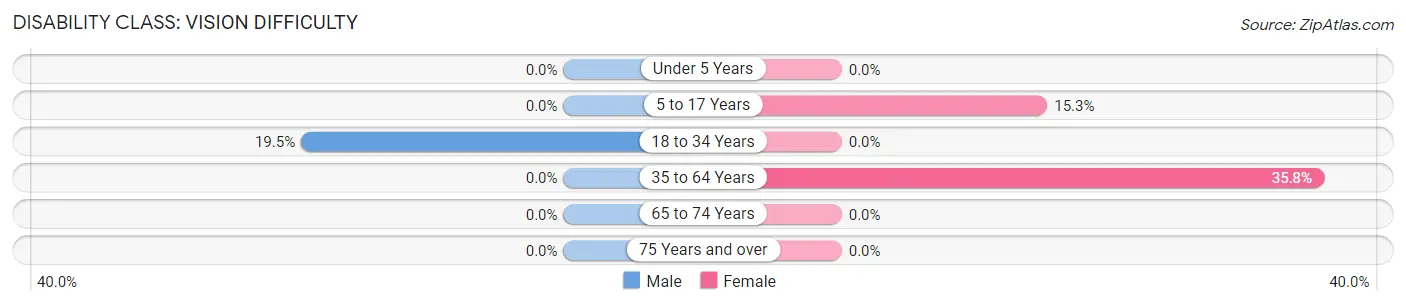
| Age Bracket | Male | Female |
| Under 5 Years | 0 (0.0%) | 0 (0.0%) |
| 5 to 17 Years | 0 (0.0%) | 29 (15.3%) |
| 18 to 34 Years | 15 (19.5%) | 0 (0.0%) |
| 35 to 64 Years | 0 (0.0%) | 34 (35.8%) |
| 65 to 74 Years | 0 (0.0%) | 0 (0.0%) |
| 75 Years and over | 0 (0.0%) | 0 (0.0%) |
Disability Class: Cognitive Difficulty
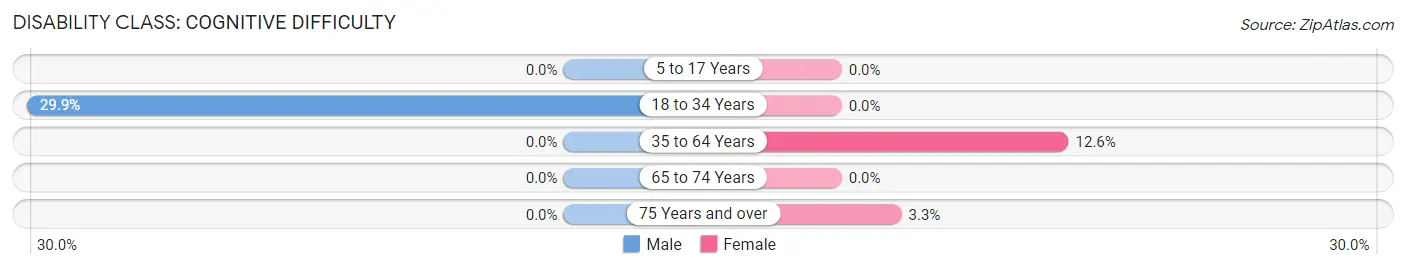
| Age Bracket | Male | Female |
| 5 to 17 Years | 0 (0.0%) | 0 (0.0%) |
| 18 to 34 Years | 23 (29.9%) | 0 (0.0%) |
| 35 to 64 Years | 0 (0.0%) | 12 (12.6%) |
| 65 to 74 Years | 0 (0.0%) | 0 (0.0%) |
| 75 Years and over | 0 (0.0%) | 1 (3.3%) |
Disability Class: Ambulatory Difficulty
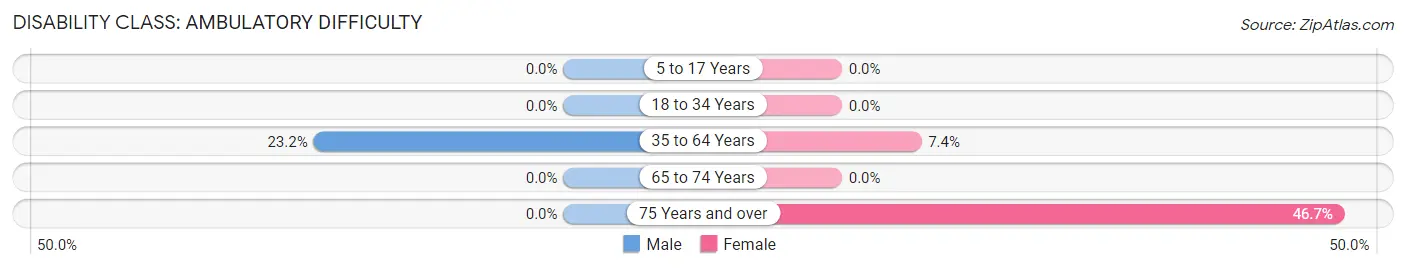
| Age Bracket | Male | Female |
| 5 to 17 Years | 0 (0.0%) | 0 (0.0%) |
| 18 to 34 Years | 0 (0.0%) | 0 (0.0%) |
| 35 to 64 Years | 16 (23.2%) | 7 (7.4%) |
| 65 to 74 Years | 0 (0.0%) | 0 (0.0%) |
| 75 Years and over | 0 (0.0%) | 14 (46.7%) |
Disability Class: Self-Care Difficulty
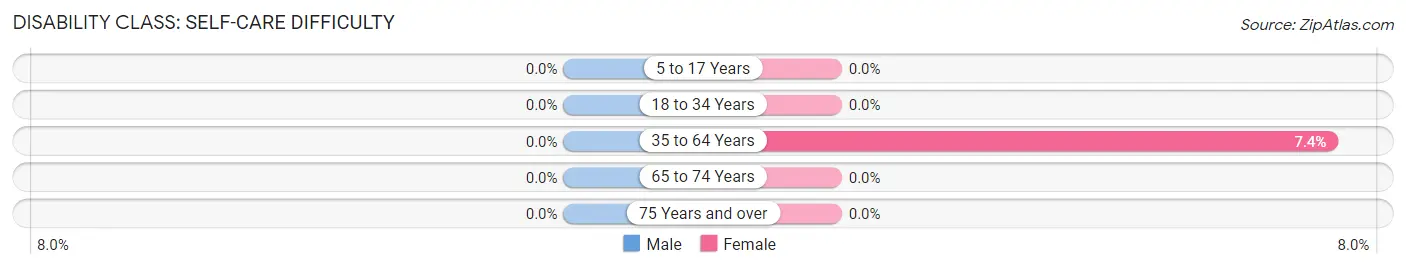
| Age Bracket | Male | Female |
| 5 to 17 Years | 0 (0.0%) | 0 (0.0%) |
| 18 to 34 Years | 0 (0.0%) | 0 (0.0%) |
| 35 to 64 Years | 0 (0.0%) | 7 (7.4%) |
| 65 to 74 Years | 0 (0.0%) | 0 (0.0%) |
| 75 Years and over | 0 (0.0%) | 0 (0.0%) |
Technology Access in Driscoll
Computing Device Access in Driscoll
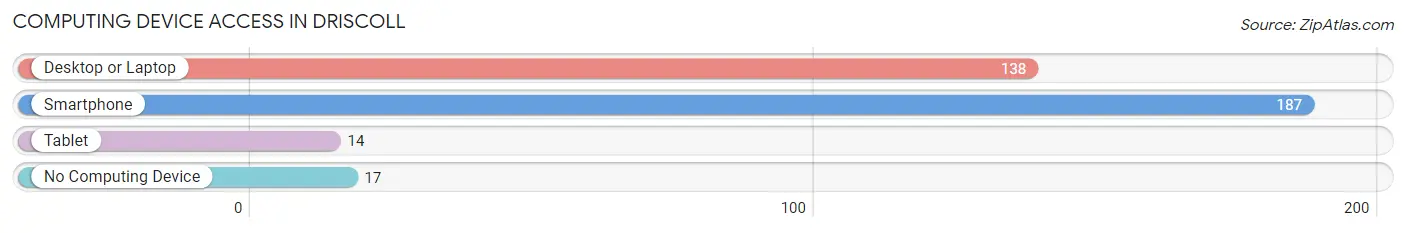
| Device Type | # Households | % Households |
| Desktop or Laptop | 138 | 67.6% |
| Smartphone | 187 | 91.7% |
| Tablet | 14 | 6.9% |
| No Computing Device | 17 | 8.3% |
| Total | 204 | 100.0% |
Internet Access in Driscoll
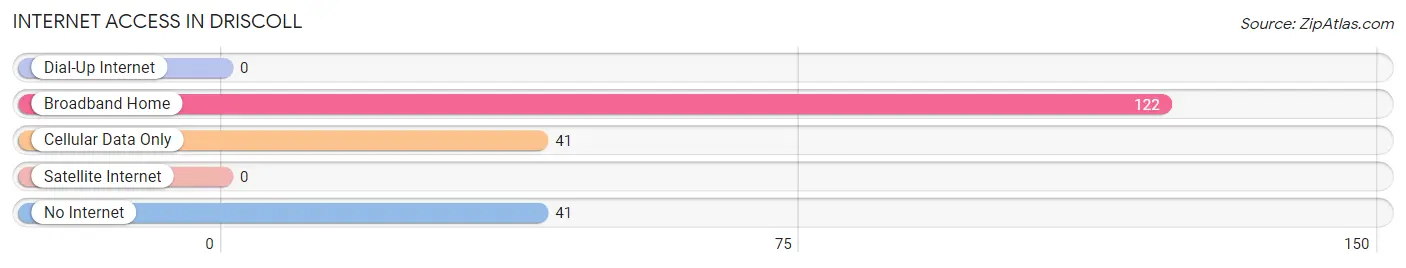
| Internet Type | # Households | % Households |
| Dial-Up Internet | 0 | 0.0% |
| Broadband Home | 122 | 59.8% |
| Cellular Data Only | 41 | 20.1% |
| Satellite Internet | 0 | 0.0% |
| No Internet | 41 | 20.1% |
| Total | 204 | 100.0% |
Driscoll Summary
Driscoll is a small city located in Nueces County, Texas. It is situated on the banks of the Nueces River, about 20 miles south of Corpus Christi. The city was founded in 1891 by the Driscoll family, who were among the first settlers in the area. The city was named after the family’s patriarch, John Driscoll.
Geography
Driscoll is located in the Coastal Bend region of Texas, which is characterized by its flat terrain and sandy soils. The city is situated on the banks of the Nueces River, which provides a source of water for the city. The city is also located near the Gulf of Mexico, which provides a source of recreation and tourism for the city. The climate in Driscoll is subtropical, with hot summers and mild winters.
Economy
The economy of Driscoll is largely based on agriculture and tourism. The city is home to several large farms, which produce a variety of crops, including cotton, corn, and sorghum. The city is also home to several tourist attractions, including the Driscoll Wildlife Refuge, which is a popular destination for birdwatchers.
Demographics
As of the 2010 census, the population of Driscoll was 1,845. The racial makeup of the city was 79.3% White, 0.7% African American, 0.2% Native American, 0.2% Asian, 0.1% Pacific Islander, 17.7% from other races, and 2.0% from two or more races. Hispanic or Latino of any race were 33.3% of the population.
The median income for a household in Driscoll was $30,938, and the median income for a family was $35,625. The per capita income for the city was $14,945. About 18.2% of families and 22.2% of the population were below the poverty line, including 28.3% of those under age 18 and 16.2% of those age 65 or over.
Education
Driscoll is served by the Driscoll Independent School District, which consists of two elementary schools, one middle school, and one high school. The city is also home to several private schools, including St. Joseph Catholic School and Driscoll Christian Academy.
Conclusion
Driscoll is a small city located in Nueces County, Texas. It is situated on the banks of the Nueces River, about 20 miles south of Corpus Christi. The city was founded in 1891 by the Driscoll family, and is home to a variety of agricultural and tourist attractions. The population of Driscoll is 1,845, and the city is served by the Driscoll Independent School District. The economy of Driscoll is largely based on agriculture and tourism, and the median income for a household in Driscoll is $30,938.
Common Questions
What is the Total Population of Driscoll?
Total Population of Driscoll is 722.
What is the Total Male Population of Driscoll?
Total Male Population of Driscoll is 217.
What is the Total Female Population of Driscoll?
Total Female Population of Driscoll is 505.
What is the Ratio of Males per 100 Females in Driscoll?
There are 42.97 Males per 100 Females in Driscoll.
What is the Ratio of Females per 100 Males in Driscoll?
There are 232.72 Females per 100 Males in Driscoll.
What is the Median Population Age in Driscoll?
Median Population Age in Driscoll is 24.3 Years.
What is the Average Family Size in Driscoll
Average Family Size in Driscoll is 3.8 People.
What is the Average Household Size in Driscoll
Average Household Size in Driscoll is 3.5 People.
What is Per Capita Income in Driscoll?
Per Capita income in Driscoll is $10,081.
What is the Median Family Income in Driscoll?
Median Family Income in Driscoll is $35,599.
What is the Median Household income in Driscoll?
Median Household Income in Driscoll is $35,246.
What is Inequality or Gini Index in Driscoll?
Inequality or Gini Index in Driscoll is 0.37.
How Large is the Labor Force in Driscoll?
There are 271 People in the Labor Forcein in Driscoll.
What is the Percentage of People in the Labor Force in Driscoll?
55.3% of People are in the Labor Force in Driscoll.
What is the Unemployment Rate in Driscoll?
Unemployment Rate in Driscoll is 3.7%.