Cross Timber, TX
Cross Timber Map
Cross Timber Overview
532
TOTAL POPULATION
139
MALE POPULATION
393
FEMALE POPULATION
35.37
MALES / 100 FEMALES
282.73
FEMALES / 100 MALES
38.2
MEDIAN AGE
3.5
AVG FAMILY SIZE
3.1
AVG HOUSEHOLD SIZE
$23,977
PER CAPITA INCOME
$43,333
AVG FAMILY INCOME
$41,136
AVG HOUSEHOLD INCOME
83.2%
WAGE / INCOME GAP [ % ]
16.8¢/ $1
WAGE / INCOME GAP [ $ ]
0.56
INEQUALITY / GINI INDEX
206
LABOR FORCE [ PEOPLE ]
64.6%
PERCENT IN LABOR FORCE
14.4%
UNEMPLOYMENT RATE
Cross Timber Area Codes
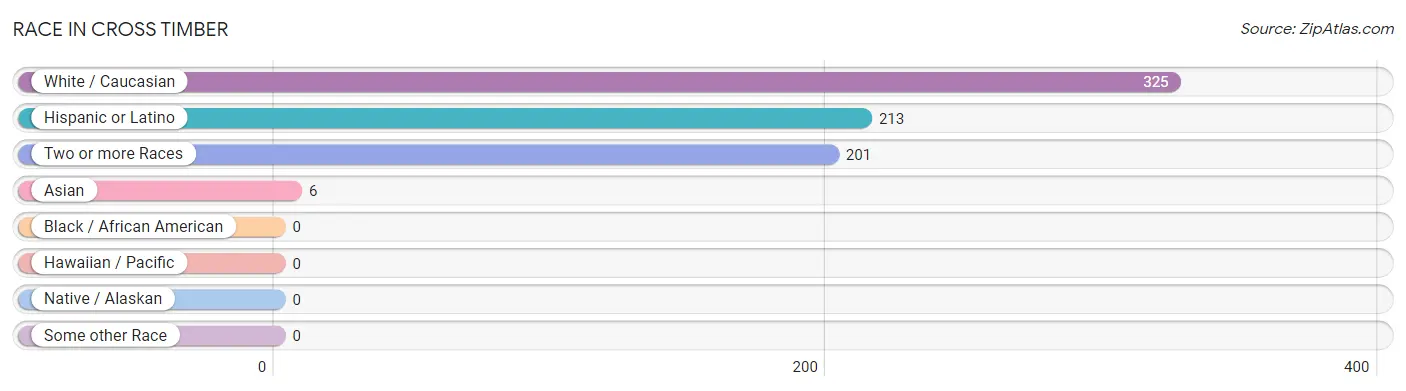
Race in Cross Timber
The most populous races in Cross Timber are White / Caucasian (325 | 61.1%), Hispanic or Latino (213 | 40.0%), and Two or more Races (201 | 37.8%).
| Race | # Population | % Population |
| Asian | 6 | 1.1% |
| Black / African American | 0 | 0.0% |
| Hawaiian / Pacific | 0 | 0.0% |
| Hispanic or Latino | 213 | 40.0% |
| Native / Alaskan | 0 | 0.0% |
| White / Caucasian | 325 | 61.1% |
| Two or more Races | 201 | 37.8% |
| Some other Race | 0 | 0.0% |
| Total | 532 | 100.0% |
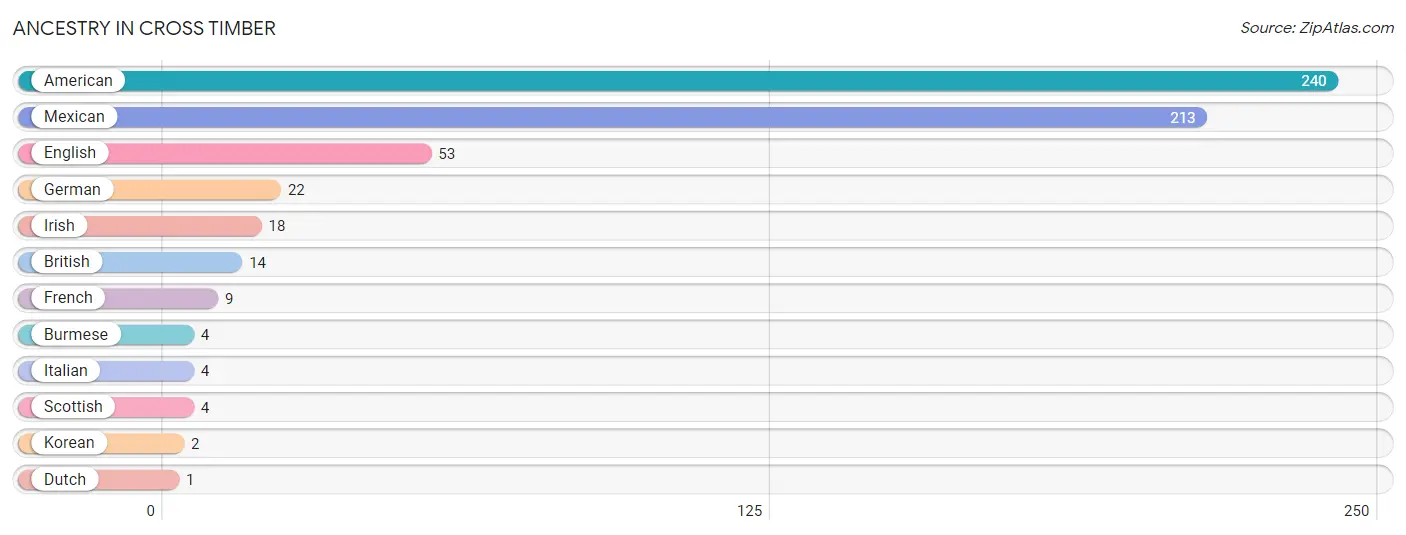
Ancestry in Cross Timber
The most populous ancestries reported in Cross Timber are American (240 | 45.1%), Mexican (213 | 40.0%), English (53 | 10.0%), German (22 | 4.1%), and Irish (18 | 3.4%), together accounting for 102.6% of all Cross Timber residents.
| Ancestry | # Population | % Population |
| American | 240 | 45.1% |
| British | 14 | 2.6% |
| Burmese | 4 | 0.7% |
| Dutch | 1 | 0.2% |
| English | 53 | 10.0% |
| French | 9 | 1.7% |
| German | 22 | 4.1% |
| Irish | 18 | 3.4% |
| Italian | 4 | 0.7% |
| Korean | 2 | 0.4% |
| Mexican | 213 | 40.0% |
| Scottish | 4 | 0.7% | View All 12 Rows |
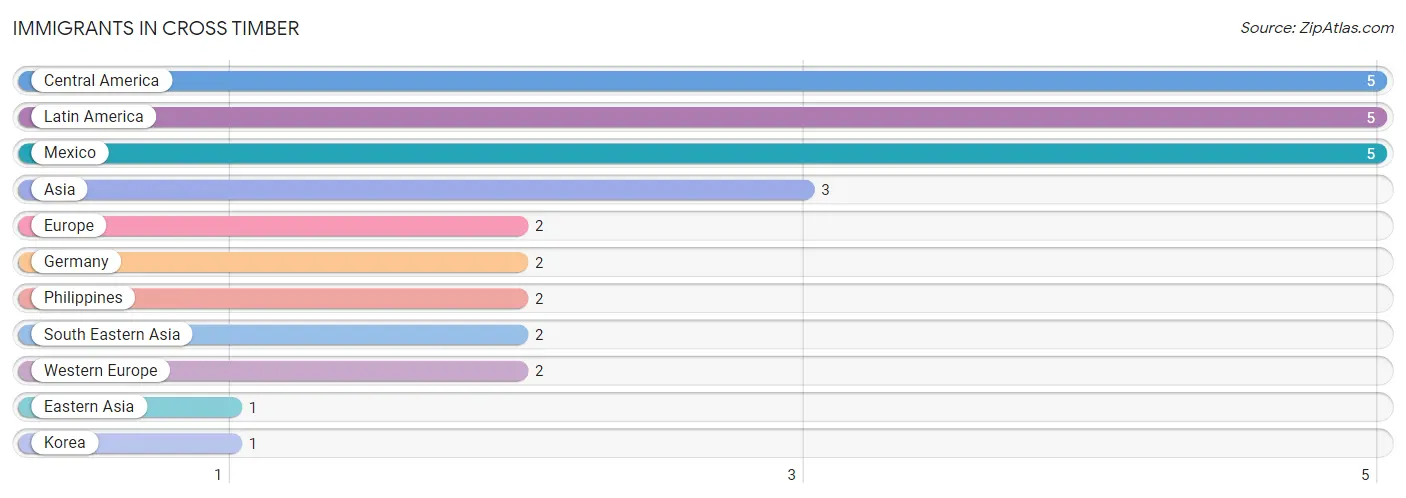
Immigrants in Cross Timber
The most numerous immigrant groups reported in Cross Timber came from Central America (5 | 0.9%), Latin America (5 | 0.9%), Mexico (5 | 0.9%), Asia (3 | 0.6%), and Europe (2 | 0.4%), together accounting for 3.8% of all Cross Timber residents.
| Immigration Origin | # Population | % Population |
| Asia | 3 | 0.6% |
| Central America | 5 | 0.9% |
| Eastern Asia | 1 | 0.2% |
| Europe | 2 | 0.4% |
| Germany | 2 | 0.4% |
| Korea | 1 | 0.2% |
| Latin America | 5 | 0.9% |
| Mexico | 5 | 0.9% |
| Philippines | 2 | 0.4% |
| South Eastern Asia | 2 | 0.4% |
| Western Europe | 2 | 0.4% | View All 11 Rows |
Sex and Age in Cross Timber
Sex and Age in Cross Timber
The most populous age groups in Cross Timber are 35 to 39 Years (22 | 15.8%) for men and 5 to 9 Years (142 | 36.1%) for women.
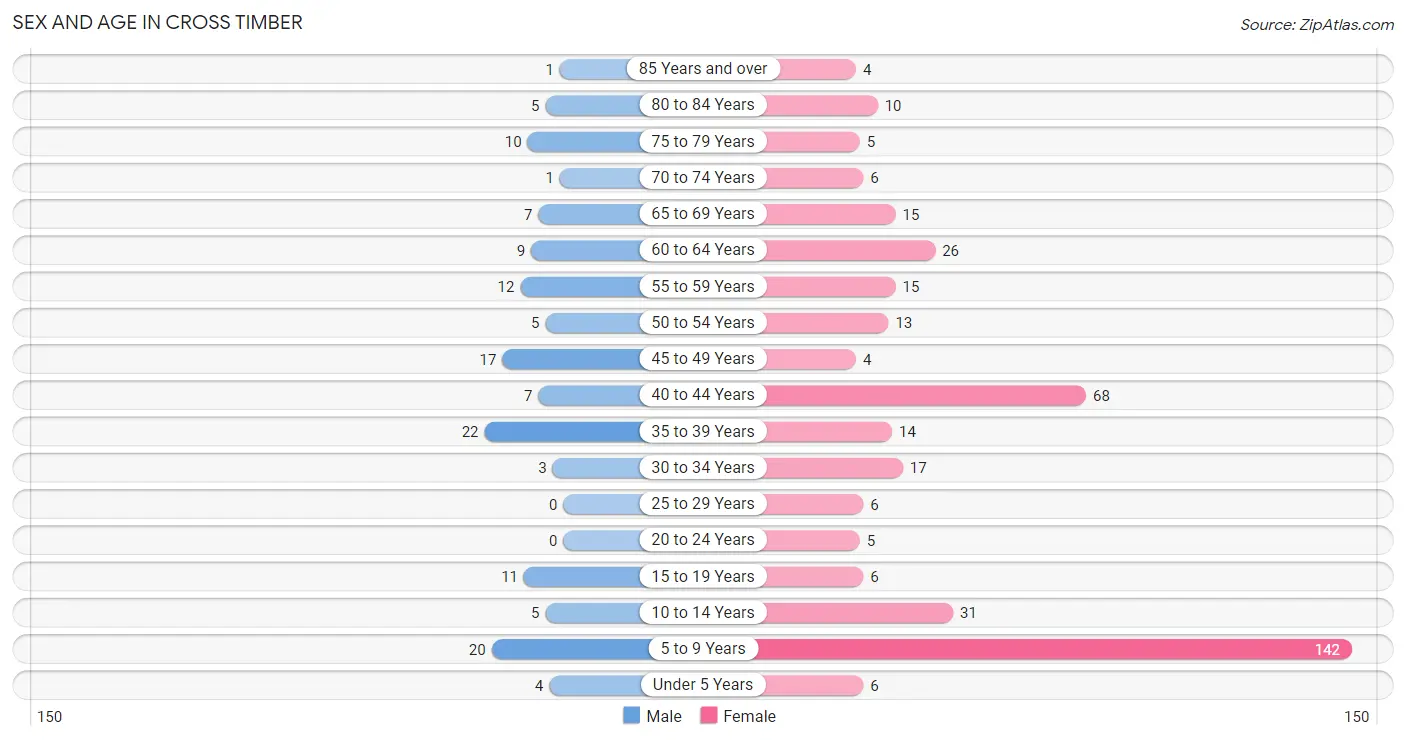
| Age Bracket | Male | Female |
| Under 5 Years | 4 (2.9%) | 6 (1.5%) |
| 5 to 9 Years | 20 (14.4%) | 142 (36.1%) |
| 10 to 14 Years | 5 (3.6%) | 31 (7.9%) |
| 15 to 19 Years | 11 (7.9%) | 6 (1.5%) |
| 20 to 24 Years | 0 (0.0%) | 5 (1.3%) |
| 25 to 29 Years | 0 (0.0%) | 6 (1.5%) |
| 30 to 34 Years | 3 (2.2%) | 17 (4.3%) |
| 35 to 39 Years | 22 (15.8%) | 14 (3.6%) |
| 40 to 44 Years | 7 (5.0%) | 68 (17.3%) |
| 45 to 49 Years | 17 (12.2%) | 4 (1.0%) |
| 50 to 54 Years | 5 (3.6%) | 13 (3.3%) |
| 55 to 59 Years | 12 (8.6%) | 15 (3.8%) |
| 60 to 64 Years | 9 (6.5%) | 26 (6.6%) |
| 65 to 69 Years | 7 (5.0%) | 15 (3.8%) |
| 70 to 74 Years | 1 (0.7%) | 6 (1.5%) |
| 75 to 79 Years | 10 (7.2%) | 5 (1.3%) |
| 80 to 84 Years | 5 (3.6%) | 10 (2.5%) |
| 85 Years and over | 1 (0.7%) | 4 (1.0%) |
| Total | 139 (100.0%) | 393 (100.0%) |
Families and Households in Cross Timber
Median Family Size in Cross Timber
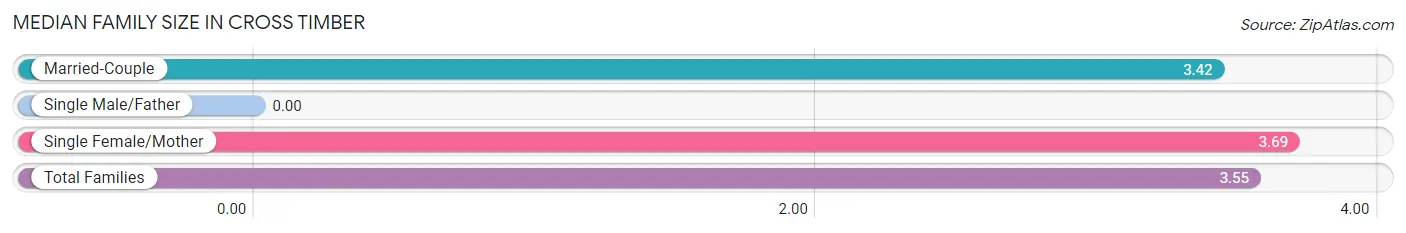
| Family Type | # Families | Family Size |
| Married-Couple | 72 (51.4%) | 3.42 |
| Single Male/Father | 0 (0.0%) | - |
| Single Female/Mother | 68 (48.6%) | 3.69 |
| Total Families | 140 (100.0%) | 3.55 |
Median Household Size in Cross Timber
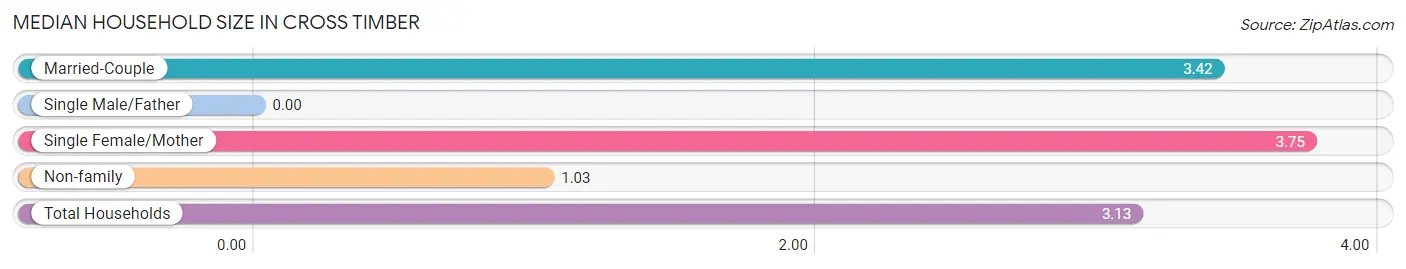
| Household Type | # Households | Household Size |
| Married-Couple | 72 (42.3%) | 3.42 |
| Single Male/Father | 0 (0.0%) | - |
| Single Female/Mother | 68 (40.0%) | 3.75 |
| Non-family | 30 (17.6%) | 1.03 |
| Total Households | 170 (100.0%) | 3.13 |
Household Size by Marriage Status in Cross Timber
Out of a total of 170 households in Cross Timber, 140 (82.4%) are family households, while 30 (17.6%) are nonfamily households. The most numerous type of family households are 3-person households, comprising 62, and the most common type of nonfamily households are 1-person households, comprising 28.
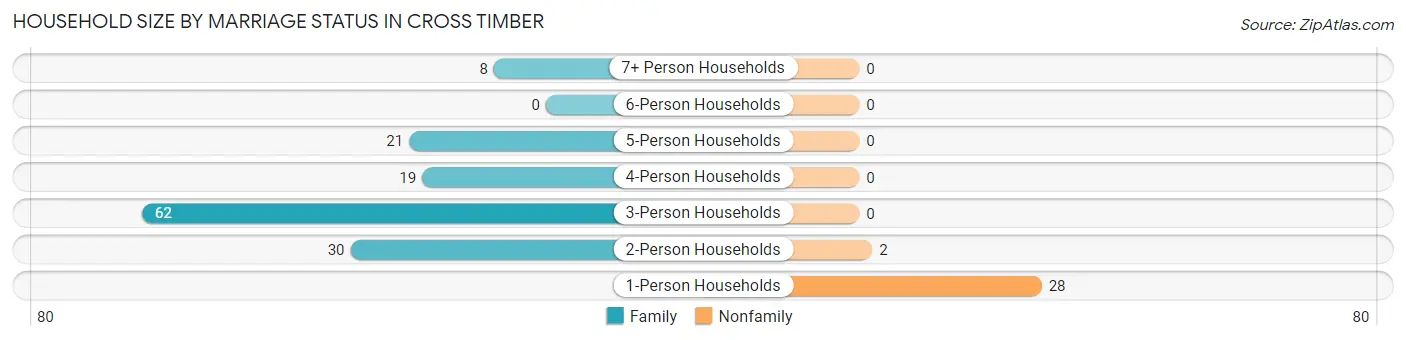
| Household Size | Family Households | Nonfamily Households |
| 1-Person Households | - | 28 (16.5%) |
| 2-Person Households | 30 (17.6%) | 2 (1.2%) |
| 3-Person Households | 62 (36.5%) | 0 (0.0%) |
| 4-Person Households | 19 (11.2%) | 0 (0.0%) |
| 5-Person Households | 21 (12.3%) | 0 (0.0%) |
| 6-Person Households | 0 (0.0%) | 0 (0.0%) |
| 7+ Person Households | 8 (4.7%) | 0 (0.0%) |
| Total | 140 (82.4%) | 30 (17.6%) |
Female Fertility in Cross Timber
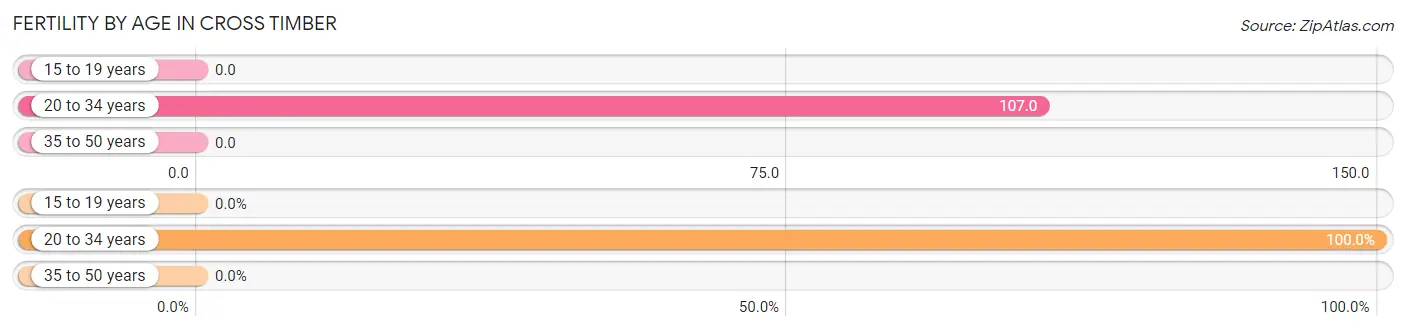
Fertility by Age in Cross Timber
Average fertility rate in Cross Timber is 24.0 births per 1,000 women. Women in the age bracket of 20 to 34 years have the highest fertility rate with 107.0 births per 1,000 women. Women in the age bracket of 20 to 34 years acount for 100.0% of all women with births.
| Age Bracket | Women with Births | Births / 1,000 Women |
| 15 to 19 years | 0 (0.0%) | 0.0 |
| 20 to 34 years | 3 (100.0%) | 107.0 |
| 35 to 50 years | 0 (0.0%) | 0.0 |
| Total | 3 (100.0%) | 24.0 |
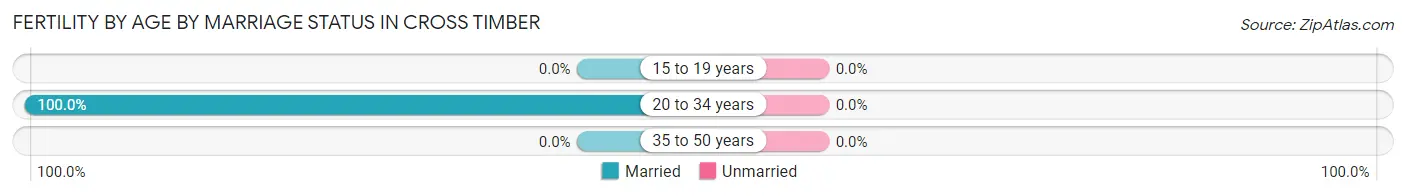
Fertility by Age by Marriage Status in Cross Timber
| Age Bracket | Married | Unmarried |
| 15 to 19 years | 0 (0.0%) | 0 (0.0%) |
| 20 to 34 years | 3 (100.0%) | 0 (0.0%) |
| 35 to 50 years | 0 (0.0%) | 0 (0.0%) |
| Total | 3 (100.0%) | 0 (0.0%) |
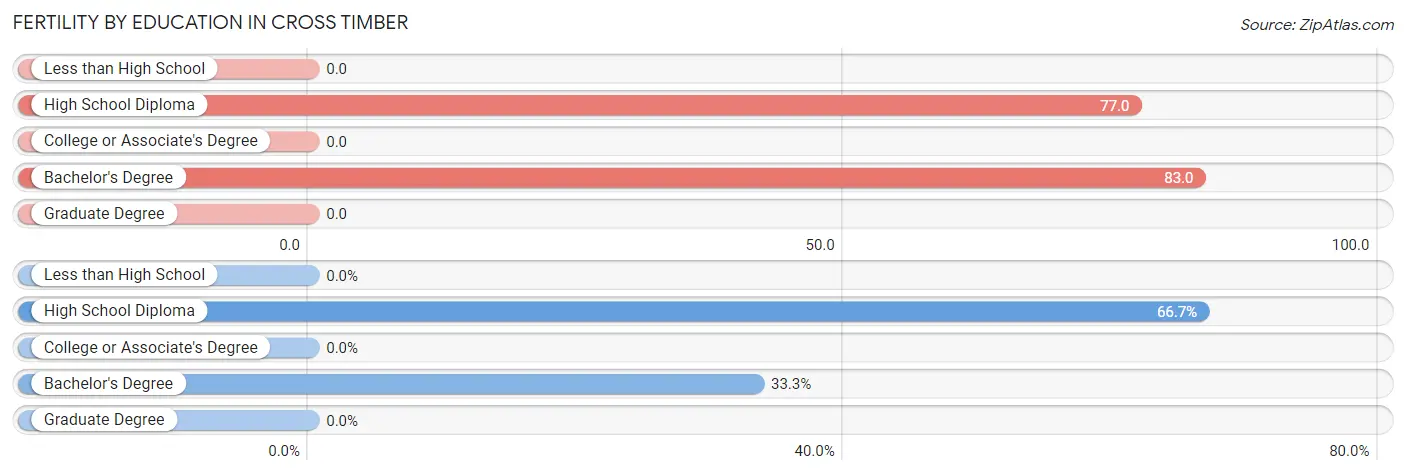
Fertility by Education in Cross Timber
| Educational Attainment | Women with Births | Births / 1,000 Women |
| Less than High School | 0 (0.0%) | 0.0 |
| High School Diploma | 2 (66.7%) | 77.0 |
| College or Associate's Degree | 0 (0.0%) | 0.0 |
| Bachelor's Degree | 1 (33.3%) | 83.0 |
| Graduate Degree | 0 (0.0%) | 0.0 |
| Total | 3 (100.0%) | 24.0 |
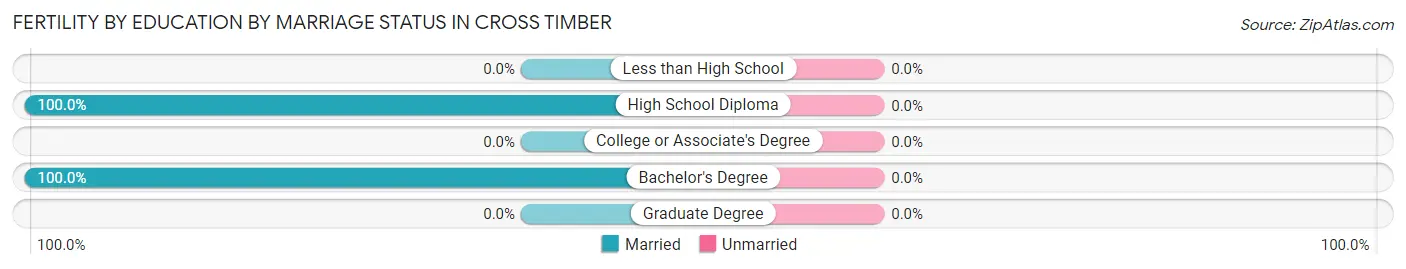
Fertility by Education by Marriage Status in Cross Timber
| Educational Attainment | Married | Unmarried |
| Less than High School | 0 (0.0%) | 0 (0.0%) |
| High School Diploma | 2 (100.0%) | 0 (0.0%) |
| College or Associate's Degree | 0 (0.0%) | 0 (0.0%) |
| Bachelor's Degree | 1 (100.0%) | 0 (0.0%) |
| Graduate Degree | 0 (0.0%) | 0 (0.0%) |
| Total | 3 (100.0%) | 0 (0.0%) |
Income in Cross Timber
Income Overview in Cross Timber
Per Capita Income in Cross Timber is $23,977, while median incomes of families and households are $43,333 and $41,136 respectively.
| Characteristic | Number | Measure |
| Per Capita Income | 532 | $23,977 |
| Median Family Income | 140 | $43,333 |
| Mean Family Income | 140 | $82,614 |
| Median Household Income | 170 | $41,136 |
| Mean Household Income | 170 | $75,342 |
| Income Deficit | 140 | $0 |
| Wage / Income Gap (%) | 532 | 83.18% |
| Wage / Income Gap ($) | 532 | 16.82¢ per $1 |
| Gini / Inequality Index | 532 | 0.56 |
Earnings by Sex in Cross Timber
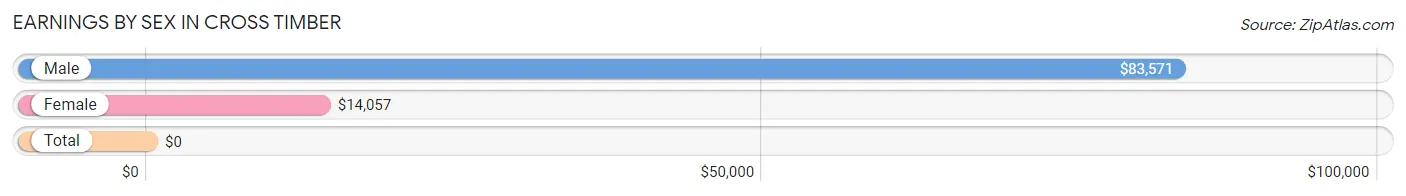
| Sex | Number | Average Earnings |
| Male | 68 (31.9%) | $83,571 |
| Female | 145 (68.1%) | $14,057 |
| Total | 213 (100.0%) | $0 |
Earnings by Sex by Income Bracket in Cross Timber
The most common earnings brackets in Cross Timber are $100,000+ for men (25 | 36.8%) and $12,500 to $14,999 for women (57 | 39.3%).
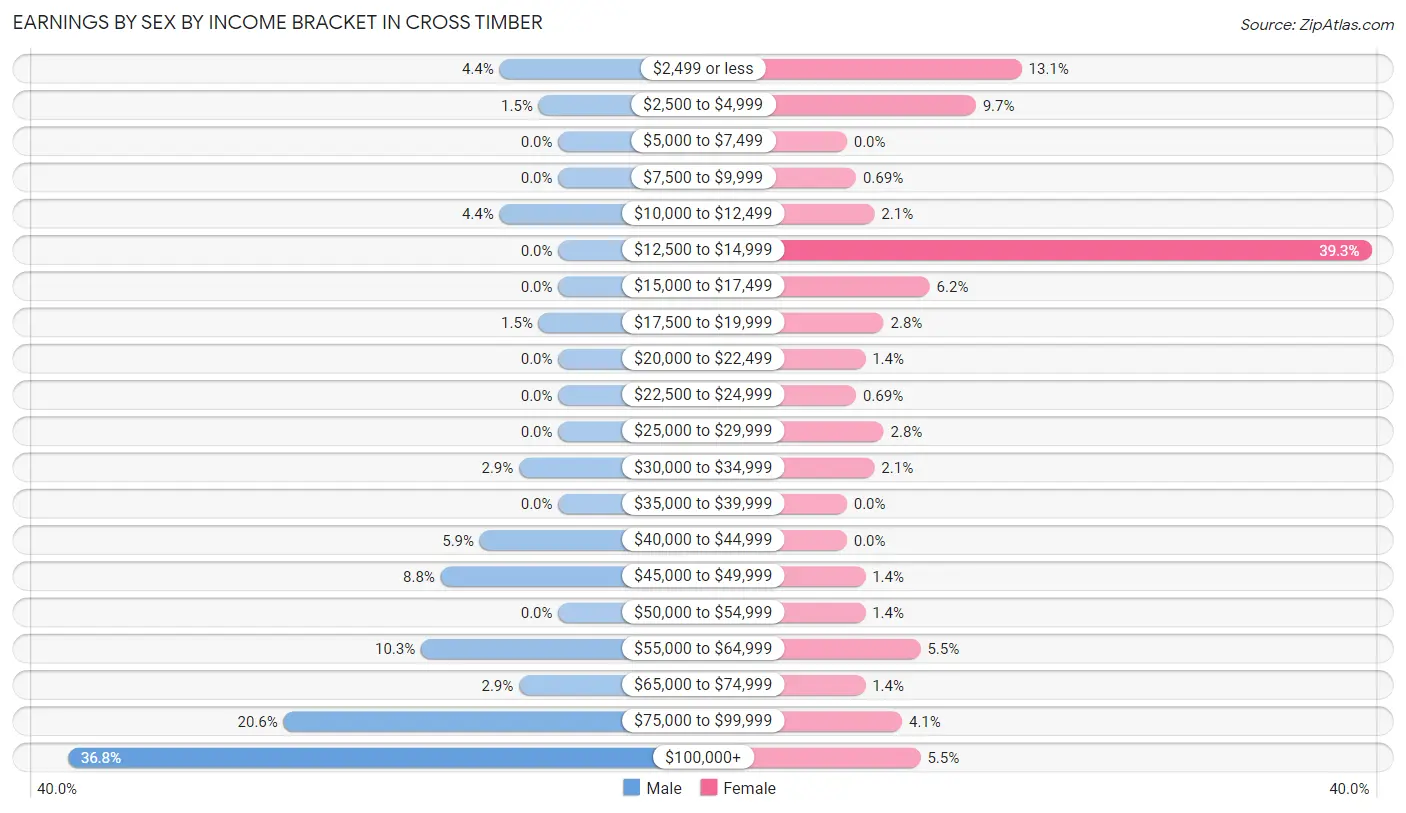
| Income | Male | Female |
| $2,499 or less | 3 (4.4%) | 19 (13.1%) |
| $2,500 to $4,999 | 1 (1.5%) | 14 (9.7%) |
| $5,000 to $7,499 | 0 (0.0%) | 0 (0.0%) |
| $7,500 to $9,999 | 0 (0.0%) | 1 (0.7%) |
| $10,000 to $12,499 | 3 (4.4%) | 3 (2.1%) |
| $12,500 to $14,999 | 0 (0.0%) | 57 (39.3%) |
| $15,000 to $17,499 | 0 (0.0%) | 9 (6.2%) |
| $17,500 to $19,999 | 1 (1.5%) | 4 (2.8%) |
| $20,000 to $22,499 | 0 (0.0%) | 2 (1.4%) |
| $22,500 to $24,999 | 0 (0.0%) | 1 (0.7%) |
| $25,000 to $29,999 | 0 (0.0%) | 4 (2.8%) |
| $30,000 to $34,999 | 2 (2.9%) | 3 (2.1%) |
| $35,000 to $39,999 | 0 (0.0%) | 0 (0.0%) |
| $40,000 to $44,999 | 4 (5.9%) | 0 (0.0%) |
| $45,000 to $49,999 | 6 (8.8%) | 2 (1.4%) |
| $50,000 to $54,999 | 0 (0.0%) | 2 (1.4%) |
| $55,000 to $64,999 | 7 (10.3%) | 8 (5.5%) |
| $65,000 to $74,999 | 2 (2.9%) | 2 (1.4%) |
| $75,000 to $99,999 | 14 (20.6%) | 6 (4.1%) |
| $100,000+ | 25 (36.8%) | 8 (5.5%) |
| Total | 68 (100.0%) | 145 (100.0%) |
Earnings by Sex by Educational Attainment in Cross Timber
Average earnings in Cross Timber are $84,107 for men and $14,035 for women, a difference of 83.3%. Men with an educational attainment of bachelor's degree enjoy the highest average annual earnings of $142,917, while those with high school diploma education earn the least with $45,833. Women with an educational attainment of graduate degree earn the most with the average annual earnings of $56,667, while those with college or associate's degree education have the smallest earnings of $13,773.
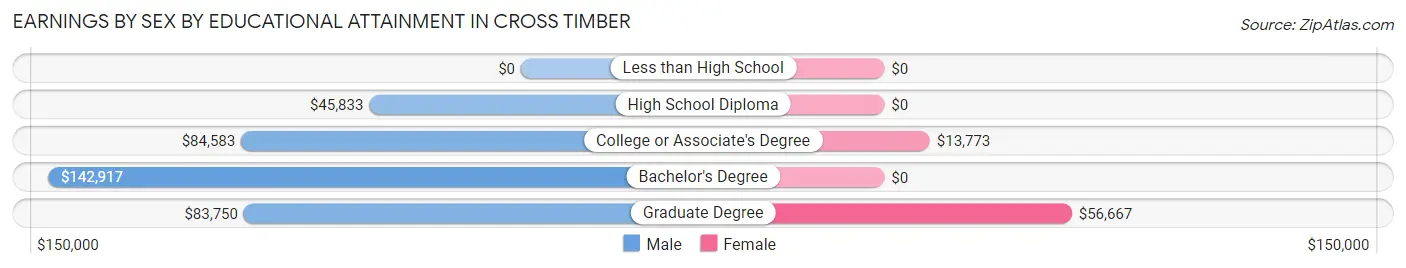
| Educational Attainment | Male Income | Female Income |
| Less than High School | - | - |
| High School Diploma | $45,833 | $0 |
| College or Associate's Degree | $84,583 | $13,773 |
| Bachelor's Degree | $142,917 | $0 |
| Graduate Degree | $83,750 | $56,667 |
| Total | $84,107 | $14,035 |
Family Income in Cross Timber
Family Income Brackets in Cross Timber
According to the Cross Timber family income data, there are 54 families falling into the $10,000 to $14,999 income range, which is the most common income bracket and makes up 38.6% of all families.
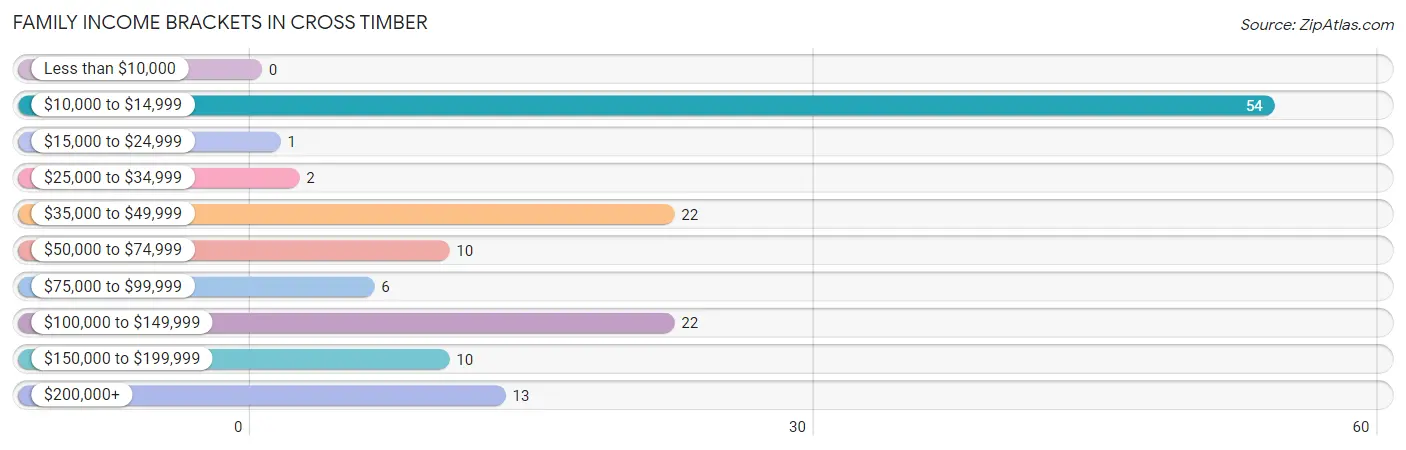
| Income Bracket | # Families | % Families |
| Less than $10,000 | 0 | 0.0% |
| $10,000 to $14,999 | 54 | 38.6% |
| $15,000 to $24,999 | 1 | 0.7% |
| $25,000 to $34,999 | 2 | 1.4% |
| $35,000 to $49,999 | 22 | 15.7% |
| $50,000 to $74,999 | 10 | 7.1% |
| $75,000 to $99,999 | 6 | 4.3% |
| $100,000 to $149,999 | 22 | 15.7% |
| $150,000 to $199,999 | 10 | 7.1% |
| $200,000+ | 13 | 9.3% |
Family Income by Famaliy Size in Cross Timber
7+ person families (8 | 5.7%) account for the highest median family income in Cross Timber with $250,001 per family, while 4-person families (17 | 12.1%) have the highest median income of $36,094 per family member.
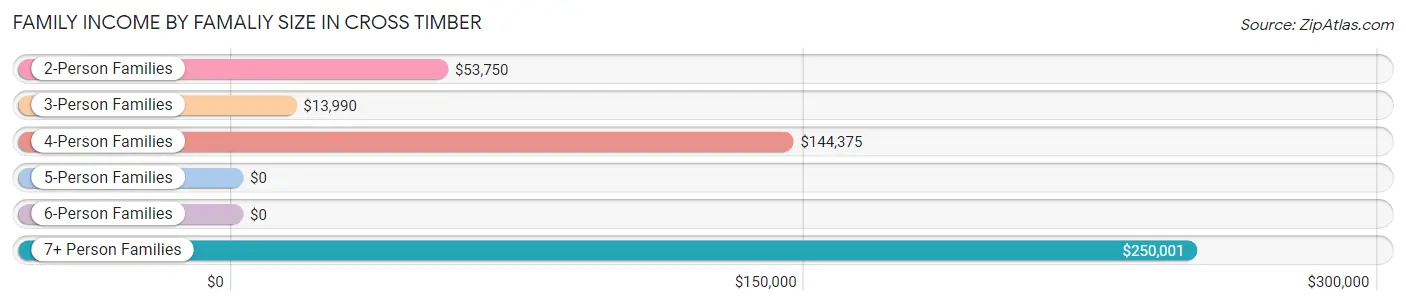
| Income Bracket | # Families | Median Income |
| 2-Person Families | 32 (22.9%) | $53,750 |
| 3-Person Families | 62 (44.3%) | $13,990 |
| 4-Person Families | 17 (12.1%) | $144,375 |
| 5-Person Families | 21 (15.0%) | $0 |
| 6-Person Families | 0 (0.0%) | $0 |
| 7+ Person Families | 8 (5.7%) | $250,001 |
| Total | 140 (100.0%) | $43,333 |
Family Income by Number of Earners in Cross Timber
The median family income in Cross Timber is $43,333, with families comprising 3+ earners (8) having the highest median family income of $250,001, while families with 1 earner (69) have the lowest median family income of $14,097, accounting for 5.7% and 49.3% of families, respectively.
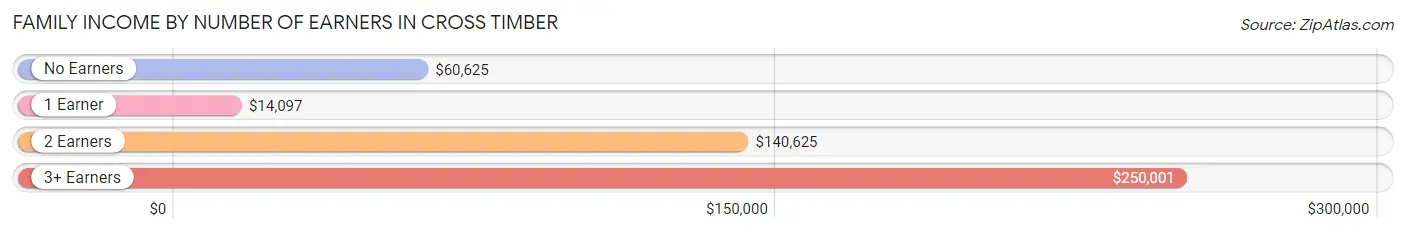
| Number of Earners | # Families | Median Income |
| No Earners | 15 (10.7%) | $60,625 |
| 1 Earner | 69 (49.3%) | $14,097 |
| 2 Earners | 48 (34.3%) | $140,625 |
| 3+ Earners | 8 (5.7%) | $250,001 |
| Total | 140 (100.0%) | $43,333 |
Household Income in Cross Timber
Household Income Brackets in Cross Timber
With 68 households falling in the category, the $10,000 to $14,999 income range is the most frequent in Cross Timber, accounting for 40.0% of all households.
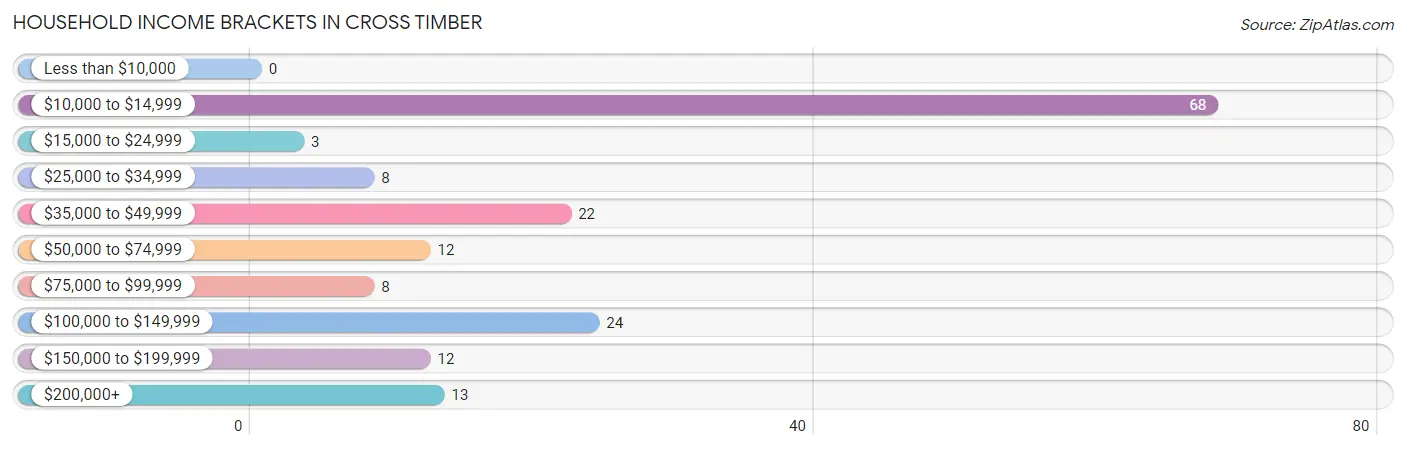
| Income Bracket | # Households | % Households |
| Less than $10,000 | 0 | 0.0% |
| $10,000 to $14,999 | 68 | 40.0% |
| $15,000 to $24,999 | 3 | 1.8% |
| $25,000 to $34,999 | 8 | 4.7% |
| $35,000 to $49,999 | 22 | 12.9% |
| $50,000 to $74,999 | 12 | 7.1% |
| $75,000 to $99,999 | 8 | 4.7% |
| $100,000 to $149,999 | 24 | 14.1% |
| $150,000 to $199,999 | 12 | 7.1% |
| $200,000+ | 13 | 7.6% |
Household Income by Householder Age in Cross Timber
The median household income in Cross Timber is $41,136, with the highest median household income of $62,500 found in the 65+ years age bracket for the primary householder. A total of 28 households (16.5%) fall into this category.
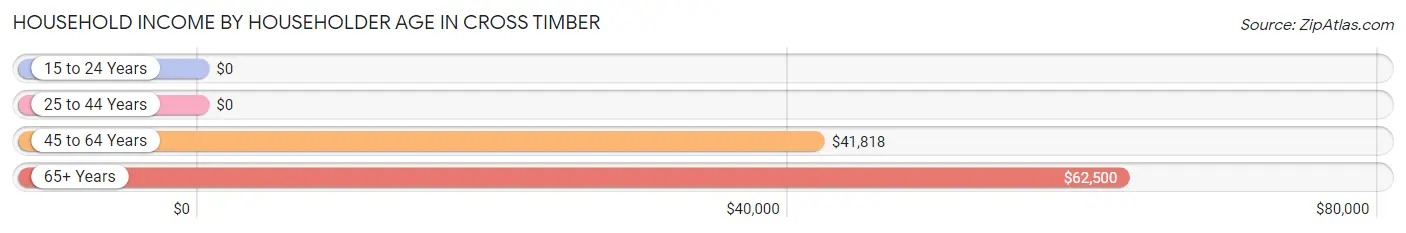
| Income Bracket | # Households | Median Income |
| 15 to 24 Years | 0 (0.0%) | $0 |
| 25 to 44 Years | 86 (50.6%) | $0 |
| 45 to 64 Years | 56 (32.9%) | $41,818 |
| 65+ Years | 28 (16.5%) | $62,500 |
| Total | 170 (100.0%) | $41,136 |
Poverty in Cross Timber
Income Below Poverty by Sex and Age in Cross Timber
With 2.2% poverty level for males and 48.6% for females among the residents of Cross Timber, 55 to 64 year old males and 6 to 11 year old females are the most vulnerable to poverty, with 3 males (14.3%) and 120 females (72.7%) in their respective age groups living below the poverty level.
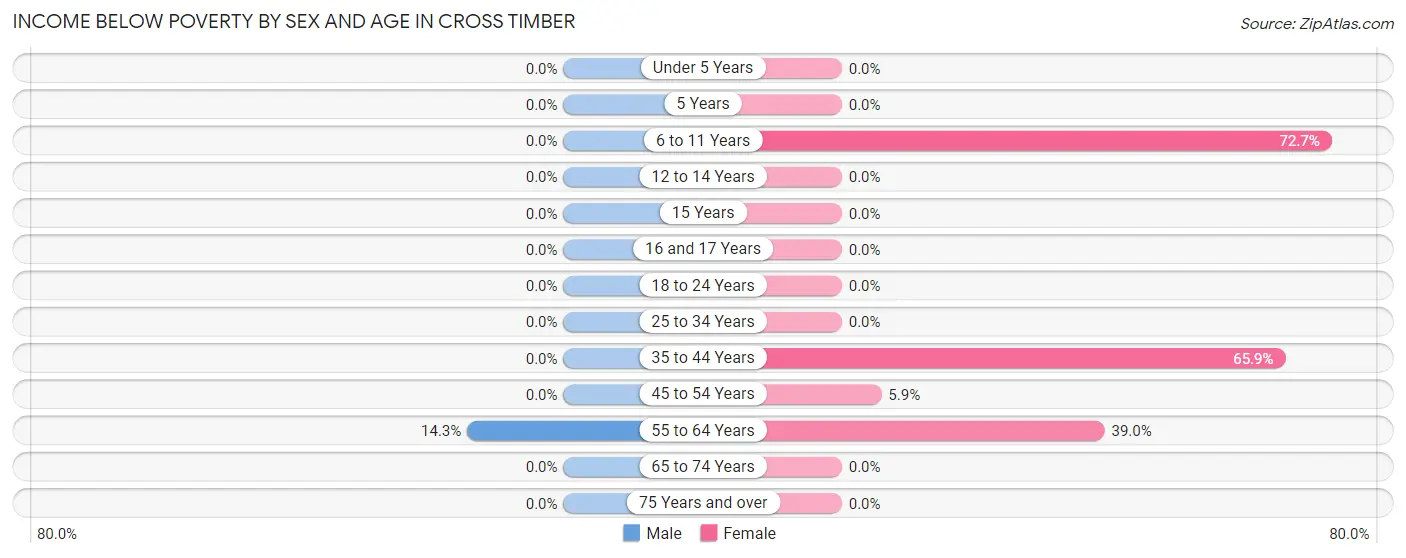
| Age Bracket | Male | Female |
| Under 5 Years | 0 (0.0%) | 0 (0.0%) |
| 5 Years | 0 (0.0%) | 0 (0.0%) |
| 6 to 11 Years | 0 (0.0%) | 120 (72.7%) |
| 12 to 14 Years | 0 (0.0%) | 0 (0.0%) |
| 15 Years | 0 (0.0%) | 0 (0.0%) |
| 16 and 17 Years | 0 (0.0%) | 0 (0.0%) |
| 18 to 24 Years | 0 (0.0%) | 0 (0.0%) |
| 25 to 34 Years | 0 (0.0%) | 0 (0.0%) |
| 35 to 44 Years | 0 (0.0%) | 54 (65.8%) |
| 45 to 54 Years | 0 (0.0%) | 1 (5.9%) |
| 55 to 64 Years | 3 (14.3%) | 16 (39.0%) |
| 65 to 74 Years | 0 (0.0%) | 0 (0.0%) |
| 75 Years and over | 0 (0.0%) | 0 (0.0%) |
| Total | 3 (2.2%) | 191 (48.6%) |
Income Above Poverty by Sex and Age in Cross Timber
According to the poverty statistics in Cross Timber, males aged under 5 years and females aged under 5 years are the age groups that are most secure financially, with 100.0% of males and 100.0% of females in these age groups living above the poverty line.
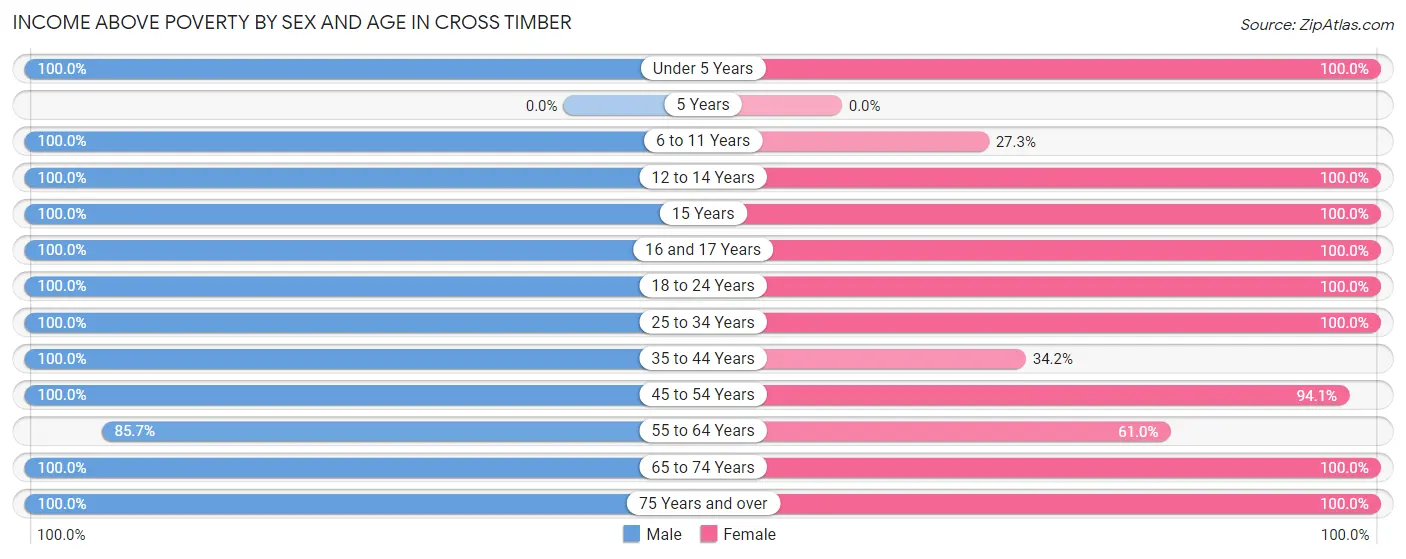
| Age Bracket | Male | Female |
| Under 5 Years | 2 (100.0%) | 6 (100.0%) |
| 5 Years | 0 (0.0%) | 0 (0.0%) |
| 6 to 11 Years | 20 (100.0%) | 45 (27.3%) |
| 12 to 14 Years | 5 (100.0%) | 8 (100.0%) |
| 15 Years | 3 (100.0%) | 2 (100.0%) |
| 16 and 17 Years | 3 (100.0%) | 4 (100.0%) |
| 18 to 24 Years | 5 (100.0%) | 5 (100.0%) |
| 25 to 34 Years | 3 (100.0%) | 23 (100.0%) |
| 35 to 44 Years | 29 (100.0%) | 28 (34.2%) |
| 45 to 54 Years | 22 (100.0%) | 16 (94.1%) |
| 55 to 64 Years | 18 (85.7%) | 25 (61.0%) |
| 65 to 74 Years | 8 (100.0%) | 21 (100.0%) |
| 75 Years and over | 16 (100.0%) | 19 (100.0%) |
| Total | 134 (97.8%) | 202 (51.4%) |
Income Below Poverty Among Married-Couple Families in Cross Timber
The poverty statistics for married-couple families in Cross Timber show that 1.4% or 1 of the total 72 families live below the poverty line. Families with no children have the highest poverty rate of 3.0%, comprising of 1 families. On the other hand, families with 1 or 2 children have the lowest poverty rate of 0.0%, which includes 0 families.
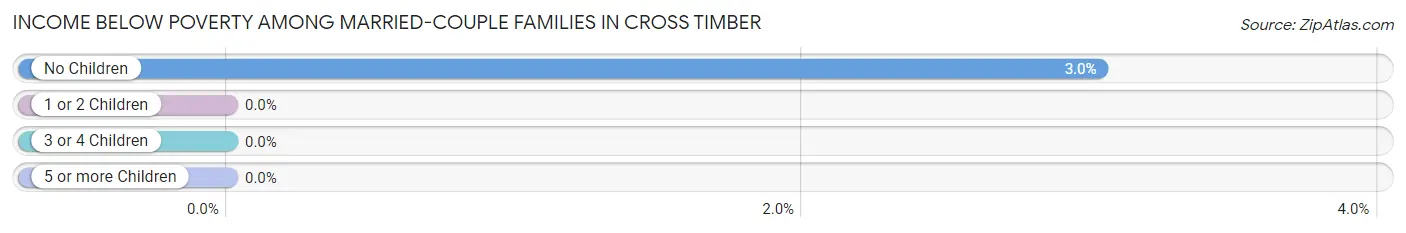
| Children | Above Poverty | Below Poverty |
| No Children | 32 (97.0%) | 1 (3.0%) |
| 1 or 2 Children | 29 (100.0%) | 0 (0.0%) |
| 3 or 4 Children | 10 (100.0%) | 0 (0.0%) |
| 5 or more Children | 0 (0.0%) | 0 (0.0%) |
| Total | 71 (98.6%) | 1 (1.4%) |
Income Below Poverty Among Single-Parent Households in Cross Timber
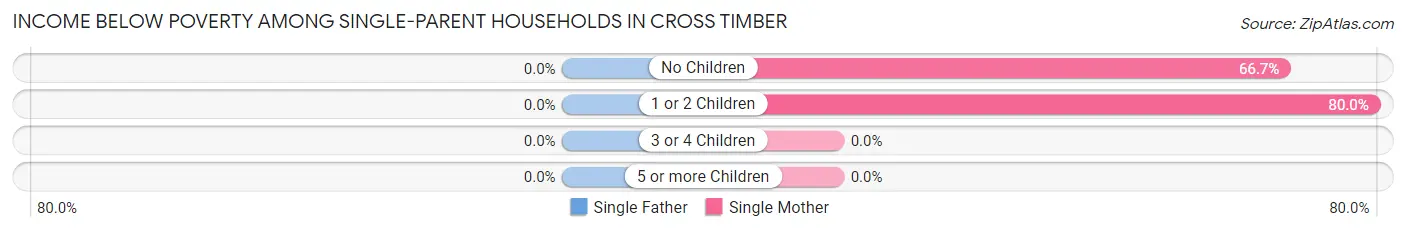
| Children | Single Father | Single Mother |
| No Children | 0 (0.0%) | 2 (66.7%) |
| 1 or 2 Children | 0 (0.0%) | 52 (80.0%) |
| 3 or 4 Children | 0 (0.0%) | 0 (0.0%) |
| 5 or more Children | 0 (0.0%) | 0 (0.0%) |
| Total | 0 (0.0%) | 54 (79.4%) |
Income Below Poverty Among Married-Couple vs Single-Parent Households in Cross Timber
The poverty data for Cross Timber shows that 1 of the married-couple family households (1.4%) and 54 of the single-parent households (79.4%) are living below the poverty level. Within the married-couple family households, those with no children have the highest poverty rate, with 1 households (3.0%) falling below the poverty line. Among the single-parent households, those with 1 or 2 children have the highest poverty rate, with 52 household (80.0%) living below poverty.
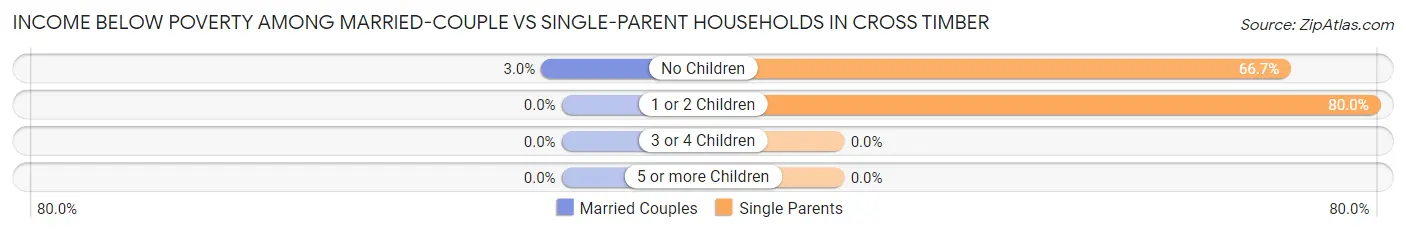
| Children | Married-Couple Families | Single-Parent Households |
| No Children | 1 (3.0%) | 2 (66.7%) |
| 1 or 2 Children | 0 (0.0%) | 52 (80.0%) |
| 3 or 4 Children | 0 (0.0%) | 0 (0.0%) |
| 5 or more Children | 0 (0.0%) | 0 (0.0%) |
| Total | 1 (1.4%) | 54 (79.4%) |
Employment Characteristics in Cross Timber
Employment by Class of Employer in Cross Timber
Among the 177 employed individuals in Cross Timber, not-for-profit organizations (70 | 39.6%), private company employees (60 | 33.9%), and self-employed (not incorporated) (17 | 9.6%) make up the most common classes of employment.
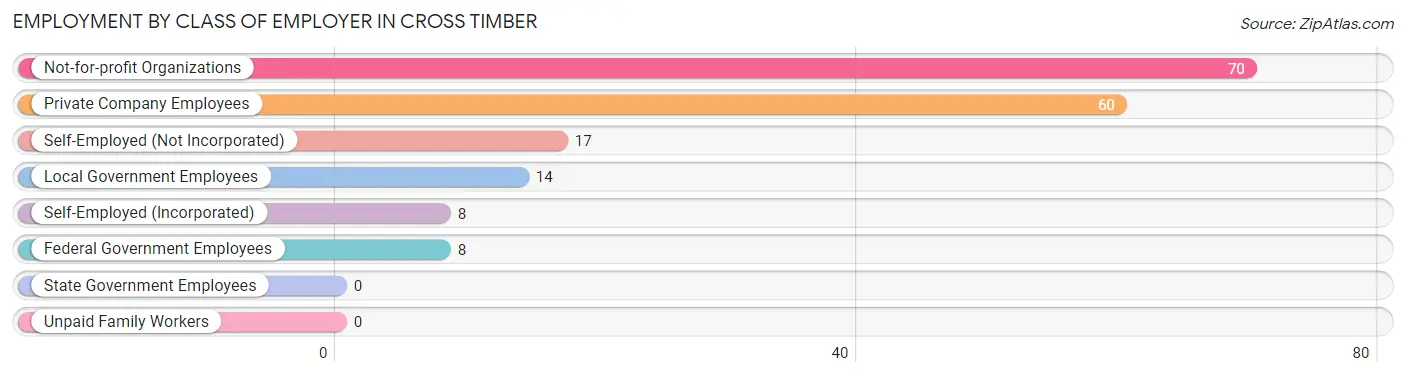
| Employer Class | # Employees | % Employees |
| Private Company Employees | 60 | 33.9% |
| Self-Employed (Incorporated) | 8 | 4.5% |
| Self-Employed (Not Incorporated) | 17 | 9.6% |
| Not-for-profit Organizations | 70 | 39.6% |
| Local Government Employees | 14 | 7.9% |
| State Government Employees | 0 | 0.0% |
| Federal Government Employees | 8 | 4.5% |
| Unpaid Family Workers | 0 | 0.0% |
| Total | 177 | 100.0% |
Employment Status by Age in Cross Timber
According to the labor force statistics for Cross Timber, out of the total population over 16 years of age (319), 64.6% or 206 individuals are in the labor force, with 14.4% or 30 of them unemployed. The age group with the highest labor force participation rate is 20 to 24 years, with 100.0% or 5 individuals in the labor force. Within the labor force, the 30 to 34 years age range has the highest percentage of unemployed individuals, with 68.4% or 13 of them being unemployed.
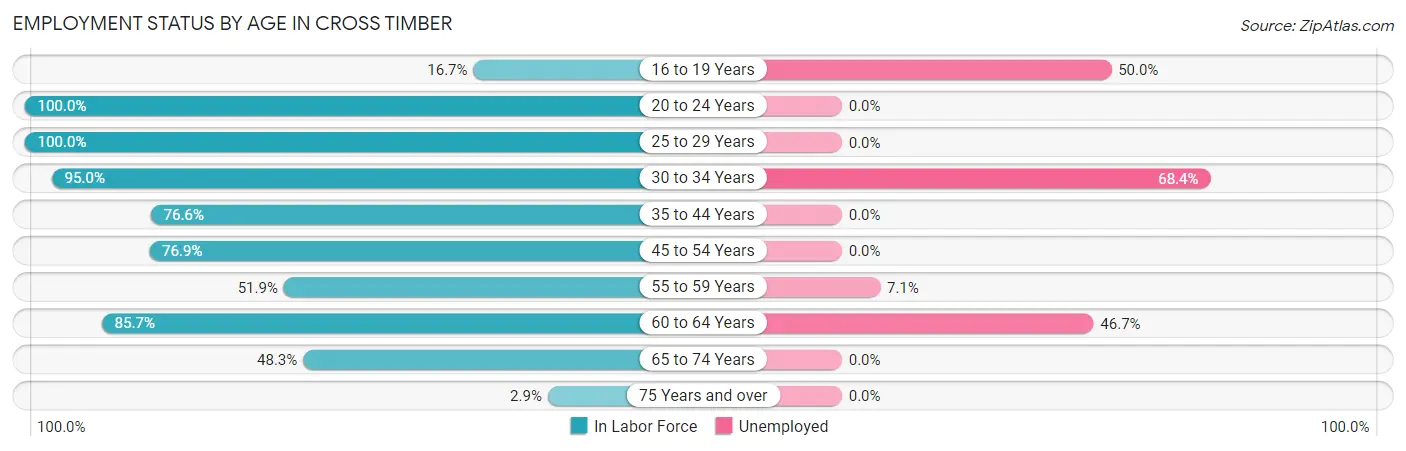
| Age Bracket | In Labor Force | Unemployed |
| 16 to 19 Years | 2 (16.7%) | 1 (50.0%) |
| 20 to 24 Years | 5 (100.0%) | 0 (0.0%) |
| 25 to 29 Years | 6 (100.0%) | 0 (0.0%) |
| 30 to 34 Years | 19 (95.0%) | 13 (68.4%) |
| 35 to 44 Years | 85 (76.6%) | 0 (0.0%) |
| 45 to 54 Years | 30 (76.9%) | 0 (0.0%) |
| 55 to 59 Years | 14 (51.9%) | 1 (7.1%) |
| 60 to 64 Years | 30 (85.7%) | 14 (46.7%) |
| 65 to 74 Years | 14 (48.3%) | 0 (0.0%) |
| 75 Years and over | 1 (2.9%) | 0 (0.0%) |
| Total | 206 (64.6%) | 30 (14.4%) |
Employment Status by Educational Attainment in Cross Timber
According to labor force statistics for Cross Timber, 77.3% of individuals (184) out of the total population between 25 and 64 years of age (238) are in the labor force, with 15.6% or 29 of them being unemployed. The group with the highest labor force participation rate are those with the educational attainment of less than high school, with 100.0% or 2 individuals in the labor force. Within the labor force, individuals with high school diploma education have the highest percentage of unemployment, with 35.0% or 14 of them being unemployed.
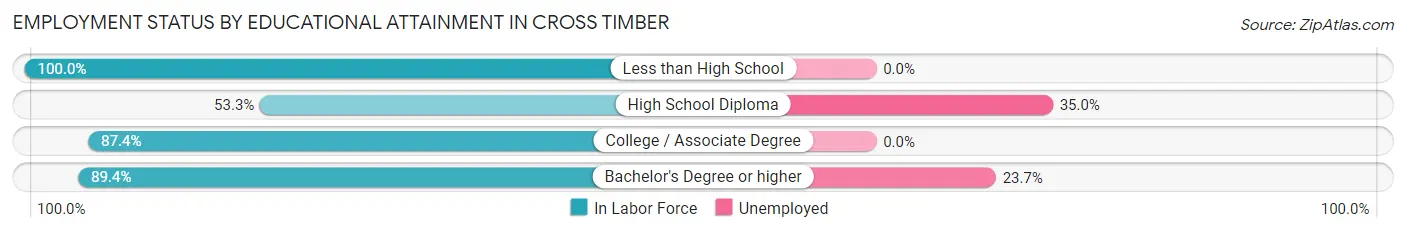
| Educational Attainment | In Labor Force | Unemployed |
| Less than High School | 2 (100.0%) | 0 (0.0%) |
| High School Diploma | 40 (53.3%) | 26 (35.0%) |
| College / Associate Degree | 83 (87.4%) | 0 (0.0%) |
| Bachelor's Degree or higher | 59 (89.4%) | 16 (23.7%) |
| Total | 184 (77.3%) | 37 (15.6%) |
Employment Occupations by Sex in Cross Timber
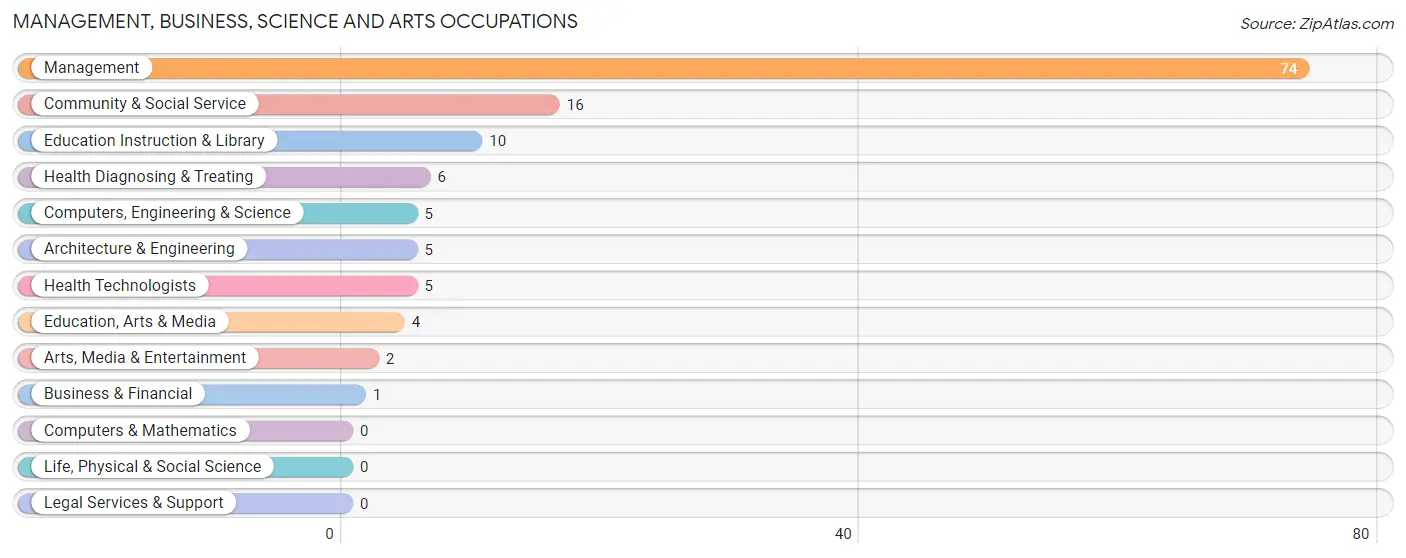
Management, Business, Science and Arts Occupations
The most common Management, Business, Science and Arts occupations in Cross Timber are Management (74 | 42.8%), Community & Social Service (16 | 9.2%), Education Instruction & Library (10 | 5.8%), Health Diagnosing & Treating (6 | 3.5%), and Computers, Engineering & Science (5 | 2.9%).
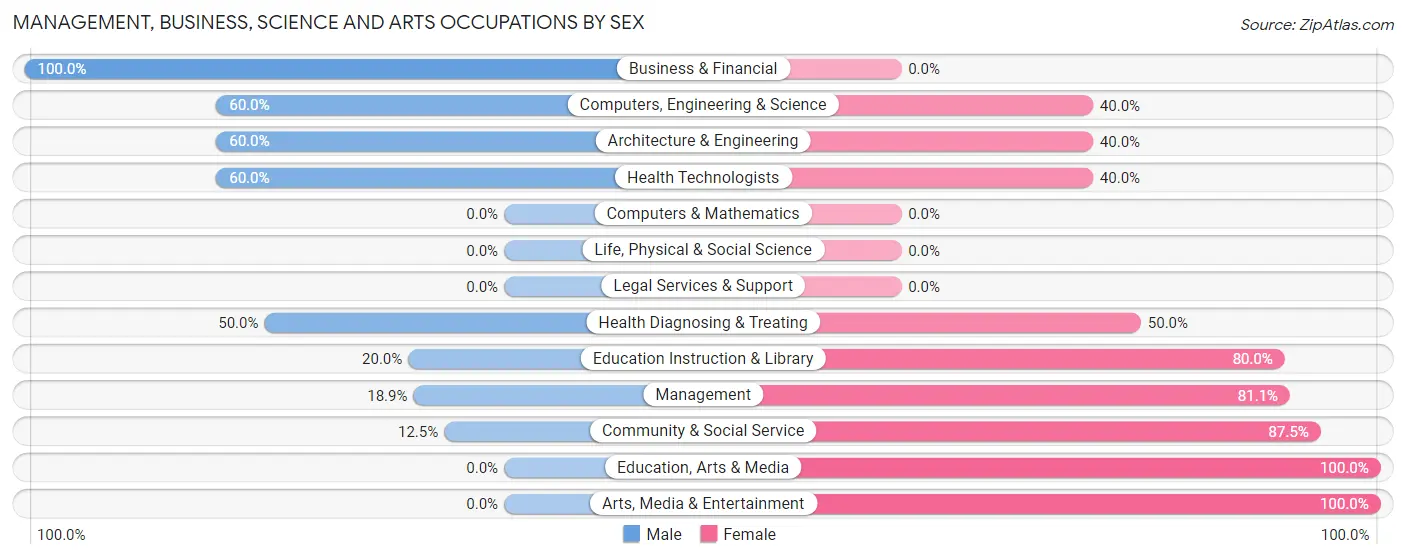
Management, Business, Science and Arts Occupations by Sex
Within the Management, Business, Science and Arts occupations in Cross Timber, the most male-oriented occupations are Business & Financial (100.0%), Computers, Engineering & Science (60.0%), and Architecture & Engineering (60.0%), while the most female-oriented occupations are Education, Arts & Media (100.0%), Arts, Media & Entertainment (100.0%), and Community & Social Service (87.5%).
| Occupation | Male | Female |
| Management | 14 (18.9%) | 60 (81.1%) |
| Business & Financial | 1 (100.0%) | 0 (0.0%) |
| Computers, Engineering & Science | 3 (60.0%) | 2 (40.0%) |
| Computers & Mathematics | 0 (0.0%) | 0 (0.0%) |
| Architecture & Engineering | 3 (60.0%) | 2 (40.0%) |
| Life, Physical & Social Science | 0 (0.0%) | 0 (0.0%) |
| Community & Social Service | 2 (12.5%) | 14 (87.5%) |
| Education, Arts & Media | 0 (0.0%) | 4 (100.0%) |
| Legal Services & Support | 0 (0.0%) | 0 (0.0%) |
| Education Instruction & Library | 2 (20.0%) | 8 (80.0%) |
| Arts, Media & Entertainment | 0 (0.0%) | 2 (100.0%) |
| Health Diagnosing & Treating | 3 (50.0%) | 3 (50.0%) |
| Health Technologists | 3 (60.0%) | 2 (40.0%) |
| Total (Category) | 23 (22.6%) | 79 (77.4%) |
| Total (Overall) | 59 (34.1%) | 114 (65.9%) |
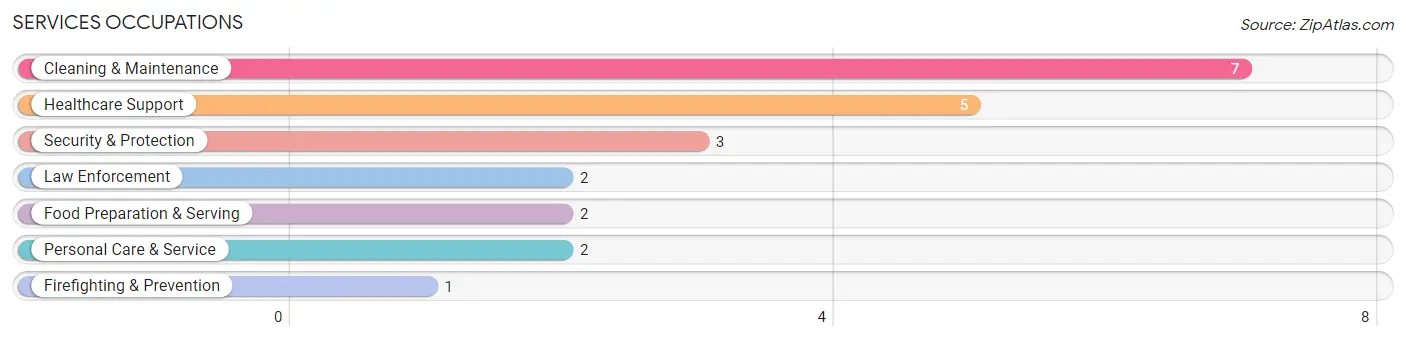
Services Occupations
The most common Services occupations in Cross Timber are Cleaning & Maintenance (7 | 4.1%), Healthcare Support (5 | 2.9%), Security & Protection (3 | 1.7%), Law Enforcement (2 | 1.2%), and Food Preparation & Serving (2 | 1.2%).
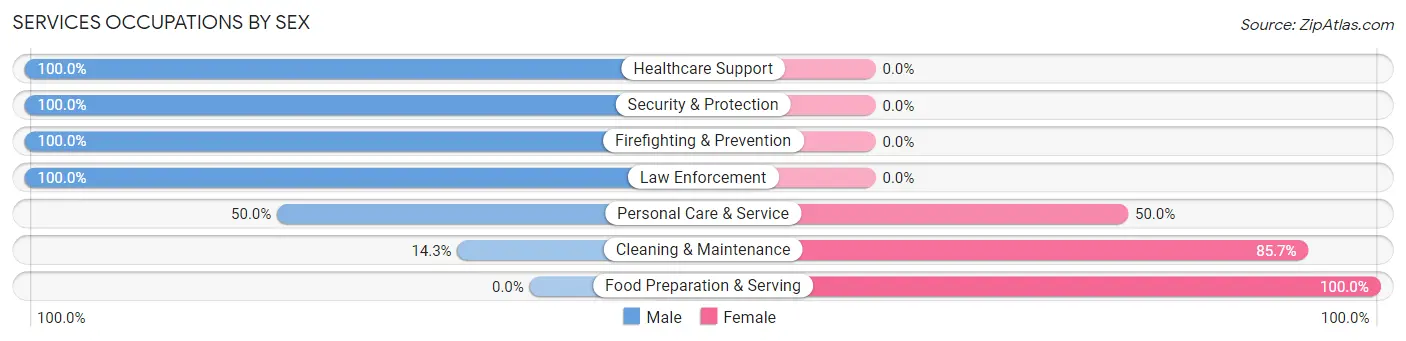
Services Occupations by Sex
Within the Services occupations in Cross Timber, the most male-oriented occupations are Healthcare Support (100.0%), Security & Protection (100.0%), and Firefighting & Prevention (100.0%), while the most female-oriented occupations are Food Preparation & Serving (100.0%), Cleaning & Maintenance (85.7%), and Personal Care & Service (50.0%).
| Occupation | Male | Female |
| Healthcare Support | 5 (100.0%) | 0 (0.0%) |
| Security & Protection | 3 (100.0%) | 0 (0.0%) |
| Firefighting & Prevention | 1 (100.0%) | 0 (0.0%) |
| Law Enforcement | 2 (100.0%) | 0 (0.0%) |
| Food Preparation & Serving | 0 (0.0%) | 2 (100.0%) |
| Cleaning & Maintenance | 1 (14.3%) | 6 (85.7%) |
| Personal Care & Service | 1 (50.0%) | 1 (50.0%) |
| Total (Category) | 10 (52.6%) | 9 (47.4%) |
| Total (Overall) | 59 (34.1%) | 114 (65.9%) |
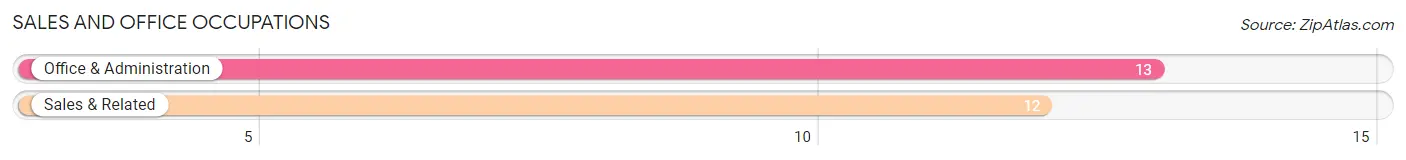
Sales and Office Occupations
The most common Sales and Office occupations in Cross Timber are Office & Administration (13 | 7.5%), and Sales & Related (12 | 6.9%).
Sales and Office Occupations by Sex
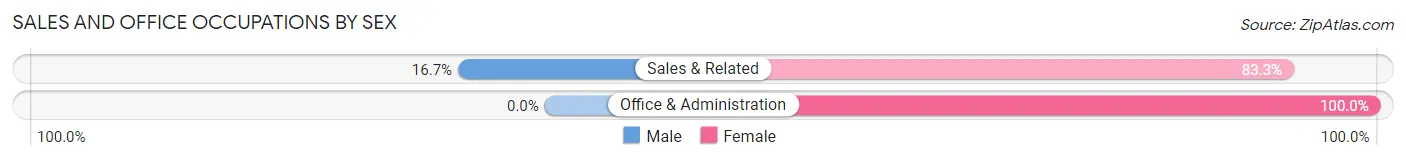
| Occupation | Male | Female |
| Sales & Related | 2 (16.7%) | 10 (83.3%) |
| Office & Administration | 0 (0.0%) | 13 (100.0%) |
| Total (Category) | 2 (8.0%) | 23 (92.0%) |
| Total (Overall) | 59 (34.1%) | 114 (65.9%) |
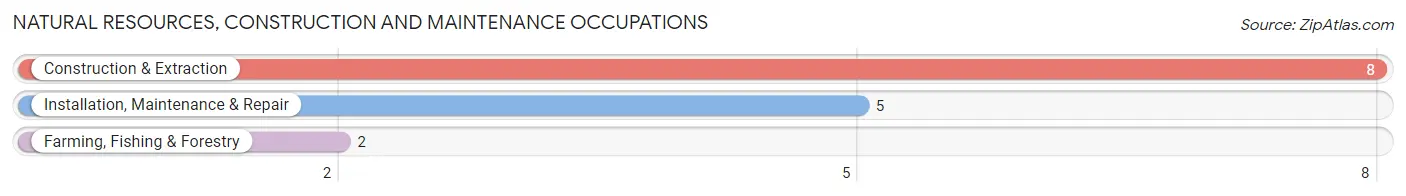
Natural Resources, Construction and Maintenance Occupations
The most common Natural Resources, Construction and Maintenance occupations in Cross Timber are Construction & Extraction (8 | 4.6%), Installation, Maintenance & Repair (5 | 2.9%), and Farming, Fishing & Forestry (2 | 1.2%).
Natural Resources, Construction and Maintenance Occupations by Sex
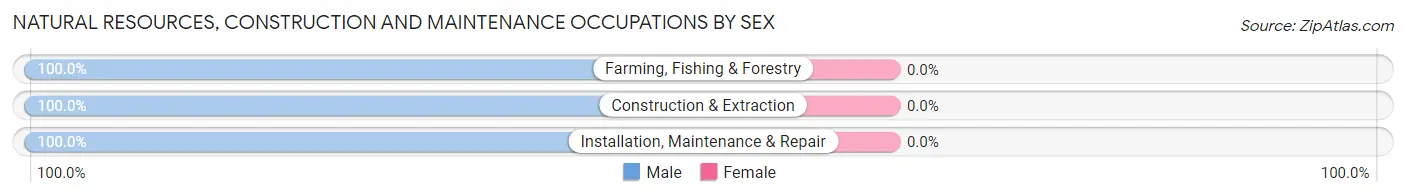
| Occupation | Male | Female |
| Farming, Fishing & Forestry | 2 (100.0%) | 0 (0.0%) |
| Construction & Extraction | 8 (100.0%) | 0 (0.0%) |
| Installation, Maintenance & Repair | 5 (100.0%) | 0 (0.0%) |
| Total (Category) | 15 (100.0%) | 0 (0.0%) |
| Total (Overall) | 59 (34.1%) | 114 (65.9%) |
Production, Transportation and Moving Occupations
The most common Production, Transportation and Moving occupations in Cross Timber are Production (7 | 4.1%), and Material Moving (5 | 2.9%).
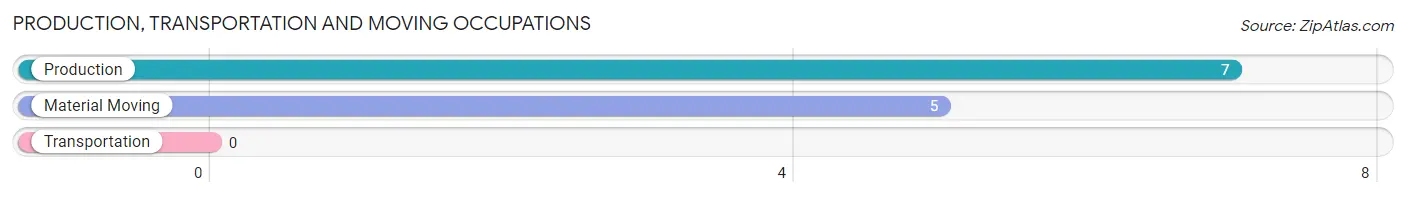
Production, Transportation and Moving Occupations by Sex
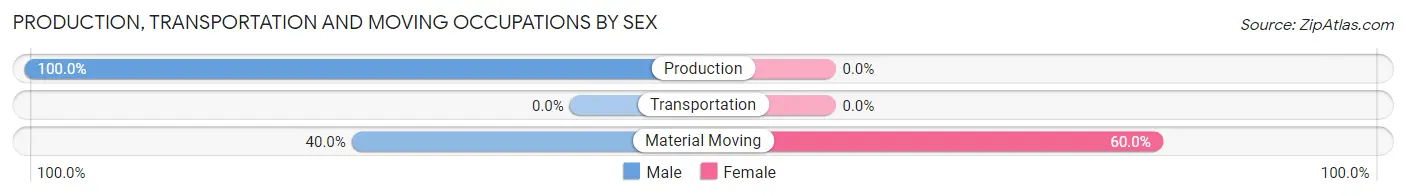
| Occupation | Male | Female |
| Production | 7 (100.0%) | 0 (0.0%) |
| Transportation | 0 (0.0%) | 0 (0.0%) |
| Material Moving | 2 (40.0%) | 3 (60.0%) |
| Total (Category) | 9 (75.0%) | 3 (25.0%) |
| Total (Overall) | 59 (34.1%) | 114 (65.9%) |
Employment Industries by Sex in Cross Timber
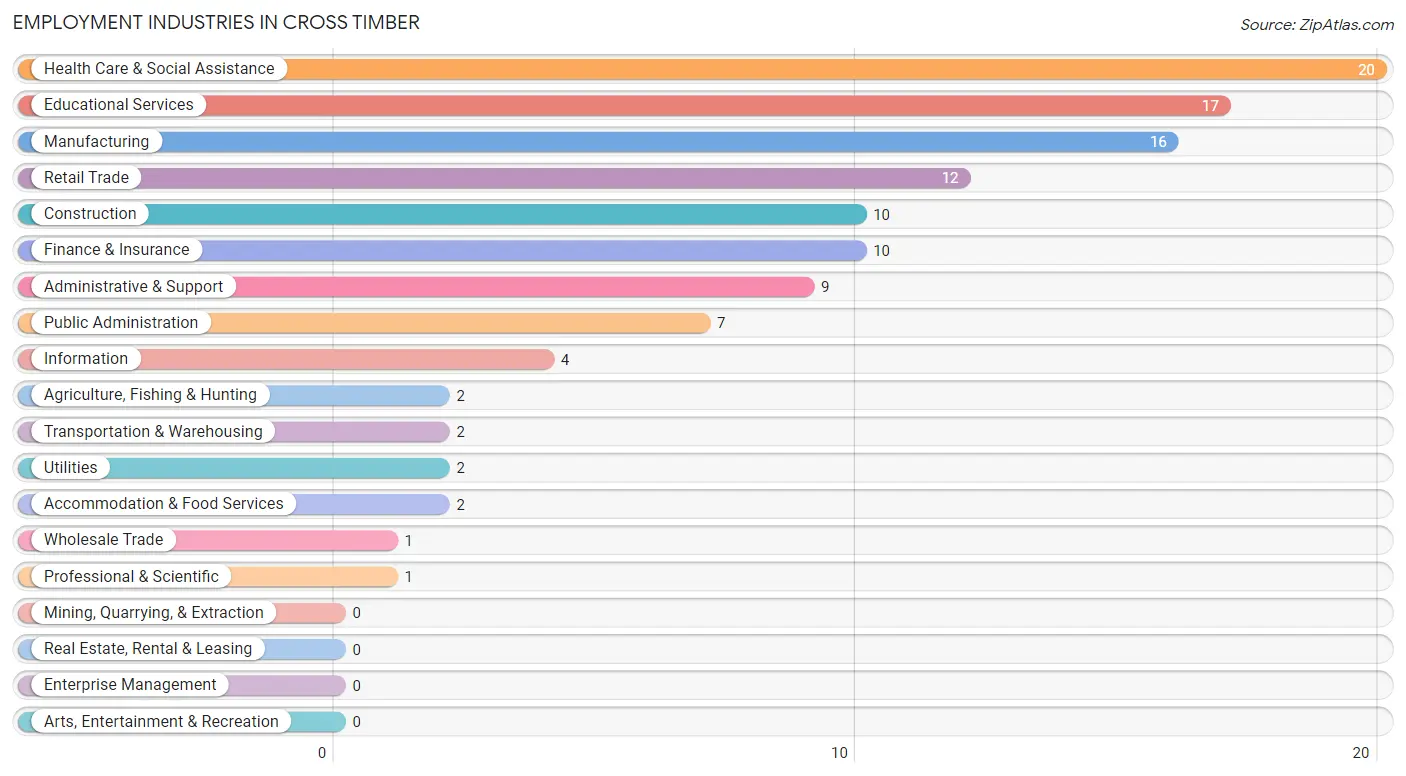
Employment Industries in Cross Timber
The major employment industries in Cross Timber include Health Care & Social Assistance (20 | 11.6%), Educational Services (17 | 9.8%), Manufacturing (16 | 9.2%), Retail Trade (12 | 6.9%), and Construction (10 | 5.8%).
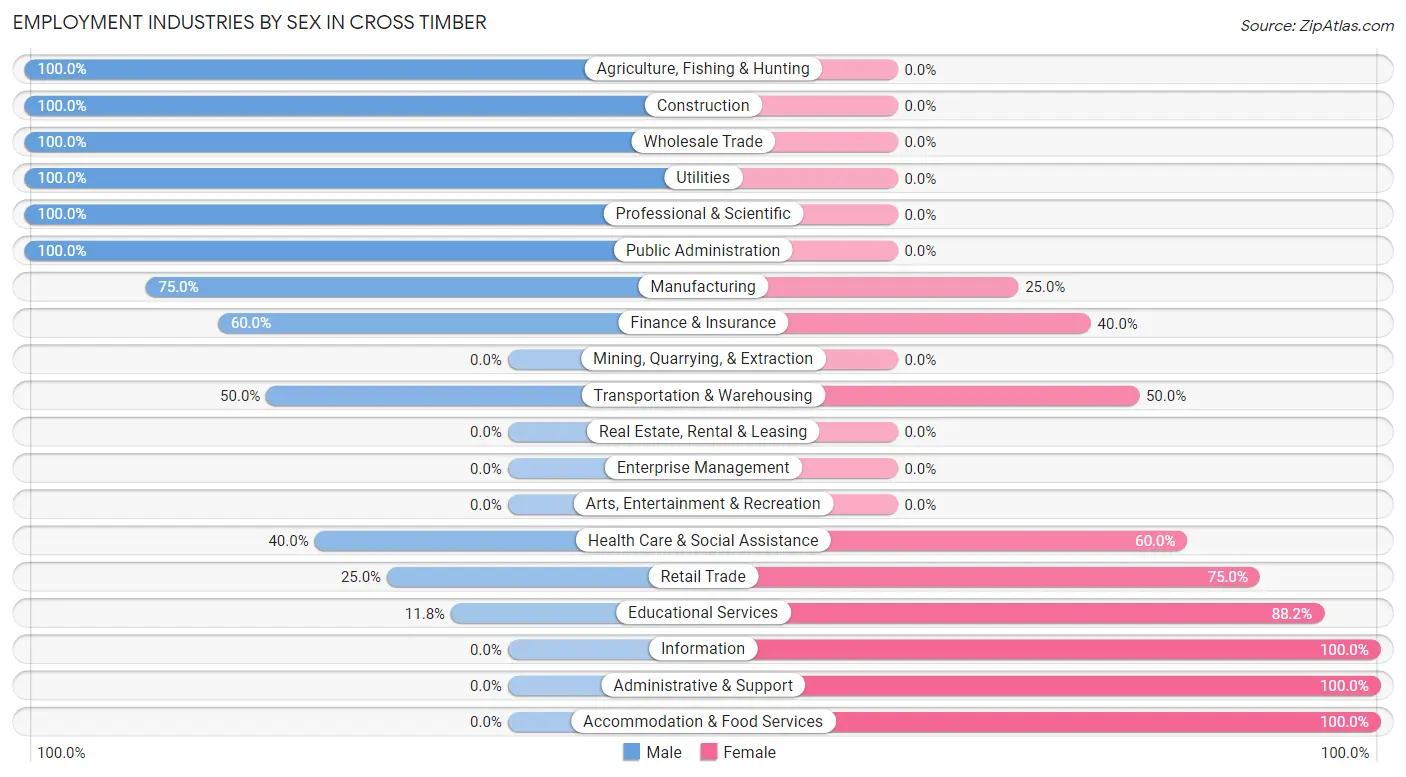
Employment Industries by Sex in Cross Timber
The Cross Timber industries that see more men than women are Agriculture, Fishing & Hunting (100.0%), Construction (100.0%), and Wholesale Trade (100.0%), whereas the industries that tend to have a higher number of women are Information (100.0%), Administrative & Support (100.0%), and Accommodation & Food Services (100.0%).
| Industry | Male | Female |
| Agriculture, Fishing & Hunting | 2 (100.0%) | 0 (0.0%) |
| Mining, Quarrying, & Extraction | 0 (0.0%) | 0 (0.0%) |
| Construction | 10 (100.0%) | 0 (0.0%) |
| Manufacturing | 12 (75.0%) | 4 (25.0%) |
| Wholesale Trade | 1 (100.0%) | 0 (0.0%) |
| Retail Trade | 3 (25.0%) | 9 (75.0%) |
| Transportation & Warehousing | 1 (50.0%) | 1 (50.0%) |
| Utilities | 2 (100.0%) | 0 (0.0%) |
| Information | 0 (0.0%) | 4 (100.0%) |
| Finance & Insurance | 6 (60.0%) | 4 (40.0%) |
| Real Estate, Rental & Leasing | 0 (0.0%) | 0 (0.0%) |
| Professional & Scientific | 1 (100.0%) | 0 (0.0%) |
| Enterprise Management | 0 (0.0%) | 0 (0.0%) |
| Administrative & Support | 0 (0.0%) | 9 (100.0%) |
| Educational Services | 2 (11.8%) | 15 (88.2%) |
| Health Care & Social Assistance | 8 (40.0%) | 12 (60.0%) |
| Arts, Entertainment & Recreation | 0 (0.0%) | 0 (0.0%) |
| Accommodation & Food Services | 0 (0.0%) | 2 (100.0%) |
| Public Administration | 7 (100.0%) | 0 (0.0%) |
| Total | 59 (34.1%) | 114 (65.9%) |
Education in Cross Timber
School Enrollment in Cross Timber
The most common levels of schooling among the 225 students in Cross Timber are elementary school (161 | 71.6%), middle school (34 | 15.1%), and high school (17 | 7.6%).
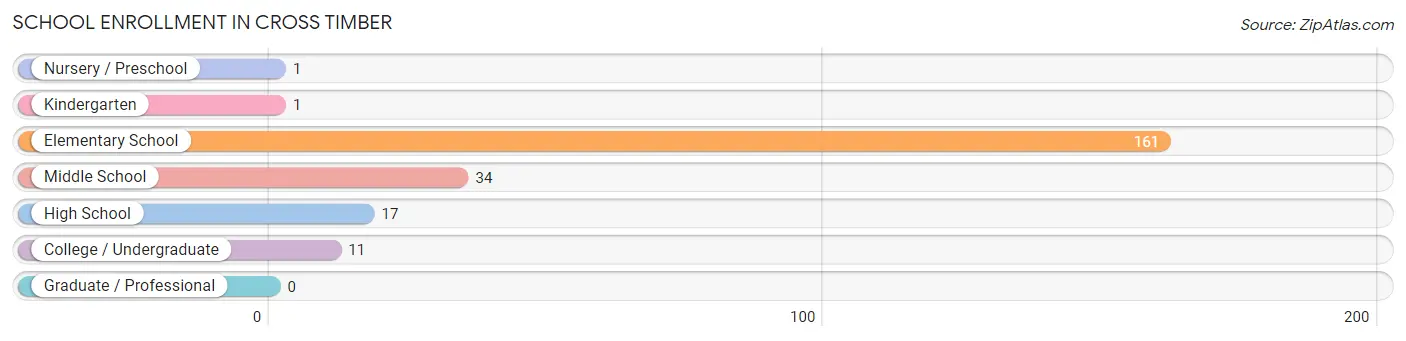
| School Level | # Students | % Students |
| Nursery / Preschool | 1 | 0.4% |
| Kindergarten | 1 | 0.4% |
| Elementary School | 161 | 71.6% |
| Middle School | 34 | 15.1% |
| High School | 17 | 7.6% |
| College / Undergraduate | 11 | 4.9% |
| Graduate / Professional | 0 | 0.0% |
| Total | 225 | 100.0% |
School Enrollment by Age by Funding Source in Cross Timber
Out of a total of 225 students who are enrolled in schools in Cross Timber, 27 (12.0%) attend a private institution, while the remaining 198 (88.0%) are enrolled in public schools. The age group of 3 to 4 year olds has the highest likelihood of being enrolled in private schools, with 1 (100.0% in the age bracket) enrolled. Conversely, the age group of 20 to 24 year olds has the lowest likelihood of being enrolled in a private school, with 5 (100.0% in the age bracket) attending a public institution.
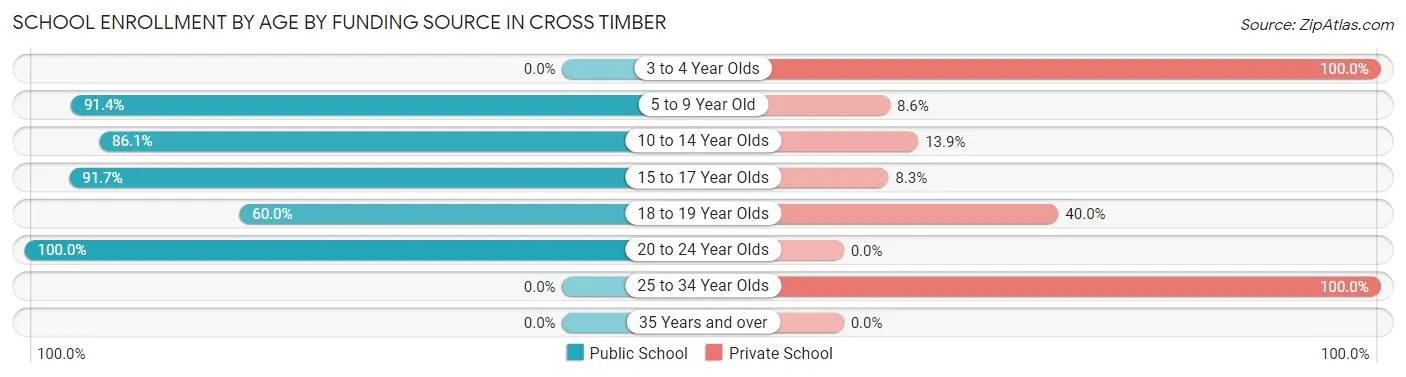
| Age Bracket | Public School | Private School |
| 3 to 4 Year Olds | 0 (0.0%) | 1 (100.0%) |
| 5 to 9 Year Old | 148 (91.4%) | 14 (8.6%) |
| 10 to 14 Year Olds | 31 (86.1%) | 5 (13.9%) |
| 15 to 17 Year Olds | 11 (91.7%) | 1 (8.3%) |
| 18 to 19 Year Olds | 3 (60.0%) | 2 (40.0%) |
| 20 to 24 Year Olds | 5 (100.0%) | 0 (0.0%) |
| 25 to 34 Year Olds | 0 (0.0%) | 4 (100.0%) |
| 35 Years and over | 0 (0.0%) | 0 (0.0%) |
| Total | 198 (88.0%) | 27 (12.0%) |
Educational Attainment by Field of Study in Cross Timber
Science & technology (20 | 25.3%), business (16 | 20.3%), education (8 | 10.1%), social sciences (5 | 6.3%), and bio, nature & agricultural (4 | 5.1%) are the most common fields of study among 79 individuals in Cross Timber who have obtained a bachelor's degree or higher.
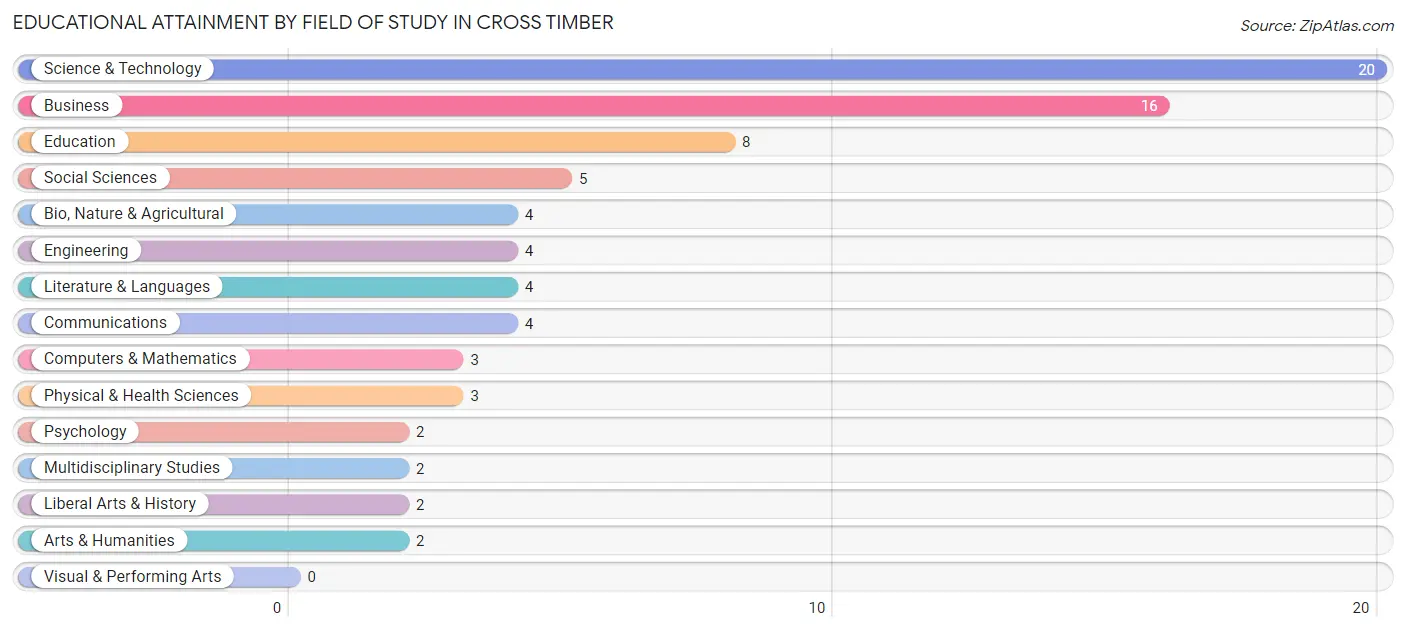
| Field of Study | # Graduates | % Graduates |
| Computers & Mathematics | 3 | 3.8% |
| Bio, Nature & Agricultural | 4 | 5.1% |
| Physical & Health Sciences | 3 | 3.8% |
| Psychology | 2 | 2.5% |
| Social Sciences | 5 | 6.3% |
| Engineering | 4 | 5.1% |
| Multidisciplinary Studies | 2 | 2.5% |
| Science & Technology | 20 | 25.3% |
| Business | 16 | 20.3% |
| Education | 8 | 10.1% |
| Literature & Languages | 4 | 5.1% |
| Liberal Arts & History | 2 | 2.5% |
| Visual & Performing Arts | 0 | 0.0% |
| Communications | 4 | 5.1% |
| Arts & Humanities | 2 | 2.5% |
| Total | 79 | 100.0% |
Transportation & Commute in Cross Timber
Vehicle Availability by Sex in Cross Timber
The most prevalent vehicle ownership categories in Cross Timber are males with 2 vehicles (35, accounting for 55.6%) and females with 2 vehicles (26, making up 30.7%).
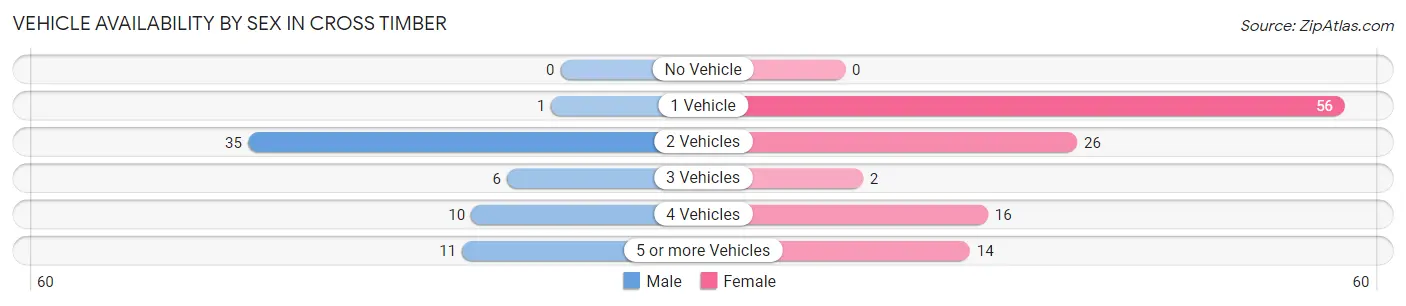
| Vehicles Available | Male | Female |
| No Vehicle | 0 (0.0%) | 0 (0.0%) |
| 1 Vehicle | 1 (1.6%) | 56 (49.1%) |
| 2 Vehicles | 35 (55.6%) | 26 (22.8%) |
| 3 Vehicles | 6 (9.5%) | 2 (1.8%) |
| 4 Vehicles | 10 (15.9%) | 16 (14.0%) |
| 5 or more Vehicles | 11 (17.5%) | 14 (12.3%) |
| Total | 63 (100.0%) | 114 (100.0%) |
Commute Time in Cross Timber
The most frequently occuring commute durations in Cross Timber are 20 to 24 minutes (91 commuters, 54.5%), 30 to 34 minutes (17 commuters, 10.2%), and 15 to 19 minutes (12 commuters, 7.2%).
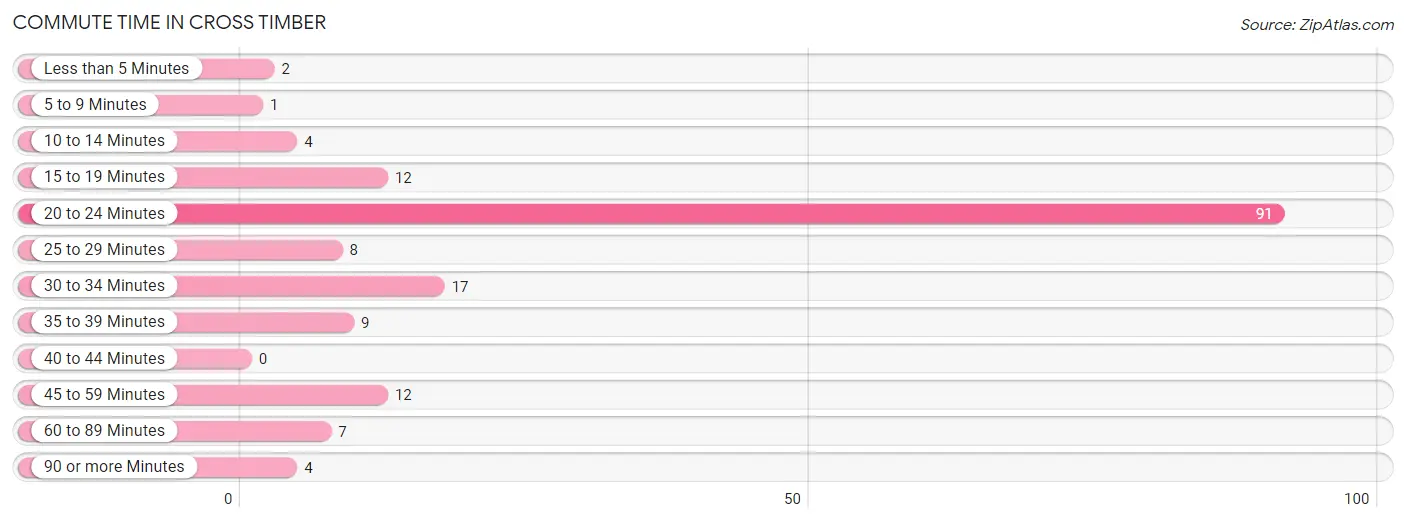
| Commute Time | # Commuters | % Commuters |
| Less than 5 Minutes | 2 | 1.2% |
| 5 to 9 Minutes | 1 | 0.6% |
| 10 to 14 Minutes | 4 | 2.4% |
| 15 to 19 Minutes | 12 | 7.2% |
| 20 to 24 Minutes | 91 | 54.5% |
| 25 to 29 Minutes | 8 | 4.8% |
| 30 to 34 Minutes | 17 | 10.2% |
| 35 to 39 Minutes | 9 | 5.4% |
| 40 to 44 Minutes | 0 | 0.0% |
| 45 to 59 Minutes | 12 | 7.2% |
| 60 to 89 Minutes | 7 | 4.2% |
| 90 or more Minutes | 4 | 2.4% |
Commute Time by Sex in Cross Timber
The most common commute times in Cross Timber are 20 to 24 minutes (18 commuters, 31.6%) for males and 20 to 24 minutes (73 commuters, 66.4%) for females.
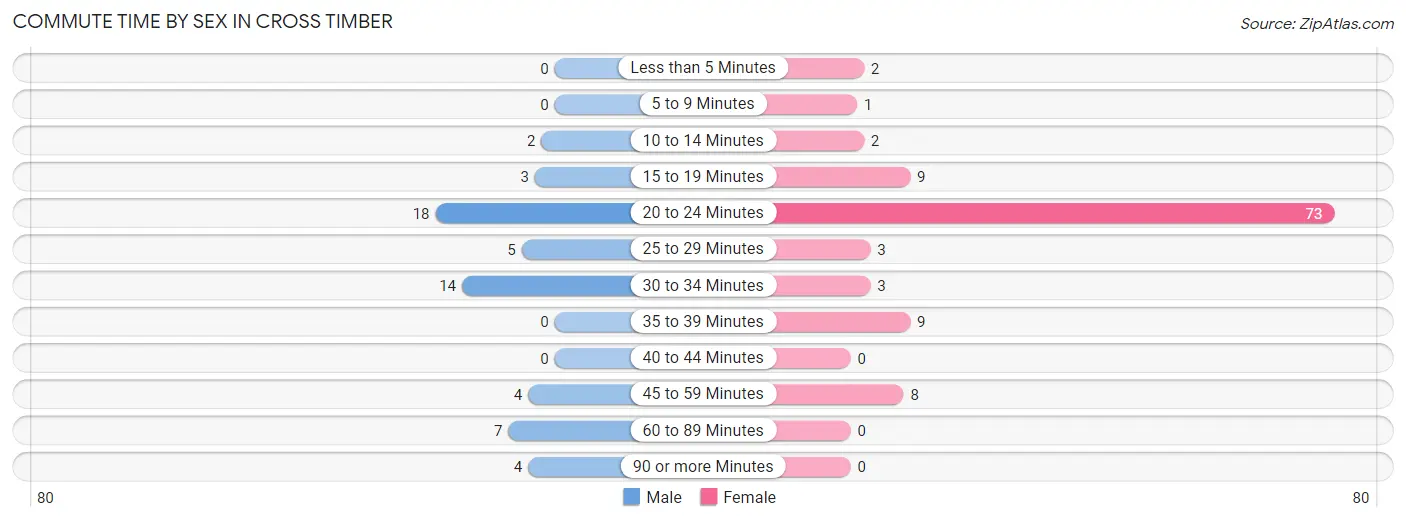
| Commute Time | Male | Female |
| Less than 5 Minutes | 0 (0.0%) | 2 (1.8%) |
| 5 to 9 Minutes | 0 (0.0%) | 1 (0.9%) |
| 10 to 14 Minutes | 2 (3.5%) | 2 (1.8%) |
| 15 to 19 Minutes | 3 (5.3%) | 9 (8.2%) |
| 20 to 24 Minutes | 18 (31.6%) | 73 (66.4%) |
| 25 to 29 Minutes | 5 (8.8%) | 3 (2.7%) |
| 30 to 34 Minutes | 14 (24.6%) | 3 (2.7%) |
| 35 to 39 Minutes | 0 (0.0%) | 9 (8.2%) |
| 40 to 44 Minutes | 0 (0.0%) | 0 (0.0%) |
| 45 to 59 Minutes | 4 (7.0%) | 8 (7.3%) |
| 60 to 89 Minutes | 7 (12.3%) | 0 (0.0%) |
| 90 or more Minutes | 4 (7.0%) | 0 (0.0%) |
Time of Departure to Work by Sex in Cross Timber
The most frequent times of departure to work in Cross Timber are 6:00 AM to 6:29 AM (14, 24.6%) for males and 7:30 AM to 7:59 AM (70, 63.6%) for females.
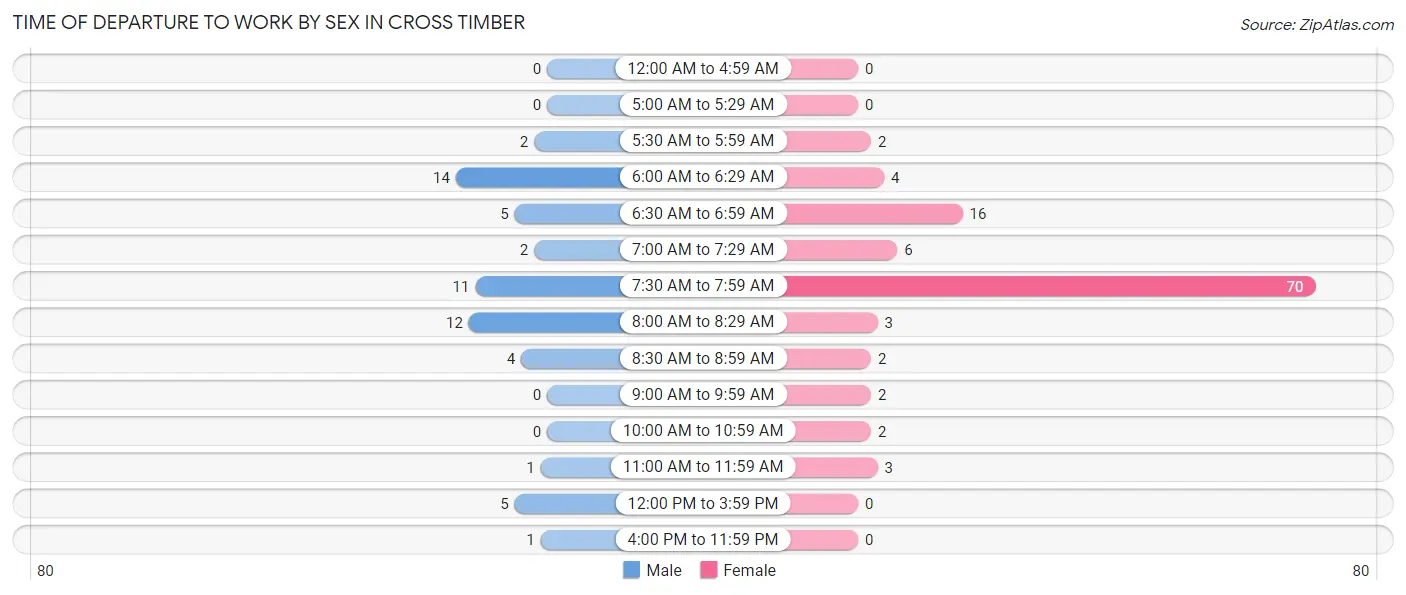
| Time of Departure | Male | Female |
| 12:00 AM to 4:59 AM | 0 (0.0%) | 0 (0.0%) |
| 5:00 AM to 5:29 AM | 0 (0.0%) | 0 (0.0%) |
| 5:30 AM to 5:59 AM | 2 (3.5%) | 2 (1.8%) |
| 6:00 AM to 6:29 AM | 14 (24.6%) | 4 (3.6%) |
| 6:30 AM to 6:59 AM | 5 (8.8%) | 16 (14.5%) |
| 7:00 AM to 7:29 AM | 2 (3.5%) | 6 (5.4%) |
| 7:30 AM to 7:59 AM | 11 (19.3%) | 70 (63.6%) |
| 8:00 AM to 8:29 AM | 12 (21.0%) | 3 (2.7%) |
| 8:30 AM to 8:59 AM | 4 (7.0%) | 2 (1.8%) |
| 9:00 AM to 9:59 AM | 0 (0.0%) | 2 (1.8%) |
| 10:00 AM to 10:59 AM | 0 (0.0%) | 2 (1.8%) |
| 11:00 AM to 11:59 AM | 1 (1.8%) | 3 (2.7%) |
| 12:00 PM to 3:59 PM | 5 (8.8%) | 0 (0.0%) |
| 4:00 PM to 11:59 PM | 1 (1.8%) | 0 (0.0%) |
| Total | 57 (100.0%) | 110 (100.0%) |
Housing Occupancy in Cross Timber
Occupancy by Ownership in Cross Timber
Of the total 170 dwellings in Cross Timber, owner-occupied units account for 165 (97.1%), while renter-occupied units make up 5 (2.9%).

| Occupancy | # Housing Units | % Housing Units |
| Owner Occupied Housing Units | 165 | 97.1% |
| Renter-Occupied Housing Units | 5 | 2.9% |
| Total Occupied Housing Units | 170 | 100.0% |
Occupancy by Household Size in Cross Timber
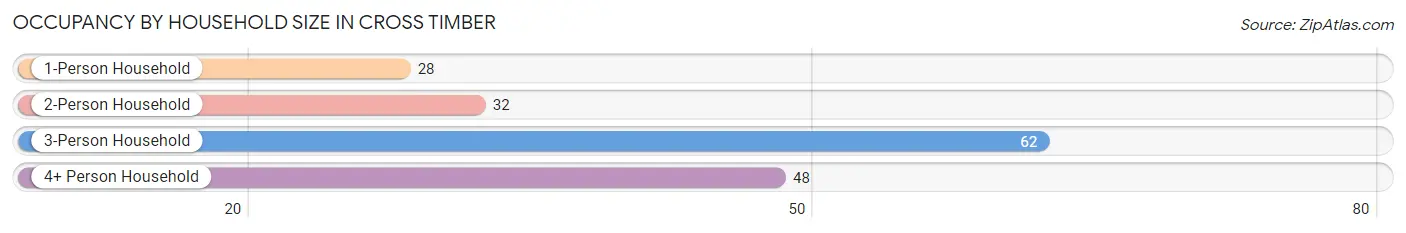
| Household Size | # Housing Units | % Housing Units |
| 1-Person Household | 28 | 16.5% |
| 2-Person Household | 32 | 18.8% |
| 3-Person Household | 62 | 36.5% |
| 4+ Person Household | 48 | 28.2% |
| Total Housing Units | 170 | 100.0% |
Occupancy by Ownership by Household Size in Cross Timber
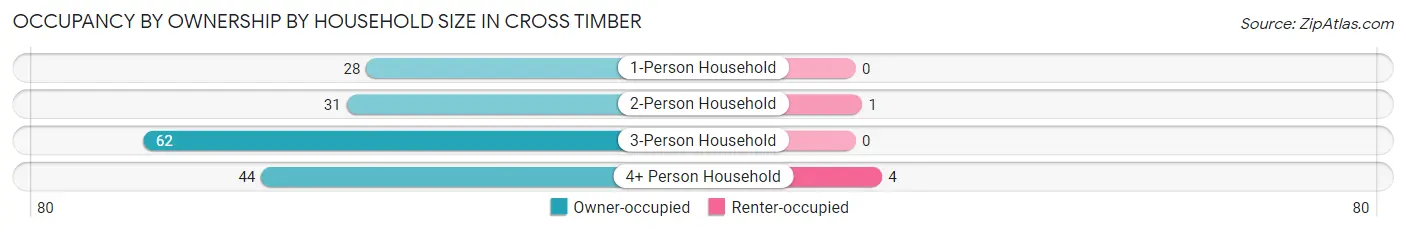
| Household Size | Owner-occupied | Renter-occupied |
| 1-Person Household | 28 (100.0%) | 0 (0.0%) |
| 2-Person Household | 31 (96.9%) | 1 (3.1%) |
| 3-Person Household | 62 (100.0%) | 0 (0.0%) |
| 4+ Person Household | 44 (91.7%) | 4 (8.3%) |
| Total Housing Units | 165 (97.1%) | 5 (2.9%) |
Occupancy by Educational Attainment in Cross Timber
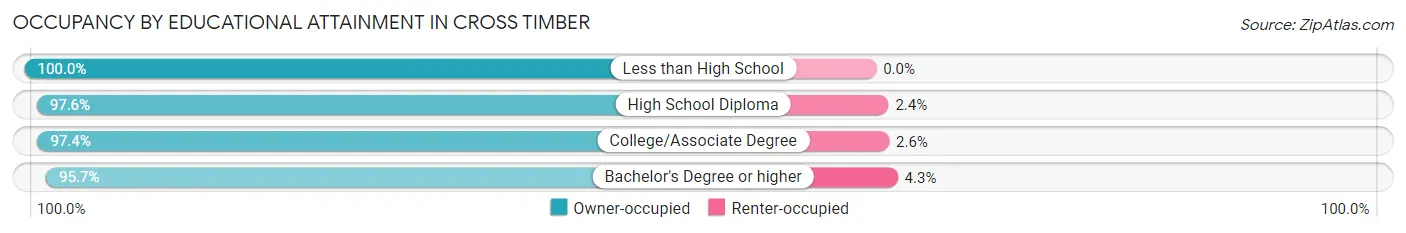
| Household Size | Owner-occupied | Renter-occupied |
| Less than High School | 4 (100.0%) | 0 (0.0%) |
| High School Diploma | 40 (97.6%) | 1 (2.4%) |
| College/Associate Degree | 76 (97.4%) | 2 (2.6%) |
| Bachelor's Degree or higher | 45 (95.7%) | 2 (4.3%) |
Occupancy by Age of Householder in Cross Timber
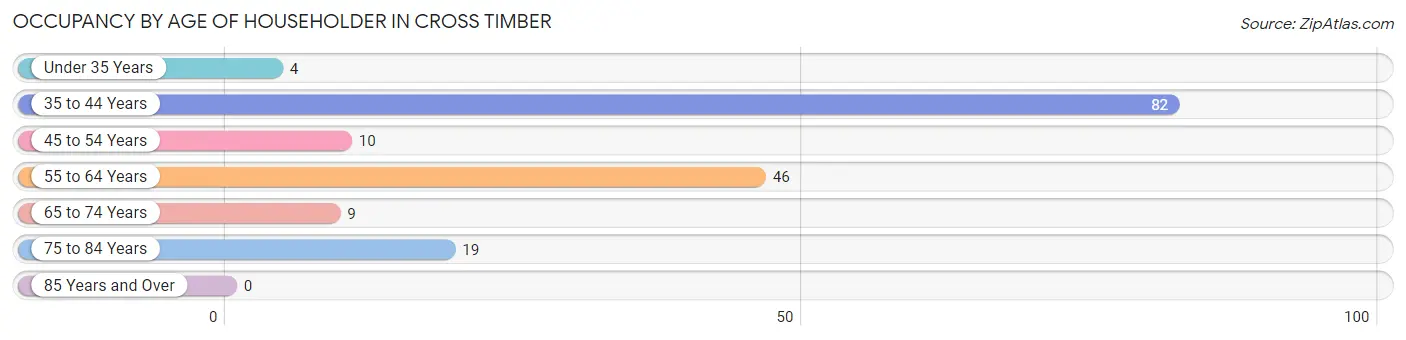
| Age Bracket | # Households | % Households |
| Under 35 Years | 4 | 2.4% |
| 35 to 44 Years | 82 | 48.2% |
| 45 to 54 Years | 10 | 5.9% |
| 55 to 64 Years | 46 | 27.1% |
| 65 to 74 Years | 9 | 5.3% |
| 75 to 84 Years | 19 | 11.2% |
| 85 Years and Over | 0 | 0.0% |
| Total | 170 | 100.0% |
Housing Finances in Cross Timber
Median Income by Occupancy in Cross Timber
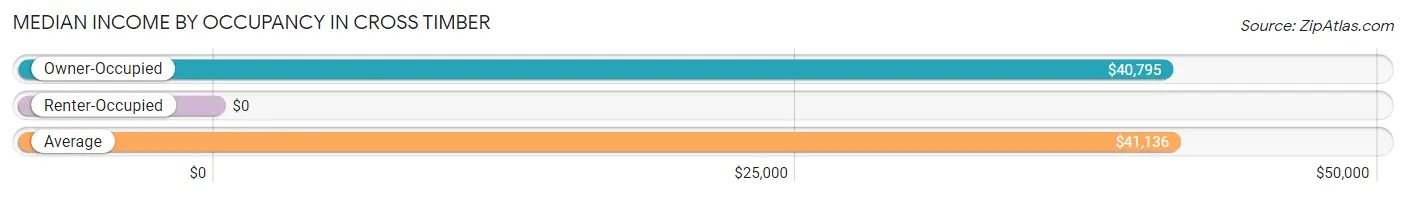
| Occupancy Type | # Households | Median Income |
| Owner-Occupied | 165 (97.1%) | $40,795 |
| Renter-Occupied | 5 (2.9%) | $0 |
| Average | 170 (100.0%) | $41,136 |
Occupancy by Householder Income Bracket in Cross Timber
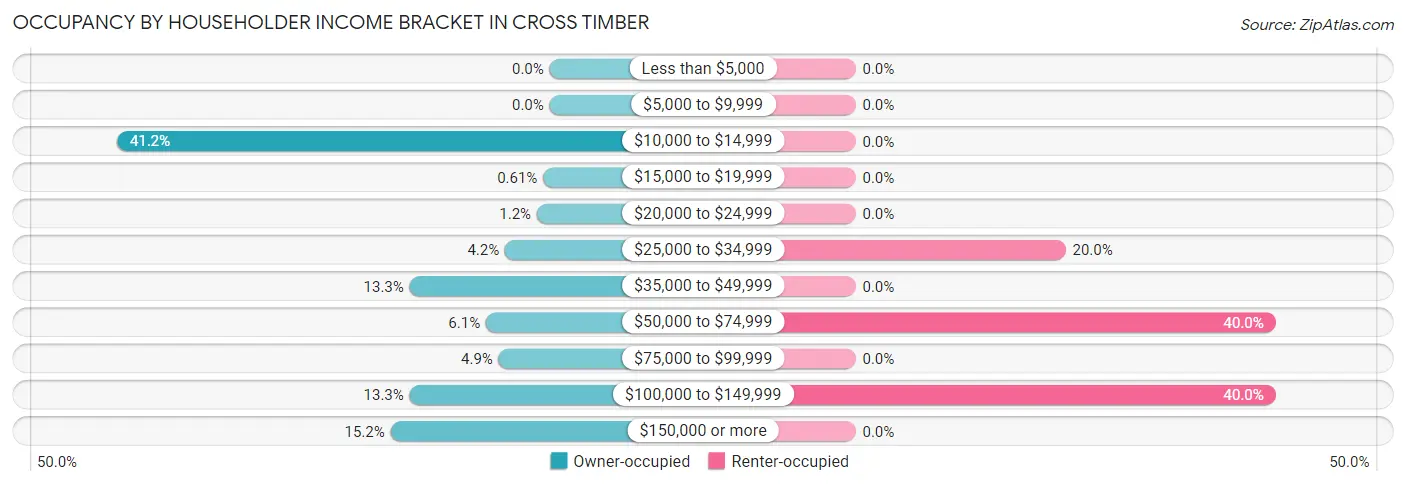
| Income Bracket | Owner-occupied | Renter-occupied |
| Less than $5,000 | 0 (0.0%) | 0 (0.0%) |
| $5,000 to $9,999 | 0 (0.0%) | 0 (0.0%) |
| $10,000 to $14,999 | 68 (41.2%) | 0 (0.0%) |
| $15,000 to $19,999 | 1 (0.6%) | 0 (0.0%) |
| $20,000 to $24,999 | 2 (1.2%) | 0 (0.0%) |
| $25,000 to $34,999 | 7 (4.2%) | 1 (20.0%) |
| $35,000 to $49,999 | 22 (13.3%) | 0 (0.0%) |
| $50,000 to $74,999 | 10 (6.1%) | 2 (40.0%) |
| $75,000 to $99,999 | 8 (4.9%) | 0 (0.0%) |
| $100,000 to $149,999 | 22 (13.3%) | 2 (40.0%) |
| $150,000 or more | 25 (15.1%) | 0 (0.0%) |
| Total | 165 (100.0%) | 5 (100.0%) |
Monthly Housing Cost Tiers in Cross Timber
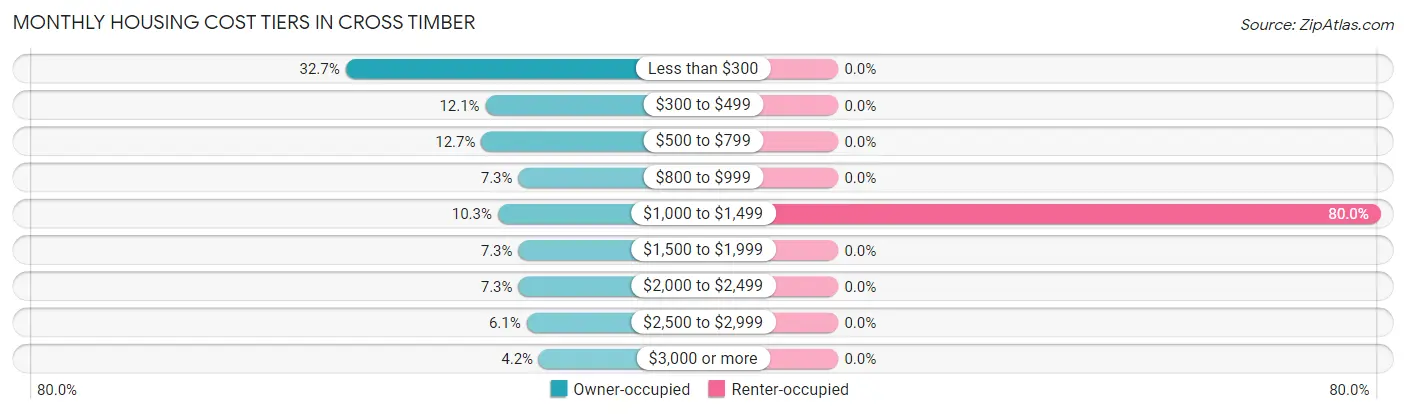
| Monthly Cost | Owner-occupied | Renter-occupied |
| Less than $300 | 54 (32.7%) | 0 (0.0%) |
| $300 to $499 | 20 (12.1%) | 0 (0.0%) |
| $500 to $799 | 21 (12.7%) | 0 (0.0%) |
| $800 to $999 | 12 (7.3%) | 0 (0.0%) |
| $1,000 to $1,499 | 17 (10.3%) | 4 (80.0%) |
| $1,500 to $1,999 | 12 (7.3%) | 0 (0.0%) |
| $2,000 to $2,499 | 12 (7.3%) | 0 (0.0%) |
| $2,500 to $2,999 | 10 (6.1%) | 0 (0.0%) |
| $3,000 or more | 7 (4.2%) | 0 (0.0%) |
| Total | 165 (100.0%) | 5 (100.0%) |
Physical Housing Characteristics in Cross Timber
Housing Structures in Cross Timber
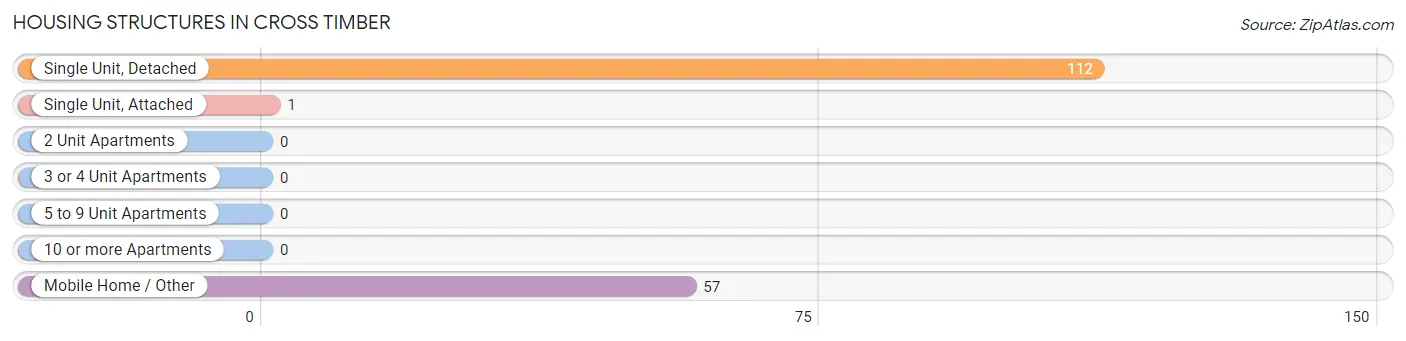
| Structure Type | # Housing Units | % Housing Units |
| Single Unit, Detached | 112 | 65.9% |
| Single Unit, Attached | 1 | 0.6% |
| 2 Unit Apartments | 0 | 0.0% |
| 3 or 4 Unit Apartments | 0 | 0.0% |
| 5 to 9 Unit Apartments | 0 | 0.0% |
| 10 or more Apartments | 0 | 0.0% |
| Mobile Home / Other | 57 | 33.5% |
| Total | 170 | 100.0% |
Housing Structures by Occupancy in Cross Timber
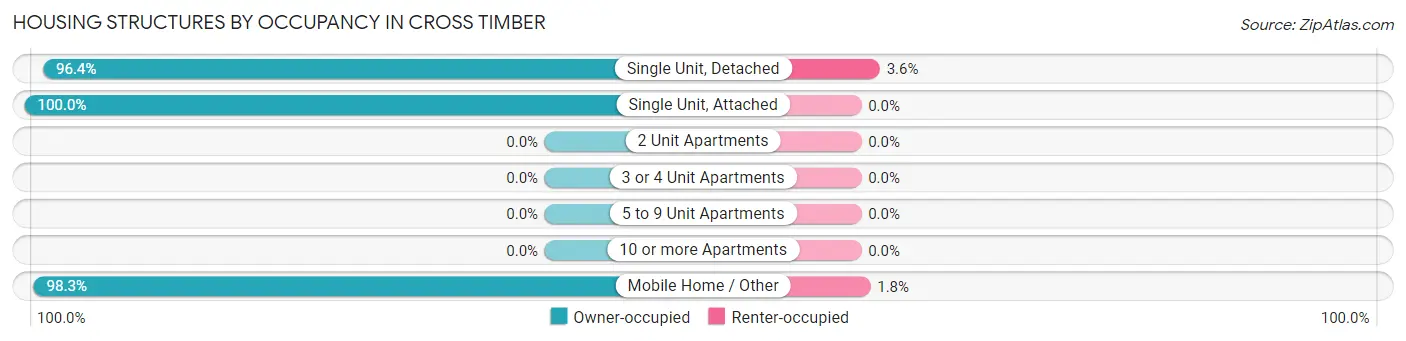
| Structure Type | Owner-occupied | Renter-occupied |
| Single Unit, Detached | 108 (96.4%) | 4 (3.6%) |
| Single Unit, Attached | 1 (100.0%) | 0 (0.0%) |
| 2 Unit Apartments | 0 (0.0%) | 0 (0.0%) |
| 3 or 4 Unit Apartments | 0 (0.0%) | 0 (0.0%) |
| 5 to 9 Unit Apartments | 0 (0.0%) | 0 (0.0%) |
| 10 or more Apartments | 0 (0.0%) | 0 (0.0%) |
| Mobile Home / Other | 56 (98.3%) | 1 (1.8%) |
| Total | 165 (97.1%) | 5 (2.9%) |
Housing Structures by Number of Rooms in Cross Timber
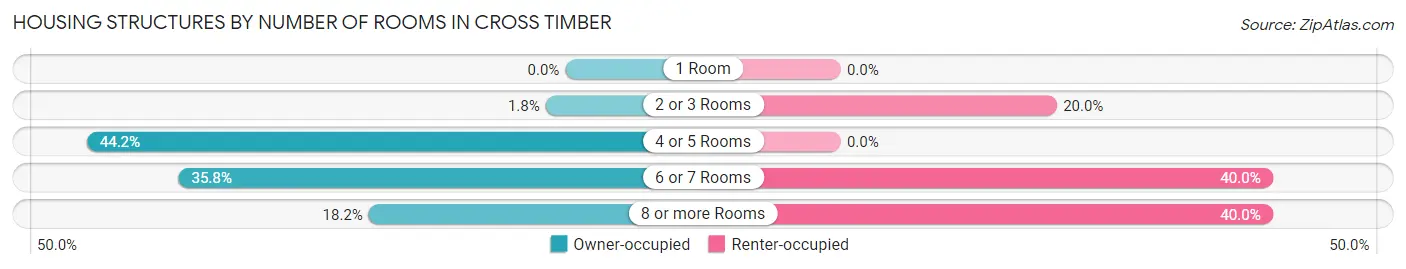
| Number of Rooms | Owner-occupied | Renter-occupied |
| 1 Room | 0 (0.0%) | 0 (0.0%) |
| 2 or 3 Rooms | 3 (1.8%) | 1 (20.0%) |
| 4 or 5 Rooms | 73 (44.2%) | 0 (0.0%) |
| 6 or 7 Rooms | 59 (35.8%) | 2 (40.0%) |
| 8 or more Rooms | 30 (18.2%) | 2 (40.0%) |
| Total | 165 (100.0%) | 5 (100.0%) |
Housing Structure by Heating Type in Cross Timber
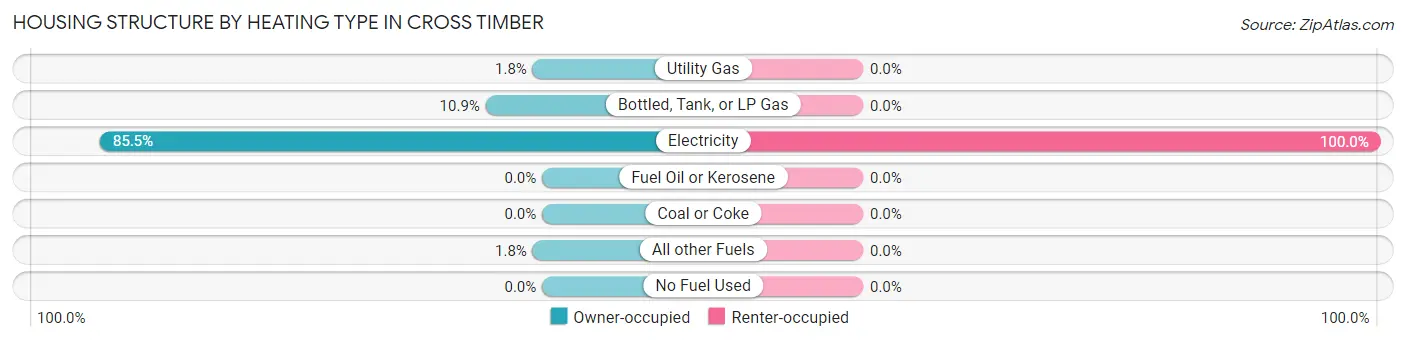
| Heating Type | Owner-occupied | Renter-occupied |
| Utility Gas | 3 (1.8%) | 0 (0.0%) |
| Bottled, Tank, or LP Gas | 18 (10.9%) | 0 (0.0%) |
| Electricity | 141 (85.5%) | 5 (100.0%) |
| Fuel Oil or Kerosene | 0 (0.0%) | 0 (0.0%) |
| Coal or Coke | 0 (0.0%) | 0 (0.0%) |
| All other Fuels | 3 (1.8%) | 0 (0.0%) |
| No Fuel Used | 0 (0.0%) | 0 (0.0%) |
| Total | 165 (100.0%) | 5 (100.0%) |
Household Vehicle Usage in Cross Timber
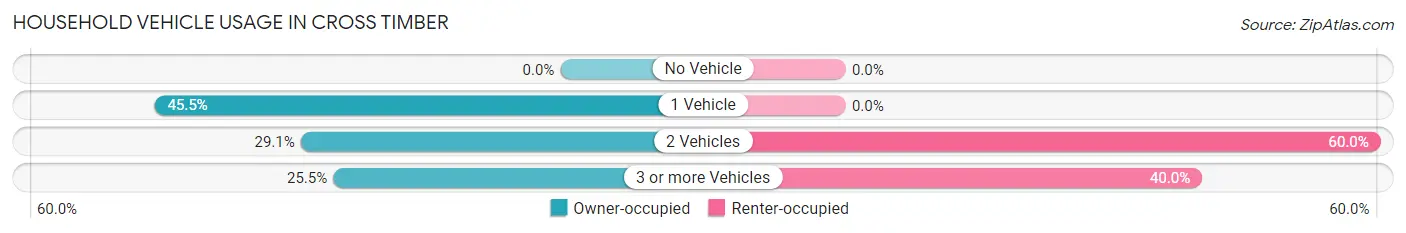
| Vehicles per Household | Owner-occupied | Renter-occupied |
| No Vehicle | 0 (0.0%) | 0 (0.0%) |
| 1 Vehicle | 75 (45.5%) | 0 (0.0%) |
| 2 Vehicles | 48 (29.1%) | 3 (60.0%) |
| 3 or more Vehicles | 42 (25.5%) | 2 (40.0%) |
| Total | 165 (100.0%) | 5 (100.0%) |
Real Estate & Mortgages in Cross Timber
Real Estate and Mortgage Overview in Cross Timber
| Characteristic | Without Mortgage | With Mortgage |
| Housing Units | 113 | 52 |
| Median Property Value | - | - |
| Median Household Income | - | - |
| Monthly Housing Costs | $408 | $7 |
| Real Estate Taxes | - | - |
Property Value by Mortgage Status in Cross Timber
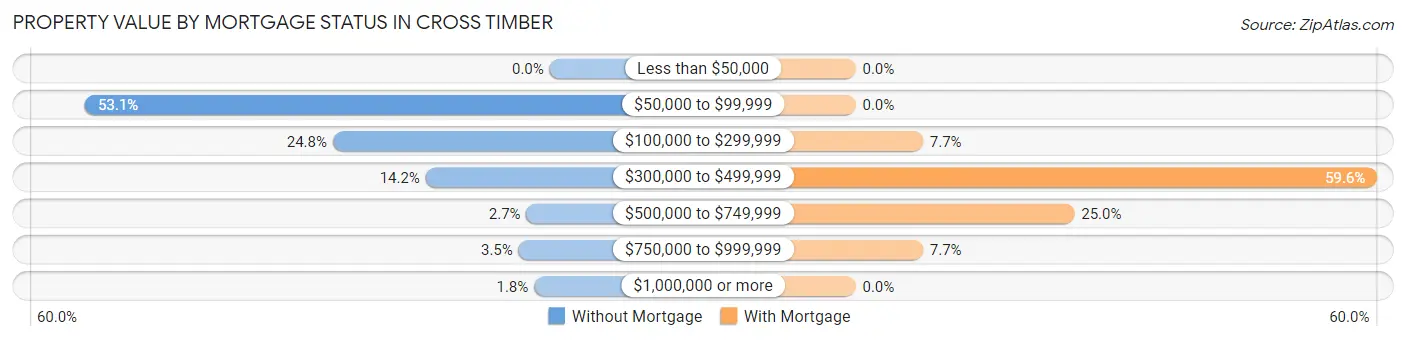
| Property Value | Without Mortgage | With Mortgage |
| Less than $50,000 | 0 (0.0%) | 0 (0.0%) |
| $50,000 to $99,999 | 60 (53.1%) | 0 (0.0%) |
| $100,000 to $299,999 | 28 (24.8%) | 4 (7.7%) |
| $300,000 to $499,999 | 16 (14.2%) | 31 (59.6%) |
| $500,000 to $749,999 | 3 (2.6%) | 13 (25.0%) |
| $750,000 to $999,999 | 4 (3.5%) | 4 (7.7%) |
| $1,000,000 or more | 2 (1.8%) | 0 (0.0%) |
| Total | 113 (100.0%) | 52 (100.0%) |
Household Income by Mortgage Status in Cross Timber
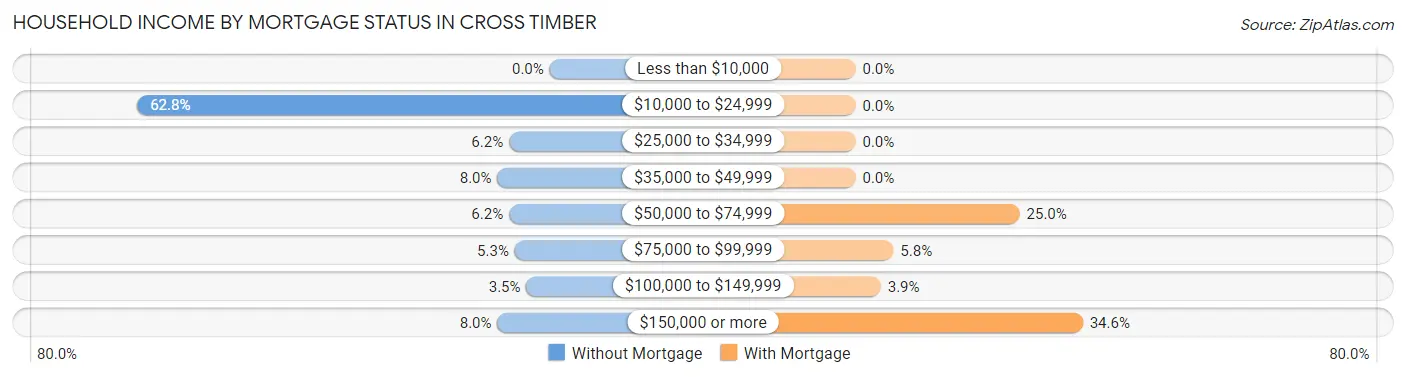
| Household Income | Without Mortgage | With Mortgage |
| Less than $10,000 | 0 (0.0%) | 0 (0.0%) |
| $10,000 to $24,999 | 71 (62.8%) | 0 (0.0%) |
| $25,000 to $34,999 | 7 (6.2%) | 0 (0.0%) |
| $35,000 to $49,999 | 9 (8.0%) | 0 (0.0%) |
| $50,000 to $74,999 | 7 (6.2%) | 13 (25.0%) |
| $75,000 to $99,999 | 6 (5.3%) | 3 (5.8%) |
| $100,000 to $149,999 | 4 (3.5%) | 2 (3.8%) |
| $150,000 or more | 9 (8.0%) | 18 (34.6%) |
| Total | 113 (100.0%) | 52 (100.0%) |
Property Value to Household Income Ratio in Cross Timber
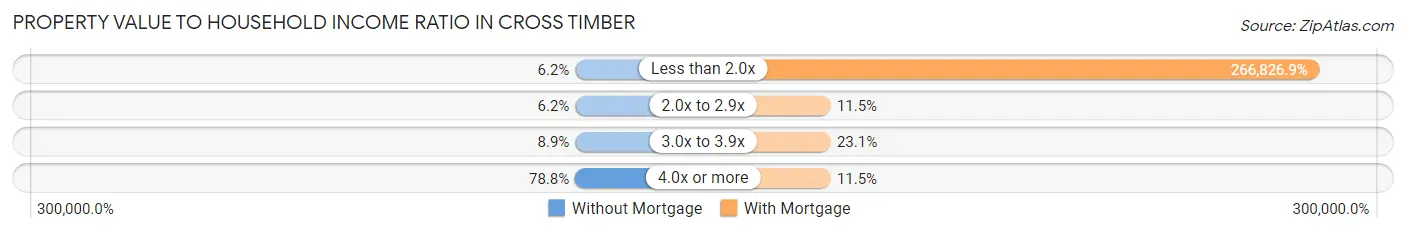
| Value-to-Income Ratio | Without Mortgage | With Mortgage |
| Less than 2.0x | 7 (6.2%) | 138,750 (266,826.9%) |
| 2.0x to 2.9x | 7 (6.2%) | 6 (11.5%) |
| 3.0x to 3.9x | 10 (8.8%) | 12 (23.1%) |
| 4.0x or more | 89 (78.8%) | 6 (11.5%) |
| Total | 113 (100.0%) | 52 (100.0%) |
Real Estate Taxes by Mortgage Status in Cross Timber
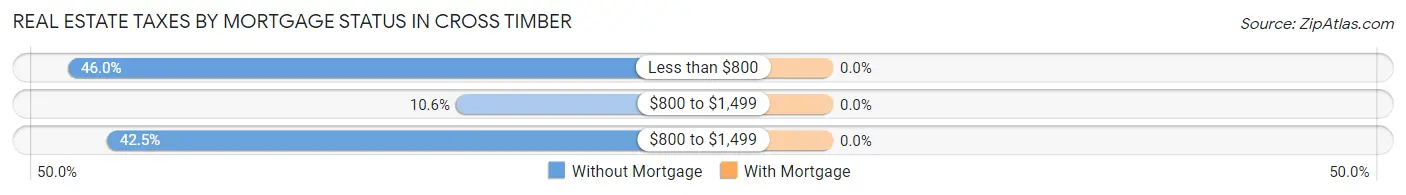
| Property Taxes | Without Mortgage | With Mortgage |
| Less than $800 | 52 (46.0%) | 0 (0.0%) |
| $800 to $1,499 | 12 (10.6%) | 0 (0.0%) |
| $800 to $1,499 | 48 (42.5%) | 0 (0.0%) |
| Total | 113 (100.0%) | 52 (100.0%) |
Health & Disability in Cross Timber
Health Insurance Coverage by Age in Cross Timber
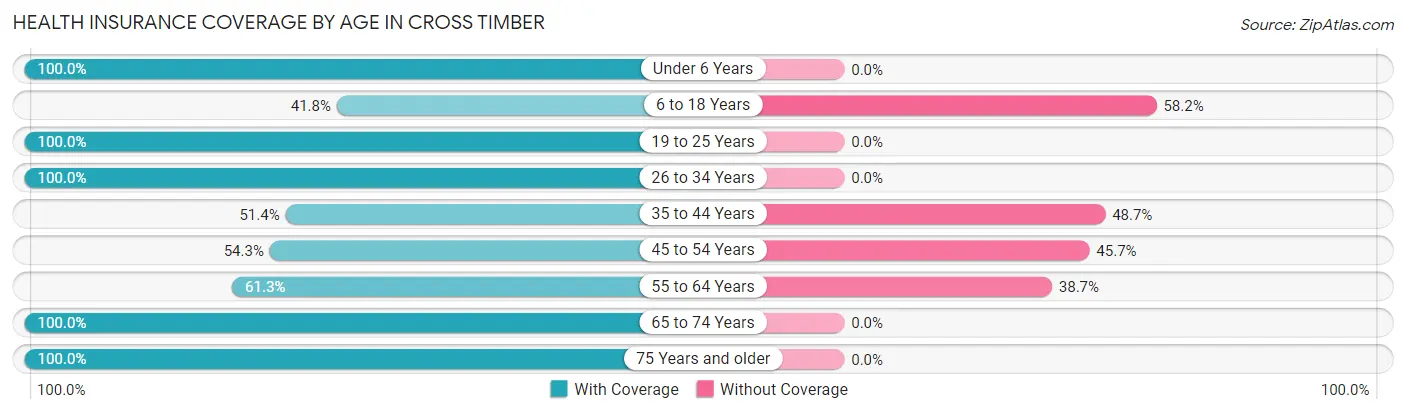
| Age Bracket | With Coverage | Without Coverage |
| Under 6 Years | 10 (100.0%) | 0 (0.0%) |
| 6 to 18 Years | 89 (41.8%) | 124 (58.2%) |
| 19 to 25 Years | 7 (100.0%) | 0 (0.0%) |
| 26 to 34 Years | 26 (100.0%) | 0 (0.0%) |
| 35 to 44 Years | 57 (51.3%) | 54 (48.6%) |
| 45 to 54 Years | 19 (54.3%) | 16 (45.7%) |
| 55 to 64 Years | 38 (61.3%) | 24 (38.7%) |
| 65 to 74 Years | 29 (100.0%) | 0 (0.0%) |
| 75 Years and older | 35 (100.0%) | 0 (0.0%) |
| Total | 310 (58.7%) | 218 (41.3%) |
Health Insurance Coverage by Citizenship Status in Cross Timber
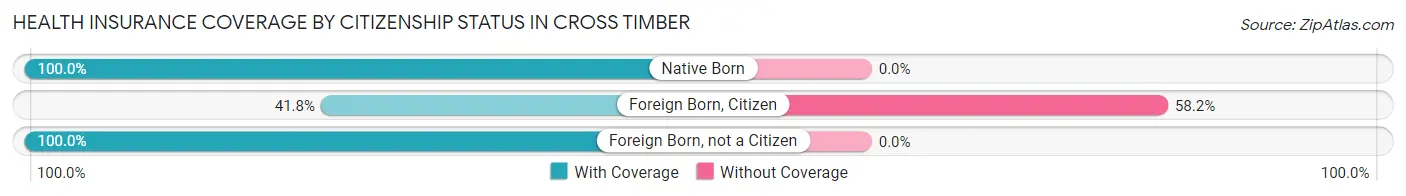
| Citizenship Status | With Coverage | Without Coverage |
| Native Born | 10 (100.0%) | 0 (0.0%) |
| Foreign Born, Citizen | 89 (41.8%) | 124 (58.2%) |
| Foreign Born, not a Citizen | 7 (100.0%) | 0 (0.0%) |
Health Insurance Coverage by Household Income in Cross Timber
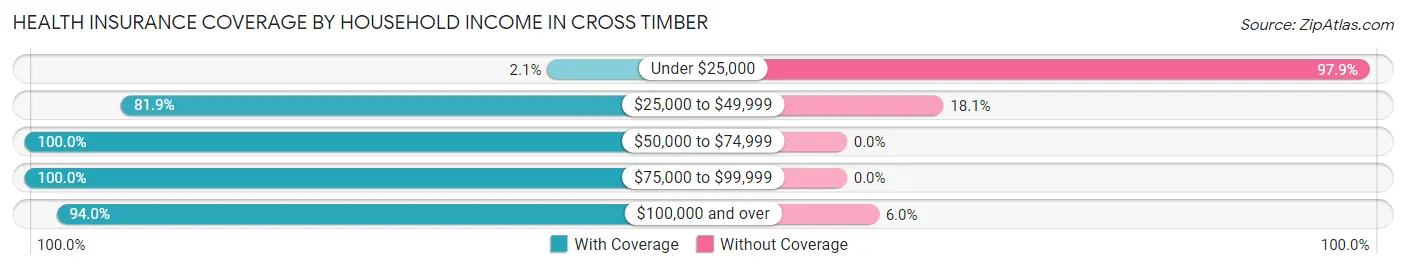
| Household Income | With Coverage | Without Coverage |
| Under $25,000 | 4 (2.1%) | 188 (97.9%) |
| $25,000 to $49,999 | 86 (81.9%) | 19 (18.1%) |
| $50,000 to $74,999 | 32 (100.0%) | 0 (0.0%) |
| $75,000 to $99,999 | 15 (100.0%) | 0 (0.0%) |
| $100,000 and over | 173 (94.0%) | 11 (6.0%) |
Public vs Private Health Insurance Coverage by Age in Cross Timber
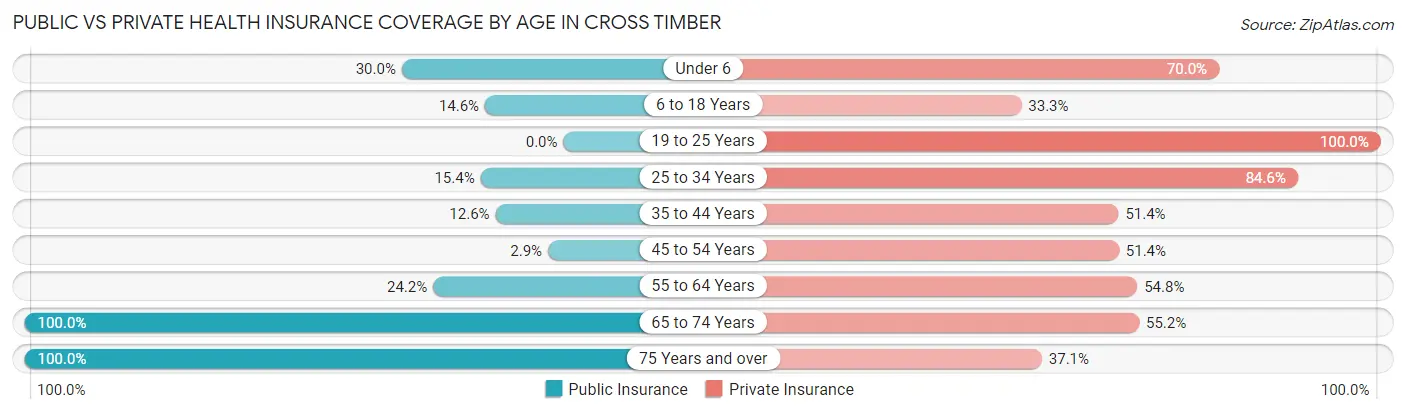
| Age Bracket | Public Insurance | Private Insurance |
| Under 6 | 3 (30.0%) | 7 (70.0%) |
| 6 to 18 Years | 31 (14.5%) | 71 (33.3%) |
| 19 to 25 Years | 0 (0.0%) | 7 (100.0%) |
| 25 to 34 Years | 4 (15.4%) | 22 (84.6%) |
| 35 to 44 Years | 14 (12.6%) | 57 (51.3%) |
| 45 to 54 Years | 1 (2.9%) | 18 (51.4%) |
| 55 to 64 Years | 15 (24.2%) | 34 (54.8%) |
| 65 to 74 Years | 29 (100.0%) | 16 (55.2%) |
| 75 Years and over | 35 (100.0%) | 13 (37.1%) |
| Total | 132 (25.0%) | 245 (46.4%) |
Disability Status by Sex by Age in Cross Timber
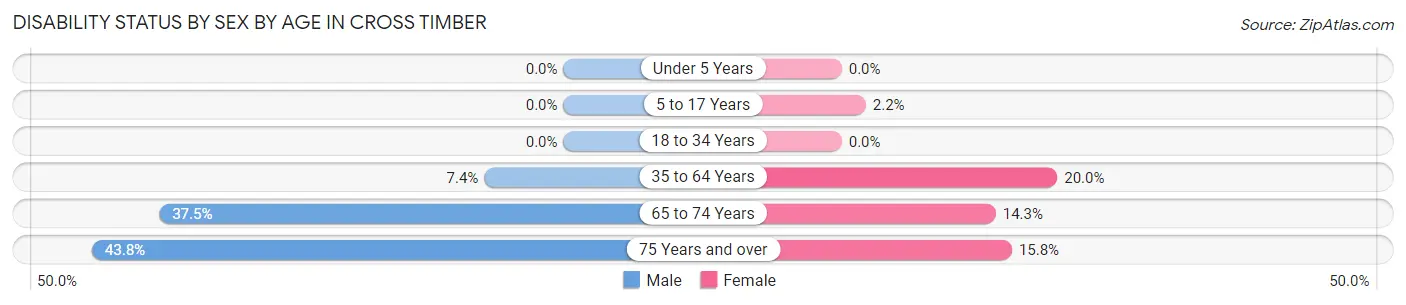
| Age Bracket | Male | Female |
| Under 5 Years | 0 (0.0%) | 0 (0.0%) |
| 5 to 17 Years | 0 (0.0%) | 4 (2.2%) |
| 18 to 34 Years | 0 (0.0%) | 0 (0.0%) |
| 35 to 64 Years | 5 (7.3%) | 28 (20.0%) |
| 65 to 74 Years | 3 (37.5%) | 3 (14.3%) |
| 75 Years and over | 7 (43.8%) | 3 (15.8%) |
Disability Class by Sex by Age in Cross Timber
Disability Class: Hearing Difficulty
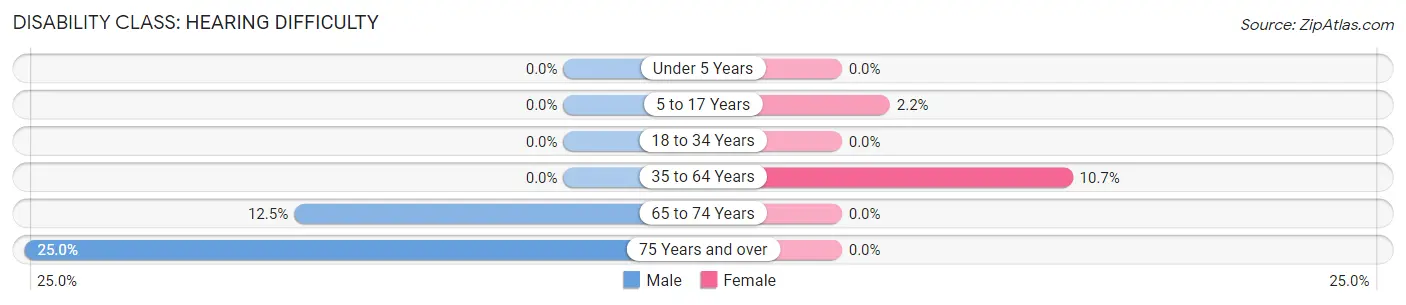
| Age Bracket | Male | Female |
| Under 5 Years | 0 (0.0%) | 0 (0.0%) |
| 5 to 17 Years | 0 (0.0%) | 4 (2.2%) |
| 18 to 34 Years | 0 (0.0%) | 0 (0.0%) |
| 35 to 64 Years | 0 (0.0%) | 15 (10.7%) |
| 65 to 74 Years | 1 (12.5%) | 0 (0.0%) |
| 75 Years and over | 4 (25.0%) | 0 (0.0%) |
Disability Class: Vision Difficulty
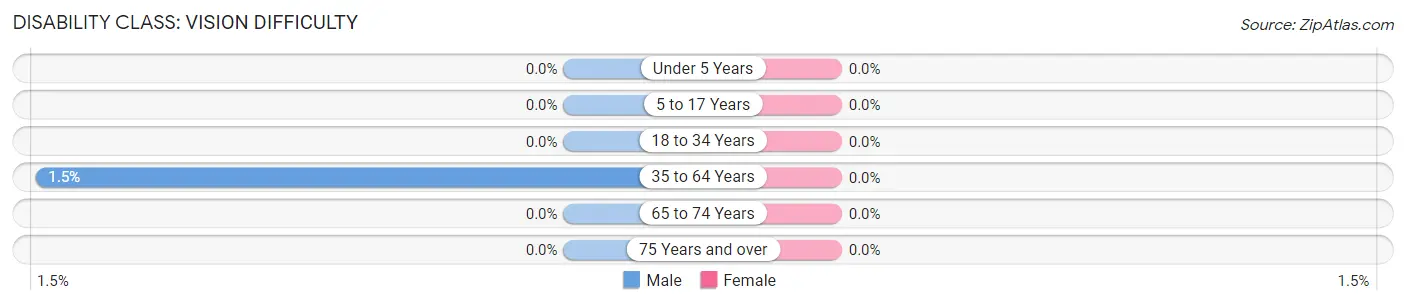
| Age Bracket | Male | Female |
| Under 5 Years | 0 (0.0%) | 0 (0.0%) |
| 5 to 17 Years | 0 (0.0%) | 0 (0.0%) |
| 18 to 34 Years | 0 (0.0%) | 0 (0.0%) |
| 35 to 64 Years | 1 (1.5%) | 0 (0.0%) |
| 65 to 74 Years | 0 (0.0%) | 0 (0.0%) |
| 75 Years and over | 0 (0.0%) | 0 (0.0%) |
Disability Class: Cognitive Difficulty
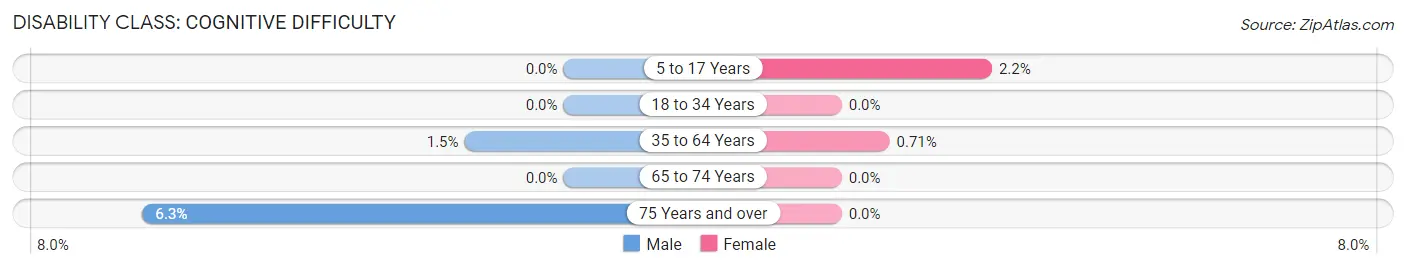
| Age Bracket | Male | Female |
| 5 to 17 Years | 0 (0.0%) | 4 (2.2%) |
| 18 to 34 Years | 0 (0.0%) | 0 (0.0%) |
| 35 to 64 Years | 1 (1.5%) | 1 (0.7%) |
| 65 to 74 Years | 0 (0.0%) | 0 (0.0%) |
| 75 Years and over | 1 (6.2%) | 0 (0.0%) |
Disability Class: Ambulatory Difficulty
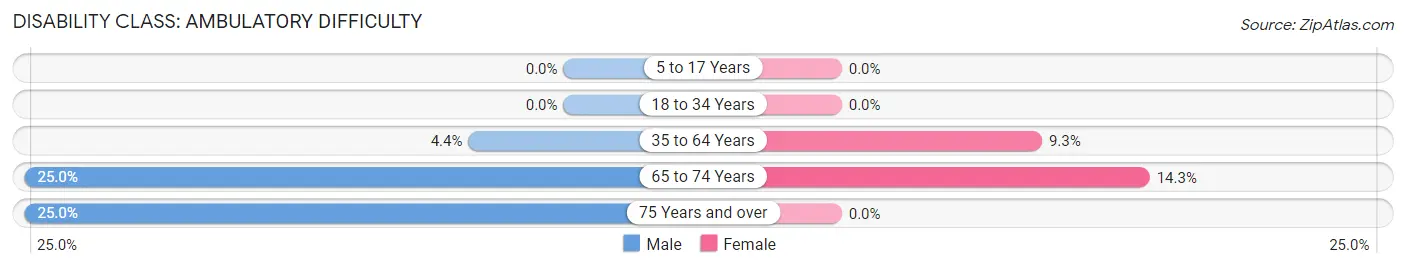
| Age Bracket | Male | Female |
| 5 to 17 Years | 0 (0.0%) | 0 (0.0%) |
| 18 to 34 Years | 0 (0.0%) | 0 (0.0%) |
| 35 to 64 Years | 3 (4.4%) | 13 (9.3%) |
| 65 to 74 Years | 2 (25.0%) | 3 (14.3%) |
| 75 Years and over | 4 (25.0%) | 0 (0.0%) |
Disability Class: Self-Care Difficulty
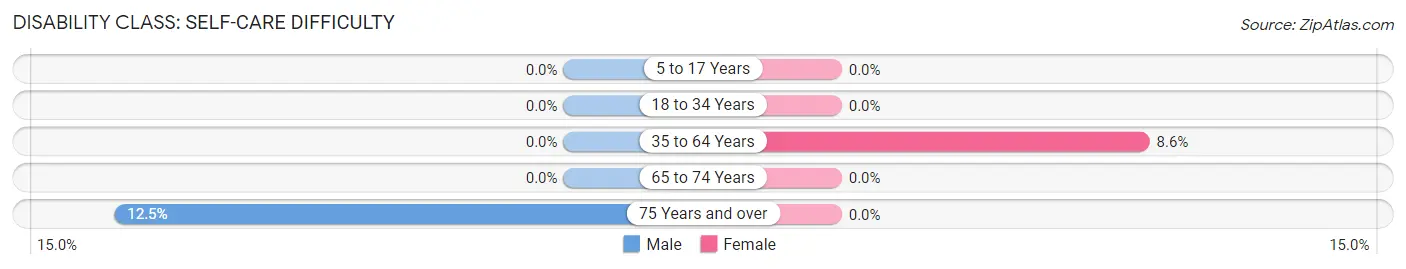
| Age Bracket | Male | Female |
| 5 to 17 Years | 0 (0.0%) | 0 (0.0%) |
| 18 to 34 Years | 0 (0.0%) | 0 (0.0%) |
| 35 to 64 Years | 0 (0.0%) | 12 (8.6%) |
| 65 to 74 Years | 0 (0.0%) | 0 (0.0%) |
| 75 Years and over | 2 (12.5%) | 0 (0.0%) |
Technology Access in Cross Timber
Computing Device Access in Cross Timber
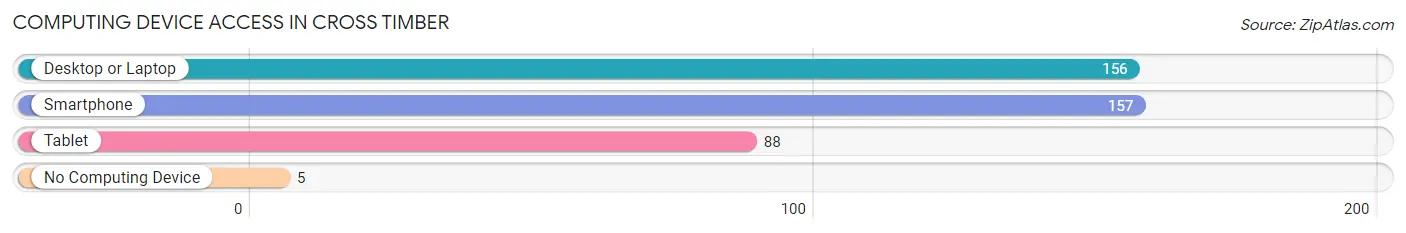
| Device Type | # Households | % Households |
| Desktop or Laptop | 156 | 91.8% |
| Smartphone | 157 | 92.3% |
| Tablet | 88 | 51.8% |
| No Computing Device | 5 | 2.9% |
| Total | 170 | 100.0% |
Internet Access in Cross Timber
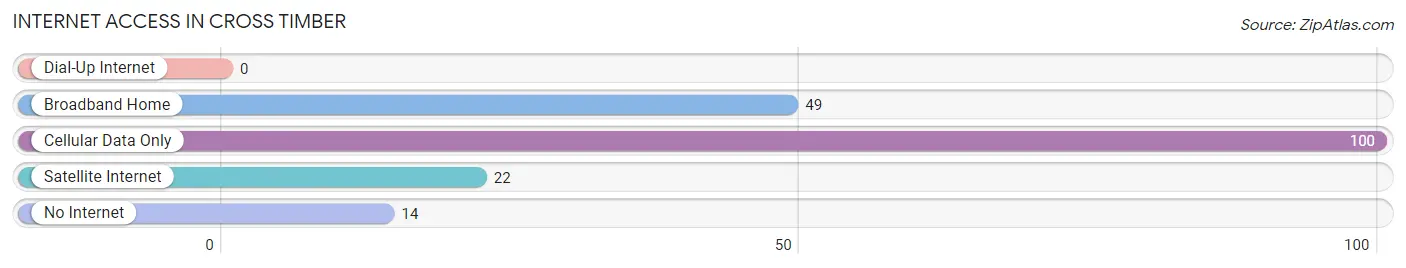
| Internet Type | # Households | % Households |
| Dial-Up Internet | 0 | 0.0% |
| Broadband Home | 49 | 28.8% |
| Cellular Data Only | 100 | 58.8% |
| Satellite Internet | 22 | 12.9% |
| No Internet | 14 | 8.2% |
| Total | 170 | 100.0% |
Cross Timber Summary
Timber Cross, Texas is a small unincorporated community located in the southeastern corner of Collin County, Texas. It is situated approximately 25 miles northeast of Dallas and is part of the Dallas-Fort Worth-Arlington metropolitan area. The population of Timber Cross was estimated to be around 1,000 in 2020.
History
The area that is now Timber Cross was first settled in the late 1800s by a group of German immigrants. The town was originally known as “Cross Timbers” due to the abundance of trees in the area. The name was later shortened to “Timber Cross”.
The town was officially incorporated in 1891 and was home to a variety of businesses, including a general store, a blacksmith shop, a cotton gin, and a post office. The town also had a school, which was built in 1892.
In the early 1900s, the town began to decline due to the Great Depression and the Dust Bowl. Many of the businesses closed and the population decreased.
In the 1950s, the town began to experience a resurgence as the Dallas-Fort Worth area began to grow. The population increased and new businesses opened.
Geography
Timber Cross is located in the southeastern corner of Collin County, Texas. It is situated approximately 25 miles northeast of Dallas and is part of the Dallas-Fort Worth-Arlington metropolitan area.
The town is situated on the banks of the Trinity River and is surrounded by rolling hills and wooded areas. The climate is generally mild, with hot summers and cool winters.
Economy
The economy of Timber Cross is largely based on agriculture and ranching. The town is home to several farms and ranches, which produce a variety of crops and livestock.
The town also has a few small businesses, including a general store, a gas station, and a few restaurants.
Demographics
The population of Timber Cross was estimated to be around 1,000 in 2020. The town is predominantly white, with a small Hispanic population. The median household income is around $50,000.
The town is served by the Timber Cross Independent School District, which includes one elementary school, one middle school, and one high school. The town also has a public library and a few churches.
Conclusion
Timber Cross, Texas is a small unincorporated community located in the southeastern corner of Collin County, Texas. It is situated approximately 25 miles northeast of Dallas and is part of the Dallas-Fort Worth-Arlington metropolitan area. The population of Timber Cross was estimated to be around 1,000 in 2020. The town is predominantly white, with a small Hispanic population. The economy of Timber Cross is largely based on agriculture and ranching. The town is served by the Timber Cross Independent School District, which includes one elementary school, one middle school, and one high school. The town also has a public library and a few churches.
Common Questions
What is the Total Population of Cross Timber?
Total Population of Cross Timber is 532.
What is the Total Male Population of Cross Timber?
Total Male Population of Cross Timber is 139.
What is the Total Female Population of Cross Timber?
Total Female Population of Cross Timber is 393.
What is the Ratio of Males per 100 Females in Cross Timber?
There are 35.37 Males per 100 Females in Cross Timber.
What is the Ratio of Females per 100 Males in Cross Timber?
There are 282.73 Females per 100 Males in Cross Timber.
What is the Median Population Age in Cross Timber?
Median Population Age in Cross Timber is 38.2 Years.
What is the Average Family Size in Cross Timber
Average Family Size in Cross Timber is 3.5 People.
What is the Average Household Size in Cross Timber
Average Household Size in Cross Timber is 3.1 People.
What is Per Capita Income in Cross Timber?
Per Capita income in Cross Timber is $23,977.
What is the Median Family Income in Cross Timber?
Median Family Income in Cross Timber is $43,333.
What is the Median Household income in Cross Timber?
Median Household Income in Cross Timber is $41,136.
What is Income or Wage Gap in Cross Timber?
Income or Wage Gap in Cross Timber is 83.2%.
Women in Cross Timber earn 16.8 cents for every dollar earned by a man.
What is Inequality or Gini Index in Cross Timber?
Inequality or Gini Index in Cross Timber is 0.56.
How Large is the Labor Force in Cross Timber?
There are 206 People in the Labor Forcein in Cross Timber.
What is the Percentage of People in the Labor Force in Cross Timber?
64.6% of People are in the Labor Force in Cross Timber.
What is the Unemployment Rate in Cross Timber?
Unemployment Rate in Cross Timber is 14.4%.