Cesar Chavez, TX
Cesar Chavez Overview
1,817
TOTAL POPULATION
864
MALE POPULATION
953
FEMALE POPULATION
90.66
MALES / 100 FEMALES
110.30
FEMALES / 100 MALES
32.0
MEDIAN AGE
3.6
AVG FAMILY SIZE
3.4
AVG HOUSEHOLD SIZE
$24,346
PER CAPITA INCOME
$77,813
AVG FAMILY INCOME
$77,594
AVG HOUSEHOLD INCOME
40.1%
WAGE / INCOME GAP [ % ]
59.9¢/ $1
WAGE / INCOME GAP [ $ ]
0.35
INEQUALITY / GINI INDEX
754
LABOR FORCE [ PEOPLE ]
57.2%
PERCENT IN LABOR FORCE
7.6%
UNEMPLOYMENT RATE
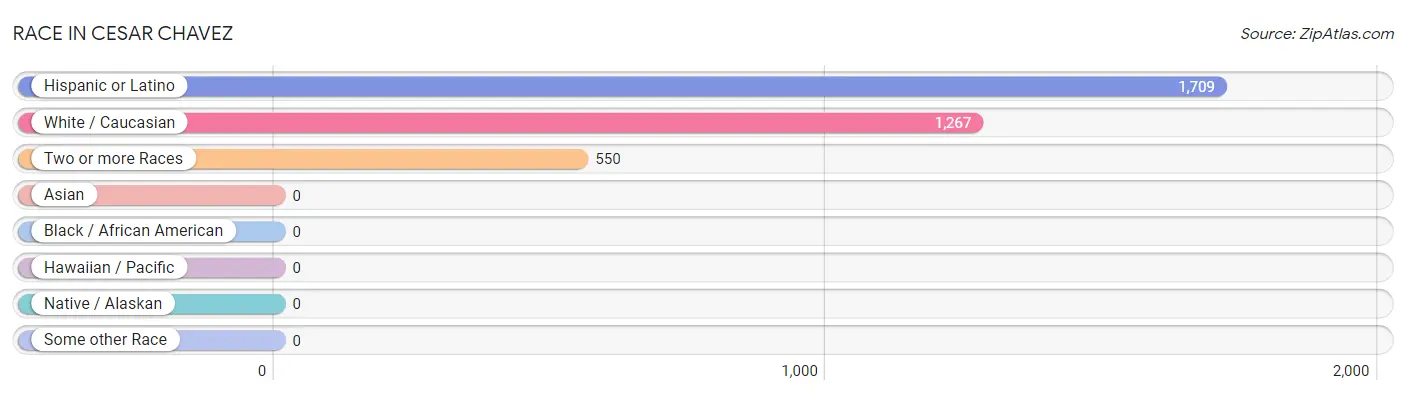
Race in Cesar Chavez
The most populous races in Cesar Chavez are Hispanic or Latino (1,709 | 94.1%), White / Caucasian (1,267 | 69.7%), and Two or more Races (550 | 30.3%).
| Race | # Population | % Population |
| Asian | 0 | 0.0% |
| Black / African American | 0 | 0.0% |
| Hawaiian / Pacific | 0 | 0.0% |
| Hispanic or Latino | 1,709 | 94.1% |
| Native / Alaskan | 0 | 0.0% |
| White / Caucasian | 1,267 | 69.7% |
| Two or more Races | 550 | 30.3% |
| Some other Race | 0 | 0.0% |
| Total | 1,817 | 100.0% |
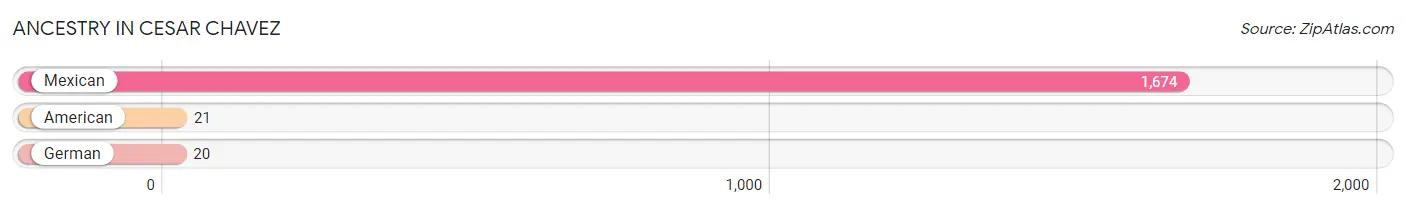
Ancestry in Cesar Chavez
The most populous ancestries reported in Cesar Chavez are Mexican (1,674 | 92.1%), American (21 | 1.2%), and German (20 | 1.1%), together accounting for 94.4% of all Cesar Chavez residents.
| Ancestry | # Population | % Population |
| American | 21 | 1.2% |
| German | 20 | 1.1% |
| Mexican | 1,674 | 92.1% | View All 3 Rows |
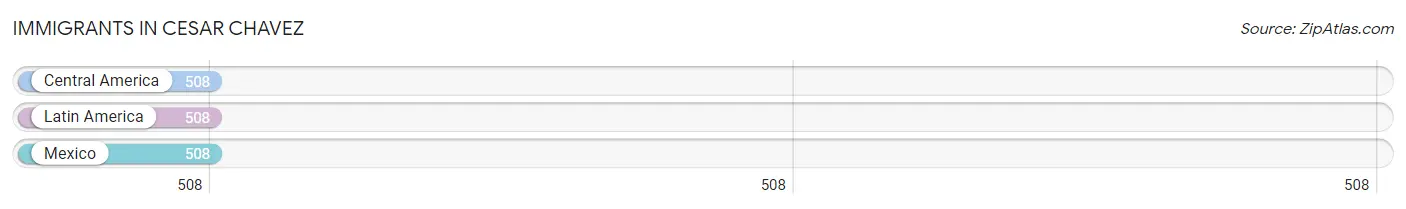
Immigrants in Cesar Chavez
The most numerous immigrant groups reported in Cesar Chavez came from Central America (508 | 28.0%), Latin America (508 | 28.0%), and Mexico (508 | 28.0%), together accounting for 83.9% of all Cesar Chavez residents.
| Immigration Origin | # Population | % Population |
| Central America | 508 | 28.0% |
| Latin America | 508 | 28.0% |
| Mexico | 508 | 28.0% | View All 3 Rows |
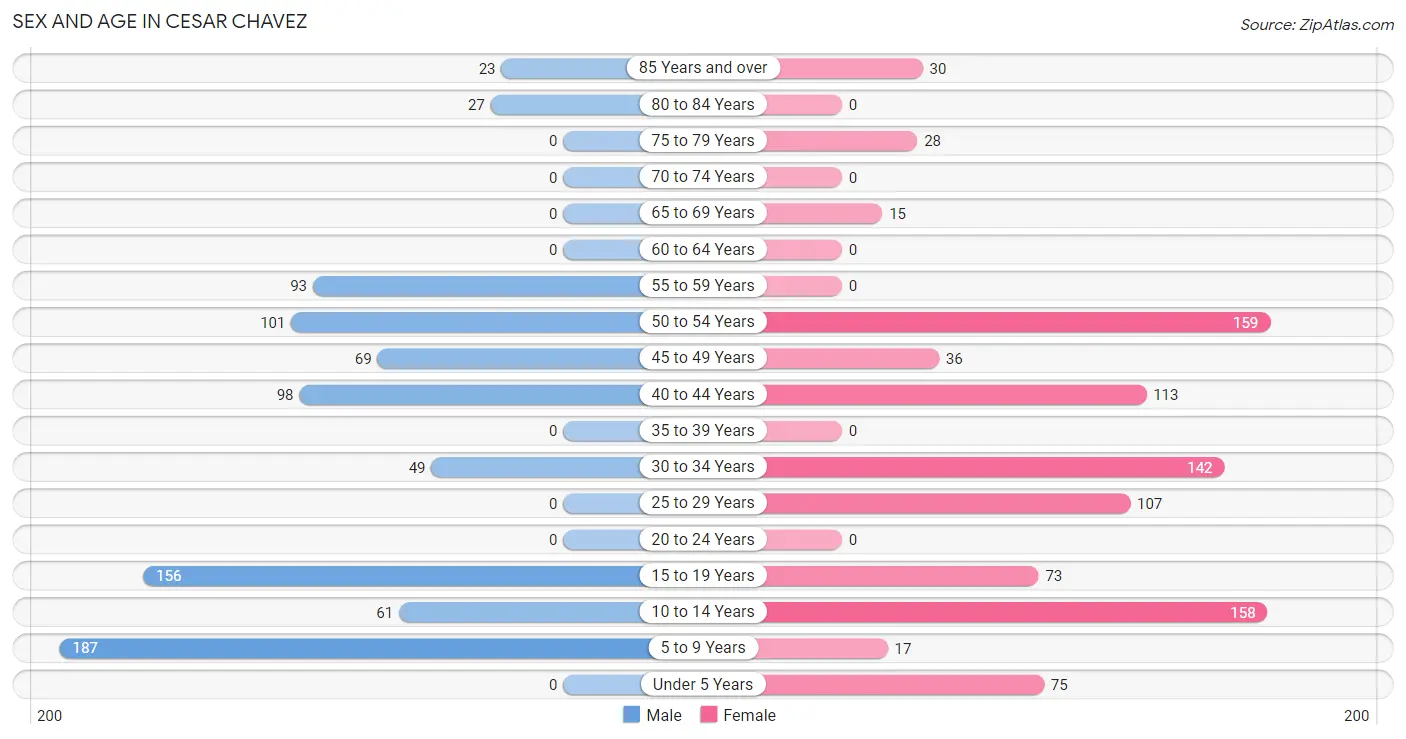
Sex and Age in Cesar Chavez
Sex and Age in Cesar Chavez
The most populous age groups in Cesar Chavez are 5 to 9 Years (187 | 21.6%) for men and 50 to 54 Years (159 | 16.7%) for women.
| Age Bracket | Male | Female |
| Under 5 Years | 0 (0.0%) | 75 (7.9%) |
| 5 to 9 Years | 187 (21.6%) | 17 (1.8%) |
| 10 to 14 Years | 61 (7.1%) | 158 (16.6%) |
| 15 to 19 Years | 156 (18.1%) | 73 (7.7%) |
| 20 to 24 Years | 0 (0.0%) | 0 (0.0%) |
| 25 to 29 Years | 0 (0.0%) | 107 (11.2%) |
| 30 to 34 Years | 49 (5.7%) | 142 (14.9%) |
| 35 to 39 Years | 0 (0.0%) | 0 (0.0%) |
| 40 to 44 Years | 98 (11.3%) | 113 (11.9%) |
| 45 to 49 Years | 69 (8.0%) | 36 (3.8%) |
| 50 to 54 Years | 101 (11.7%) | 159 (16.7%) |
| 55 to 59 Years | 93 (10.8%) | 0 (0.0%) |
| 60 to 64 Years | 0 (0.0%) | 0 (0.0%) |
| 65 to 69 Years | 0 (0.0%) | 15 (1.6%) |
| 70 to 74 Years | 0 (0.0%) | 0 (0.0%) |
| 75 to 79 Years | 0 (0.0%) | 28 (2.9%) |
| 80 to 84 Years | 27 (3.1%) | 0 (0.0%) |
| 85 Years and over | 23 (2.7%) | 30 (3.2%) |
| Total | 864 (100.0%) | 953 (100.0%) |
Families and Households in Cesar Chavez
Median Family Size in Cesar Chavez
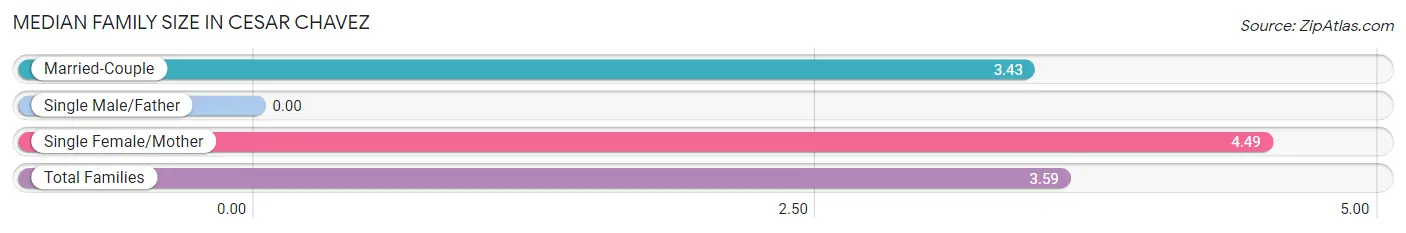
| Family Type | # Families | Family Size |
| Married-Couple | 404 (84.5%) | 3.43 |
| Single Male/Father | 0 (0.0%) | - |
| Single Female/Mother | 74 (15.5%) | 4.49 |
| Total Families | 478 (100.0%) | 3.59 |
Median Household Size in Cesar Chavez
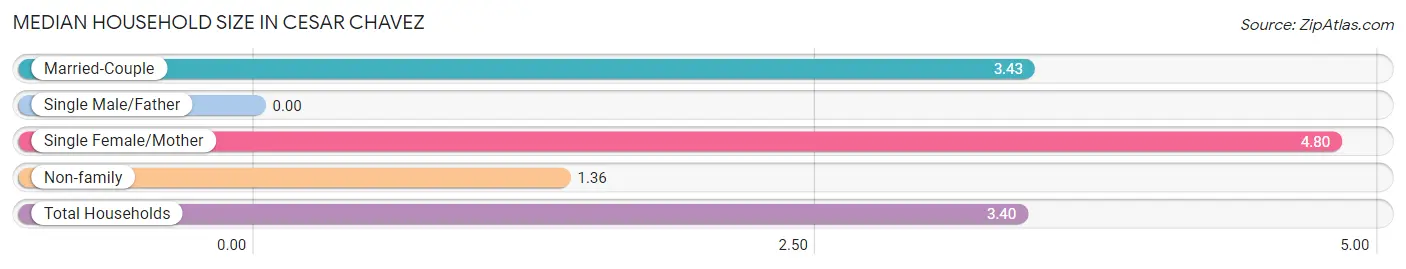
| Household Type | # Households | Household Size |
| Married-Couple | 404 (75.7%) | 3.43 |
| Single Male/Father | 0 (0.0%) | - |
| Single Female/Mother | 74 (13.9%) | 4.80 |
| Non-family | 56 (10.5%) | 1.36 |
| Total Households | 534 (100.0%) | 3.40 |
Household Size by Marriage Status in Cesar Chavez
Out of a total of 534 households in Cesar Chavez, 478 (89.5%) are family households, while 56 (10.5%) are nonfamily households. The most numerous type of family households are 4-person households, comprising 331, and the most common type of nonfamily households are 1-person households, comprising 35.
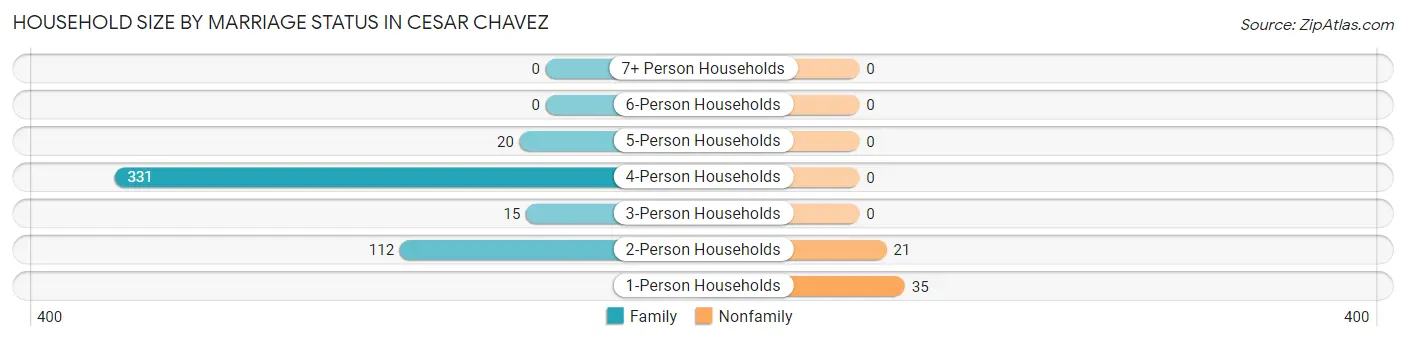
| Household Size | Family Households | Nonfamily Households |
| 1-Person Households | - | 35 (6.6%) |
| 2-Person Households | 112 (21.0%) | 21 (3.9%) |
| 3-Person Households | 15 (2.8%) | 0 (0.0%) |
| 4-Person Households | 331 (62.0%) | 0 (0.0%) |
| 5-Person Households | 20 (3.7%) | 0 (0.0%) |
| 6-Person Households | 0 (0.0%) | 0 (0.0%) |
| 7+ Person Households | 0 (0.0%) | 0 (0.0%) |
| Total | 478 (89.5%) | 56 (10.5%) |
Female Fertility in Cesar Chavez
Fertility by Age in Cesar Chavez
Average fertility rate in Cesar Chavez is 29.0 births per 1,000 women. Women in the age bracket of 35 to 50 years have the highest fertility rate with 71.0 births per 1,000 women. Women in the age bracket of 35 to 50 years acount for 100.0% of all women with births.
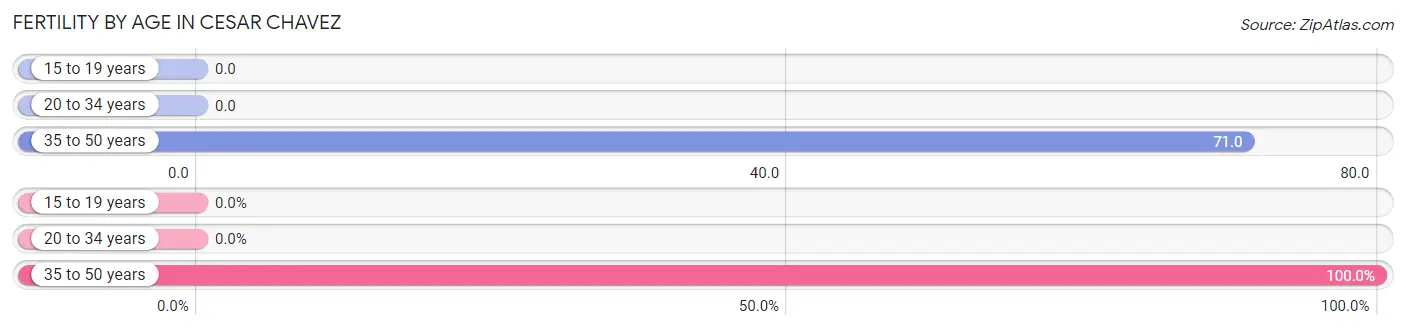
| Age Bracket | Women with Births | Births / 1,000 Women |
| 15 to 19 years | 0 (0.0%) | 0.0 |
| 20 to 34 years | 0 (0.0%) | 0.0 |
| 35 to 50 years | 16 (100.0%) | 71.0 |
| Total | 16 (100.0%) | 29.0 |
Fertility by Age by Marriage Status in Cesar Chavez
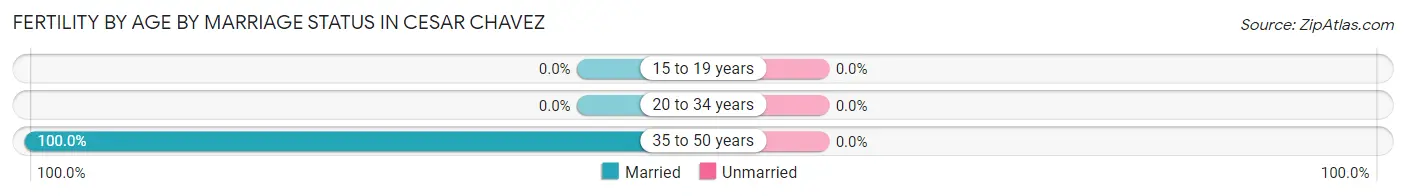
| Age Bracket | Married | Unmarried |
| 15 to 19 years | 0 (0.0%) | 0 (0.0%) |
| 20 to 34 years | 0 (0.0%) | 0 (0.0%) |
| 35 to 50 years | 16 (100.0%) | 0 (0.0%) |
| Total | 16 (100.0%) | 0 (0.0%) |
Fertility by Education in Cesar Chavez
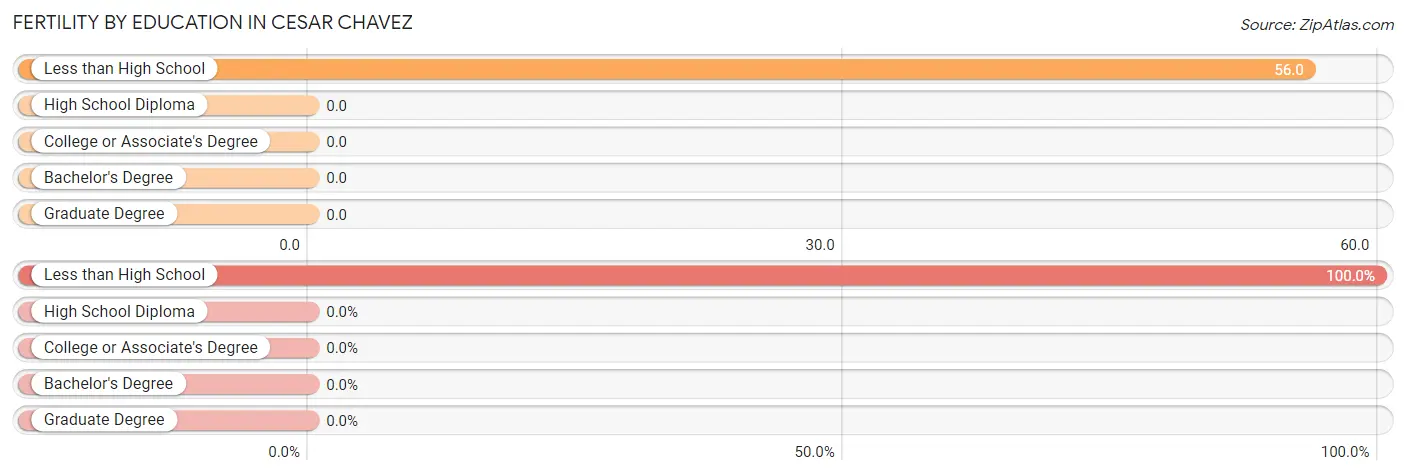
| Educational Attainment | Women with Births | Births / 1,000 Women |
| Less than High School | 16 (100.0%) | 56.0 |
| High School Diploma | 0 (0.0%) | 0.0 |
| College or Associate's Degree | 0 (0.0%) | 0.0 |
| Bachelor's Degree | 0 (0.0%) | 0.0 |
| Graduate Degree | 0 (0.0%) | 0.0 |
| Total | 16 (100.0%) | 29.0 |
Fertility by Education by Marriage Status in Cesar Chavez
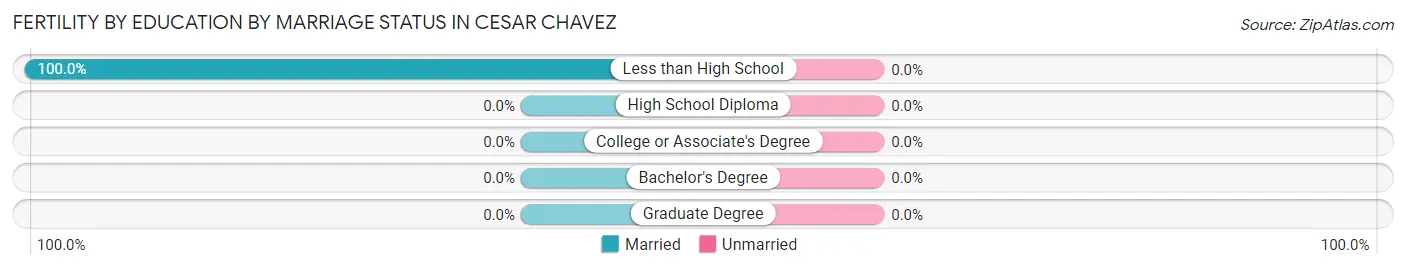
| Educational Attainment | Married | Unmarried |
| Less than High School | 16 (100.0%) | 0 (0.0%) |
| High School Diploma | 0 (0.0%) | 0 (0.0%) |
| College or Associate's Degree | 0 (0.0%) | 0 (0.0%) |
| Bachelor's Degree | 0 (0.0%) | 0 (0.0%) |
| Graduate Degree | 0 (0.0%) | 0 (0.0%) |
| Total | 16 (100.0%) | 0 (0.0%) |
Income in Cesar Chavez
Income Overview in Cesar Chavez
Per Capita Income in Cesar Chavez is $24,346, while median incomes of families and households are $77,813 and $77,594 respectively.
| Characteristic | Number | Measure |
| Per Capita Income | 1,817 | $24,346 |
| Median Family Income | 478 | $77,813 |
| Mean Family Income | 478 | $84,065 |
| Median Household Income | 534 | $77,594 |
| Mean Household Income | 534 | $80,284 |
| Income Deficit | 478 | $0 |
| Wage / Income Gap (%) | 1,817 | 40.06% |
| Wage / Income Gap ($) | 1,817 | 59.94¢ per $1 |
| Gini / Inequality Index | 1,817 | 0.35 |
Earnings by Sex in Cesar Chavez
Average Earnings in Cesar Chavez are $51,726, $54,016 for men and $32,375 for women, a difference of 40.1%.
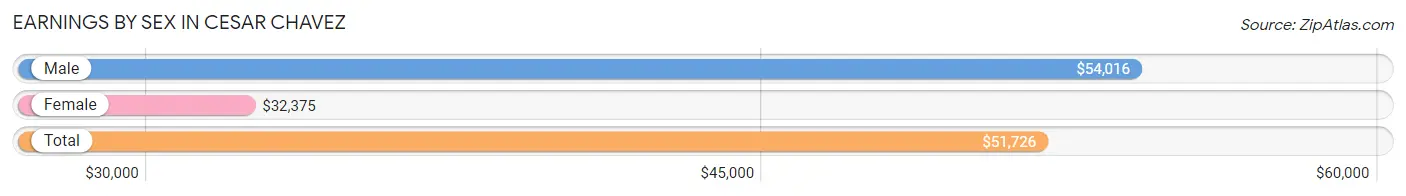
| Sex | Number | Average Earnings |
| Male | 481 (69.0%) | $54,016 |
| Female | 216 (31.0%) | $32,375 |
| Total | 697 (100.0%) | $51,726 |
Earnings by Sex by Income Bracket in Cesar Chavez
The most common earnings brackets in Cesar Chavez are $25,000 to $29,999 for men (140 | 29.1%) and $25,000 to $29,999 for women (69 | 31.9%).
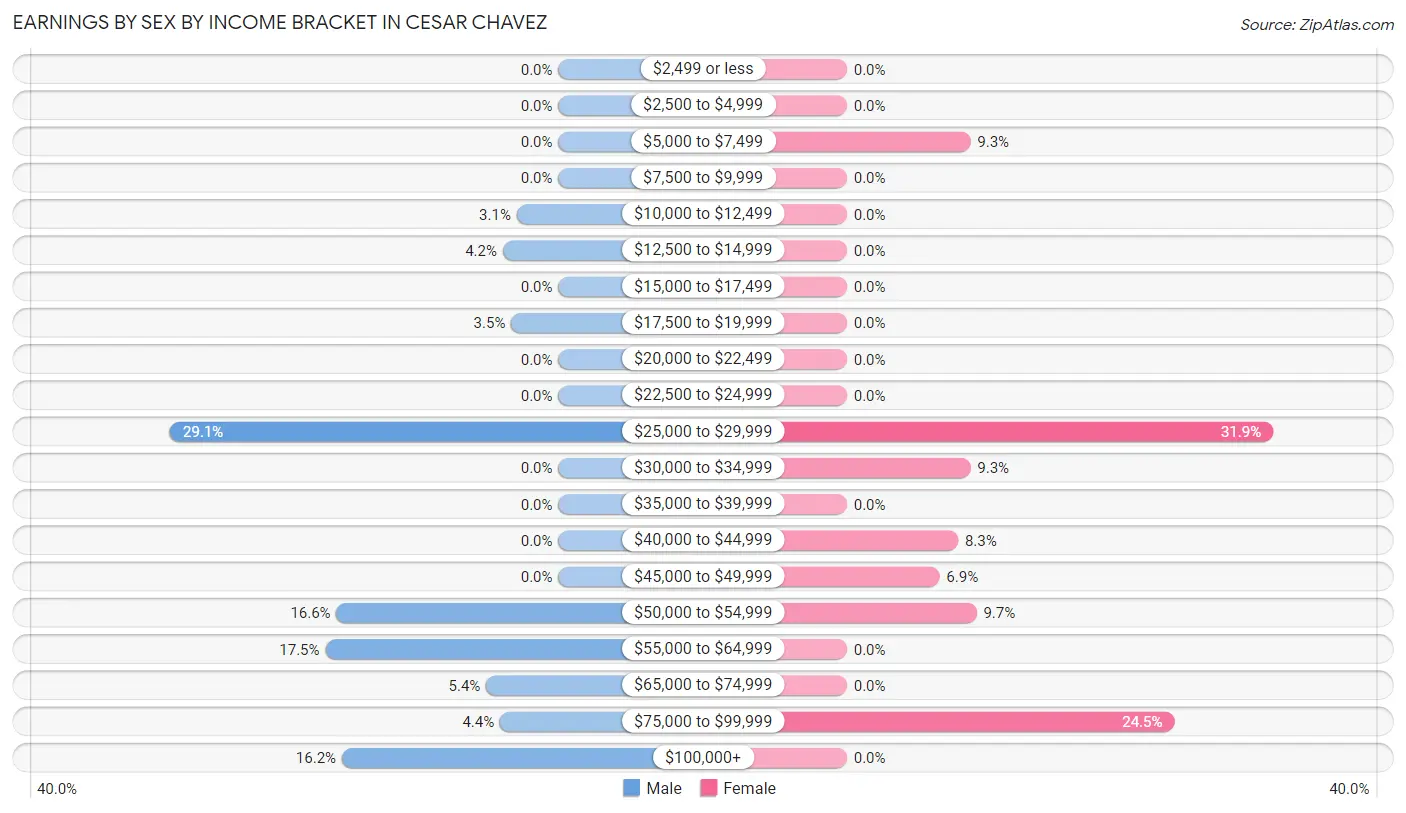
| Income | Male | Female |
| $2,499 or less | 0 (0.0%) | 0 (0.0%) |
| $2,500 to $4,999 | 0 (0.0%) | 0 (0.0%) |
| $5,000 to $7,499 | 0 (0.0%) | 20 (9.3%) |
| $7,500 to $9,999 | 0 (0.0%) | 0 (0.0%) |
| $10,000 to $12,499 | 15 (3.1%) | 0 (0.0%) |
| $12,500 to $14,999 | 20 (4.2%) | 0 (0.0%) |
| $15,000 to $17,499 | 0 (0.0%) | 0 (0.0%) |
| $17,500 to $19,999 | 17 (3.5%) | 0 (0.0%) |
| $20,000 to $22,499 | 0 (0.0%) | 0 (0.0%) |
| $22,500 to $24,999 | 0 (0.0%) | 0 (0.0%) |
| $25,000 to $29,999 | 140 (29.1%) | 69 (31.9%) |
| $30,000 to $34,999 | 0 (0.0%) | 20 (9.3%) |
| $35,000 to $39,999 | 0 (0.0%) | 0 (0.0%) |
| $40,000 to $44,999 | 0 (0.0%) | 18 (8.3%) |
| $45,000 to $49,999 | 0 (0.0%) | 15 (6.9%) |
| $50,000 to $54,999 | 80 (16.6%) | 21 (9.7%) |
| $55,000 to $64,999 | 84 (17.5%) | 0 (0.0%) |
| $65,000 to $74,999 | 26 (5.4%) | 0 (0.0%) |
| $75,000 to $99,999 | 21 (4.4%) | 53 (24.5%) |
| $100,000+ | 78 (16.2%) | 0 (0.0%) |
| Total | 481 (100.0%) | 216 (100.0%) |
Earnings by Sex by Educational Attainment in Cesar Chavez
Average earnings in Cesar Chavez are $57,961 for men and $32,375 for women, a difference of 44.1%. Men with an educational attainment of less than high school enjoy the highest average annual earnings of $54,297, while those with less than high school education earn the least with $54,297. Women with an educational attainment of college or associate's degree earn the most with the average annual earnings of $51,250, while those with college or associate's degree education have the smallest earnings of $51,250.
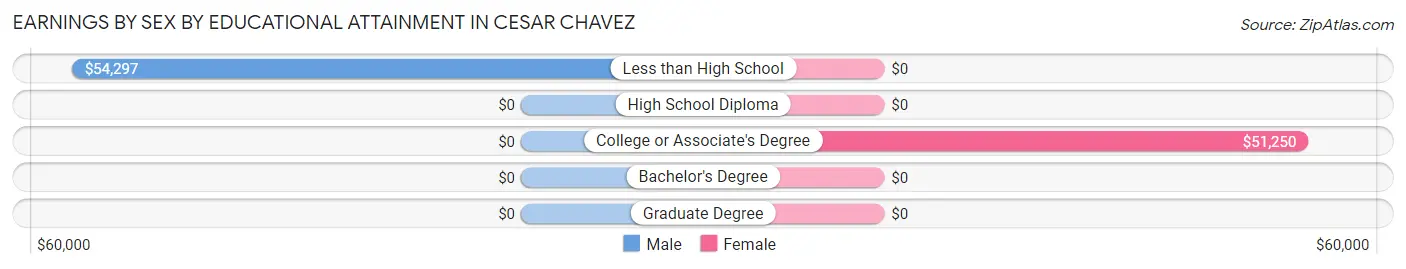
| Educational Attainment | Male Income | Female Income |
| Less than High School | $54,297 | $0 |
| High School Diploma | - | - |
| College or Associate's Degree | - | - |
| Bachelor's Degree | - | - |
| Graduate Degree | - | - |
| Total | $57,961 | $32,375 |
Family Income in Cesar Chavez
Family Income Brackets in Cesar Chavez
According to the Cesar Chavez family income data, there are 109 families falling into the $75,000 to $99,999 income range, which is the most common income bracket and makes up 22.8% of all families.
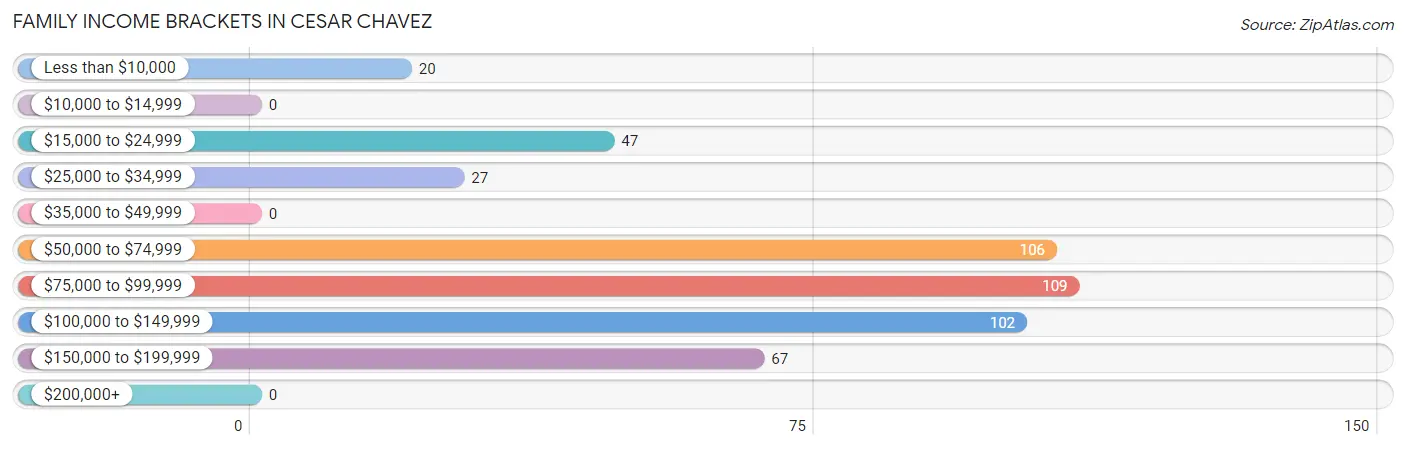
| Income Bracket | # Families | % Families |
| Less than $10,000 | 20 | 4.2% |
| $10,000 to $14,999 | 0 | 0.0% |
| $15,000 to $24,999 | 47 | 9.8% |
| $25,000 to $34,999 | 27 | 5.6% |
| $35,000 to $49,999 | 0 | 0.0% |
| $50,000 to $74,999 | 106 | 22.2% |
| $75,000 to $99,999 | 109 | 22.8% |
| $100,000 to $149,999 | 102 | 21.3% |
| $150,000 to $199,999 | 67 | 14.0% |
| $200,000+ | 0 | 0.0% |
Family Income by Famaliy Size in Cesar Chavez
4-person families (351 | 73.4%) account for the highest median family income in Cesar Chavez with $78,516 per family, while 4-person families (351 | 73.4%) have the highest median income of $19,629 per family member.
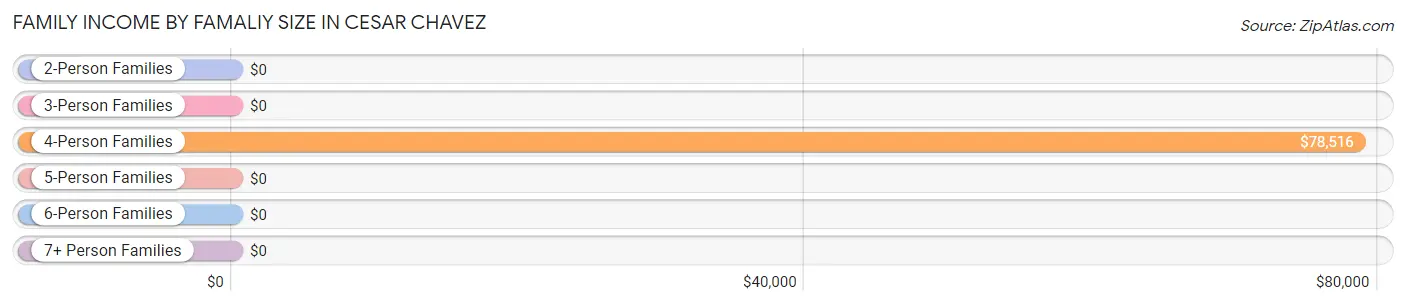
| Income Bracket | # Families | Median Income |
| 2-Person Families | 112 (23.4%) | $0 |
| 3-Person Families | 15 (3.1%) | $0 |
| 4-Person Families | 351 (73.4%) | $78,516 |
| 5-Person Families | 0 (0.0%) | $0 |
| 6-Person Families | 0 (0.0%) | $0 |
| 7+ Person Families | 0 (0.0%) | $0 |
| Total | 478 (100.0%) | $77,813 |
Family Income by Number of Earners in Cesar Chavez
| Number of Earners | # Families | Median Income |
| No Earners | 111 (23.2%) | $0 |
| 1 Earner | 185 (38.7%) | $0 |
| 2 Earners | 106 (22.2%) | $0 |
| 3+ Earners | 76 (15.9%) | $0 |
| Total | 478 (100.0%) | $77,813 |
Household Income in Cesar Chavez
Household Income Brackets in Cesar Chavez
With 123 households falling in the category, the $100,000 to $149,999 income range is the most frequent in Cesar Chavez, accounting for 23.0% of all households.
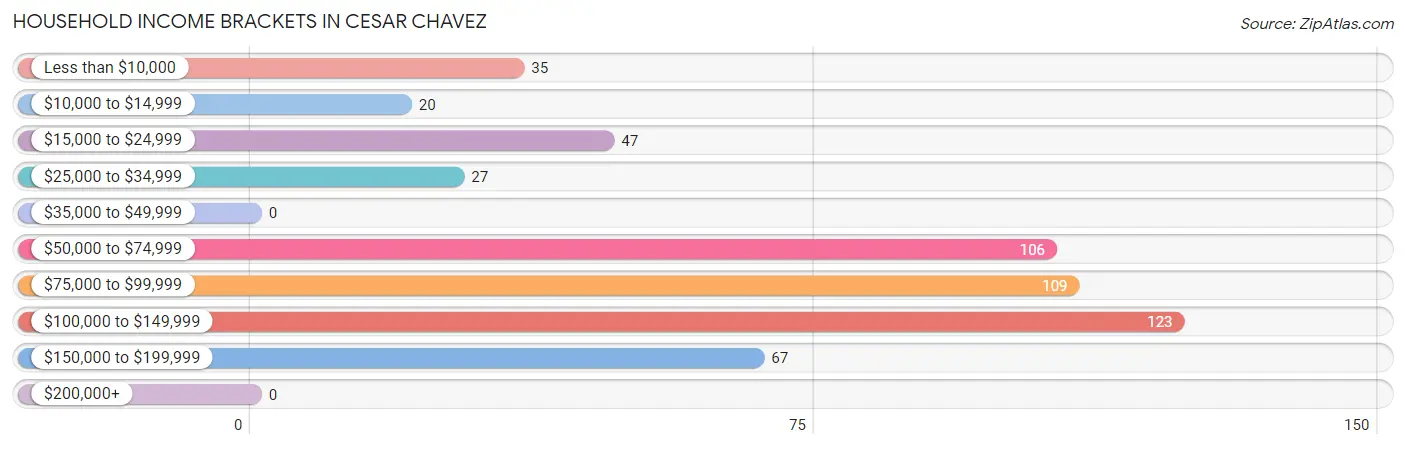
| Income Bracket | # Households | % Households |
| Less than $10,000 | 35 | 6.6% |
| $10,000 to $14,999 | 20 | 3.7% |
| $15,000 to $24,999 | 47 | 8.8% |
| $25,000 to $34,999 | 27 | 5.1% |
| $35,000 to $49,999 | 0 | 0.0% |
| $50,000 to $74,999 | 106 | 19.9% |
| $75,000 to $99,999 | 109 | 20.4% |
| $100,000 to $149,999 | 123 | 23.0% |
| $150,000 to $199,999 | 67 | 12.5% |
| $200,000+ | 0 | 0.0% |
Household Income by Householder Age in Cesar Chavez
The median household income in Cesar Chavez is $77,594, with the highest median household income of $78,500 found in the 45 to 64 years age bracket for the primary householder. A total of 260 households (48.7%) fall into this category.
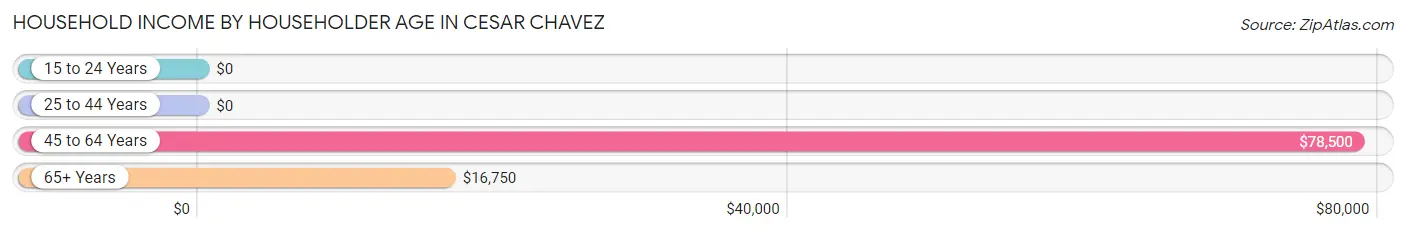
| Income Bracket | # Households | Median Income |
| 15 to 24 Years | 0 (0.0%) | $0 |
| 25 to 44 Years | 202 (37.8%) | $0 |
| 45 to 64 Years | 260 (48.7%) | $78,500 |
| 65+ Years | 72 (13.5%) | $16,750 |
| Total | 534 (100.0%) | $77,594 |
Poverty in Cesar Chavez
Income Below Poverty by Sex and Age in Cesar Chavez
With 9.6% poverty level for males and 20.0% for females among the residents of Cesar Chavez, 25 to 34 year old males and under 5 year old females are the most vulnerable to poverty, with 23 males (46.9%) and 75 females (100.0%) in their respective age groups living below the poverty level.
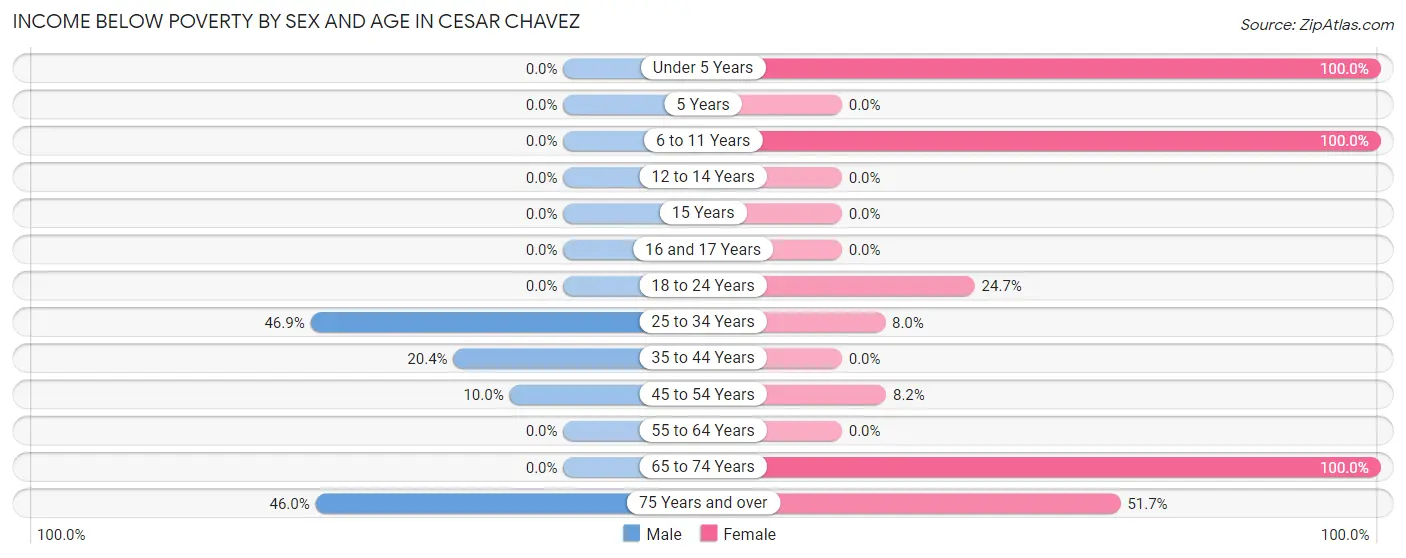
| Age Bracket | Male | Female |
| Under 5 Years | 0 (0.0%) | 75 (100.0%) |
| 5 Years | 0 (0.0%) | 0 (0.0%) |
| 6 to 11 Years | 0 (0.0%) | 17 (100.0%) |
| 12 to 14 Years | 0 (0.0%) | 0 (0.0%) |
| 15 Years | 0 (0.0%) | 0 (0.0%) |
| 16 and 17 Years | 0 (0.0%) | 0 (0.0%) |
| 18 to 24 Years | 0 (0.0%) | 18 (24.7%) |
| 25 to 34 Years | 23 (46.9%) | 20 (8.0%) |
| 35 to 44 Years | 20 (20.4%) | 0 (0.0%) |
| 45 to 54 Years | 17 (10.0%) | 16 (8.2%) |
| 55 to 64 Years | 0 (0.0%) | 0 (0.0%) |
| 65 to 74 Years | 0 (0.0%) | 15 (100.0%) |
| 75 Years and over | 23 (46.0%) | 30 (51.7%) |
| Total | 83 (9.6%) | 191 (20.0%) |
Income Above Poverty by Sex and Age in Cesar Chavez
According to the poverty statistics in Cesar Chavez, males aged 5 years and females aged 12 to 14 years are the age groups that are most secure financially, with 100.0% of males and 100.0% of females in these age groups living above the poverty line.
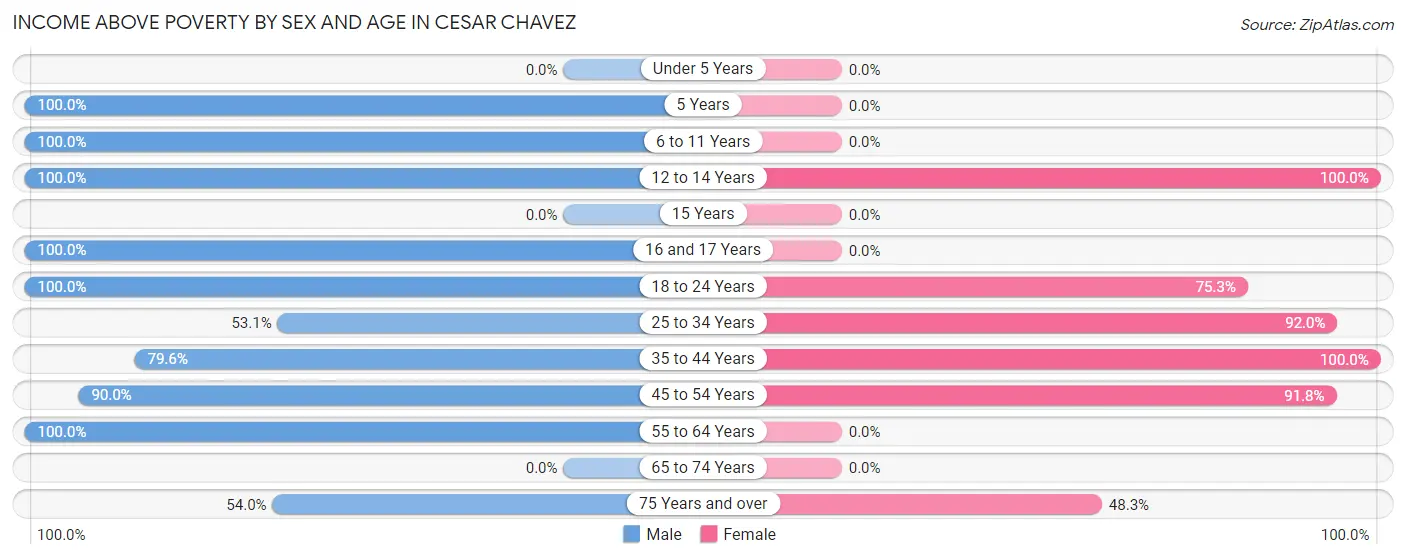
| Age Bracket | Male | Female |
| Under 5 Years | 0 (0.0%) | 0 (0.0%) |
| 5 Years | 65 (100.0%) | 0 (0.0%) |
| 6 to 11 Years | 122 (100.0%) | 0 (0.0%) |
| 12 to 14 Years | 61 (100.0%) | 158 (100.0%) |
| 15 Years | 0 (0.0%) | 0 (0.0%) |
| 16 and 17 Years | 62 (100.0%) | 0 (0.0%) |
| 18 to 24 Years | 94 (100.0%) | 55 (75.3%) |
| 25 to 34 Years | 26 (53.1%) | 229 (92.0%) |
| 35 to 44 Years | 78 (79.6%) | 113 (100.0%) |
| 45 to 54 Years | 153 (90.0%) | 179 (91.8%) |
| 55 to 64 Years | 93 (100.0%) | 0 (0.0%) |
| 65 to 74 Years | 0 (0.0%) | 0 (0.0%) |
| 75 Years and over | 27 (54.0%) | 28 (48.3%) |
| Total | 781 (90.4%) | 762 (80.0%) |
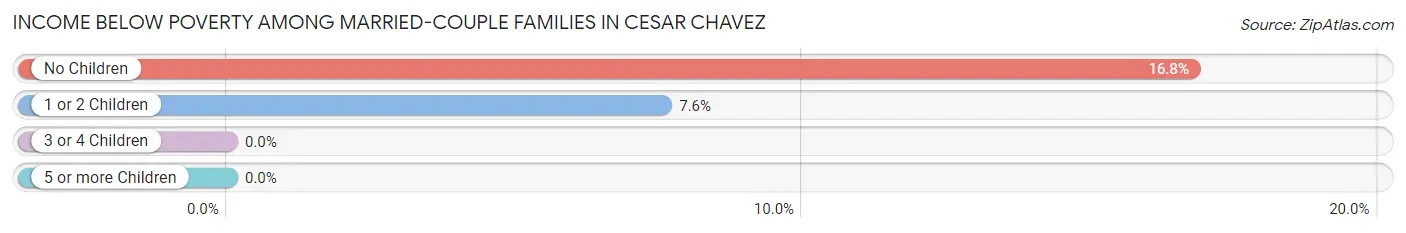
Income Below Poverty Among Married-Couple Families in Cesar Chavez
The poverty statistics for married-couple families in Cesar Chavez show that 11.6% or 47 of the total 404 families live below the poverty line. Families with no children have the highest poverty rate of 16.8%, comprising of 30 families. On the other hand, families with 1 or 2 children have the lowest poverty rate of 7.6%, which includes 17 families.
| Children | Above Poverty | Below Poverty |
| No Children | 149 (83.2%) | 30 (16.8%) |
| 1 or 2 Children | 208 (92.4%) | 17 (7.6%) |
| 3 or 4 Children | 0 (0.0%) | 0 (0.0%) |
| 5 or more Children | 0 (0.0%) | 0 (0.0%) |
| Total | 357 (88.4%) | 47 (11.6%) |
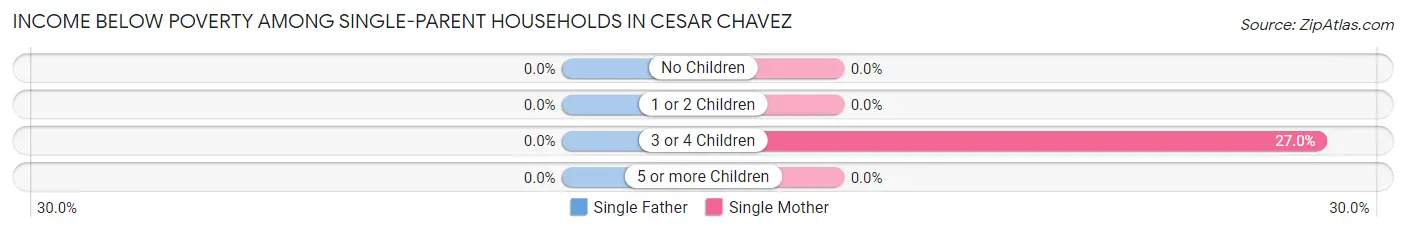
Income Below Poverty Among Single-Parent Households in Cesar Chavez
| Children | Single Father | Single Mother |
| No Children | 0 (0.0%) | 0 (0.0%) |
| 1 or 2 Children | 0 (0.0%) | 0 (0.0%) |
| 3 or 4 Children | 0 (0.0%) | 20 (27.0%) |
| 5 or more Children | 0 (0.0%) | 0 (0.0%) |
| Total | 0 (0.0%) | 20 (27.0%) |
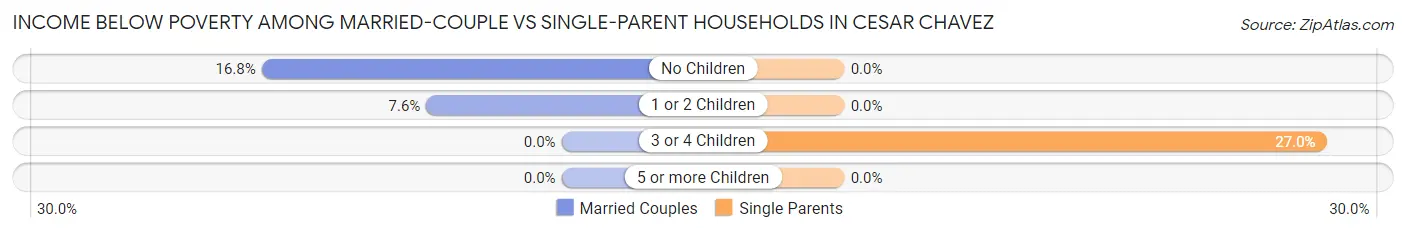
Income Below Poverty Among Married-Couple vs Single-Parent Households in Cesar Chavez
The poverty data for Cesar Chavez shows that 47 of the married-couple family households (11.6%) and 20 of the single-parent households (27.0%) are living below the poverty level. Within the married-couple family households, those with no children have the highest poverty rate, with 30 households (16.8%) falling below the poverty line. Among the single-parent households, those with 3 or 4 children have the highest poverty rate, with 20 household (27.0%) living below poverty.
| Children | Married-Couple Families | Single-Parent Households |
| No Children | 30 (16.8%) | 0 (0.0%) |
| 1 or 2 Children | 17 (7.6%) | 0 (0.0%) |
| 3 or 4 Children | 0 (0.0%) | 20 (27.0%) |
| 5 or more Children | 0 (0.0%) | 0 (0.0%) |
| Total | 47 (11.6%) | 20 (27.0%) |
Employment Characteristics in Cesar Chavez
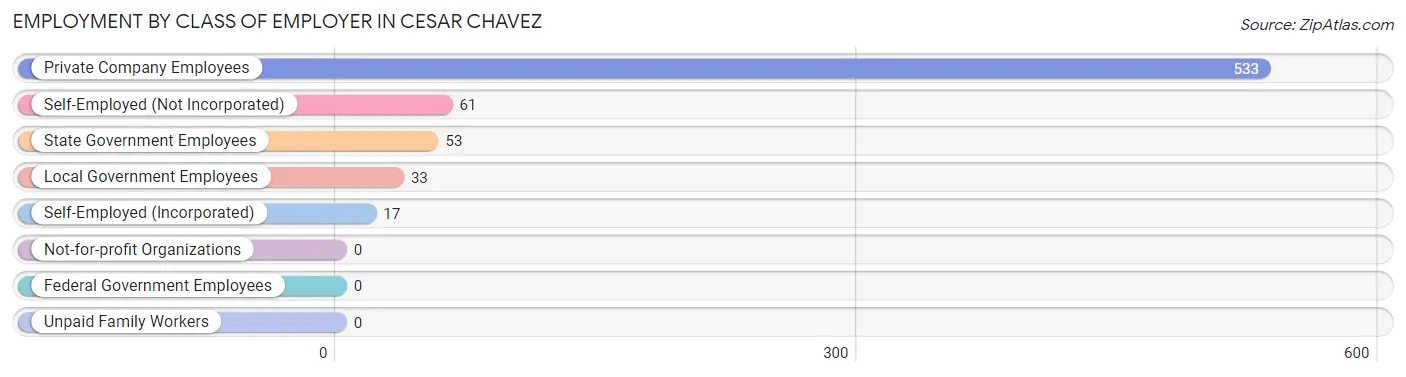
Employment by Class of Employer in Cesar Chavez
Among the 697 employed individuals in Cesar Chavez, private company employees (533 | 76.5%), self-employed (not incorporated) (61 | 8.7%), and state government employees (53 | 7.6%) make up the most common classes of employment.
| Employer Class | # Employees | % Employees |
| Private Company Employees | 533 | 76.5% |
| Self-Employed (Incorporated) | 17 | 2.4% |
| Self-Employed (Not Incorporated) | 61 | 8.7% |
| Not-for-profit Organizations | 0 | 0.0% |
| Local Government Employees | 33 | 4.7% |
| State Government Employees | 53 | 7.6% |
| Federal Government Employees | 0 | 0.0% |
| Unpaid Family Workers | 0 | 0.0% |
| Total | 697 | 100.0% |
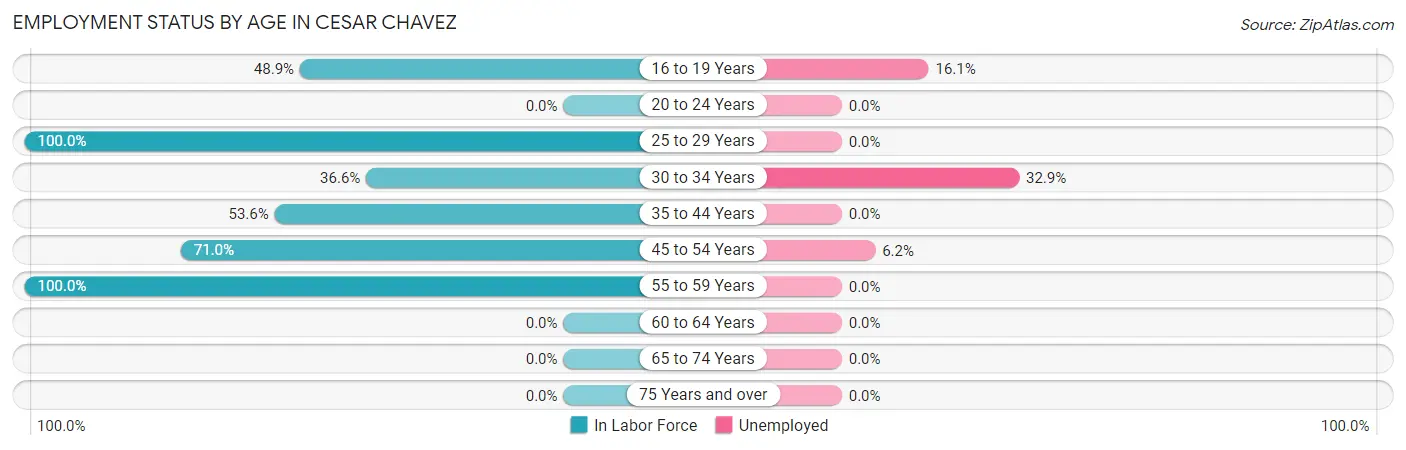
Employment Status by Age in Cesar Chavez
According to the labor force statistics for Cesar Chavez, out of the total population over 16 years of age (1,319), 57.2% or 754 individuals are in the labor force, with 7.6% or 57 of them unemployed. The age group with the highest labor force participation rate is 25 to 29 years, with 100.0% or 107 individuals in the labor force. Within the labor force, the 30 to 34 years age range has the highest percentage of unemployed individuals, with 32.9% or 23 of them being unemployed.
| Age Bracket | In Labor Force | Unemployed |
| 16 to 19 Years | 112 (48.9%) | 18 (16.1%) |
| 20 to 24 Years | 0 (0.0%) | 0 (0.0%) |
| 25 to 29 Years | 107 (100.0%) | 0 (0.0%) |
| 30 to 34 Years | 70 (36.6%) | 23 (32.9%) |
| 35 to 44 Years | 113 (53.6%) | 0 (0.0%) |
| 45 to 54 Years | 259 (71.0%) | 16 (6.2%) |
| 55 to 59 Years | 93 (100.0%) | 0 (0.0%) |
| 60 to 64 Years | 0 (0.0%) | 0 (0.0%) |
| 65 to 74 Years | 0 (0.0%) | 0 (0.0%) |
| 75 Years and over | 0 (0.0%) | 0 (0.0%) |
| Total | 754 (57.2%) | 57 (7.6%) |
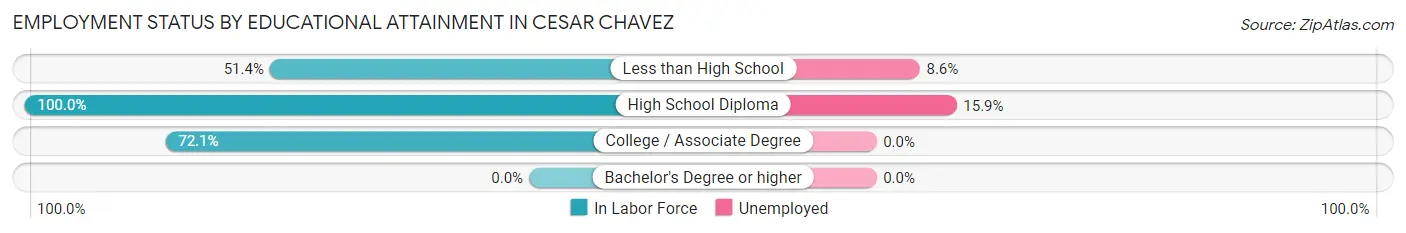
Employment Status by Educational Attainment in Cesar Chavez
According to labor force statistics for Cesar Chavez, 66.4% of individuals (642) out of the total population between 25 and 64 years of age (967) are in the labor force, with 6.1% or 39 of them being unemployed. The group with the highest labor force participation rate are those with the educational attainment of high school diploma, with 100.0% or 145 individuals in the labor force. Within the labor force, individuals with high school diploma education have the highest percentage of unemployment, with 15.9% or 23 of them being unemployed.
| Educational Attainment | In Labor Force | Unemployed |
| Less than High School | 185 (51.4%) | 31 (8.6%) |
| High School Diploma | 145 (100.0%) | 23 (15.9%) |
| College / Associate Degree | 312 (72.1%) | 0 (0.0%) |
| Bachelor's Degree or higher | 0 (0.0%) | 0 (0.0%) |
| Total | 642 (66.4%) | 59 (6.1%) |
Employment Occupations by Sex in Cesar Chavez
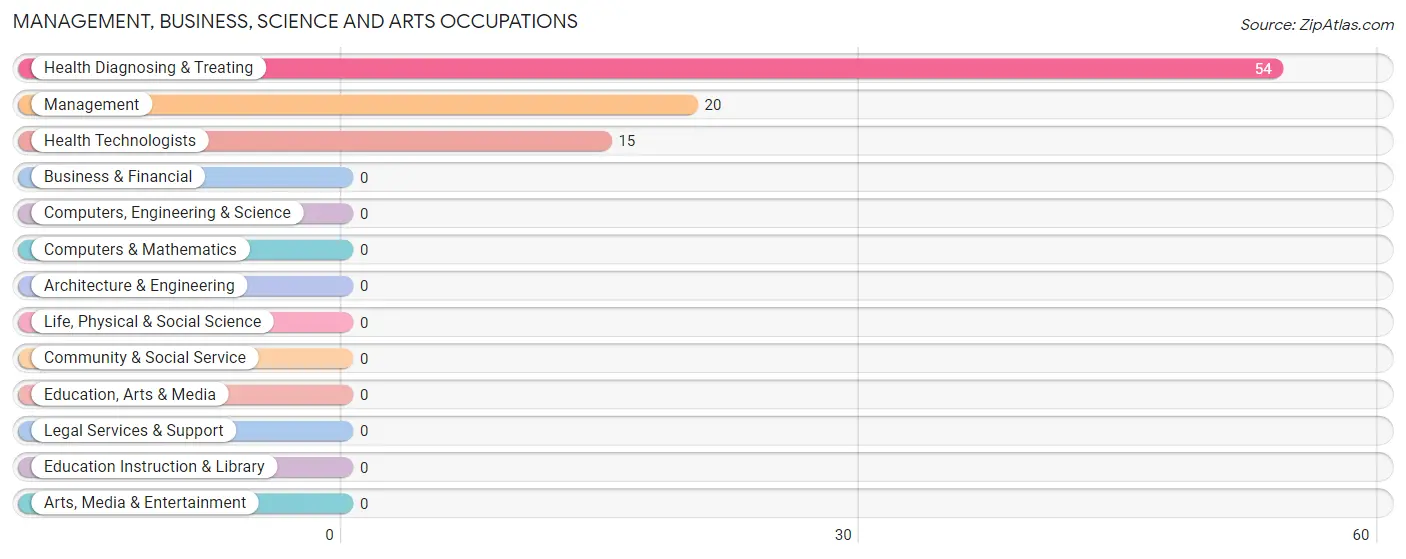
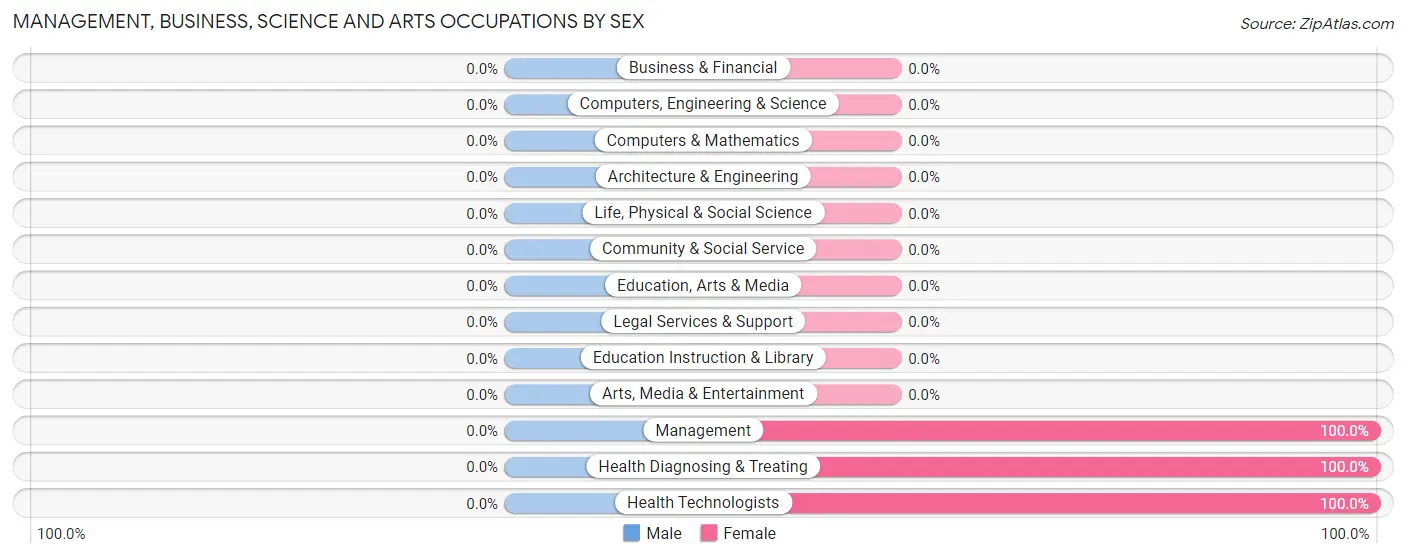
Management, Business, Science and Arts Occupations
The most common Management, Business, Science and Arts occupations in Cesar Chavez are Health Diagnosing & Treating (54 | 7.7%), Management (20 | 2.9%), and Health Technologists (15 | 2.1%).
Management, Business, Science and Arts Occupations by Sex
| Occupation | Male | Female |
| Management | 0 (0.0%) | 20 (100.0%) |
| Business & Financial | 0 (0.0%) | 0 (0.0%) |
| Computers, Engineering & Science | 0 (0.0%) | 0 (0.0%) |
| Computers & Mathematics | 0 (0.0%) | 0 (0.0%) |
| Architecture & Engineering | 0 (0.0%) | 0 (0.0%) |
| Life, Physical & Social Science | 0 (0.0%) | 0 (0.0%) |
| Community & Social Service | 0 (0.0%) | 0 (0.0%) |
| Education, Arts & Media | 0 (0.0%) | 0 (0.0%) |
| Legal Services & Support | 0 (0.0%) | 0 (0.0%) |
| Education Instruction & Library | 0 (0.0%) | 0 (0.0%) |
| Arts, Media & Entertainment | 0 (0.0%) | 0 (0.0%) |
| Health Diagnosing & Treating | 0 (0.0%) | 54 (100.0%) |
| Health Technologists | 0 (0.0%) | 15 (100.0%) |
| Total (Category) | 0 (0.0%) | 74 (100.0%) |
| Total (Overall) | 481 (69.0%) | 216 (31.0%) |
Services Occupations
The most common Services occupations in Cesar Chavez are , and Cleaning & Maintenance (20 | 2.9%).
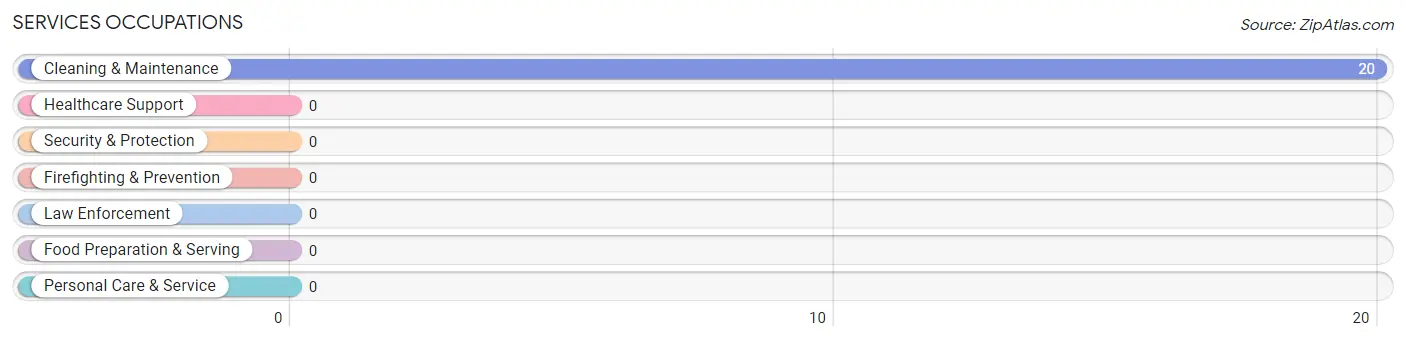
Services Occupations by Sex
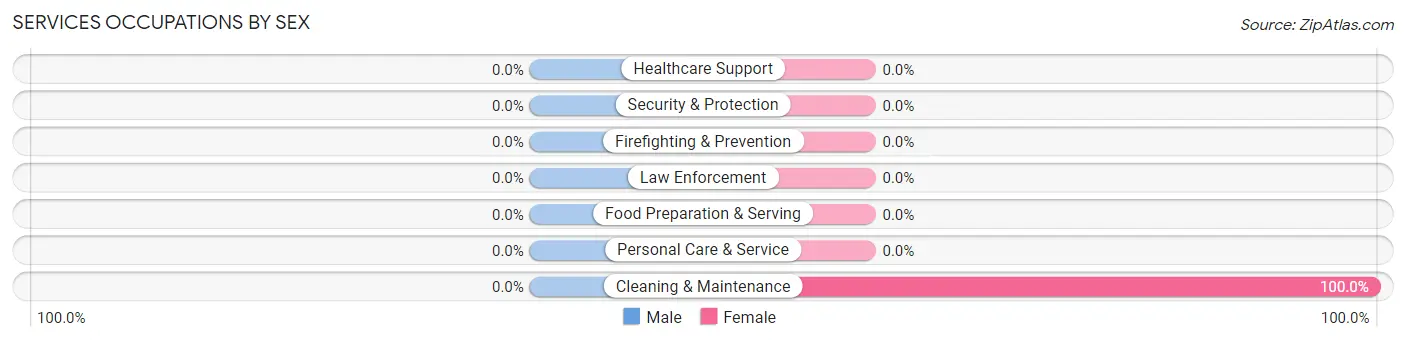
| Occupation | Male | Female |
| Healthcare Support | 0 (0.0%) | 0 (0.0%) |
| Security & Protection | 0 (0.0%) | 0 (0.0%) |
| Firefighting & Prevention | 0 (0.0%) | 0 (0.0%) |
| Law Enforcement | 0 (0.0%) | 0 (0.0%) |
| Food Preparation & Serving | 0 (0.0%) | 0 (0.0%) |
| Cleaning & Maintenance | 0 (0.0%) | 20 (100.0%) |
| Personal Care & Service | 0 (0.0%) | 0 (0.0%) |
| Total (Category) | 0 (0.0%) | 20 (100.0%) |
| Total (Overall) | 481 (69.0%) | 216 (31.0%) |
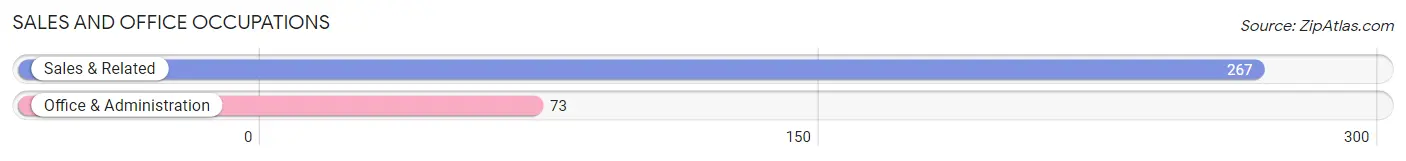
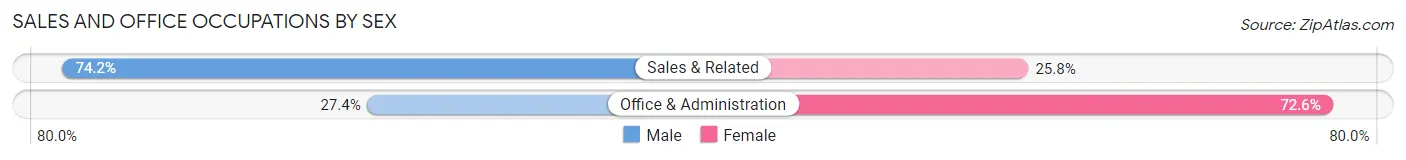
Sales and Office Occupations
The most common Sales and Office occupations in Cesar Chavez are Sales & Related (267 | 38.3%), and Office & Administration (73 | 10.5%).
Sales and Office Occupations by Sex
| Occupation | Male | Female |
| Sales & Related | 198 (74.2%) | 69 (25.8%) |
| Office & Administration | 20 (27.4%) | 53 (72.6%) |
| Total (Category) | 218 (64.1%) | 122 (35.9%) |
| Total (Overall) | 481 (69.0%) | 216 (31.0%) |
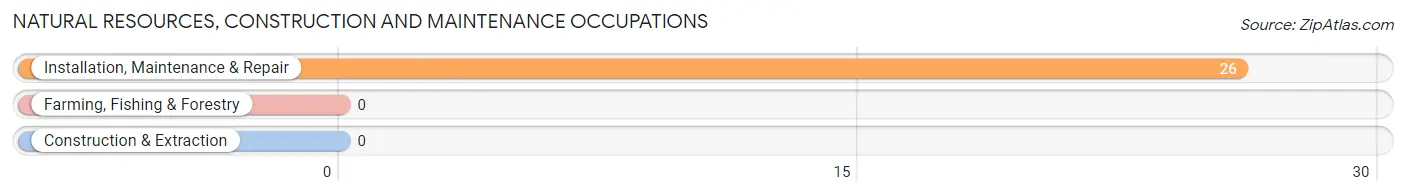
Natural Resources, Construction and Maintenance Occupations
The most common Natural Resources, Construction and Maintenance occupations in Cesar Chavez are , and Installation, Maintenance & Repair (26 | 3.7%).
Natural Resources, Construction and Maintenance Occupations by Sex
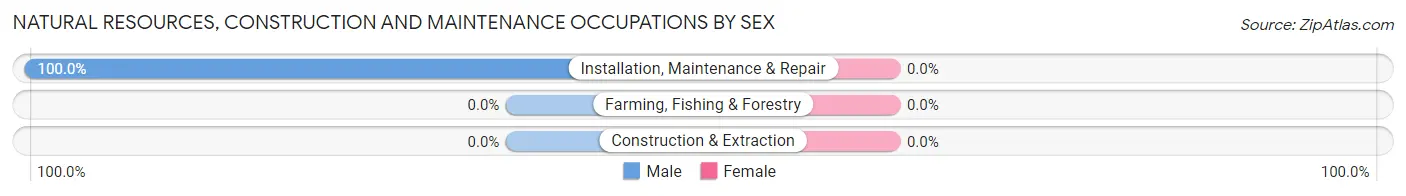
| Occupation | Male | Female |
| Farming, Fishing & Forestry | 0 (0.0%) | 0 (0.0%) |
| Construction & Extraction | 0 (0.0%) | 0 (0.0%) |
| Installation, Maintenance & Repair | 26 (100.0%) | 0 (0.0%) |
| Total (Category) | 26 (100.0%) | 0 (0.0%) |
| Total (Overall) | 481 (69.0%) | 216 (31.0%) |
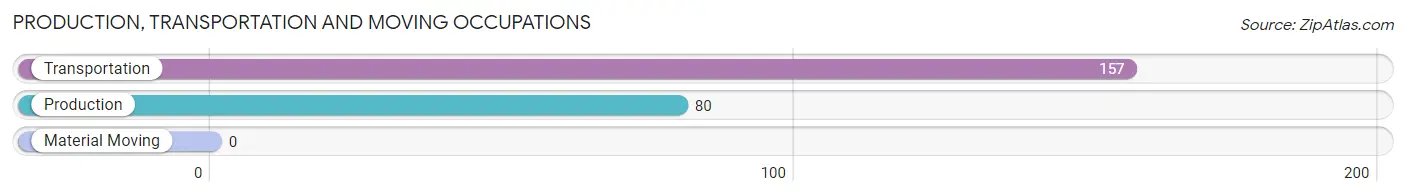
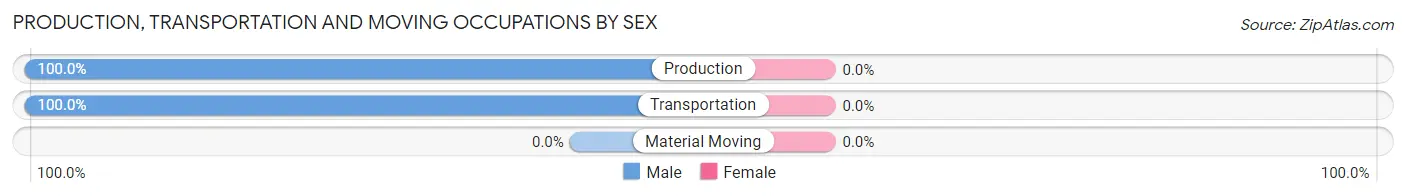
Production, Transportation and Moving Occupations
The most common Production, Transportation and Moving occupations in Cesar Chavez are Transportation (157 | 22.5%), and Production (80 | 11.5%).
Production, Transportation and Moving Occupations by Sex
| Occupation | Male | Female |
| Production | 80 (100.0%) | 0 (0.0%) |
| Transportation | 157 (100.0%) | 0 (0.0%) |
| Material Moving | 0 (0.0%) | 0 (0.0%) |
| Total (Category) | 237 (100.0%) | 0 (0.0%) |
| Total (Overall) | 481 (69.0%) | 216 (31.0%) |
Employment Industries by Sex in Cesar Chavez
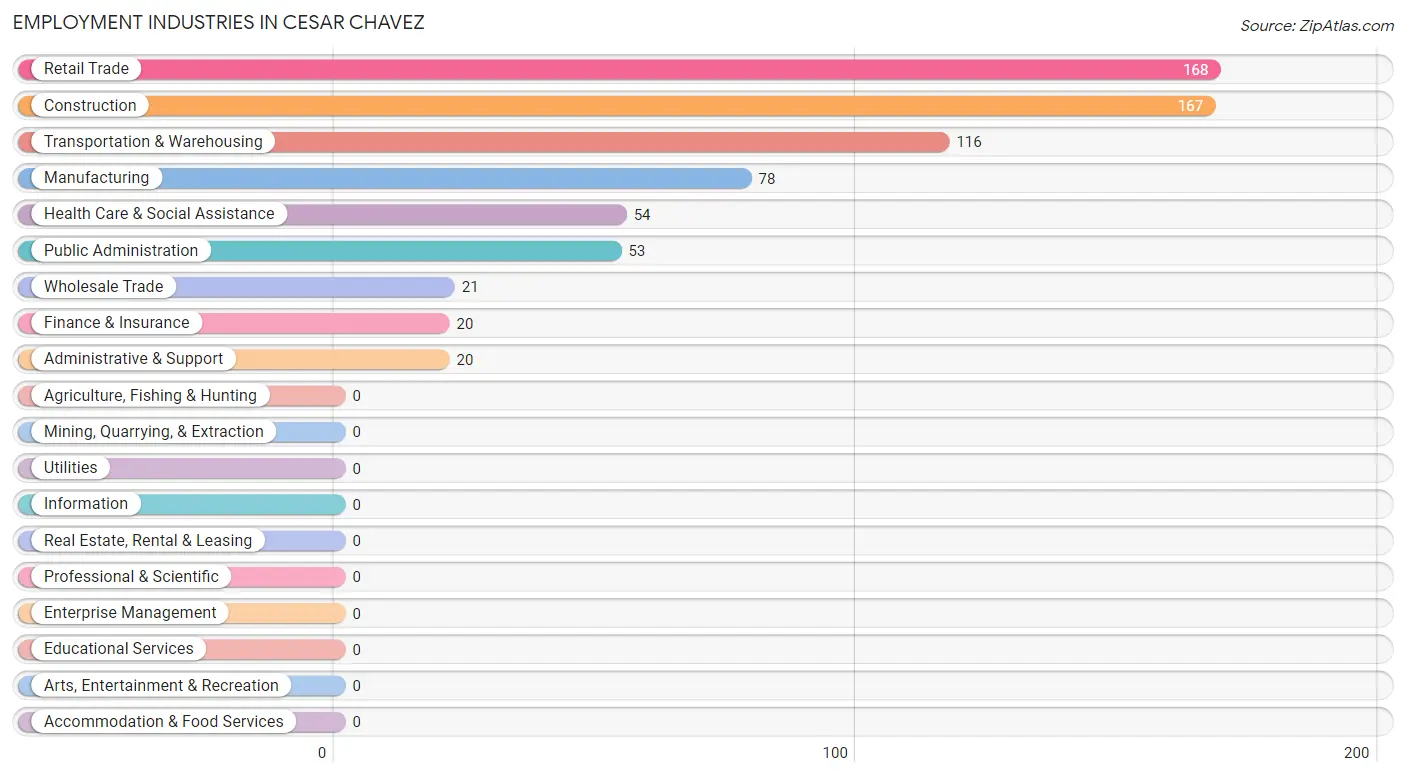
Employment Industries in Cesar Chavez
The major employment industries in Cesar Chavez include Retail Trade (168 | 24.1%), Construction (167 | 24.0%), Transportation & Warehousing (116 | 16.6%), Manufacturing (78 | 11.2%), and Health Care & Social Assistance (54 | 7.7%).
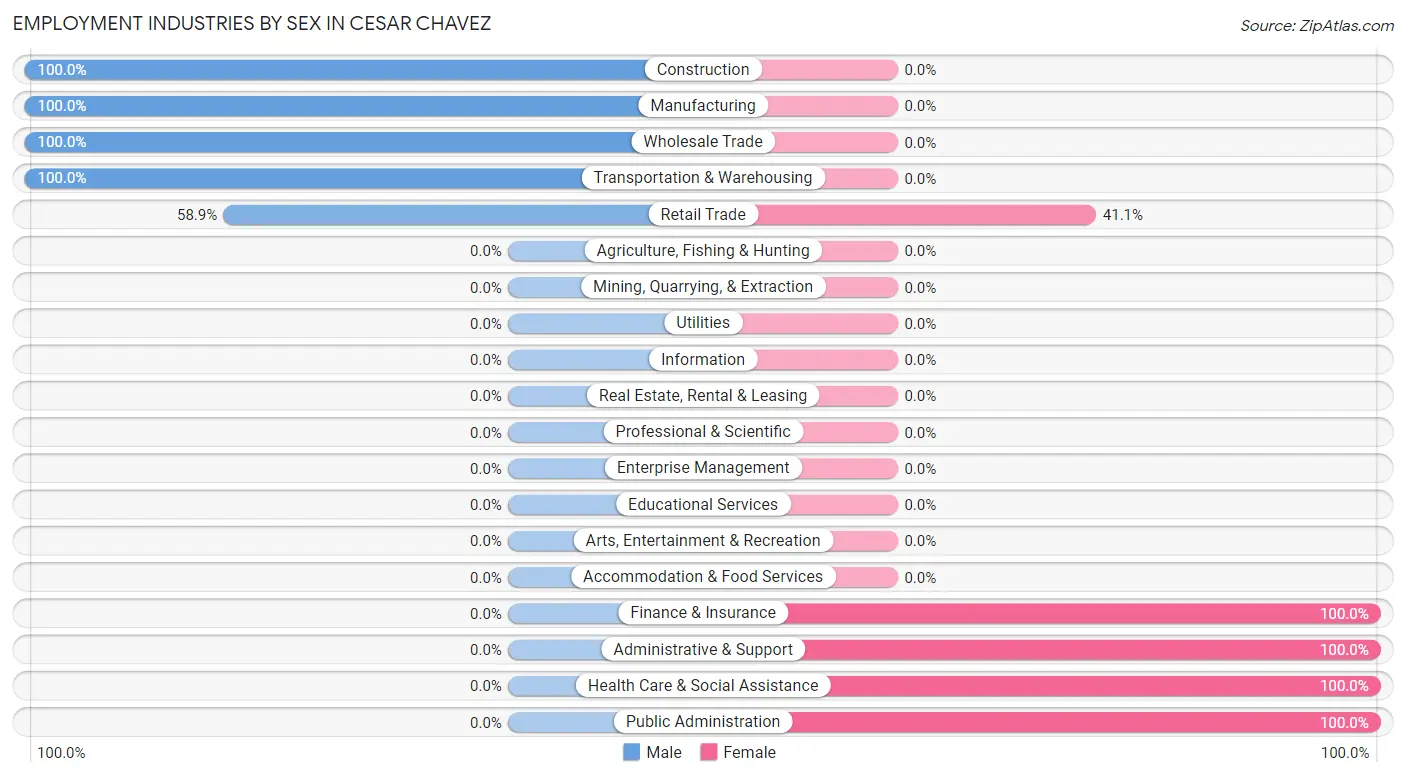
Employment Industries by Sex in Cesar Chavez
The Cesar Chavez industries that see more men than women are Construction (100.0%), Manufacturing (100.0%), and Wholesale Trade (100.0%), whereas the industries that tend to have a higher number of women are Finance & Insurance (100.0%), Administrative & Support (100.0%), and Health Care & Social Assistance (100.0%).
| Industry | Male | Female |
| Agriculture, Fishing & Hunting | 0 (0.0%) | 0 (0.0%) |
| Mining, Quarrying, & Extraction | 0 (0.0%) | 0 (0.0%) |
| Construction | 167 (100.0%) | 0 (0.0%) |
| Manufacturing | 78 (100.0%) | 0 (0.0%) |
| Wholesale Trade | 21 (100.0%) | 0 (0.0%) |
| Retail Trade | 99 (58.9%) | 69 (41.1%) |
| Transportation & Warehousing | 116 (100.0%) | 0 (0.0%) |
| Utilities | 0 (0.0%) | 0 (0.0%) |
| Information | 0 (0.0%) | 0 (0.0%) |
| Finance & Insurance | 0 (0.0%) | 20 (100.0%) |
| Real Estate, Rental & Leasing | 0 (0.0%) | 0 (0.0%) |
| Professional & Scientific | 0 (0.0%) | 0 (0.0%) |
| Enterprise Management | 0 (0.0%) | 0 (0.0%) |
| Administrative & Support | 0 (0.0%) | 20 (100.0%) |
| Educational Services | 0 (0.0%) | 0 (0.0%) |
| Health Care & Social Assistance | 0 (0.0%) | 54 (100.0%) |
| Arts, Entertainment & Recreation | 0 (0.0%) | 0 (0.0%) |
| Accommodation & Food Services | 0 (0.0%) | 0 (0.0%) |
| Public Administration | 0 (0.0%) | 53 (100.0%) |
| Total | 481 (69.0%) | 216 (31.0%) |
Education in Cesar Chavez
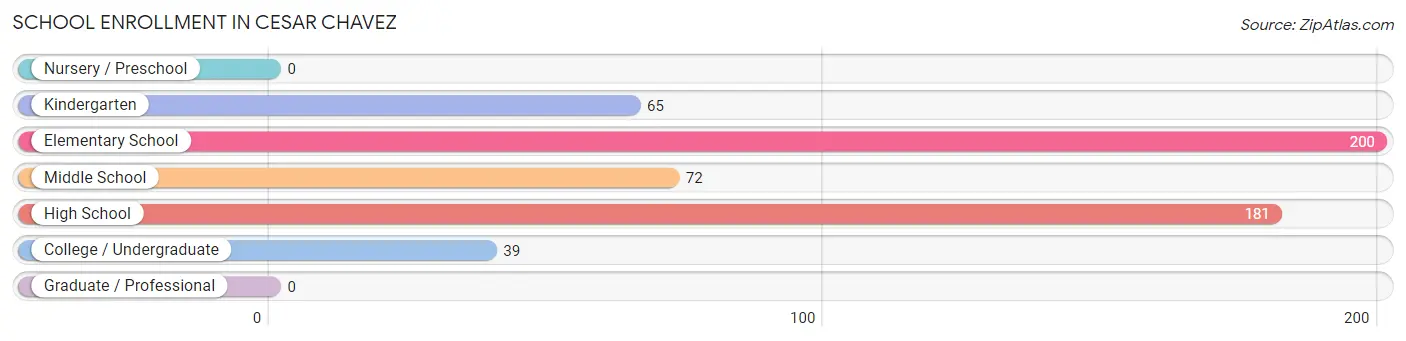
School Enrollment in Cesar Chavez
The most common levels of schooling among the 557 students in Cesar Chavez are elementary school (200 | 35.9%), high school (181 | 32.5%), and middle school (72 | 12.9%).
| School Level | # Students | % Students |
| Nursery / Preschool | 0 | 0.0% |
| Kindergarten | 65 | 11.7% |
| Elementary School | 200 | 35.9% |
| Middle School | 72 | 12.9% |
| High School | 181 | 32.5% |
| College / Undergraduate | 39 | 7.0% |
| Graduate / Professional | 0 | 0.0% |
| Total | 557 | 100.0% |
School Enrollment by Age by Funding Source in Cesar Chavez
Out of a total of 557 students who are enrolled in schools in Cesar Chavez, 21 (3.8%) attend a private institution, while the remaining 536 (96.2%) are enrolled in public schools. The age group of 25 to 34 year olds has the highest likelihood of being enrolled in private schools, with 21 (53.8% in the age bracket) enrolled. Conversely, the age group of 5 to 9 year old has the lowest likelihood of being enrolled in a private school, with 204 (100.0% in the age bracket) attending a public institution.
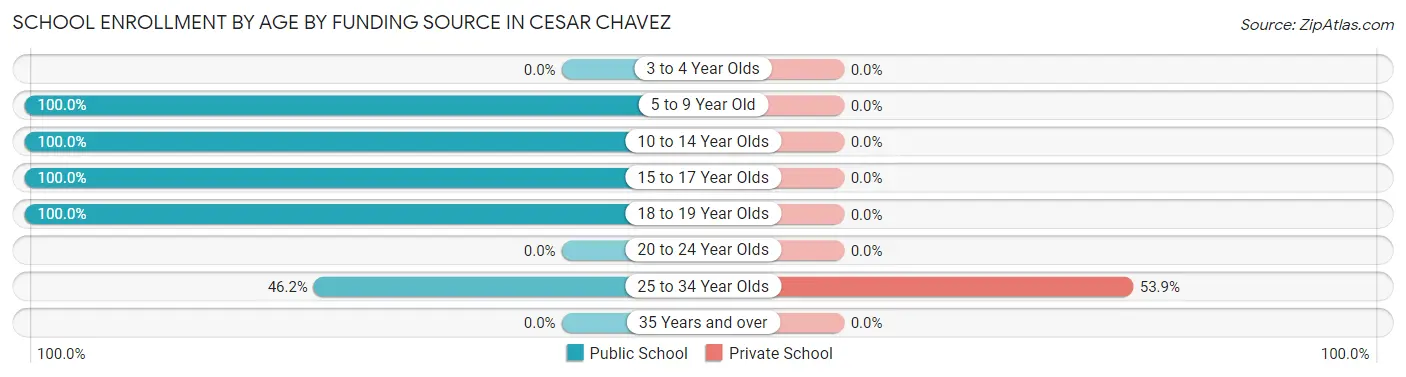
| Age Bracket | Public School | Private School |
| 3 to 4 Year Olds | 0 (0.0%) | 0 (0.0%) |
| 5 to 9 Year Old | 204 (100.0%) | 0 (0.0%) |
| 10 to 14 Year Olds | 219 (100.0%) | 0 (0.0%) |
| 15 to 17 Year Olds | 62 (100.0%) | 0 (0.0%) |
| 18 to 19 Year Olds | 33 (100.0%) | 0 (0.0%) |
| 20 to 24 Year Olds | 0 (0.0%) | 0 (0.0%) |
| 25 to 34 Year Olds | 18 (46.2%) | 21 (53.8%) |
| 35 Years and over | 0 (0.0%) | 0 (0.0%) |
| Total | 536 (96.2%) | 21 (3.8%) |
Educational Attainment by Field of Study in Cesar Chavez
, and education (29 | 100.0%) are the most common fields of study among 29 individuals in Cesar Chavez who have obtained a bachelor's degree or higher.
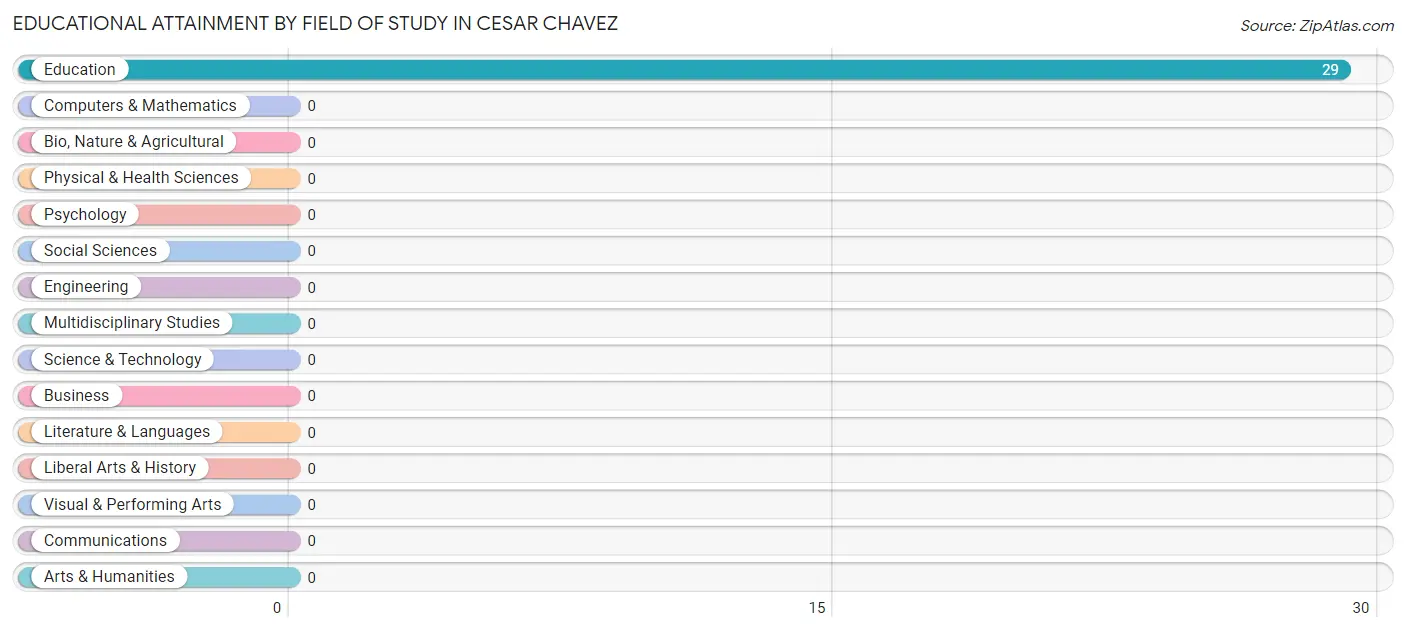
| Field of Study | # Graduates | % Graduates |
| Computers & Mathematics | 0 | 0.0% |
| Bio, Nature & Agricultural | 0 | 0.0% |
| Physical & Health Sciences | 0 | 0.0% |
| Psychology | 0 | 0.0% |
| Social Sciences | 0 | 0.0% |
| Engineering | 0 | 0.0% |
| Multidisciplinary Studies | 0 | 0.0% |
| Science & Technology | 0 | 0.0% |
| Business | 0 | 0.0% |
| Education | 29 | 100.0% |
| Literature & Languages | 0 | 0.0% |
| Liberal Arts & History | 0 | 0.0% |
| Visual & Performing Arts | 0 | 0.0% |
| Communications | 0 | 0.0% |
| Arts & Humanities | 0 | 0.0% |
| Total | 29 | 100.0% |
Transportation & Commute in Cesar Chavez
Vehicle Availability by Sex in Cesar Chavez
The most prevalent vehicle ownership categories in Cesar Chavez are males with 4 vehicles (159, accounting for 33.1%) and females with 4 vehicles (0, making up 73.6%).
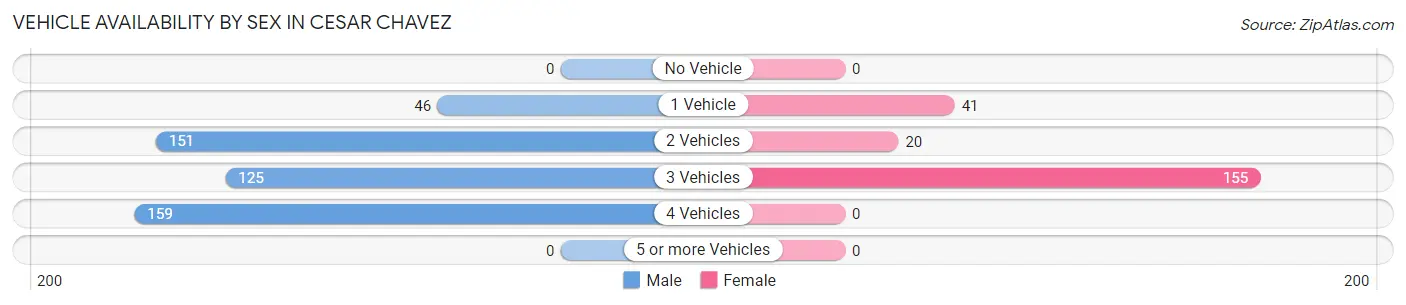
| Vehicles Available | Male | Female |
| No Vehicle | 0 (0.0%) | 0 (0.0%) |
| 1 Vehicle | 46 (9.6%) | 41 (19.0%) |
| 2 Vehicles | 151 (31.4%) | 20 (9.3%) |
| 3 Vehicles | 125 (26.0%) | 155 (71.8%) |
| 4 Vehicles | 159 (33.1%) | 0 (0.0%) |
| 5 or more Vehicles | 0 (0.0%) | 0 (0.0%) |
| Total | 481 (100.0%) | 216 (100.0%) |
Commute Time in Cesar Chavez
The most frequently occuring commute durations in Cesar Chavez are 5 to 9 minutes (342 commuters, 49.1%), 20 to 24 minutes (153 commuters, 22.0%), and 15 to 19 minutes (82 commuters, 11.8%).
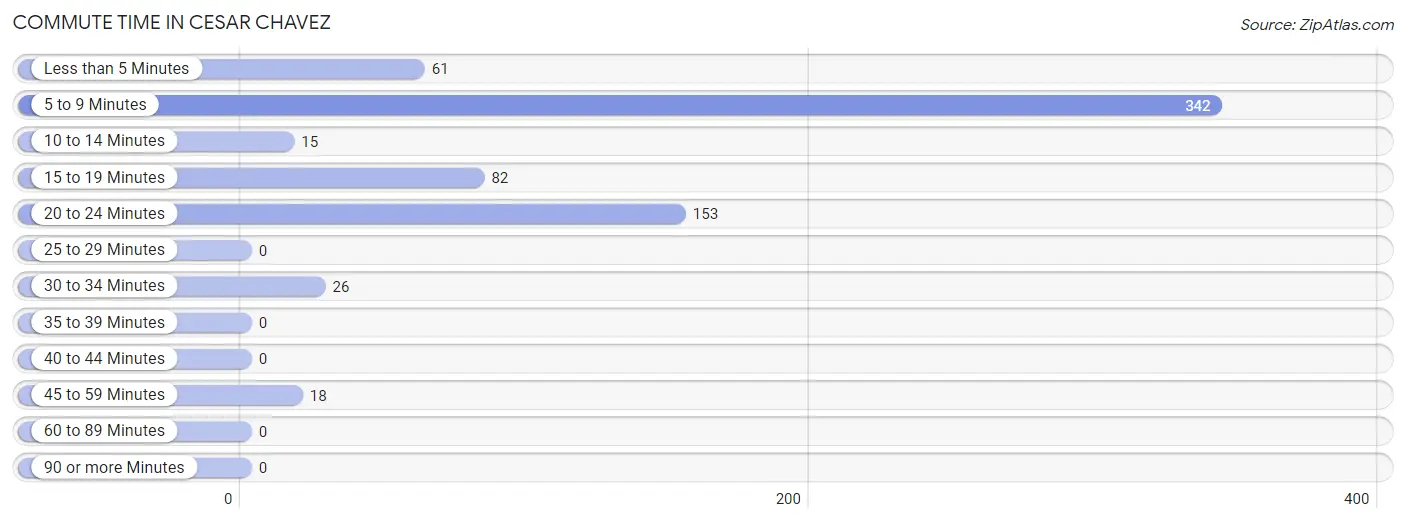
| Commute Time | # Commuters | % Commuters |
| Less than 5 Minutes | 61 | 8.7% |
| 5 to 9 Minutes | 342 | 49.1% |
| 10 to 14 Minutes | 15 | 2.1% |
| 15 to 19 Minutes | 82 | 11.8% |
| 20 to 24 Minutes | 153 | 22.0% |
| 25 to 29 Minutes | 0 | 0.0% |
| 30 to 34 Minutes | 26 | 3.7% |
| 35 to 39 Minutes | 0 | 0.0% |
| 40 to 44 Minutes | 0 | 0.0% |
| 45 to 59 Minutes | 18 | 2.6% |
| 60 to 89 Minutes | 0 | 0.0% |
| 90 or more Minutes | 0 | 0.0% |
Commute Time by Sex in Cesar Chavez
The most common commute times in Cesar Chavez are 5 to 9 minutes (289 commuters, 60.1%) for males and 20 to 24 minutes (69 commuters, 31.9%) for females.
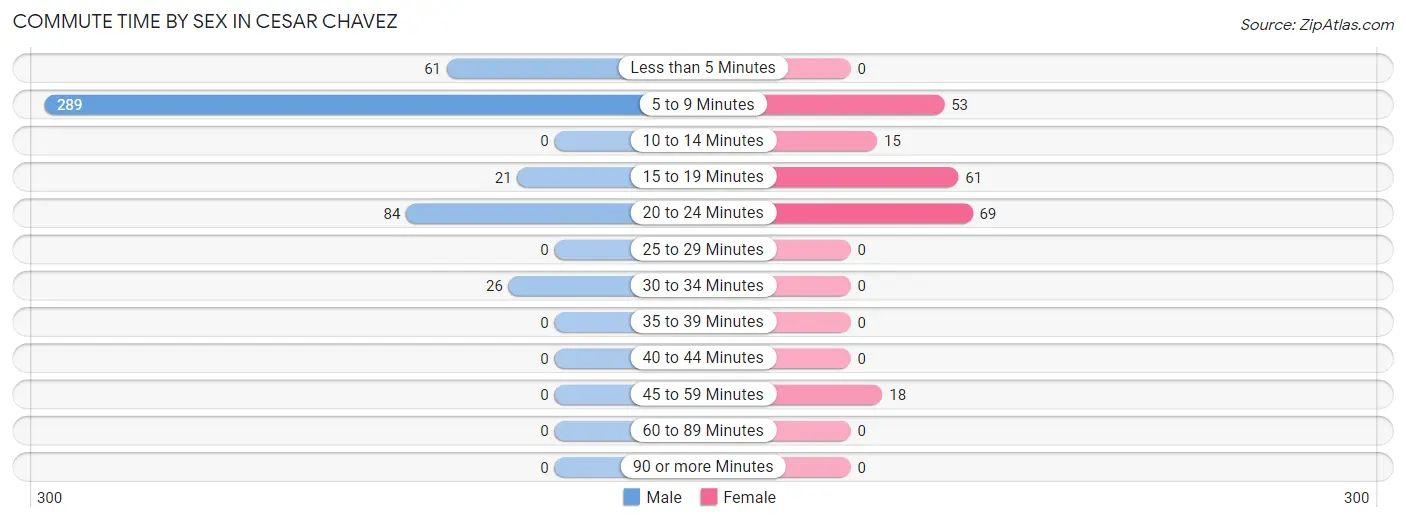
| Commute Time | Male | Female |
| Less than 5 Minutes | 61 (12.7%) | 0 (0.0%) |
| 5 to 9 Minutes | 289 (60.1%) | 53 (24.5%) |
| 10 to 14 Minutes | 0 (0.0%) | 15 (6.9%) |
| 15 to 19 Minutes | 21 (4.4%) | 61 (28.2%) |
| 20 to 24 Minutes | 84 (17.5%) | 69 (31.9%) |
| 25 to 29 Minutes | 0 (0.0%) | 0 (0.0%) |
| 30 to 34 Minutes | 26 (5.4%) | 0 (0.0%) |
| 35 to 39 Minutes | 0 (0.0%) | 0 (0.0%) |
| 40 to 44 Minutes | 0 (0.0%) | 0 (0.0%) |
| 45 to 59 Minutes | 0 (0.0%) | 18 (8.3%) |
| 60 to 89 Minutes | 0 (0.0%) | 0 (0.0%) |
| 90 or more Minutes | 0 (0.0%) | 0 (0.0%) |
Time of Departure to Work by Sex in Cesar Chavez
The most frequent times of departure to work in Cesar Chavez are 12:00 AM to 4:59 AM (159, 33.1%) for males and 7:30 AM to 7:59 AM (114, 52.8%) for females.
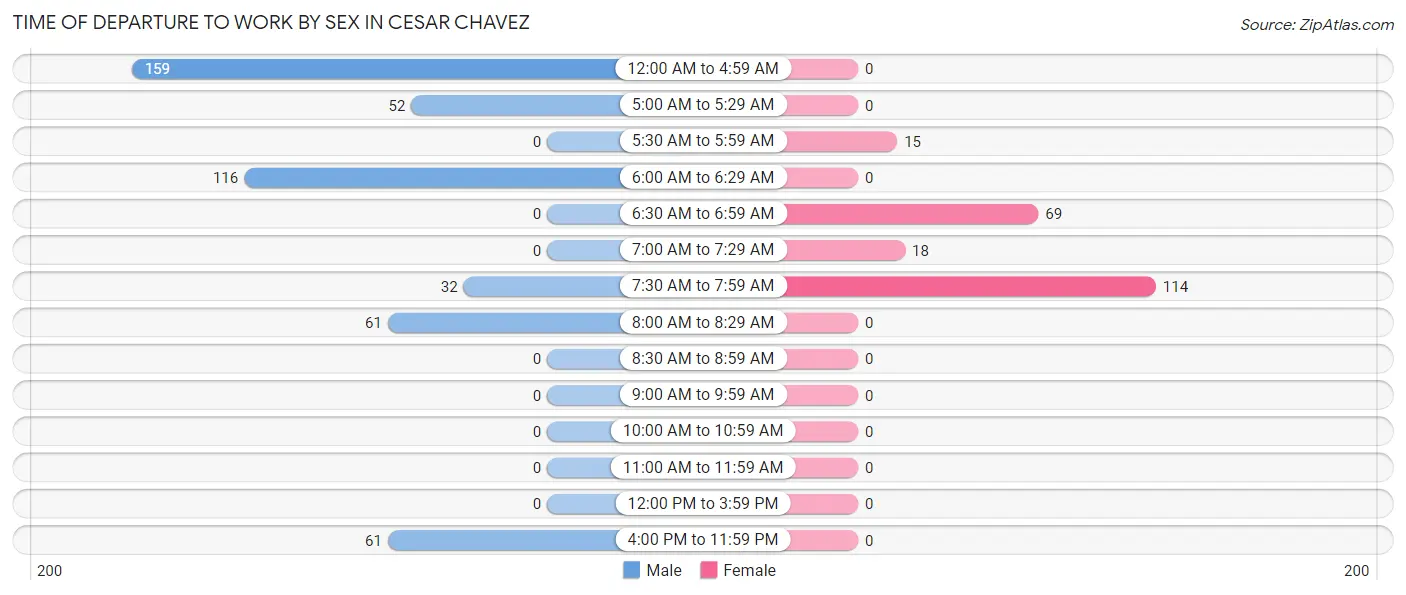
| Time of Departure | Male | Female |
| 12:00 AM to 4:59 AM | 159 (33.1%) | 0 (0.0%) |
| 5:00 AM to 5:29 AM | 52 (10.8%) | 0 (0.0%) |
| 5:30 AM to 5:59 AM | 0 (0.0%) | 15 (6.9%) |
| 6:00 AM to 6:29 AM | 116 (24.1%) | 0 (0.0%) |
| 6:30 AM to 6:59 AM | 0 (0.0%) | 69 (31.9%) |
| 7:00 AM to 7:29 AM | 0 (0.0%) | 18 (8.3%) |
| 7:30 AM to 7:59 AM | 32 (6.7%) | 114 (52.8%) |
| 8:00 AM to 8:29 AM | 61 (12.7%) | 0 (0.0%) |
| 8:30 AM to 8:59 AM | 0 (0.0%) | 0 (0.0%) |
| 9:00 AM to 9:59 AM | 0 (0.0%) | 0 (0.0%) |
| 10:00 AM to 10:59 AM | 0 (0.0%) | 0 (0.0%) |
| 11:00 AM to 11:59 AM | 0 (0.0%) | 0 (0.0%) |
| 12:00 PM to 3:59 PM | 0 (0.0%) | 0 (0.0%) |
| 4:00 PM to 11:59 PM | 61 (12.7%) | 0 (0.0%) |
| Total | 481 (100.0%) | 216 (100.0%) |
Housing Occupancy in Cesar Chavez
Occupancy by Ownership in Cesar Chavez
Of the total 534 dwellings in Cesar Chavez, owner-occupied units account for 488 (91.4%), while renter-occupied units make up 46 (8.6%).
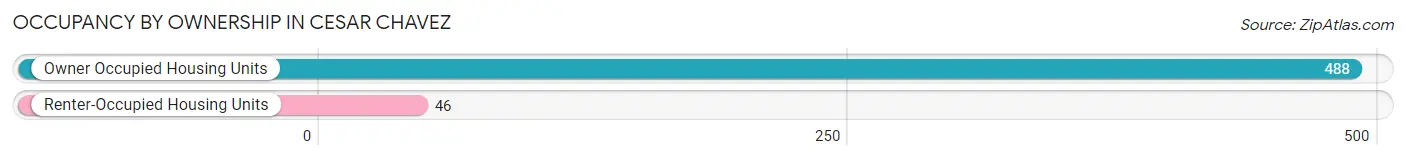
| Occupancy | # Housing Units | % Housing Units |
| Owner Occupied Housing Units | 488 | 91.4% |
| Renter-Occupied Housing Units | 46 | 8.6% |
| Total Occupied Housing Units | 534 | 100.0% |
Occupancy by Household Size in Cesar Chavez
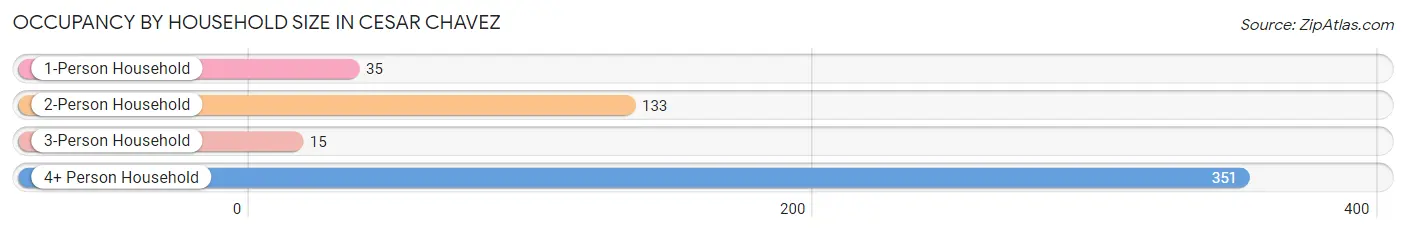
| Household Size | # Housing Units | % Housing Units |
| 1-Person Household | 35 | 6.6% |
| 2-Person Household | 133 | 24.9% |
| 3-Person Household | 15 | 2.8% |
| 4+ Person Household | 351 | 65.7% |
| Total Housing Units | 534 | 100.0% |
Occupancy by Ownership by Household Size in Cesar Chavez
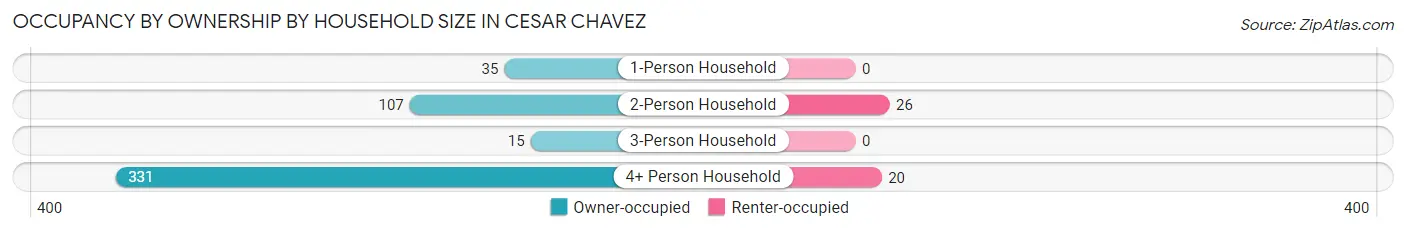
| Household Size | Owner-occupied | Renter-occupied |
| 1-Person Household | 35 (100.0%) | 0 (0.0%) |
| 2-Person Household | 107 (80.4%) | 26 (19.6%) |
| 3-Person Household | 15 (100.0%) | 0 (0.0%) |
| 4+ Person Household | 331 (94.3%) | 20 (5.7%) |
| Total Housing Units | 488 (91.4%) | 46 (8.6%) |
Occupancy by Educational Attainment in Cesar Chavez
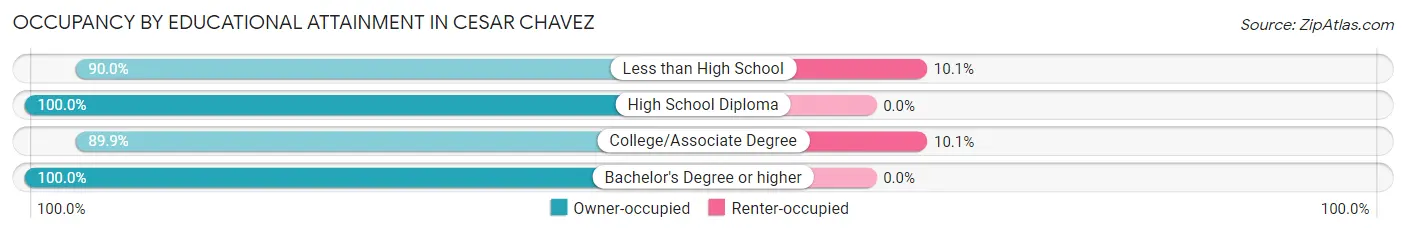
| Household Size | Owner-occupied | Renter-occupied |
| Less than High School | 179 (89.9%) | 20 (10.1%) |
| High School Diploma | 48 (100.0%) | 0 (0.0%) |
| College/Associate Degree | 232 (89.9%) | 26 (10.1%) |
| Bachelor's Degree or higher | 29 (100.0%) | 0 (0.0%) |
Occupancy by Age of Householder in Cesar Chavez
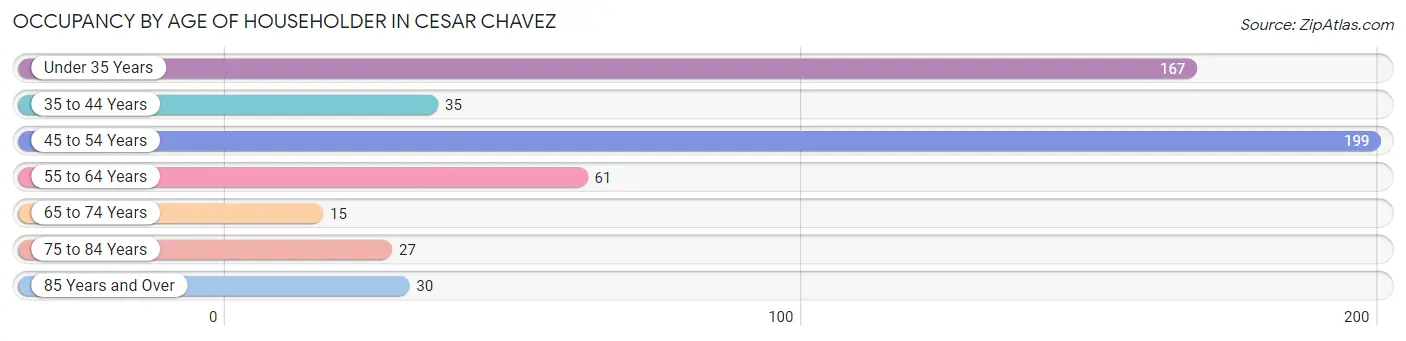
| Age Bracket | # Households | % Households |
| Under 35 Years | 167 | 31.3% |
| 35 to 44 Years | 35 | 6.6% |
| 45 to 54 Years | 199 | 37.3% |
| 55 to 64 Years | 61 | 11.4% |
| 65 to 74 Years | 15 | 2.8% |
| 75 to 84 Years | 27 | 5.1% |
| 85 Years and Over | 30 | 5.6% |
| Total | 534 | 100.0% |
Housing Finances in Cesar Chavez
Median Income by Occupancy in Cesar Chavez
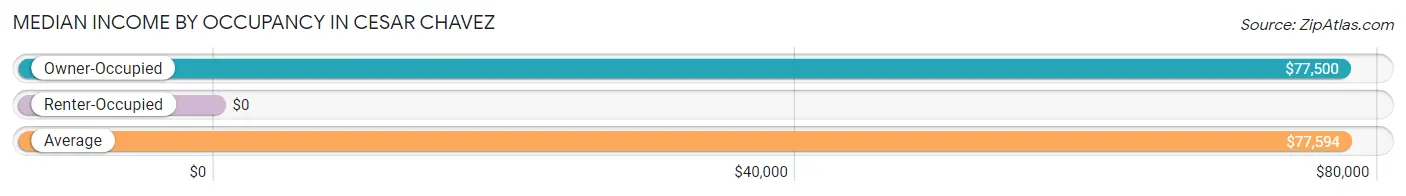
| Occupancy Type | # Households | Median Income |
| Owner-Occupied | 488 (91.4%) | $77,500 |
| Renter-Occupied | 46 (8.6%) | $0 |
| Average | 534 (100.0%) | $77,594 |
Occupancy by Householder Income Bracket in Cesar Chavez
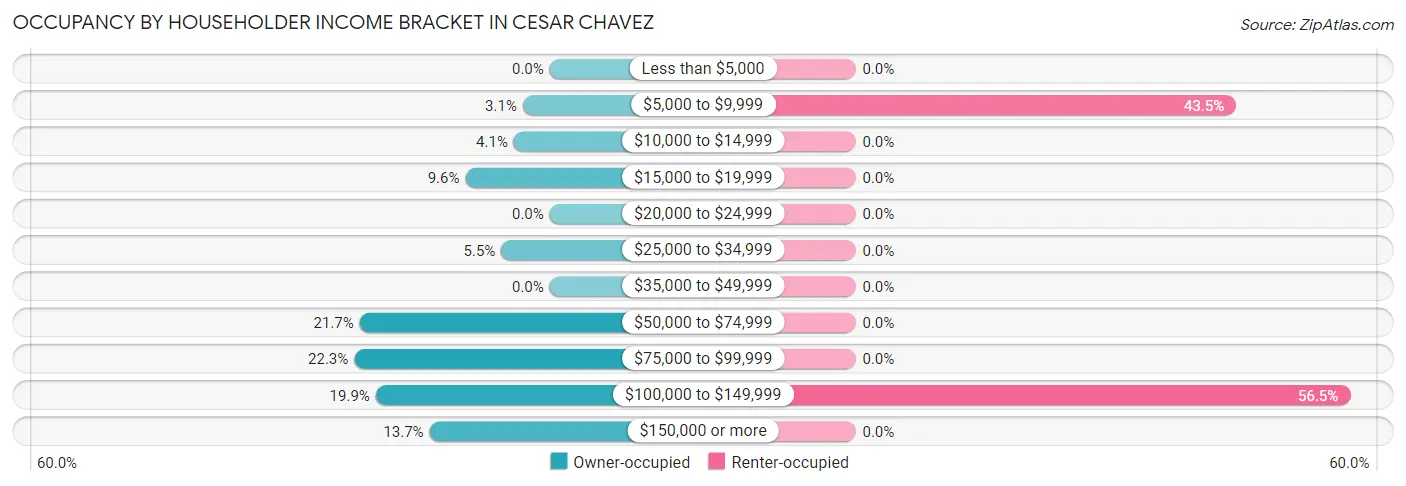
| Income Bracket | Owner-occupied | Renter-occupied |
| Less than $5,000 | 0 (0.0%) | 0 (0.0%) |
| $5,000 to $9,999 | 15 (3.1%) | 20 (43.5%) |
| $10,000 to $14,999 | 20 (4.1%) | 0 (0.0%) |
| $15,000 to $19,999 | 47 (9.6%) | 0 (0.0%) |
| $20,000 to $24,999 | 0 (0.0%) | 0 (0.0%) |
| $25,000 to $34,999 | 27 (5.5%) | 0 (0.0%) |
| $35,000 to $49,999 | 0 (0.0%) | 0 (0.0%) |
| $50,000 to $74,999 | 106 (21.7%) | 0 (0.0%) |
| $75,000 to $99,999 | 109 (22.3%) | 0 (0.0%) |
| $100,000 to $149,999 | 97 (19.9%) | 26 (56.5%) |
| $150,000 or more | 67 (13.7%) | 0 (0.0%) |
| Total | 488 (100.0%) | 46 (100.0%) |
Monthly Housing Cost Tiers in Cesar Chavez
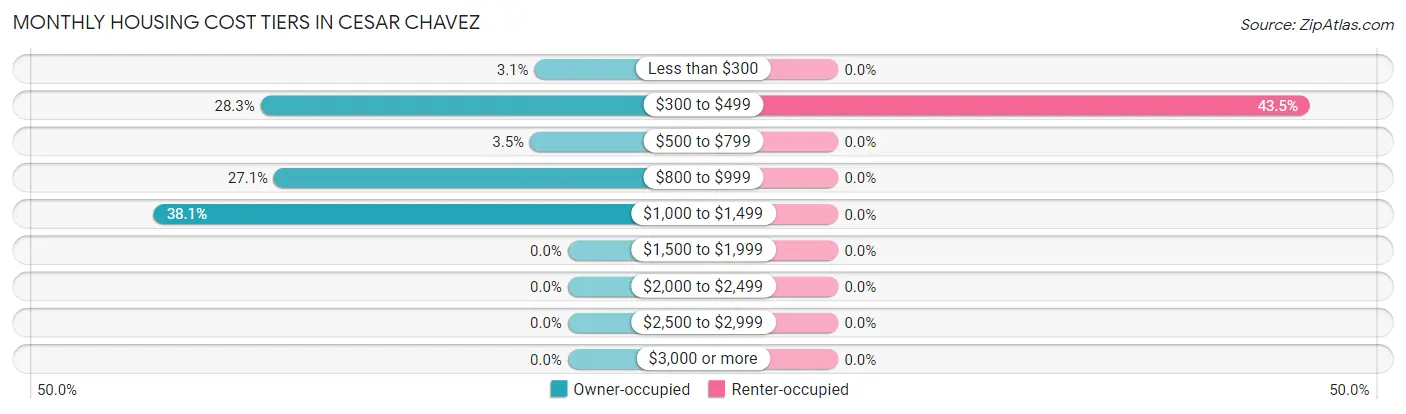
| Monthly Cost | Owner-occupied | Renter-occupied |
| Less than $300 | 15 (3.1%) | 0 (0.0%) |
| $300 to $499 | 138 (28.3%) | 20 (43.5%) |
| $500 to $799 | 17 (3.5%) | 0 (0.0%) |
| $800 to $999 | 132 (27.1%) | 0 (0.0%) |
| $1,000 to $1,499 | 186 (38.1%) | 0 (0.0%) |
| $1,500 to $1,999 | 0 (0.0%) | 0 (0.0%) |
| $2,000 to $2,499 | 0 (0.0%) | 0 (0.0%) |
| $2,500 to $2,999 | 0 (0.0%) | 0 (0.0%) |
| $3,000 or more | 0 (0.0%) | 0 (0.0%) |
| Total | 488 (100.0%) | 46 (100.0%) |
Physical Housing Characteristics in Cesar Chavez
Housing Structures in Cesar Chavez
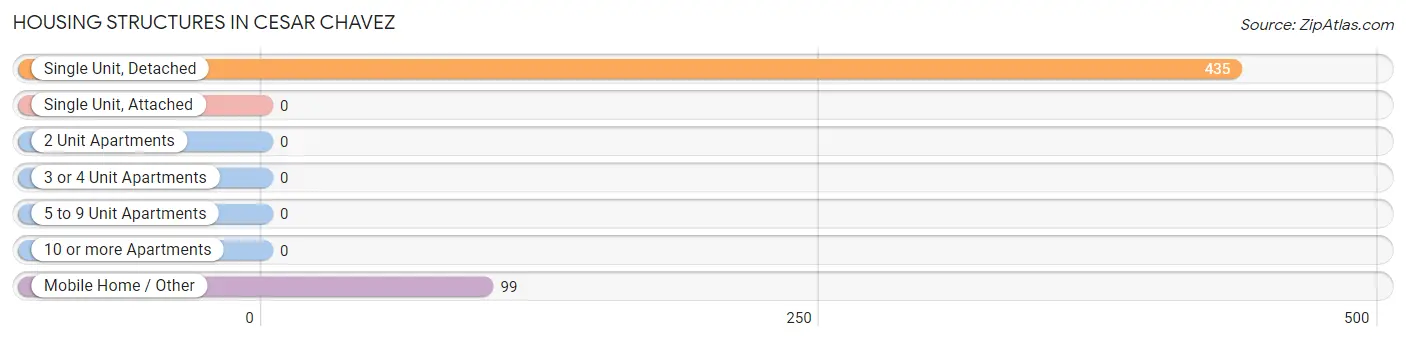
| Structure Type | # Housing Units | % Housing Units |
| Single Unit, Detached | 435 | 81.5% |
| Single Unit, Attached | 0 | 0.0% |
| 2 Unit Apartments | 0 | 0.0% |
| 3 or 4 Unit Apartments | 0 | 0.0% |
| 5 to 9 Unit Apartments | 0 | 0.0% |
| 10 or more Apartments | 0 | 0.0% |
| Mobile Home / Other | 99 | 18.5% |
| Total | 534 | 100.0% |
Housing Structures by Occupancy in Cesar Chavez
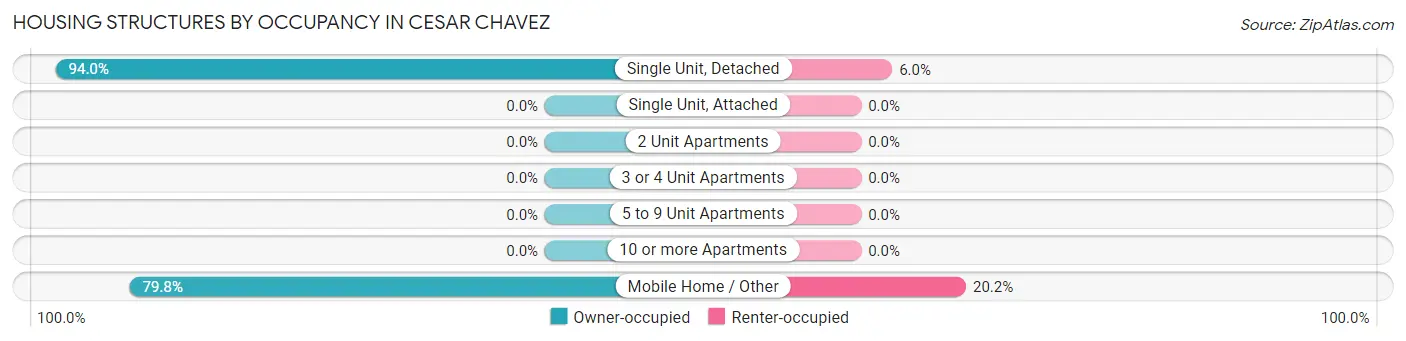
| Structure Type | Owner-occupied | Renter-occupied |
| Single Unit, Detached | 409 (94.0%) | 26 (6.0%) |
| Single Unit, Attached | 0 (0.0%) | 0 (0.0%) |
| 2 Unit Apartments | 0 (0.0%) | 0 (0.0%) |
| 3 or 4 Unit Apartments | 0 (0.0%) | 0 (0.0%) |
| 5 to 9 Unit Apartments | 0 (0.0%) | 0 (0.0%) |
| 10 or more Apartments | 0 (0.0%) | 0 (0.0%) |
| Mobile Home / Other | 79 (79.8%) | 20 (20.2%) |
| Total | 488 (91.4%) | 46 (8.6%) |
Housing Structures by Number of Rooms in Cesar Chavez
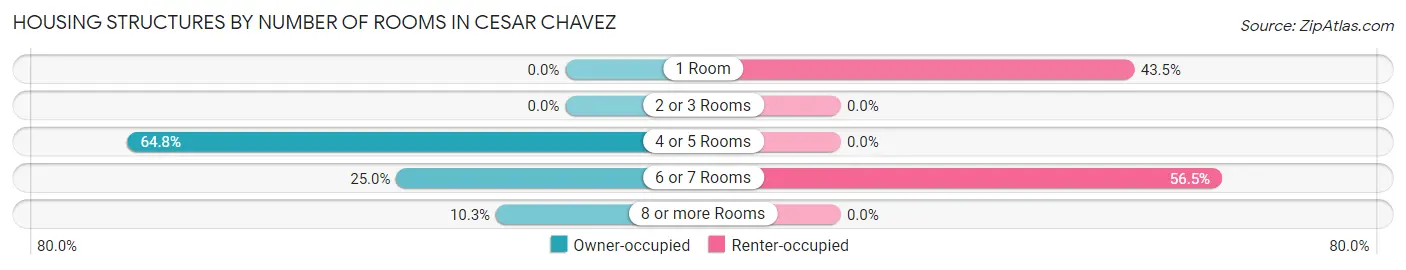
| Number of Rooms | Owner-occupied | Renter-occupied |
| 1 Room | 0 (0.0%) | 20 (43.5%) |
| 2 or 3 Rooms | 0 (0.0%) | 0 (0.0%) |
| 4 or 5 Rooms | 316 (64.7%) | 0 (0.0%) |
| 6 or 7 Rooms | 122 (25.0%) | 26 (56.5%) |
| 8 or more Rooms | 50 (10.2%) | 0 (0.0%) |
| Total | 488 (100.0%) | 46 (100.0%) |
Housing Structure by Heating Type in Cesar Chavez
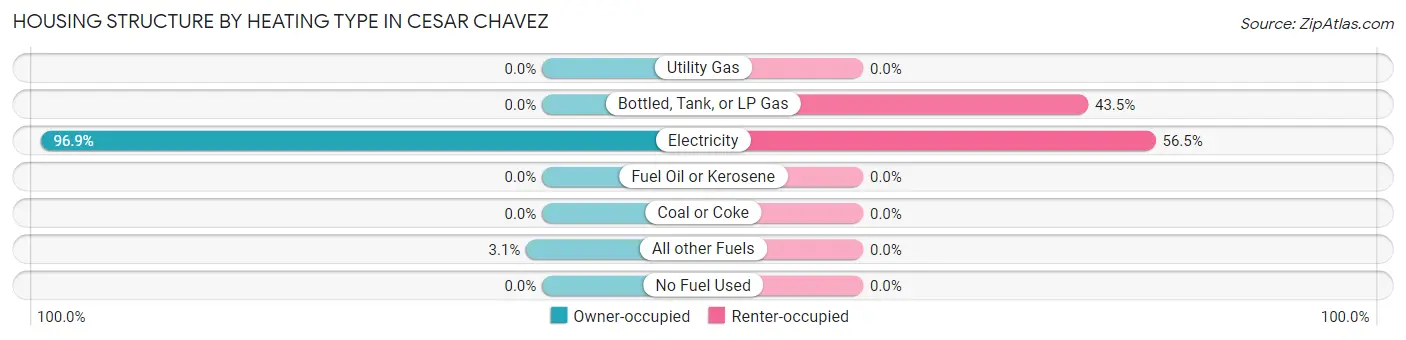
| Heating Type | Owner-occupied | Renter-occupied |
| Utility Gas | 0 (0.0%) | 0 (0.0%) |
| Bottled, Tank, or LP Gas | 0 (0.0%) | 20 (43.5%) |
| Electricity | 473 (96.9%) | 26 (56.5%) |
| Fuel Oil or Kerosene | 0 (0.0%) | 0 (0.0%) |
| Coal or Coke | 0 (0.0%) | 0 (0.0%) |
| All other Fuels | 15 (3.1%) | 0 (0.0%) |
| No Fuel Used | 0 (0.0%) | 0 (0.0%) |
| Total | 488 (100.0%) | 46 (100.0%) |
Household Vehicle Usage in Cesar Chavez
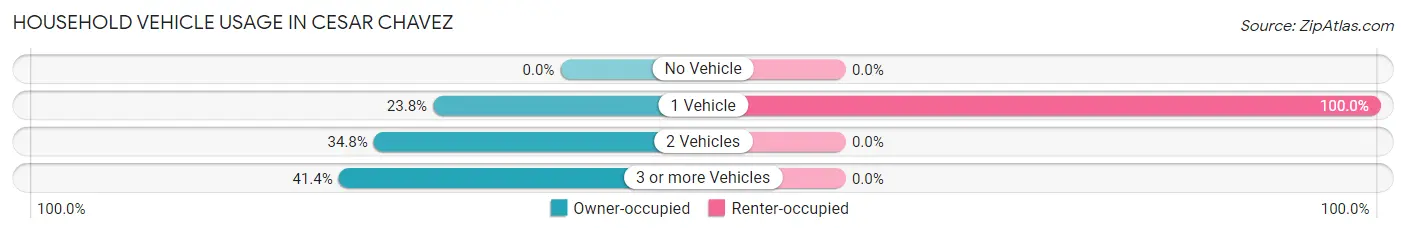
| Vehicles per Household | Owner-occupied | Renter-occupied |
| No Vehicle | 0 (0.0%) | 0 (0.0%) |
| 1 Vehicle | 116 (23.8%) | 46 (100.0%) |
| 2 Vehicles | 170 (34.8%) | 0 (0.0%) |
| 3 or more Vehicles | 202 (41.4%) | 0 (0.0%) |
| Total | 488 (100.0%) | 46 (100.0%) |
Real Estate & Mortgages in Cesar Chavez
Real Estate and Mortgage Overview in Cesar Chavez
| Characteristic | Without Mortgage | With Mortgage |
| Housing Units | 199 | 289 |
| Median Property Value | - | - |
| Median Household Income | - | - |
| Monthly Housing Costs | $388 | $0 |
| Real Estate Taxes | $1,225 | $0 |
Property Value by Mortgage Status in Cesar Chavez
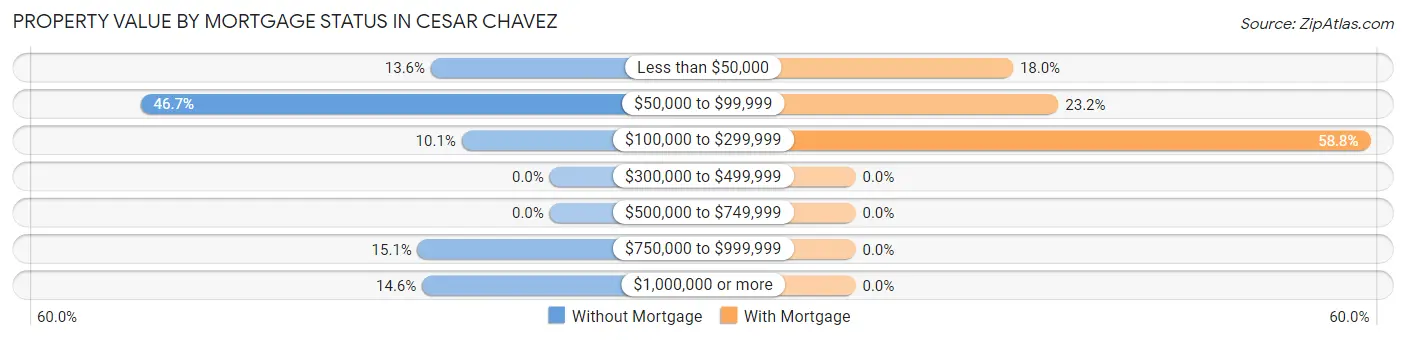
| Property Value | Without Mortgage | With Mortgage |
| Less than $50,000 | 27 (13.6%) | 52 (18.0%) |
| $50,000 to $99,999 | 93 (46.7%) | 67 (23.2%) |
| $100,000 to $299,999 | 20 (10.1%) | 170 (58.8%) |
| $300,000 to $499,999 | 0 (0.0%) | 0 (0.0%) |
| $500,000 to $749,999 | 0 (0.0%) | 0 (0.0%) |
| $750,000 to $999,999 | 30 (15.1%) | 0 (0.0%) |
| $1,000,000 or more | 29 (14.6%) | 0 (0.0%) |
| Total | 199 (100.0%) | 289 (100.0%) |
Household Income by Mortgage Status in Cesar Chavez
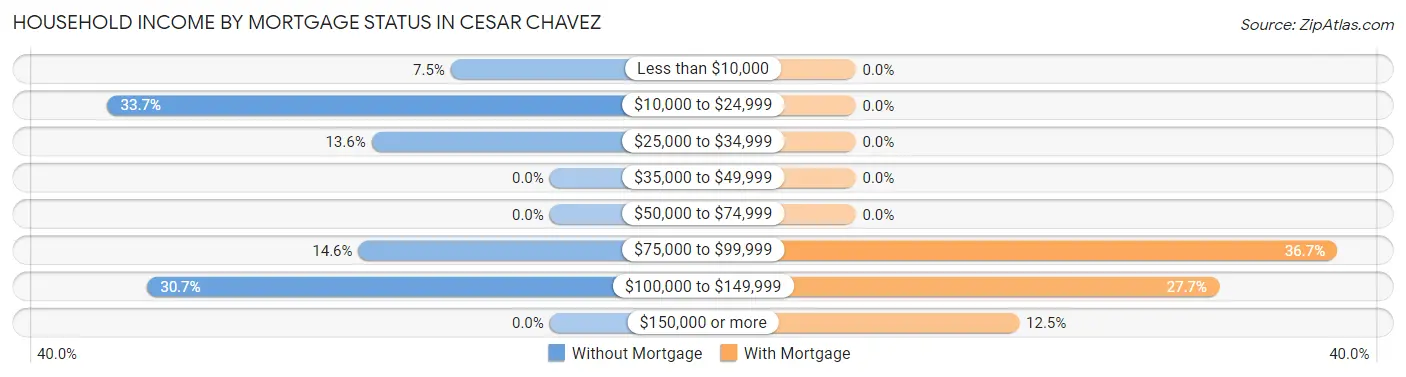
| Household Income | Without Mortgage | With Mortgage |
| Less than $10,000 | 15 (7.5%) | 0 (0.0%) |
| $10,000 to $24,999 | 67 (33.7%) | 0 (0.0%) |
| $25,000 to $34,999 | 27 (13.6%) | 0 (0.0%) |
| $35,000 to $49,999 | 0 (0.0%) | 0 (0.0%) |
| $50,000 to $74,999 | 0 (0.0%) | 0 (0.0%) |
| $75,000 to $99,999 | 29 (14.6%) | 106 (36.7%) |
| $100,000 to $149,999 | 61 (30.6%) | 80 (27.7%) |
| $150,000 or more | 0 (0.0%) | 36 (12.5%) |
| Total | 199 (100.0%) | 289 (100.0%) |
Property Value to Household Income Ratio in Cesar Chavez
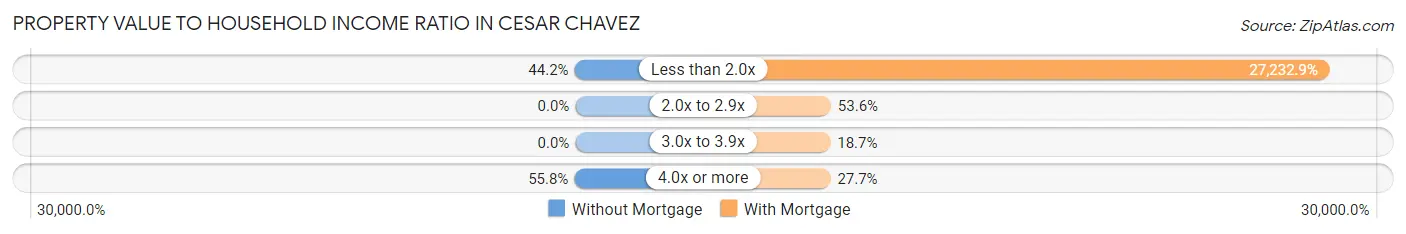
| Value-to-Income Ratio | Without Mortgage | With Mortgage |
| Less than 2.0x | 88 (44.2%) | 78,703 (27,232.9%) |
| 2.0x to 2.9x | 0 (0.0%) | 155 (53.6%) |
| 3.0x to 3.9x | 0 (0.0%) | 54 (18.7%) |
| 4.0x or more | 111 (55.8%) | 80 (27.7%) |
| Total | 199 (100.0%) | 289 (100.0%) |
Real Estate Taxes by Mortgage Status in Cesar Chavez
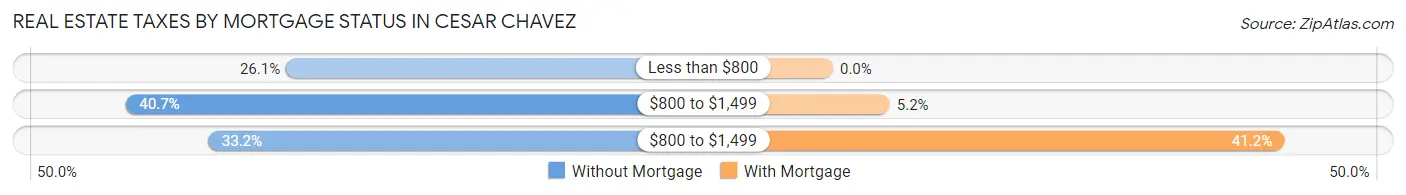
| Property Taxes | Without Mortgage | With Mortgage |
| Less than $800 | 52 (26.1%) | 0 (0.0%) |
| $800 to $1,499 | 81 (40.7%) | 15 (5.2%) |
| $800 to $1,499 | 66 (33.2%) | 119 (41.2%) |
| Total | 199 (100.0%) | 289 (100.0%) |
Health & Disability in Cesar Chavez
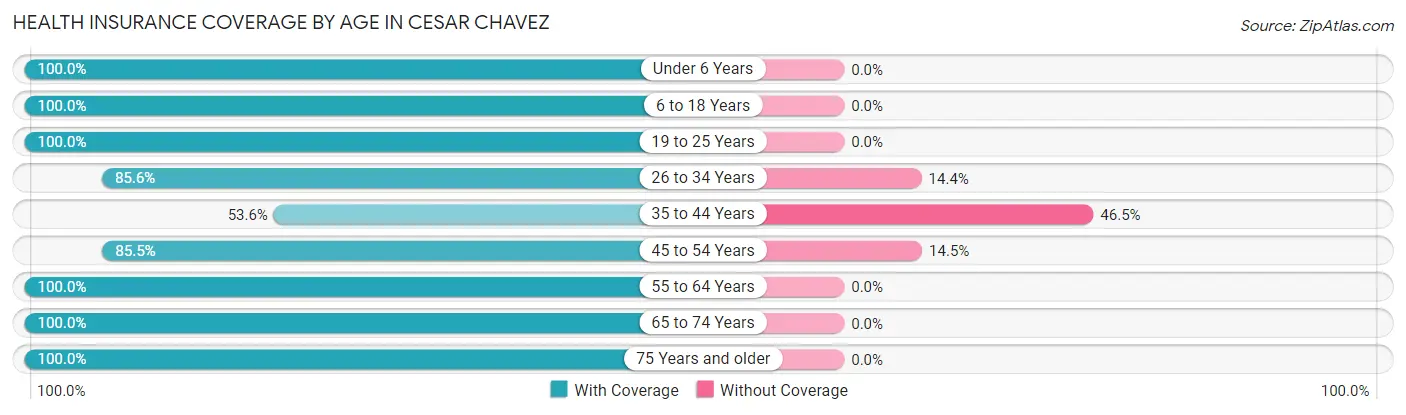
Health Insurance Coverage by Age in Cesar Chavez
| Age Bracket | With Coverage | Without Coverage |
| Under 6 Years | 140 (100.0%) | 0 (0.0%) |
| 6 to 18 Years | 453 (100.0%) | 0 (0.0%) |
| 19 to 25 Years | 134 (100.0%) | 0 (0.0%) |
| 26 to 34 Years | 255 (85.6%) | 43 (14.4%) |
| 35 to 44 Years | 113 (53.5%) | 98 (46.5%) |
| 45 to 54 Years | 312 (85.5%) | 53 (14.5%) |
| 55 to 64 Years | 93 (100.0%) | 0 (0.0%) |
| 65 to 74 Years | 15 (100.0%) | 0 (0.0%) |
| 75 Years and older | 108 (100.0%) | 0 (0.0%) |
| Total | 1,623 (89.3%) | 194 (10.7%) |
Health Insurance Coverage by Citizenship Status in Cesar Chavez
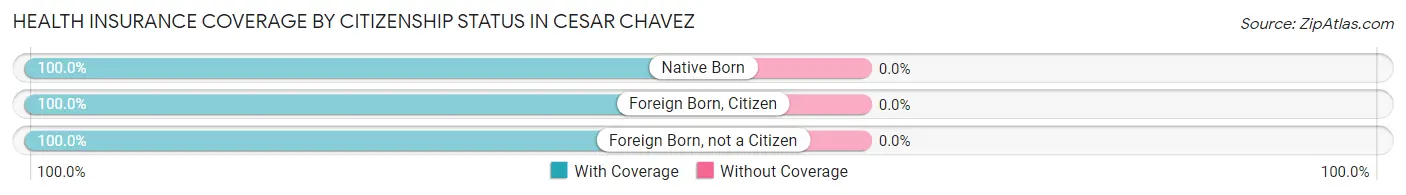
| Citizenship Status | With Coverage | Without Coverage |
| Native Born | 140 (100.0%) | 0 (0.0%) |
| Foreign Born, Citizen | 453 (100.0%) | 0 (0.0%) |
| Foreign Born, not a Citizen | 134 (100.0%) | 0 (0.0%) |
Health Insurance Coverage by Household Income in Cesar Chavez
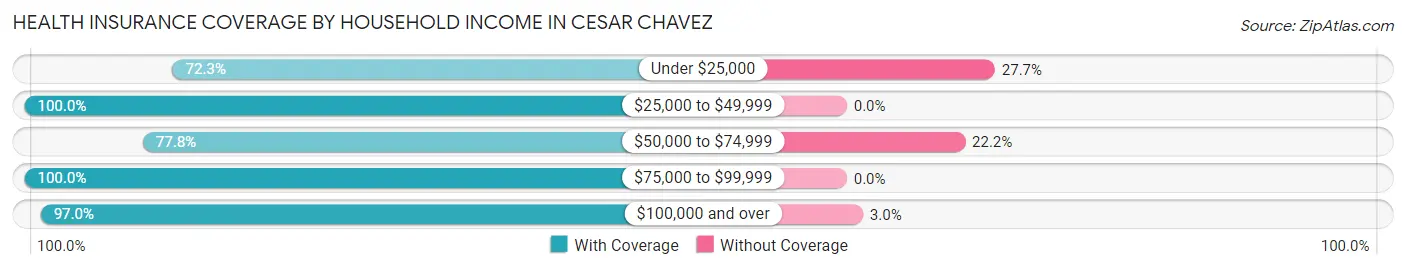
| Household Income | With Coverage | Without Coverage |
| Under $25,000 | 198 (72.3%) | 76 (27.7%) |
| $25,000 to $49,999 | 55 (100.0%) | 0 (0.0%) |
| $50,000 to $74,999 | 344 (77.8%) | 98 (22.2%) |
| $75,000 to $99,999 | 383 (100.0%) | 0 (0.0%) |
| $100,000 and over | 643 (97.0%) | 20 (3.0%) |
Public vs Private Health Insurance Coverage by Age in Cesar Chavez
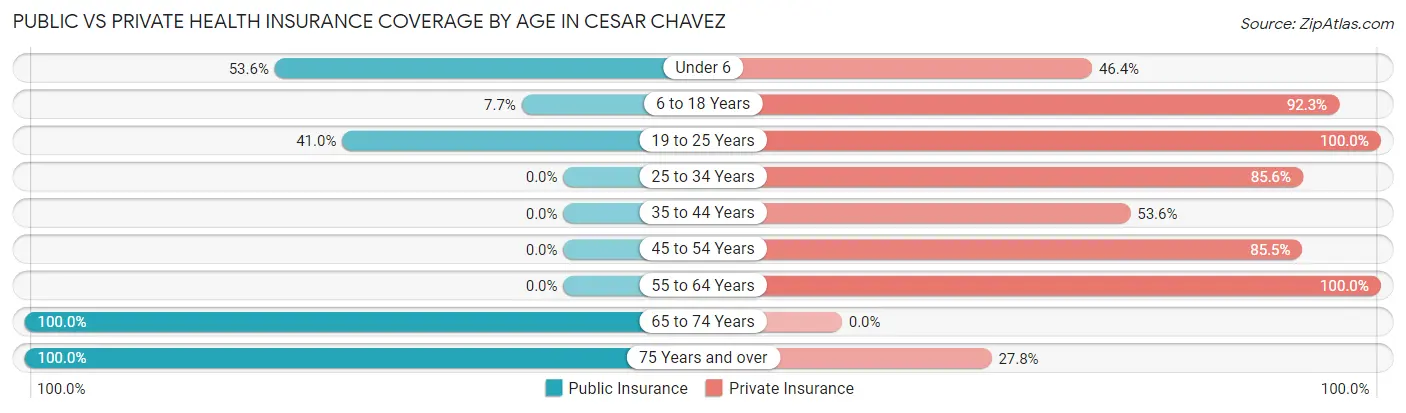
| Age Bracket | Public Insurance | Private Insurance |
| Under 6 | 75 (53.6%) | 65 (46.4%) |
| 6 to 18 Years | 35 (7.7%) | 418 (92.3%) |
| 19 to 25 Years | 55 (41.0%) | 134 (100.0%) |
| 25 to 34 Years | 0 (0.0%) | 255 (85.6%) |
| 35 to 44 Years | 0 (0.0%) | 113 (53.5%) |
| 45 to 54 Years | 0 (0.0%) | 312 (85.5%) |
| 55 to 64 Years | 0 (0.0%) | 93 (100.0%) |
| 65 to 74 Years | 15 (100.0%) | 0 (0.0%) |
| 75 Years and over | 108 (100.0%) | 30 (27.8%) |
| Total | 288 (15.9%) | 1,420 (78.1%) |
Disability Status by Sex by Age in Cesar Chavez
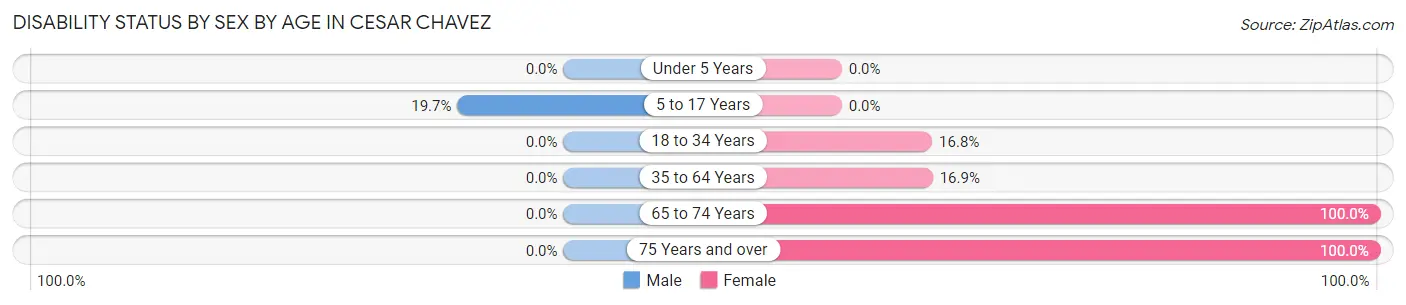
| Age Bracket | Male | Female |
| Under 5 Years | 0 (0.0%) | 0 (0.0%) |
| 5 to 17 Years | 61 (19.7%) | 0 (0.0%) |
| 18 to 34 Years | 0 (0.0%) | 54 (16.8%) |
| 35 to 64 Years | 0 (0.0%) | 52 (16.9%) |
| 65 to 74 Years | 0 (0.0%) | 15 (100.0%) |
| 75 Years and over | 0 (0.0%) | 58 (100.0%) |
Disability Class by Sex by Age in Cesar Chavez
Disability Class: Hearing Difficulty
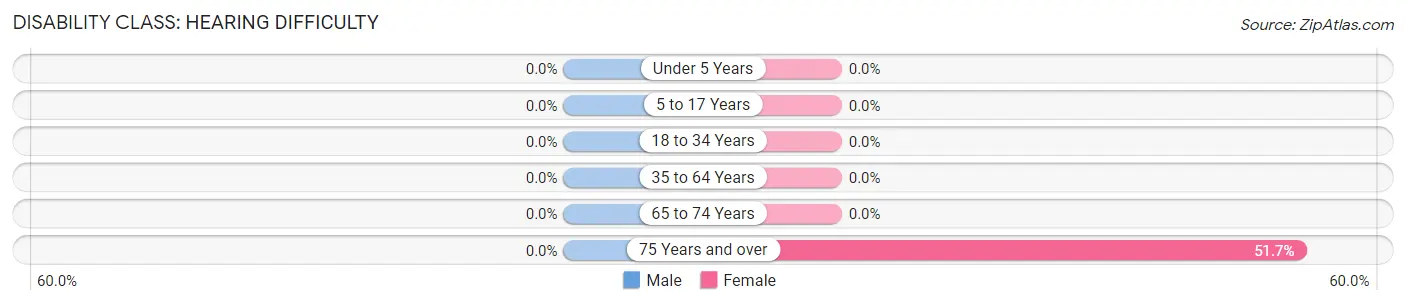
| Age Bracket | Male | Female |
| Under 5 Years | 0 (0.0%) | 0 (0.0%) |
| 5 to 17 Years | 0 (0.0%) | 0 (0.0%) |
| 18 to 34 Years | 0 (0.0%) | 0 (0.0%) |
| 35 to 64 Years | 0 (0.0%) | 0 (0.0%) |
| 65 to 74 Years | 0 (0.0%) | 0 (0.0%) |
| 75 Years and over | 0 (0.0%) | 30 (51.7%) |
Disability Class: Vision Difficulty
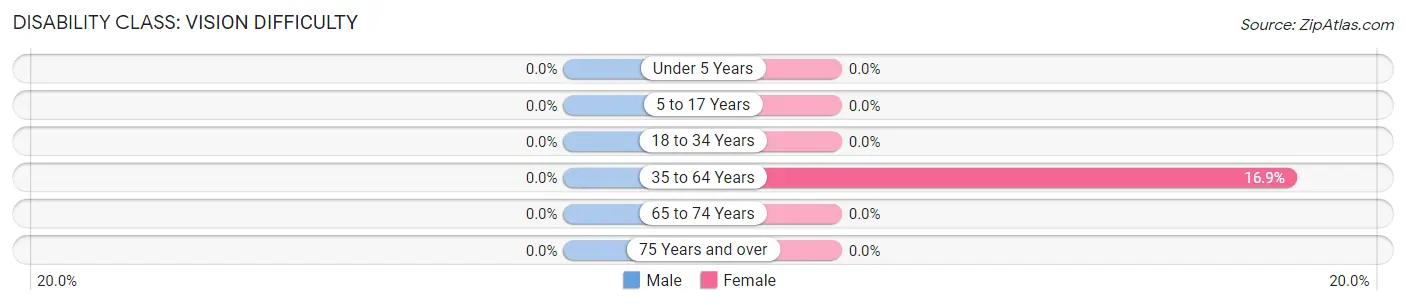
| Age Bracket | Male | Female |
| Under 5 Years | 0 (0.0%) | 0 (0.0%) |
| 5 to 17 Years | 0 (0.0%) | 0 (0.0%) |
| 18 to 34 Years | 0 (0.0%) | 0 (0.0%) |
| 35 to 64 Years | 0 (0.0%) | 52 (16.9%) |
| 65 to 74 Years | 0 (0.0%) | 0 (0.0%) |
| 75 Years and over | 0 (0.0%) | 0 (0.0%) |
Disability Class: Cognitive Difficulty
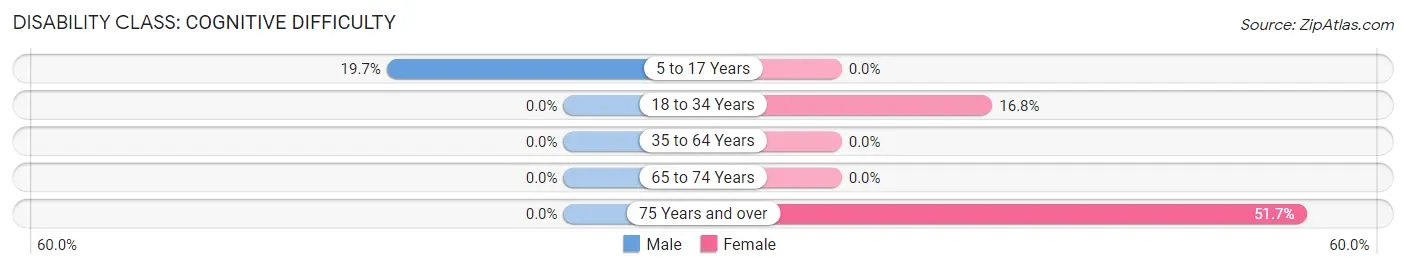
| Age Bracket | Male | Female |
| 5 to 17 Years | 61 (19.7%) | 0 (0.0%) |
| 18 to 34 Years | 0 (0.0%) | 54 (16.8%) |
| 35 to 64 Years | 0 (0.0%) | 0 (0.0%) |
| 65 to 74 Years | 0 (0.0%) | 0 (0.0%) |
| 75 Years and over | 0 (0.0%) | 30 (51.7%) |
Disability Class: Ambulatory Difficulty
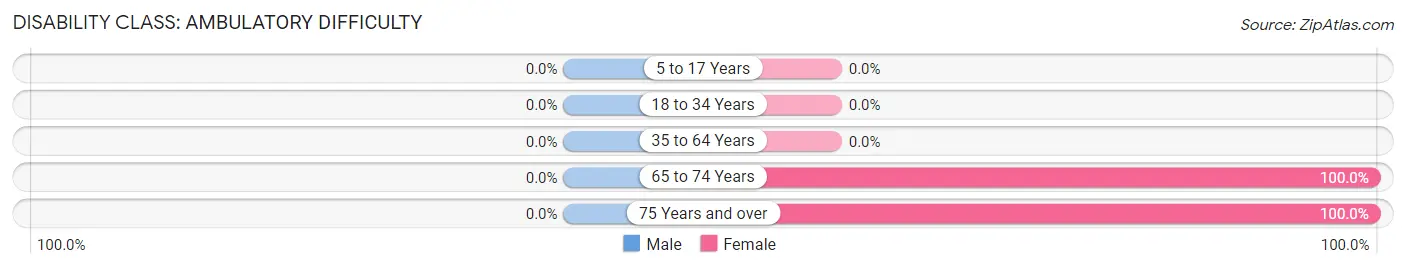
| Age Bracket | Male | Female |
| 5 to 17 Years | 0 (0.0%) | 0 (0.0%) |
| 18 to 34 Years | 0 (0.0%) | 0 (0.0%) |
| 35 to 64 Years | 0 (0.0%) | 0 (0.0%) |
| 65 to 74 Years | 0 (0.0%) | 15 (100.0%) |
| 75 Years and over | 0 (0.0%) | 58 (100.0%) |
Disability Class: Self-Care Difficulty
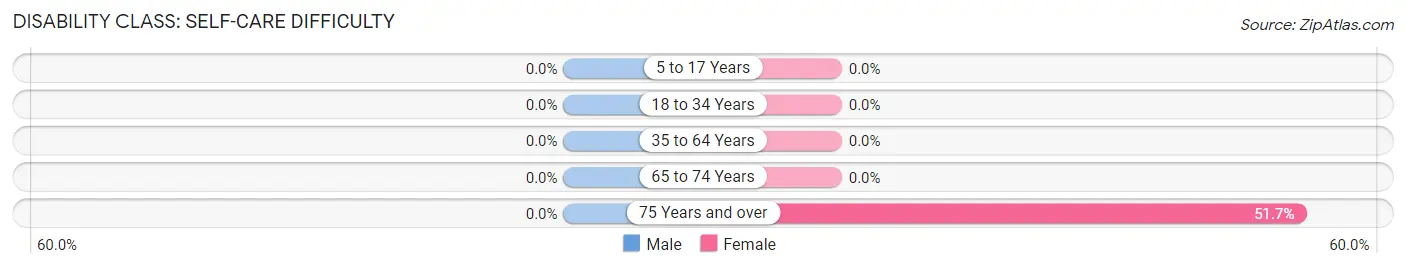
| Age Bracket | Male | Female |
| 5 to 17 Years | 0 (0.0%) | 0 (0.0%) |
| 18 to 34 Years | 0 (0.0%) | 0 (0.0%) |
| 35 to 64 Years | 0 (0.0%) | 0 (0.0%) |
| 65 to 74 Years | 0 (0.0%) | 0 (0.0%) |
| 75 Years and over | 0 (0.0%) | 30 (51.7%) |
Technology Access in Cesar Chavez
Computing Device Access in Cesar Chavez
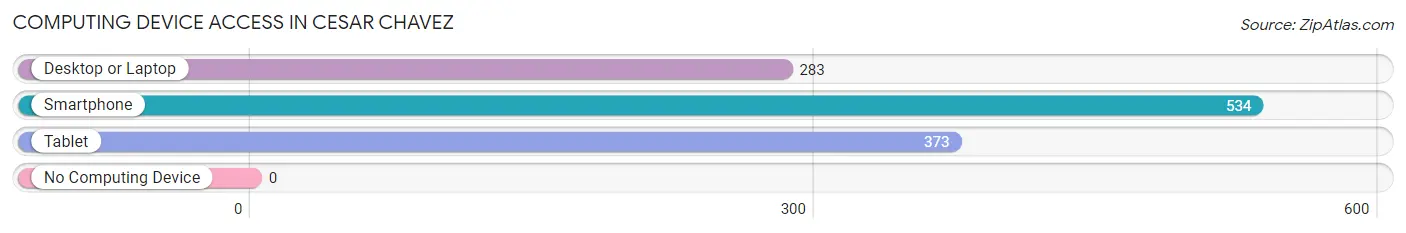
| Device Type | # Households | % Households |
| Desktop or Laptop | 283 | 53.0% |
| Smartphone | 534 | 100.0% |
| Tablet | 373 | 69.9% |
| No Computing Device | 0 | 0.0% |
| Total | 534 | 100.0% |
Internet Access in Cesar Chavez
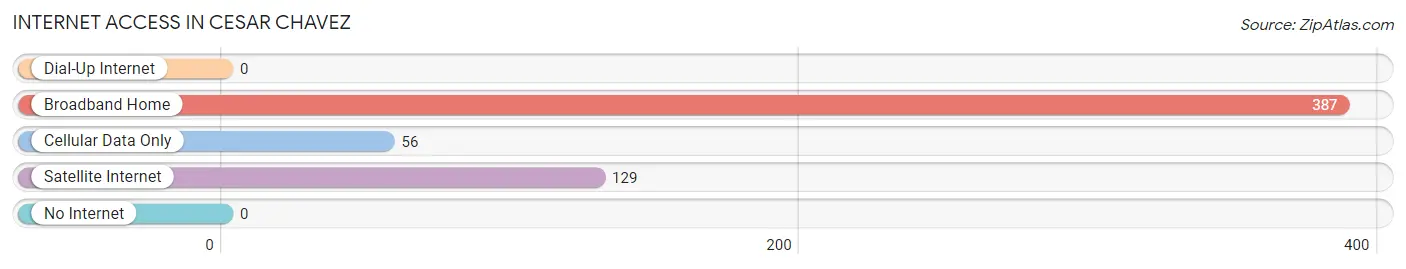
| Internet Type | # Households | % Households |
| Dial-Up Internet | 0 | 0.0% |
| Broadband Home | 387 | 72.5% |
| Cellular Data Only | 56 | 10.5% |
| Satellite Internet | 129 | 24.2% |
| No Internet | 0 | 0.0% |
| Total | 534 | 100.0% |
Cesar Chavez Summary
Cesar Chavez, Texas is a small town located in the Rio Grande Valley of South Texas. It is situated in Hidalgo County, approximately 20 miles west of McAllen and 30 miles east of Mission. The town was named after the famous labor leader and civil rights activist Cesar Chavez, who was born in Yuma, Arizona in 1927.
Geography
Cesar Chavez, Texas is located in the Rio Grande Valley of South Texas. It is situated in Hidalgo County, approximately 20 miles west of McAllen and 30 miles east of Mission. The town is located on the banks of the Rio Grande River, which forms the border between the United States and Mexico. The town is surrounded by agricultural fields and is home to a variety of wildlife, including deer, javelina, and wild turkeys. The climate in Cesar Chavez is subtropical, with hot summers and mild winters.
History
Cesar Chavez, Texas was founded in the early 1900s by Mexican immigrants who were looking for a better life. The town was named after the famous labor leader and civil rights activist Cesar Chavez, who was born in Yuma, Arizona in 1927. The town was originally a small farming community, but it has since grown to become a vibrant and diverse community.
Economy
The economy of Cesar Chavez, Texas is largely based on agriculture. The town is home to a variety of farms, including vegetable farms, citrus farms, and cattle ranches. The town is also home to a number of businesses, including restaurants, grocery stores, and retail stores. The town is also home to a number of manufacturing companies, including a furniture factory and a plastics factory.
Demographics
As of the 2010 census, the population of Cesar Chavez, Texas was 2,845. The population is predominantly Hispanic, with over 90% of the population identifying as Hispanic or Latino. The median household income in the town is $25,000, and the median age is 28. The town is home to a variety of religious denominations, including Catholic, Baptist, and Methodist.
Conclusion
Cesar Chavez, Texas is a small town located in the Rio Grande Valley of South Texas. It is situated in Hidalgo County, approximately 20 miles west of McAllen and 30 miles east of Mission. The town was named after the famous labor leader and civil rights activist Cesar Chavez, who was born in Yuma, Arizona in 1927. The economy of Cesar Chavez, Texas is largely based on agriculture, and the town is home to a variety of businesses. The population of Cesar Chavez, Texas is predominantly Hispanic, with over 90% of the population identifying as Hispanic or Latino. The town is home to a variety of religious denominations, and the median household income is $25,000.
Common Questions
What is the Total Population of Cesar Chavez?
Total Population of Cesar Chavez is 1,817.
What is the Total Male Population of Cesar Chavez?
Total Male Population of Cesar Chavez is 864.
What is the Total Female Population of Cesar Chavez?
Total Female Population of Cesar Chavez is 953.
What is the Ratio of Males per 100 Females in Cesar Chavez?
There are 90.66 Males per 100 Females in Cesar Chavez.
What is the Ratio of Females per 100 Males in Cesar Chavez?
There are 110.30 Females per 100 Males in Cesar Chavez.
What is the Median Population Age in Cesar Chavez?
Median Population Age in Cesar Chavez is 32.0 Years.
What is the Average Family Size in Cesar Chavez
Average Family Size in Cesar Chavez is 3.6 People.
What is the Average Household Size in Cesar Chavez
Average Household Size in Cesar Chavez is 3.4 People.
What is Per Capita Income in Cesar Chavez?
Per Capita income in Cesar Chavez is $24,346.
What is the Median Family Income in Cesar Chavez?
Median Family Income in Cesar Chavez is $77,813.
What is the Median Household income in Cesar Chavez?
Median Household Income in Cesar Chavez is $77,594.
What is Income or Wage Gap in Cesar Chavez?
Income or Wage Gap in Cesar Chavez is 40.1%.
Women in Cesar Chavez earn 59.9 cents for every dollar earned by a man.
What is Inequality or Gini Index in Cesar Chavez?
Inequality or Gini Index in Cesar Chavez is 0.35.
How Large is the Labor Force in Cesar Chavez?
There are 754 People in the Labor Forcein in Cesar Chavez.
What is the Percentage of People in the Labor Force in Cesar Chavez?
57.2% of People are in the Labor Force in Cesar Chavez.
What is the Unemployment Rate in Cesar Chavez?
Unemployment Rate in Cesar Chavez is 7.6%.