Cape Royale, TX
Cape Royale Map
Cape Royale Overview
469
TOTAL POPULATION
198
MALE POPULATION
271
FEMALE POPULATION
73.06
MALES / 100 FEMALES
136.87
FEMALES / 100 MALES
64.6
MEDIAN AGE
2.0
AVG FAMILY SIZE
1.7
AVG HOUSEHOLD SIZE
$44,416
PER CAPITA INCOME
$105,063
AVG FAMILY INCOME
$57,273
AVG HOUSEHOLD INCOME
16.5%
WAGE / INCOME GAP [ % ]
83.5¢/ $1
WAGE / INCOME GAP [ $ ]
0.37
INEQUALITY / GINI INDEX
267
LABOR FORCE [ PEOPLE ]
56.9%
PERCENT IN LABOR FORCE
21.3%
UNEMPLOYMENT RATE
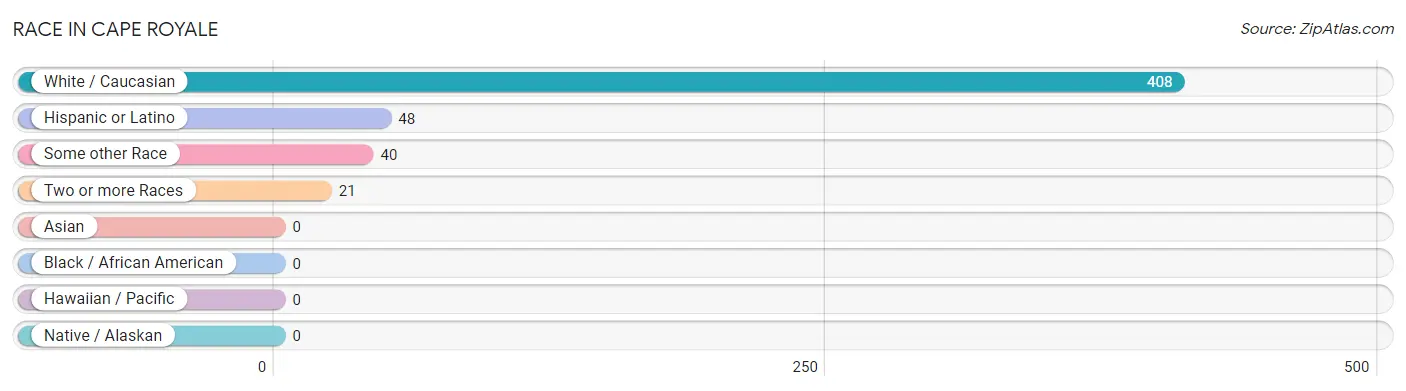
Race in Cape Royale
The most populous races in Cape Royale are White / Caucasian (408 | 87.0%), Hispanic or Latino (48 | 10.2%), and Some other Race (40 | 8.5%).
| Race | # Population | % Population |
| Asian | 0 | 0.0% |
| Black / African American | 0 | 0.0% |
| Hawaiian / Pacific | 0 | 0.0% |
| Hispanic or Latino | 48 | 10.2% |
| Native / Alaskan | 0 | 0.0% |
| White / Caucasian | 408 | 87.0% |
| Two or more Races | 21 | 4.5% |
| Some other Race | 40 | 8.5% |
| Total | 469 | 100.0% |
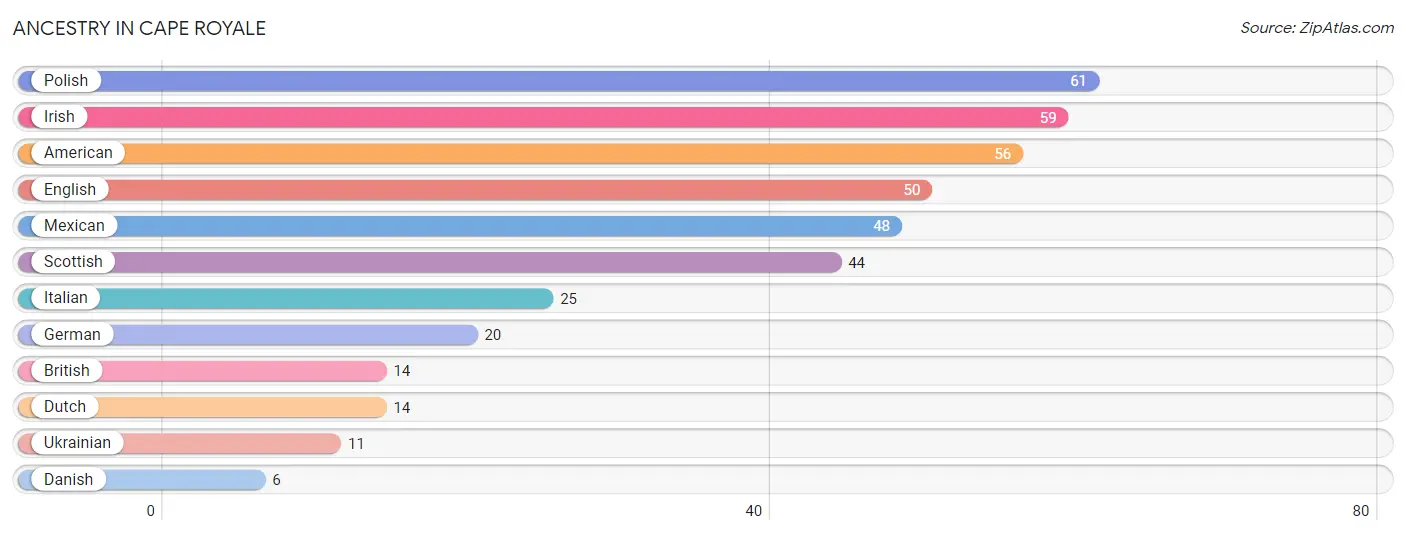
Ancestry in Cape Royale
The most populous ancestries reported in Cape Royale are Polish (61 | 13.0%), Irish (59 | 12.6%), American (56 | 11.9%), English (50 | 10.7%), and Mexican (48 | 10.2%), together accounting for 58.4% of all Cape Royale residents.
| Ancestry | # Population | % Population |
| American | 56 | 11.9% |
| British | 14 | 3.0% |
| Danish | 6 | 1.3% |
| Dutch | 14 | 3.0% |
| English | 50 | 10.7% |
| German | 20 | 4.3% |
| Irish | 59 | 12.6% |
| Italian | 25 | 5.3% |
| Mexican | 48 | 10.2% |
| Polish | 61 | 13.0% |
| Scottish | 44 | 9.4% |
| Ukrainian | 11 | 2.4% | View All 12 Rows |
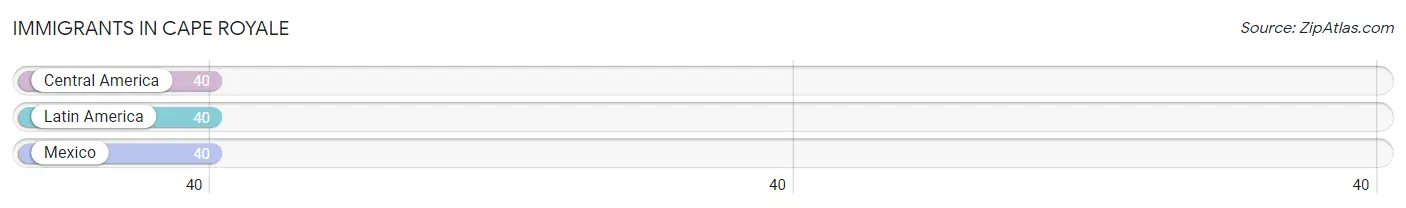
Immigrants in Cape Royale
The most numerous immigrant groups reported in Cape Royale came from Central America (40 | 8.5%), Latin America (40 | 8.5%), and Mexico (40 | 8.5%), together accounting for 25.6% of all Cape Royale residents.
| Immigration Origin | # Population | % Population |
| Central America | 40 | 8.5% |
| Latin America | 40 | 8.5% |
| Mexico | 40 | 8.5% | View All 3 Rows |
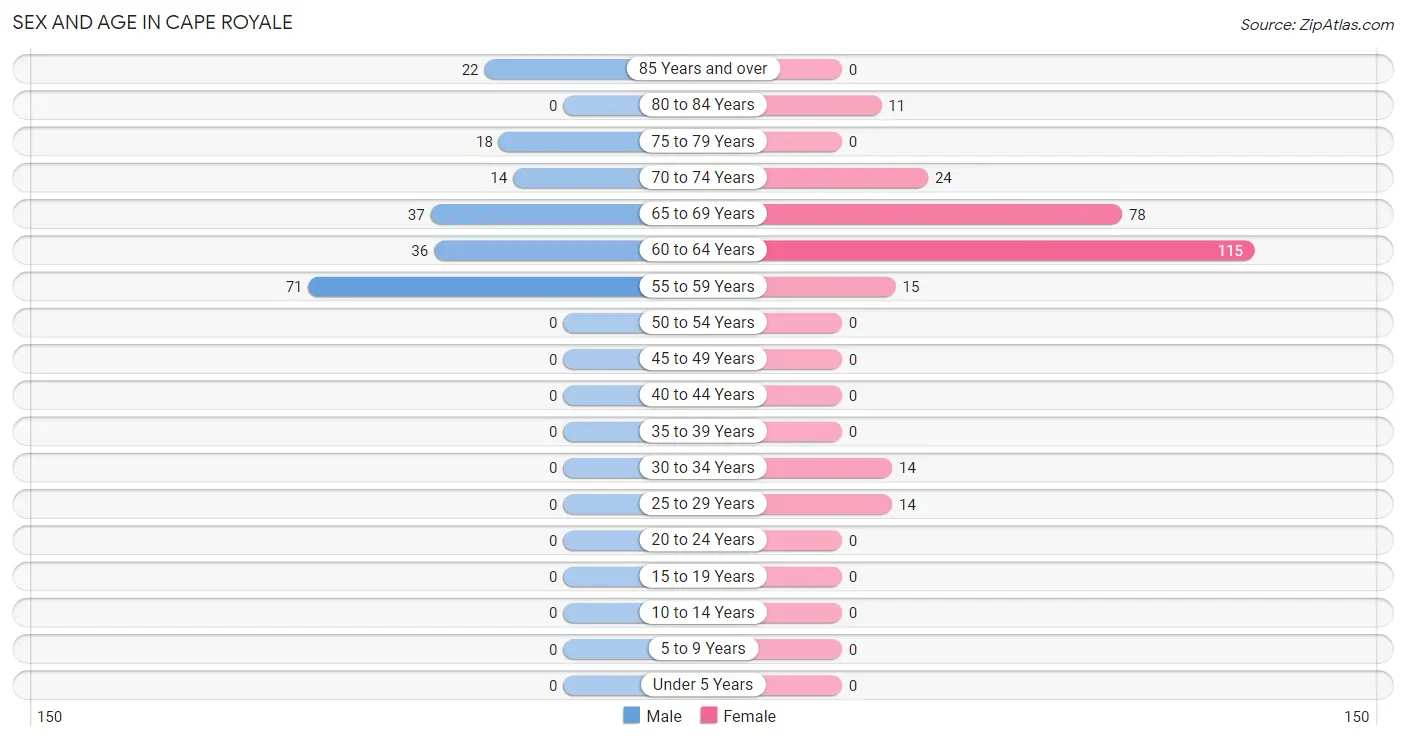
Sex and Age in Cape Royale
Sex and Age in Cape Royale
The most populous age groups in Cape Royale are 55 to 59 Years (71 | 35.9%) for men and 60 to 64 Years (115 | 42.4%) for women.
| Age Bracket | Male | Female |
| Under 5 Years | 0 (0.0%) | 0 (0.0%) |
| 5 to 9 Years | 0 (0.0%) | 0 (0.0%) |
| 10 to 14 Years | 0 (0.0%) | 0 (0.0%) |
| 15 to 19 Years | 0 (0.0%) | 0 (0.0%) |
| 20 to 24 Years | 0 (0.0%) | 0 (0.0%) |
| 25 to 29 Years | 0 (0.0%) | 14 (5.2%) |
| 30 to 34 Years | 0 (0.0%) | 14 (5.2%) |
| 35 to 39 Years | 0 (0.0%) | 0 (0.0%) |
| 40 to 44 Years | 0 (0.0%) | 0 (0.0%) |
| 45 to 49 Years | 0 (0.0%) | 0 (0.0%) |
| 50 to 54 Years | 0 (0.0%) | 0 (0.0%) |
| 55 to 59 Years | 71 (35.9%) | 15 (5.5%) |
| 60 to 64 Years | 36 (18.2%) | 115 (42.4%) |
| 65 to 69 Years | 37 (18.7%) | 78 (28.8%) |
| 70 to 74 Years | 14 (7.1%) | 24 (8.9%) |
| 75 to 79 Years | 18 (9.1%) | 0 (0.0%) |
| 80 to 84 Years | 0 (0.0%) | 11 (4.1%) |
| 85 Years and over | 22 (11.1%) | 0 (0.0%) |
| Total | 198 (100.0%) | 271 (100.0%) |
Families and Households in Cape Royale
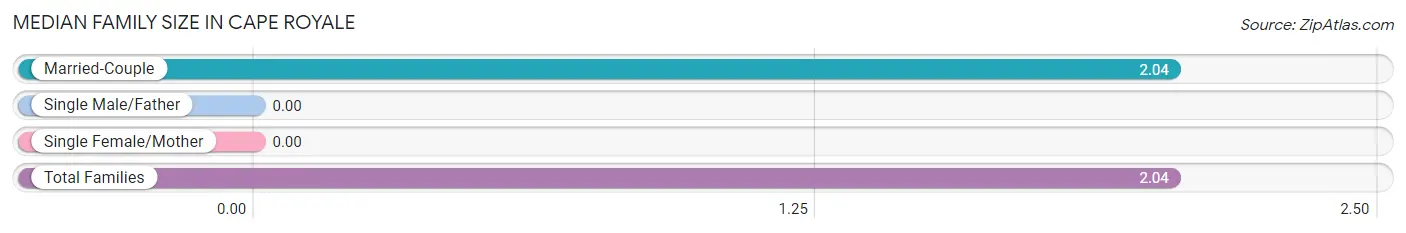
Median Family Size in Cape Royale
| Family Type | # Families | Family Size |
| Married-Couple | 182 (100.0%) | 2.04 |
| Single Male/Father | 0 (0.0%) | - |
| Single Female/Mother | 0 (0.0%) | - |
| Total Families | 182 (100.0%) | 2.04 |
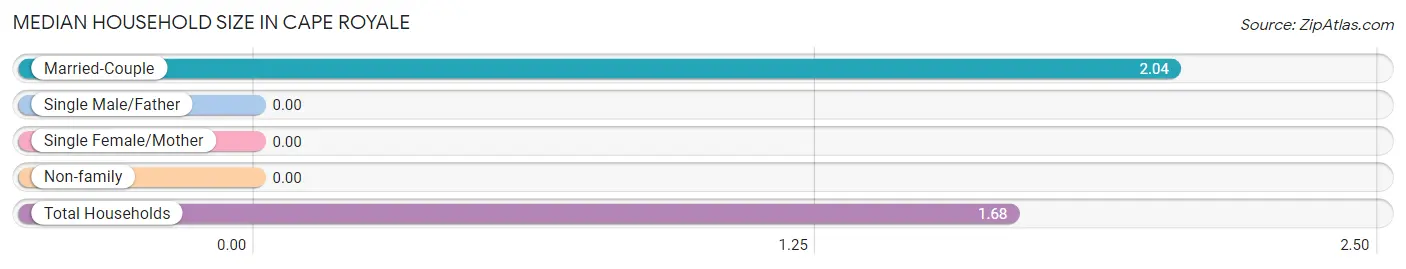
Median Household Size in Cape Royale
| Household Type | # Households | Household Size |
| Married-Couple | 182 (65.0%) | 2.04 |
| Single Male/Father | 0 (0.0%) | - |
| Single Female/Mother | 0 (0.0%) | - |
| Non-family | 98 (35.0%) | - |
| Total Households | 280 (100.0%) | 1.68 |
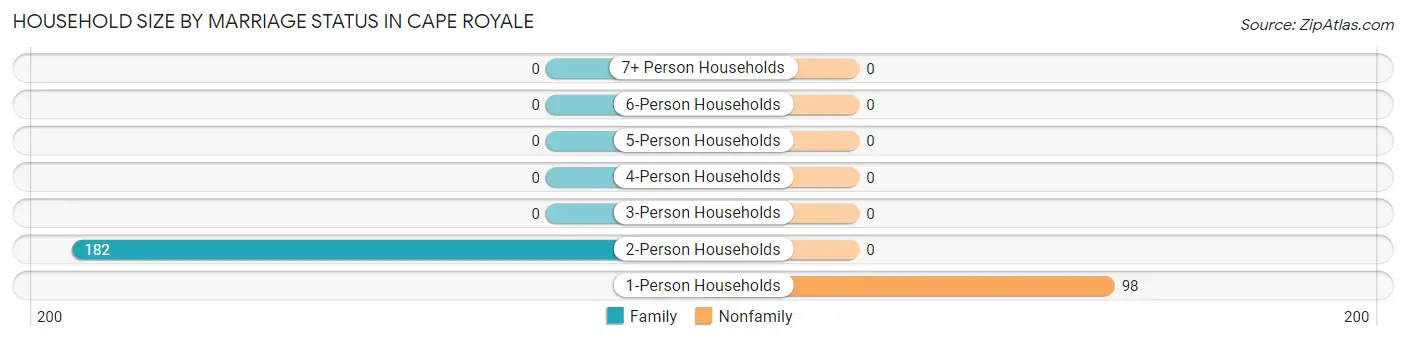
Household Size by Marriage Status in Cape Royale
Out of a total of 280 households in Cape Royale, 182 (65.0%) are family households, while 98 (35.0%) are nonfamily households. The most numerous type of family households are 2-person households, comprising 182, and the most common type of nonfamily households are 1-person households, comprising 98.
| Household Size | Family Households | Nonfamily Households |
| 1-Person Households | - | 98 (35.0%) |
| 2-Person Households | 182 (65.0%) | 0 (0.0%) |
| 3-Person Households | 0 (0.0%) | 0 (0.0%) |
| 4-Person Households | 0 (0.0%) | 0 (0.0%) |
| 5-Person Households | 0 (0.0%) | 0 (0.0%) |
| 6-Person Households | 0 (0.0%) | 0 (0.0%) |
| 7+ Person Households | 0 (0.0%) | 0 (0.0%) |
| Total | 182 (65.0%) | 98 (35.0%) |
Female Fertility in Cape Royale
Fertility by Age in Cape Royale
| Age Bracket | Women with Births | Births / 1,000 Women |
| 15 to 19 years | 0 (0.0%) | 0.0 |
| 20 to 34 years | 0 (0.0%) | 0.0 |
| 35 to 50 years | 0 (0.0%) | 0.0 |
| Total | 0 (0.0%) | 0.0 |
Fertility by Age by Marriage Status in Cape Royale
| Age Bracket | Married | Unmarried |
| 15 to 19 years | 0 (0.0%) | 0 (0.0%) |
| 20 to 34 years | 0 (0.0%) | 0 (0.0%) |
| 35 to 50 years | 0 (0.0%) | 0 (0.0%) |
| Total | 0 (0.0%) | 0 (0.0%) |
Fertility by Education in Cape Royale
| Educational Attainment | Women with Births | Births / 1,000 Women |
| Less than High School | 0 (0.0%) | 0.0 |
| High School Diploma | 0 (0.0%) | 0.0 |
| College or Associate's Degree | 0 (0.0%) | 0.0 |
| Bachelor's Degree | 0 (0.0%) | 0.0 |
| Graduate Degree | 0 (0.0%) | 0.0 |
| Total | 0 (0.0%) | 0.0 |
Fertility by Education by Marriage Status in Cape Royale
| Educational Attainment | Married | Unmarried |
| Less than High School | 0 (0.0%) | 0 (0.0%) |
| High School Diploma | 0 (0.0%) | 0 (0.0%) |
| College or Associate's Degree | 0 (0.0%) | 0 (0.0%) |
| Bachelor's Degree | 0 (0.0%) | 0 (0.0%) |
| Graduate Degree | 0 (0.0%) | 0 (0.0%) |
| Total | 0 (0.0%) | 0 (0.0%) |
Income in Cape Royale
Income Overview in Cape Royale
Per Capita Income in Cape Royale is $44,416, while median incomes of families and households are $105,063 and $57,273 respectively.
| Characteristic | Number | Measure |
| Per Capita Income | 469 | $44,416 |
| Median Family Income | 182 | $105,063 |
| Mean Family Income | 182 | $89,930 |
| Median Household Income | 280 | $57,273 |
| Mean Household Income | 280 | $73,254 |
| Income Deficit | 182 | $0 |
| Wage / Income Gap (%) | 469 | 16.49% |
| Wage / Income Gap ($) | 469 | 83.51¢ per $1 |
| Gini / Inequality Index | 469 | 0.37 |
Earnings by Sex in Cape Royale
Average Earnings in Cape Royale are $49,250, $58,112 for men and $48,531 for women, a difference of 16.5%.
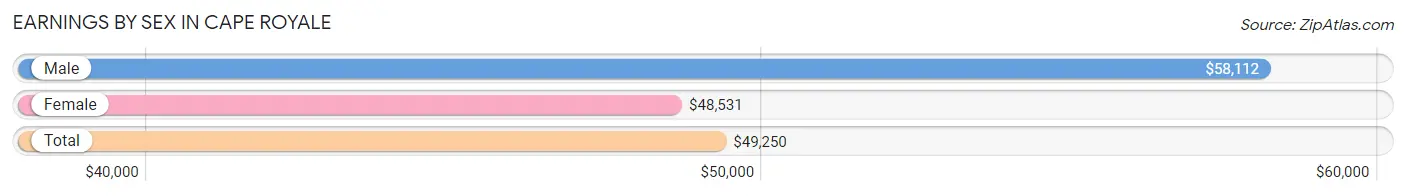
| Sex | Number | Average Earnings |
| Male | 107 (44.2%) | $58,112 |
| Female | 135 (55.8%) | $48,531 |
| Total | 242 (100.0%) | $49,250 |
Earnings by Sex by Income Bracket in Cape Royale
The most common earnings brackets in Cape Royale are $55,000 to $64,999 for men (47 | 43.9%) and $45,000 to $49,999 for women (40 | 29.6%).
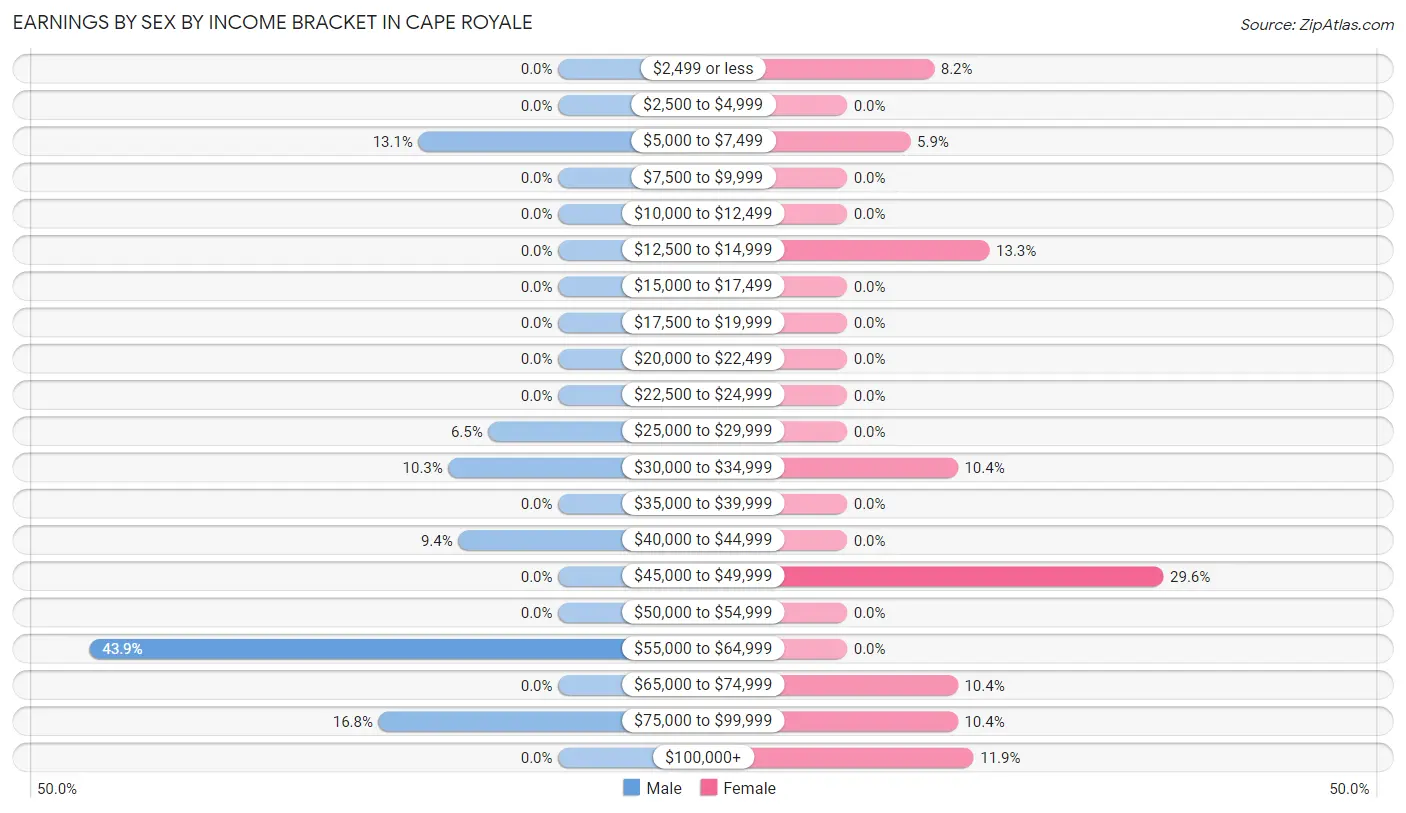
| Income | Male | Female |
| $2,499 or less | 0 (0.0%) | 11 (8.2%) |
| $2,500 to $4,999 | 0 (0.0%) | 0 (0.0%) |
| $5,000 to $7,499 | 14 (13.1%) | 8 (5.9%) |
| $7,500 to $9,999 | 0 (0.0%) | 0 (0.0%) |
| $10,000 to $12,499 | 0 (0.0%) | 0 (0.0%) |
| $12,500 to $14,999 | 0 (0.0%) | 18 (13.3%) |
| $15,000 to $17,499 | 0 (0.0%) | 0 (0.0%) |
| $17,500 to $19,999 | 0 (0.0%) | 0 (0.0%) |
| $20,000 to $22,499 | 0 (0.0%) | 0 (0.0%) |
| $22,500 to $24,999 | 0 (0.0%) | 0 (0.0%) |
| $25,000 to $29,999 | 7 (6.5%) | 0 (0.0%) |
| $30,000 to $34,999 | 11 (10.3%) | 14 (10.4%) |
| $35,000 to $39,999 | 0 (0.0%) | 0 (0.0%) |
| $40,000 to $44,999 | 10 (9.3%) | 0 (0.0%) |
| $45,000 to $49,999 | 0 (0.0%) | 40 (29.6%) |
| $50,000 to $54,999 | 0 (0.0%) | 0 (0.0%) |
| $55,000 to $64,999 | 47 (43.9%) | 0 (0.0%) |
| $65,000 to $74,999 | 0 (0.0%) | 14 (10.4%) |
| $75,000 to $99,999 | 18 (16.8%) | 14 (10.4%) |
| $100,000+ | 0 (0.0%) | 16 (11.8%) |
| Total | 107 (100.0%) | 135 (100.0%) |
Earnings by Sex by Educational Attainment in Cape Royale
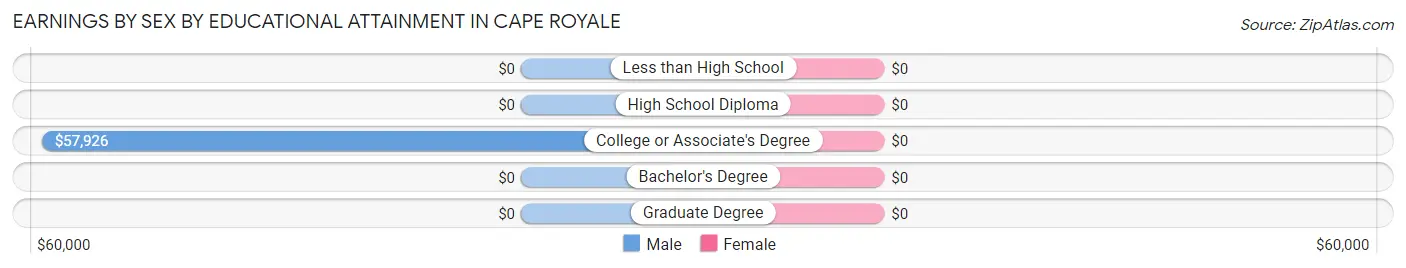
| Educational Attainment | Male Income | Female Income |
| Less than High School | - | - |
| High School Diploma | - | - |
| College or Associate's Degree | $57,926 | $0 |
| Bachelor's Degree | - | - |
| Graduate Degree | - | - |
| Total | $58,112 | $48,531 |
Family Income in Cape Royale
Family Income Brackets in Cape Royale
According to the Cape Royale family income data, there are 78 families falling into the $100,000 to $149,999 income range, which is the most common income bracket and makes up 42.9% of all families.
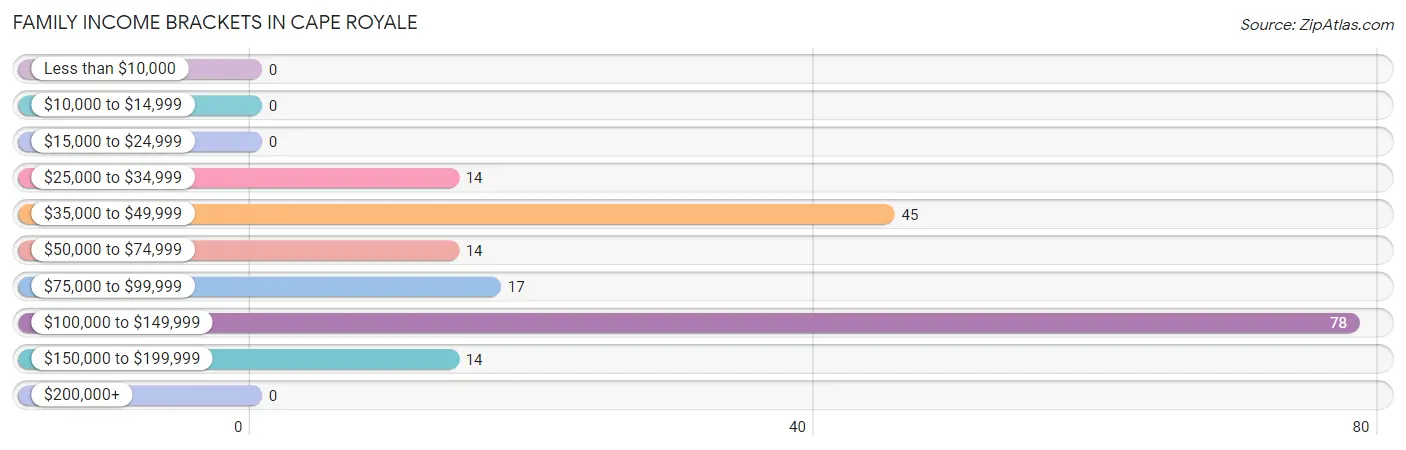
| Income Bracket | # Families | % Families |
| Less than $10,000 | 0 | 0.0% |
| $10,000 to $14,999 | 0 | 0.0% |
| $15,000 to $24,999 | 0 | 0.0% |
| $25,000 to $34,999 | 14 | 7.7% |
| $35,000 to $49,999 | 45 | 24.7% |
| $50,000 to $74,999 | 14 | 7.7% |
| $75,000 to $99,999 | 17 | 9.3% |
| $100,000 to $149,999 | 78 | 42.9% |
| $150,000 to $199,999 | 14 | 7.7% |
| $200,000+ | 0 | 0.0% |
Family Income by Famaliy Size in Cape Royale
2-person families (182 | 100.0%) account for the highest median family income in Cape Royale with $105,063 per family, while 2-person families (182 | 100.0%) have the highest median income of $52,532 per family member.
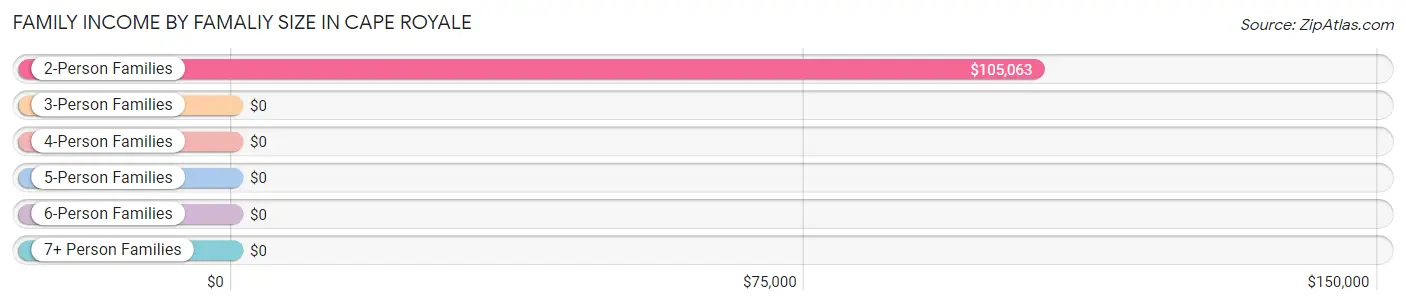
| Income Bracket | # Families | Median Income |
| 2-Person Families | 182 (100.0%) | $105,063 |
| 3-Person Families | 0 (0.0%) | $0 |
| 4-Person Families | 0 (0.0%) | $0 |
| 5-Person Families | 0 (0.0%) | $0 |
| 6-Person Families | 0 (0.0%) | $0 |
| 7+ Person Families | 0 (0.0%) | $0 |
| Total | 182 (100.0%) | $105,063 |
Family Income by Number of Earners in Cape Royale
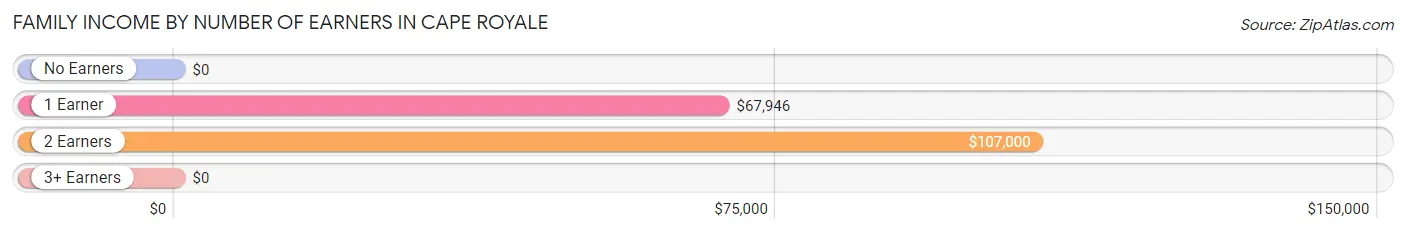
| Number of Earners | # Families | Median Income |
| No Earners | 47 (25.8%) | $0 |
| 1 Earner | 55 (30.2%) | $67,946 |
| 2 Earners | 80 (44.0%) | $107,000 |
| 3+ Earners | 0 (0.0%) | $0 |
| Total | 182 (100.0%) | $105,063 |
Household Income in Cape Royale
Household Income Brackets in Cape Royale
With 94 households falling in the category, the $100,000 to $149,999 income range is the most frequent in Cape Royale, accounting for 33.6% of all households.
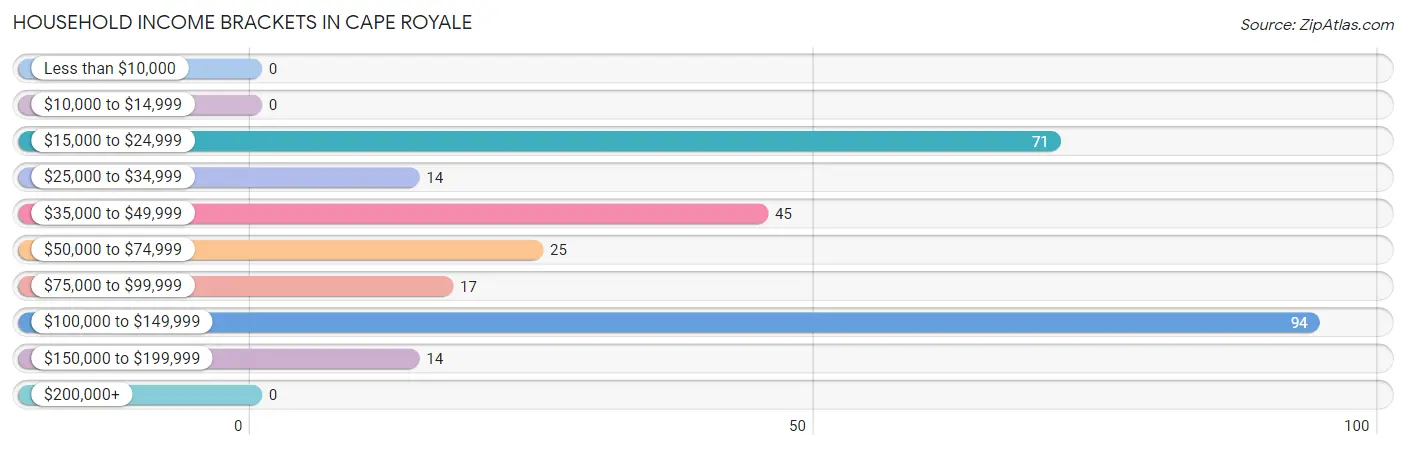
| Income Bracket | # Households | % Households |
| Less than $10,000 | 0 | 0.0% |
| $10,000 to $14,999 | 0 | 0.0% |
| $15,000 to $24,999 | 71 | 25.4% |
| $25,000 to $34,999 | 14 | 5.0% |
| $35,000 to $49,999 | 45 | 16.1% |
| $50,000 to $74,999 | 25 | 8.9% |
| $75,000 to $99,999 | 17 | 6.1% |
| $100,000 to $149,999 | 94 | 33.6% |
| $150,000 to $199,999 | 14 | 5.0% |
| $200,000+ | 0 | 0.0% |
Household Income by Householder Age in Cape Royale
The median household income in Cape Royale is $57,273, with the highest median household income of $75,625 found in the 65+ years age bracket for the primary householder. A total of 137 households (48.9%) fall into this category.
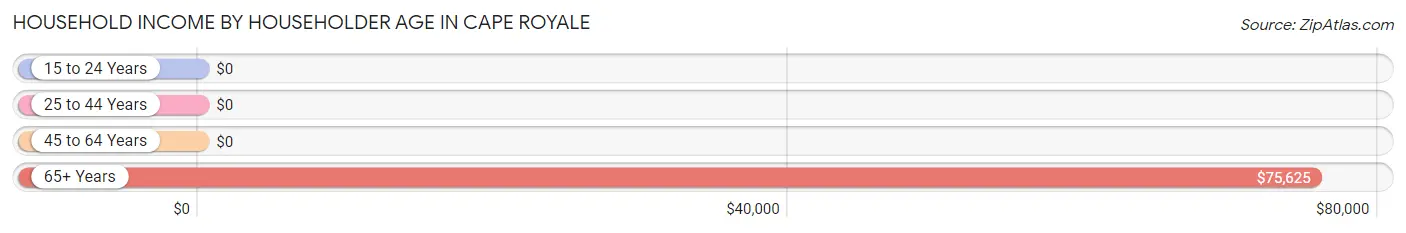
| Income Bracket | # Households | Median Income |
| 15 to 24 Years | 0 (0.0%) | $0 |
| 25 to 44 Years | 14 (5.0%) | $0 |
| 45 to 64 Years | 129 (46.1%) | $0 |
| 65+ Years | 137 (48.9%) | $75,625 |
| Total | 280 (100.0%) | $57,273 |
Poverty in Cape Royale
Income Below Poverty by Sex and Age in Cape Royale
| Age Bracket | Male | Female |
| Under 5 Years | 0 (0.0%) | 0 (0.0%) |
| 5 Years | 0 (0.0%) | 0 (0.0%) |
| 6 to 11 Years | 0 (0.0%) | 0 (0.0%) |
| 12 to 14 Years | 0 (0.0%) | 0 (0.0%) |
| 15 Years | 0 (0.0%) | 0 (0.0%) |
| 16 and 17 Years | 0 (0.0%) | 0 (0.0%) |
| 18 to 24 Years | 0 (0.0%) | 0 (0.0%) |
| 25 to 34 Years | 0 (0.0%) | 0 (0.0%) |
| 35 to 44 Years | 0 (0.0%) | 0 (0.0%) |
| 45 to 54 Years | 0 (0.0%) | 0 (0.0%) |
| 55 to 64 Years | 0 (0.0%) | 0 (0.0%) |
| 65 to 74 Years | 0 (0.0%) | 0 (0.0%) |
| 75 Years and over | 0 (0.0%) | 0 (0.0%) |
| Total | 0 (0.0%) | 0 (0.0%) |
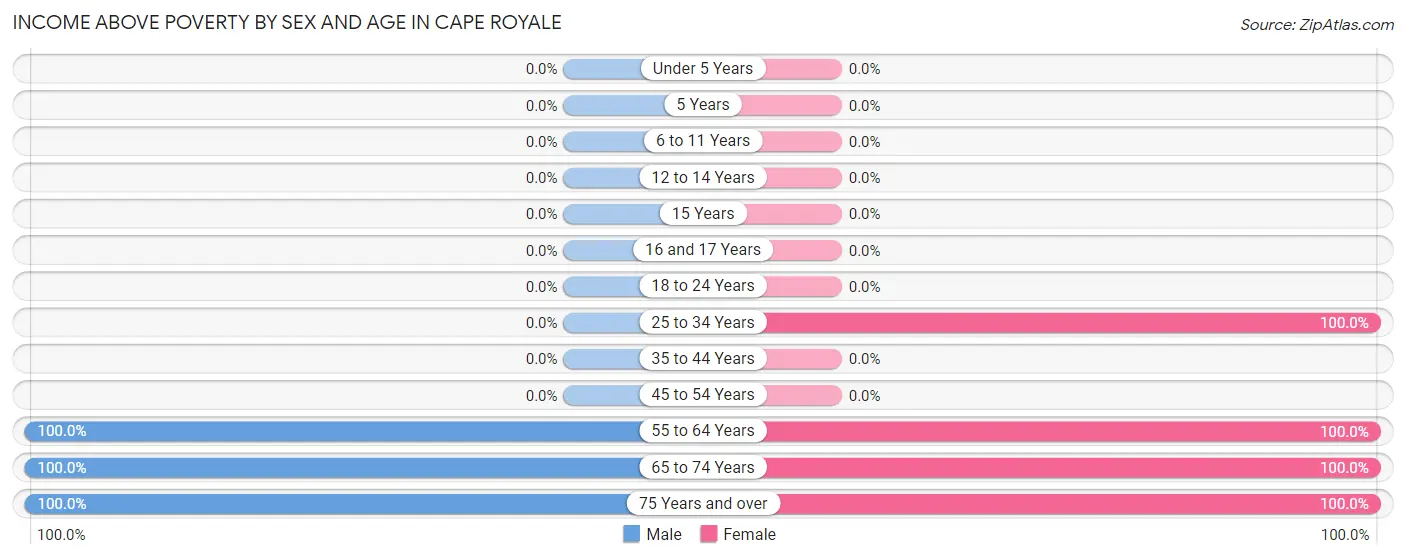
Income Above Poverty by Sex and Age in Cape Royale
According to the poverty statistics in Cape Royale, males aged 55 to 64 years and females aged 25 to 34 years are the age groups that are most secure financially, with 100.0% of males and 100.0% of females in these age groups living above the poverty line.
| Age Bracket | Male | Female |
| Under 5 Years | 0 (0.0%) | 0 (0.0%) |
| 5 Years | 0 (0.0%) | 0 (0.0%) |
| 6 to 11 Years | 0 (0.0%) | 0 (0.0%) |
| 12 to 14 Years | 0 (0.0%) | 0 (0.0%) |
| 15 Years | 0 (0.0%) | 0 (0.0%) |
| 16 and 17 Years | 0 (0.0%) | 0 (0.0%) |
| 18 to 24 Years | 0 (0.0%) | 0 (0.0%) |
| 25 to 34 Years | 0 (0.0%) | 28 (100.0%) |
| 35 to 44 Years | 0 (0.0%) | 0 (0.0%) |
| 45 to 54 Years | 0 (0.0%) | 0 (0.0%) |
| 55 to 64 Years | 107 (100.0%) | 130 (100.0%) |
| 65 to 74 Years | 51 (100.0%) | 102 (100.0%) |
| 75 Years and over | 40 (100.0%) | 11 (100.0%) |
| Total | 198 (100.0%) | 271 (100.0%) |
Income Below Poverty Among Married-Couple Families in Cape Royale
| Children | Above Poverty | Below Poverty |
| No Children | 182 (100.0%) | 0 (0.0%) |
| 1 or 2 Children | 0 (0.0%) | 0 (0.0%) |
| 3 or 4 Children | 0 (0.0%) | 0 (0.0%) |
| 5 or more Children | 0 (0.0%) | 0 (0.0%) |
| Total | 182 (100.0%) | 0 (0.0%) |
Income Below Poverty Among Single-Parent Households in Cape Royale
| Children | Single Father | Single Mother |
| No Children | 0 (0.0%) | 0 (0.0%) |
| 1 or 2 Children | 0 (0.0%) | 0 (0.0%) |
| 3 or 4 Children | 0 (0.0%) | 0 (0.0%) |
| 5 or more Children | 0 (0.0%) | 0 (0.0%) |
| Total | 0 (0.0%) | 0 (0.0%) |
Income Below Poverty Among Married-Couple vs Single-Parent Households in Cape Royale
| Children | Married-Couple Families | Single-Parent Households |
| No Children | 0 (0.0%) | 0 (0.0%) |
| 1 or 2 Children | 0 (0.0%) | 0 (0.0%) |
| 3 or 4 Children | 0 (0.0%) | 0 (0.0%) |
| 5 or more Children | 0 (0.0%) | 0 (0.0%) |
| Total | 0 (0.0%) | 0 (0.0%) |
Employment Characteristics in Cape Royale
Employment by Class of Employer in Cape Royale
Among the 192 employed individuals in Cape Royale, private company employees (165 | 85.9%), self-employed (incorporated) (16 | 8.3%), and local government employees (11 | 5.7%) make up the most common classes of employment.
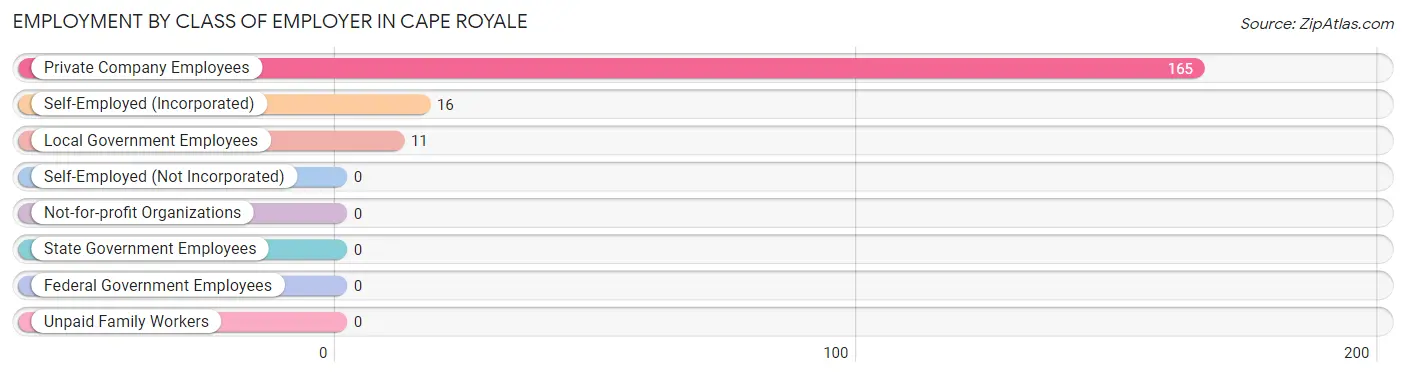
| Employer Class | # Employees | % Employees |
| Private Company Employees | 165 | 85.9% |
| Self-Employed (Incorporated) | 16 | 8.3% |
| Self-Employed (Not Incorporated) | 0 | 0.0% |
| Not-for-profit Organizations | 0 | 0.0% |
| Local Government Employees | 11 | 5.7% |
| State Government Employees | 0 | 0.0% |
| Federal Government Employees | 0 | 0.0% |
| Unpaid Family Workers | 0 | 0.0% |
| Total | 192 | 100.0% |
Employment Status by Age in Cape Royale
According to the labor force statistics for Cape Royale, out of the total population over 16 years of age (469), 56.9% or 267 individuals are in the labor force, with 21.3% or 57 of them unemployed. The age group with the highest labor force participation rate is 25 to 29 years, with 100.0% or 14 individuals in the labor force. Within the labor force, the 60 to 64 years age range has the highest percentage of unemployed individuals, with 41.7% or 43 of them being unemployed.
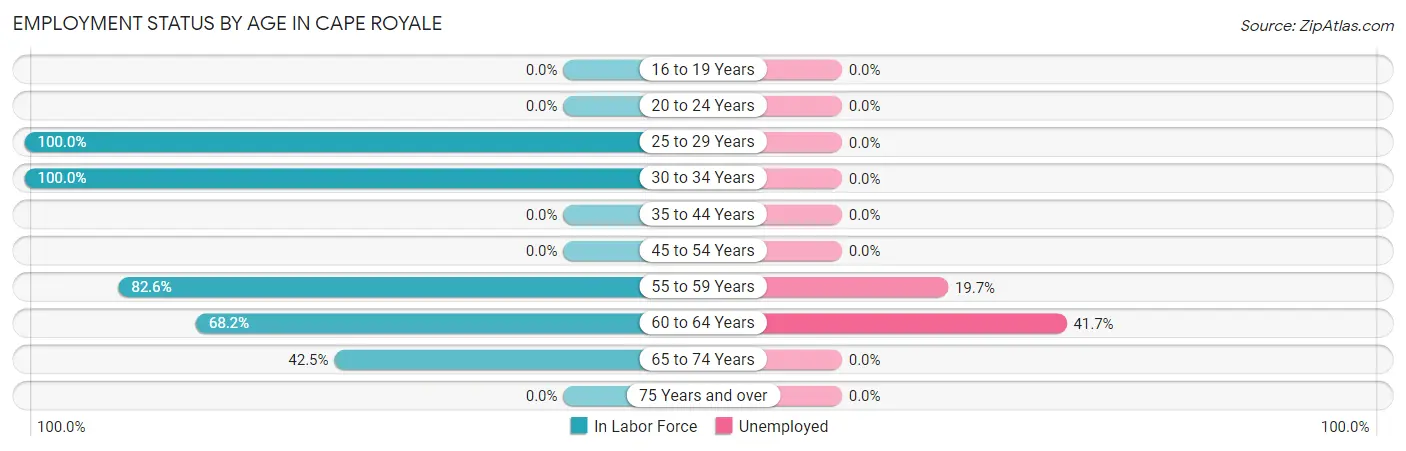
| Age Bracket | In Labor Force | Unemployed |
| 16 to 19 Years | 0 (0.0%) | 0 (0.0%) |
| 20 to 24 Years | 0 (0.0%) | 0 (0.0%) |
| 25 to 29 Years | 14 (100.0%) | 0 (0.0%) |
| 30 to 34 Years | 14 (100.0%) | 0 (0.0%) |
| 35 to 44 Years | 0 (0.0%) | 0 (0.0%) |
| 45 to 54 Years | 0 (0.0%) | 0 (0.0%) |
| 55 to 59 Years | 71 (82.6%) | 14 (19.7%) |
| 60 to 64 Years | 103 (68.2%) | 43 (41.7%) |
| 65 to 74 Years | 65 (42.5%) | 0 (0.0%) |
| 75 Years and over | 0 (0.0%) | 0 (0.0%) |
| Total | 267 (56.9%) | 57 (21.3%) |
Employment Status by Educational Attainment in Cape Royale
According to labor force statistics for Cape Royale, 76.2% of individuals (202) out of the total population between 25 and 64 years of age (265) are in the labor force, with 28.2% or 57 of them being unemployed. The group with the highest labor force participation rate are those with the educational attainment of bachelor's degree or higher, with 91.2% or 62 individuals in the labor force. Within the labor force, individuals with high school diploma education have the highest percentage of unemployment, with 100.0% or 43 of them being unemployed.
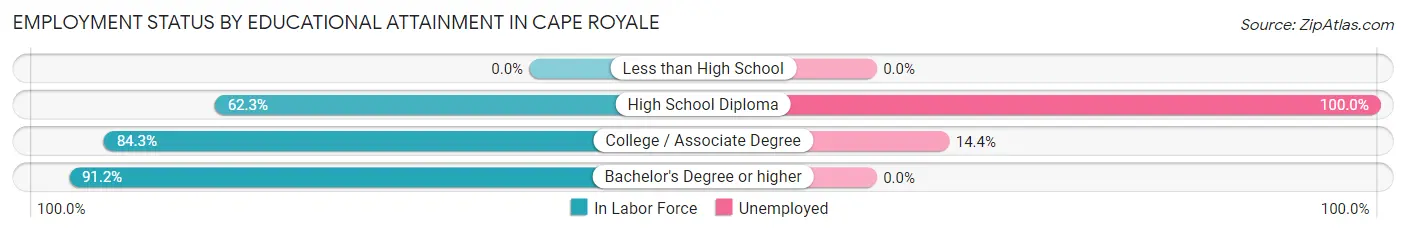
| Educational Attainment | In Labor Force | Unemployed |
| Less than High School | 0 (0.0%) | 0 (0.0%) |
| High School Diploma | 43 (62.3%) | 69 (100.0%) |
| College / Associate Degree | 97 (84.3%) | 17 (14.4%) |
| Bachelor's Degree or higher | 62 (91.2%) | 0 (0.0%) |
| Total | 202 (76.2%) | 75 (28.2%) |
Employment Occupations by Sex in Cape Royale
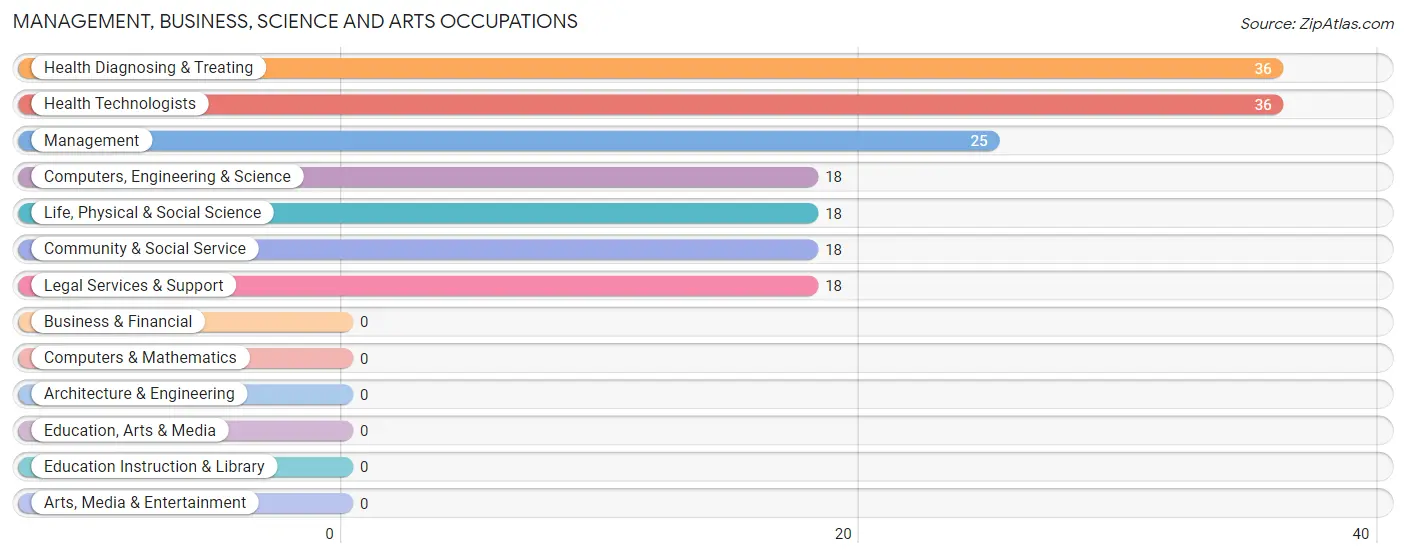
Management, Business, Science and Arts Occupations
The most common Management, Business, Science and Arts occupations in Cape Royale are Health Diagnosing & Treating (36 | 17.1%), Health Technologists (36 | 17.1%), Management (25 | 11.9%), Computers, Engineering & Science (18 | 8.6%), and Life, Physical & Social Science (18 | 8.6%).
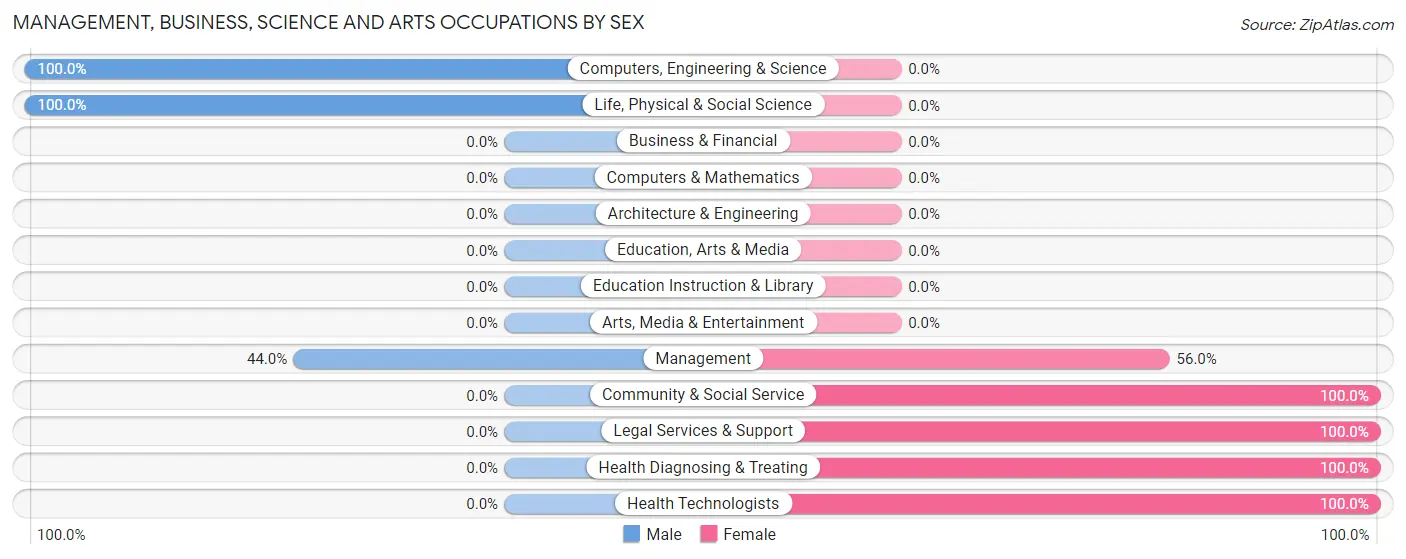
Management, Business, Science and Arts Occupations by Sex
Within the Management, Business, Science and Arts occupations in Cape Royale, the most male-oriented occupations are Computers, Engineering & Science (100.0%), Life, Physical & Social Science (100.0%), and Management (44.0%), while the most female-oriented occupations are Community & Social Service (100.0%), Legal Services & Support (100.0%), and Health Diagnosing & Treating (100.0%).
| Occupation | Male | Female |
| Management | 11 (44.0%) | 14 (56.0%) |
| Business & Financial | 0 (0.0%) | 0 (0.0%) |
| Computers, Engineering & Science | 18 (100.0%) | 0 (0.0%) |
| Computers & Mathematics | 0 (0.0%) | 0 (0.0%) |
| Architecture & Engineering | 0 (0.0%) | 0 (0.0%) |
| Life, Physical & Social Science | 18 (100.0%) | 0 (0.0%) |
| Community & Social Service | 0 (0.0%) | 18 (100.0%) |
| Education, Arts & Media | 0 (0.0%) | 0 (0.0%) |
| Legal Services & Support | 0 (0.0%) | 18 (100.0%) |
| Education Instruction & Library | 0 (0.0%) | 0 (0.0%) |
| Arts, Media & Entertainment | 0 (0.0%) | 0 (0.0%) |
| Health Diagnosing & Treating | 0 (0.0%) | 36 (100.0%) |
| Health Technologists | 0 (0.0%) | 36 (100.0%) |
| Total (Category) | 29 (29.9%) | 68 (70.1%) |
| Total (Overall) | 86 (40.9%) | 124 (59.1%) |
Services Occupations
Services Occupations by Sex
| Occupation | Male | Female |
| Healthcare Support | 0 (0.0%) | 0 (0.0%) |
| Security & Protection | 0 (0.0%) | 0 (0.0%) |
| Firefighting & Prevention | 0 (0.0%) | 0 (0.0%) |
| Law Enforcement | 0 (0.0%) | 0 (0.0%) |
| Food Preparation & Serving | 0 (0.0%) | 0 (0.0%) |
| Cleaning & Maintenance | 0 (0.0%) | 0 (0.0%) |
| Personal Care & Service | 0 (0.0%) | 0 (0.0%) |
| Total (Category) | 0 (0.0%) | 0 (0.0%) |
| Total (Overall) | 86 (40.9%) | 124 (59.1%) |
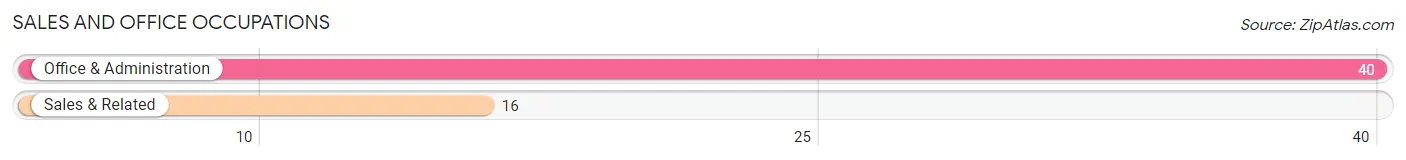
Sales and Office Occupations
The most common Sales and Office occupations in Cape Royale are Office & Administration (40 | 19.1%), and Sales & Related (16 | 7.6%).
Sales and Office Occupations by Sex
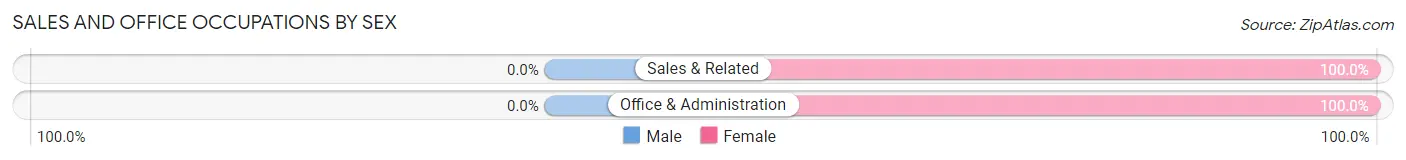
| Occupation | Male | Female |
| Sales & Related | 0 (0.0%) | 16 (100.0%) |
| Office & Administration | 0 (0.0%) | 40 (100.0%) |
| Total (Category) | 0 (0.0%) | 56 (100.0%) |
| Total (Overall) | 86 (40.9%) | 124 (59.1%) |
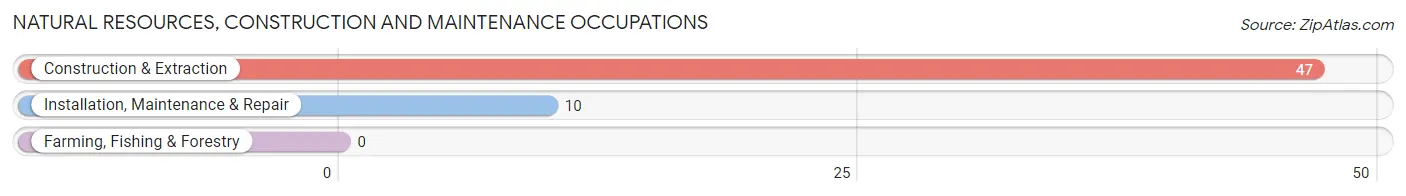
Natural Resources, Construction and Maintenance Occupations
The most common Natural Resources, Construction and Maintenance occupations in Cape Royale are Construction & Extraction (47 | 22.4%), and Installation, Maintenance & Repair (10 | 4.8%).
Natural Resources, Construction and Maintenance Occupations by Sex
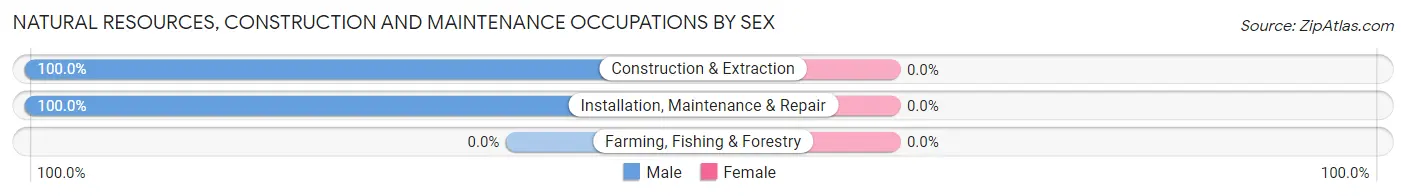
| Occupation | Male | Female |
| Farming, Fishing & Forestry | 0 (0.0%) | 0 (0.0%) |
| Construction & Extraction | 47 (100.0%) | 0 (0.0%) |
| Installation, Maintenance & Repair | 10 (100.0%) | 0 (0.0%) |
| Total (Category) | 57 (100.0%) | 0 (0.0%) |
| Total (Overall) | 86 (40.9%) | 124 (59.1%) |
Production, Transportation and Moving Occupations
Production, Transportation and Moving Occupations by Sex
| Occupation | Male | Female |
| Production | 0 (0.0%) | 0 (0.0%) |
| Transportation | 0 (0.0%) | 0 (0.0%) |
| Material Moving | 0 (0.0%) | 0 (0.0%) |
| Total (Category) | 0 (0.0%) | 0 (0.0%) |
| Total (Overall) | 86 (40.9%) | 124 (59.1%) |
Employment Industries by Sex in Cape Royale
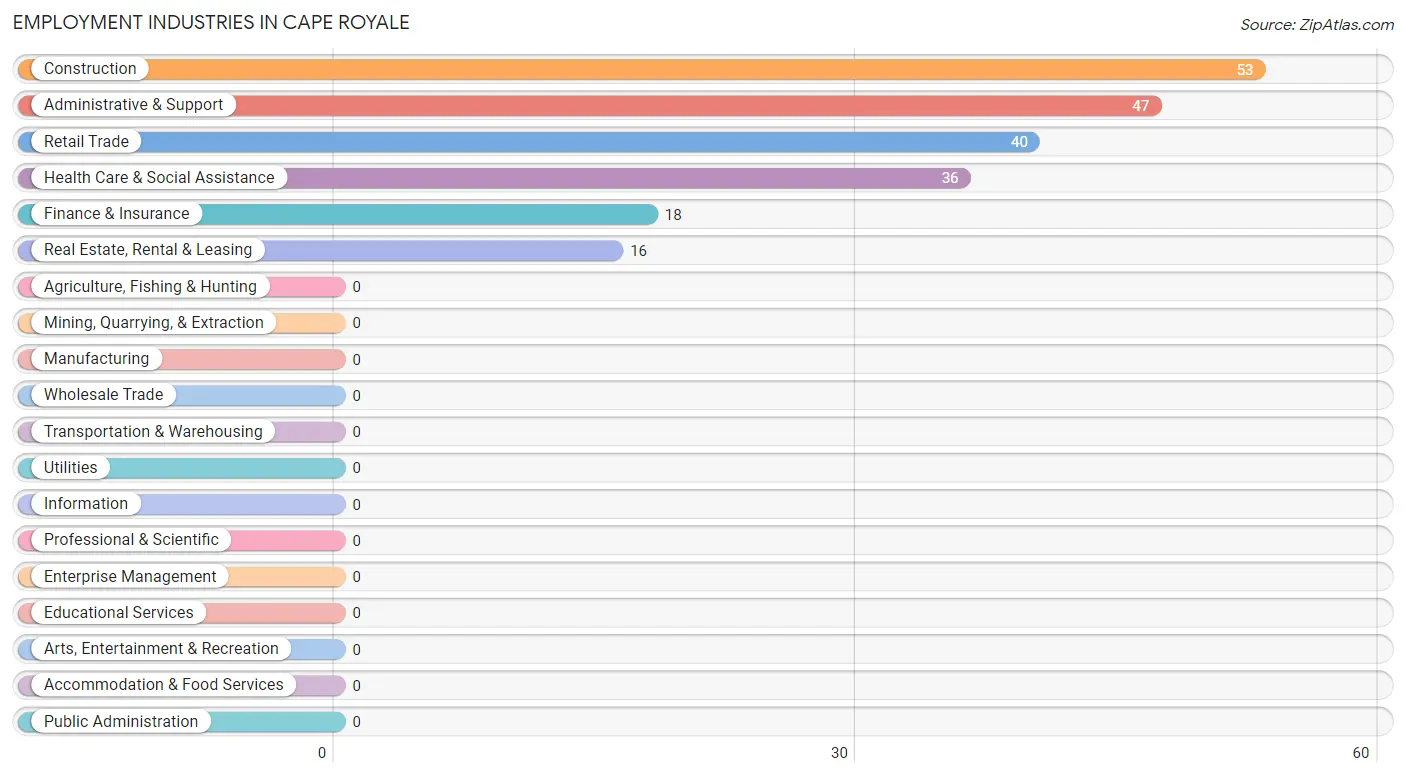
Employment Industries in Cape Royale
The major employment industries in Cape Royale include Construction (53 | 25.2%), Administrative & Support (47 | 22.4%), Retail Trade (40 | 19.1%), Health Care & Social Assistance (36 | 17.1%), and Finance & Insurance (18 | 8.6%).
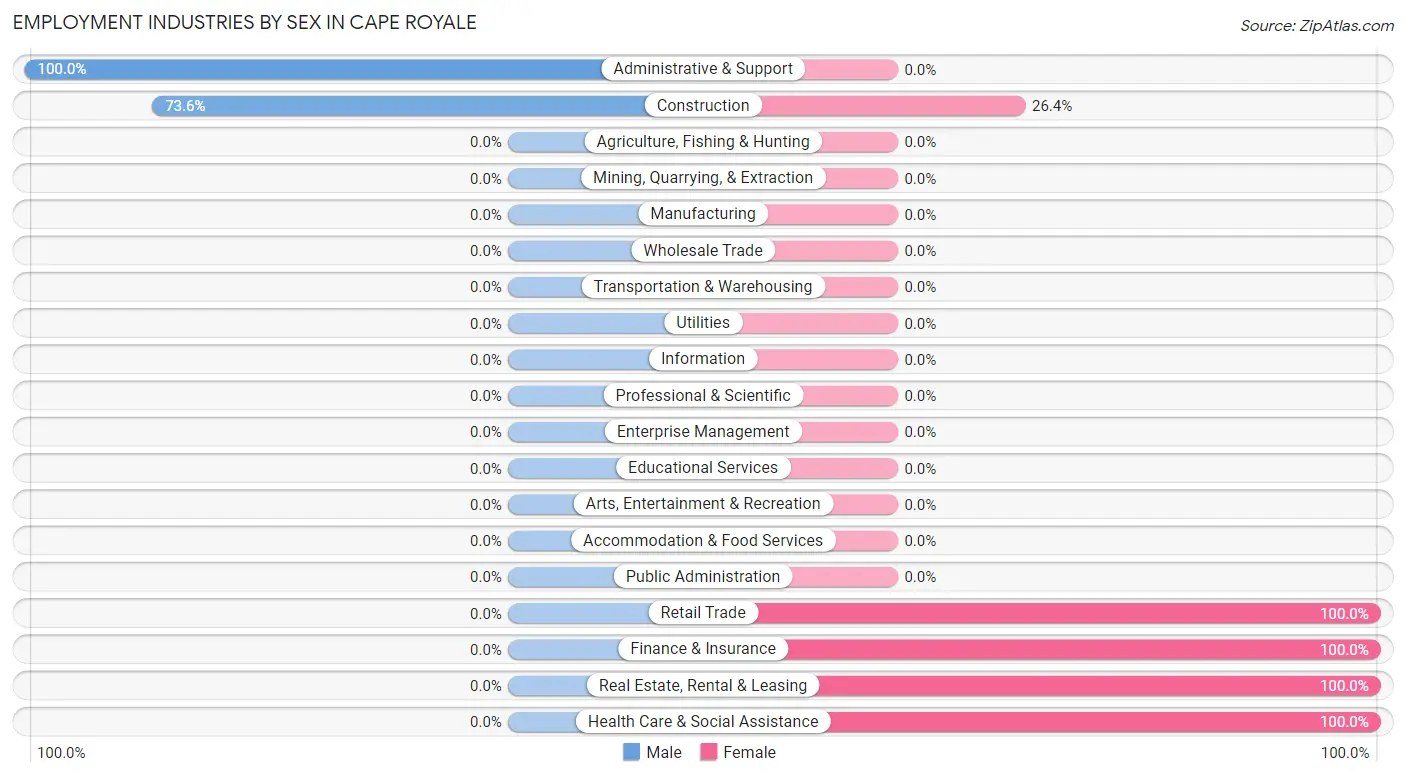
Employment Industries by Sex in Cape Royale
The Cape Royale industries that see more men than women are Administrative & Support (100.0%), and Construction (73.6%), whereas the industries that tend to have a higher number of women are Retail Trade (100.0%), Finance & Insurance (100.0%), and Real Estate, Rental & Leasing (100.0%).
| Industry | Male | Female |
| Agriculture, Fishing & Hunting | 0 (0.0%) | 0 (0.0%) |
| Mining, Quarrying, & Extraction | 0 (0.0%) | 0 (0.0%) |
| Construction | 39 (73.6%) | 14 (26.4%) |
| Manufacturing | 0 (0.0%) | 0 (0.0%) |
| Wholesale Trade | 0 (0.0%) | 0 (0.0%) |
| Retail Trade | 0 (0.0%) | 40 (100.0%) |
| Transportation & Warehousing | 0 (0.0%) | 0 (0.0%) |
| Utilities | 0 (0.0%) | 0 (0.0%) |
| Information | 0 (0.0%) | 0 (0.0%) |
| Finance & Insurance | 0 (0.0%) | 18 (100.0%) |
| Real Estate, Rental & Leasing | 0 (0.0%) | 16 (100.0%) |
| Professional & Scientific | 0 (0.0%) | 0 (0.0%) |
| Enterprise Management | 0 (0.0%) | 0 (0.0%) |
| Administrative & Support | 47 (100.0%) | 0 (0.0%) |
| Educational Services | 0 (0.0%) | 0 (0.0%) |
| Health Care & Social Assistance | 0 (0.0%) | 36 (100.0%) |
| Arts, Entertainment & Recreation | 0 (0.0%) | 0 (0.0%) |
| Accommodation & Food Services | 0 (0.0%) | 0 (0.0%) |
| Public Administration | 0 (0.0%) | 0 (0.0%) |
| Total | 86 (40.9%) | 124 (59.1%) |
Education in Cape Royale
School Enrollment in Cape Royale
| School Level | # Students | % Students |
| Nursery / Preschool | 0 | 0.0% |
| Kindergarten | 0 | 0.0% |
| Elementary School | 0 | 0.0% |
| Middle School | 0 | 0.0% |
| High School | 0 | 0.0% |
| College / Undergraduate | 0 | 0.0% |
| Graduate / Professional | 0 | 0.0% |
| Total | 0 | 0.0% |
School Enrollment by Age by Funding Source in Cape Royale
| Age Bracket | Public School | Private School |
| 3 to 4 Year Olds | 0 (0.0%) | 0 (0.0%) |
| 5 to 9 Year Old | 0 (0.0%) | 0 (0.0%) |
| 10 to 14 Year Olds | 0 (0.0%) | 0 (0.0%) |
| 15 to 17 Year Olds | 0 (0.0%) | 0 (0.0%) |
| 18 to 19 Year Olds | 0 (0.0%) | 0 (0.0%) |
| 20 to 24 Year Olds | 0 (0.0%) | 0 (0.0%) |
| 25 to 34 Year Olds | 0 (0.0%) | 0 (0.0%) |
| 35 Years and over | 0 (0.0%) | 0 (0.0%) |
| Total | 0 (0.0%) | 0 (0.0%) |
Educational Attainment by Field of Study in Cape Royale
Science & technology (38 | 48.7%), bio, nature & agricultural (18 | 23.1%), communications (16 | 20.5%), and business (6 | 7.7%) are the most common fields of study among 78 individuals in Cape Royale who have obtained a bachelor's degree or higher.
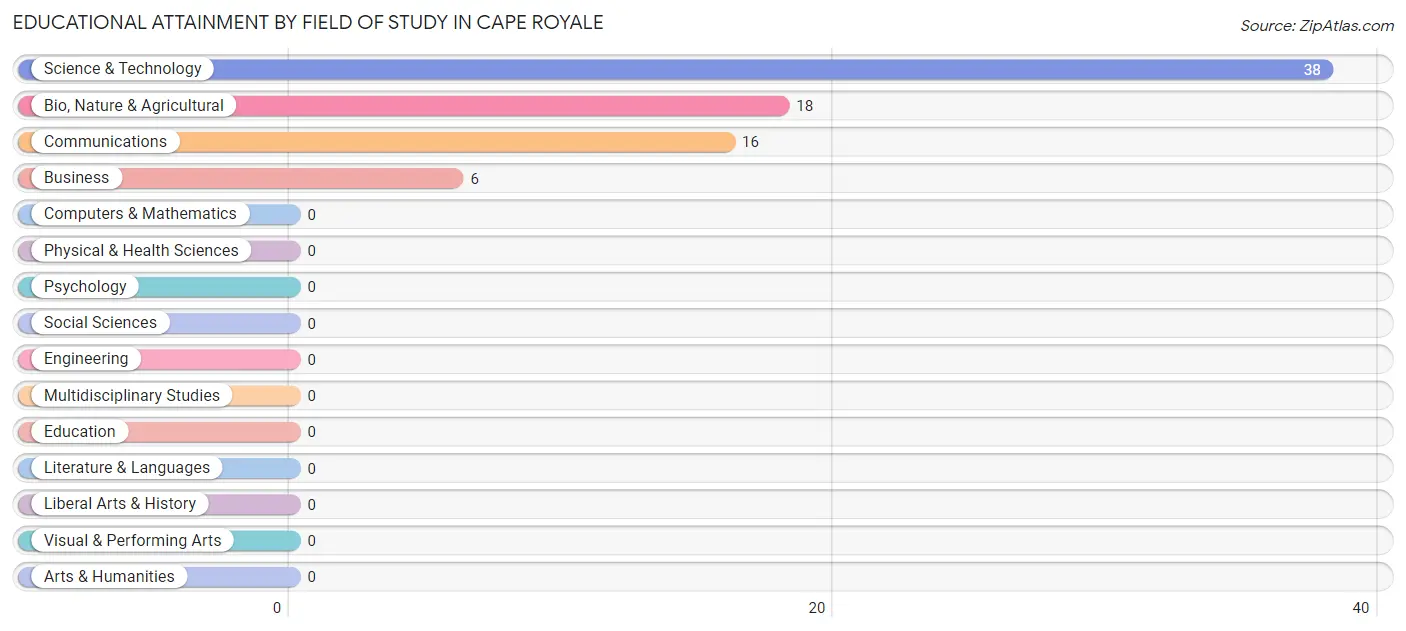
| Field of Study | # Graduates | % Graduates |
| Computers & Mathematics | 0 | 0.0% |
| Bio, Nature & Agricultural | 18 | 23.1% |
| Physical & Health Sciences | 0 | 0.0% |
| Psychology | 0 | 0.0% |
| Social Sciences | 0 | 0.0% |
| Engineering | 0 | 0.0% |
| Multidisciplinary Studies | 0 | 0.0% |
| Science & Technology | 38 | 48.7% |
| Business | 6 | 7.7% |
| Education | 0 | 0.0% |
| Literature & Languages | 0 | 0.0% |
| Liberal Arts & History | 0 | 0.0% |
| Visual & Performing Arts | 0 | 0.0% |
| Communications | 16 | 20.5% |
| Arts & Humanities | 0 | 0.0% |
| Total | 78 | 100.0% |
Transportation & Commute in Cape Royale
Vehicle Availability by Sex in Cape Royale
The most prevalent vehicle ownership categories in Cape Royale are males with 2 vehicles (86, accounting for 100.0%) and females with 2 vehicles (90, making up 81.1%).
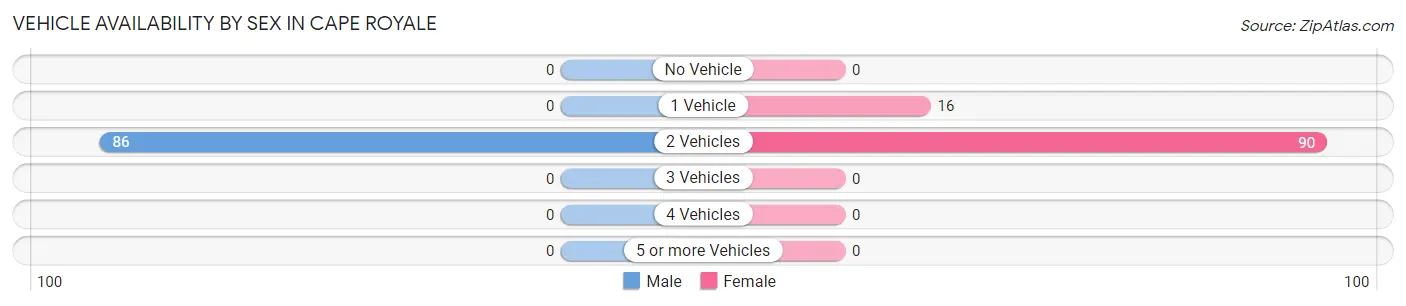
| Vehicles Available | Male | Female |
| No Vehicle | 0 (0.0%) | 0 (0.0%) |
| 1 Vehicle | 0 (0.0%) | 16 (15.1%) |
| 2 Vehicles | 86 (100.0%) | 90 (84.9%) |
| 3 Vehicles | 0 (0.0%) | 0 (0.0%) |
| 4 Vehicles | 0 (0.0%) | 0 (0.0%) |
| 5 or more Vehicles | 0 (0.0%) | 0 (0.0%) |
| Total | 86 (100.0%) | 106 (100.0%) |
Commute Time in Cape Royale
The most frequently occuring commute durations in Cape Royale are 60 to 89 minutes (72 commuters, 37.5%), 90 or more minutes (47 commuters, 24.5%), and 20 to 24 minutes (25 commuters, 13.0%).
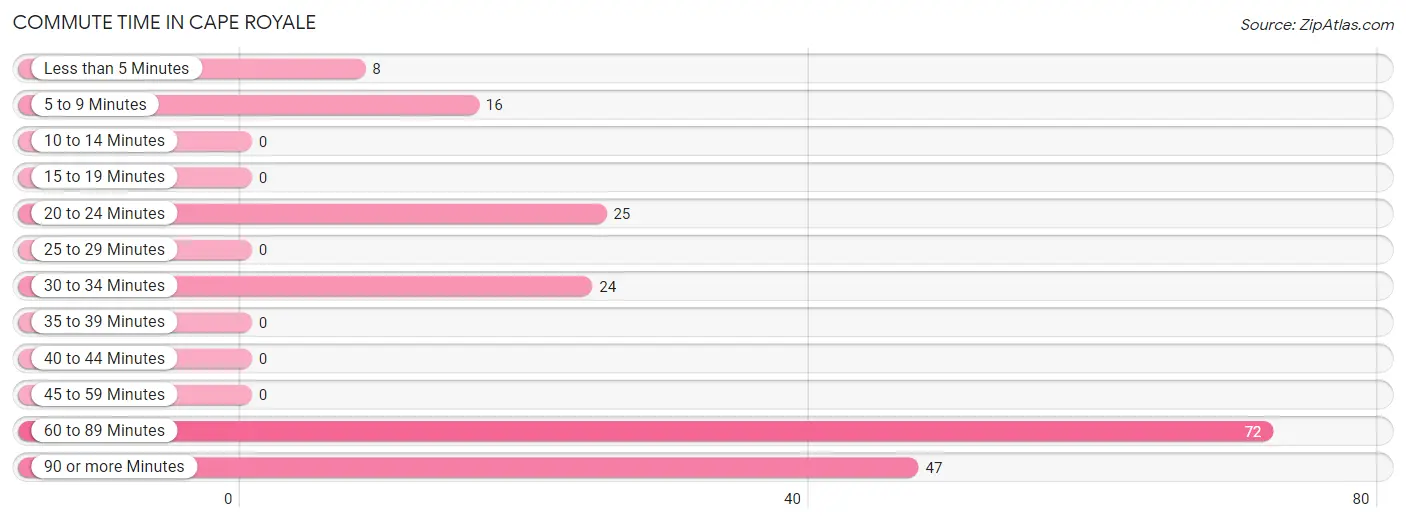
| Commute Time | # Commuters | % Commuters |
| Less than 5 Minutes | 8 | 4.2% |
| 5 to 9 Minutes | 16 | 8.3% |
| 10 to 14 Minutes | 0 | 0.0% |
| 15 to 19 Minutes | 0 | 0.0% |
| 20 to 24 Minutes | 25 | 13.0% |
| 25 to 29 Minutes | 0 | 0.0% |
| 30 to 34 Minutes | 24 | 12.5% |
| 35 to 39 Minutes | 0 | 0.0% |
| 40 to 44 Minutes | 0 | 0.0% |
| 45 to 59 Minutes | 0 | 0.0% |
| 60 to 89 Minutes | 72 | 37.5% |
| 90 or more Minutes | 47 | 24.5% |
Commute Time by Sex in Cape Royale
The most common commute times in Cape Royale are 90 or more minutes (47 commuters, 54.6%) for males and 60 to 89 minutes (54 commuters, 50.9%) for females.
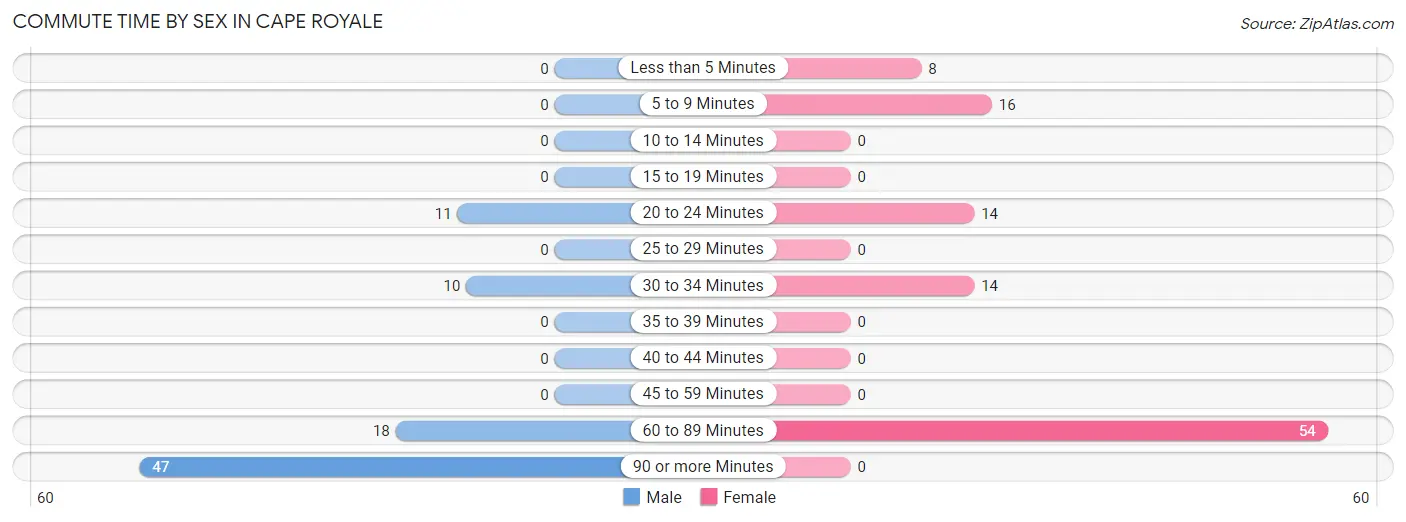
| Commute Time | Male | Female |
| Less than 5 Minutes | 0 (0.0%) | 8 (7.5%) |
| 5 to 9 Minutes | 0 (0.0%) | 16 (15.1%) |
| 10 to 14 Minutes | 0 (0.0%) | 0 (0.0%) |
| 15 to 19 Minutes | 0 (0.0%) | 0 (0.0%) |
| 20 to 24 Minutes | 11 (12.8%) | 14 (13.2%) |
| 25 to 29 Minutes | 0 (0.0%) | 0 (0.0%) |
| 30 to 34 Minutes | 10 (11.6%) | 14 (13.2%) |
| 35 to 39 Minutes | 0 (0.0%) | 0 (0.0%) |
| 40 to 44 Minutes | 0 (0.0%) | 0 (0.0%) |
| 45 to 59 Minutes | 0 (0.0%) | 0 (0.0%) |
| 60 to 89 Minutes | 18 (20.9%) | 54 (50.9%) |
| 90 or more Minutes | 47 (54.6%) | 0 (0.0%) |
Time of Departure to Work by Sex in Cape Royale
The most frequent times of departure to work in Cape Royale are 5:00 AM to 5:29 AM (47, 54.6%) for males and 8:30 AM to 8:59 AM (40, 37.7%) for females.
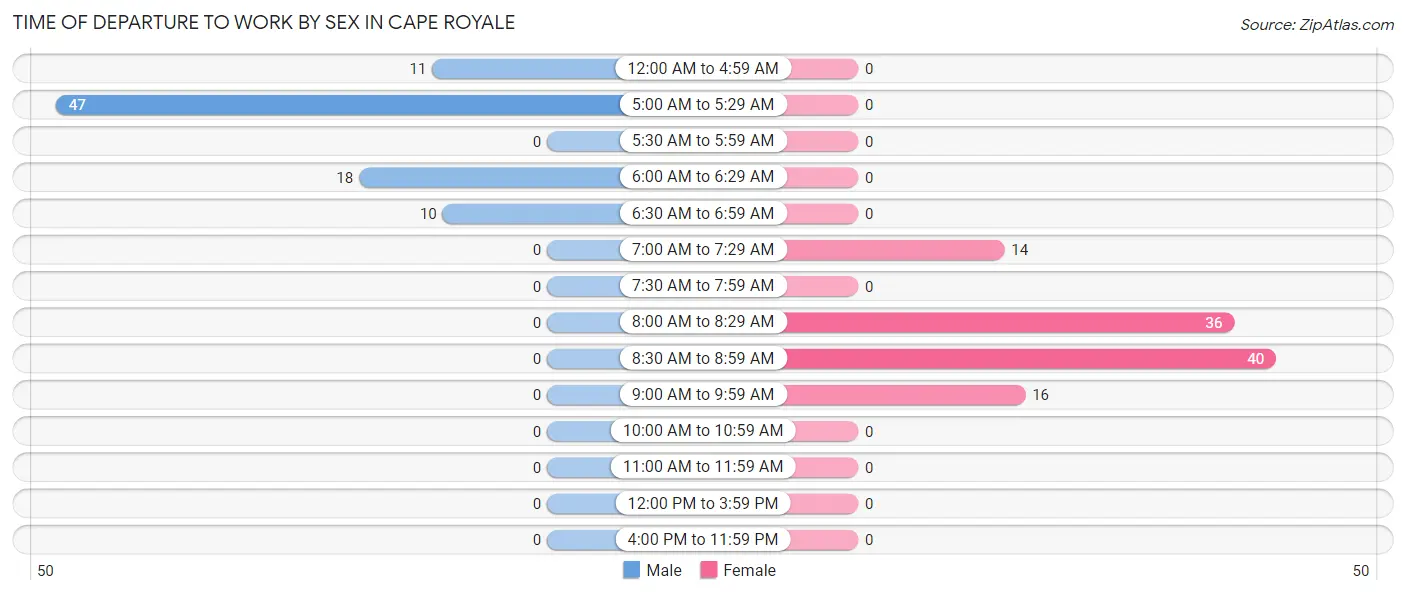
| Time of Departure | Male | Female |
| 12:00 AM to 4:59 AM | 11 (12.8%) | 0 (0.0%) |
| 5:00 AM to 5:29 AM | 47 (54.6%) | 0 (0.0%) |
| 5:30 AM to 5:59 AM | 0 (0.0%) | 0 (0.0%) |
| 6:00 AM to 6:29 AM | 18 (20.9%) | 0 (0.0%) |
| 6:30 AM to 6:59 AM | 10 (11.6%) | 0 (0.0%) |
| 7:00 AM to 7:29 AM | 0 (0.0%) | 14 (13.2%) |
| 7:30 AM to 7:59 AM | 0 (0.0%) | 0 (0.0%) |
| 8:00 AM to 8:29 AM | 0 (0.0%) | 36 (34.0%) |
| 8:30 AM to 8:59 AM | 0 (0.0%) | 40 (37.7%) |
| 9:00 AM to 9:59 AM | 0 (0.0%) | 16 (15.1%) |
| 10:00 AM to 10:59 AM | 0 (0.0%) | 0 (0.0%) |
| 11:00 AM to 11:59 AM | 0 (0.0%) | 0 (0.0%) |
| 12:00 PM to 3:59 PM | 0 (0.0%) | 0 (0.0%) |
| 4:00 PM to 11:59 PM | 0 (0.0%) | 0 (0.0%) |
| Total | 86 (100.0%) | 106 (100.0%) |
Housing Occupancy in Cape Royale
Occupancy by Ownership in Cape Royale
Of the total 280 dwellings in Cape Royale, owner-occupied units account for 223 (79.6%), while renter-occupied units make up 57 (20.4%).
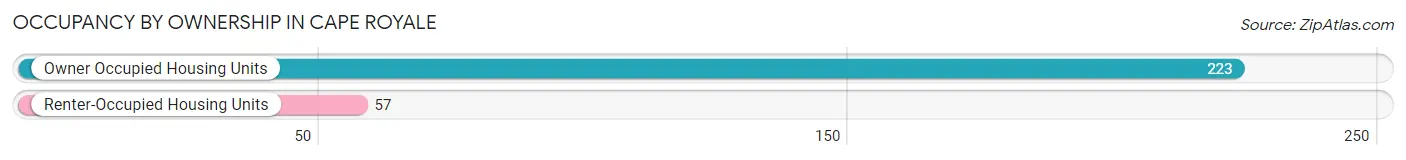
| Occupancy | # Housing Units | % Housing Units |
| Owner Occupied Housing Units | 223 | 79.6% |
| Renter-Occupied Housing Units | 57 | 20.4% |
| Total Occupied Housing Units | 280 | 100.0% |
Occupancy by Household Size in Cape Royale
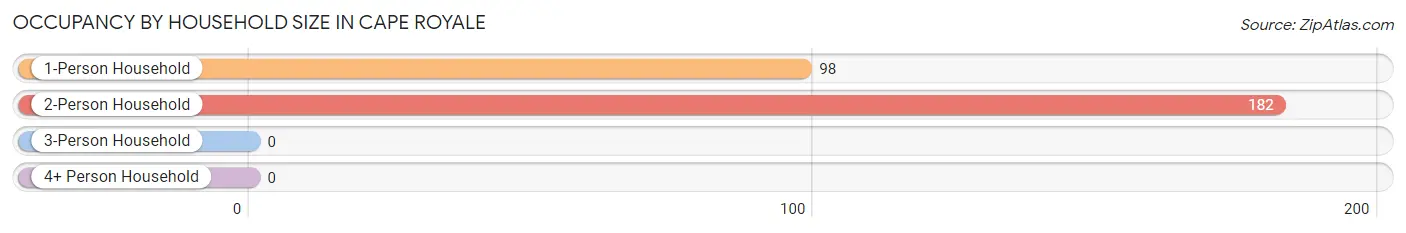
| Household Size | # Housing Units | % Housing Units |
| 1-Person Household | 98 | 35.0% |
| 2-Person Household | 182 | 65.0% |
| 3-Person Household | 0 | 0.0% |
| 4+ Person Household | 0 | 0.0% |
| Total Housing Units | 280 | 100.0% |
Occupancy by Ownership by Household Size in Cape Royale
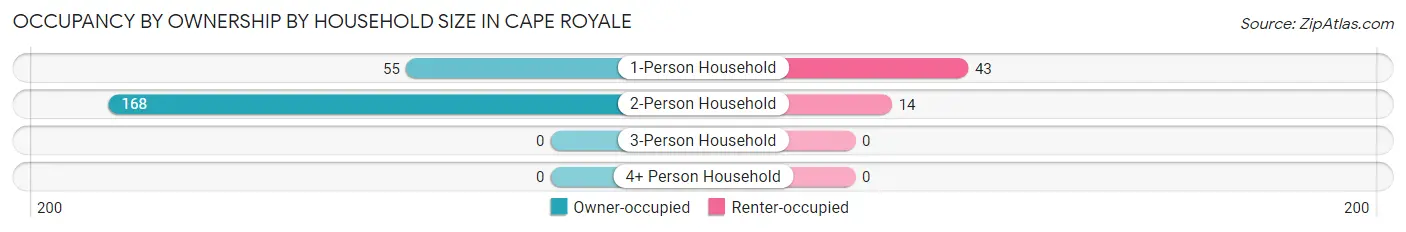
| Household Size | Owner-occupied | Renter-occupied |
| 1-Person Household | 55 (56.1%) | 43 (43.9%) |
| 2-Person Household | 168 (92.3%) | 14 (7.7%) |
| 3-Person Household | 0 (0.0%) | 0 (0.0%) |
| 4+ Person Household | 0 (0.0%) | 0 (0.0%) |
| Total Housing Units | 223 (79.6%) | 57 (20.4%) |
Occupancy by Educational Attainment in Cape Royale
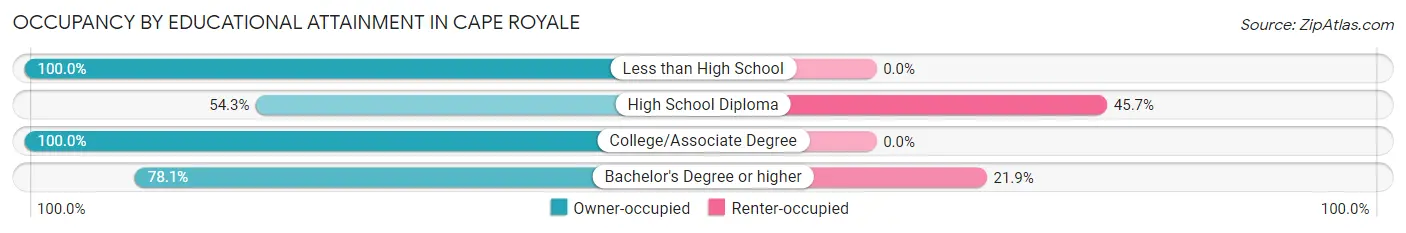
| Household Size | Owner-occupied | Renter-occupied |
| Less than High School | 41 (100.0%) | 0 (0.0%) |
| High School Diploma | 51 (54.3%) | 43 (45.7%) |
| College/Associate Degree | 81 (100.0%) | 0 (0.0%) |
| Bachelor's Degree or higher | 50 (78.1%) | 14 (21.9%) |
Occupancy by Age of Householder in Cape Royale
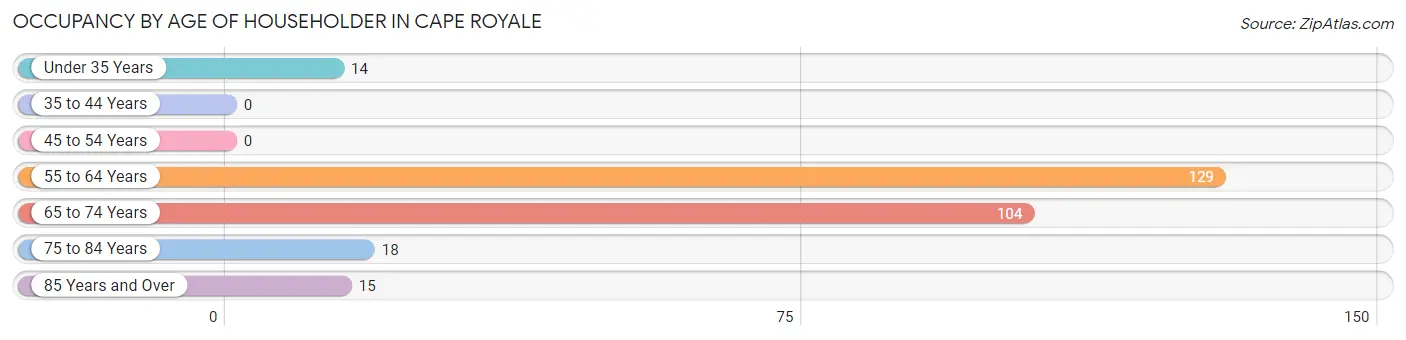
| Age Bracket | # Households | % Households |
| Under 35 Years | 14 | 5.0% |
| 35 to 44 Years | 0 | 0.0% |
| 45 to 54 Years | 0 | 0.0% |
| 55 to 64 Years | 129 | 46.1% |
| 65 to 74 Years | 104 | 37.1% |
| 75 to 84 Years | 18 | 6.4% |
| 85 Years and Over | 15 | 5.4% |
| Total | 280 | 100.0% |
Housing Finances in Cape Royale
Median Income by Occupancy in Cape Royale
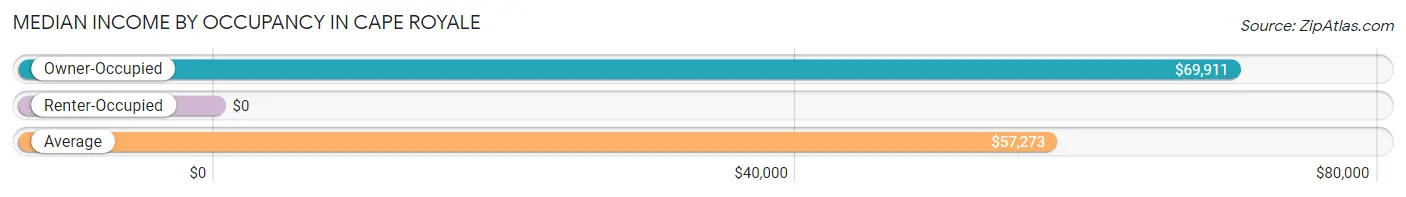
| Occupancy Type | # Households | Median Income |
| Owner-Occupied | 223 (79.6%) | $69,911 |
| Renter-Occupied | 57 (20.4%) | $0 |
| Average | 280 (100.0%) | $57,273 |
Occupancy by Householder Income Bracket in Cape Royale
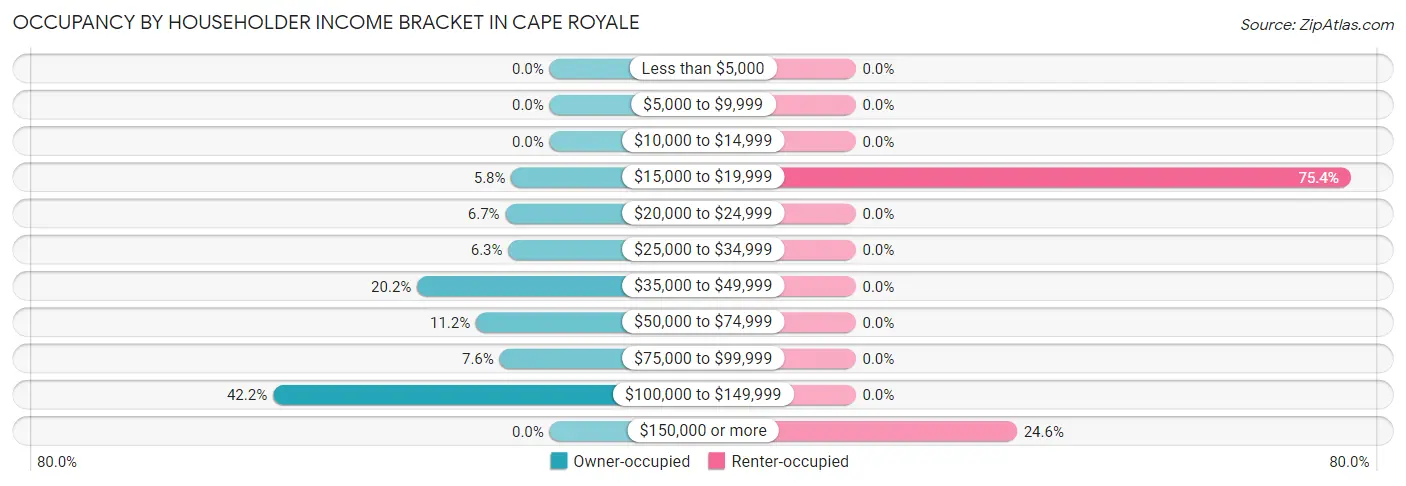
| Income Bracket | Owner-occupied | Renter-occupied |
| Less than $5,000 | 0 (0.0%) | 0 (0.0%) |
| $5,000 to $9,999 | 0 (0.0%) | 0 (0.0%) |
| $10,000 to $14,999 | 0 (0.0%) | 0 (0.0%) |
| $15,000 to $19,999 | 13 (5.8%) | 43 (75.4%) |
| $20,000 to $24,999 | 15 (6.7%) | 0 (0.0%) |
| $25,000 to $34,999 | 14 (6.3%) | 0 (0.0%) |
| $35,000 to $49,999 | 45 (20.2%) | 0 (0.0%) |
| $50,000 to $74,999 | 25 (11.2%) | 0 (0.0%) |
| $75,000 to $99,999 | 17 (7.6%) | 0 (0.0%) |
| $100,000 to $149,999 | 94 (42.1%) | 0 (0.0%) |
| $150,000 or more | 0 (0.0%) | 14 (24.6%) |
| Total | 223 (100.0%) | 57 (100.0%) |
Monthly Housing Cost Tiers in Cape Royale
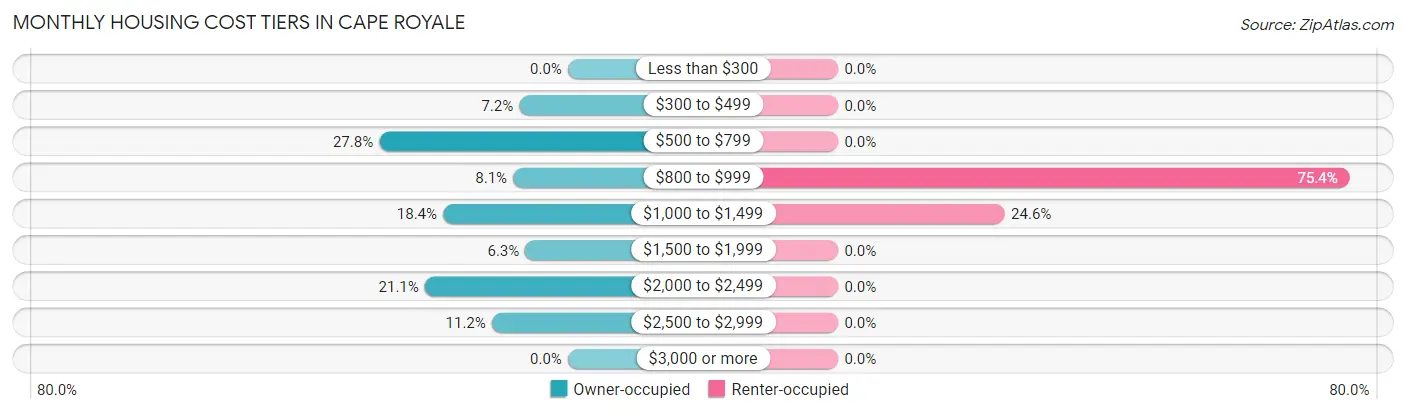
| Monthly Cost | Owner-occupied | Renter-occupied |
| Less than $300 | 0 (0.0%) | 0 (0.0%) |
| $300 to $499 | 16 (7.2%) | 0 (0.0%) |
| $500 to $799 | 62 (27.8%) | 0 (0.0%) |
| $800 to $999 | 18 (8.1%) | 43 (75.4%) |
| $1,000 to $1,499 | 41 (18.4%) | 14 (24.6%) |
| $1,500 to $1,999 | 14 (6.3%) | 0 (0.0%) |
| $2,000 to $2,499 | 47 (21.1%) | 0 (0.0%) |
| $2,500 to $2,999 | 25 (11.2%) | 0 (0.0%) |
| $3,000 or more | 0 (0.0%) | 0 (0.0%) |
| Total | 223 (100.0%) | 57 (100.0%) |
Physical Housing Characteristics in Cape Royale
Housing Structures in Cape Royale
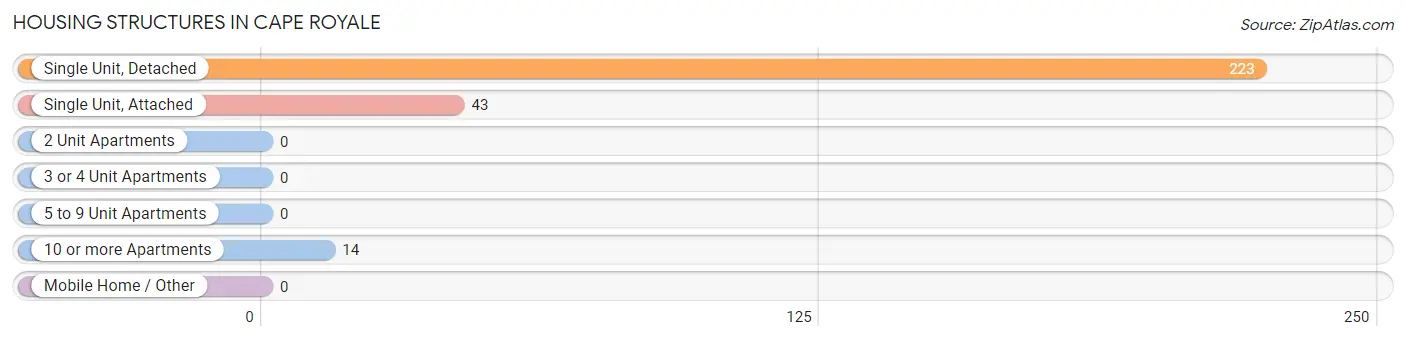
| Structure Type | # Housing Units | % Housing Units |
| Single Unit, Detached | 223 | 79.6% |
| Single Unit, Attached | 43 | 15.4% |
| 2 Unit Apartments | 0 | 0.0% |
| 3 or 4 Unit Apartments | 0 | 0.0% |
| 5 to 9 Unit Apartments | 0 | 0.0% |
| 10 or more Apartments | 14 | 5.0% |
| Mobile Home / Other | 0 | 0.0% |
| Total | 280 | 100.0% |
Housing Structures by Occupancy in Cape Royale
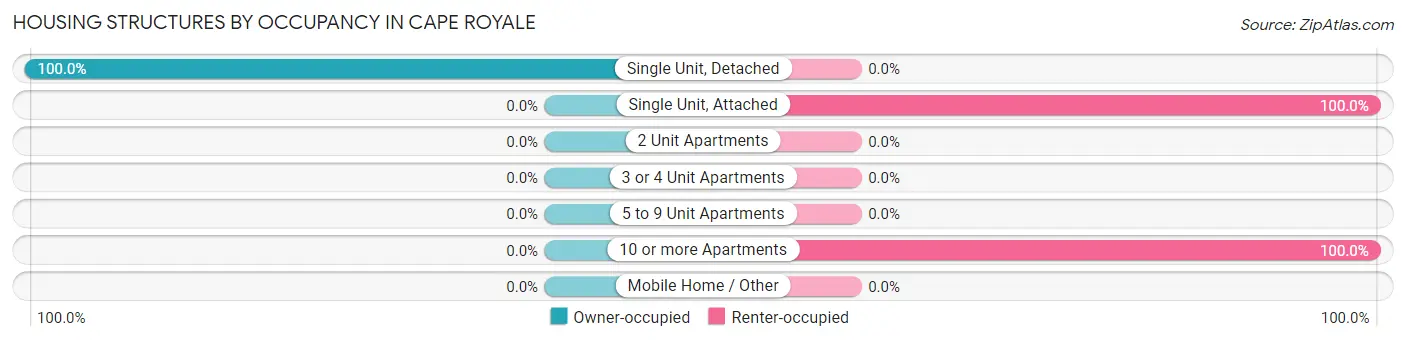
| Structure Type | Owner-occupied | Renter-occupied |
| Single Unit, Detached | 223 (100.0%) | 0 (0.0%) |
| Single Unit, Attached | 0 (0.0%) | 43 (100.0%) |
| 2 Unit Apartments | 0 (0.0%) | 0 (0.0%) |
| 3 or 4 Unit Apartments | 0 (0.0%) | 0 (0.0%) |
| 5 to 9 Unit Apartments | 0 (0.0%) | 0 (0.0%) |
| 10 or more Apartments | 0 (0.0%) | 14 (100.0%) |
| Mobile Home / Other | 0 (0.0%) | 0 (0.0%) |
| Total | 223 (79.6%) | 57 (20.4%) |
Housing Structures by Number of Rooms in Cape Royale
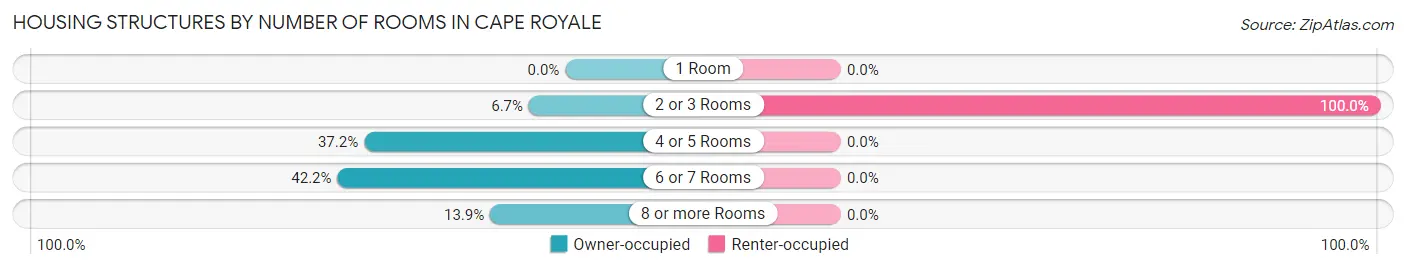
| Number of Rooms | Owner-occupied | Renter-occupied |
| 1 Room | 0 (0.0%) | 0 (0.0%) |
| 2 or 3 Rooms | 15 (6.7%) | 57 (100.0%) |
| 4 or 5 Rooms | 83 (37.2%) | 0 (0.0%) |
| 6 or 7 Rooms | 94 (42.1%) | 0 (0.0%) |
| 8 or more Rooms | 31 (13.9%) | 0 (0.0%) |
| Total | 223 (100.0%) | 57 (100.0%) |
Housing Structure by Heating Type in Cape Royale
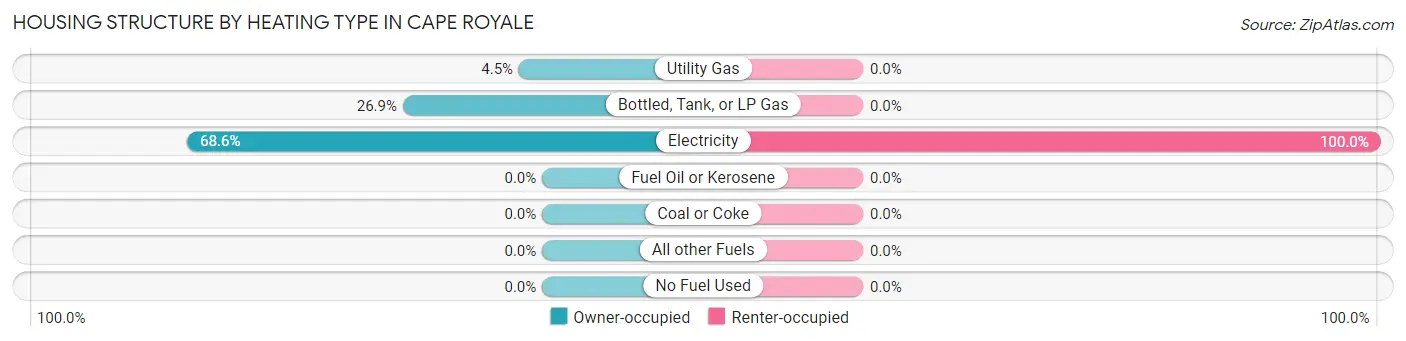
| Heating Type | Owner-occupied | Renter-occupied |
| Utility Gas | 10 (4.5%) | 0 (0.0%) |
| Bottled, Tank, or LP Gas | 60 (26.9%) | 0 (0.0%) |
| Electricity | 153 (68.6%) | 57 (100.0%) |
| Fuel Oil or Kerosene | 0 (0.0%) | 0 (0.0%) |
| Coal or Coke | 0 (0.0%) | 0 (0.0%) |
| All other Fuels | 0 (0.0%) | 0 (0.0%) |
| No Fuel Used | 0 (0.0%) | 0 (0.0%) |
| Total | 223 (100.0%) | 57 (100.0%) |
Household Vehicle Usage in Cape Royale
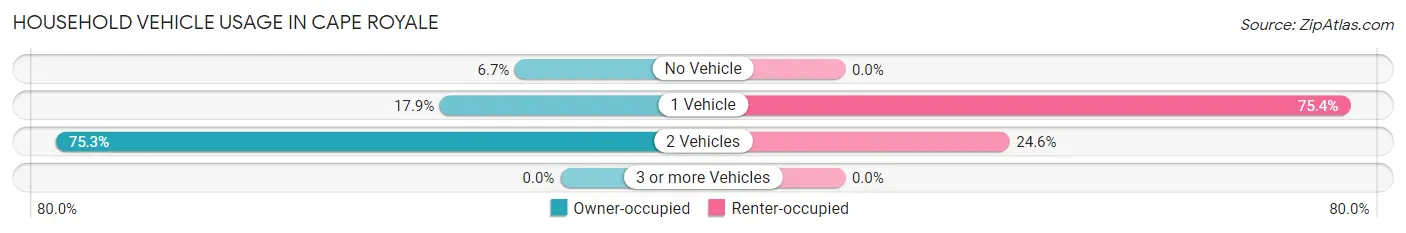
| Vehicles per Household | Owner-occupied | Renter-occupied |
| No Vehicle | 15 (6.7%) | 0 (0.0%) |
| 1 Vehicle | 40 (17.9%) | 43 (75.4%) |
| 2 Vehicles | 168 (75.3%) | 14 (24.6%) |
| 3 or more Vehicles | 0 (0.0%) | 0 (0.0%) |
| Total | 223 (100.0%) | 57 (100.0%) |
Real Estate & Mortgages in Cape Royale
Real Estate and Mortgage Overview in Cape Royale
| Characteristic | Without Mortgage | With Mortgage |
| Housing Units | 102 | 121 |
| Median Property Value | $287,900 | $307,600 |
| Median Household Income | - | - |
| Monthly Housing Costs | $704 | $0 |
| Real Estate Taxes | $4,328 | $0 |
Property Value by Mortgage Status in Cape Royale
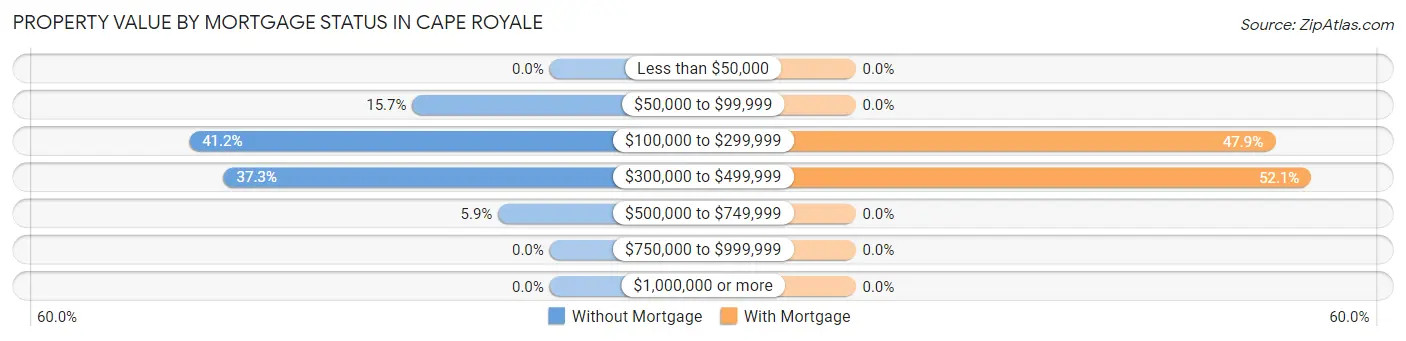
| Property Value | Without Mortgage | With Mortgage |
| Less than $50,000 | 0 (0.0%) | 0 (0.0%) |
| $50,000 to $99,999 | 16 (15.7%) | 0 (0.0%) |
| $100,000 to $299,999 | 42 (41.2%) | 58 (47.9%) |
| $300,000 to $499,999 | 38 (37.2%) | 63 (52.1%) |
| $500,000 to $749,999 | 6 (5.9%) | 0 (0.0%) |
| $750,000 to $999,999 | 0 (0.0%) | 0 (0.0%) |
| $1,000,000 or more | 0 (0.0%) | 0 (0.0%) |
| Total | 102 (100.0%) | 121 (100.0%) |
Household Income by Mortgage Status in Cape Royale
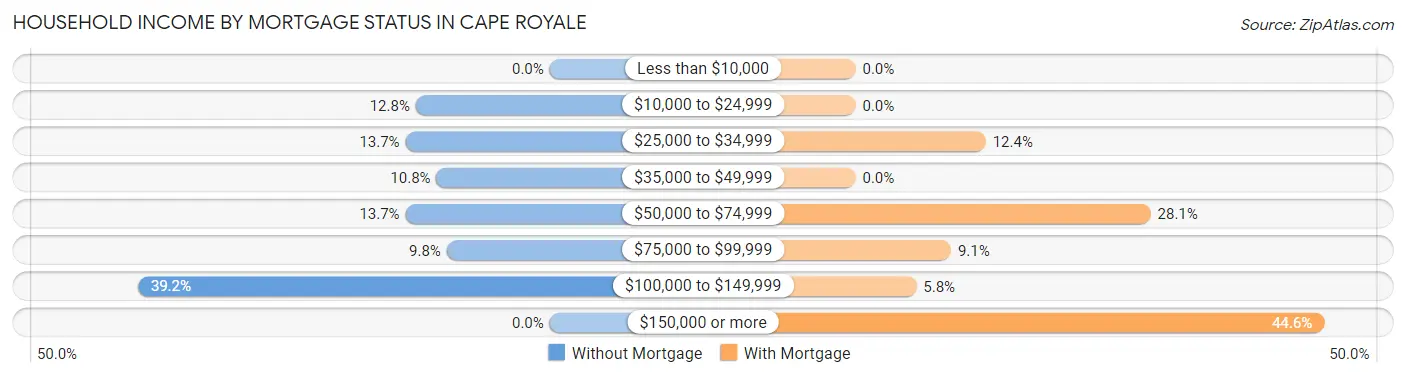
| Household Income | Without Mortgage | With Mortgage |
| Less than $10,000 | 0 (0.0%) | 0 (0.0%) |
| $10,000 to $24,999 | 13 (12.8%) | 0 (0.0%) |
| $25,000 to $34,999 | 14 (13.7%) | 15 (12.4%) |
| $35,000 to $49,999 | 11 (10.8%) | 0 (0.0%) |
| $50,000 to $74,999 | 14 (13.7%) | 34 (28.1%) |
| $75,000 to $99,999 | 10 (9.8%) | 11 (9.1%) |
| $100,000 to $149,999 | 40 (39.2%) | 7 (5.8%) |
| $150,000 or more | 0 (0.0%) | 54 (44.6%) |
| Total | 102 (100.0%) | 121 (100.0%) |
Property Value to Household Income Ratio in Cape Royale
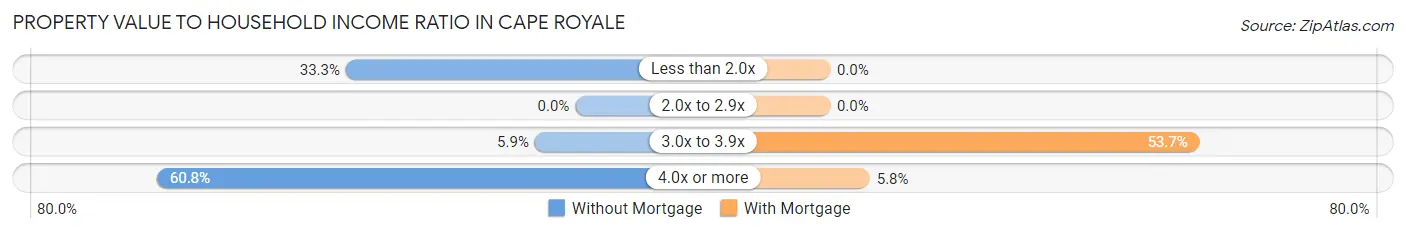
| Value-to-Income Ratio | Without Mortgage | With Mortgage |
| Less than 2.0x | 34 (33.3%) | 0 (0.0%) |
| 2.0x to 2.9x | 0 (0.0%) | 0 (0.0%) |
| 3.0x to 3.9x | 6 (5.9%) | 65 (53.7%) |
| 4.0x or more | 62 (60.8%) | 7 (5.8%) |
| Total | 102 (100.0%) | 121 (100.0%) |
Real Estate Taxes by Mortgage Status in Cape Royale
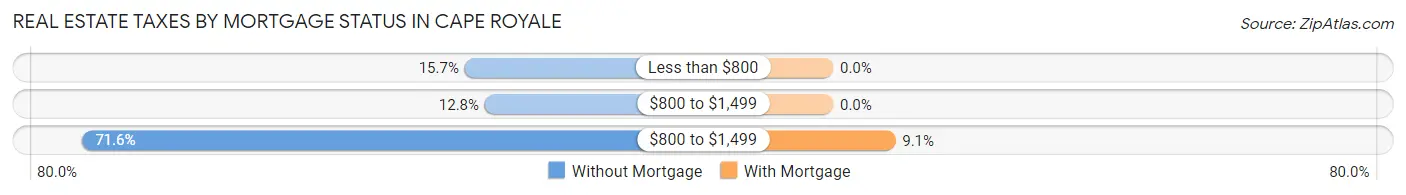
| Property Taxes | Without Mortgage | With Mortgage |
| Less than $800 | 16 (15.7%) | 0 (0.0%) |
| $800 to $1,499 | 13 (12.8%) | 0 (0.0%) |
| $800 to $1,499 | 73 (71.6%) | 11 (9.1%) |
| Total | 102 (100.0%) | 121 (100.0%) |
Health & Disability in Cape Royale
Health Insurance Coverage by Age in Cape Royale
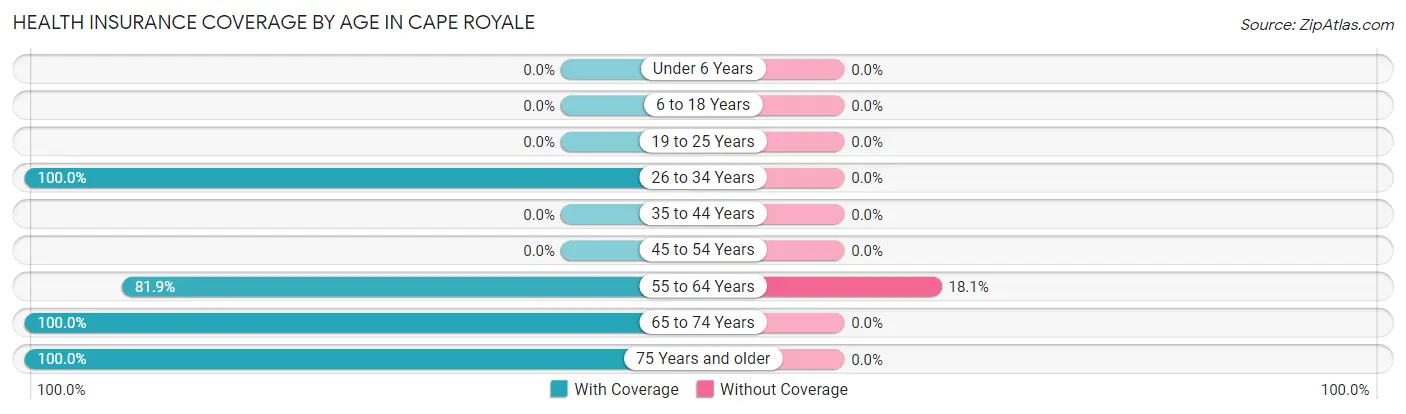
| Age Bracket | With Coverage | Without Coverage |
| Under 6 Years | 0 (0.0%) | 0 (0.0%) |
| 6 to 18 Years | 0 (0.0%) | 0 (0.0%) |
| 19 to 25 Years | 0 (0.0%) | 0 (0.0%) |
| 26 to 34 Years | 28 (100.0%) | 0 (0.0%) |
| 35 to 44 Years | 0 (0.0%) | 0 (0.0%) |
| 45 to 54 Years | 0 (0.0%) | 0 (0.0%) |
| 55 to 64 Years | 194 (81.9%) | 43 (18.1%) |
| 65 to 74 Years | 153 (100.0%) | 0 (0.0%) |
| 75 Years and older | 51 (100.0%) | 0 (0.0%) |
| Total | 426 (90.8%) | 43 (9.2%) |
Health Insurance Coverage by Citizenship Status in Cape Royale
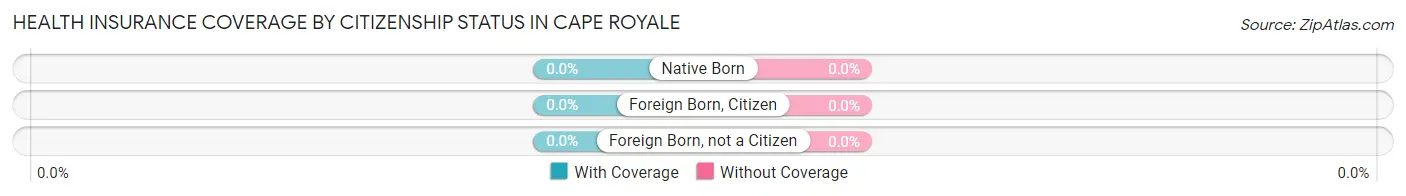
| Citizenship Status | With Coverage | Without Coverage |
| Native Born | 0 (0.0%) | 0 (0.0%) |
| Foreign Born, Citizen | 0 (0.0%) | 0 (0.0%) |
| Foreign Born, not a Citizen | 0 (0.0%) | 0 (0.0%) |
Health Insurance Coverage by Household Income in Cape Royale
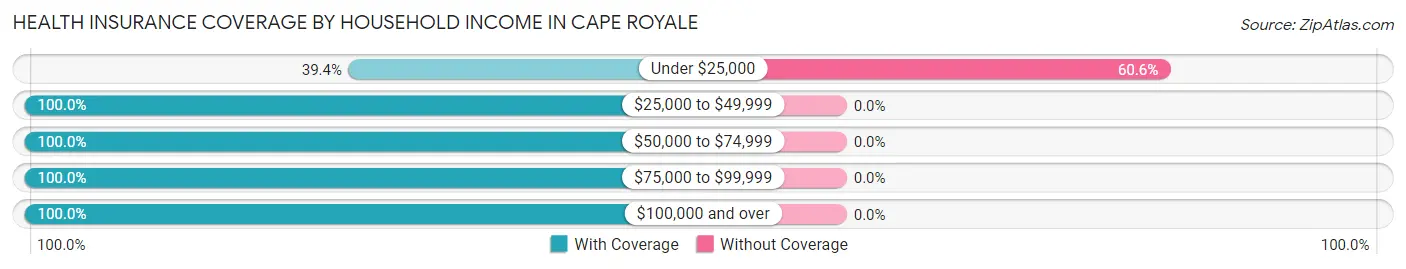
| Household Income | With Coverage | Without Coverage |
| Under $25,000 | 28 (39.4%) | 43 (60.6%) |
| $25,000 to $49,999 | 113 (100.0%) | 0 (0.0%) |
| $50,000 to $74,999 | 40 (100.0%) | 0 (0.0%) |
| $75,000 to $99,999 | 37 (100.0%) | 0 (0.0%) |
| $100,000 and over | 208 (100.0%) | 0 (0.0%) |
Public vs Private Health Insurance Coverage by Age in Cape Royale
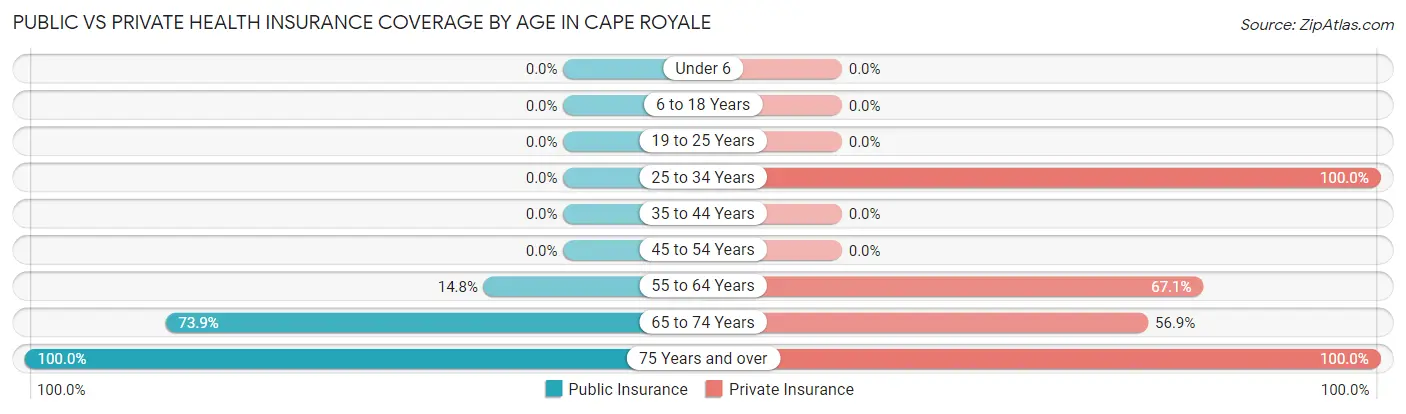
| Age Bracket | Public Insurance | Private Insurance |
| Under 6 | 0 (0.0%) | 0 (0.0%) |
| 6 to 18 Years | 0 (0.0%) | 0 (0.0%) |
| 19 to 25 Years | 0 (0.0%) | 0 (0.0%) |
| 25 to 34 Years | 0 (0.0%) | 28 (100.0%) |
| 35 to 44 Years | 0 (0.0%) | 0 (0.0%) |
| 45 to 54 Years | 0 (0.0%) | 0 (0.0%) |
| 55 to 64 Years | 35 (14.8%) | 159 (67.1%) |
| 65 to 74 Years | 113 (73.9%) | 87 (56.9%) |
| 75 Years and over | 51 (100.0%) | 51 (100.0%) |
| Total | 199 (42.4%) | 325 (69.3%) |
Disability Status by Sex by Age in Cape Royale
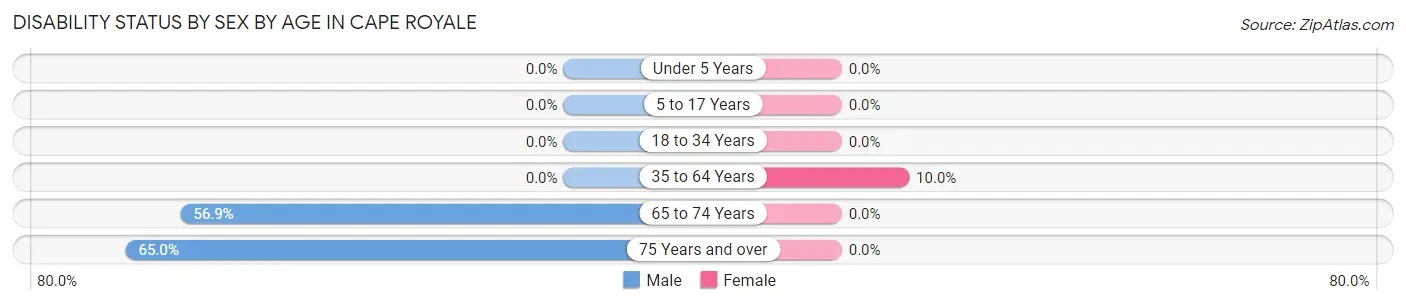
| Age Bracket | Male | Female |
| Under 5 Years | 0 (0.0%) | 0 (0.0%) |
| 5 to 17 Years | 0 (0.0%) | 0 (0.0%) |
| 18 to 34 Years | 0 (0.0%) | 0 (0.0%) |
| 35 to 64 Years | 0 (0.0%) | 13 (10.0%) |
| 65 to 74 Years | 29 (56.9%) | 0 (0.0%) |
| 75 Years and over | 26 (65.0%) | 0 (0.0%) |
Disability Class by Sex by Age in Cape Royale
Disability Class: Hearing Difficulty
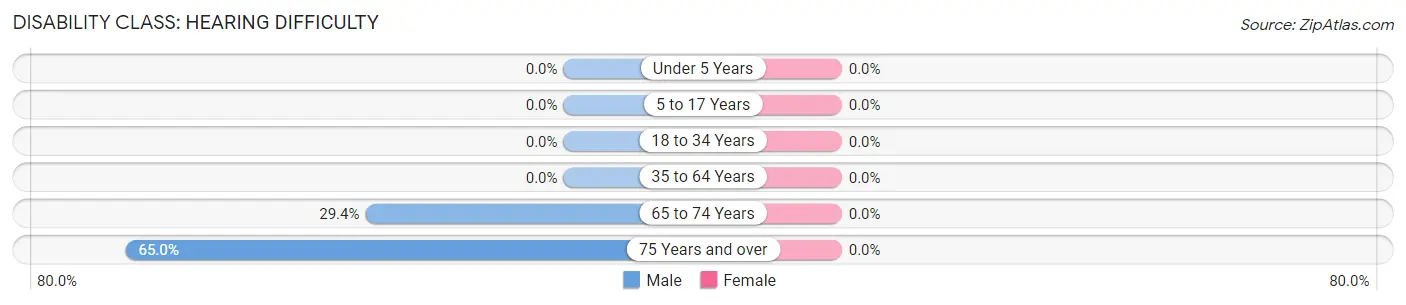
| Age Bracket | Male | Female |
| Under 5 Years | 0 (0.0%) | 0 (0.0%) |
| 5 to 17 Years | 0 (0.0%) | 0 (0.0%) |
| 18 to 34 Years | 0 (0.0%) | 0 (0.0%) |
| 35 to 64 Years | 0 (0.0%) | 0 (0.0%) |
| 65 to 74 Years | 15 (29.4%) | 0 (0.0%) |
| 75 Years and over | 26 (65.0%) | 0 (0.0%) |
Disability Class: Vision Difficulty
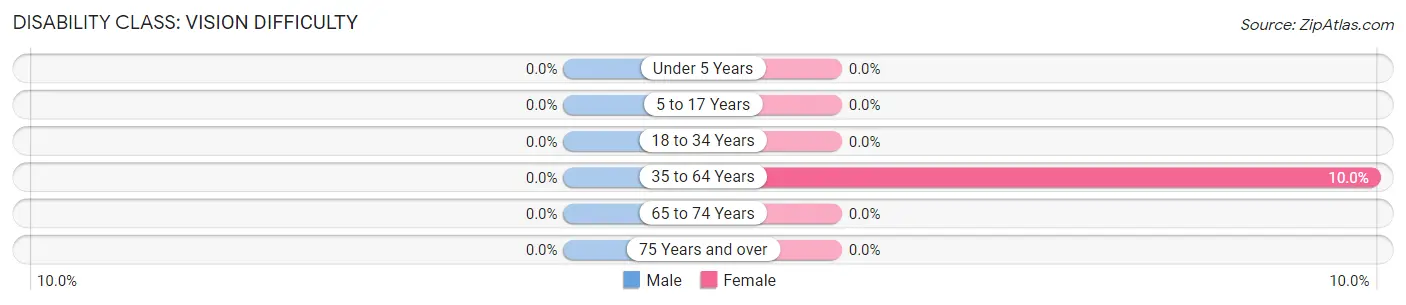
| Age Bracket | Male | Female |
| Under 5 Years | 0 (0.0%) | 0 (0.0%) |
| 5 to 17 Years | 0 (0.0%) | 0 (0.0%) |
| 18 to 34 Years | 0 (0.0%) | 0 (0.0%) |
| 35 to 64 Years | 0 (0.0%) | 13 (10.0%) |
| 65 to 74 Years | 0 (0.0%) | 0 (0.0%) |
| 75 Years and over | 0 (0.0%) | 0 (0.0%) |
Disability Class: Cognitive Difficulty
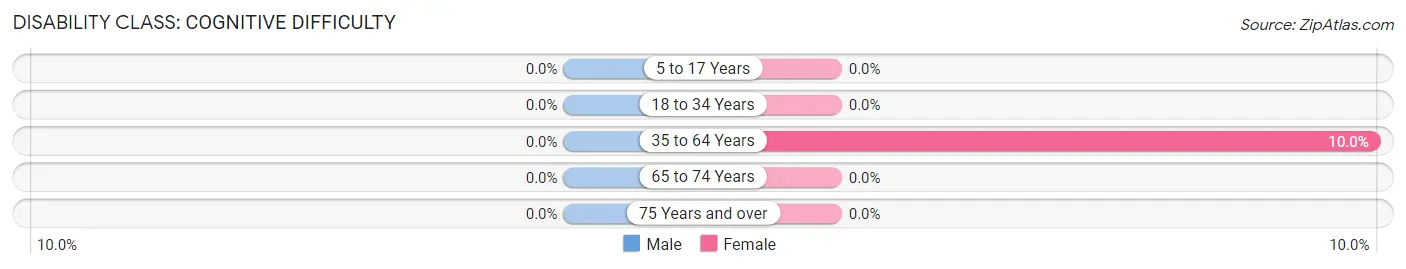
| Age Bracket | Male | Female |
| 5 to 17 Years | 0 (0.0%) | 0 (0.0%) |
| 18 to 34 Years | 0 (0.0%) | 0 (0.0%) |
| 35 to 64 Years | 0 (0.0%) | 13 (10.0%) |
| 65 to 74 Years | 0 (0.0%) | 0 (0.0%) |
| 75 Years and over | 0 (0.0%) | 0 (0.0%) |
Disability Class: Ambulatory Difficulty
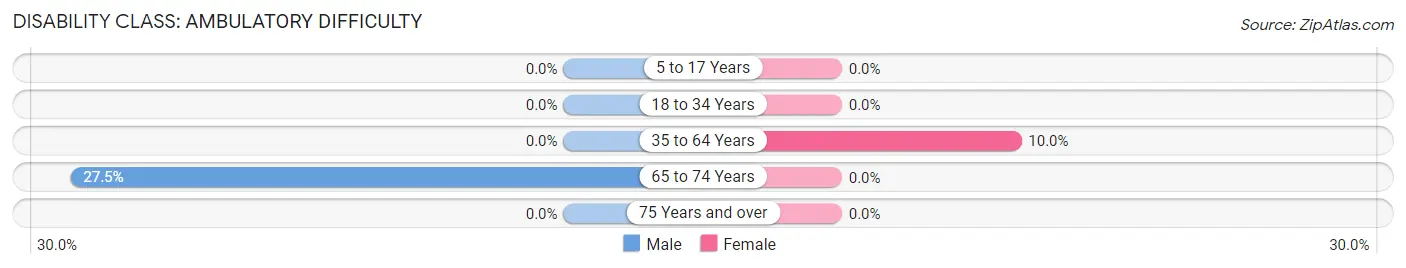
| Age Bracket | Male | Female |
| 5 to 17 Years | 0 (0.0%) | 0 (0.0%) |
| 18 to 34 Years | 0 (0.0%) | 0 (0.0%) |
| 35 to 64 Years | 0 (0.0%) | 13 (10.0%) |
| 65 to 74 Years | 14 (27.5%) | 0 (0.0%) |
| 75 Years and over | 0 (0.0%) | 0 (0.0%) |
Disability Class: Self-Care Difficulty
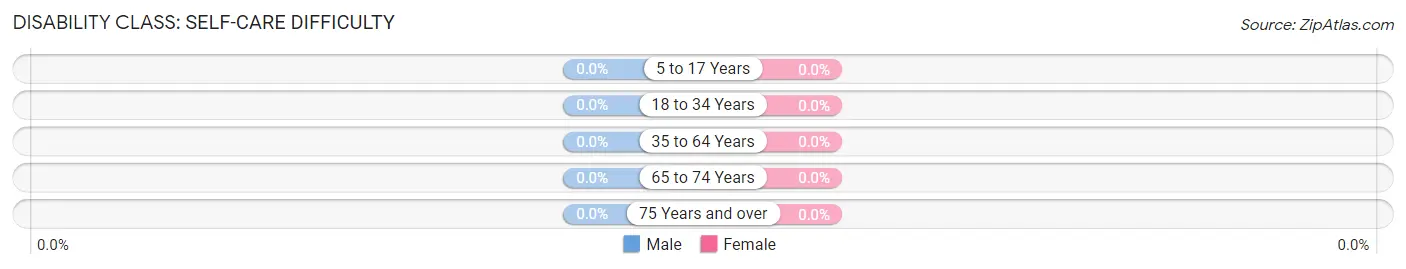
| Age Bracket | Male | Female |
| 5 to 17 Years | 0 (0.0%) | 0 (0.0%) |
| 18 to 34 Years | 0 (0.0%) | 0 (0.0%) |
| 35 to 64 Years | 0 (0.0%) | 0 (0.0%) |
| 65 to 74 Years | 0 (0.0%) | 0 (0.0%) |
| 75 Years and over | 0 (0.0%) | 0 (0.0%) |
Technology Access in Cape Royale
Computing Device Access in Cape Royale
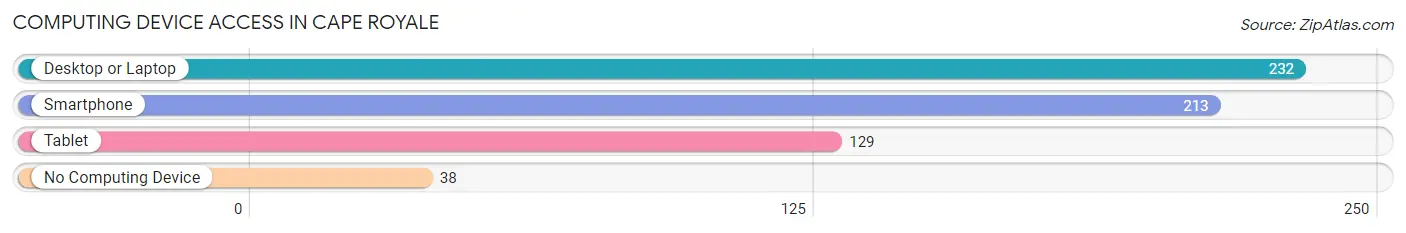
| Device Type | # Households | % Households |
| Desktop or Laptop | 232 | 82.9% |
| Smartphone | 213 | 76.1% |
| Tablet | 129 | 46.1% |
| No Computing Device | 38 | 13.6% |
| Total | 280 | 100.0% |
Internet Access in Cape Royale
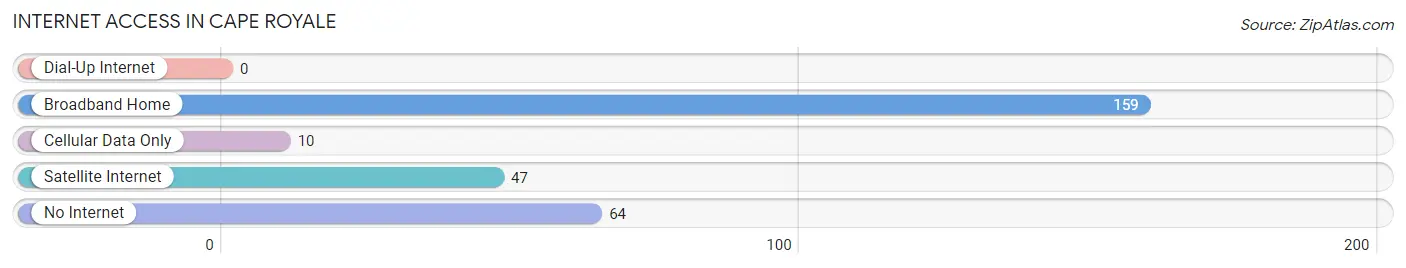
| Internet Type | # Households | % Households |
| Dial-Up Internet | 0 | 0.0% |
| Broadband Home | 159 | 56.8% |
| Cellular Data Only | 10 | 3.6% |
| Satellite Internet | 47 | 16.8% |
| No Internet | 64 | 22.9% |
| Total | 280 | 100.0% |
Cape Royale Summary
Cape Royale is a small town located in the state of Texas, United States. It is situated in the southeastern corner of the state, near the Gulf of Mexico. The town has a population of approximately 1,000 people and is part of the Galveston-Houston metropolitan area.
History
Cape Royale was founded in 1845 by a group of settlers from the Republic of Texas. The town was originally named “Cape Royal”, but the name was changed to “Cape Royale” in 1848. The town was originally a fishing village, but it soon became a popular tourist destination due to its proximity to the Gulf of Mexico.
In the late 19th century, the town was a popular destination for wealthy Texans who wanted to escape the heat of the summer. The town was also known for its oyster beds, which were a major source of income for the town.
In the early 20th century, the town began to decline as the oyster beds were depleted and the tourist industry declined. The town was also hit hard by the Great Depression and World War II.
Geography
Cape Royale is located in the southeastern corner of Texas, near the Gulf of Mexico. The town is situated on the Galveston Bay, which is a large estuary that connects to the Gulf of Mexico. The town is surrounded by wetlands and marshlands, which provide a unique habitat for a variety of wildlife.
The town is located in Galveston County and is part of the Galveston-Houston metropolitan area. The town is located approximately 40 miles south of Houston and 25 miles east of Galveston.
Economy
The economy of Cape Royale is largely based on tourism and fishing. The town is a popular destination for tourists who want to experience the unique culture and scenery of the Gulf Coast. The town is also known for its oyster beds, which are a major source of income for the town.
The town also has a small manufacturing sector, which produces a variety of products such as furniture, clothing, and electronics.
Demographics
As of the 2010 census, the population of Cape Royale was 1,000 people. The town is predominantly white, with approximately 75% of the population being white. The remaining 25% of the population is made up of African Americans, Hispanics, and other ethnicities.
The median household income in Cape Royale is $45,000, which is slightly lower than the national average. The town has a poverty rate of 15%, which is slightly higher than the national average.
Conclusion
Cape Royale is a small town located in the southeastern corner of Texas, near the Gulf of Mexico. The town has a population of approximately 1,000 people and is part of the Galveston-Houston metropolitan area. The town’s economy is largely based on tourism and fishing, and it is known for its oyster beds. The town is predominantly white, with a median household income of $45,000 and a poverty rate of 15%.
Common Questions
What is the Total Population of Cape Royale?
Total Population of Cape Royale is 469.
What is the Total Male Population of Cape Royale?
Total Male Population of Cape Royale is 198.
What is the Total Female Population of Cape Royale?
Total Female Population of Cape Royale is 271.
What is the Ratio of Males per 100 Females in Cape Royale?
There are 73.06 Males per 100 Females in Cape Royale.
What is the Ratio of Females per 100 Males in Cape Royale?
There are 136.87 Females per 100 Males in Cape Royale.
What is the Median Population Age in Cape Royale?
Median Population Age in Cape Royale is 64.6 Years.
What is the Average Family Size in Cape Royale
Average Family Size in Cape Royale is 2.0 People.
What is the Average Household Size in Cape Royale
Average Household Size in Cape Royale is 1.7 People.
What is Per Capita Income in Cape Royale?
Per Capita income in Cape Royale is $44,416.
What is the Median Family Income in Cape Royale?
Median Family Income in Cape Royale is $105,063.
What is the Median Household income in Cape Royale?
Median Household Income in Cape Royale is $57,273.
What is Income or Wage Gap in Cape Royale?
Income or Wage Gap in Cape Royale is 16.5%.
Women in Cape Royale earn 83.5 cents for every dollar earned by a man.
What is Inequality or Gini Index in Cape Royale?
Inequality or Gini Index in Cape Royale is 0.37.
How Large is the Labor Force in Cape Royale?
There are 267 People in the Labor Forcein in Cape Royale.
What is the Percentage of People in the Labor Force in Cape Royale?
56.9% of People are in the Labor Force in Cape Royale.
What is the Unemployment Rate in Cape Royale?
Unemployment Rate in Cape Royale is 21.3%.