Briar, TX
Briar Map
Briar Overview
6,227
TOTAL POPULATION
2,923
MALE POPULATION
3,304
FEMALE POPULATION
88.47
MALES / 100 FEMALES
113.03
FEMALES / 100 MALES
40.0
MEDIAN AGE
3.2
AVG FAMILY SIZE
2.8
AVG HOUSEHOLD SIZE
$35,257
PER CAPITA INCOME
$93,646
AVG FAMILY INCOME
$80,486
AVG HOUSEHOLD INCOME
19.6%
WAGE / INCOME GAP [ % ]
80.4¢/ $1
WAGE / INCOME GAP [ $ ]
0.39
INEQUALITY / GINI INDEX
3,141
LABOR FORCE [ PEOPLE ]
61.1%
PERCENT IN LABOR FORCE
3.2%
UNEMPLOYMENT RATE
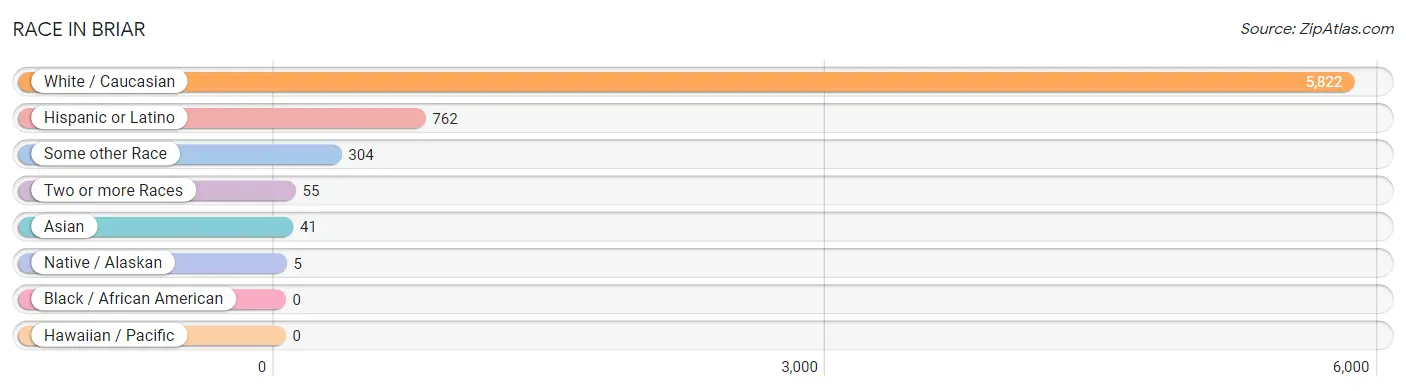
Race in Briar
The most populous races in Briar are White / Caucasian (5,822 | 93.5%), Hispanic or Latino (762 | 12.2%), and Some other Race (304 | 4.9%).
| Race | # Population | % Population |
| Asian | 41 | 0.7% |
| Black / African American | 0 | 0.0% |
| Hawaiian / Pacific | 0 | 0.0% |
| Hispanic or Latino | 762 | 12.2% |
| Native / Alaskan | 5 | 0.1% |
| White / Caucasian | 5,822 | 93.5% |
| Two or more Races | 55 | 0.9% |
| Some other Race | 304 | 4.9% |
| Total | 6,227 | 100.0% |
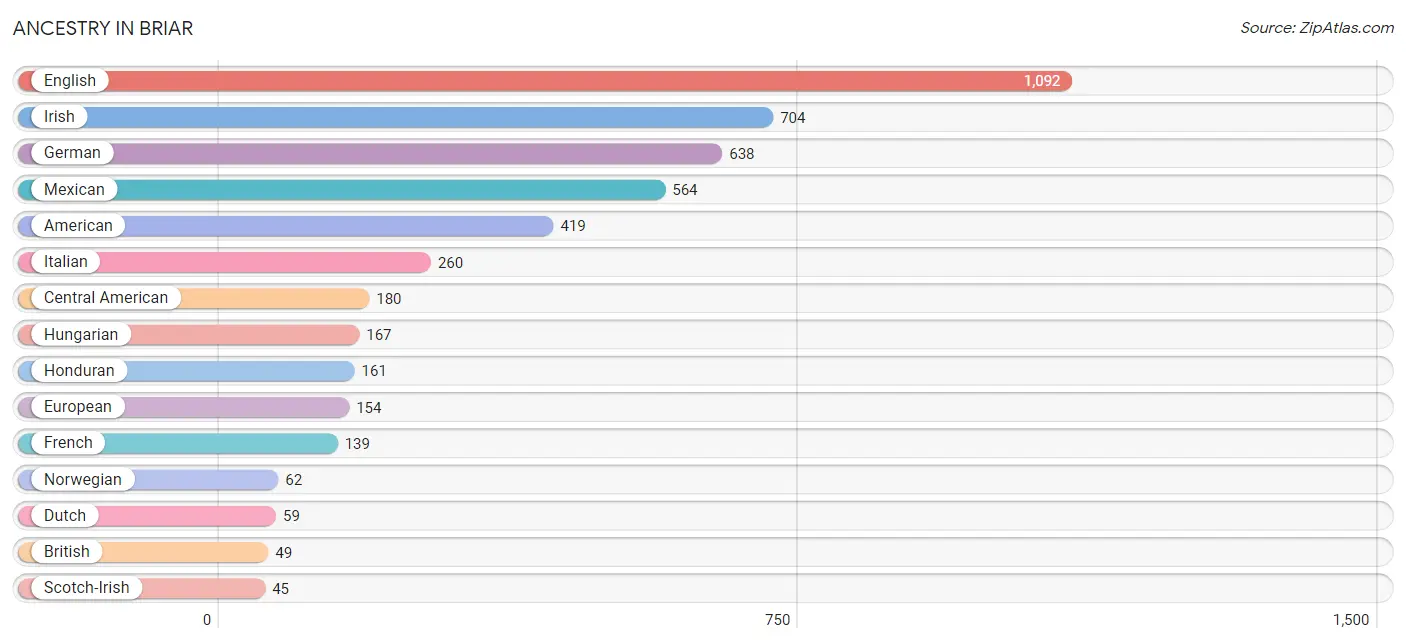
Ancestry in Briar
The most populous ancestries reported in Briar are English (1,092 | 17.5%), Irish (704 | 11.3%), German (638 | 10.2%), Mexican (564 | 9.1%), and American (419 | 6.7%), together accounting for 54.9% of all Briar residents.
| Ancestry | # Population | % Population |
| American | 419 | 6.7% |
| British | 49 | 0.8% |
| Celtic | 8 | 0.1% |
| Central American | 180 | 2.9% |
| Cherokee | 15 | 0.2% |
| Chickasaw | 12 | 0.2% |
| Czech | 38 | 0.6% |
| Dutch | 59 | 0.9% |
| Dutch West Indian | 10 | 0.2% |
| English | 1,092 | 17.5% |
| European | 154 | 2.5% |
| French | 139 | 2.2% |
| French Canadian | 19 | 0.3% |
| German | 638 | 10.2% |
| Honduran | 161 | 2.6% |
| Hungarian | 167 | 2.7% |
| Indian (Asian) | 41 | 0.7% |
| Irish | 704 | 11.3% |
| Italian | 260 | 4.2% |
| Mexican | 564 | 9.1% |
| Norwegian | 62 | 1.0% |
| Panamanian | 19 | 0.3% |
| Polish | 32 | 0.5% |
| Russian | 15 | 0.2% |
| Scandinavian | 39 | 0.6% |
| Scotch-Irish | 45 | 0.7% |
| Scottish | 42 | 0.7% |
| Spaniard | 18 | 0.3% |
| Ukrainian | 45 | 0.7% |
| Welsh | 12 | 0.2% | View All 30 Rows |
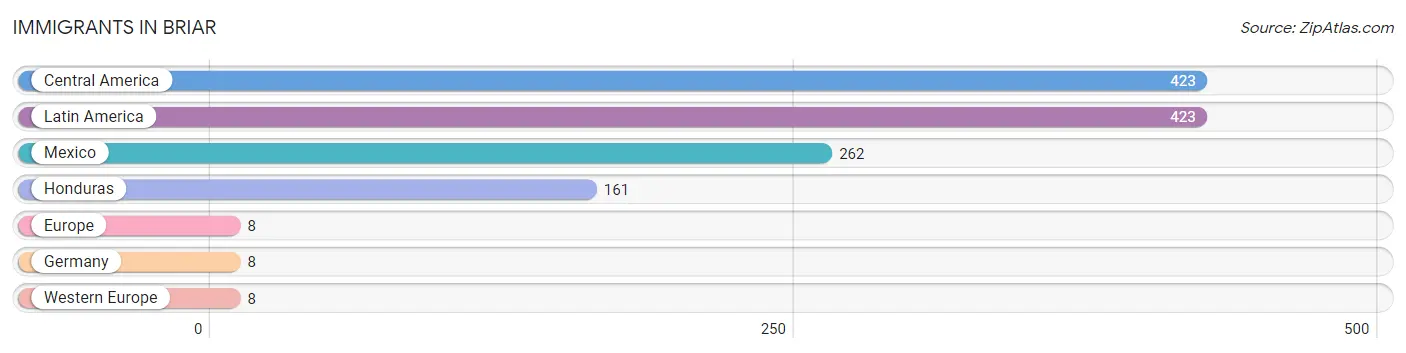
Immigrants in Briar
The most numerous immigrant groups reported in Briar came from Central America (423 | 6.8%), Latin America (423 | 6.8%), Mexico (262 | 4.2%), Honduras (161 | 2.6%), and Europe (8 | 0.1%), together accounting for 20.5% of all Briar residents.
| Immigration Origin | # Population | % Population |
| Central America | 423 | 6.8% |
| Europe | 8 | 0.1% |
| Germany | 8 | 0.1% |
| Honduras | 161 | 2.6% |
| Latin America | 423 | 6.8% |
| Mexico | 262 | 4.2% |
| Western Europe | 8 | 0.1% | View All 7 Rows |
Sex and Age in Briar
Sex and Age in Briar
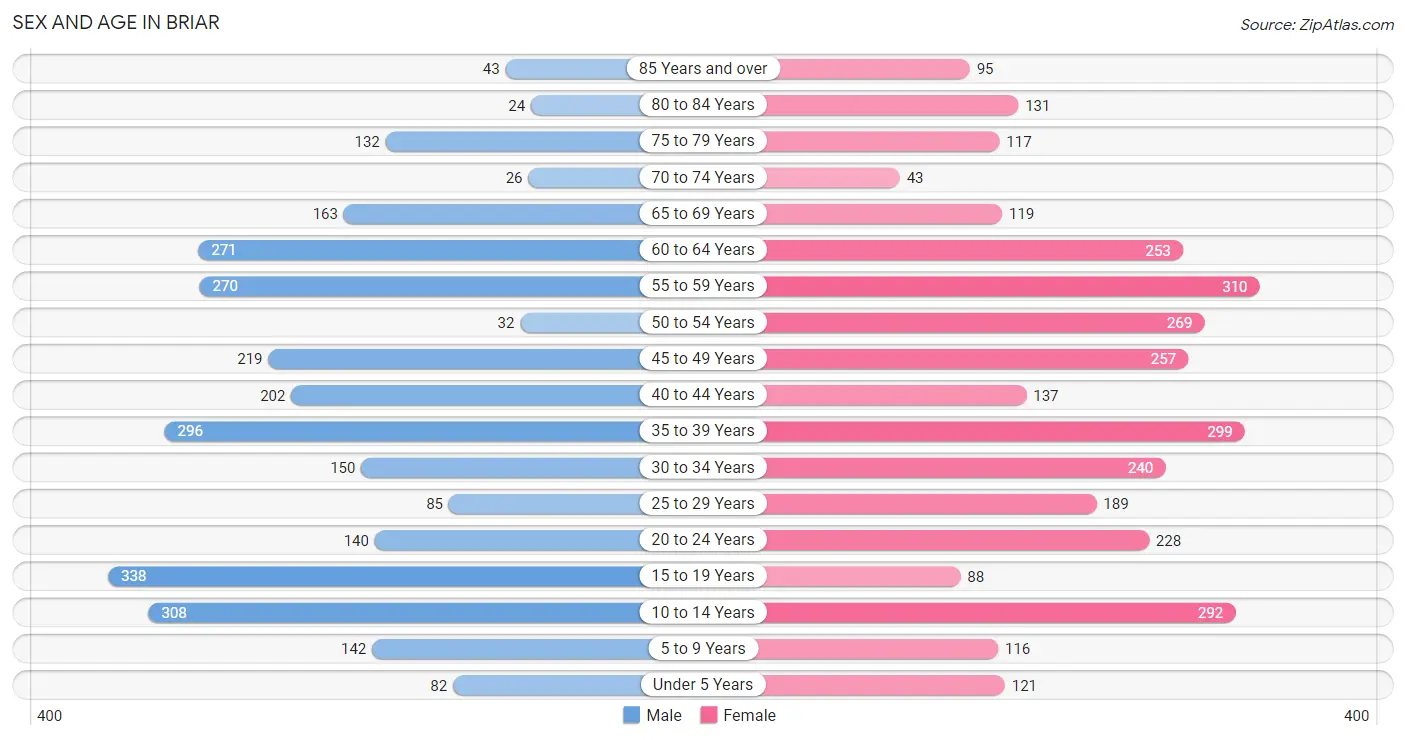
The most populous age groups in Briar are 15 to 19 Years (338 | 11.6%) for men and 55 to 59 Years (310 | 9.4%) for women.
| Age Bracket | Male | Female |
| Under 5 Years | 82 (2.8%) | 121 (3.7%) |
| 5 to 9 Years | 142 (4.9%) | 116 (3.5%) |
| 10 to 14 Years | 308 (10.5%) | 292 (8.8%) |
| 15 to 19 Years | 338 (11.6%) | 88 (2.7%) |
| 20 to 24 Years | 140 (4.8%) | 228 (6.9%) |
| 25 to 29 Years | 85 (2.9%) | 189 (5.7%) |
| 30 to 34 Years | 150 (5.1%) | 240 (7.3%) |
| 35 to 39 Years | 296 (10.1%) | 299 (9.0%) |
| 40 to 44 Years | 202 (6.9%) | 137 (4.2%) |
| 45 to 49 Years | 219 (7.5%) | 257 (7.8%) |
| 50 to 54 Years | 32 (1.1%) | 269 (8.1%) |
| 55 to 59 Years | 270 (9.2%) | 310 (9.4%) |
| 60 to 64 Years | 271 (9.3%) | 253 (7.7%) |
| 65 to 69 Years | 163 (5.6%) | 119 (3.6%) |
| 70 to 74 Years | 26 (0.9%) | 43 (1.3%) |
| 75 to 79 Years | 132 (4.5%) | 117 (3.5%) |
| 80 to 84 Years | 24 (0.8%) | 131 (4.0%) |
| 85 Years and over | 43 (1.5%) | 95 (2.9%) |
| Total | 2,923 (100.0%) | 3,304 (100.0%) |
Families and Households in Briar
Median Family Size in Briar
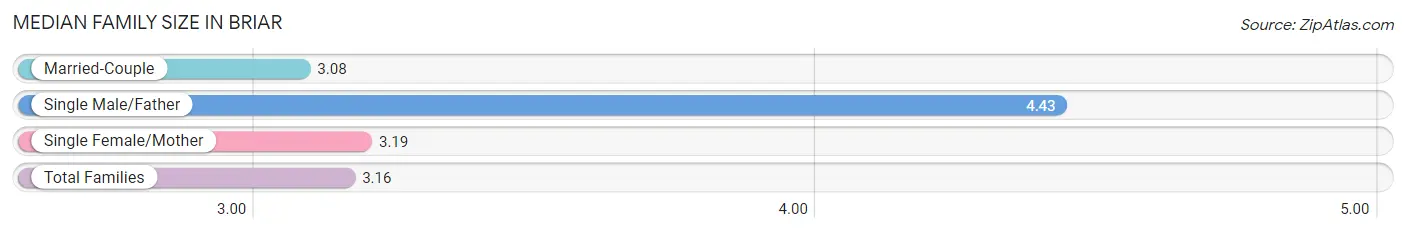
The median family size in Briar is 3.16 persons per family, with single male/father families (72 | 4.1%) accounting for the largest median family size of 4.43 persons per family. On the other hand, married-couple families (1,316 | 75.3%) represent the smallest median family size with 3.08 persons per family.
| Family Type | # Families | Family Size |
| Married-Couple | 1,316 (75.3%) | 3.08 |
| Single Male/Father | 72 (4.1%) | 4.43 |
| Single Female/Mother | 359 (20.5%) | 3.19 |
| Total Families | 1,747 (100.0%) | 3.16 |
Median Household Size in Briar
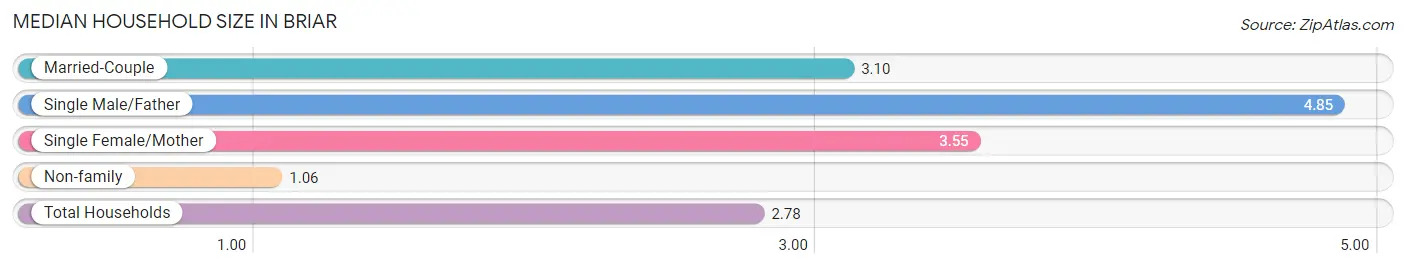
The median household size in Briar is 2.78 persons per household, with single male/father households (72 | 3.2%) accounting for the largest median household size of 4.85 persons per household. non-family households (494 | 22.0%) represent the smallest median household size with 1.06 persons per household.
| Household Type | # Households | Household Size |
| Married-Couple | 1,316 (58.7%) | 3.10 |
| Single Male/Father | 72 (3.2%) | 4.85 |
| Single Female/Mother | 359 (16.0%) | 3.55 |
| Non-family | 494 (22.0%) | 1.06 |
| Total Households | 2,241 (100.0%) | 2.78 |
Household Size by Marriage Status in Briar
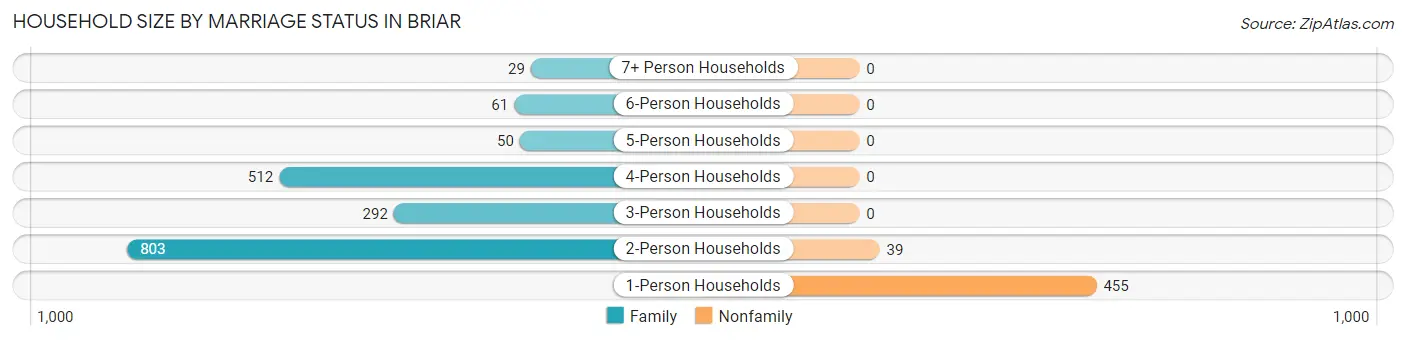
Out of a total of 2,241 households in Briar, 1,747 (78.0%) are family households, while 494 (22.0%) are nonfamily households. The most numerous type of family households are 2-person households, comprising 803, and the most common type of nonfamily households are 1-person households, comprising 455.
| Household Size | Family Households | Nonfamily Households |
| 1-Person Households | - | 455 (20.3%) |
| 2-Person Households | 803 (35.8%) | 39 (1.7%) |
| 3-Person Households | 292 (13.0%) | 0 (0.0%) |
| 4-Person Households | 512 (22.9%) | 0 (0.0%) |
| 5-Person Households | 50 (2.2%) | 0 (0.0%) |
| 6-Person Households | 61 (2.7%) | 0 (0.0%) |
| 7+ Person Households | 29 (1.3%) | 0 (0.0%) |
| Total | 1,747 (78.0%) | 494 (22.0%) |
Female Fertility in Briar
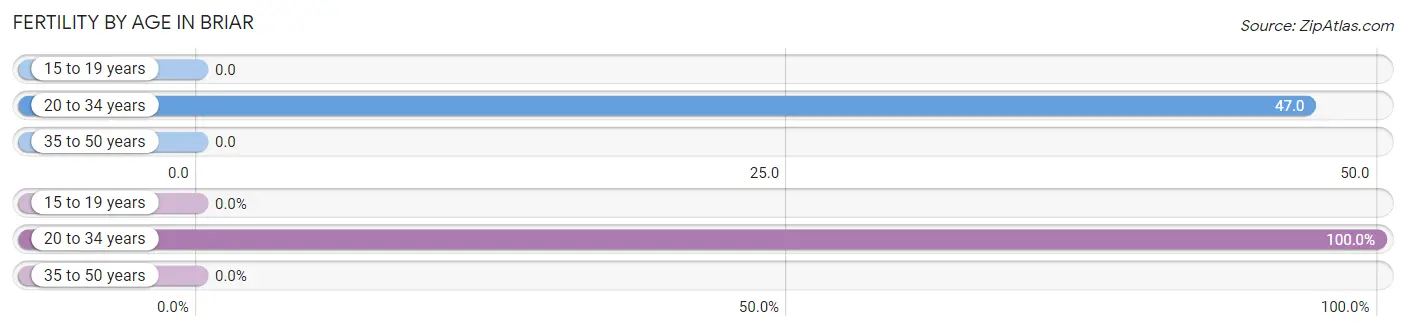
Fertility by Age in Briar
Average fertility rate in Briar is 19.0 births per 1,000 women. Women in the age bracket of 20 to 34 years have the highest fertility rate with 47.0 births per 1,000 women. Women in the age bracket of 20 to 34 years acount for 100.0% of all women with births.
| Age Bracket | Women with Births | Births / 1,000 Women |
| 15 to 19 years | 0 (0.0%) | 0.0 |
| 20 to 34 years | 31 (100.0%) | 47.0 |
| 35 to 50 years | 0 (0.0%) | 0.0 |
| Total | 31 (100.0%) | 19.0 |
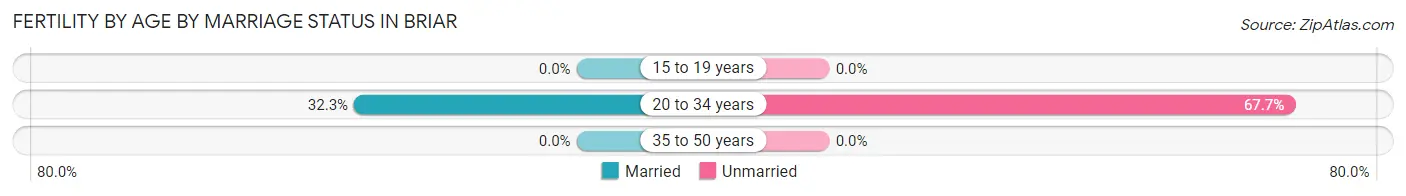
Fertility by Age by Marriage Status in Briar
32.3% of women with births (31) in Briar are married. The highest percentage of unmarried women with births falls into 20 to 34 years age bracket with 67.7% of them unmarried at the time of birth, while the lowest percentage of unmarried women with births belong to 20 to 34 years age bracket with 67.7% of them unmarried.
| Age Bracket | Married | Unmarried |
| 15 to 19 years | 0 (0.0%) | 0 (0.0%) |
| 20 to 34 years | 10 (32.3%) | 21 (67.7%) |
| 35 to 50 years | 0 (0.0%) | 0 (0.0%) |
| Total | 10 (32.3%) | 21 (67.7%) |
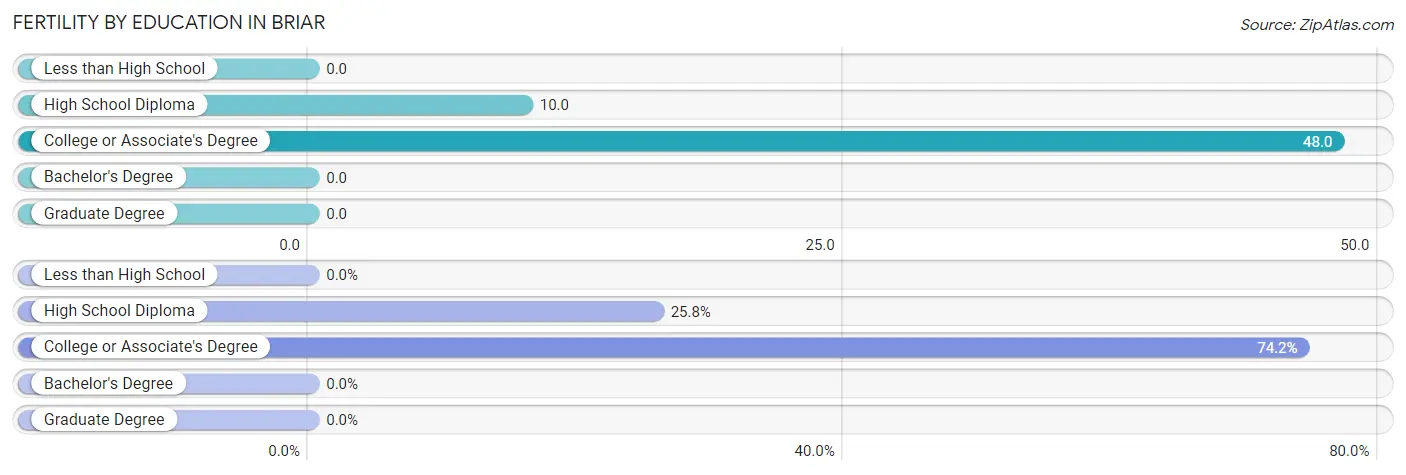
Fertility by Education in Briar
| Educational Attainment | Women with Births | Births / 1,000 Women |
| Less than High School | 0 (0.0%) | 0.0 |
| High School Diploma | 8 (25.8%) | 10.0 |
| College or Associate's Degree | 23 (74.2%) | 48.0 |
| Bachelor's Degree | 0 (0.0%) | 0.0 |
| Graduate Degree | 0 (0.0%) | 0.0 |
| Total | 31 (100.0%) | 19.0 |
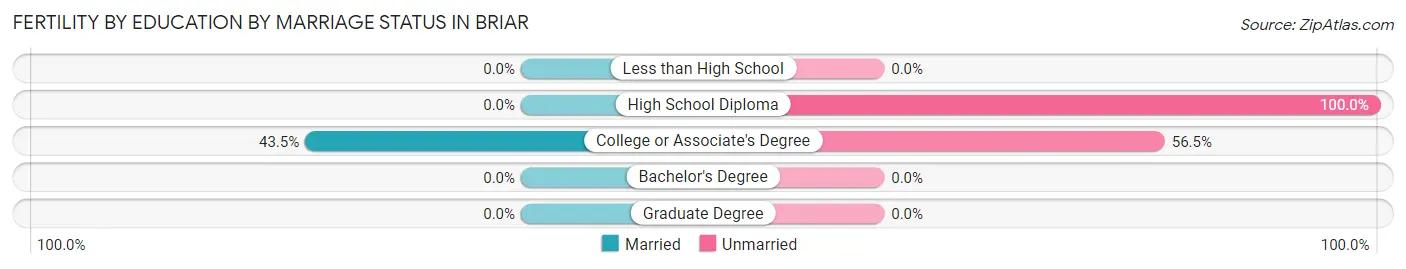
Fertility by Education by Marriage Status in Briar
67.7% of women with births in Briar are unmarried. Women with the educational attainment of college or associate's degree are most likely to be married with 43.5% of them married at childbirth, while women with the educational attainment of high school diploma are least likely to be married with 100.0% of them unmarried at childbirth.
| Educational Attainment | Married | Unmarried |
| Less than High School | 0 (0.0%) | 0 (0.0%) |
| High School Diploma | 0 (0.0%) | 8 (100.0%) |
| College or Associate's Degree | 10 (43.5%) | 13 (56.5%) |
| Bachelor's Degree | 0 (0.0%) | 0 (0.0%) |
| Graduate Degree | 0 (0.0%) | 0 (0.0%) |
| Total | 10 (32.3%) | 21 (67.7%) |
Income in Briar
Income Overview in Briar
Per Capita Income in Briar is $35,257, while median incomes of families and households are $93,646 and $80,486 respectively.
| Characteristic | Number | Measure |
| Per Capita Income | 6,227 | $35,257 |
| Median Family Income | 1,747 | $93,646 |
| Mean Family Income | 1,747 | $102,859 |
| Median Household Income | 2,241 | $80,486 |
| Mean Household Income | 2,241 | $93,925 |
| Income Deficit | 1,747 | $0 |
| Wage / Income Gap (%) | 6,227 | 19.57% |
| Wage / Income Gap ($) | 6,227 | 80.43¢ per $1 |
| Gini / Inequality Index | 6,227 | 0.39 |
Earnings by Sex in Briar
Average Earnings in Briar are $42,515, $47,355 for men and $38,087 for women, a difference of 19.6%.
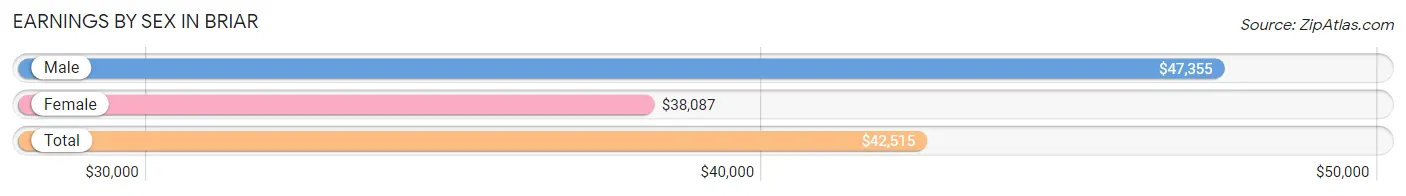
| Sex | Number | Average Earnings |
| Male | 1,644 (50.7%) | $47,355 |
| Female | 1,601 (49.3%) | $38,087 |
| Total | 3,245 (100.0%) | $42,515 |
Earnings by Sex by Income Bracket in Briar
The most common earnings brackets in Briar are $100,000+ for men (279 | 17.0%) and $35,000 to $39,999 for women (208 | 13.0%).
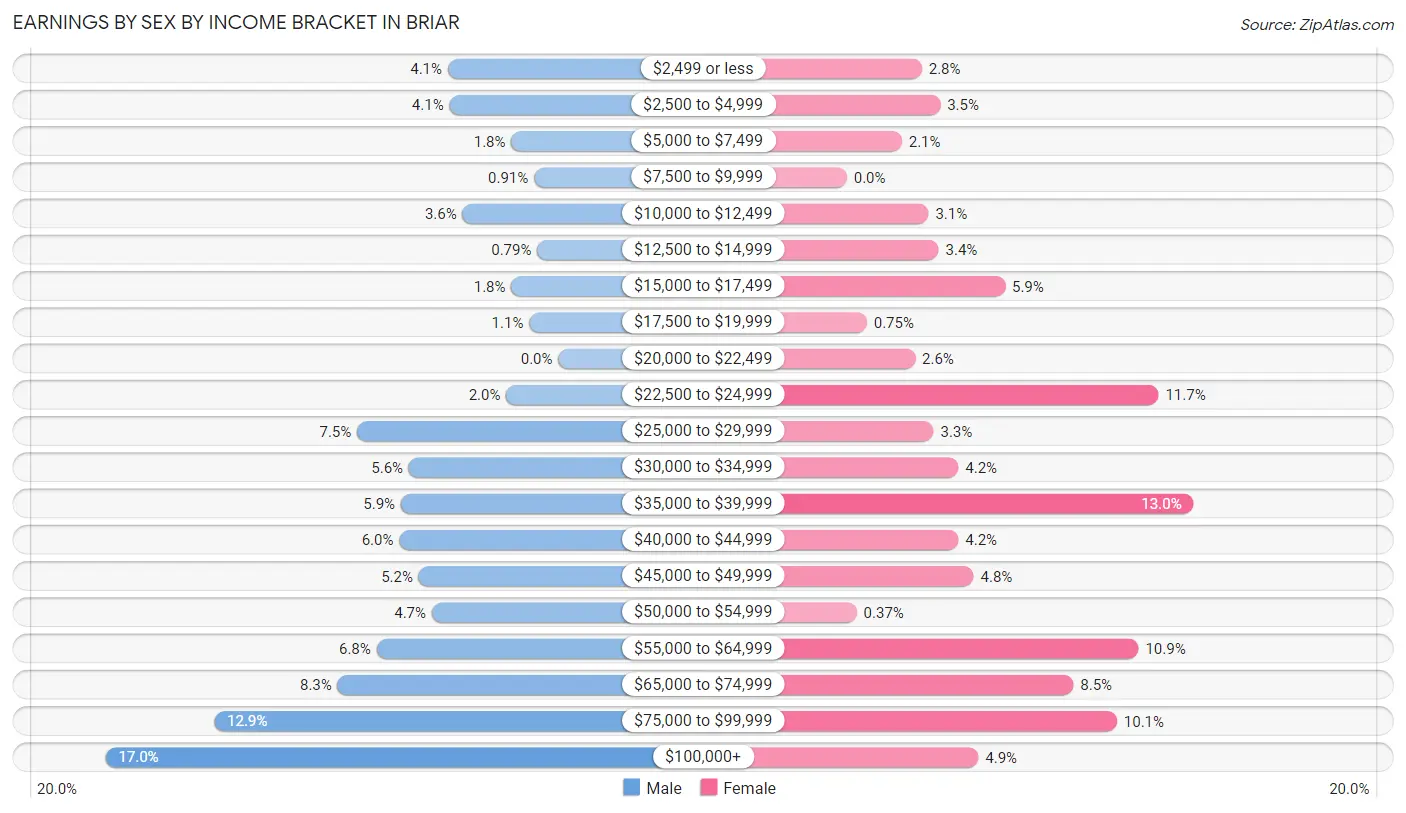
| Income | Male | Female |
| $2,499 or less | 68 (4.1%) | 45 (2.8%) |
| $2,500 to $4,999 | 67 (4.1%) | 56 (3.5%) |
| $5,000 to $7,499 | 29 (1.8%) | 33 (2.1%) |
| $7,500 to $9,999 | 15 (0.9%) | 0 (0.0%) |
| $10,000 to $12,499 | 59 (3.6%) | 49 (3.1%) |
| $12,500 to $14,999 | 13 (0.8%) | 55 (3.4%) |
| $15,000 to $17,499 | 29 (1.8%) | 95 (5.9%) |
| $17,500 to $19,999 | 18 (1.1%) | 12 (0.7%) |
| $20,000 to $22,499 | 0 (0.0%) | 41 (2.6%) |
| $22,500 to $24,999 | 32 (1.9%) | 187 (11.7%) |
| $25,000 to $29,999 | 124 (7.5%) | 52 (3.3%) |
| $30,000 to $34,999 | 92 (5.6%) | 67 (4.2%) |
| $35,000 to $39,999 | 97 (5.9%) | 208 (13.0%) |
| $40,000 to $44,999 | 98 (6.0%) | 67 (4.2%) |
| $45,000 to $49,999 | 86 (5.2%) | 76 (4.8%) |
| $50,000 to $54,999 | 78 (4.7%) | 6 (0.4%) |
| $55,000 to $64,999 | 112 (6.8%) | 175 (10.9%) |
| $65,000 to $74,999 | 136 (8.3%) | 136 (8.5%) |
| $75,000 to $99,999 | 212 (12.9%) | 162 (10.1%) |
| $100,000+ | 279 (17.0%) | 79 (4.9%) |
| Total | 1,644 (100.0%) | 1,601 (100.0%) |
Earnings by Sex by Educational Attainment in Briar
Average earnings in Briar are $56,976 for men and $39,452 for women, a difference of 30.8%. Men with an educational attainment of bachelor's degree enjoy the highest average annual earnings of $79,432, while those with high school diploma education earn the least with $42,127. Women with an educational attainment of graduate degree earn the most with the average annual earnings of $72,332, while those with high school diploma education have the smallest earnings of $37,500.
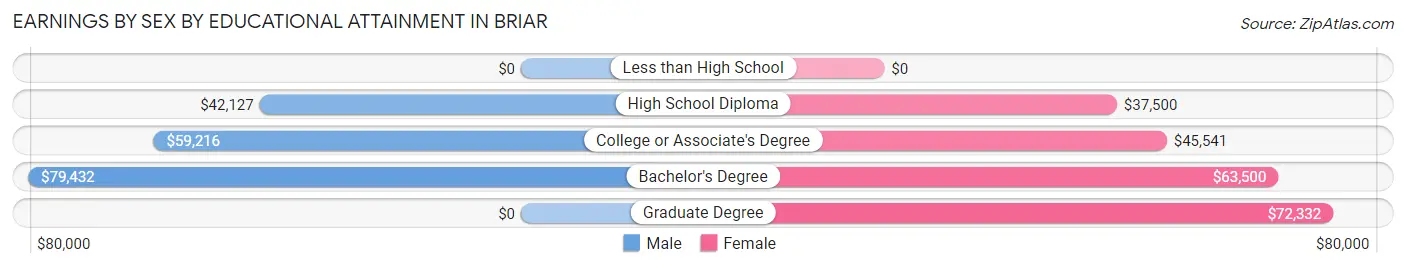
| Educational Attainment | Male Income | Female Income |
| Less than High School | - | - |
| High School Diploma | $42,127 | $37,500 |
| College or Associate's Degree | $59,216 | $45,541 |
| Bachelor's Degree | $79,432 | $63,500 |
| Graduate Degree | - | - |
| Total | $56,976 | $39,452 |
Family Income in Briar
Family Income Brackets in Briar
According to the Briar family income data, there are 390 families falling into the $150,000 to $199,999 income range, which is the most common income bracket and makes up 22.3% of all families. Conversely, the $10,000 to $14,999 income bracket is the least frequent group with only 26 families (1.5%) belonging to this category.
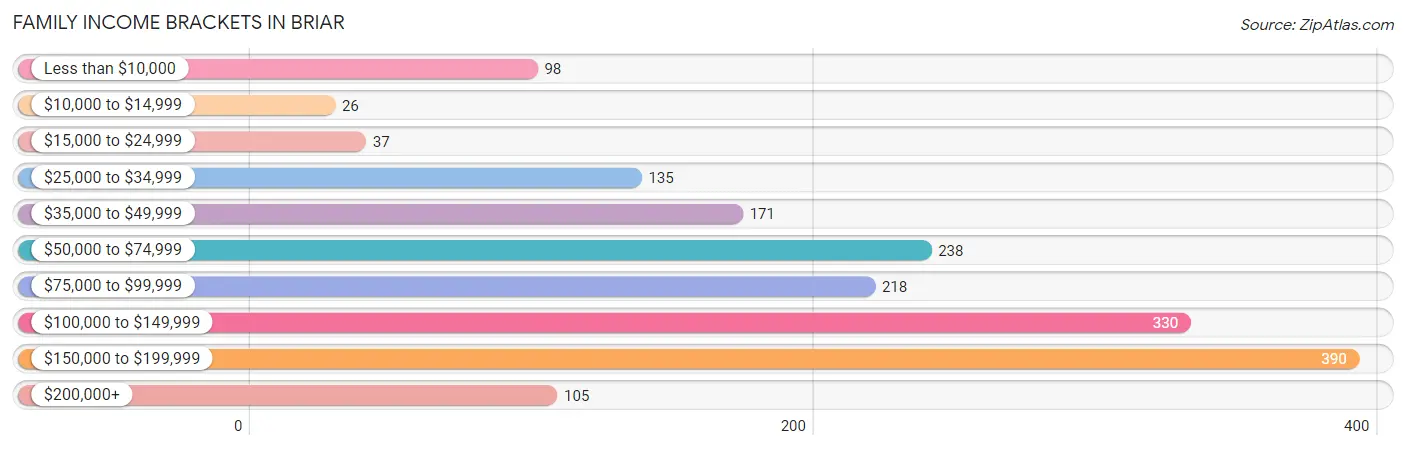
| Income Bracket | # Families | % Families |
| Less than $10,000 | 98 | 5.6% |
| $10,000 to $14,999 | 26 | 1.5% |
| $15,000 to $24,999 | 37 | 2.1% |
| $25,000 to $34,999 | 135 | 7.7% |
| $35,000 to $49,999 | 171 | 9.8% |
| $50,000 to $74,999 | 238 | 13.6% |
| $75,000 to $99,999 | 218 | 12.5% |
| $100,000 to $149,999 | 330 | 18.9% |
| $150,000 to $199,999 | 390 | 22.3% |
| $200,000+ | 105 | 6.0% |
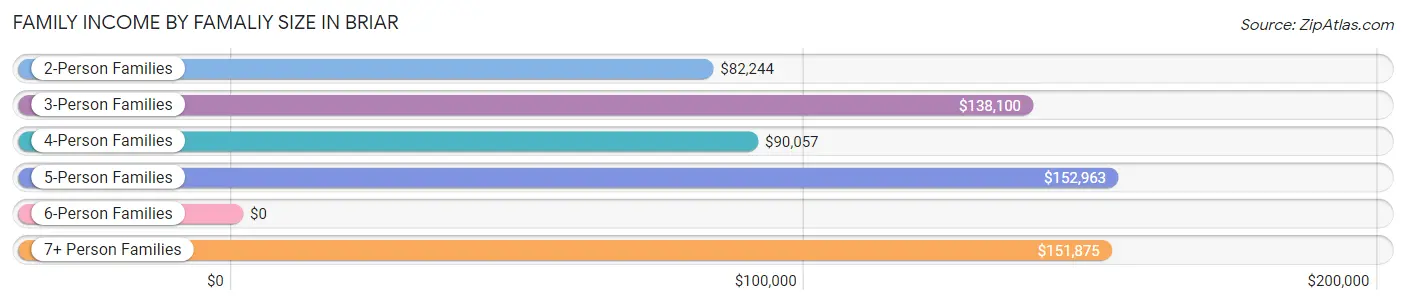
Family Income by Famaliy Size in Briar
5-person families (88 | 5.0%) account for the highest median family income in Briar with $152,963 per family, while 3-person families (310 | 17.7%) have the highest median income of $46,033 per family member.
| Income Bracket | # Families | Median Income |
| 2-Person Families | 841 (48.1%) | $82,244 |
| 3-Person Families | 310 (17.7%) | $138,100 |
| 4-Person Families | 469 (26.9%) | $90,057 |
| 5-Person Families | 88 (5.0%) | $152,963 |
| 6-Person Families | 10 (0.6%) | $0 |
| 7+ Person Families | 29 (1.7%) | $151,875 |
| Total | 1,747 (100.0%) | $93,646 |
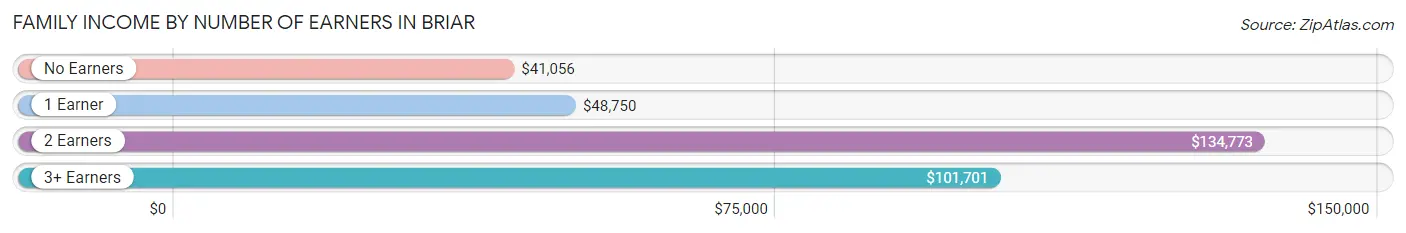
Family Income by Number of Earners in Briar
The median family income in Briar is $93,646, with families comprising 2 earners (756) having the highest median family income of $134,773, while families with no earners (256) have the lowest median family income of $41,056, accounting for 43.3% and 14.6% of families, respectively.
| Number of Earners | # Families | Median Income |
| No Earners | 256 (14.6%) | $41,056 |
| 1 Earner | 520 (29.8%) | $48,750 |
| 2 Earners | 756 (43.3%) | $134,773 |
| 3+ Earners | 215 (12.3%) | $101,701 |
| Total | 1,747 (100.0%) | $93,646 |
Household Income in Briar
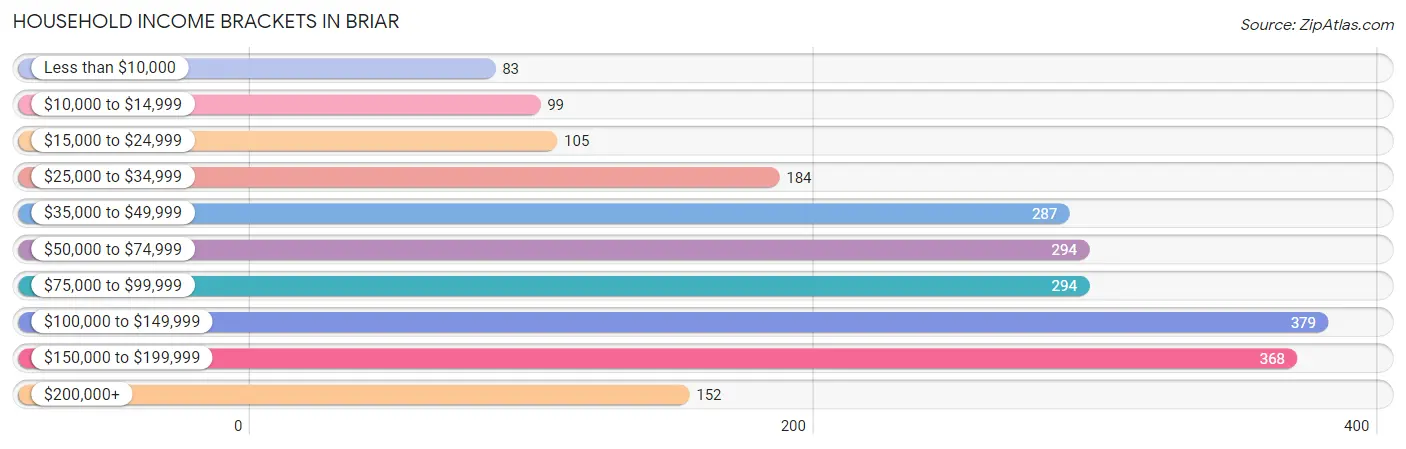
Household Income Brackets in Briar
With 379 households falling in the category, the $100,000 to $149,999 income range is the most frequent in Briar, accounting for 16.9% of all households. In contrast, only 83 households (3.7%) fall into the less than $10,000 income bracket, making it the least populous group.
| Income Bracket | # Households | % Households |
| Less than $10,000 | 83 | 3.7% |
| $10,000 to $14,999 | 99 | 4.4% |
| $15,000 to $24,999 | 105 | 4.7% |
| $25,000 to $34,999 | 184 | 8.2% |
| $35,000 to $49,999 | 287 | 12.8% |
| $50,000 to $74,999 | 294 | 13.1% |
| $75,000 to $99,999 | 294 | 13.1% |
| $100,000 to $149,999 | 379 | 16.9% |
| $150,000 to $199,999 | 368 | 16.4% |
| $200,000+ | 152 | 6.8% |
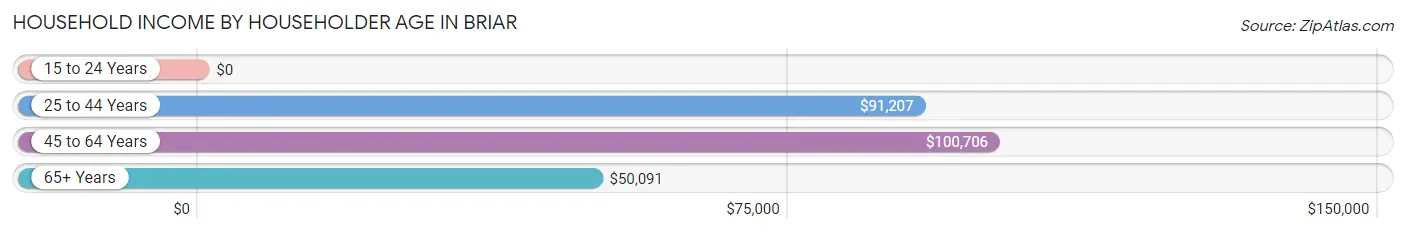
Household Income by Householder Age in Briar
The median household income in Briar is $80,486, with the highest median household income of $100,706 found in the 45 to 64 years age bracket for the primary householder. A total of 977 households (43.6%) fall into this category. Meanwhile, the 15 to 24 years age bracket for the primary householder has the lowest median household income of $0, with 83 households (3.7%) in this group.
| Income Bracket | # Households | Median Income |
| 15 to 24 Years | 83 (3.7%) | $0 |
| 25 to 44 Years | 618 (27.6%) | $91,207 |
| 45 to 64 Years | 977 (43.6%) | $100,706 |
| 65+ Years | 563 (25.1%) | $50,091 |
| Total | 2,241 (100.0%) | $80,486 |
Poverty in Briar
Income Below Poverty by Sex and Age in Briar
With 9.8% poverty level for males and 9.2% for females among the residents of Briar, under 5 year old males and 6 to 11 year old females are the most vulnerable to poverty, with 47 males (57.3%) and 50 females (35.2%) in their respective age groups living below the poverty level.
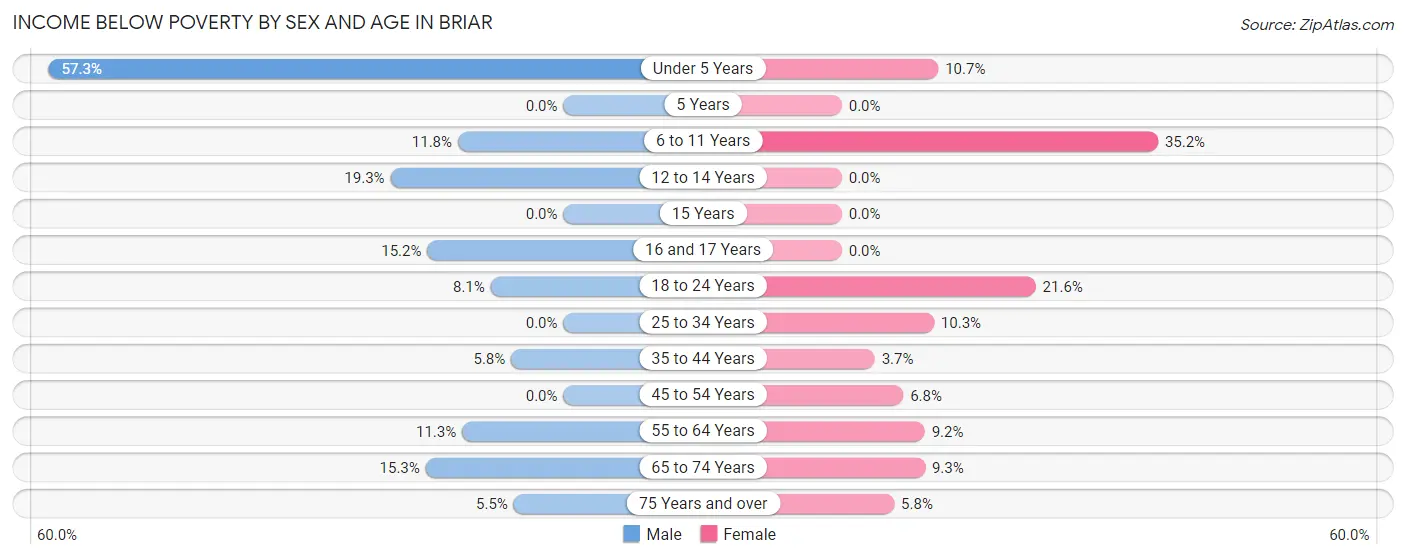
| Age Bracket | Male | Female |
| Under 5 Years | 47 (57.3%) | 13 (10.7%) |
| 5 Years | 0 (0.0%) | 0 (0.0%) |
| 6 to 11 Years | 37 (11.7%) | 50 (35.2%) |
| 12 to 14 Years | 26 (19.3%) | 0 (0.0%) |
| 15 Years | 0 (0.0%) | 0 (0.0%) |
| 16 and 17 Years | 20 (15.1%) | 0 (0.0%) |
| 18 to 24 Years | 26 (8.1%) | 57 (21.6%) |
| 25 to 34 Years | 0 (0.0%) | 44 (10.3%) |
| 35 to 44 Years | 29 (5.8%) | 16 (3.7%) |
| 45 to 54 Years | 0 (0.0%) | 36 (6.8%) |
| 55 to 64 Years | 61 (11.3%) | 52 (9.2%) |
| 65 to 74 Years | 29 (15.3%) | 15 (9.3%) |
| 75 Years and over | 11 (5.5%) | 20 (5.8%) |
| Total | 286 (9.8%) | 303 (9.2%) |
Income Above Poverty by Sex and Age in Briar
According to the poverty statistics in Briar, males aged 15 years and females aged 5 years are the age groups that are most secure financially, with 100.0% of males and 100.0% of females in these age groups living above the poverty line.
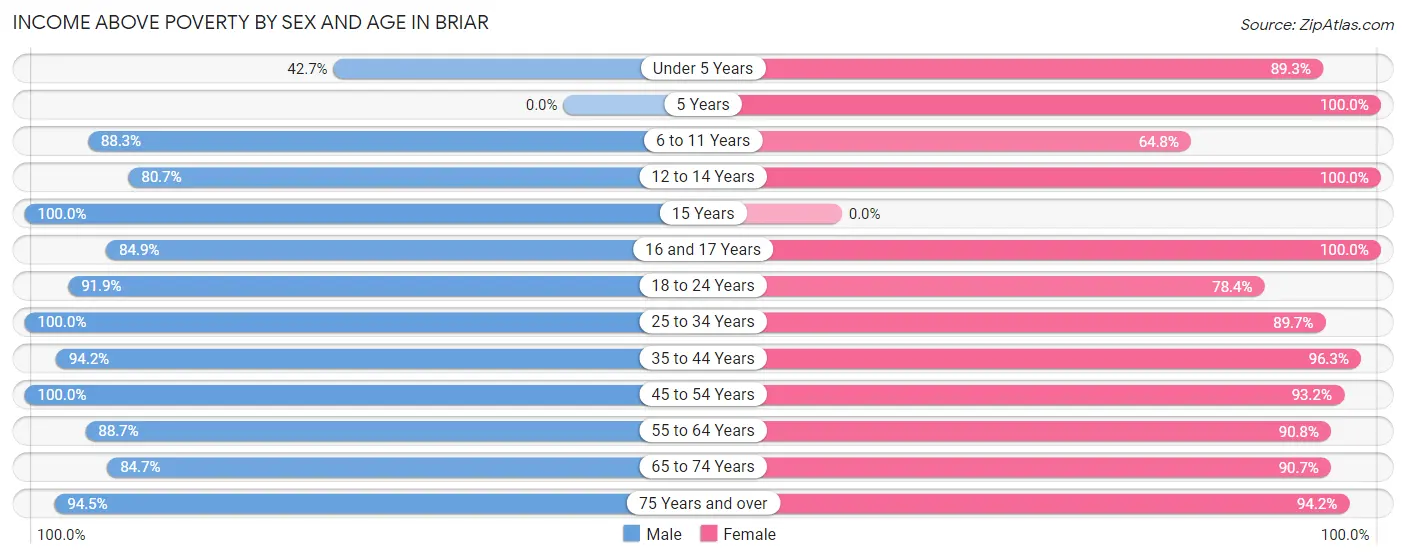
| Age Bracket | Male | Female |
| Under 5 Years | 35 (42.7%) | 108 (89.3%) |
| 5 Years | 0 (0.0%) | 33 (100.0%) |
| 6 to 11 Years | 278 (88.2%) | 92 (64.8%) |
| 12 to 14 Years | 109 (80.7%) | 233 (100.0%) |
| 15 Years | 25 (100.0%) | 0 (0.0%) |
| 16 and 17 Years | 112 (84.9%) | 52 (100.0%) |
| 18 to 24 Years | 295 (91.9%) | 207 (78.4%) |
| 25 to 34 Years | 235 (100.0%) | 385 (89.7%) |
| 35 to 44 Years | 469 (94.2%) | 420 (96.3%) |
| 45 to 54 Years | 251 (100.0%) | 490 (93.2%) |
| 55 to 64 Years | 480 (88.7%) | 511 (90.8%) |
| 65 to 74 Years | 160 (84.7%) | 147 (90.7%) |
| 75 Years and over | 188 (94.5%) | 323 (94.2%) |
| Total | 2,637 (90.2%) | 3,001 (90.8%) |
Income Below Poverty Among Married-Couple Families in Briar
The poverty statistics for married-couple families in Briar show that 4.6% or 61 of the total 1,316 families live below the poverty line. Families with 1 or 2 children have the highest poverty rate of 5.0%, comprising of 20 families. On the other hand, families with 3 or 4 children have the lowest poverty rate of 0.0%, which includes 0 families.
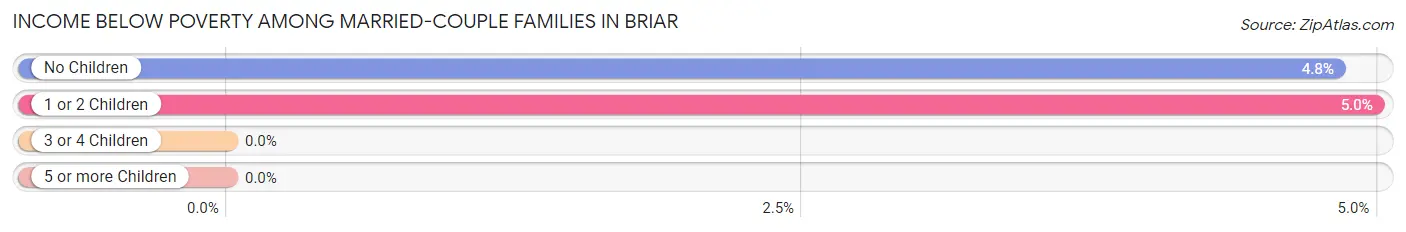
| Children | Above Poverty | Below Poverty |
| No Children | 810 (95.2%) | 41 (4.8%) |
| 1 or 2 Children | 381 (95.0%) | 20 (5.0%) |
| 3 or 4 Children | 64 (100.0%) | 0 (0.0%) |
| 5 or more Children | 0 (0.0%) | 0 (0.0%) |
| Total | 1,255 (95.4%) | 61 (4.6%) |
Income Below Poverty Among Single-Parent Households in Briar
According to the poverty data in Briar, 40.3% or 29 single-father households and 9.5% or 34 single-mother households are living below the poverty line. Among single-father households, those with 3 or 4 children have the highest poverty rate, with 29 households (70.7%) experiencing poverty. Likewise, among single-mother households, those with 3 or 4 children have the highest poverty rate, with 13 households (39.4%) falling below the poverty line.
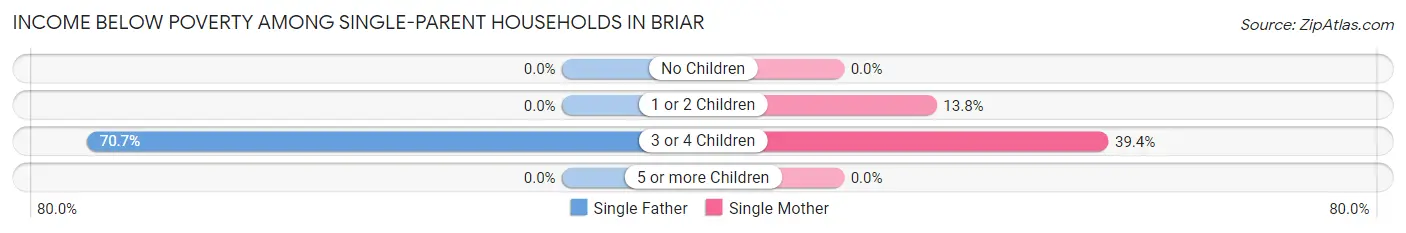
| Children | Single Father | Single Mother |
| No Children | 0 (0.0%) | 0 (0.0%) |
| 1 or 2 Children | 0 (0.0%) | 21 (13.8%) |
| 3 or 4 Children | 29 (70.7%) | 13 (39.4%) |
| 5 or more Children | 0 (0.0%) | 0 (0.0%) |
| Total | 29 (40.3%) | 34 (9.5%) |
Income Below Poverty Among Married-Couple vs Single-Parent Households in Briar
The poverty data for Briar shows that 61 of the married-couple family households (4.6%) and 63 of the single-parent households (14.6%) are living below the poverty level. Within the married-couple family households, those with 1 or 2 children have the highest poverty rate, with 20 households (5.0%) falling below the poverty line. Among the single-parent households, those with 3 or 4 children have the highest poverty rate, with 42 household (56.8%) living below poverty.
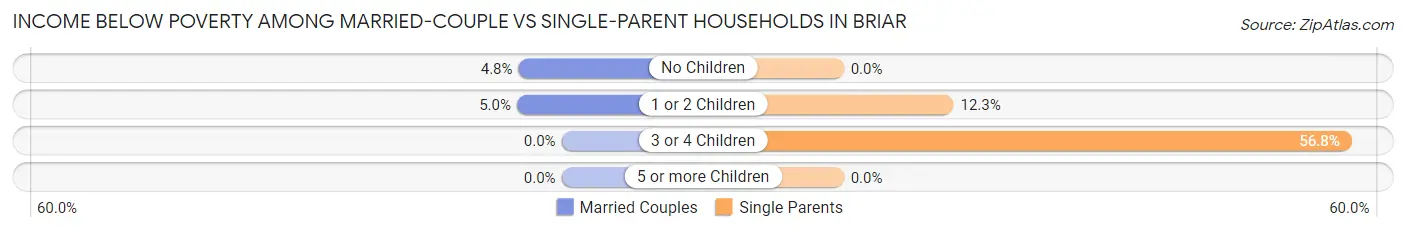
| Children | Married-Couple Families | Single-Parent Households |
| No Children | 41 (4.8%) | 0 (0.0%) |
| 1 or 2 Children | 20 (5.0%) | 21 (12.3%) |
| 3 or 4 Children | 0 (0.0%) | 42 (56.8%) |
| 5 or more Children | 0 (0.0%) | 0 (0.0%) |
| Total | 61 (4.6%) | 63 (14.6%) |
Employment Characteristics in Briar
Employment by Class of Employer in Briar
Among the 3,042 employed individuals in Briar, private company employees (2,354 | 77.4%), self-employed (not incorporated) (189 | 6.2%), and local government employees (155 | 5.1%) make up the most common classes of employment.
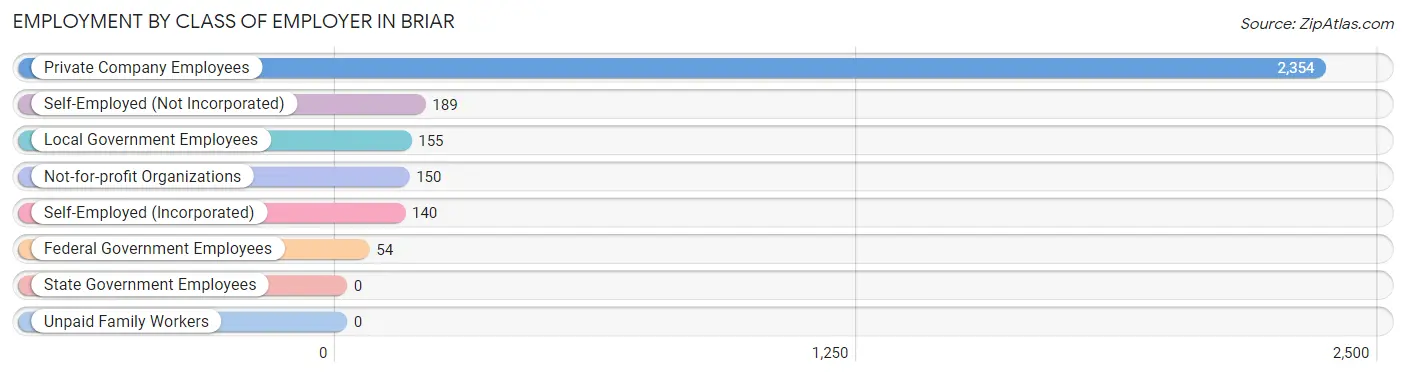
| Employer Class | # Employees | % Employees |
| Private Company Employees | 2,354 | 77.4% |
| Self-Employed (Incorporated) | 140 | 4.6% |
| Self-Employed (Not Incorporated) | 189 | 6.2% |
| Not-for-profit Organizations | 150 | 4.9% |
| Local Government Employees | 155 | 5.1% |
| State Government Employees | 0 | 0.0% |
| Federal Government Employees | 54 | 1.8% |
| Unpaid Family Workers | 0 | 0.0% |
| Total | 3,042 | 100.0% |
Employment Status by Age in Briar
According to the labor force statistics for Briar, out of the total population over 16 years of age (5,141), 61.1% or 3,141 individuals are in the labor force, with 3.2% or 101 of them unemployed. The age group with the highest labor force participation rate is 45 to 54 years, with 91.9% or 714 individuals in the labor force. Within the labor force, the 55 to 59 years age range has the highest percentage of unemployed individuals, with 13.2% or 58 of them being unemployed.
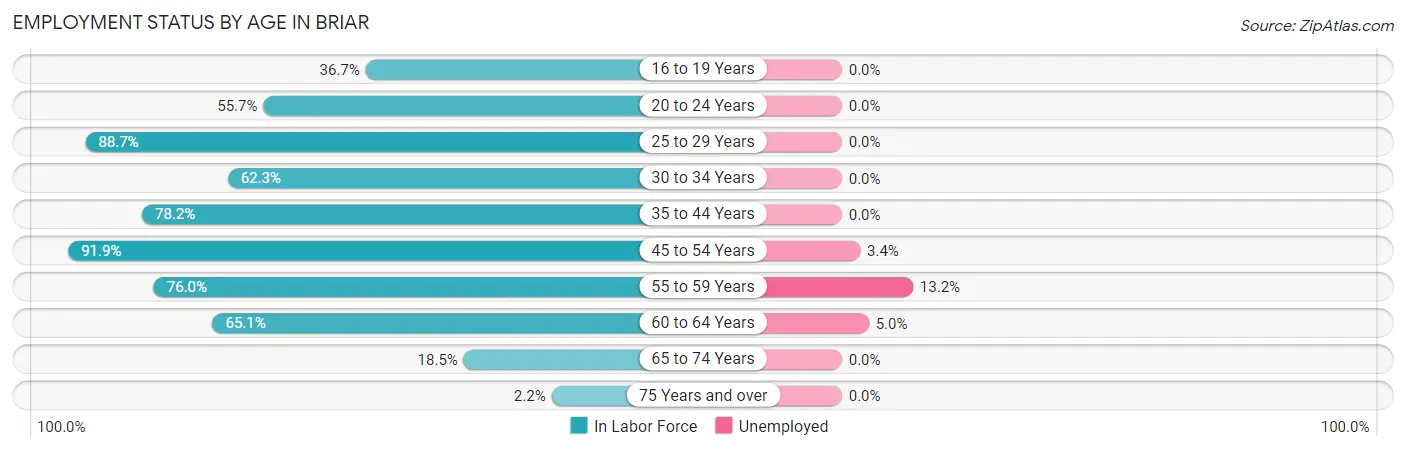
| Age Bracket | In Labor Force | Unemployed |
| 16 to 19 Years | 147 (36.7%) | 0 (0.0%) |
| 20 to 24 Years | 205 (55.7%) | 0 (0.0%) |
| 25 to 29 Years | 243 (88.7%) | 0 (0.0%) |
| 30 to 34 Years | 243 (62.3%) | 0 (0.0%) |
| 35 to 44 Years | 730 (78.2%) | 0 (0.0%) |
| 45 to 54 Years | 714 (91.9%) | 24 (3.4%) |
| 55 to 59 Years | 441 (76.0%) | 58 (13.2%) |
| 60 to 64 Years | 341 (65.1%) | 17 (5.0%) |
| 65 to 74 Years | 65 (18.5%) | 0 (0.0%) |
| 75 Years and over | 12 (2.2%) | 0 (0.0%) |
| Total | 3,141 (61.1%) | 101 (3.2%) |
Employment Status by Educational Attainment in Briar
According to labor force statistics for Briar, 78.0% of individuals (2,714) out of the total population between 25 and 64 years of age (3,479) are in the labor force, with 3.7% or 100 of them being unemployed. The group with the highest labor force participation rate are those with the educational attainment of college / associate degree, with 90.5% or 981 individuals in the labor force. Within the labor force, individuals with college / associate degree education have the highest percentage of unemployment, with 9.6% or 94 of them being unemployed.
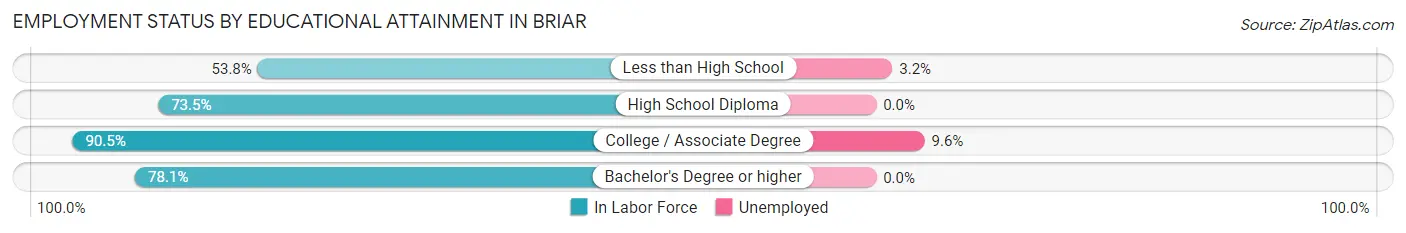
| Educational Attainment | In Labor Force | Unemployed |
| Less than High School | 156 (53.8%) | 9 (3.2%) |
| High School Diploma | 1,100 (73.5%) | 0 (0.0%) |
| College / Associate Degree | 981 (90.5%) | 104 (9.6%) |
| Bachelor's Degree or higher | 475 (78.1%) | 0 (0.0%) |
| Total | 2,714 (78.0%) | 129 (3.7%) |
Employment Occupations by Sex in Briar
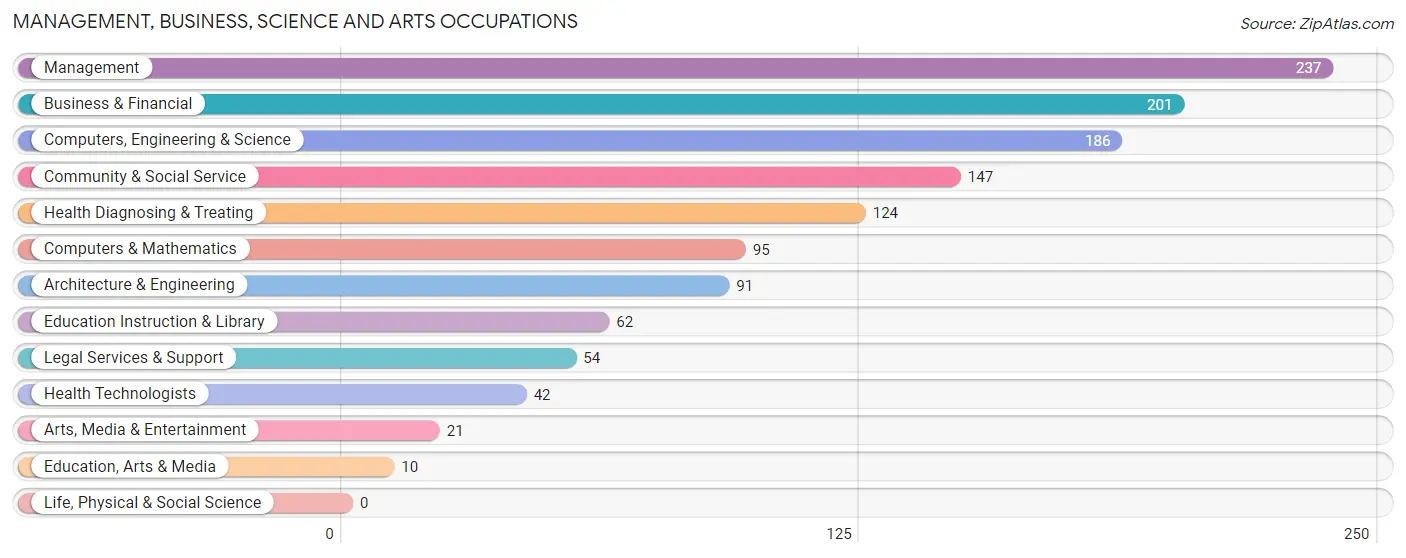
Management, Business, Science and Arts Occupations
The most common Management, Business, Science and Arts occupations in Briar are Management (237 | 7.8%), Business & Financial (201 | 6.6%), Computers, Engineering & Science (186 | 6.1%), Community & Social Service (147 | 4.8%), and Health Diagnosing & Treating (124 | 4.1%).
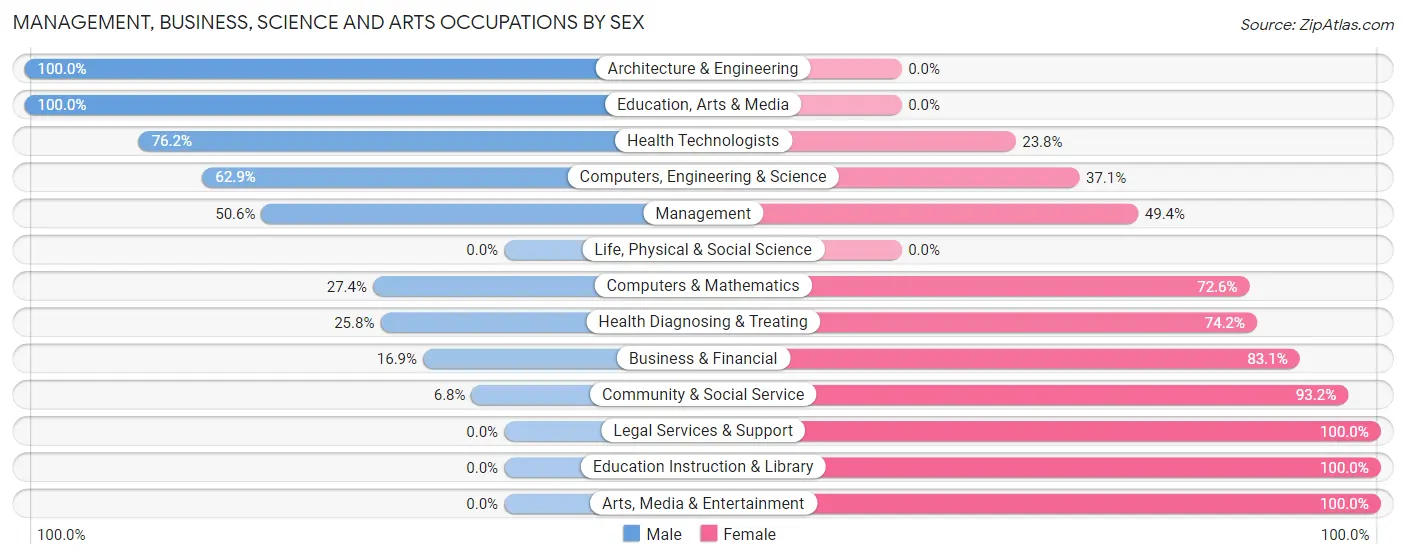
Management, Business, Science and Arts Occupations by Sex
Within the Management, Business, Science and Arts occupations in Briar, the most male-oriented occupations are Architecture & Engineering (100.0%), Education, Arts & Media (100.0%), and Health Technologists (76.2%), while the most female-oriented occupations are Legal Services & Support (100.0%), Education Instruction & Library (100.0%), and Arts, Media & Entertainment (100.0%).
| Occupation | Male | Female |
| Management | 120 (50.6%) | 117 (49.4%) |
| Business & Financial | 34 (16.9%) | 167 (83.1%) |
| Computers, Engineering & Science | 117 (62.9%) | 69 (37.1%) |
| Computers & Mathematics | 26 (27.4%) | 69 (72.6%) |
| Architecture & Engineering | 91 (100.0%) | 0 (0.0%) |
| Life, Physical & Social Science | 0 (0.0%) | 0 (0.0%) |
| Community & Social Service | 10 (6.8%) | 137 (93.2%) |
| Education, Arts & Media | 10 (100.0%) | 0 (0.0%) |
| Legal Services & Support | 0 (0.0%) | 54 (100.0%) |
| Education Instruction & Library | 0 (0.0%) | 62 (100.0%) |
| Arts, Media & Entertainment | 0 (0.0%) | 21 (100.0%) |
| Health Diagnosing & Treating | 32 (25.8%) | 92 (74.2%) |
| Health Technologists | 32 (76.2%) | 10 (23.8%) |
| Total (Category) | 313 (35.0%) | 582 (65.0%) |
| Total (Overall) | 1,539 (50.6%) | 1,503 (49.4%) |
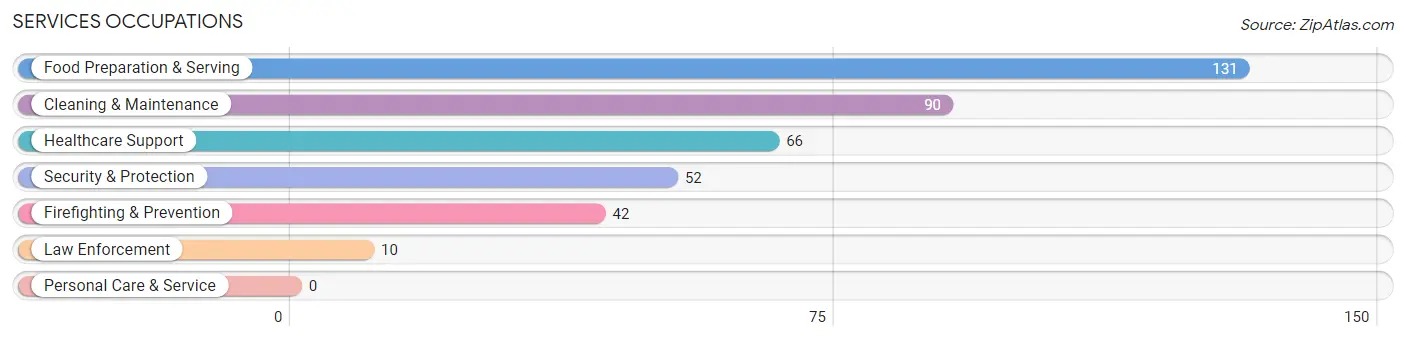
Services Occupations
The most common Services occupations in Briar are Food Preparation & Serving (131 | 4.3%), Cleaning & Maintenance (90 | 3.0%), Healthcare Support (66 | 2.2%), Security & Protection (52 | 1.7%), and Firefighting & Prevention (42 | 1.4%).
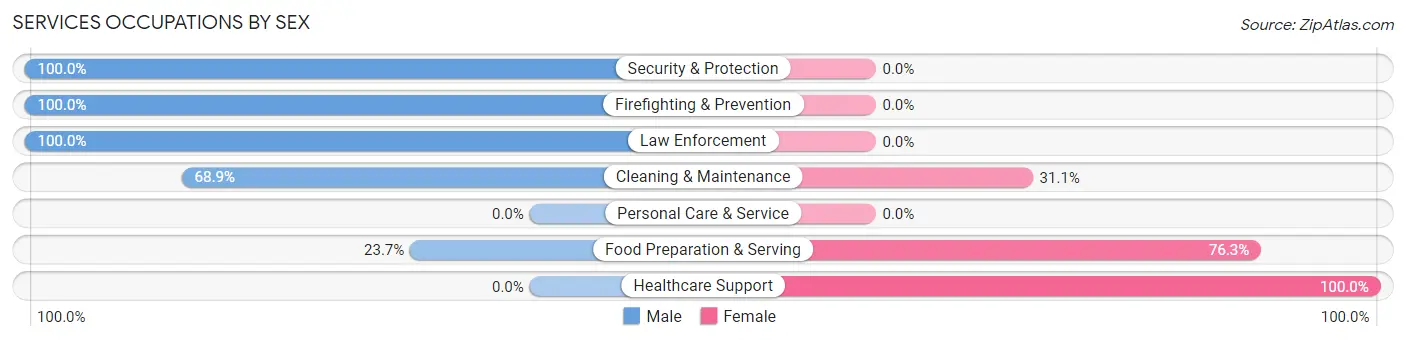
Services Occupations by Sex
Within the Services occupations in Briar, the most male-oriented occupations are Security & Protection (100.0%), Firefighting & Prevention (100.0%), and Law Enforcement (100.0%), while the most female-oriented occupations are Healthcare Support (100.0%), Food Preparation & Serving (76.3%), and Cleaning & Maintenance (31.1%).
| Occupation | Male | Female |
| Healthcare Support | 0 (0.0%) | 66 (100.0%) |
| Security & Protection | 52 (100.0%) | 0 (0.0%) |
| Firefighting & Prevention | 42 (100.0%) | 0 (0.0%) |
| Law Enforcement | 10 (100.0%) | 0 (0.0%) |
| Food Preparation & Serving | 31 (23.7%) | 100 (76.3%) |
| Cleaning & Maintenance | 62 (68.9%) | 28 (31.1%) |
| Personal Care & Service | 0 (0.0%) | 0 (0.0%) |
| Total (Category) | 145 (42.8%) | 194 (57.2%) |
| Total (Overall) | 1,539 (50.6%) | 1,503 (49.4%) |
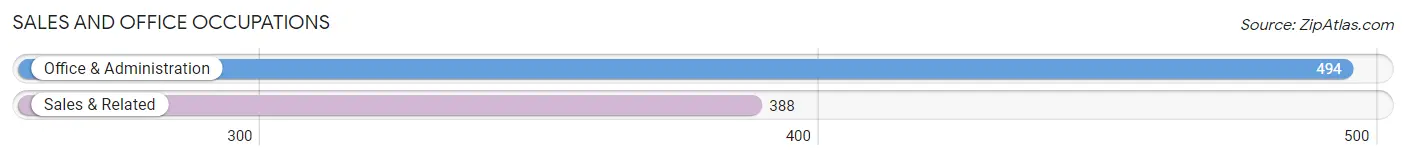
Sales and Office Occupations
The most common Sales and Office occupations in Briar are Office & Administration (494 | 16.2%), and Sales & Related (388 | 12.8%).
Sales and Office Occupations by Sex
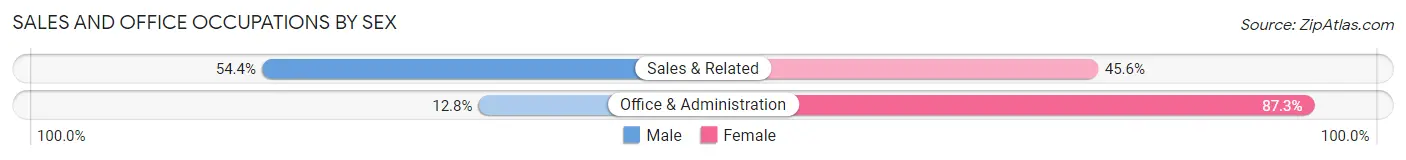
| Occupation | Male | Female |
| Sales & Related | 211 (54.4%) | 177 (45.6%) |
| Office & Administration | 63 (12.8%) | 431 (87.3%) |
| Total (Category) | 274 (31.1%) | 608 (68.9%) |
| Total (Overall) | 1,539 (50.6%) | 1,503 (49.4%) |
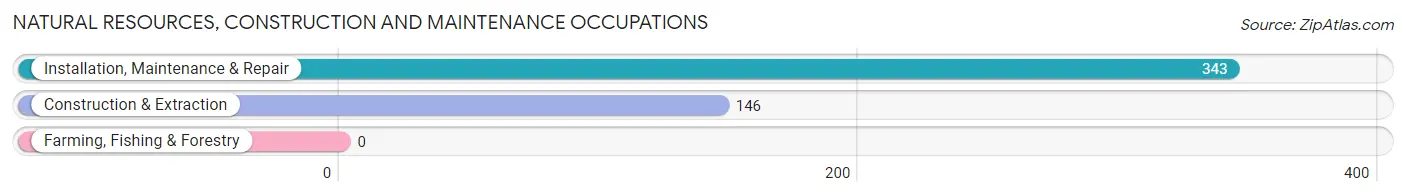
Natural Resources, Construction and Maintenance Occupations
The most common Natural Resources, Construction and Maintenance occupations in Briar are Installation, Maintenance & Repair (343 | 11.3%), and Construction & Extraction (146 | 4.8%).
Natural Resources, Construction and Maintenance Occupations by Sex
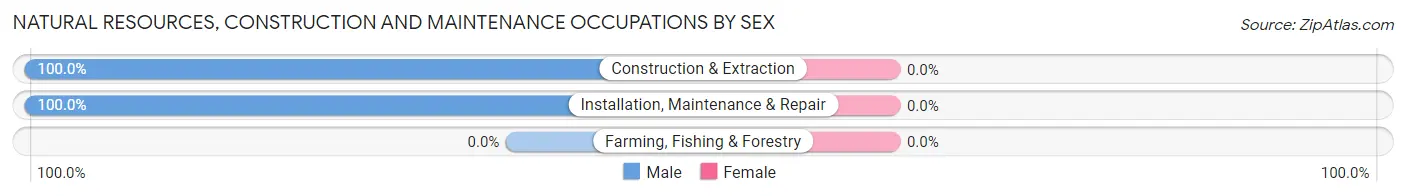
| Occupation | Male | Female |
| Farming, Fishing & Forestry | 0 (0.0%) | 0 (0.0%) |
| Construction & Extraction | 146 (100.0%) | 0 (0.0%) |
| Installation, Maintenance & Repair | 343 (100.0%) | 0 (0.0%) |
| Total (Category) | 489 (100.0%) | 0 (0.0%) |
| Total (Overall) | 1,539 (50.6%) | 1,503 (49.4%) |
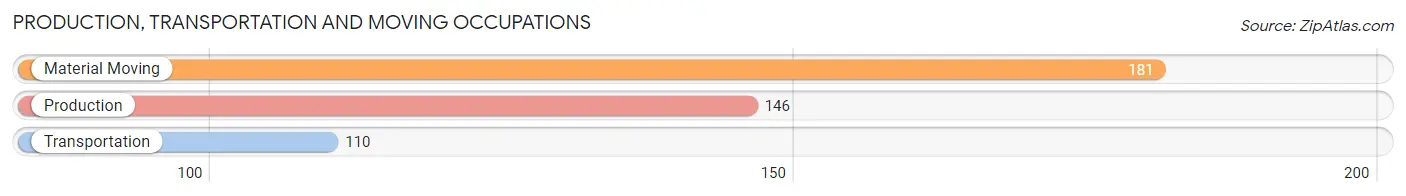
Production, Transportation and Moving Occupations
The most common Production, Transportation and Moving occupations in Briar are Material Moving (181 | 5.9%), Production (146 | 4.8%), and Transportation (110 | 3.6%).
Production, Transportation and Moving Occupations by Sex
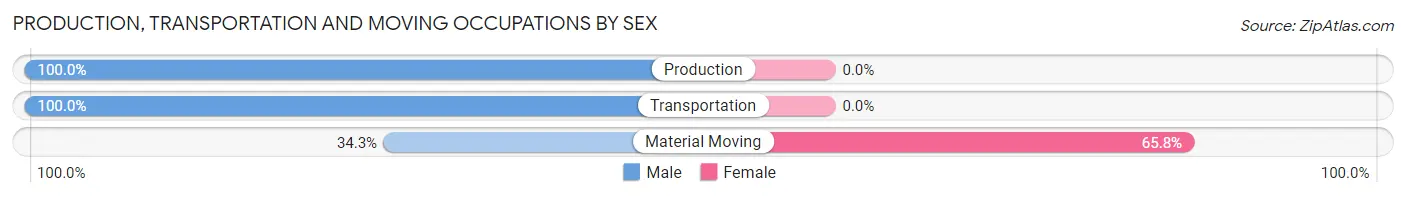
| Occupation | Male | Female |
| Production | 146 (100.0%) | 0 (0.0%) |
| Transportation | 110 (100.0%) | 0 (0.0%) |
| Material Moving | 62 (34.3%) | 119 (65.7%) |
| Total (Category) | 318 (72.8%) | 119 (27.2%) |
| Total (Overall) | 1,539 (50.6%) | 1,503 (49.4%) |
Employment Industries by Sex in Briar
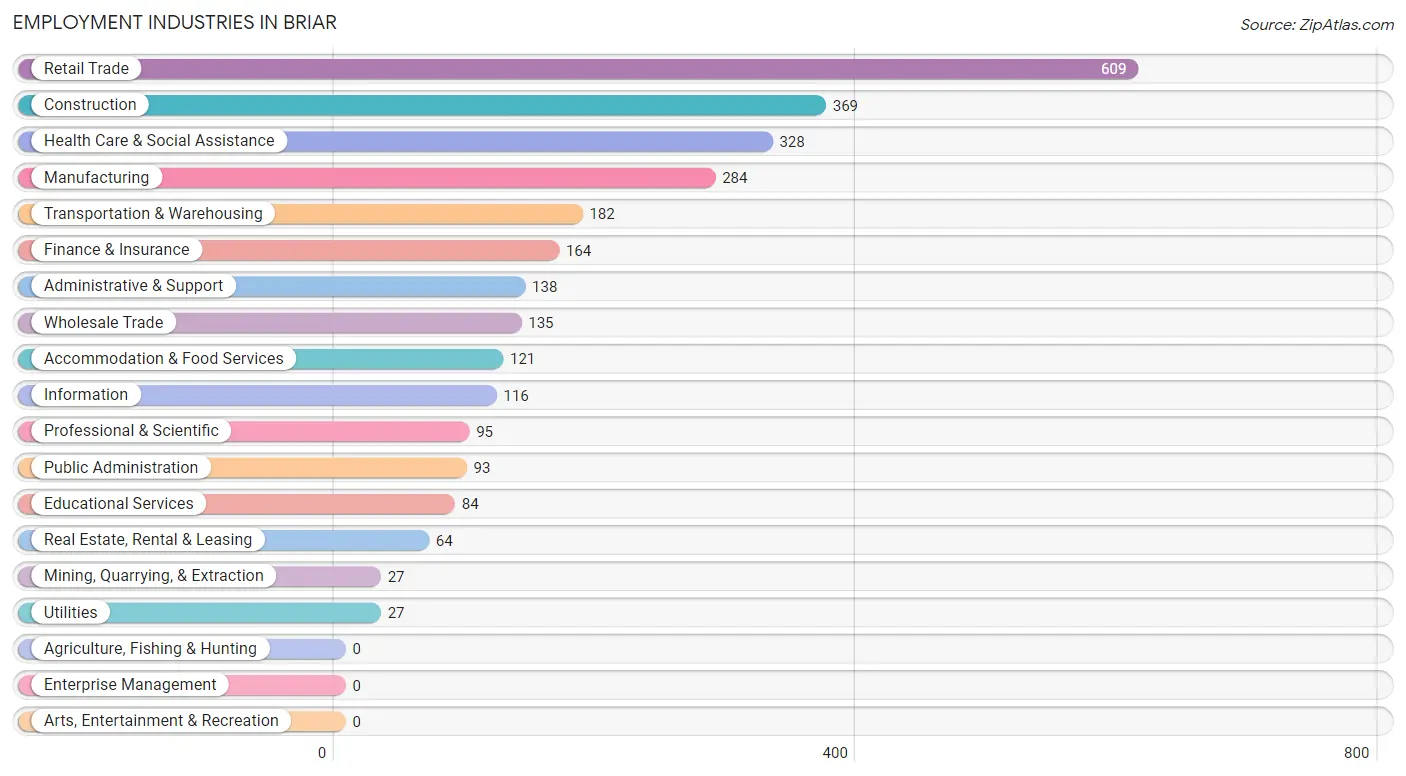
Employment Industries in Briar
The major employment industries in Briar include Retail Trade (609 | 20.0%), Construction (369 | 12.1%), Health Care & Social Assistance (328 | 10.8%), Manufacturing (284 | 9.3%), and Transportation & Warehousing (182 | 6.0%).
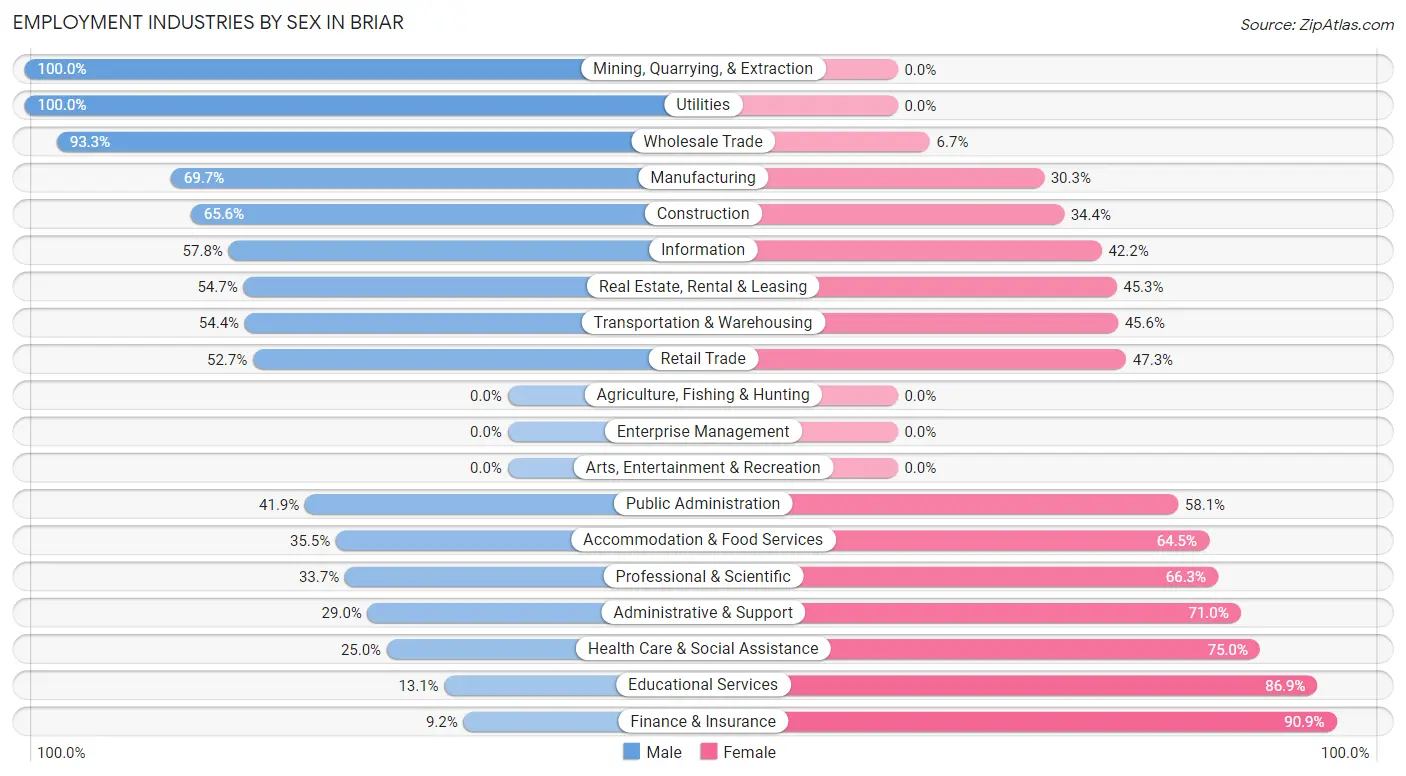
Employment Industries by Sex in Briar
The Briar industries that see more men than women are Mining, Quarrying, & Extraction (100.0%), Utilities (100.0%), and Wholesale Trade (93.3%), whereas the industries that tend to have a higher number of women are Finance & Insurance (90.8%), Educational Services (86.9%), and Health Care & Social Assistance (75.0%).
| Industry | Male | Female |
| Agriculture, Fishing & Hunting | 0 (0.0%) | 0 (0.0%) |
| Mining, Quarrying, & Extraction | 27 (100.0%) | 0 (0.0%) |
| Construction | 242 (65.6%) | 127 (34.4%) |
| Manufacturing | 198 (69.7%) | 86 (30.3%) |
| Wholesale Trade | 126 (93.3%) | 9 (6.7%) |
| Retail Trade | 321 (52.7%) | 288 (47.3%) |
| Transportation & Warehousing | 99 (54.4%) | 83 (45.6%) |
| Utilities | 27 (100.0%) | 0 (0.0%) |
| Information | 67 (57.8%) | 49 (42.2%) |
| Finance & Insurance | 15 (9.1%) | 149 (90.8%) |
| Real Estate, Rental & Leasing | 35 (54.7%) | 29 (45.3%) |
| Professional & Scientific | 32 (33.7%) | 63 (66.3%) |
| Enterprise Management | 0 (0.0%) | 0 (0.0%) |
| Administrative & Support | 40 (29.0%) | 98 (71.0%) |
| Educational Services | 11 (13.1%) | 73 (86.9%) |
| Health Care & Social Assistance | 82 (25.0%) | 246 (75.0%) |
| Arts, Entertainment & Recreation | 0 (0.0%) | 0 (0.0%) |
| Accommodation & Food Services | 43 (35.5%) | 78 (64.5%) |
| Public Administration | 39 (41.9%) | 54 (58.1%) |
| Total | 1,539 (50.6%) | 1,503 (49.4%) |
Education in Briar
School Enrollment in Briar
The most common levels of schooling among the 1,557 students in Briar are middle school (530 | 34.0%), high school (333 | 21.4%), and college / undergraduate (284 | 18.2%).
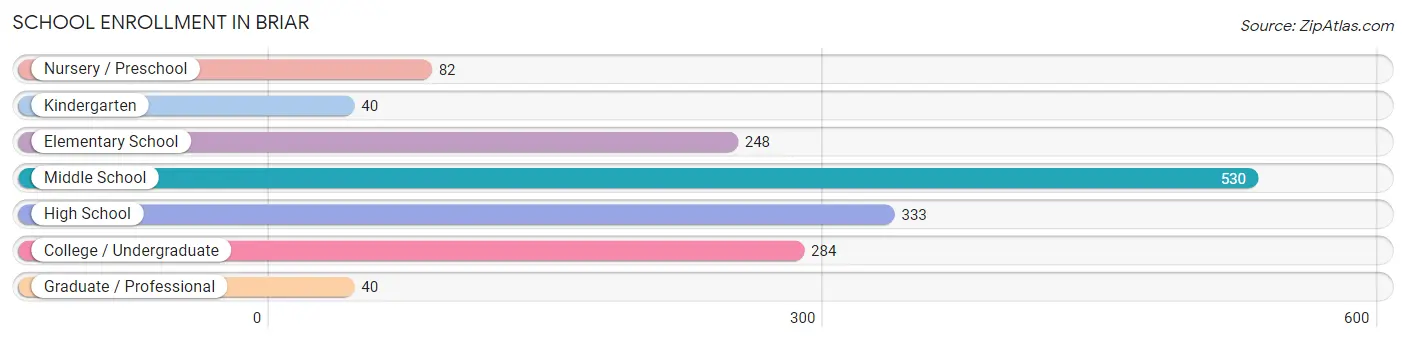
| School Level | # Students | % Students |
| Nursery / Preschool | 82 | 5.3% |
| Kindergarten | 40 | 2.6% |
| Elementary School | 248 | 15.9% |
| Middle School | 530 | 34.0% |
| High School | 333 | 21.4% |
| College / Undergraduate | 284 | 18.2% |
| Graduate / Professional | 40 | 2.6% |
| Total | 1,557 | 100.0% |
School Enrollment by Age by Funding Source in Briar
Out of a total of 1,557 students who are enrolled in schools in Briar, 140 (9.0%) attend a private institution, while the remaining 1,417 (91.0%) are enrolled in public schools. The age group of 35 years and over has the highest likelihood of being enrolled in private schools, with 22 (78.6% in the age bracket) enrolled. Conversely, the age group of 15 to 17 year olds has the lowest likelihood of being enrolled in a private school, with 209 (100.0% in the age bracket) attending a public institution.
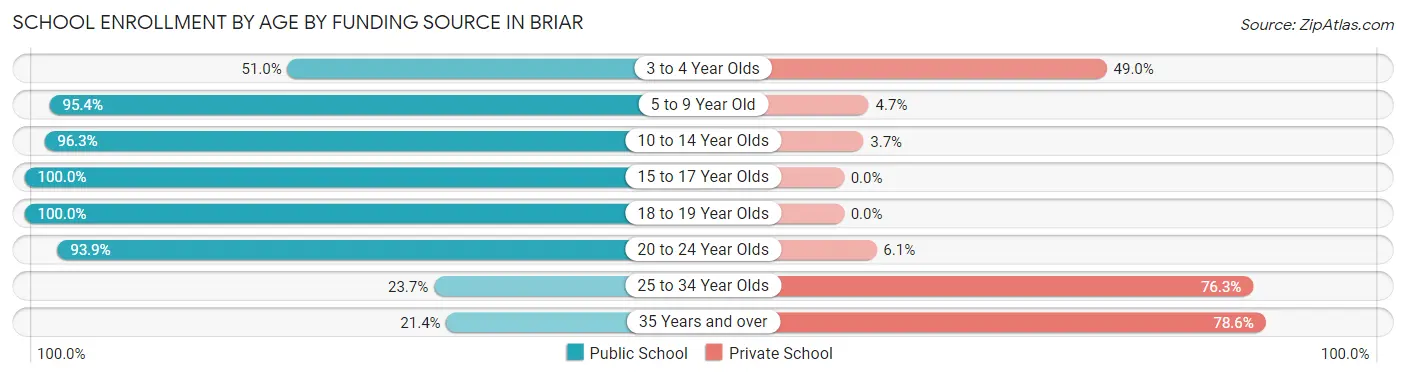
| Age Bracket | Public School | Private School |
| 3 to 4 Year Olds | 25 (51.0%) | 24 (49.0%) |
| 5 to 9 Year Old | 246 (95.4%) | 12 (4.6%) |
| 10 to 14 Year Olds | 578 (96.3%) | 22 (3.7%) |
| 15 to 17 Year Olds | 209 (100.0%) | 0 (0.0%) |
| 18 to 19 Year Olds | 108 (100.0%) | 0 (0.0%) |
| 20 to 24 Year Olds | 231 (93.9%) | 15 (6.1%) |
| 25 to 34 Year Olds | 14 (23.7%) | 45 (76.3%) |
| 35 Years and over | 6 (21.4%) | 22 (78.6%) |
| Total | 1,417 (91.0%) | 140 (9.0%) |
Educational Attainment by Field of Study in Briar
Business (261 | 33.3%), science & technology (135 | 17.2%), education (107 | 13.7%), arts & humanities (87 | 11.1%), and social sciences (69 | 8.8%) are the most common fields of study among 783 individuals in Briar who have obtained a bachelor's degree or higher.
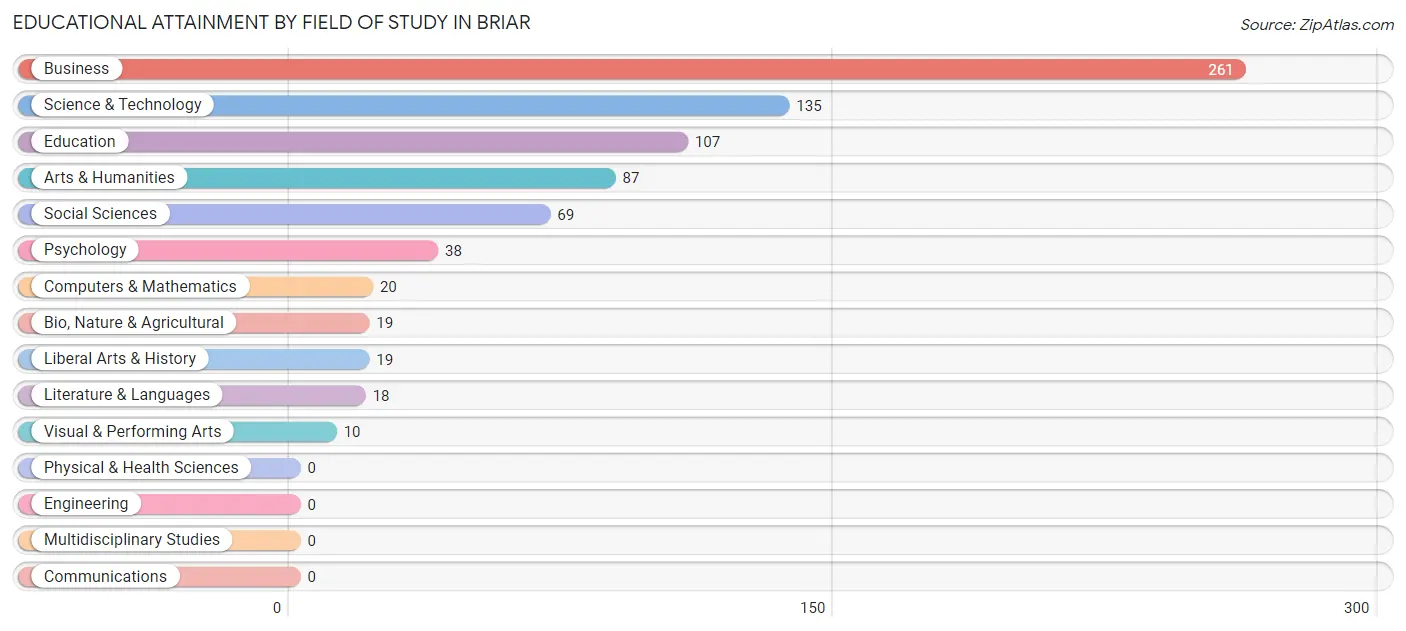
| Field of Study | # Graduates | % Graduates |
| Computers & Mathematics | 20 | 2.5% |
| Bio, Nature & Agricultural | 19 | 2.4% |
| Physical & Health Sciences | 0 | 0.0% |
| Psychology | 38 | 4.9% |
| Social Sciences | 69 | 8.8% |
| Engineering | 0 | 0.0% |
| Multidisciplinary Studies | 0 | 0.0% |
| Science & Technology | 135 | 17.2% |
| Business | 261 | 33.3% |
| Education | 107 | 13.7% |
| Literature & Languages | 18 | 2.3% |
| Liberal Arts & History | 19 | 2.4% |
| Visual & Performing Arts | 10 | 1.3% |
| Communications | 0 | 0.0% |
| Arts & Humanities | 87 | 11.1% |
| Total | 783 | 100.0% |
Transportation & Commute in Briar
Vehicle Availability by Sex in Briar
The most prevalent vehicle ownership categories in Briar are males with 2 vehicles (684, accounting for 44.4%) and females with 2 vehicles (563, making up 45.5%).
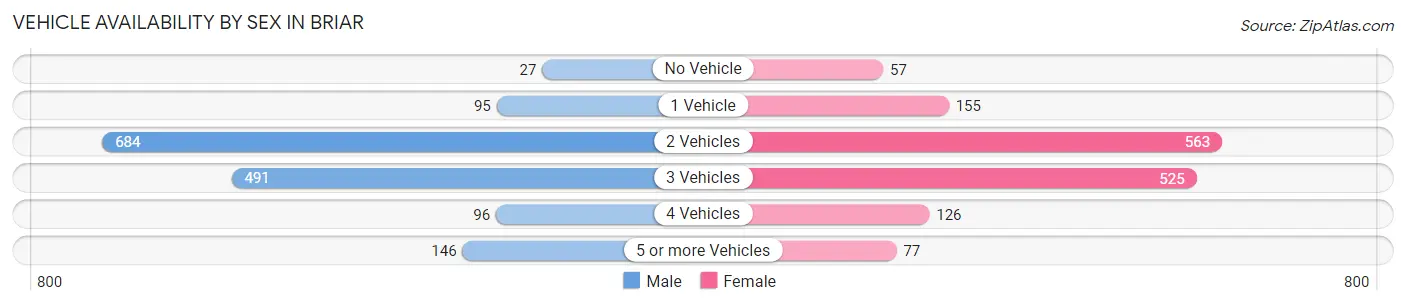
| Vehicles Available | Male | Female |
| No Vehicle | 27 (1.8%) | 57 (3.8%) |
| 1 Vehicle | 95 (6.2%) | 155 (10.3%) |
| 2 Vehicles | 684 (44.4%) | 563 (37.5%) |
| 3 Vehicles | 491 (31.9%) | 525 (34.9%) |
| 4 Vehicles | 96 (6.2%) | 126 (8.4%) |
| 5 or more Vehicles | 146 (9.5%) | 77 (5.1%) |
| Total | 1,539 (100.0%) | 1,503 (100.0%) |
Commute Time in Briar
The most frequently occuring commute durations in Briar are 45 to 59 minutes (681 commuters, 24.8%), 30 to 34 minutes (537 commuters, 19.6%), and 60 to 89 minutes (420 commuters, 15.3%).
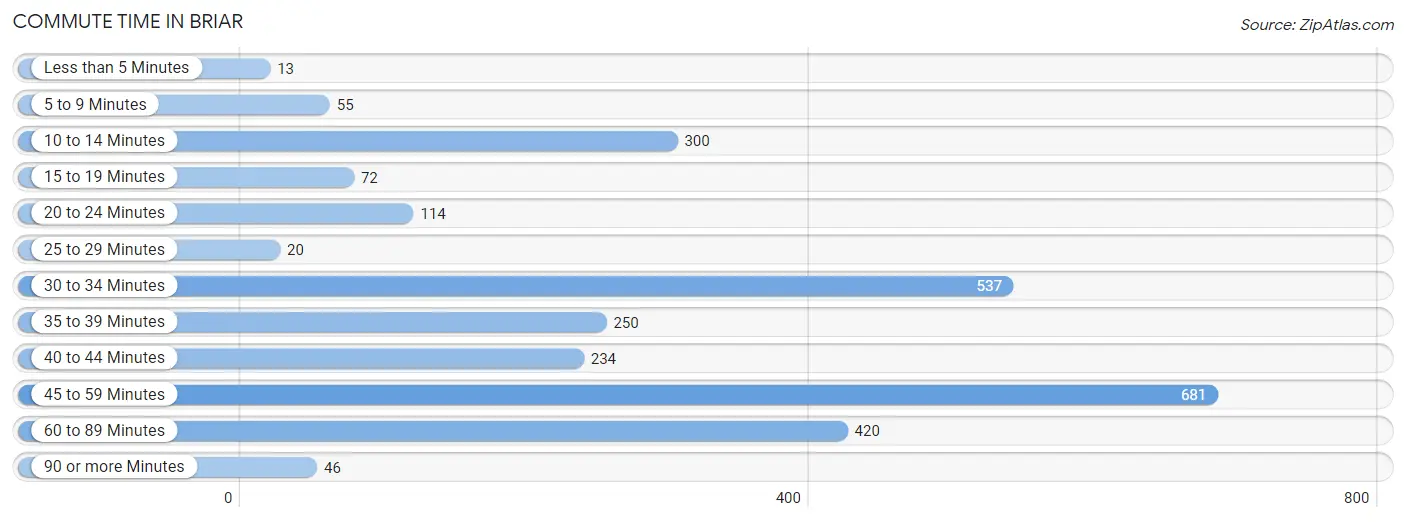
| Commute Time | # Commuters | % Commuters |
| Less than 5 Minutes | 13 | 0.5% |
| 5 to 9 Minutes | 55 | 2.0% |
| 10 to 14 Minutes | 300 | 10.9% |
| 15 to 19 Minutes | 72 | 2.6% |
| 20 to 24 Minutes | 114 | 4.2% |
| 25 to 29 Minutes | 20 | 0.7% |
| 30 to 34 Minutes | 537 | 19.6% |
| 35 to 39 Minutes | 250 | 9.1% |
| 40 to 44 Minutes | 234 | 8.5% |
| 45 to 59 Minutes | 681 | 24.8% |
| 60 to 89 Minutes | 420 | 15.3% |
| 90 or more Minutes | 46 | 1.7% |
Commute Time by Sex in Briar
The most common commute times in Briar are 45 to 59 minutes (384 commuters, 27.2%) for males and 30 to 34 minutes (299 commuters, 22.5%) for females.
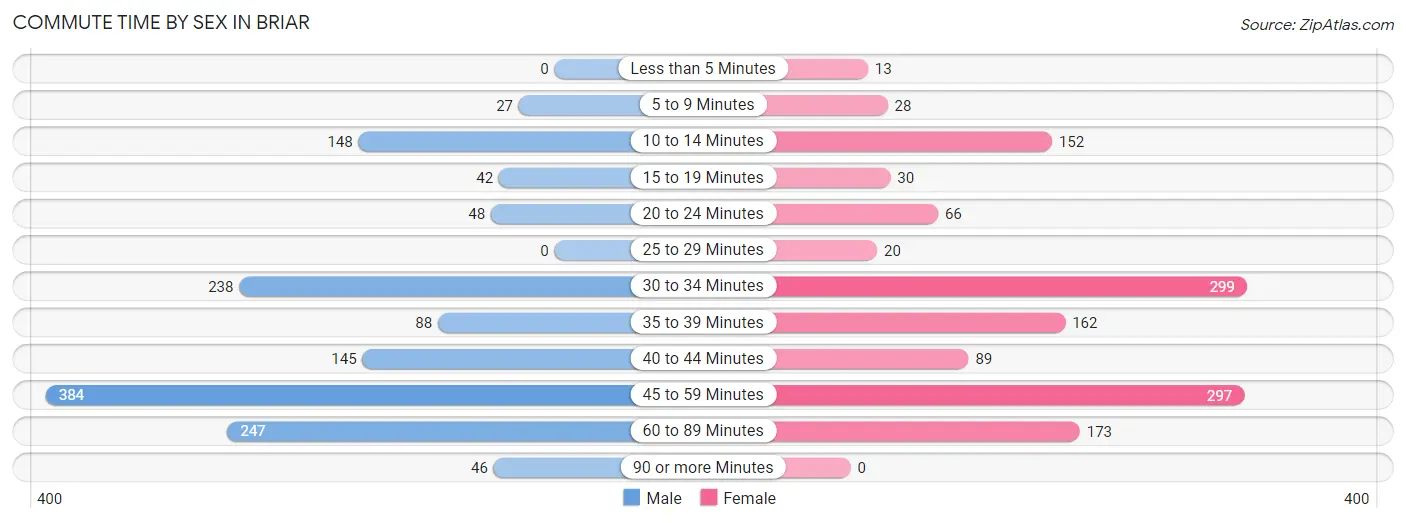
| Commute Time | Male | Female |
| Less than 5 Minutes | 0 (0.0%) | 13 (1.0%) |
| 5 to 9 Minutes | 27 (1.9%) | 28 (2.1%) |
| 10 to 14 Minutes | 148 (10.5%) | 152 (11.4%) |
| 15 to 19 Minutes | 42 (3.0%) | 30 (2.3%) |
| 20 to 24 Minutes | 48 (3.4%) | 66 (5.0%) |
| 25 to 29 Minutes | 0 (0.0%) | 20 (1.5%) |
| 30 to 34 Minutes | 238 (16.8%) | 299 (22.5%) |
| 35 to 39 Minutes | 88 (6.2%) | 162 (12.2%) |
| 40 to 44 Minutes | 145 (10.3%) | 89 (6.7%) |
| 45 to 59 Minutes | 384 (27.2%) | 297 (22.4%) |
| 60 to 89 Minutes | 247 (17.5%) | 173 (13.0%) |
| 90 or more Minutes | 46 (3.3%) | 0 (0.0%) |
Time of Departure to Work by Sex in Briar
The most frequent times of departure to work in Briar are 7:00 AM to 7:29 AM (277, 19.6%) for males and 7:00 AM to 7:29 AM (321, 24.1%) for females.
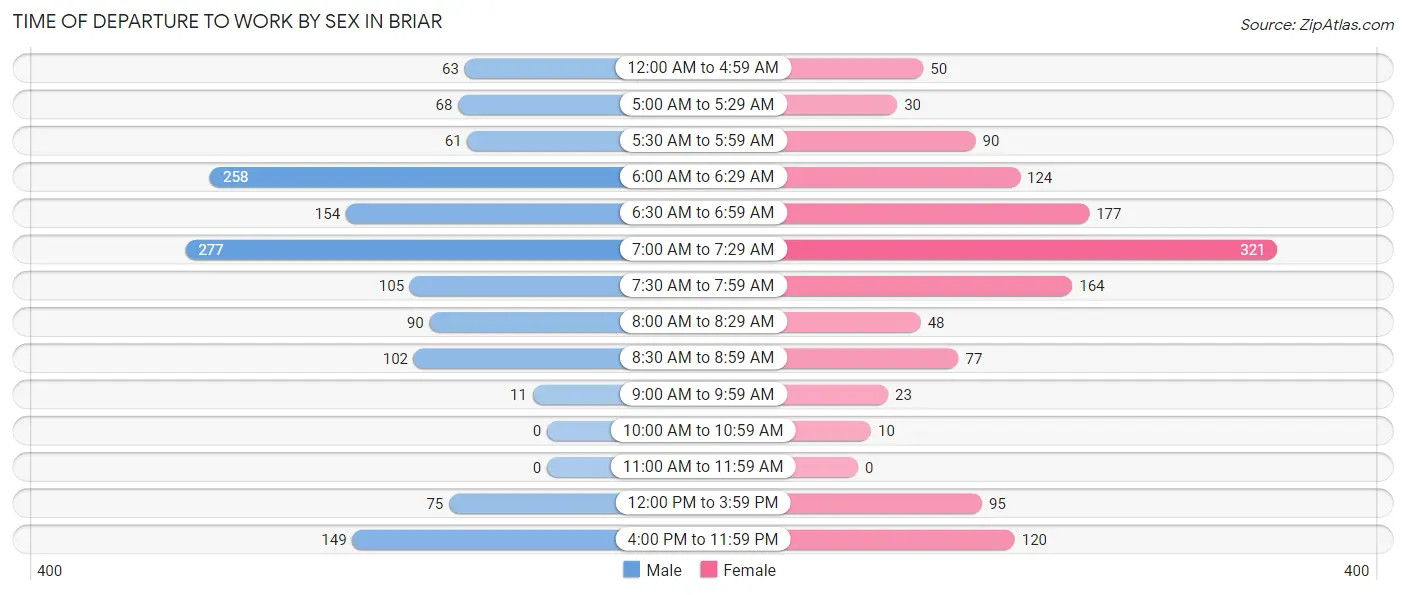
| Time of Departure | Male | Female |
| 12:00 AM to 4:59 AM | 63 (4.5%) | 50 (3.8%) |
| 5:00 AM to 5:29 AM | 68 (4.8%) | 30 (2.3%) |
| 5:30 AM to 5:59 AM | 61 (4.3%) | 90 (6.8%) |
| 6:00 AM to 6:29 AM | 258 (18.3%) | 124 (9.3%) |
| 6:30 AM to 6:59 AM | 154 (10.9%) | 177 (13.3%) |
| 7:00 AM to 7:29 AM | 277 (19.6%) | 321 (24.1%) |
| 7:30 AM to 7:59 AM | 105 (7.4%) | 164 (12.3%) |
| 8:00 AM to 8:29 AM | 90 (6.4%) | 48 (3.6%) |
| 8:30 AM to 8:59 AM | 102 (7.2%) | 77 (5.8%) |
| 9:00 AM to 9:59 AM | 11 (0.8%) | 23 (1.7%) |
| 10:00 AM to 10:59 AM | 0 (0.0%) | 10 (0.7%) |
| 11:00 AM to 11:59 AM | 0 (0.0%) | 0 (0.0%) |
| 12:00 PM to 3:59 PM | 75 (5.3%) | 95 (7.1%) |
| 4:00 PM to 11:59 PM | 149 (10.5%) | 120 (9.0%) |
| Total | 1,413 (100.0%) | 1,329 (100.0%) |
Housing Occupancy in Briar
Occupancy by Ownership in Briar
Of the total 2,241 dwellings in Briar, owner-occupied units account for 1,945 (86.8%), while renter-occupied units make up 296 (13.2%).
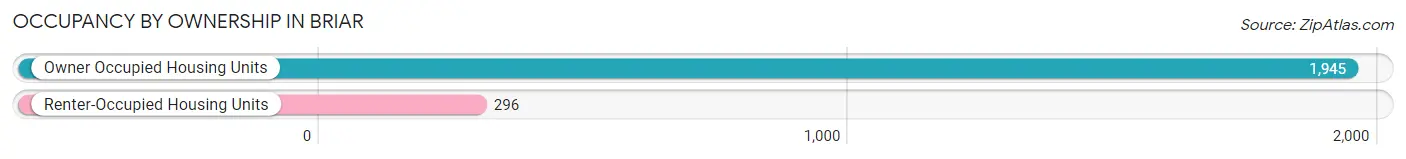
| Occupancy | # Housing Units | % Housing Units |
| Owner Occupied Housing Units | 1,945 | 86.8% |
| Renter-Occupied Housing Units | 296 | 13.2% |
| Total Occupied Housing Units | 2,241 | 100.0% |
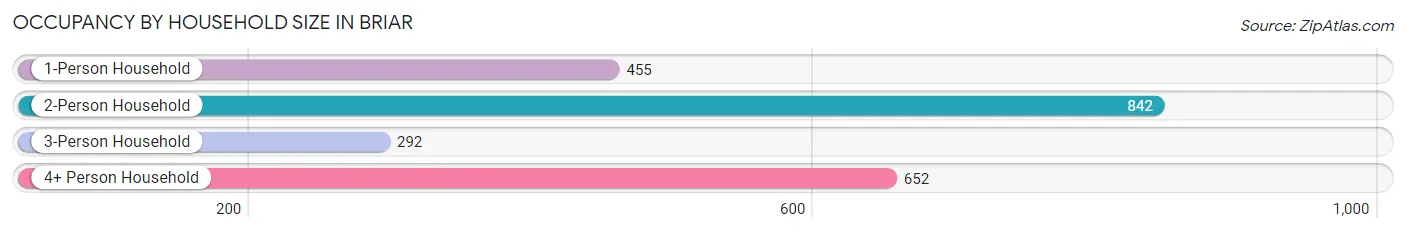
Occupancy by Household Size in Briar
| Household Size | # Housing Units | % Housing Units |
| 1-Person Household | 455 | 20.3% |
| 2-Person Household | 842 | 37.6% |
| 3-Person Household | 292 | 13.0% |
| 4+ Person Household | 652 | 29.1% |
| Total Housing Units | 2,241 | 100.0% |
Occupancy by Ownership by Household Size in Briar
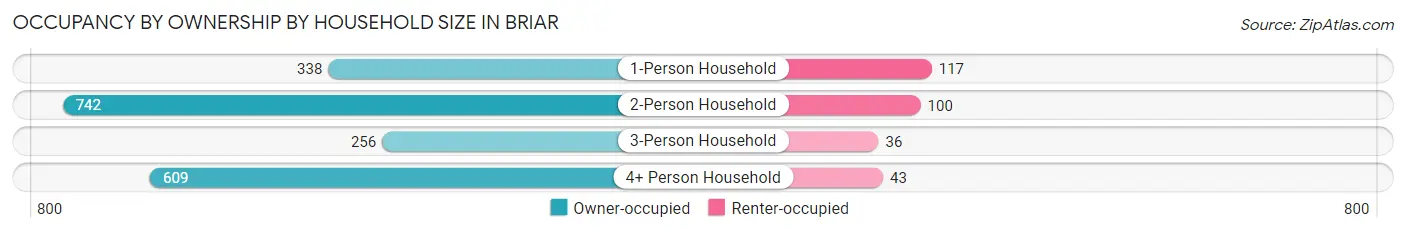
| Household Size | Owner-occupied | Renter-occupied |
| 1-Person Household | 338 (74.3%) | 117 (25.7%) |
| 2-Person Household | 742 (88.1%) | 100 (11.9%) |
| 3-Person Household | 256 (87.7%) | 36 (12.3%) |
| 4+ Person Household | 609 (93.4%) | 43 (6.6%) |
| Total Housing Units | 1,945 (86.8%) | 296 (13.2%) |
Occupancy by Educational Attainment in Briar
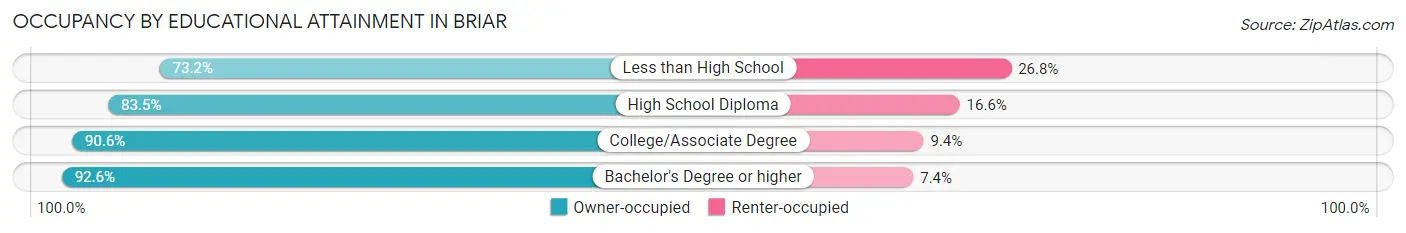
| Household Size | Owner-occupied | Renter-occupied |
| Less than High School | 145 (73.2%) | 53 (26.8%) |
| High School Diploma | 706 (83.5%) | 140 (16.6%) |
| College/Associate Degree | 666 (90.6%) | 69 (9.4%) |
| Bachelor's Degree or higher | 428 (92.6%) | 34 (7.4%) |
Occupancy by Age of Householder in Briar
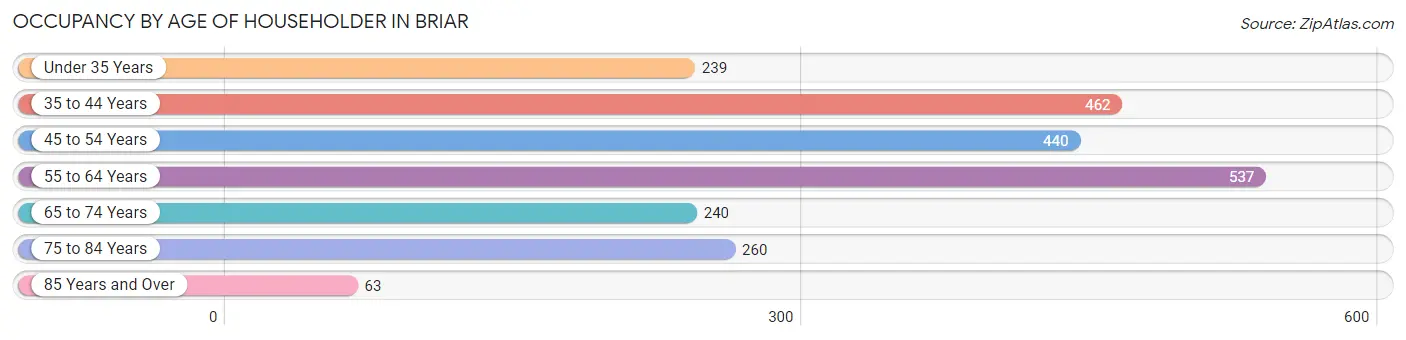
| Age Bracket | # Households | % Households |
| Under 35 Years | 239 | 10.7% |
| 35 to 44 Years | 462 | 20.6% |
| 45 to 54 Years | 440 | 19.6% |
| 55 to 64 Years | 537 | 24.0% |
| 65 to 74 Years | 240 | 10.7% |
| 75 to 84 Years | 260 | 11.6% |
| 85 Years and Over | 63 | 2.8% |
| Total | 2,241 | 100.0% |
Housing Finances in Briar
Median Income by Occupancy in Briar
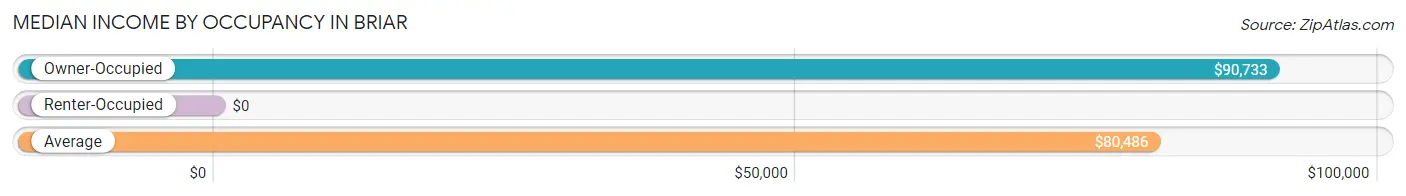
| Occupancy Type | # Households | Median Income |
| Owner-Occupied | 1,945 (86.8%) | $90,733 |
| Renter-Occupied | 296 (13.2%) | $0 |
| Average | 2,241 (100.0%) | $80,486 |
Occupancy by Householder Income Bracket in Briar
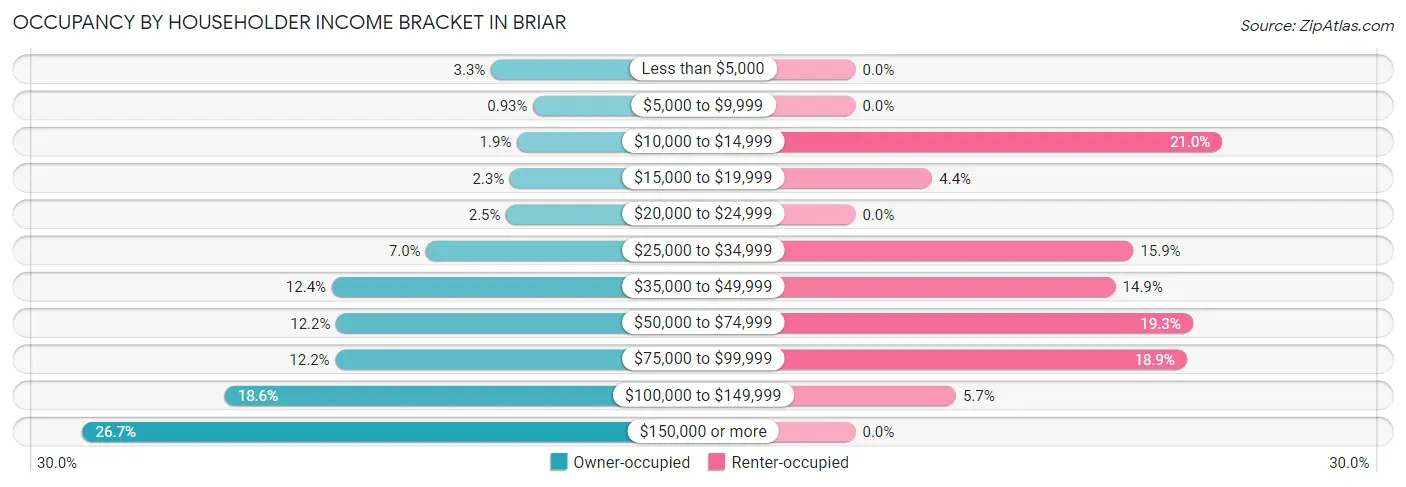
| Income Bracket | Owner-occupied | Renter-occupied |
| Less than $5,000 | 65 (3.3%) | 0 (0.0%) |
| $5,000 to $9,999 | 18 (0.9%) | 0 (0.0%) |
| $10,000 to $14,999 | 36 (1.8%) | 62 (20.9%) |
| $15,000 to $19,999 | 44 (2.3%) | 13 (4.4%) |
| $20,000 to $24,999 | 48 (2.5%) | 0 (0.0%) |
| $25,000 to $34,999 | 137 (7.0%) | 47 (15.9%) |
| $35,000 to $49,999 | 242 (12.4%) | 44 (14.9%) |
| $50,000 to $74,999 | 237 (12.2%) | 57 (19.3%) |
| $75,000 to $99,999 | 238 (12.2%) | 56 (18.9%) |
| $100,000 to $149,999 | 361 (18.6%) | 17 (5.7%) |
| $150,000 or more | 519 (26.7%) | 0 (0.0%) |
| Total | 1,945 (100.0%) | 296 (100.0%) |
Monthly Housing Cost Tiers in Briar
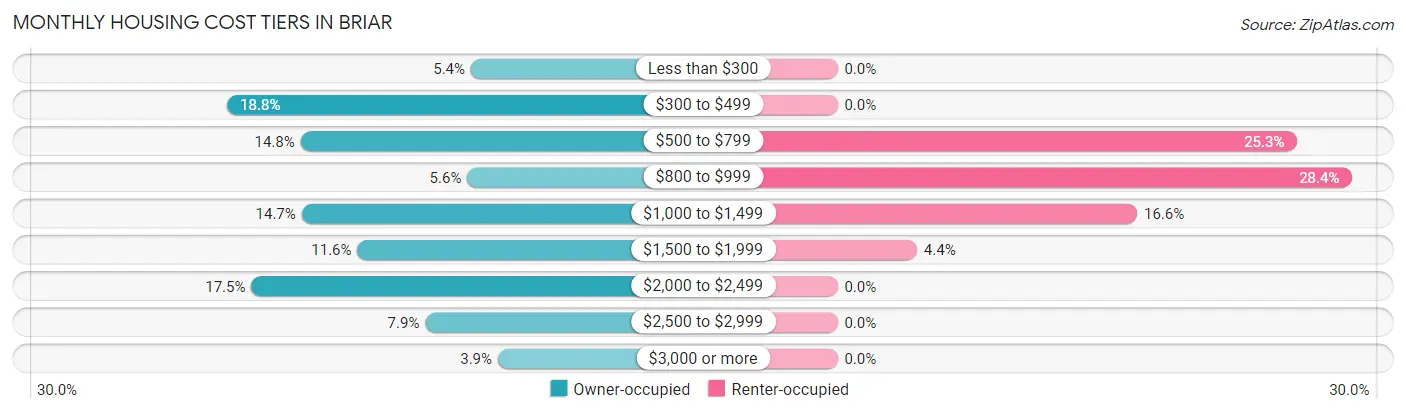
| Monthly Cost | Owner-occupied | Renter-occupied |
| Less than $300 | 104 (5.3%) | 0 (0.0%) |
| $300 to $499 | 366 (18.8%) | 0 (0.0%) |
| $500 to $799 | 287 (14.8%) | 75 (25.3%) |
| $800 to $999 | 108 (5.6%) | 84 (28.4%) |
| $1,000 to $1,499 | 286 (14.7%) | 49 (16.6%) |
| $1,500 to $1,999 | 226 (11.6%) | 13 (4.4%) |
| $2,000 to $2,499 | 340 (17.5%) | 0 (0.0%) |
| $2,500 to $2,999 | 153 (7.9%) | 0 (0.0%) |
| $3,000 or more | 75 (3.9%) | 0 (0.0%) |
| Total | 1,945 (100.0%) | 296 (100.0%) |
Physical Housing Characteristics in Briar
Housing Structures in Briar
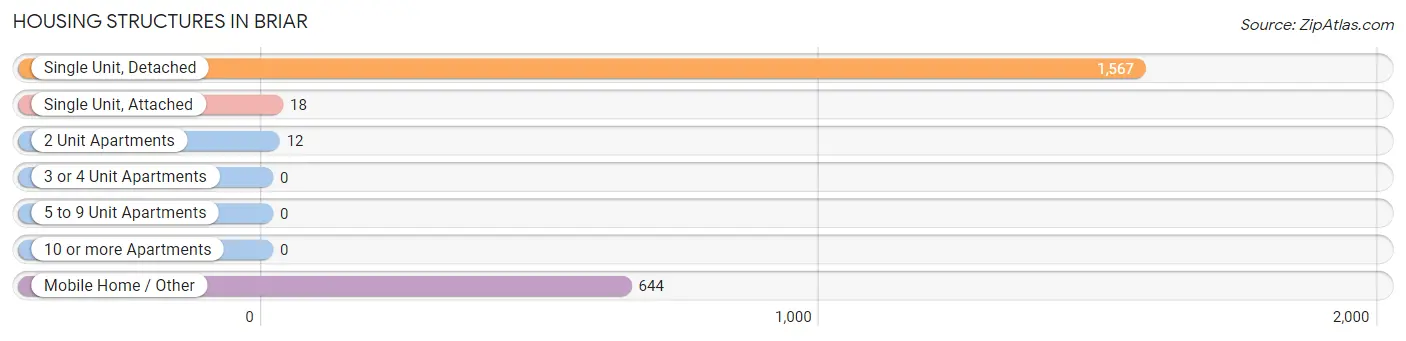
| Structure Type | # Housing Units | % Housing Units |
| Single Unit, Detached | 1,567 | 69.9% |
| Single Unit, Attached | 18 | 0.8% |
| 2 Unit Apartments | 12 | 0.5% |
| 3 or 4 Unit Apartments | 0 | 0.0% |
| 5 to 9 Unit Apartments | 0 | 0.0% |
| 10 or more Apartments | 0 | 0.0% |
| Mobile Home / Other | 644 | 28.7% |
| Total | 2,241 | 100.0% |
Housing Structures by Occupancy in Briar
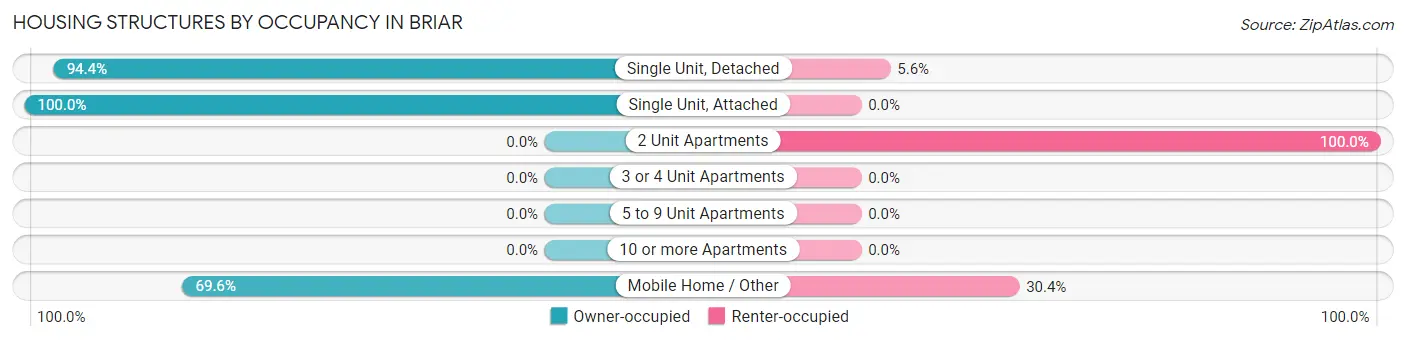
| Structure Type | Owner-occupied | Renter-occupied |
| Single Unit, Detached | 1,479 (94.4%) | 88 (5.6%) |
| Single Unit, Attached | 18 (100.0%) | 0 (0.0%) |
| 2 Unit Apartments | 0 (0.0%) | 12 (100.0%) |
| 3 or 4 Unit Apartments | 0 (0.0%) | 0 (0.0%) |
| 5 to 9 Unit Apartments | 0 (0.0%) | 0 (0.0%) |
| 10 or more Apartments | 0 (0.0%) | 0 (0.0%) |
| Mobile Home / Other | 448 (69.6%) | 196 (30.4%) |
| Total | 1,945 (86.8%) | 296 (13.2%) |
Housing Structures by Number of Rooms in Briar
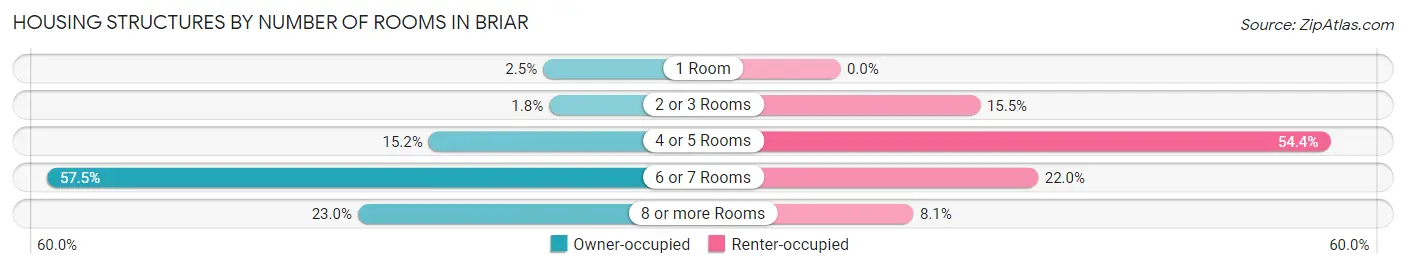
| Number of Rooms | Owner-occupied | Renter-occupied |
| 1 Room | 48 (2.5%) | 0 (0.0%) |
| 2 or 3 Rooms | 35 (1.8%) | 46 (15.5%) |
| 4 or 5 Rooms | 295 (15.2%) | 161 (54.4%) |
| 6 or 7 Rooms | 1,119 (57.5%) | 65 (22.0%) |
| 8 or more Rooms | 448 (23.0%) | 24 (8.1%) |
| Total | 1,945 (100.0%) | 296 (100.0%) |
Housing Structure by Heating Type in Briar
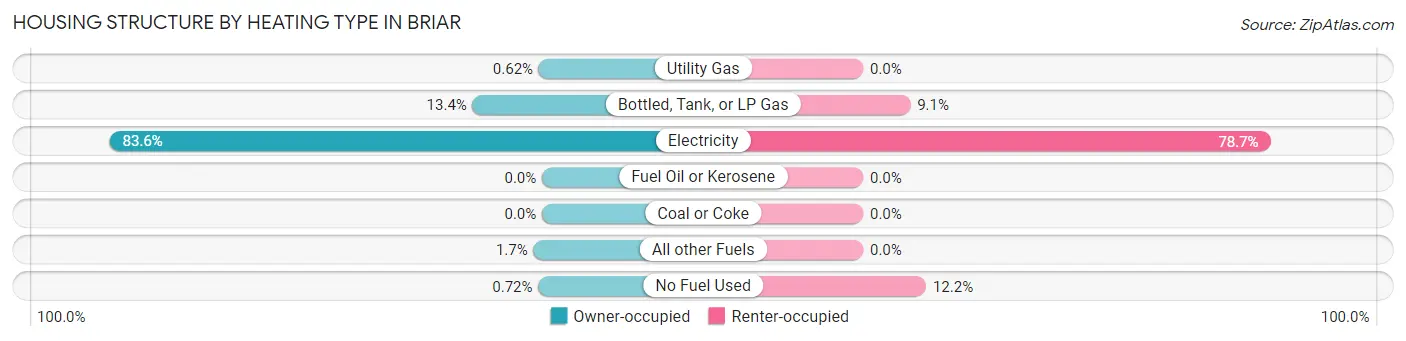
| Heating Type | Owner-occupied | Renter-occupied |
| Utility Gas | 12 (0.6%) | 0 (0.0%) |
| Bottled, Tank, or LP Gas | 261 (13.4%) | 27 (9.1%) |
| Electricity | 1,626 (83.6%) | 233 (78.7%) |
| Fuel Oil or Kerosene | 0 (0.0%) | 0 (0.0%) |
| Coal or Coke | 0 (0.0%) | 0 (0.0%) |
| All other Fuels | 32 (1.7%) | 0 (0.0%) |
| No Fuel Used | 14 (0.7%) | 36 (12.2%) |
| Total | 1,945 (100.0%) | 296 (100.0%) |
Household Vehicle Usage in Briar
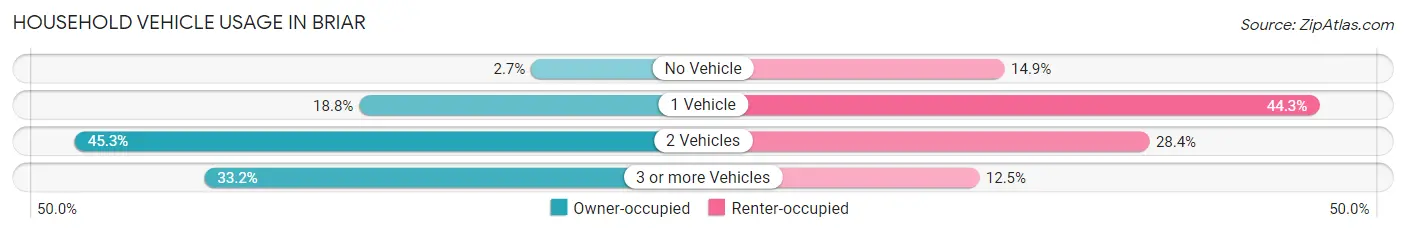
| Vehicles per Household | Owner-occupied | Renter-occupied |
| No Vehicle | 53 (2.7%) | 44 (14.9%) |
| 1 Vehicle | 365 (18.8%) | 131 (44.3%) |
| 2 Vehicles | 881 (45.3%) | 84 (28.4%) |
| 3 or more Vehicles | 646 (33.2%) | 37 (12.5%) |
| Total | 1,945 (100.0%) | 296 (100.0%) |
Real Estate & Mortgages in Briar
Real Estate and Mortgage Overview in Briar
| Characteristic | Without Mortgage | With Mortgage |
| Housing Units | 879 | 1,066 |
| Median Property Value | $213,200 | $318,200 |
| Median Household Income | $47,938 | $470 |
| Monthly Housing Costs | $470 | $75 |
| Real Estate Taxes | $2,003 | $68 |
Property Value by Mortgage Status in Briar
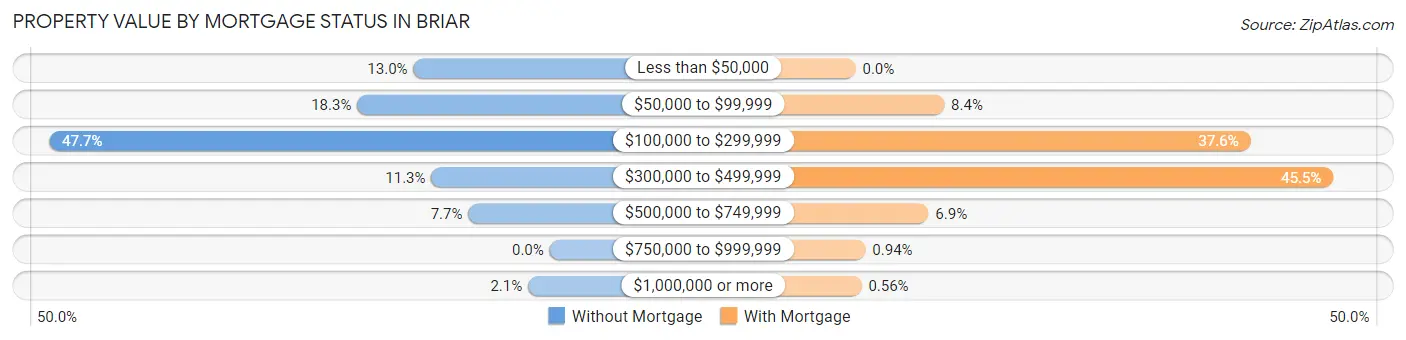
| Property Value | Without Mortgage | With Mortgage |
| Less than $50,000 | 114 (13.0%) | 0 (0.0%) |
| $50,000 to $99,999 | 161 (18.3%) | 90 (8.4%) |
| $100,000 to $299,999 | 419 (47.7%) | 401 (37.6%) |
| $300,000 to $499,999 | 99 (11.3%) | 485 (45.5%) |
| $500,000 to $749,999 | 68 (7.7%) | 74 (6.9%) |
| $750,000 to $999,999 | 0 (0.0%) | 10 (0.9%) |
| $1,000,000 or more | 18 (2.1%) | 6 (0.6%) |
| Total | 879 (100.0%) | 1,066 (100.0%) |
Household Income by Mortgage Status in Briar
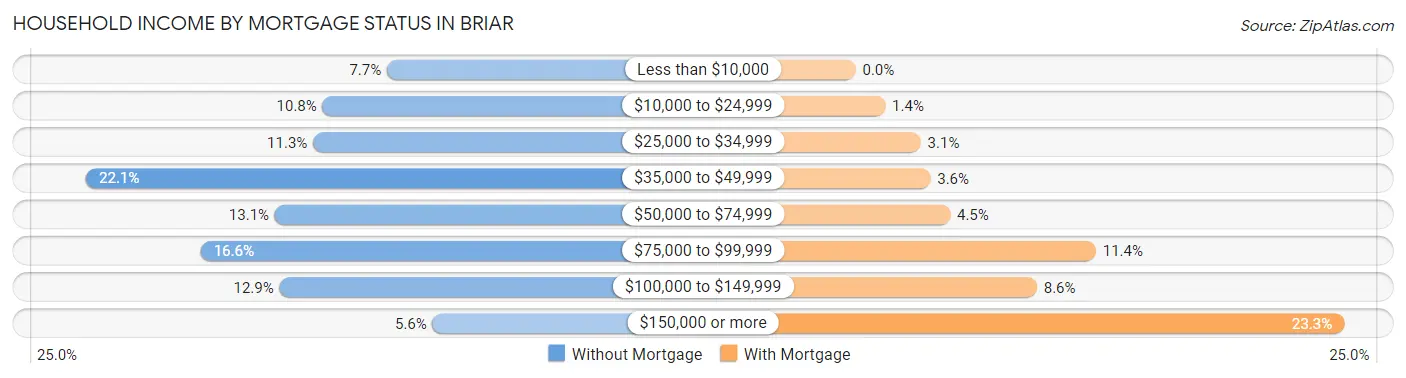
| Household Income | Without Mortgage | With Mortgage |
| Less than $10,000 | 68 (7.7%) | 0 (0.0%) |
| $10,000 to $24,999 | 95 (10.8%) | 15 (1.4%) |
| $25,000 to $34,999 | 99 (11.3%) | 33 (3.1%) |
| $35,000 to $49,999 | 194 (22.1%) | 38 (3.6%) |
| $50,000 to $74,999 | 115 (13.1%) | 48 (4.5%) |
| $75,000 to $99,999 | 146 (16.6%) | 122 (11.4%) |
| $100,000 to $149,999 | 113 (12.9%) | 92 (8.6%) |
| $150,000 or more | 49 (5.6%) | 248 (23.3%) |
| Total | 879 (100.0%) | 1,066 (100.0%) |
Property Value to Household Income Ratio in Briar
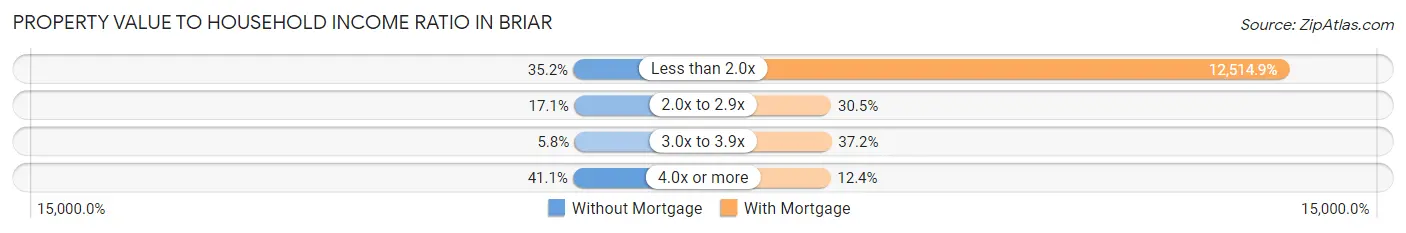
| Value-to-Income Ratio | Without Mortgage | With Mortgage |
| Less than 2.0x | 309 (35.1%) | 133,409 (12,514.9%) |
| 2.0x to 2.9x | 150 (17.1%) | 325 (30.5%) |
| 3.0x to 3.9x | 51 (5.8%) | 397 (37.2%) |
| 4.0x or more | 361 (41.1%) | 132 (12.4%) |
| Total | 879 (100.0%) | 1,066 (100.0%) |
Real Estate Taxes by Mortgage Status in Briar
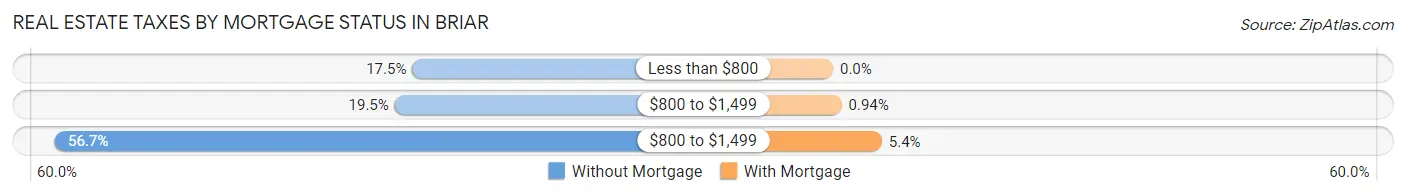
| Property Taxes | Without Mortgage | With Mortgage |
| Less than $800 | 154 (17.5%) | 0 (0.0%) |
| $800 to $1,499 | 171 (19.5%) | 10 (0.9%) |
| $800 to $1,499 | 498 (56.7%) | 57 (5.3%) |
| Total | 879 (100.0%) | 1,066 (100.0%) |
Health & Disability in Briar
Health Insurance Coverage by Age in Briar
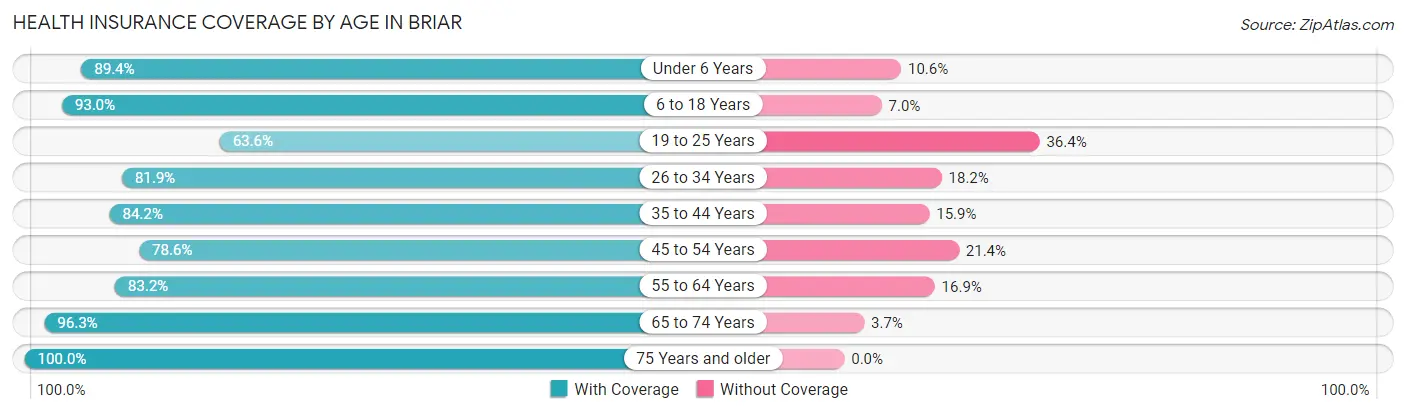
| Age Bracket | With Coverage | Without Coverage |
| Under 6 Years | 211 (89.4%) | 25 (10.6%) |
| 6 to 18 Years | 1,003 (93.0%) | 75 (7.0%) |
| 19 to 25 Years | 360 (63.6%) | 206 (36.4%) |
| 26 to 34 Years | 523 (81.9%) | 116 (18.1%) |
| 35 to 44 Years | 786 (84.2%) | 148 (15.9%) |
| 45 to 54 Years | 611 (78.6%) | 166 (21.4%) |
| 55 to 64 Years | 918 (83.2%) | 186 (16.9%) |
| 65 to 74 Years | 338 (96.3%) | 13 (3.7%) |
| 75 Years and older | 542 (100.0%) | 0 (0.0%) |
| Total | 5,292 (85.0%) | 935 (15.0%) |
Health Insurance Coverage by Citizenship Status in Briar
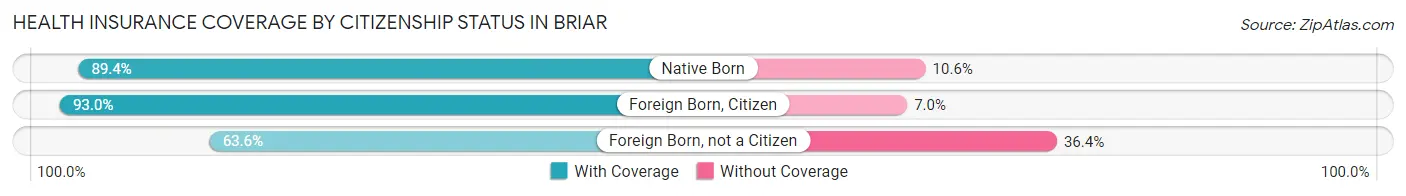
| Citizenship Status | With Coverage | Without Coverage |
| Native Born | 211 (89.4%) | 25 (10.6%) |
| Foreign Born, Citizen | 1,003 (93.0%) | 75 (7.0%) |
| Foreign Born, not a Citizen | 360 (63.6%) | 206 (36.4%) |
Health Insurance Coverage by Household Income in Briar
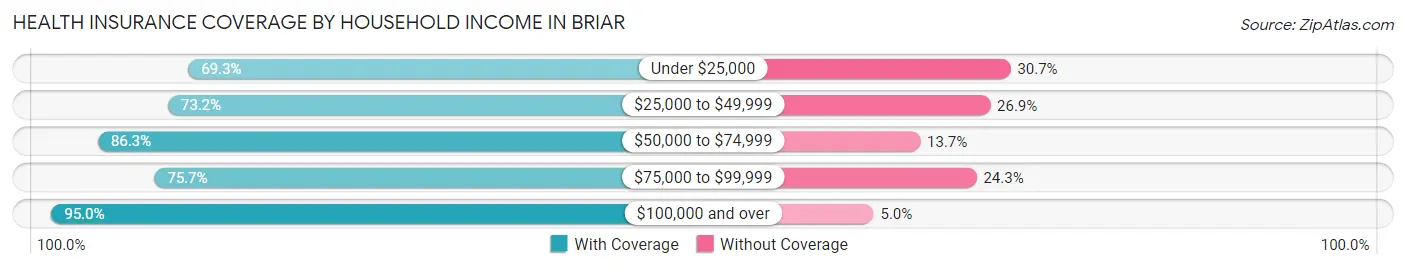
| Household Income | With Coverage | Without Coverage |
| Under $25,000 | 337 (69.3%) | 149 (30.7%) |
| $25,000 to $49,999 | 869 (73.2%) | 319 (26.9%) |
| $50,000 to $74,999 | 666 (86.3%) | 106 (13.7%) |
| $75,000 to $99,999 | 673 (75.7%) | 216 (24.3%) |
| $100,000 and over | 2,747 (95.0%) | 145 (5.0%) |
Public vs Private Health Insurance Coverage by Age in Briar
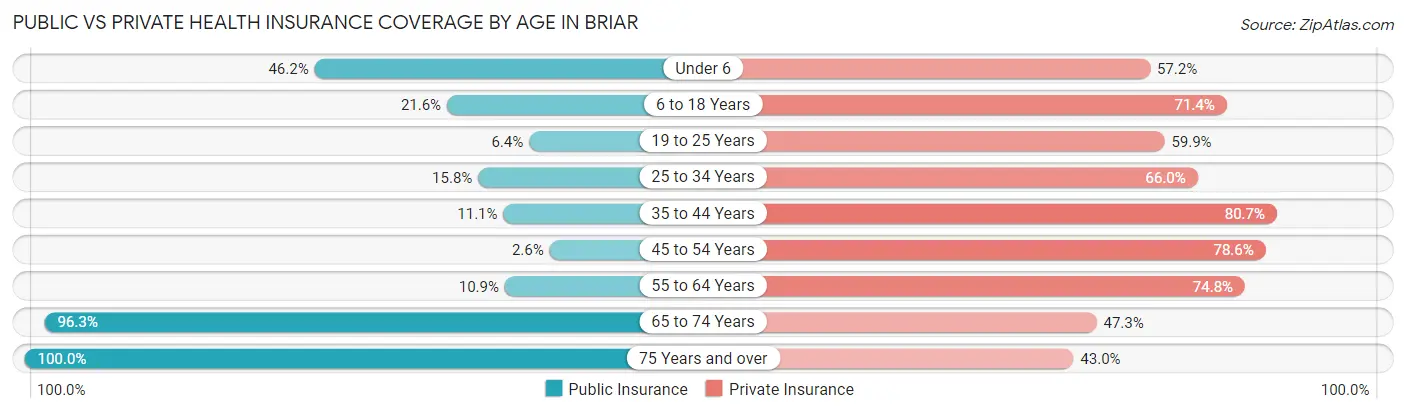
| Age Bracket | Public Insurance | Private Insurance |
| Under 6 | 109 (46.2%) | 135 (57.2%) |
| 6 to 18 Years | 233 (21.6%) | 770 (71.4%) |
| 19 to 25 Years | 36 (6.4%) | 339 (59.9%) |
| 25 to 34 Years | 101 (15.8%) | 422 (66.0%) |
| 35 to 44 Years | 104 (11.1%) | 754 (80.7%) |
| 45 to 54 Years | 20 (2.6%) | 611 (78.6%) |
| 55 to 64 Years | 120 (10.9%) | 826 (74.8%) |
| 65 to 74 Years | 338 (96.3%) | 166 (47.3%) |
| 75 Years and over | 542 (100.0%) | 233 (43.0%) |
| Total | 1,603 (25.7%) | 4,256 (68.3%) |
Disability Status by Sex by Age in Briar
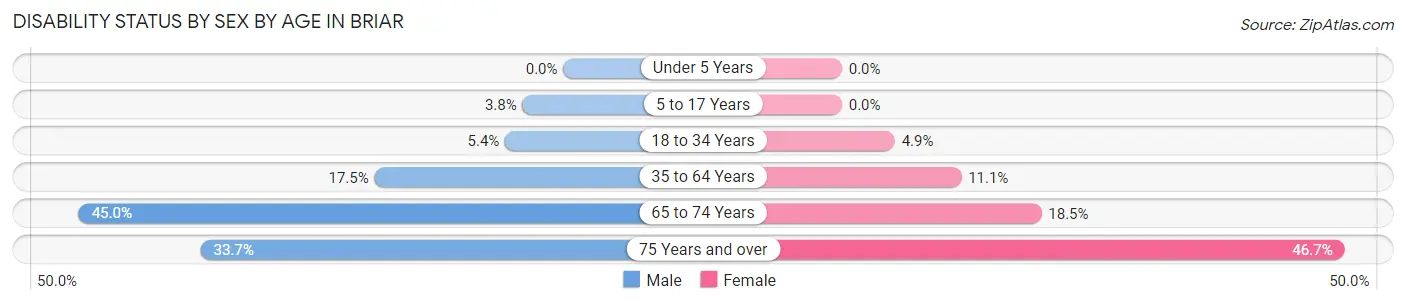
| Age Bracket | Male | Female |
| Under 5 Years | 0 (0.0%) | 0 (0.0%) |
| 5 to 17 Years | 23 (3.8%) | 0 (0.0%) |
| 18 to 34 Years | 30 (5.4%) | 34 (4.9%) |
| 35 to 64 Years | 226 (17.5%) | 169 (11.1%) |
| 65 to 74 Years | 85 (45.0%) | 30 (18.5%) |
| 75 Years and over | 67 (33.7%) | 160 (46.7%) |
Disability Class by Sex by Age in Briar
Disability Class: Hearing Difficulty
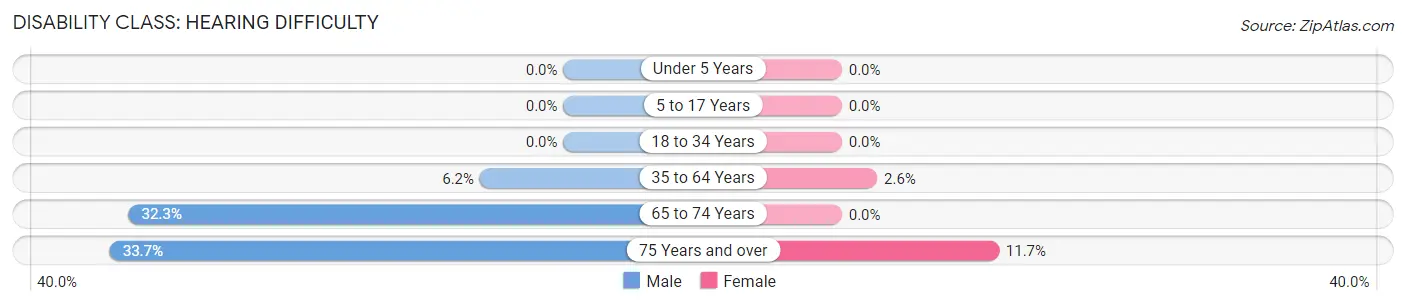
| Age Bracket | Male | Female |
| Under 5 Years | 0 (0.0%) | 0 (0.0%) |
| 5 to 17 Years | 0 (0.0%) | 0 (0.0%) |
| 18 to 34 Years | 0 (0.0%) | 0 (0.0%) |
| 35 to 64 Years | 80 (6.2%) | 40 (2.6%) |
| 65 to 74 Years | 61 (32.3%) | 0 (0.0%) |
| 75 Years and over | 67 (33.7%) | 40 (11.7%) |
Disability Class: Vision Difficulty
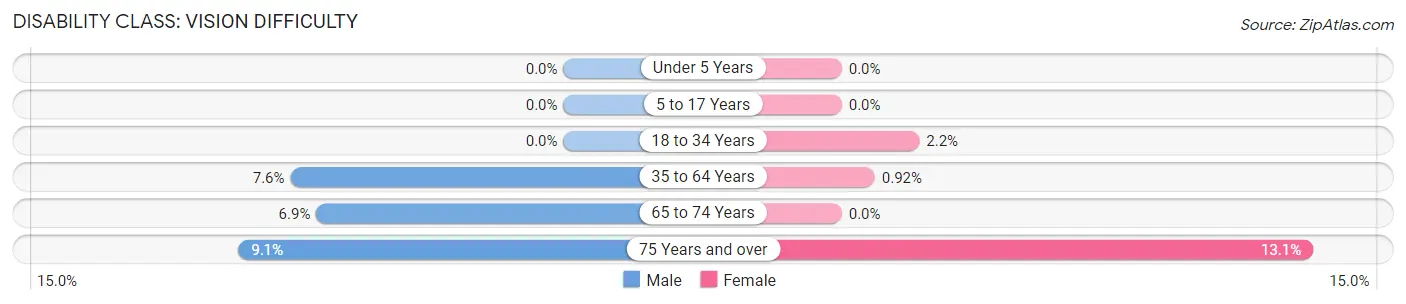
| Age Bracket | Male | Female |
| Under 5 Years | 0 (0.0%) | 0 (0.0%) |
| 5 to 17 Years | 0 (0.0%) | 0 (0.0%) |
| 18 to 34 Years | 0 (0.0%) | 15 (2.2%) |
| 35 to 64 Years | 98 (7.6%) | 14 (0.9%) |
| 65 to 74 Years | 13 (6.9%) | 0 (0.0%) |
| 75 Years and over | 18 (9.0%) | 45 (13.1%) |
Disability Class: Cognitive Difficulty
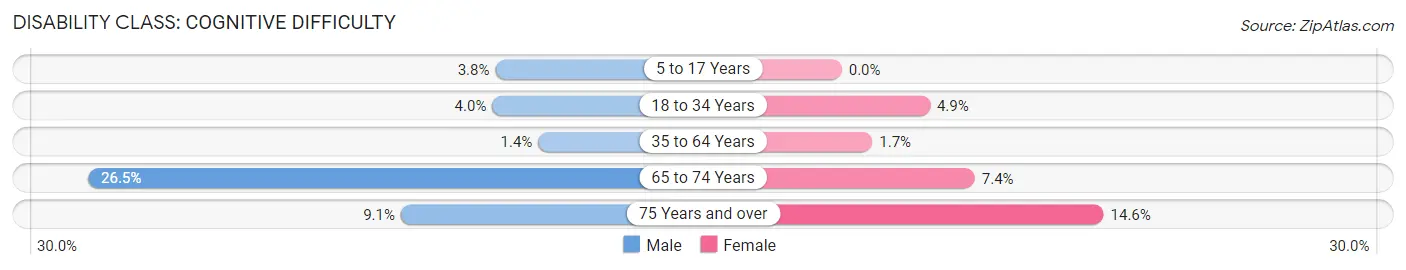
| Age Bracket | Male | Female |
| 5 to 17 Years | 23 (3.8%) | 0 (0.0%) |
| 18 to 34 Years | 22 (4.0%) | 34 (4.9%) |
| 35 to 64 Years | 18 (1.4%) | 26 (1.7%) |
| 65 to 74 Years | 50 (26.5%) | 12 (7.4%) |
| 75 Years and over | 18 (9.0%) | 50 (14.6%) |
Disability Class: Ambulatory Difficulty
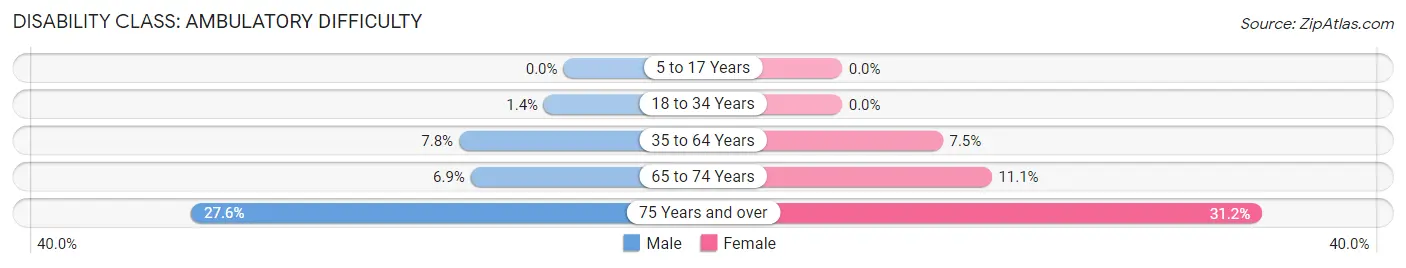
| Age Bracket | Male | Female |
| 5 to 17 Years | 0 (0.0%) | 0 (0.0%) |
| 18 to 34 Years | 8 (1.4%) | 0 (0.0%) |
| 35 to 64 Years | 100 (7.7%) | 114 (7.5%) |
| 65 to 74 Years | 13 (6.9%) | 18 (11.1%) |
| 75 Years and over | 55 (27.6%) | 107 (31.2%) |
Disability Class: Self-Care Difficulty
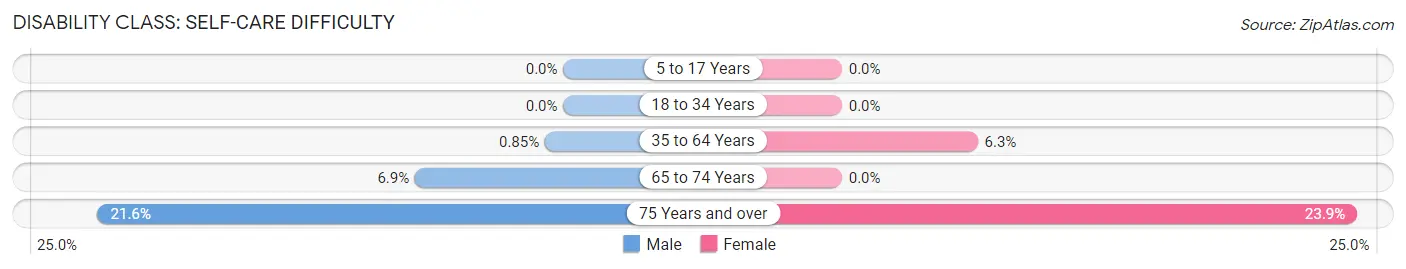
| Age Bracket | Male | Female |
| 5 to 17 Years | 0 (0.0%) | 0 (0.0%) |
| 18 to 34 Years | 0 (0.0%) | 0 (0.0%) |
| 35 to 64 Years | 11 (0.9%) | 96 (6.3%) |
| 65 to 74 Years | 13 (6.9%) | 0 (0.0%) |
| 75 Years and over | 43 (21.6%) | 82 (23.9%) |
Technology Access in Briar
Computing Device Access in Briar
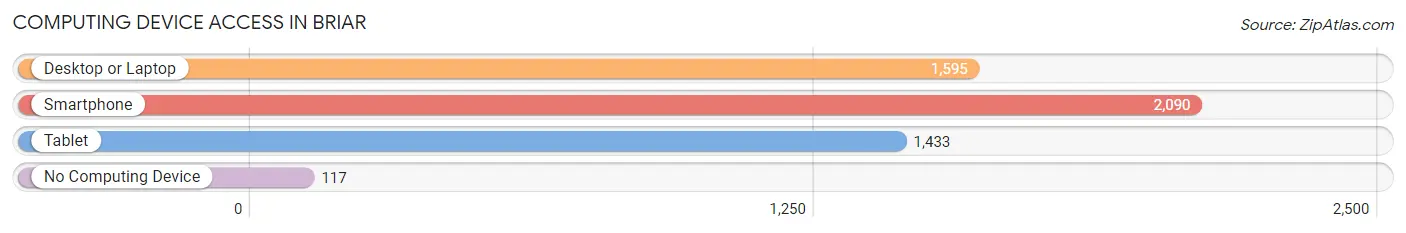
| Device Type | # Households | % Households |
| Desktop or Laptop | 1,595 | 71.2% |
| Smartphone | 2,090 | 93.3% |
| Tablet | 1,433 | 63.9% |
| No Computing Device | 117 | 5.2% |
| Total | 2,241 | 100.0% |
Internet Access in Briar
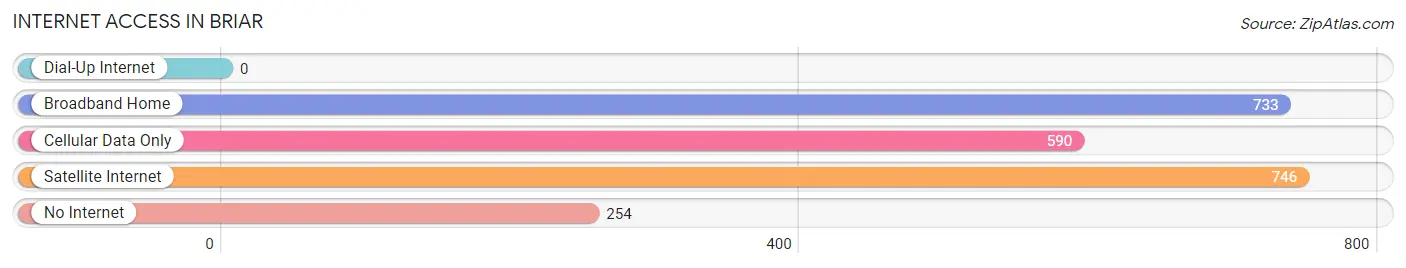
| Internet Type | # Households | % Households |
| Dial-Up Internet | 0 | 0.0% |
| Broadband Home | 733 | 32.7% |
| Cellular Data Only | 590 | 26.3% |
| Satellite Internet | 746 | 33.3% |
| No Internet | 254 | 11.3% |
| Total | 2,241 | 100.0% |
Briar Summary
Briar, Texas is a small town located in the Dallas-Fort Worth metropolitan area in Collin County. The town is situated on the banks of the Trinity River and is home to a population of just over 1,000 people.
History
Briar, Texas was founded in 1845 by a group of settlers from Kentucky. The town was named after the briar bushes that grew in the area. The settlers were attracted to the area due to its fertile soil and abundant water supply. The town quickly grew and by the late 1800s, it had become a thriving agricultural community.
In the early 1900s, the town began to experience a period of growth and development. The population increased and new businesses were established. The town was also home to a number of churches, schools, and other civic organizations.
In the 1950s, the town experienced a period of decline as many of its residents moved away in search of better opportunities. However, in the late 1970s, the town began to experience a resurgence as new businesses and residents moved into the area.
Geography
Briar, Texas is located in the Dallas-Fort Worth metropolitan area in Collin County. The town is situated on the banks of the Trinity River and is surrounded by rolling hills and lush green pastures. The town is located approximately 25 miles north of Dallas and is accessible via Interstate 35.
The climate in Briar is generally mild and humid. The average temperature in the summer months is around 90 degrees Fahrenheit and the average temperature in the winter months is around 50 degrees Fahrenheit.
Economy
The economy of Briar, Texas is largely based on agriculture. The town is home to a number of farms and ranches that produce a variety of crops and livestock. The town is also home to a number of small businesses, including restaurants, retail stores, and service providers.
Demographics
As of the 2010 census, the population of Briar, Texas was 1,072. The racial makeup of the town was 94.3% White, 0.9% African American, 0.3% Native American, 0.3% Asian, and 3.2% from other races. The median household income in the town was $45,000 and the median home value was $125,000.
Conclusion
Briar, Texas is a small town located in the Dallas-Fort Worth metropolitan area in Collin County. The town is situated on the banks of the Trinity River and is home to a population of just over 1,000 people. The town has a long history of agriculture and is home to a number of small businesses. The town has a mild climate and is accessible via Interstate 35. The population of Briar is largely white and the median household income is around $45,000.
Common Questions
What is the Total Population of Briar?
Total Population of Briar is 6,227.
What is the Total Male Population of Briar?
Total Male Population of Briar is 2,923.
What is the Total Female Population of Briar?
Total Female Population of Briar is 3,304.
What is the Ratio of Males per 100 Females in Briar?
There are 88.47 Males per 100 Females in Briar.
What is the Ratio of Females per 100 Males in Briar?
There are 113.03 Females per 100 Males in Briar.
What is the Median Population Age in Briar?
Median Population Age in Briar is 40.0 Years.
What is the Average Family Size in Briar
Average Family Size in Briar is 3.2 People.
What is the Average Household Size in Briar
Average Household Size in Briar is 2.8 People.
What is Per Capita Income in Briar?
Per Capita income in Briar is $35,257.
What is the Median Family Income in Briar?
Median Family Income in Briar is $93,646.
What is the Median Household income in Briar?
Median Household Income in Briar is $80,486.
What is Income or Wage Gap in Briar?
Income or Wage Gap in Briar is 19.6%.
Women in Briar earn 80.4 cents for every dollar earned by a man.
What is Inequality or Gini Index in Briar?
Inequality or Gini Index in Briar is 0.39.
How Large is the Labor Force in Briar?
There are 3,141 People in the Labor Forcein in Briar.
What is the Percentage of People in the Labor Force in Briar?
61.1% of People are in the Labor Force in Briar.
What is the Unemployment Rate in Briar?
Unemployment Rate in Briar is 3.2%.