Barrett, TX
Barrett Map
Barrett Overview
3,488
TOTAL POPULATION
1,760
MALE POPULATION
1,728
FEMALE POPULATION
101.85
MALES / 100 FEMALES
98.18
FEMALES / 100 MALES
34.4
MEDIAN AGE
3.4
AVG FAMILY SIZE
2.8
AVG HOUSEHOLD SIZE
$32,286
PER CAPITA INCOME
$80,125
AVG FAMILY INCOME
$66,883
AVG HOUSEHOLD INCOME
5.6%
WAGE / INCOME GAP [ % ]
94.4¢/ $1
WAGE / INCOME GAP [ $ ]
0.46
INEQUALITY / GINI INDEX
1,837
LABOR FORCE [ PEOPLE ]
69.8%
PERCENT IN LABOR FORCE
7.5%
UNEMPLOYMENT RATE
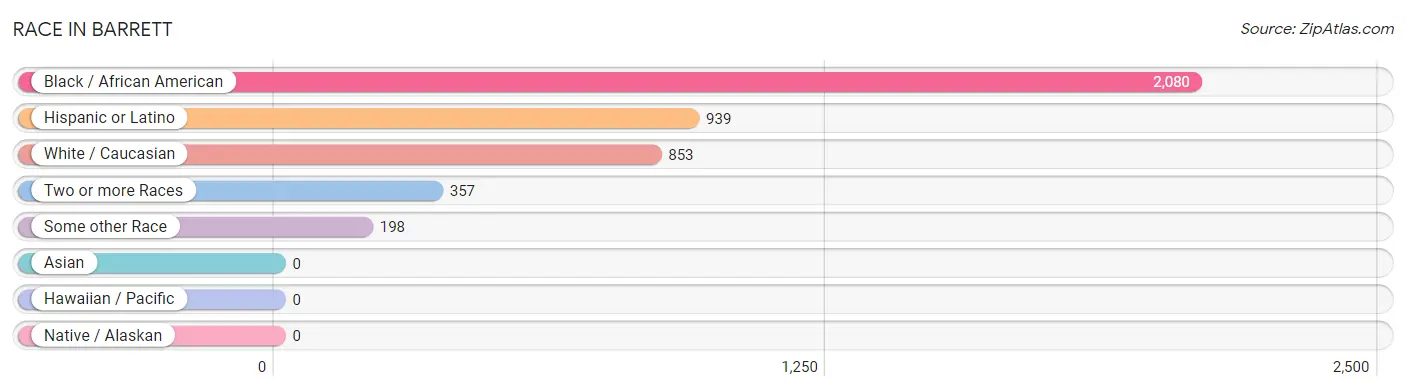
Race in Barrett
The most populous races in Barrett are Black / African American (2,080 | 59.6%), Hispanic or Latino (939 | 26.9%), and White / Caucasian (853 | 24.5%).
| Race | # Population | % Population |
| Asian | 0 | 0.0% |
| Black / African American | 2,080 | 59.6% |
| Hawaiian / Pacific | 0 | 0.0% |
| Hispanic or Latino | 939 | 26.9% |
| Native / Alaskan | 0 | 0.0% |
| White / Caucasian | 853 | 24.5% |
| Two or more Races | 357 | 10.2% |
| Some other Race | 198 | 5.7% |
| Total | 3,488 | 100.0% |
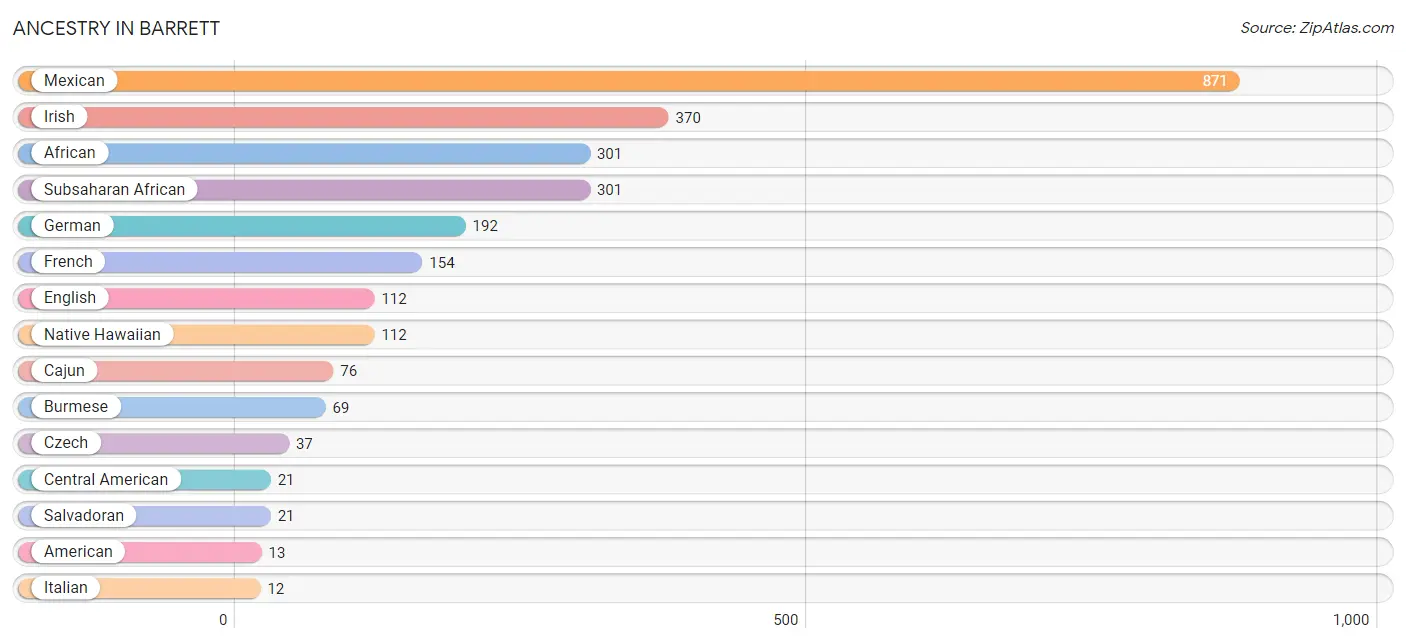
Ancestry in Barrett
The most populous ancestries reported in Barrett are Mexican (871 | 25.0%), Irish (370 | 10.6%), African (301 | 8.6%), Subsaharan African (301 | 8.6%), and German (192 | 5.5%), together accounting for 58.3% of all Barrett residents.
| Ancestry | # Population | % Population |
| African | 301 | 8.6% |
| American | 13 | 0.4% |
| Burmese | 69 | 2.0% |
| Cajun | 76 | 2.2% |
| Central American | 21 | 0.6% |
| Czech | 37 | 1.1% |
| English | 112 | 3.2% |
| French | 154 | 4.4% |
| German | 192 | 5.5% |
| Irish | 370 | 10.6% |
| Italian | 12 | 0.3% |
| Mexican | 871 | 25.0% |
| Native Hawaiian | 112 | 3.2% |
| Salvadoran | 21 | 0.6% |
| Spanish | 1 | 0.0% |
| Subsaharan African | 301 | 8.6% |
| Swedish | 11 | 0.3% |
| Swiss | 11 | 0.3% | View All 18 Rows |
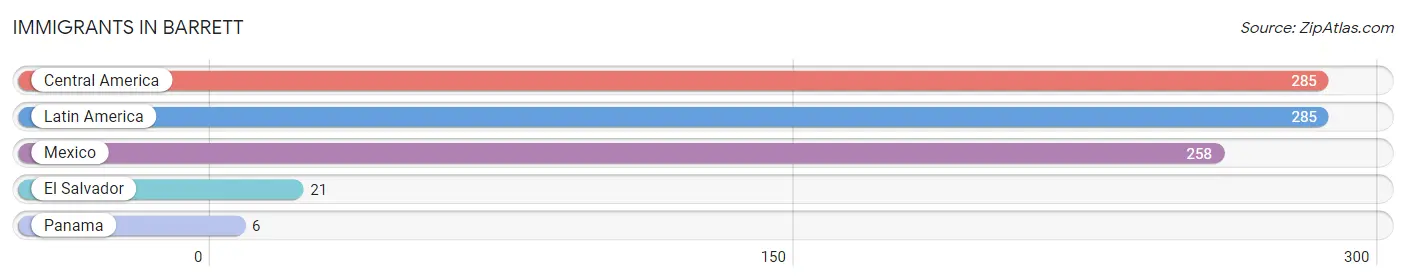
Immigrants in Barrett
The most numerous immigrant groups reported in Barrett came from Central America (285 | 8.2%), Latin America (285 | 8.2%), Mexico (258 | 7.4%), El Salvador (21 | 0.6%), and Panama (6 | 0.2%), together accounting for 24.5% of all Barrett residents.
| Immigration Origin | # Population | % Population |
| Central America | 285 | 8.2% |
| El Salvador | 21 | 0.6% |
| Latin America | 285 | 8.2% |
| Mexico | 258 | 7.4% |
| Panama | 6 | 0.2% | View All 5 Rows |
Sex and Age in Barrett
Sex and Age in Barrett
The most populous age groups in Barrett are 25 to 29 Years (380 | 21.6%) for men and Under 5 Years (230 | 13.3%) for women.
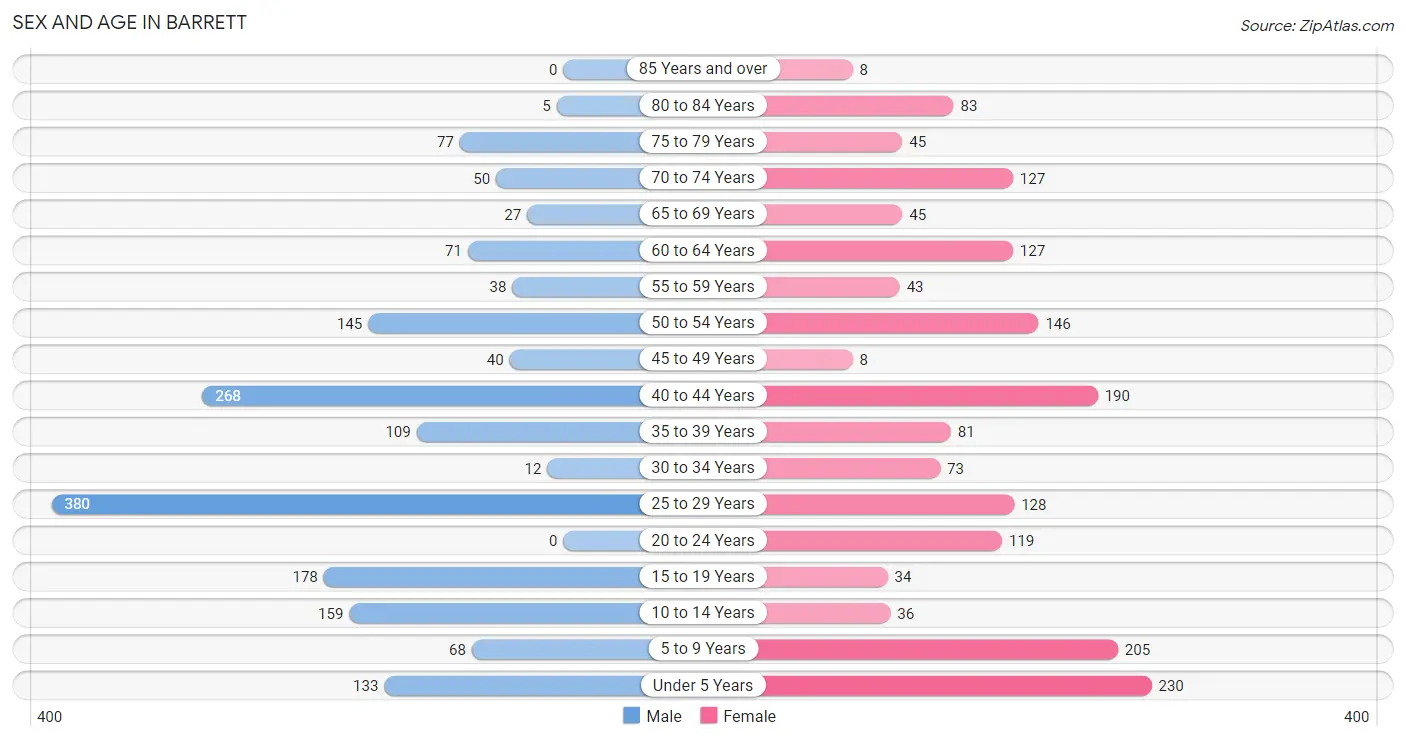
| Age Bracket | Male | Female |
| Under 5 Years | 133 (7.6%) | 230 (13.3%) |
| 5 to 9 Years | 68 (3.9%) | 205 (11.9%) |
| 10 to 14 Years | 159 (9.0%) | 36 (2.1%) |
| 15 to 19 Years | 178 (10.1%) | 34 (2.0%) |
| 20 to 24 Years | 0 (0.0%) | 119 (6.9%) |
| 25 to 29 Years | 380 (21.6%) | 128 (7.4%) |
| 30 to 34 Years | 12 (0.7%) | 73 (4.2%) |
| 35 to 39 Years | 109 (6.2%) | 81 (4.7%) |
| 40 to 44 Years | 268 (15.2%) | 190 (11.0%) |
| 45 to 49 Years | 40 (2.3%) | 8 (0.5%) |
| 50 to 54 Years | 145 (8.2%) | 146 (8.5%) |
| 55 to 59 Years | 38 (2.2%) | 43 (2.5%) |
| 60 to 64 Years | 71 (4.0%) | 127 (7.3%) |
| 65 to 69 Years | 27 (1.5%) | 45 (2.6%) |
| 70 to 74 Years | 50 (2.8%) | 127 (7.3%) |
| 75 to 79 Years | 77 (4.4%) | 45 (2.6%) |
| 80 to 84 Years | 5 (0.3%) | 83 (4.8%) |
| 85 Years and over | 0 (0.0%) | 8 (0.5%) |
| Total | 1,760 (100.0%) | 1,728 (100.0%) |
Families and Households in Barrett
Median Family Size in Barrett
The median family size in Barrett is 3.36 persons per family, with married-couple families (648 | 71.4%) accounting for the largest median family size of 3.41 persons per family. On the other hand, single male/father families (14 | 1.5%) represent the smallest median family size with 2.29 persons per family.
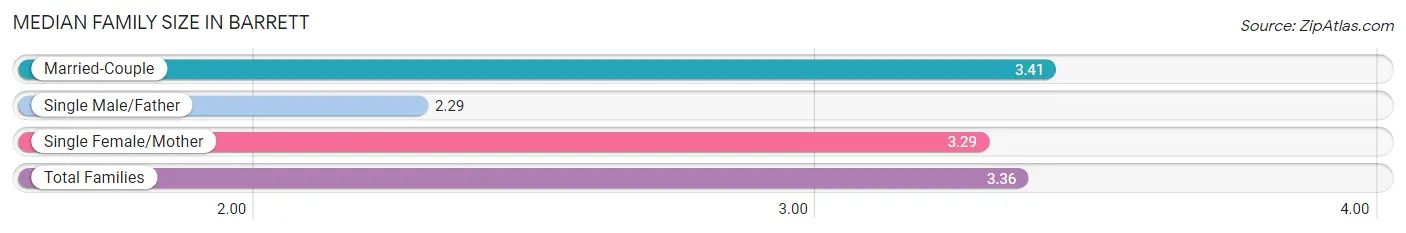
| Family Type | # Families | Family Size |
| Married-Couple | 648 (71.4%) | 3.41 |
| Single Male/Father | 14 (1.5%) | 2.29 |
| Single Female/Mother | 246 (27.1%) | 3.29 |
| Total Families | 908 (100.0%) | 3.36 |
Median Household Size in Barrett
The median household size in Barrett is 2.80 persons per household, with single female/mother households (246 | 19.7%) accounting for the largest median household size of 3.5 persons per household. non-family households (338 | 27.1%) represent the smallest median household size with 1.10 persons per household.
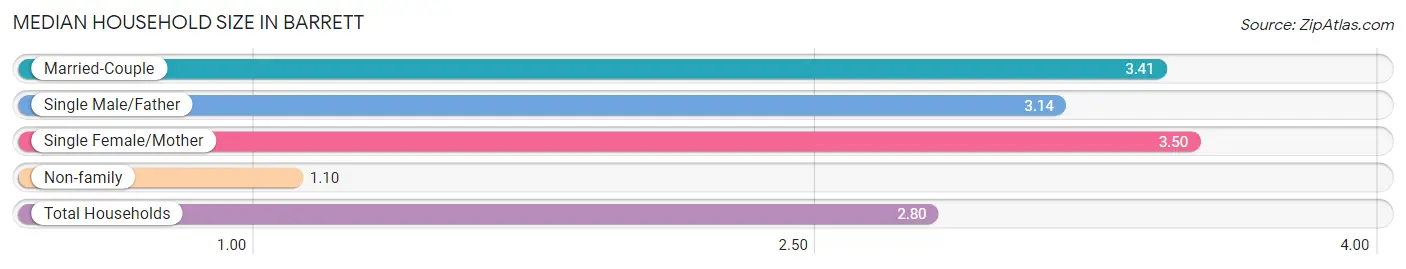
| Household Type | # Households | Household Size |
| Married-Couple | 648 (52.0%) | 3.41 |
| Single Male/Father | 14 (1.1%) | 3.14 |
| Single Female/Mother | 246 (19.7%) | 3.50 |
| Non-family | 338 (27.1%) | 1.10 |
| Total Households | 1,246 (100.0%) | 2.80 |
Household Size by Marriage Status in Barrett
Out of a total of 1,246 households in Barrett, 908 (72.9%) are family households, while 338 (27.1%) are nonfamily households. The most numerous type of family households are 3-person households, comprising 332, and the most common type of nonfamily households are 1-person households, comprising 307.
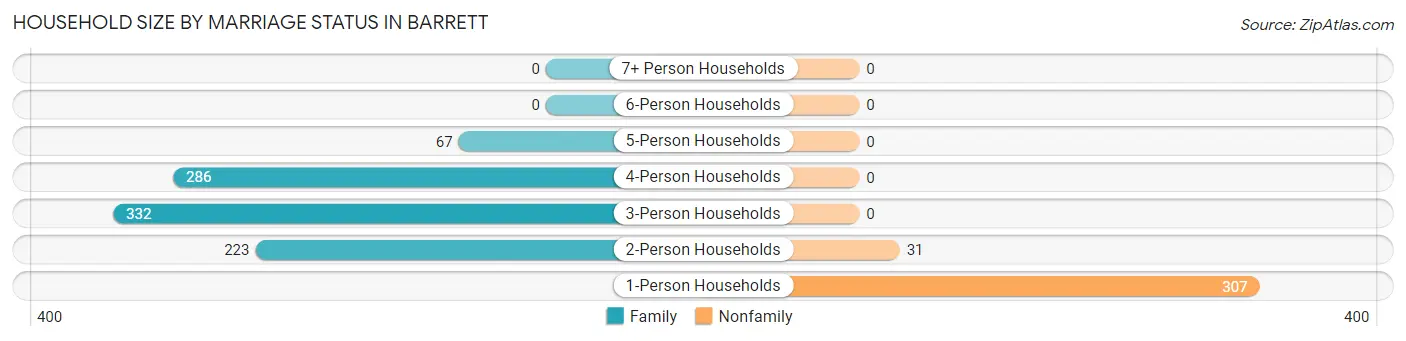
| Household Size | Family Households | Nonfamily Households |
| 1-Person Households | - | 307 (24.6%) |
| 2-Person Households | 223 (17.9%) | 31 (2.5%) |
| 3-Person Households | 332 (26.7%) | 0 (0.0%) |
| 4-Person Households | 286 (23.0%) | 0 (0.0%) |
| 5-Person Households | 67 (5.4%) | 0 (0.0%) |
| 6-Person Households | 0 (0.0%) | 0 (0.0%) |
| 7+ Person Households | 0 (0.0%) | 0 (0.0%) |
| Total | 908 (72.9%) | 338 (27.1%) |
Female Fertility in Barrett
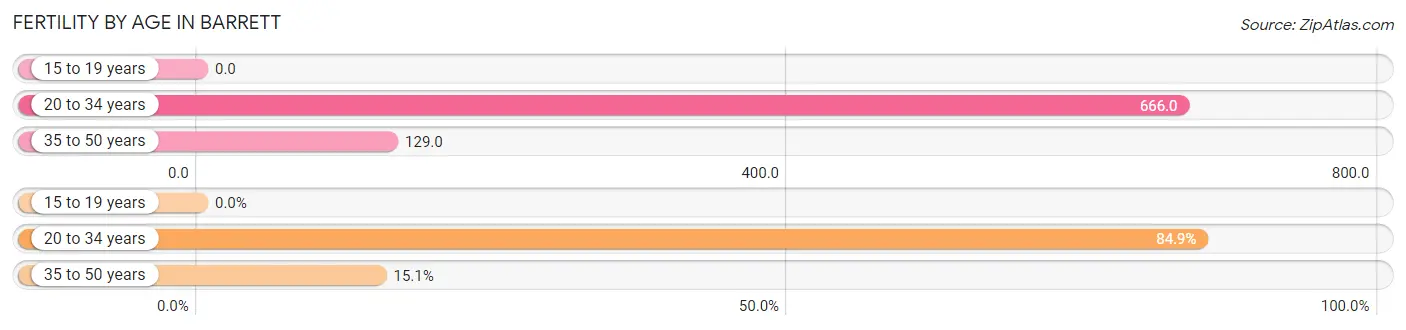
Fertility by Age in Barrett
Average fertility rate in Barrett is 387.0 births per 1,000 women. Women in the age bracket of 20 to 34 years have the highest fertility rate with 666.0 births per 1,000 women. Women in the age bracket of 20 to 34 years acount for 84.9% of all women with births.
| Age Bracket | Women with Births | Births / 1,000 Women |
| 15 to 19 years | 0 (0.0%) | 0.0 |
| 20 to 34 years | 213 (84.9%) | 666.0 |
| 35 to 50 years | 38 (15.1%) | 129.0 |
| Total | 251 (100.0%) | 387.0 |
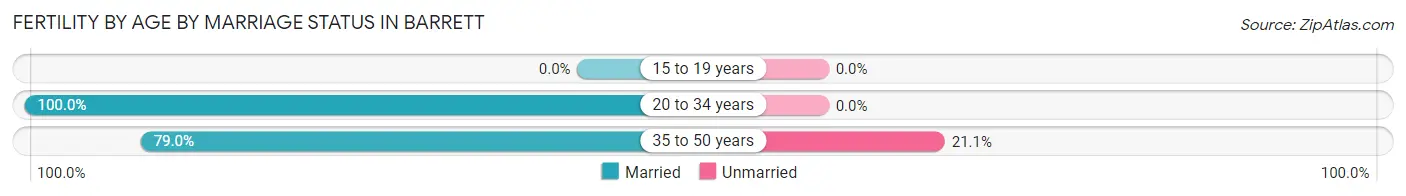
Fertility by Age by Marriage Status in Barrett
96.8% of women with births (251) in Barrett are married. The highest percentage of unmarried women with births falls into 35 to 50 years age bracket with 21.0% of them unmarried at the time of birth, while the lowest percentage of unmarried women with births belong to 20 to 34 years age bracket with 0.0% of them unmarried.
| Age Bracket | Married | Unmarried |
| 15 to 19 years | 0 (0.0%) | 0 (0.0%) |
| 20 to 34 years | 213 (100.0%) | 0 (0.0%) |
| 35 to 50 years | 30 (78.9%) | 8 (21.0%) |
| Total | 243 (96.8%) | 8 (3.2%) |
Fertility by Education in Barrett
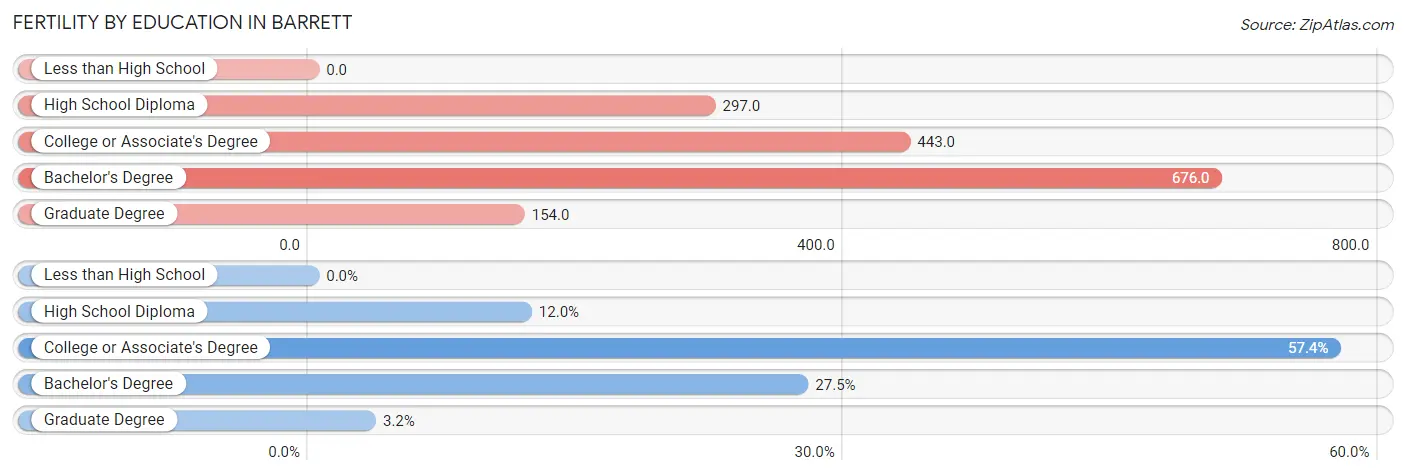
| Educational Attainment | Women with Births | Births / 1,000 Women |
| Less than High School | 0 (0.0%) | 0.0 |
| High School Diploma | 30 (11.9%) | 297.0 |
| College or Associate's Degree | 144 (57.4%) | 443.0 |
| Bachelor's Degree | 69 (27.5%) | 676.0 |
| Graduate Degree | 8 (3.2%) | 154.0 |
| Total | 251 (100.0%) | 387.0 |
Fertility by Education by Marriage Status in Barrett
3.2% of women with births in Barrett are unmarried. Women with the educational attainment of high school diploma are most likely to be married with 100.0% of them married at childbirth, while women with the educational attainment of graduate degree are least likely to be married with 100.0% of them unmarried at childbirth.
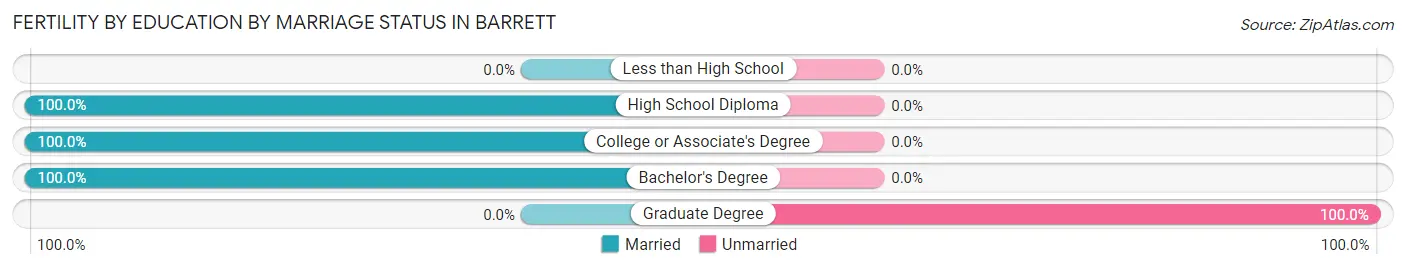
| Educational Attainment | Married | Unmarried |
| Less than High School | 0 (0.0%) | 0 (0.0%) |
| High School Diploma | 30 (100.0%) | 0 (0.0%) |
| College or Associate's Degree | 144 (100.0%) | 0 (0.0%) |
| Bachelor's Degree | 69 (100.0%) | 0 (0.0%) |
| Graduate Degree | 0 (0.0%) | 8 (100.0%) |
| Total | 243 (96.8%) | 8 (3.2%) |
Income in Barrett
Income Overview in Barrett
Per Capita Income in Barrett is $32,286, while median incomes of families and households are $80,125 and $66,883 respectively.
| Characteristic | Number | Measure |
| Per Capita Income | 3,488 | $32,286 |
| Median Family Income | 908 | $80,125 |
| Mean Family Income | 908 | $104,071 |
| Median Household Income | 1,246 | $66,883 |
| Mean Household Income | 1,246 | $86,545 |
| Income Deficit | 908 | $0 |
| Wage / Income Gap (%) | 3,488 | 5.61% |
| Wage / Income Gap ($) | 3,488 | 94.39¢ per $1 |
| Gini / Inequality Index | 3,488 | 0.46 |
Earnings by Sex in Barrett
Average Earnings in Barrett are $43,646, $43,419 for men and $46,000 for women, a difference of 5.6%.
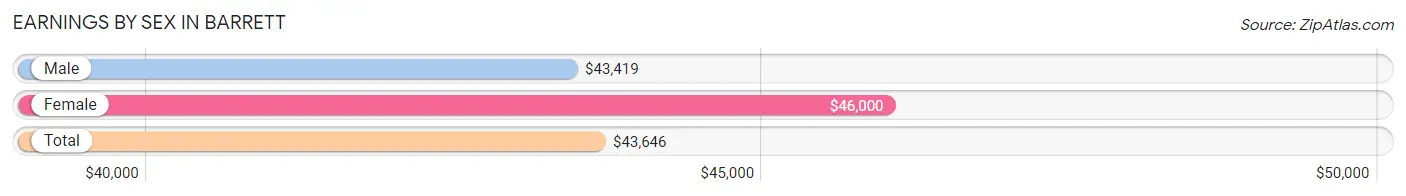
| Sex | Number | Average Earnings |
| Male | 1,041 (58.8%) | $43,419 |
| Female | 730 (41.2%) | $46,000 |
| Total | 1,771 (100.0%) | $43,646 |
Earnings by Sex by Income Bracket in Barrett
The most common earnings brackets in Barrett are $30,000 to $34,999 for men (189 | 18.2%) and $65,000 to $74,999 for women (111 | 15.2%).
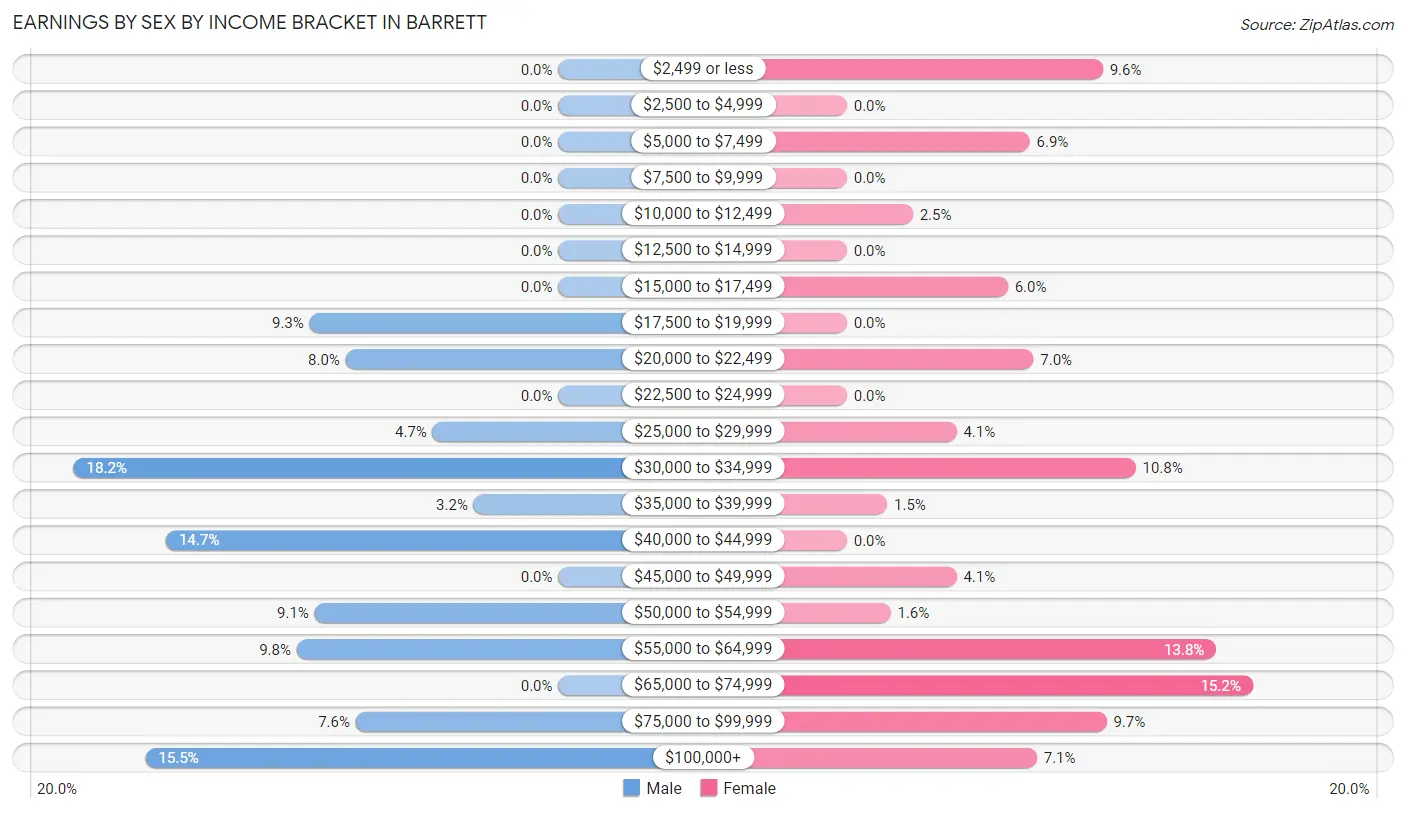
| Income | Male | Female |
| $2,499 or less | 0 (0.0%) | 70 (9.6%) |
| $2,500 to $4,999 | 0 (0.0%) | 0 (0.0%) |
| $5,000 to $7,499 | 0 (0.0%) | 50 (6.9%) |
| $7,500 to $9,999 | 0 (0.0%) | 0 (0.0%) |
| $10,000 to $12,499 | 0 (0.0%) | 18 (2.5%) |
| $12,500 to $14,999 | 0 (0.0%) | 0 (0.0%) |
| $15,000 to $17,499 | 0 (0.0%) | 44 (6.0%) |
| $17,500 to $19,999 | 97 (9.3%) | 0 (0.0%) |
| $20,000 to $22,499 | 83 (8.0%) | 51 (7.0%) |
| $22,500 to $24,999 | 0 (0.0%) | 0 (0.0%) |
| $25,000 to $29,999 | 49 (4.7%) | 30 (4.1%) |
| $30,000 to $34,999 | 189 (18.2%) | 79 (10.8%) |
| $35,000 to $39,999 | 33 (3.2%) | 11 (1.5%) |
| $40,000 to $44,999 | 153 (14.7%) | 0 (0.0%) |
| $45,000 to $49,999 | 0 (0.0%) | 30 (4.1%) |
| $50,000 to $54,999 | 95 (9.1%) | 12 (1.6%) |
| $55,000 to $64,999 | 102 (9.8%) | 101 (13.8%) |
| $65,000 to $74,999 | 0 (0.0%) | 111 (15.2%) |
| $75,000 to $99,999 | 79 (7.6%) | 71 (9.7%) |
| $100,000+ | 161 (15.5%) | 52 (7.1%) |
| Total | 1,041 (100.0%) | 730 (100.0%) |
Earnings by Sex by Educational Attainment in Barrett
Average earnings in Barrett are $44,337 for men and $46,917 for women, a difference of 5.5%. Men with an educational attainment of college or associate's degree enjoy the highest average annual earnings of $44,688, while those with high school diploma education earn the least with $43,304. Women with an educational attainment of bachelor's degree earn the most with the average annual earnings of $80,833, while those with high school diploma education have the smallest earnings of $28,708.
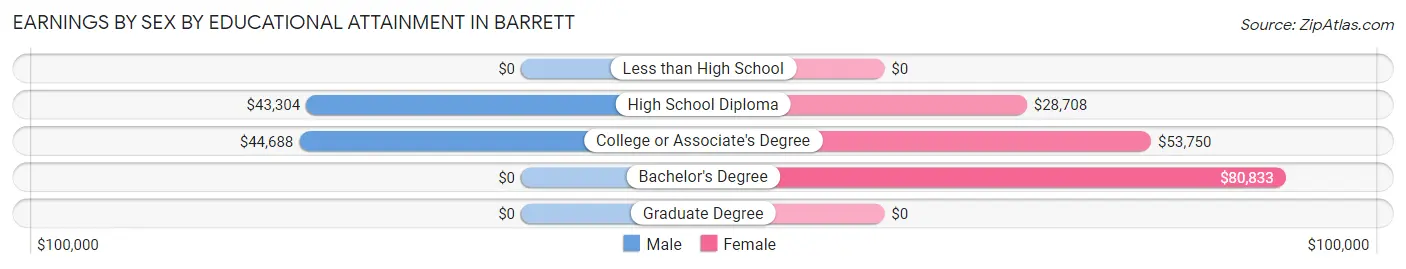
| Educational Attainment | Male Income | Female Income |
| Less than High School | - | - |
| High School Diploma | $43,304 | $28,708 |
| College or Associate's Degree | $44,688 | $53,750 |
| Bachelor's Degree | - | - |
| Graduate Degree | - | - |
| Total | $44,337 | $46,917 |
Family Income in Barrett
Family Income Brackets in Barrett
According to the Barrett family income data, there are 226 families falling into the $50,000 to $74,999 income range, which is the most common income bracket and makes up 24.9% of all families.
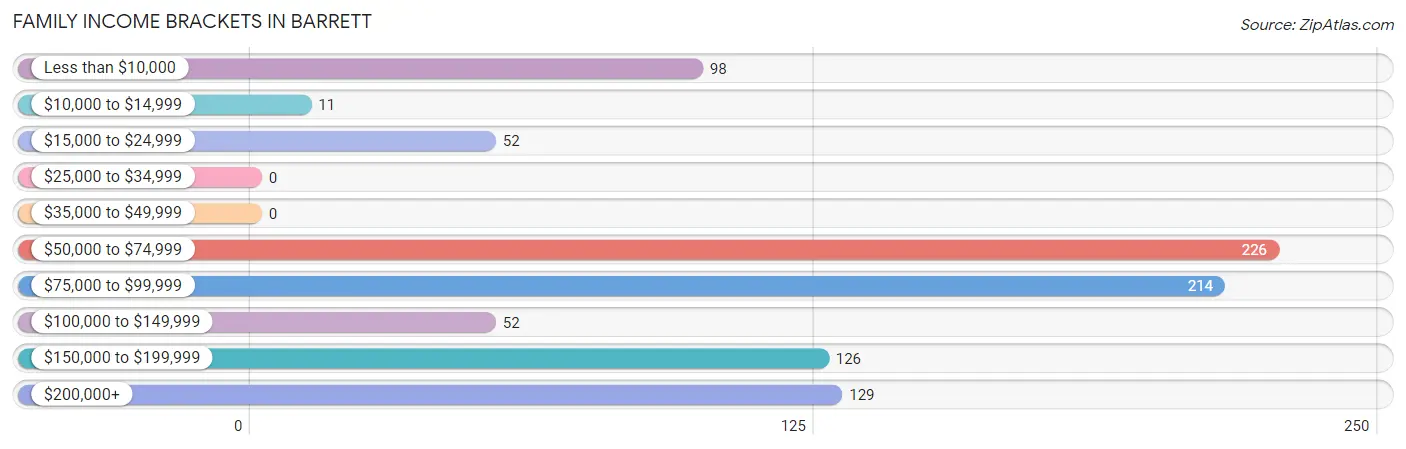
| Income Bracket | # Families | % Families |
| Less than $10,000 | 98 | 10.8% |
| $10,000 to $14,999 | 11 | 1.2% |
| $15,000 to $24,999 | 52 | 5.7% |
| $25,000 to $34,999 | 0 | 0.0% |
| $35,000 to $49,999 | 0 | 0.0% |
| $50,000 to $74,999 | 226 | 24.9% |
| $75,000 to $99,999 | 214 | 23.6% |
| $100,000 to $149,999 | 52 | 5.7% |
| $150,000 to $199,999 | 126 | 13.9% |
| $200,000+ | 129 | 14.2% |
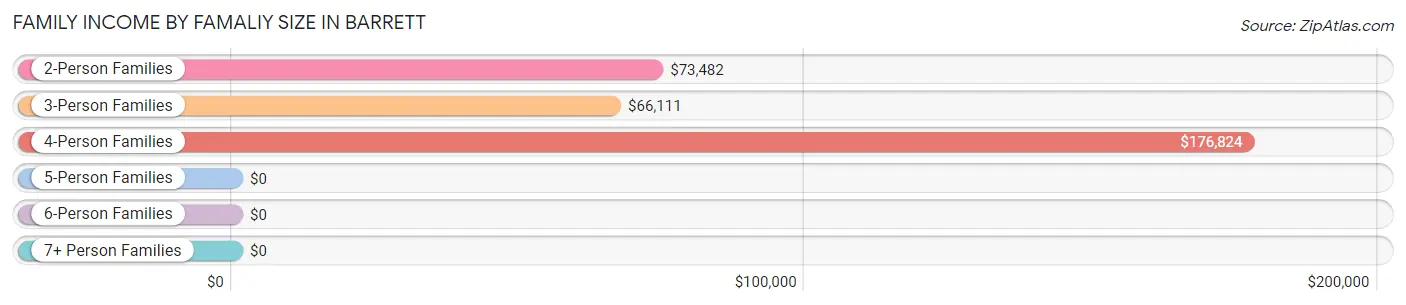
Family Income by Famaliy Size in Barrett
4-person families (240 | 26.4%) account for the highest median family income in Barrett with $176,824 per family, while 4-person families (240 | 26.4%) have the highest median income of $44,206 per family member.
| Income Bracket | # Families | Median Income |
| 2-Person Families | 231 (25.4%) | $73,482 |
| 3-Person Families | 370 (40.7%) | $66,111 |
| 4-Person Families | 240 (26.4%) | $176,824 |
| 5-Person Families | 67 (7.4%) | $0 |
| 6-Person Families | 0 (0.0%) | $0 |
| 7+ Person Families | 0 (0.0%) | $0 |
| Total | 908 (100.0%) | $80,125 |
Family Income by Number of Earners in Barrett
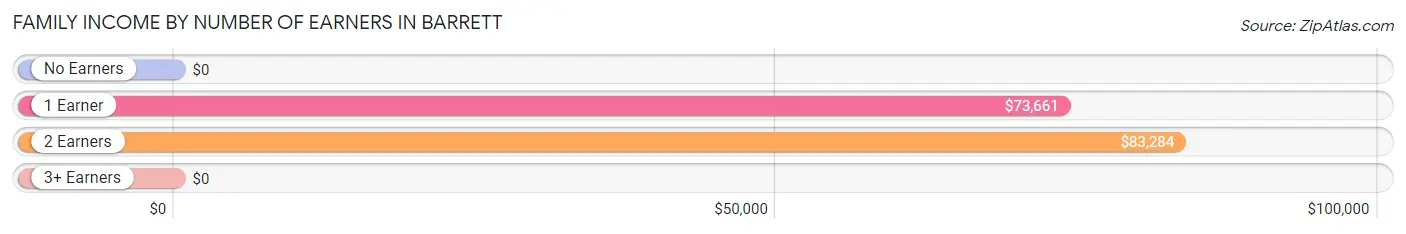
| Number of Earners | # Families | Median Income |
| No Earners | 183 (20.2%) | $0 |
| 1 Earner | 181 (19.9%) | $73,661 |
| 2 Earners | 426 (46.9%) | $83,284 |
| 3+ Earners | 118 (13.0%) | $0 |
| Total | 908 (100.0%) | $80,125 |
Household Income in Barrett
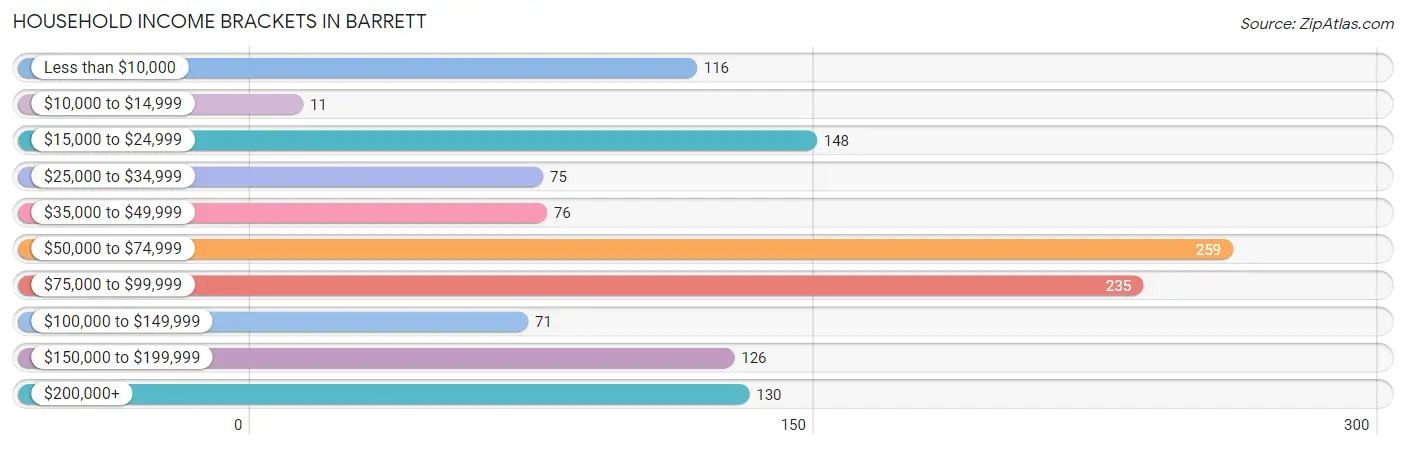
Household Income Brackets in Barrett
With 259 households falling in the category, the $50,000 to $74,999 income range is the most frequent in Barrett, accounting for 20.8% of all households. In contrast, only 11 households (0.9%) fall into the $10,000 to $14,999 income bracket, making it the least populous group.
| Income Bracket | # Households | % Households |
| Less than $10,000 | 116 | 9.3% |
| $10,000 to $14,999 | 11 | 0.9% |
| $15,000 to $24,999 | 148 | 11.9% |
| $25,000 to $34,999 | 75 | 6.0% |
| $35,000 to $49,999 | 76 | 6.1% |
| $50,000 to $74,999 | 259 | 20.8% |
| $75,000 to $99,999 | 235 | 18.9% |
| $100,000 to $149,999 | 71 | 5.7% |
| $150,000 to $199,999 | 126 | 10.1% |
| $200,000+ | 130 | 10.4% |
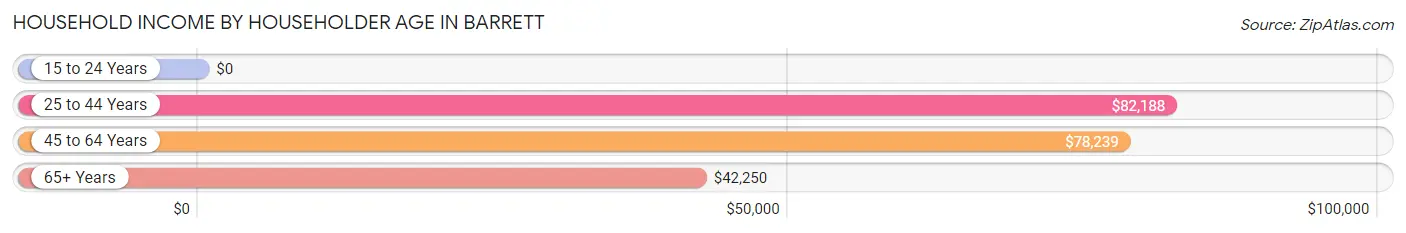
Household Income by Householder Age in Barrett
The median household income in Barrett is $66,883, with the highest median household income of $82,188 found in the 25 to 44 years age bracket for the primary householder. A total of 561 households (45.0%) fall into this category.
| Income Bracket | # Households | Median Income |
| 15 to 24 Years | 0 (0.0%) | $0 |
| 25 to 44 Years | 561 (45.0%) | $82,188 |
| 45 to 64 Years | 319 (25.6%) | $78,239 |
| 65+ Years | 366 (29.4%) | $42,250 |
| Total | 1,246 (100.0%) | $66,883 |
Poverty in Barrett
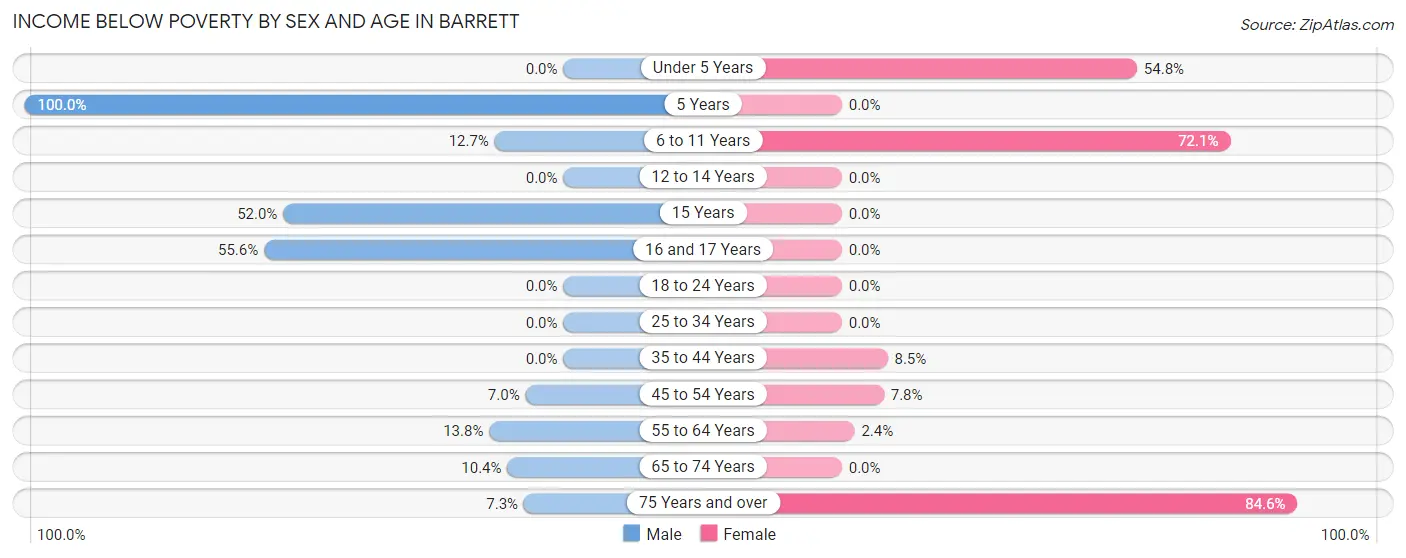
Income Below Poverty by Sex and Age in Barrett
With 6.4% poverty level for males and 23.4% for females among the residents of Barrett, 5 year old males and 75 year old and over females are the most vulnerable to poverty, with 15 males (100.0%) and 115 females (84.6%) in their respective age groups living below the poverty level.
| Age Bracket | Male | Female |
| Under 5 Years | 0 (0.0%) | 126 (54.8%) |
| 5 Years | 15 (100.0%) | 0 (0.0%) |
| 6 to 11 Years | 27 (12.7%) | 124 (72.1%) |
| 12 to 14 Years | 0 (0.0%) | 0 (0.0%) |
| 15 Years | 13 (52.0%) | 0 (0.0%) |
| 16 and 17 Years | 15 (55.6%) | 0 (0.0%) |
| 18 to 24 Years | 0 (0.0%) | 0 (0.0%) |
| 25 to 34 Years | 0 (0.0%) | 0 (0.0%) |
| 35 to 44 Years | 0 (0.0%) | 23 (8.5%) |
| 45 to 54 Years | 13 (7.0%) | 12 (7.8%) |
| 55 to 64 Years | 15 (13.8%) | 4 (2.4%) |
| 65 to 74 Years | 8 (10.4%) | 0 (0.0%) |
| 75 Years and over | 6 (7.3%) | 115 (84.6%) |
| Total | 112 (6.4%) | 404 (23.4%) |
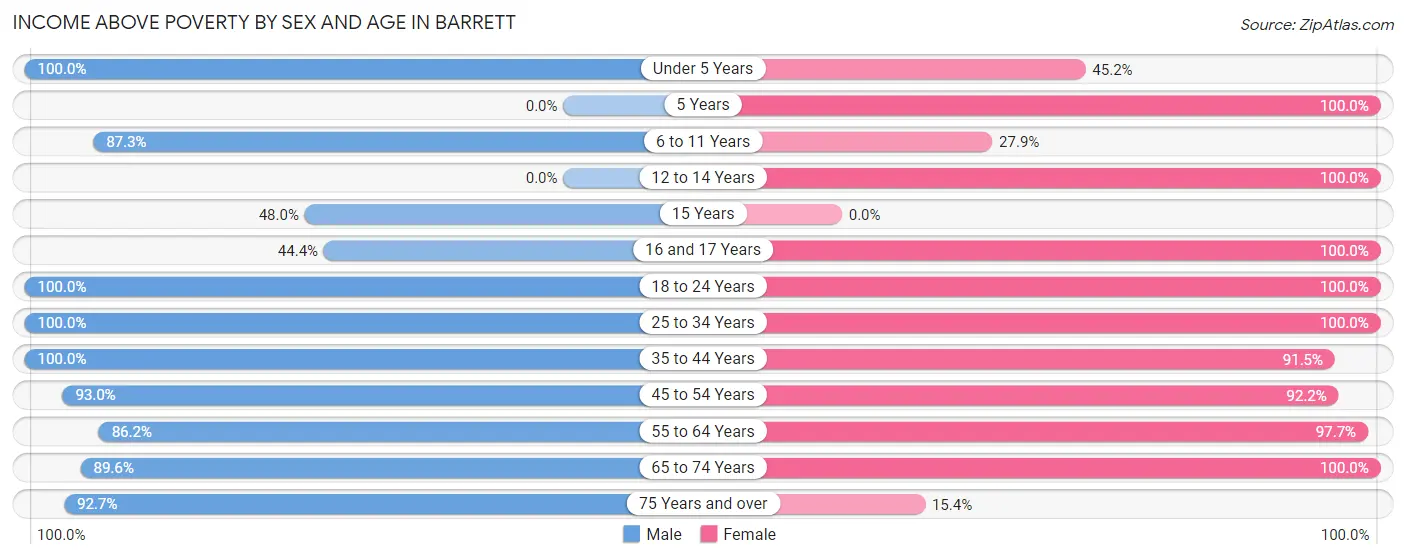
Income Above Poverty by Sex and Age in Barrett
According to the poverty statistics in Barrett, males aged under 5 years and females aged 5 years are the age groups that are most secure financially, with 100.0% of males and 100.0% of females in these age groups living above the poverty line.
| Age Bracket | Male | Female |
| Under 5 Years | 133 (100.0%) | 104 (45.2%) |
| 5 Years | 0 (0.0%) | 33 (100.0%) |
| 6 to 11 Years | 185 (87.3%) | 48 (27.9%) |
| 12 to 14 Years | 0 (0.0%) | 36 (100.0%) |
| 15 Years | 12 (48.0%) | 0 (0.0%) |
| 16 and 17 Years | 12 (44.4%) | 12 (100.0%) |
| 18 to 24 Years | 126 (100.0%) | 141 (100.0%) |
| 25 to 34 Years | 392 (100.0%) | 201 (100.0%) |
| 35 to 44 Years | 377 (100.0%) | 248 (91.5%) |
| 45 to 54 Years | 172 (93.0%) | 142 (92.2%) |
| 55 to 64 Years | 94 (86.2%) | 166 (97.7%) |
| 65 to 74 Years | 69 (89.6%) | 172 (100.0%) |
| 75 Years and over | 76 (92.7%) | 21 (15.4%) |
| Total | 1,648 (93.6%) | 1,324 (76.6%) |
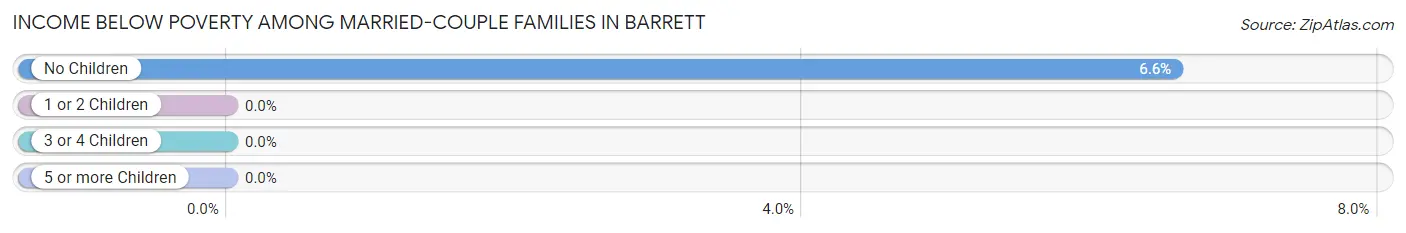
Income Below Poverty Among Married-Couple Families in Barrett
The poverty statistics for married-couple families in Barrett show that 3.2% or 21 of the total 648 families live below the poverty line. Families with no children have the highest poverty rate of 6.6%, comprising of 21 families. On the other hand, families with 1 or 2 children have the lowest poverty rate of 0.0%, which includes 0 families.
| Children | Above Poverty | Below Poverty |
| No Children | 298 (93.4%) | 21 (6.6%) |
| 1 or 2 Children | 262 (100.0%) | 0 (0.0%) |
| 3 or 4 Children | 67 (100.0%) | 0 (0.0%) |
| 5 or more Children | 0 (0.0%) | 0 (0.0%) |
| Total | 627 (96.8%) | 21 (3.2%) |
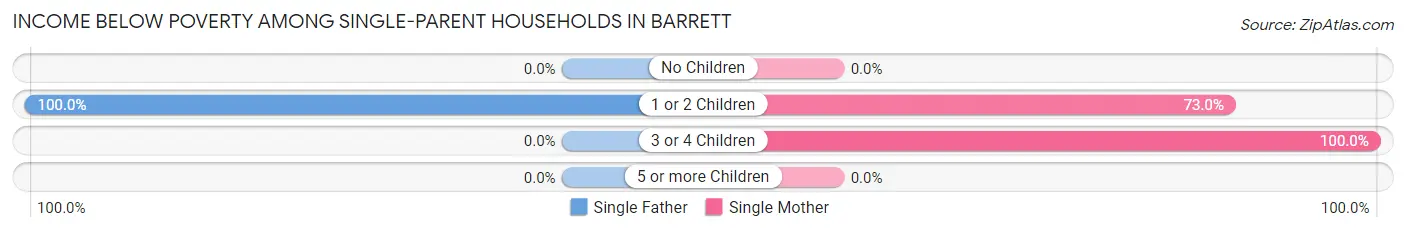
Income Below Poverty Among Single-Parent Households in Barrett
According to the poverty data in Barrett, 57.1% or 8 single-father households and 43.1% or 106 single-mother households are living below the poverty line. Among single-father households, those with 1 or 2 children have the highest poverty rate, with 8 households (100.0%) experiencing poverty. Likewise, among single-mother households, those with 3 or 4 children have the highest poverty rate, with 14 households (100.0%) falling below the poverty line.
| Children | Single Father | Single Mother |
| No Children | 0 (0.0%) | 0 (0.0%) |
| 1 or 2 Children | 8 (100.0%) | 92 (73.0%) |
| 3 or 4 Children | 0 (0.0%) | 14 (100.0%) |
| 5 or more Children | 0 (0.0%) | 0 (0.0%) |
| Total | 8 (57.1%) | 106 (43.1%) |
Income Below Poverty Among Married-Couple vs Single-Parent Households in Barrett
The poverty data for Barrett shows that 21 of the married-couple family households (3.2%) and 114 of the single-parent households (43.9%) are living below the poverty level. Within the married-couple family households, those with no children have the highest poverty rate, with 21 households (6.6%) falling below the poverty line. Among the single-parent households, those with 3 or 4 children have the highest poverty rate, with 14 household (100.0%) living below poverty.
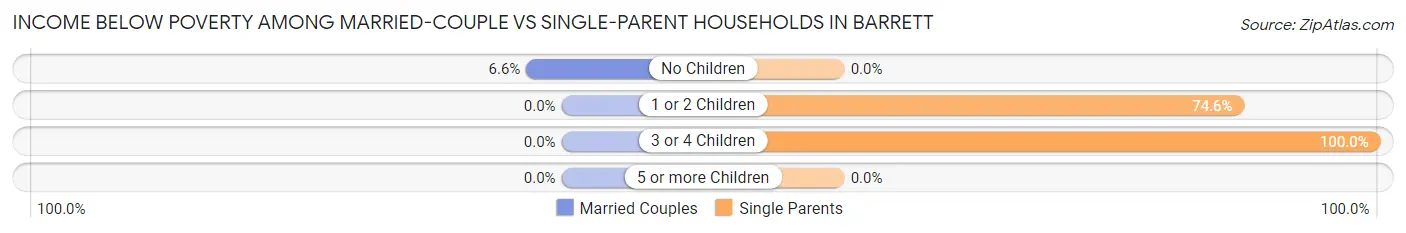
| Children | Married-Couple Families | Single-Parent Households |
| No Children | 21 (6.6%) | 0 (0.0%) |
| 1 or 2 Children | 0 (0.0%) | 100 (74.6%) |
| 3 or 4 Children | 0 (0.0%) | 14 (100.0%) |
| 5 or more Children | 0 (0.0%) | 0 (0.0%) |
| Total | 21 (3.2%) | 114 (43.9%) |
Employment Characteristics in Barrett
Employment by Class of Employer in Barrett
Among the 1,677 employed individuals in Barrett, private company employees (1,329 | 79.2%), local government employees (128 | 7.6%), and not-for-profit organizations (74 | 4.4%) make up the most common classes of employment.
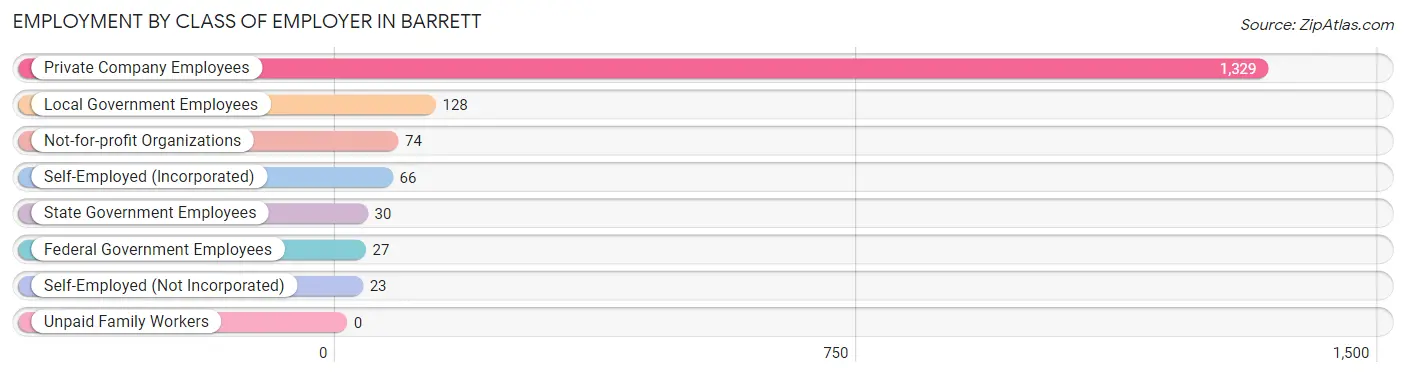
| Employer Class | # Employees | % Employees |
| Private Company Employees | 1,329 | 79.2% |
| Self-Employed (Incorporated) | 66 | 3.9% |
| Self-Employed (Not Incorporated) | 23 | 1.4% |
| Not-for-profit Organizations | 74 | 4.4% |
| Local Government Employees | 128 | 7.6% |
| State Government Employees | 30 | 1.8% |
| Federal Government Employees | 27 | 1.6% |
| Unpaid Family Workers | 0 | 0.0% |
| Total | 1,677 | 100.0% |
Employment Status by Age in Barrett
According to the labor force statistics for Barrett, out of the total population over 16 years of age (2,632), 69.8% or 1,837 individuals are in the labor force, with 7.5% or 138 of them unemployed. The age group with the highest labor force participation rate is 25 to 29 years, with 100.0% or 508 individuals in the labor force. Within the labor force, the 45 to 54 years age range has the highest percentage of unemployed individuals, with 30.0% or 65 of them being unemployed.
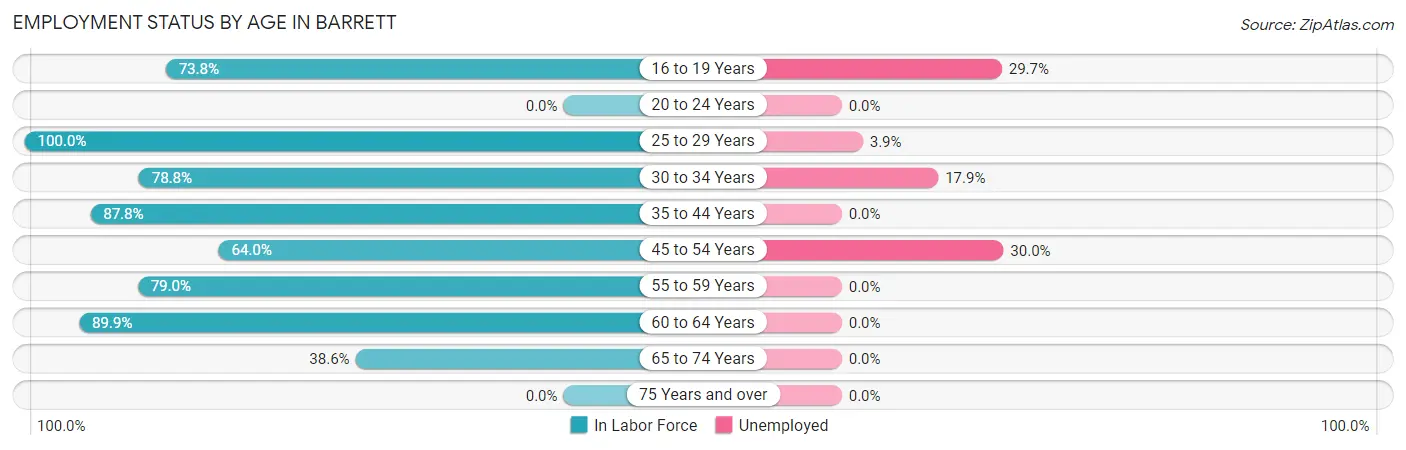
| Age Bracket | In Labor Force | Unemployed |
| 16 to 19 Years | 138 (73.8%) | 41 (29.7%) |
| 20 to 24 Years | 0 (0.0%) | 0 (0.0%) |
| 25 to 29 Years | 508 (100.0%) | 20 (3.9%) |
| 30 to 34 Years | 67 (78.8%) | 12 (17.9%) |
| 35 to 44 Years | 569 (87.8%) | 0 (0.0%) |
| 45 to 54 Years | 217 (64.0%) | 65 (30.0%) |
| 55 to 59 Years | 64 (79.0%) | 0 (0.0%) |
| 60 to 64 Years | 178 (89.9%) | 0 (0.0%) |
| 65 to 74 Years | 96 (38.6%) | 0 (0.0%) |
| 75 Years and over | 0 (0.0%) | 0 (0.0%) |
| Total | 1,837 (69.8%) | 138 (7.5%) |
Employment Status by Educational Attainment in Barrett
According to labor force statistics for Barrett, 86.2% of individuals (1,602) out of the total population between 25 and 64 years of age (1,859) are in the labor force, with 6.1% or 98 of them being unemployed. The group with the highest labor force participation rate are those with the educational attainment of college / associate degree, with 94.6% or 853 individuals in the labor force. Within the labor force, individuals with high school diploma education have the highest percentage of unemployment, with 14.2% or 54 of them being unemployed.
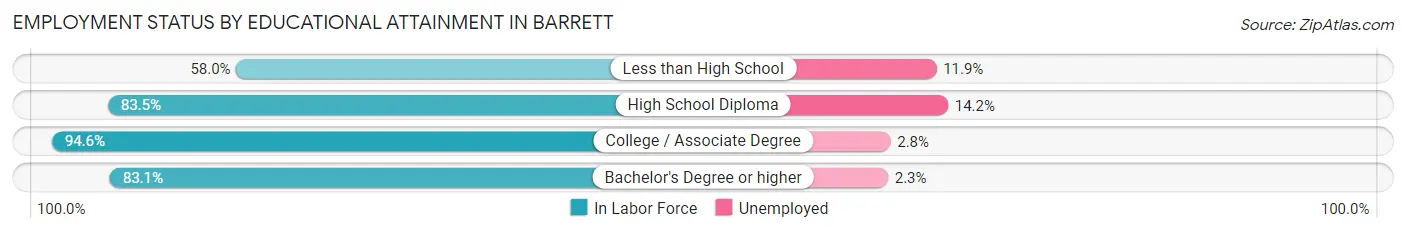
| Educational Attainment | In Labor Force | Unemployed |
| Less than High School | 109 (58.0%) | 22 (11.9%) |
| High School Diploma | 380 (83.5%) | 65 (14.2%) |
| College / Associate Degree | 853 (94.6%) | 25 (2.8%) |
| Bachelor's Degree or higher | 261 (83.1%) | 7 (2.3%) |
| Total | 1,602 (86.2%) | 113 (6.1%) |
Employment Occupations by Sex in Barrett
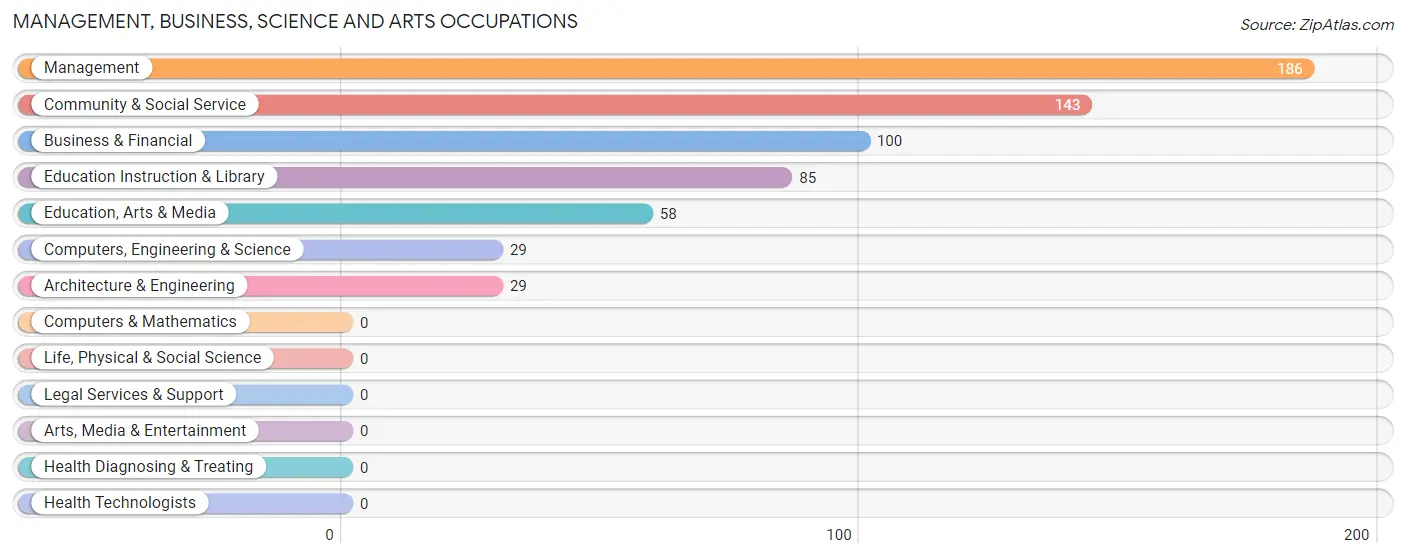
Management, Business, Science and Arts Occupations
The most common Management, Business, Science and Arts occupations in Barrett are Management (186 | 11.0%), Community & Social Service (143 | 8.4%), Business & Financial (100 | 5.9%), Education Instruction & Library (85 | 5.0%), and Education, Arts & Media (58 | 3.4%).
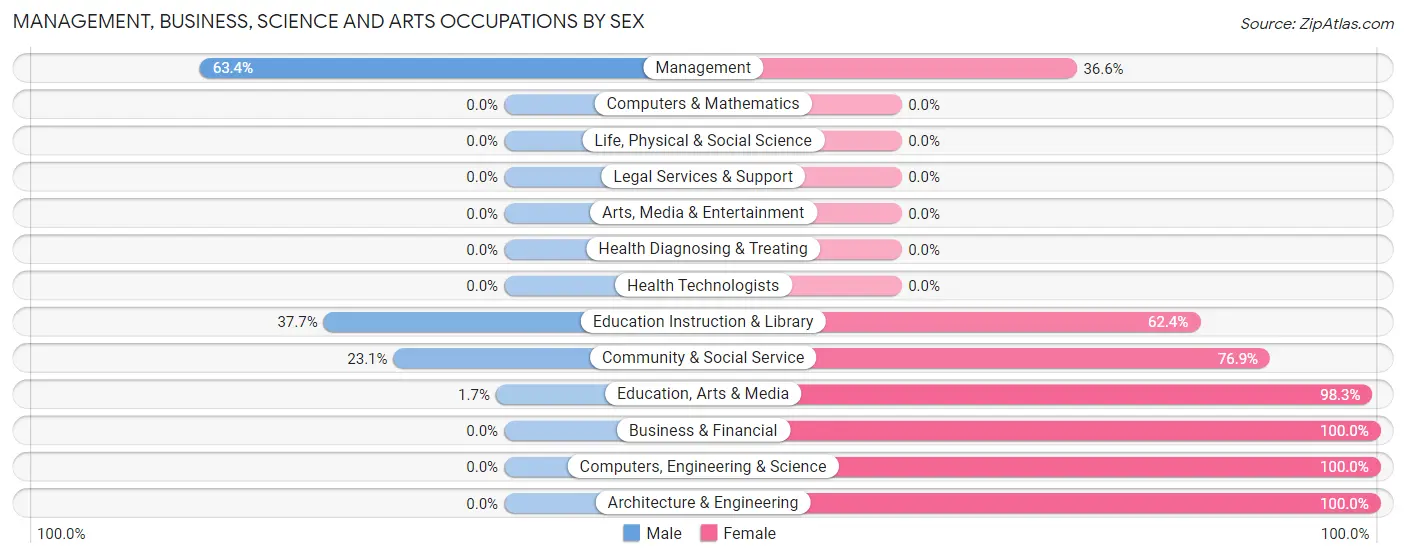
Management, Business, Science and Arts Occupations by Sex
Within the Management, Business, Science and Arts occupations in Barrett, the most male-oriented occupations are Management (63.4%), Education Instruction & Library (37.7%), and Community & Social Service (23.1%), while the most female-oriented occupations are Business & Financial (100.0%), Computers, Engineering & Science (100.0%), and Architecture & Engineering (100.0%).
| Occupation | Male | Female |
| Management | 118 (63.4%) | 68 (36.6%) |
| Business & Financial | 0 (0.0%) | 100 (100.0%) |
| Computers, Engineering & Science | 0 (0.0%) | 29 (100.0%) |
| Computers & Mathematics | 0 (0.0%) | 0 (0.0%) |
| Architecture & Engineering | 0 (0.0%) | 29 (100.0%) |
| Life, Physical & Social Science | 0 (0.0%) | 0 (0.0%) |
| Community & Social Service | 33 (23.1%) | 110 (76.9%) |
| Education, Arts & Media | 1 (1.7%) | 57 (98.3%) |
| Legal Services & Support | 0 (0.0%) | 0 (0.0%) |
| Education Instruction & Library | 32 (37.7%) | 53 (62.4%) |
| Arts, Media & Entertainment | 0 (0.0%) | 0 (0.0%) |
| Health Diagnosing & Treating | 0 (0.0%) | 0 (0.0%) |
| Health Technologists | 0 (0.0%) | 0 (0.0%) |
| Total (Category) | 151 (33.0%) | 307 (67.0%) |
| Total (Overall) | 1,029 (60.6%) | 670 (39.4%) |
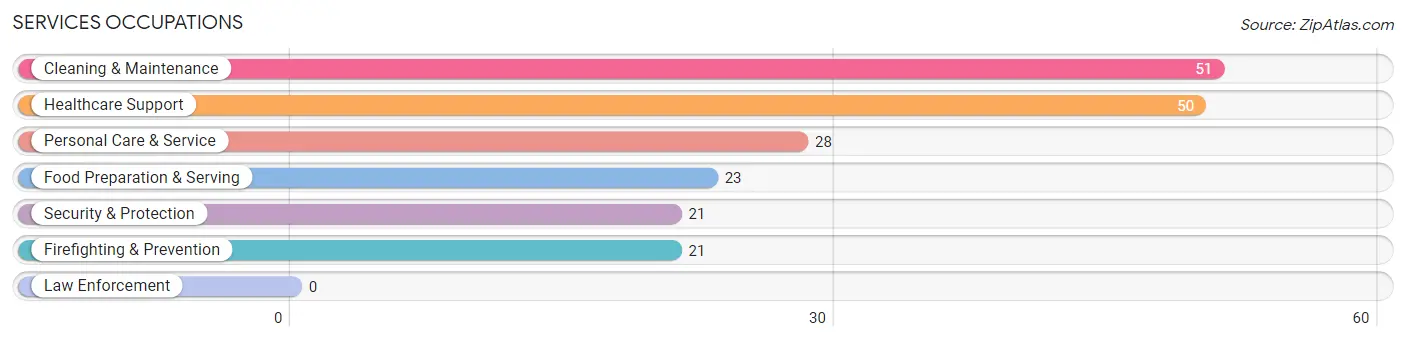
Services Occupations
The most common Services occupations in Barrett are Cleaning & Maintenance (51 | 3.0%), Healthcare Support (50 | 2.9%), Personal Care & Service (28 | 1.7%), Food Preparation & Serving (23 | 1.3%), and Security & Protection (21 | 1.2%).
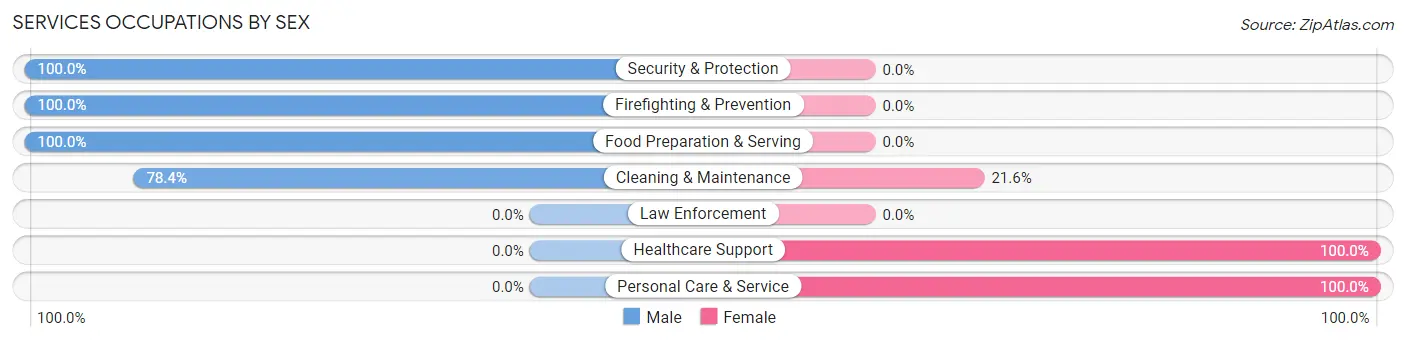
Services Occupations by Sex
Within the Services occupations in Barrett, the most male-oriented occupations are Security & Protection (100.0%), Firefighting & Prevention (100.0%), and Food Preparation & Serving (100.0%), while the most female-oriented occupations are Healthcare Support (100.0%), Personal Care & Service (100.0%), and Cleaning & Maintenance (21.6%).
| Occupation | Male | Female |
| Healthcare Support | 0 (0.0%) | 50 (100.0%) |
| Security & Protection | 21 (100.0%) | 0 (0.0%) |
| Firefighting & Prevention | 21 (100.0%) | 0 (0.0%) |
| Law Enforcement | 0 (0.0%) | 0 (0.0%) |
| Food Preparation & Serving | 23 (100.0%) | 0 (0.0%) |
| Cleaning & Maintenance | 40 (78.4%) | 11 (21.6%) |
| Personal Care & Service | 0 (0.0%) | 28 (100.0%) |
| Total (Category) | 84 (48.5%) | 89 (51.4%) |
| Total (Overall) | 1,029 (60.6%) | 670 (39.4%) |
Sales and Office Occupations
The most common Sales and Office occupations in Barrett are Office & Administration (170 | 10.0%), and Sales & Related (132 | 7.8%).
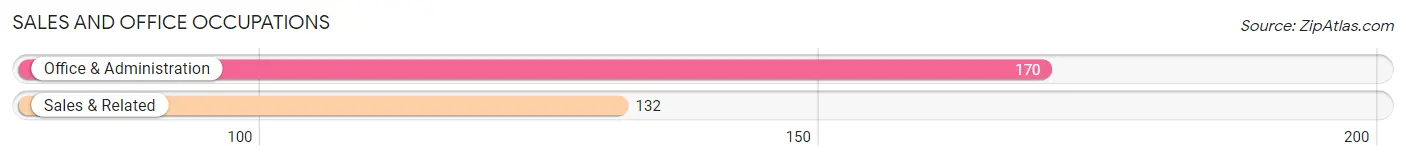
Sales and Office Occupations by Sex

| Occupation | Male | Female |
| Sales & Related | 66 (50.0%) | 66 (50.0%) |
| Office & Administration | 31 (18.2%) | 139 (81.8%) |
| Total (Category) | 97 (32.1%) | 205 (67.9%) |
| Total (Overall) | 1,029 (60.6%) | 670 (39.4%) |
Natural Resources, Construction and Maintenance Occupations
The most common Natural Resources, Construction and Maintenance occupations in Barrett are Construction & Extraction (206 | 12.1%), and Installation, Maintenance & Repair (19 | 1.1%).
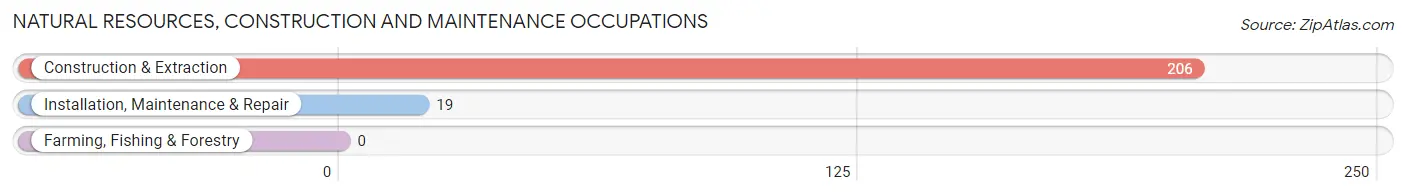
Natural Resources, Construction and Maintenance Occupations by Sex

| Occupation | Male | Female |
| Farming, Fishing & Forestry | 0 (0.0%) | 0 (0.0%) |
| Construction & Extraction | 206 (100.0%) | 0 (0.0%) |
| Installation, Maintenance & Repair | 19 (100.0%) | 0 (0.0%) |
| Total (Category) | 225 (100.0%) | 0 (0.0%) |
| Total (Overall) | 1,029 (60.6%) | 670 (39.4%) |
Production, Transportation and Moving Occupations
The most common Production, Transportation and Moving occupations in Barrett are Material Moving (260 | 15.3%), Transportation (208 | 12.2%), and Production (73 | 4.3%).
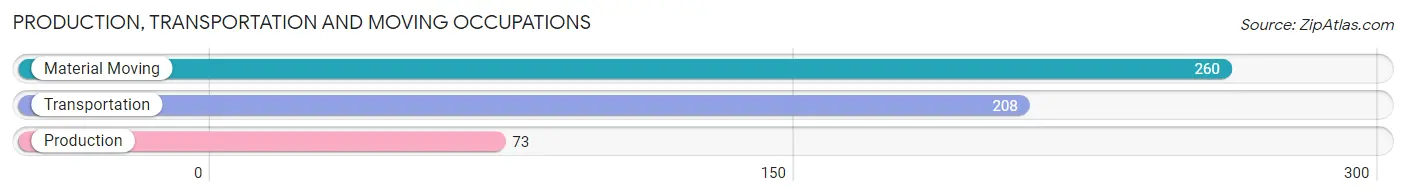
Production, Transportation and Moving Occupations by Sex
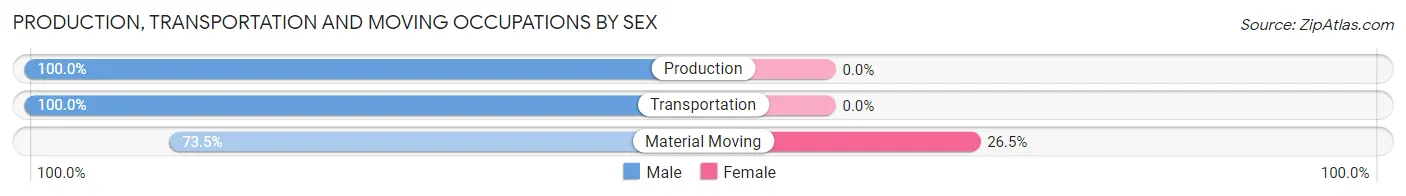
| Occupation | Male | Female |
| Production | 73 (100.0%) | 0 (0.0%) |
| Transportation | 208 (100.0%) | 0 (0.0%) |
| Material Moving | 191 (73.5%) | 69 (26.5%) |
| Total (Category) | 472 (87.3%) | 69 (12.8%) |
| Total (Overall) | 1,029 (60.6%) | 670 (39.4%) |
Employment Industries by Sex in Barrett
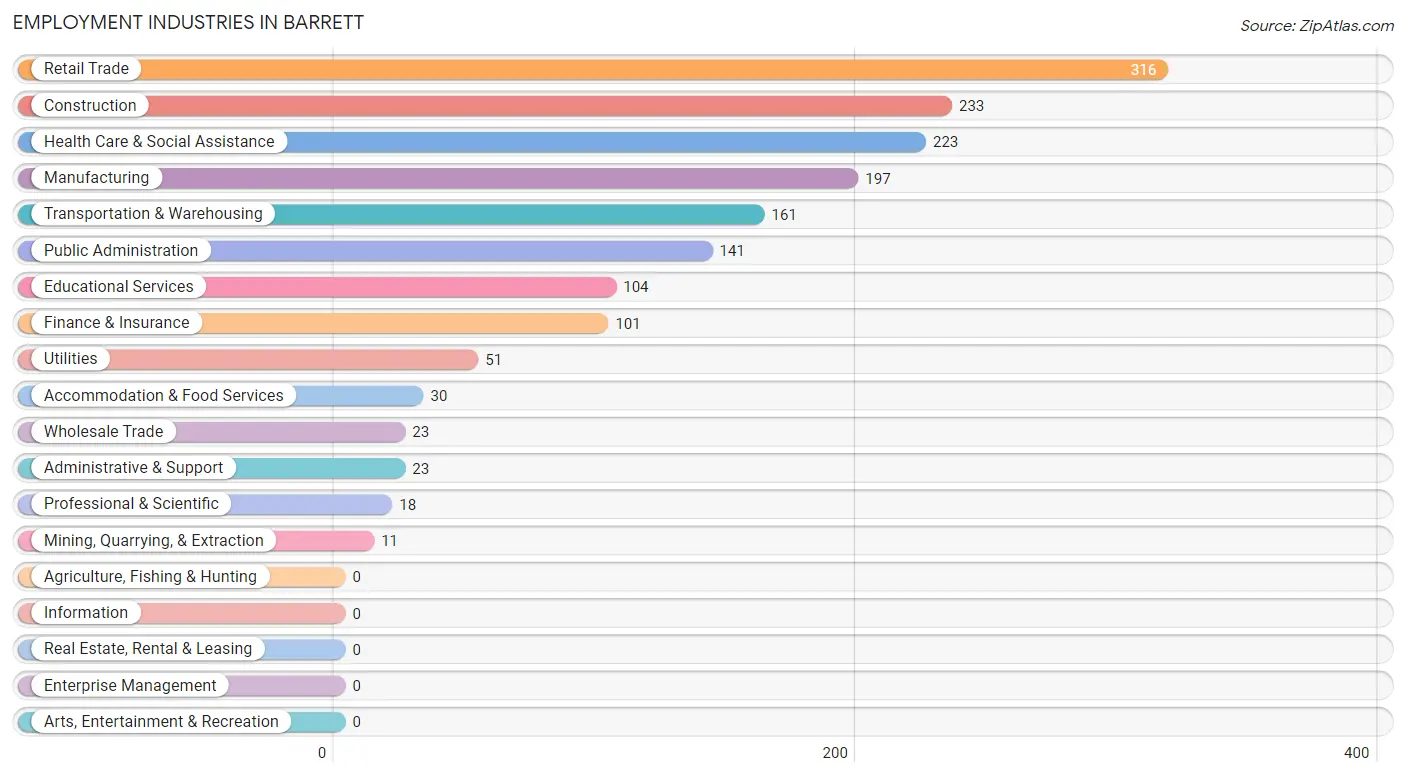
Employment Industries in Barrett
The major employment industries in Barrett include Retail Trade (316 | 18.6%), Construction (233 | 13.7%), Health Care & Social Assistance (223 | 13.1%), Manufacturing (197 | 11.6%), and Transportation & Warehousing (161 | 9.5%).
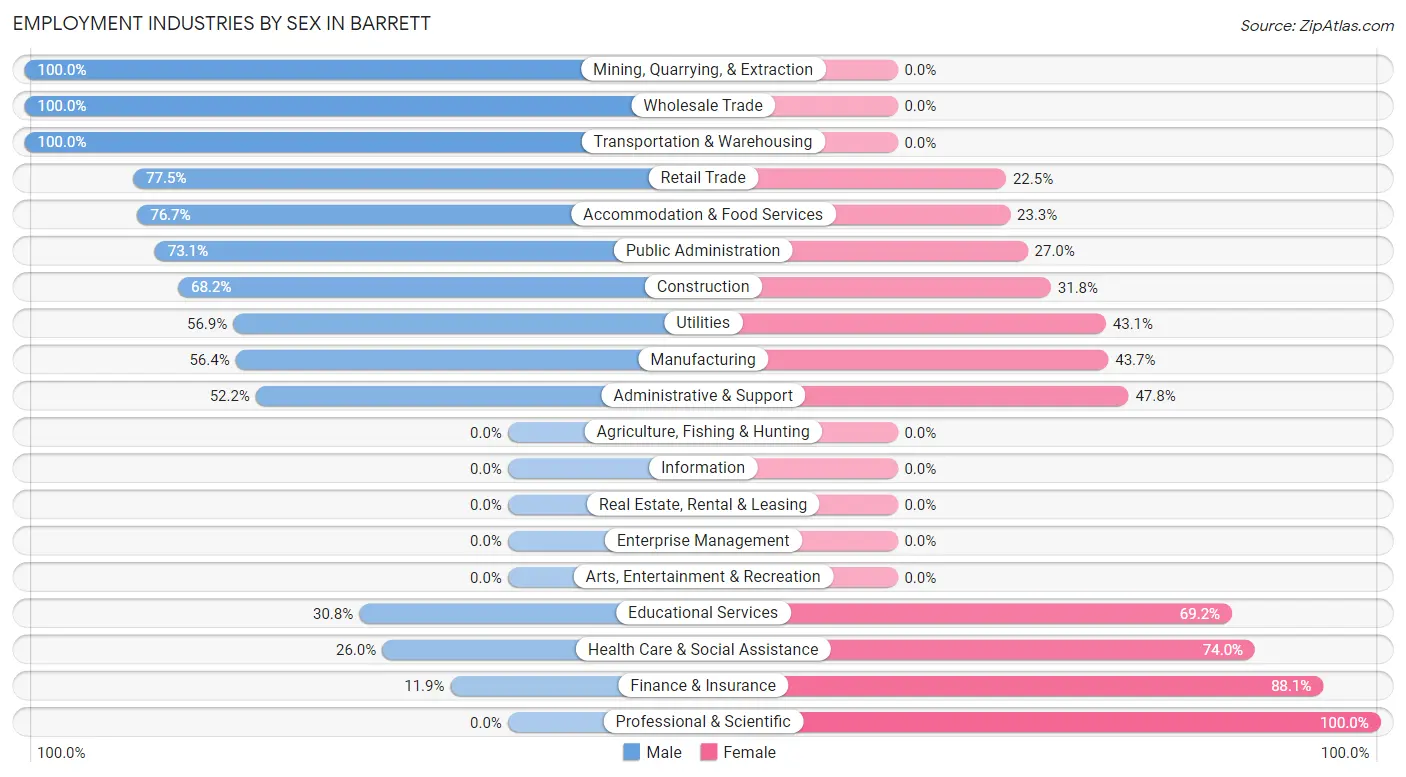
Employment Industries by Sex in Barrett
The Barrett industries that see more men than women are Mining, Quarrying, & Extraction (100.0%), Wholesale Trade (100.0%), and Transportation & Warehousing (100.0%), whereas the industries that tend to have a higher number of women are Professional & Scientific (100.0%), Finance & Insurance (88.1%), and Health Care & Social Assistance (74.0%).
| Industry | Male | Female |
| Agriculture, Fishing & Hunting | 0 (0.0%) | 0 (0.0%) |
| Mining, Quarrying, & Extraction | 11 (100.0%) | 0 (0.0%) |
| Construction | 159 (68.2%) | 74 (31.8%) |
| Manufacturing | 111 (56.4%) | 86 (43.6%) |
| Wholesale Trade | 23 (100.0%) | 0 (0.0%) |
| Retail Trade | 245 (77.5%) | 71 (22.5%) |
| Transportation & Warehousing | 161 (100.0%) | 0 (0.0%) |
| Utilities | 29 (56.9%) | 22 (43.1%) |
| Information | 0 (0.0%) | 0 (0.0%) |
| Finance & Insurance | 12 (11.9%) | 89 (88.1%) |
| Real Estate, Rental & Leasing | 0 (0.0%) | 0 (0.0%) |
| Professional & Scientific | 0 (0.0%) | 18 (100.0%) |
| Enterprise Management | 0 (0.0%) | 0 (0.0%) |
| Administrative & Support | 12 (52.2%) | 11 (47.8%) |
| Educational Services | 32 (30.8%) | 72 (69.2%) |
| Health Care & Social Assistance | 58 (26.0%) | 165 (74.0%) |
| Arts, Entertainment & Recreation | 0 (0.0%) | 0 (0.0%) |
| Accommodation & Food Services | 23 (76.7%) | 7 (23.3%) |
| Public Administration | 103 (73.1%) | 38 (27.0%) |
| Total | 1,029 (60.6%) | 670 (39.4%) |
Education in Barrett
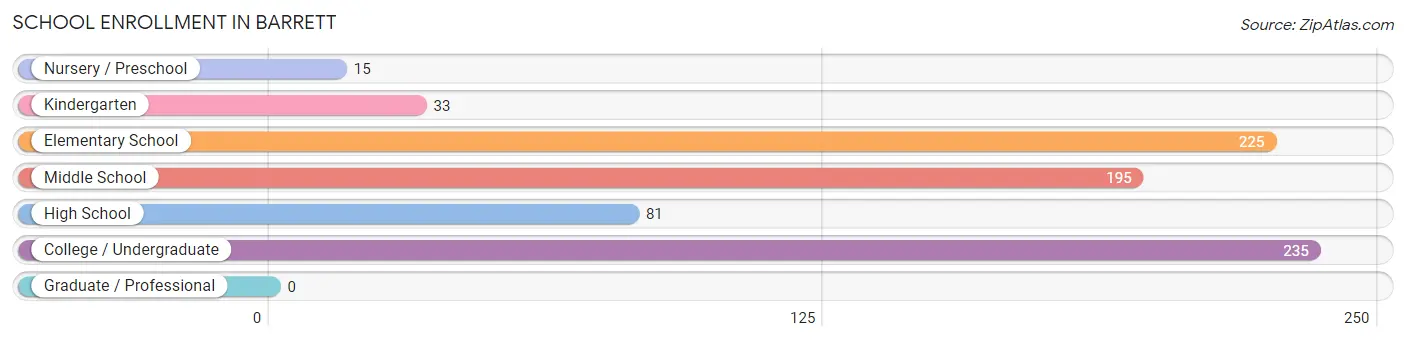
School Enrollment in Barrett
The most common levels of schooling among the 784 students in Barrett are college / undergraduate (235 | 30.0%), elementary school (225 | 28.7%), and middle school (195 | 24.9%).
| School Level | # Students | % Students |
| Nursery / Preschool | 15 | 1.9% |
| Kindergarten | 33 | 4.2% |
| Elementary School | 225 | 28.7% |
| Middle School | 195 | 24.9% |
| High School | 81 | 10.3% |
| College / Undergraduate | 235 | 30.0% |
| Graduate / Professional | 0 | 0.0% |
| Total | 784 | 100.0% |
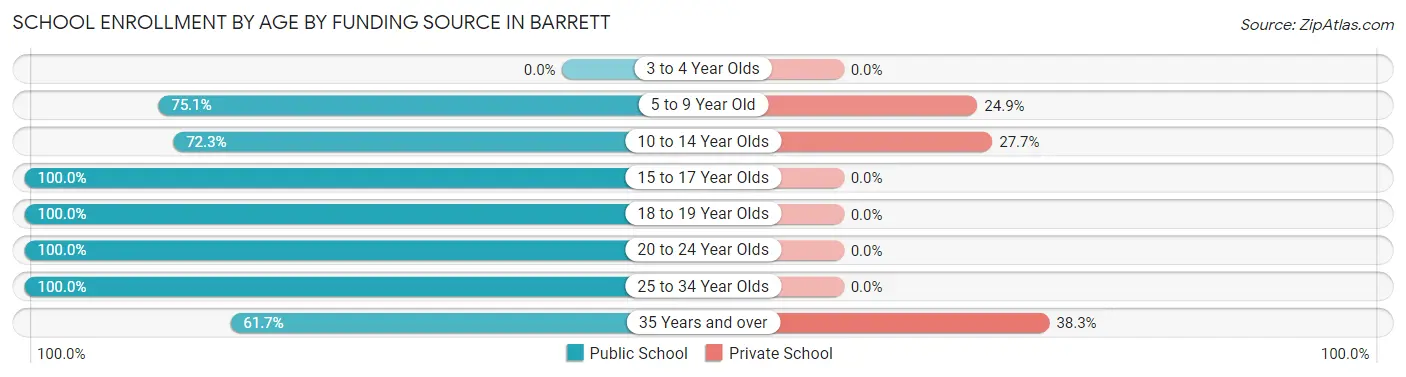
School Enrollment by Age by Funding Source in Barrett
Out of a total of 784 students who are enrolled in schools in Barrett, 145 (18.5%) attend a private institution, while the remaining 639 (81.5%) are enrolled in public schools. The age group of 35 years and over has the highest likelihood of being enrolled in private schools, with 23 (38.3% in the age bracket) enrolled. Conversely, the age group of 15 to 17 year olds has the lowest likelihood of being enrolled in a private school, with 49 (100.0% in the age bracket) attending a public institution.
| Age Bracket | Public School | Private School |
| 3 to 4 Year Olds | 0 (0.0%) | 0 (0.0%) |
| 5 to 9 Year Old | 205 (75.1%) | 68 (24.9%) |
| 10 to 14 Year Olds | 141 (72.3%) | 54 (27.7%) |
| 15 to 17 Year Olds | 49 (100.0%) | 0 (0.0%) |
| 18 to 19 Year Olds | 34 (100.0%) | 0 (0.0%) |
| 20 to 24 Year Olds | 119 (100.0%) | 0 (0.0%) |
| 25 to 34 Year Olds | 54 (100.0%) | 0 (0.0%) |
| 35 Years and over | 37 (61.7%) | 23 (38.3%) |
| Total | 639 (81.5%) | 145 (18.5%) |
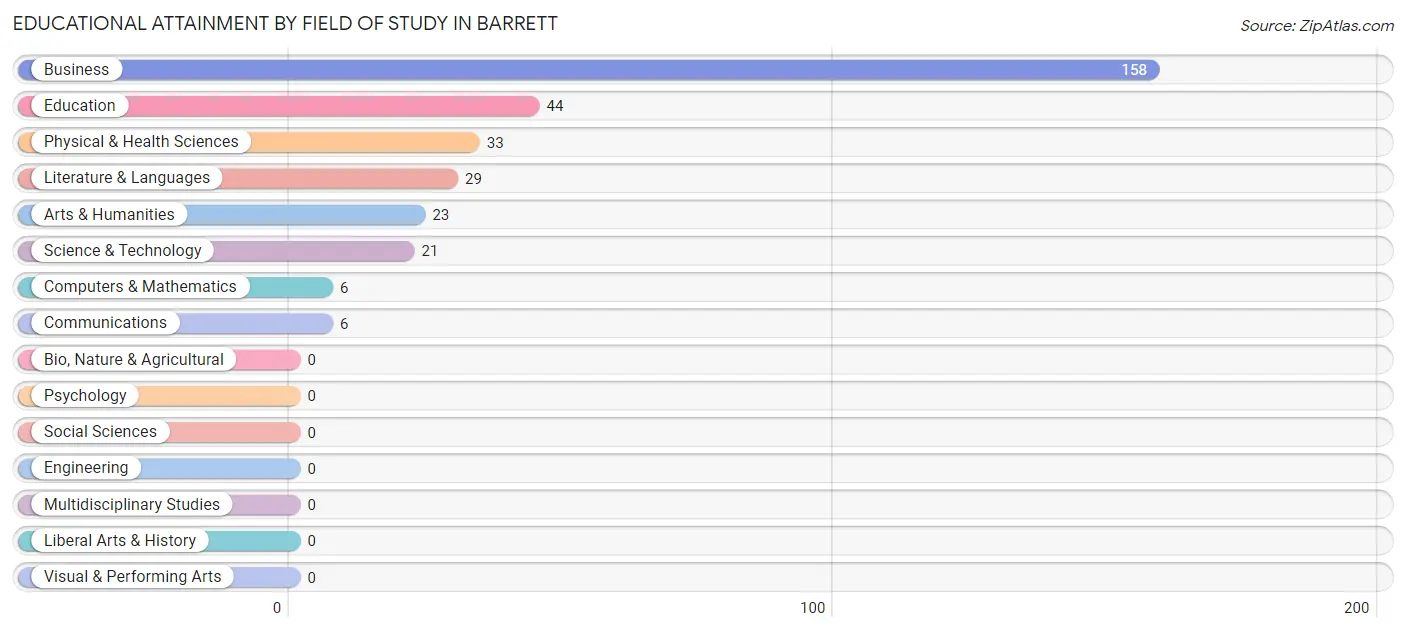
Educational Attainment by Field of Study in Barrett
Business (158 | 49.4%), education (44 | 13.8%), physical & health sciences (33 | 10.3%), literature & languages (29 | 9.1%), and arts & humanities (23 | 7.2%) are the most common fields of study among 320 individuals in Barrett who have obtained a bachelor's degree or higher.
| Field of Study | # Graduates | % Graduates |
| Computers & Mathematics | 6 | 1.9% |
| Bio, Nature & Agricultural | 0 | 0.0% |
| Physical & Health Sciences | 33 | 10.3% |
| Psychology | 0 | 0.0% |
| Social Sciences | 0 | 0.0% |
| Engineering | 0 | 0.0% |
| Multidisciplinary Studies | 0 | 0.0% |
| Science & Technology | 21 | 6.6% |
| Business | 158 | 49.4% |
| Education | 44 | 13.8% |
| Literature & Languages | 29 | 9.1% |
| Liberal Arts & History | 0 | 0.0% |
| Visual & Performing Arts | 0 | 0.0% |
| Communications | 6 | 1.9% |
| Arts & Humanities | 23 | 7.2% |
| Total | 320 | 100.0% |
Transportation & Commute in Barrett
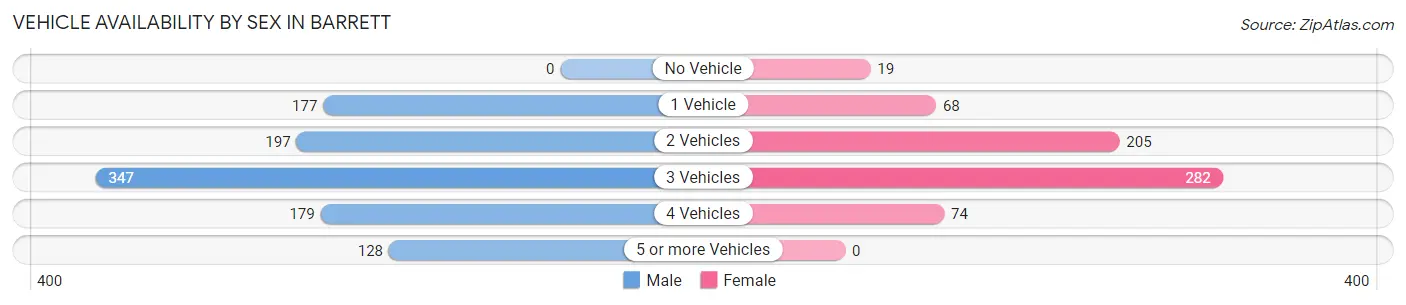
Vehicle Availability by Sex in Barrett
The most prevalent vehicle ownership categories in Barrett are males with 3 vehicles (347, accounting for 33.8%) and females with 3 vehicles (282, making up 53.5%).
| Vehicles Available | Male | Female |
| No Vehicle | 0 (0.0%) | 19 (2.9%) |
| 1 Vehicle | 177 (17.2%) | 68 (10.5%) |
| 2 Vehicles | 197 (19.2%) | 205 (31.6%) |
| 3 Vehicles | 347 (33.8%) | 282 (43.5%) |
| 4 Vehicles | 179 (17.4%) | 74 (11.4%) |
| 5 or more Vehicles | 128 (12.4%) | 0 (0.0%) |
| Total | 1,028 (100.0%) | 648 (100.0%) |
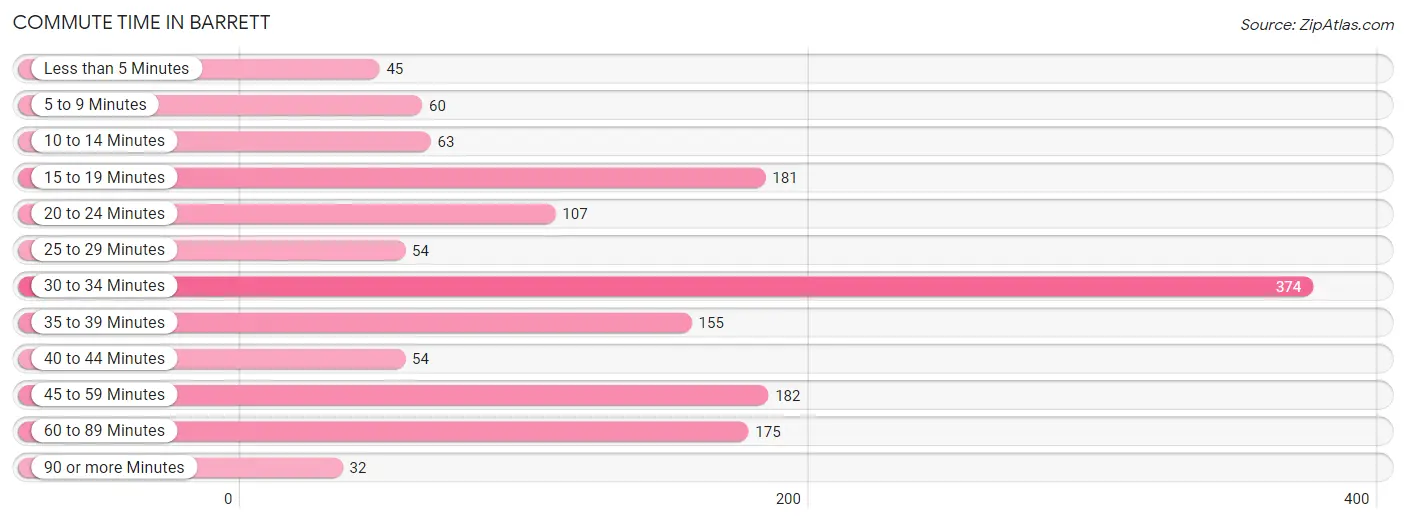
Commute Time in Barrett
The most frequently occuring commute durations in Barrett are 30 to 34 minutes (374 commuters, 25.2%), 45 to 59 minutes (182 commuters, 12.3%), and 15 to 19 minutes (181 commuters, 12.2%).
| Commute Time | # Commuters | % Commuters |
| Less than 5 Minutes | 45 | 3.0% |
| 5 to 9 Minutes | 60 | 4.1% |
| 10 to 14 Minutes | 63 | 4.3% |
| 15 to 19 Minutes | 181 | 12.2% |
| 20 to 24 Minutes | 107 | 7.2% |
| 25 to 29 Minutes | 54 | 3.6% |
| 30 to 34 Minutes | 374 | 25.2% |
| 35 to 39 Minutes | 155 | 10.5% |
| 40 to 44 Minutes | 54 | 3.6% |
| 45 to 59 Minutes | 182 | 12.3% |
| 60 to 89 Minutes | 175 | 11.8% |
| 90 or more Minutes | 32 | 2.2% |
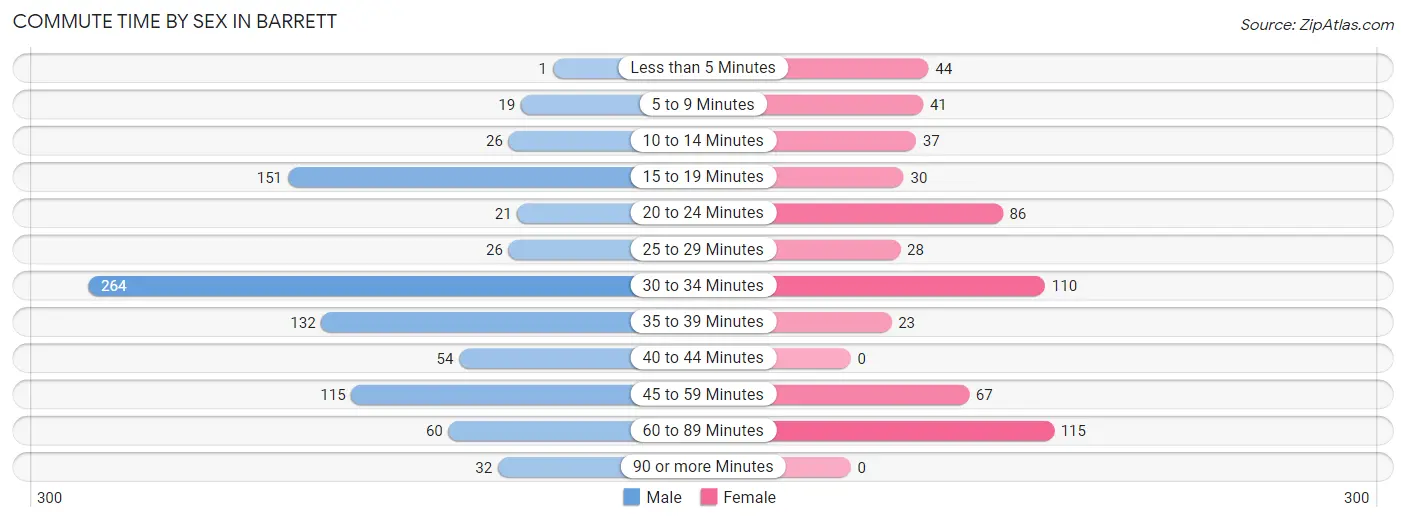
Commute Time by Sex in Barrett
The most common commute times in Barrett are 30 to 34 minutes (264 commuters, 29.3%) for males and 60 to 89 minutes (115 commuters, 19.8%) for females.
| Commute Time | Male | Female |
| Less than 5 Minutes | 1 (0.1%) | 44 (7.6%) |
| 5 to 9 Minutes | 19 (2.1%) | 41 (7.1%) |
| 10 to 14 Minutes | 26 (2.9%) | 37 (6.4%) |
| 15 to 19 Minutes | 151 (16.8%) | 30 (5.2%) |
| 20 to 24 Minutes | 21 (2.3%) | 86 (14.8%) |
| 25 to 29 Minutes | 26 (2.9%) | 28 (4.8%) |
| 30 to 34 Minutes | 264 (29.3%) | 110 (18.9%) |
| 35 to 39 Minutes | 132 (14.6%) | 23 (4.0%) |
| 40 to 44 Minutes | 54 (6.0%) | 0 (0.0%) |
| 45 to 59 Minutes | 115 (12.8%) | 67 (11.5%) |
| 60 to 89 Minutes | 60 (6.7%) | 115 (19.8%) |
| 90 or more Minutes | 32 (3.5%) | 0 (0.0%) |
Time of Departure to Work by Sex in Barrett
The most frequent times of departure to work in Barrett are 7:30 AM to 7:59 AM (213, 23.6%) for males and 7:30 AM to 7:59 AM (131, 22.6%) for females.
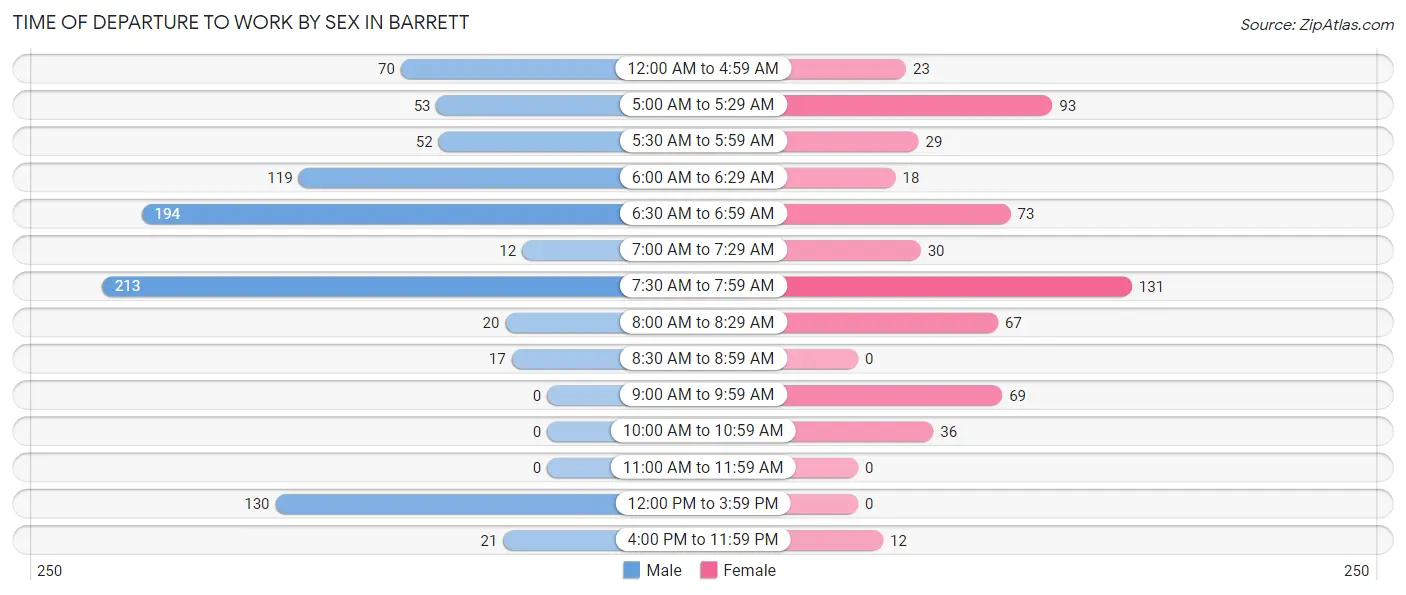
| Time of Departure | Male | Female |
| 12:00 AM to 4:59 AM | 70 (7.8%) | 23 (4.0%) |
| 5:00 AM to 5:29 AM | 53 (5.9%) | 93 (16.0%) |
| 5:30 AM to 5:59 AM | 52 (5.8%) | 29 (5.0%) |
| 6:00 AM to 6:29 AM | 119 (13.2%) | 18 (3.1%) |
| 6:30 AM to 6:59 AM | 194 (21.5%) | 73 (12.6%) |
| 7:00 AM to 7:29 AM | 12 (1.3%) | 30 (5.2%) |
| 7:30 AM to 7:59 AM | 213 (23.6%) | 131 (22.6%) |
| 8:00 AM to 8:29 AM | 20 (2.2%) | 67 (11.5%) |
| 8:30 AM to 8:59 AM | 17 (1.9%) | 0 (0.0%) |
| 9:00 AM to 9:59 AM | 0 (0.0%) | 69 (11.9%) |
| 10:00 AM to 10:59 AM | 0 (0.0%) | 36 (6.2%) |
| 11:00 AM to 11:59 AM | 0 (0.0%) | 0 (0.0%) |
| 12:00 PM to 3:59 PM | 130 (14.4%) | 0 (0.0%) |
| 4:00 PM to 11:59 PM | 21 (2.3%) | 12 (2.1%) |
| Total | 901 (100.0%) | 581 (100.0%) |
Housing Occupancy in Barrett
Occupancy by Ownership in Barrett
Of the total 1,246 dwellings in Barrett, owner-occupied units account for 984 (79.0%), while renter-occupied units make up 262 (21.0%).
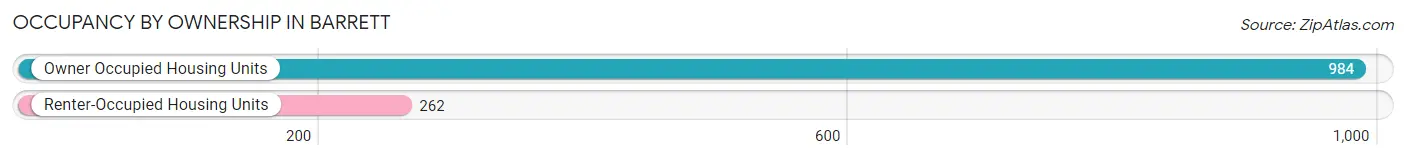
| Occupancy | # Housing Units | % Housing Units |
| Owner Occupied Housing Units | 984 | 79.0% |
| Renter-Occupied Housing Units | 262 | 21.0% |
| Total Occupied Housing Units | 1,246 | 100.0% |
Occupancy by Household Size in Barrett
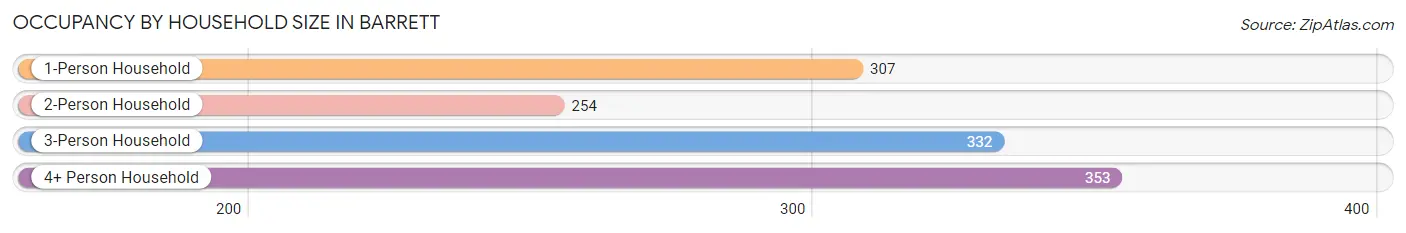
| Household Size | # Housing Units | % Housing Units |
| 1-Person Household | 307 | 24.6% |
| 2-Person Household | 254 | 20.4% |
| 3-Person Household | 332 | 26.7% |
| 4+ Person Household | 353 | 28.3% |
| Total Housing Units | 1,246 | 100.0% |
Occupancy by Ownership by Household Size in Barrett
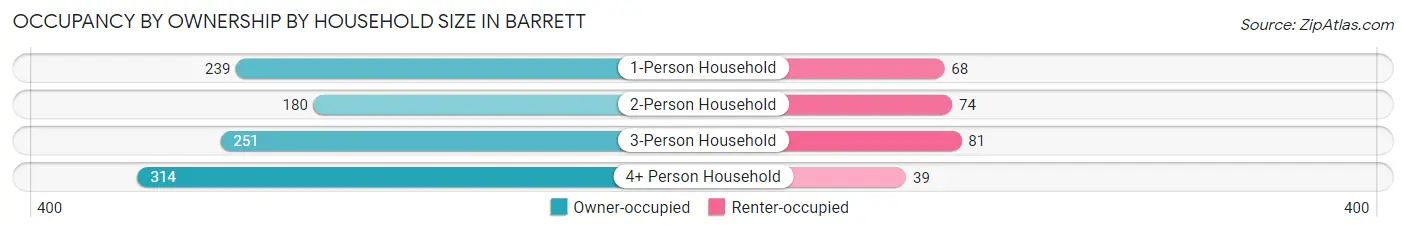
| Household Size | Owner-occupied | Renter-occupied |
| 1-Person Household | 239 (77.8%) | 68 (22.2%) |
| 2-Person Household | 180 (70.9%) | 74 (29.1%) |
| 3-Person Household | 251 (75.6%) | 81 (24.4%) |
| 4+ Person Household | 314 (88.9%) | 39 (11.1%) |
| Total Housing Units | 984 (79.0%) | 262 (21.0%) |
Occupancy by Educational Attainment in Barrett
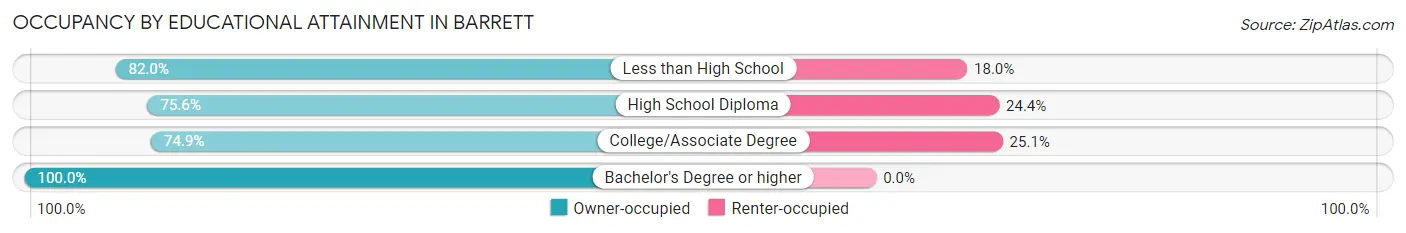
| Household Size | Owner-occupied | Renter-occupied |
| Less than High School | 100 (82.0%) | 22 (18.0%) |
| High School Diploma | 270 (75.6%) | 87 (24.4%) |
| College/Associate Degree | 457 (74.9%) | 153 (25.1%) |
| Bachelor's Degree or higher | 157 (100.0%) | 0 (0.0%) |
Occupancy by Age of Householder in Barrett
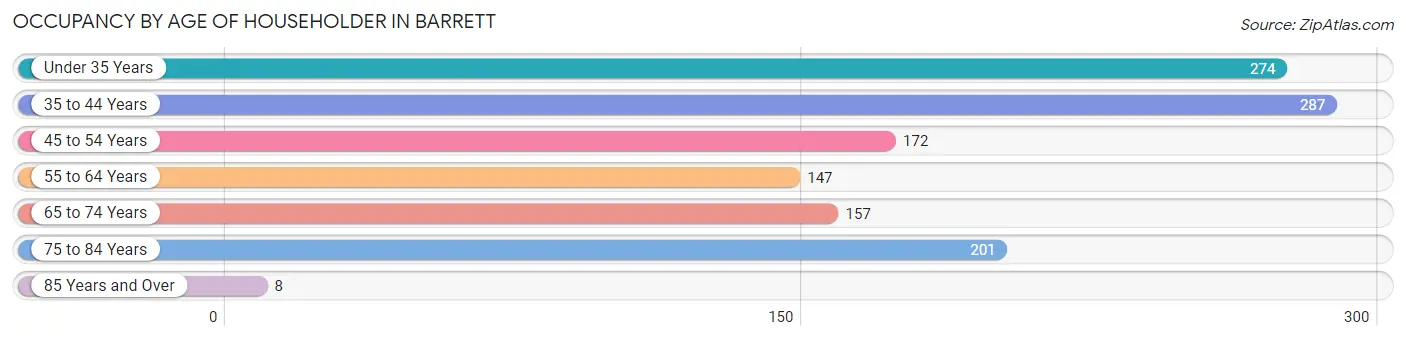
| Age Bracket | # Households | % Households |
| Under 35 Years | 274 | 22.0% |
| 35 to 44 Years | 287 | 23.0% |
| 45 to 54 Years | 172 | 13.8% |
| 55 to 64 Years | 147 | 11.8% |
| 65 to 74 Years | 157 | 12.6% |
| 75 to 84 Years | 201 | 16.1% |
| 85 Years and Over | 8 | 0.6% |
| Total | 1,246 | 100.0% |
Housing Finances in Barrett
Median Income by Occupancy in Barrett
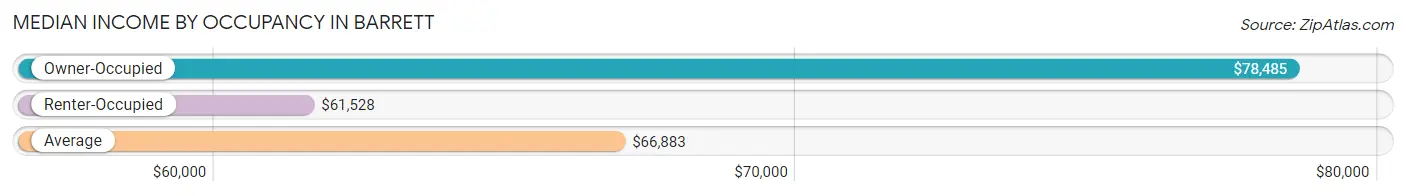
| Occupancy Type | # Households | Median Income |
| Owner-Occupied | 984 (79.0%) | $78,485 |
| Renter-Occupied | 262 (21.0%) | $61,528 |
| Average | 1,246 (100.0%) | $66,883 |
Occupancy by Householder Income Bracket in Barrett
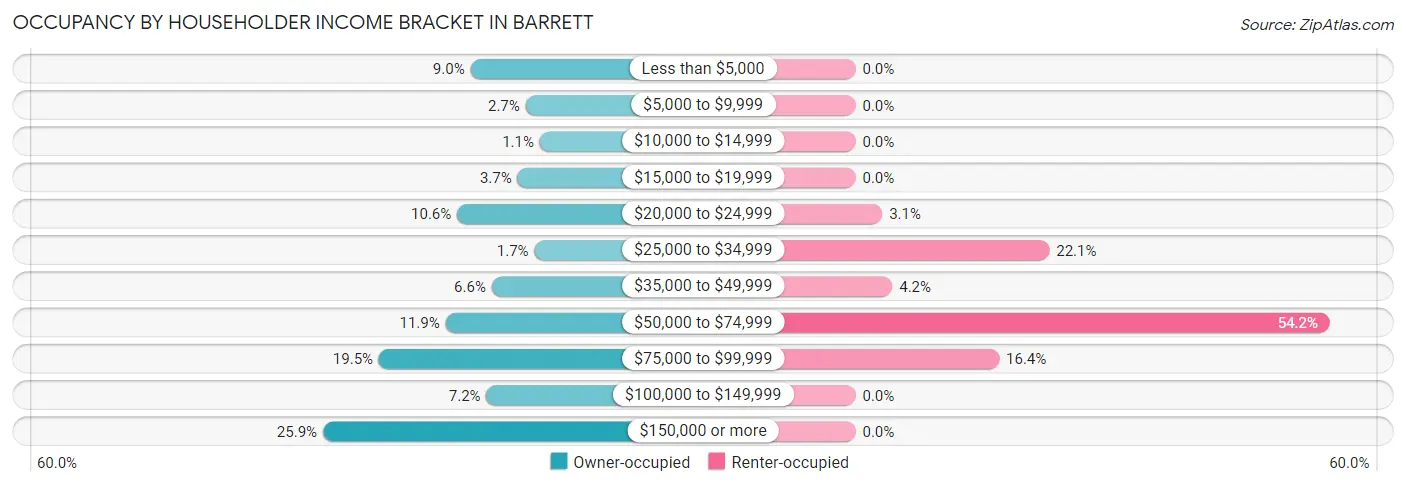
| Income Bracket | Owner-occupied | Renter-occupied |
| Less than $5,000 | 89 (9.0%) | 0 (0.0%) |
| $5,000 to $9,999 | 27 (2.7%) | 0 (0.0%) |
| $10,000 to $14,999 | 11 (1.1%) | 0 (0.0%) |
| $15,000 to $19,999 | 36 (3.7%) | 0 (0.0%) |
| $20,000 to $24,999 | 104 (10.6%) | 8 (3.0%) |
| $25,000 to $34,999 | 17 (1.7%) | 58 (22.1%) |
| $35,000 to $49,999 | 65 (6.6%) | 11 (4.2%) |
| $50,000 to $74,999 | 117 (11.9%) | 142 (54.2%) |
| $75,000 to $99,999 | 192 (19.5%) | 43 (16.4%) |
| $100,000 to $149,999 | 71 (7.2%) | 0 (0.0%) |
| $150,000 or more | 255 (25.9%) | 0 (0.0%) |
| Total | 984 (100.0%) | 262 (100.0%) |
Monthly Housing Cost Tiers in Barrett
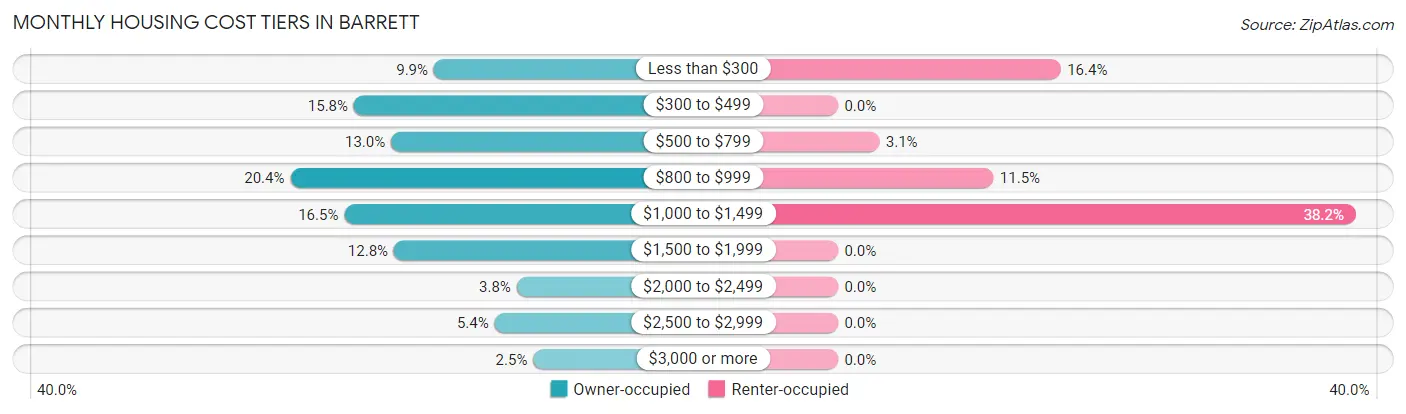
| Monthly Cost | Owner-occupied | Renter-occupied |
| Less than $300 | 97 (9.9%) | 43 (16.4%) |
| $300 to $499 | 155 (15.8%) | 0 (0.0%) |
| $500 to $799 | 128 (13.0%) | 8 (3.0%) |
| $800 to $999 | 201 (20.4%) | 30 (11.5%) |
| $1,000 to $1,499 | 162 (16.5%) | 100 (38.2%) |
| $1,500 to $1,999 | 126 (12.8%) | 0 (0.0%) |
| $2,000 to $2,499 | 37 (3.8%) | 0 (0.0%) |
| $2,500 to $2,999 | 53 (5.4%) | 0 (0.0%) |
| $3,000 or more | 25 (2.5%) | 0 (0.0%) |
| Total | 984 (100.0%) | 262 (100.0%) |
Physical Housing Characteristics in Barrett
Housing Structures in Barrett
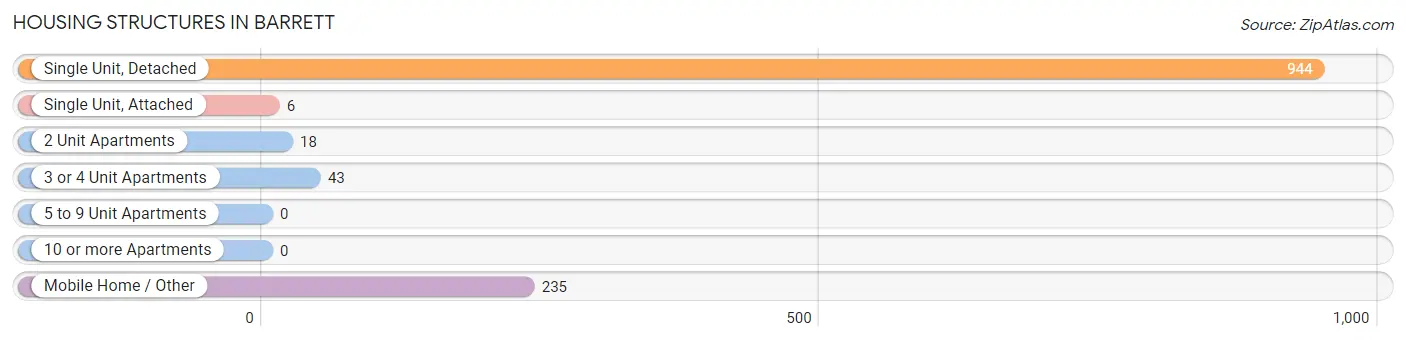
| Structure Type | # Housing Units | % Housing Units |
| Single Unit, Detached | 944 | 75.8% |
| Single Unit, Attached | 6 | 0.5% |
| 2 Unit Apartments | 18 | 1.4% |
| 3 or 4 Unit Apartments | 43 | 3.5% |
| 5 to 9 Unit Apartments | 0 | 0.0% |
| 10 or more Apartments | 0 | 0.0% |
| Mobile Home / Other | 235 | 18.9% |
| Total | 1,246 | 100.0% |
Housing Structures by Occupancy in Barrett
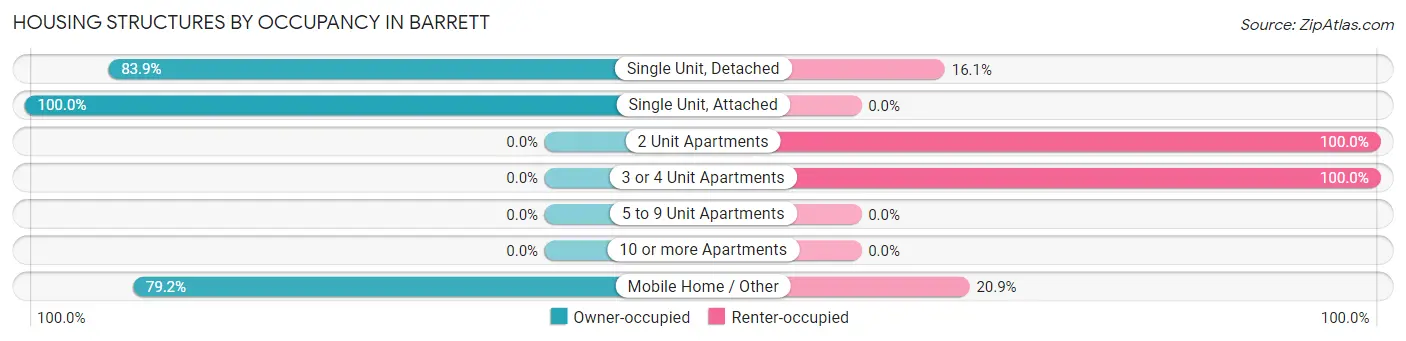
| Structure Type | Owner-occupied | Renter-occupied |
| Single Unit, Detached | 792 (83.9%) | 152 (16.1%) |
| Single Unit, Attached | 6 (100.0%) | 0 (0.0%) |
| 2 Unit Apartments | 0 (0.0%) | 18 (100.0%) |
| 3 or 4 Unit Apartments | 0 (0.0%) | 43 (100.0%) |
| 5 to 9 Unit Apartments | 0 (0.0%) | 0 (0.0%) |
| 10 or more Apartments | 0 (0.0%) | 0 (0.0%) |
| Mobile Home / Other | 186 (79.1%) | 49 (20.8%) |
| Total | 984 (79.0%) | 262 (21.0%) |
Housing Structures by Number of Rooms in Barrett
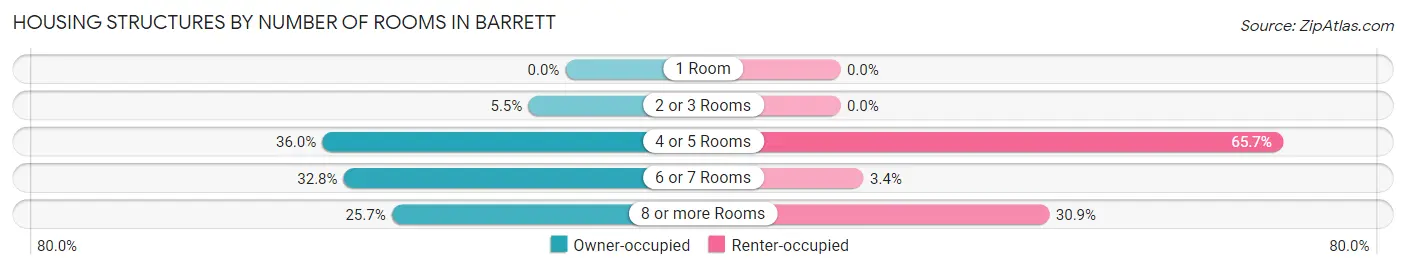
| Number of Rooms | Owner-occupied | Renter-occupied |
| 1 Room | 0 (0.0%) | 0 (0.0%) |
| 2 or 3 Rooms | 54 (5.5%) | 0 (0.0%) |
| 4 or 5 Rooms | 354 (36.0%) | 172 (65.6%) |
| 6 or 7 Rooms | 323 (32.8%) | 9 (3.4%) |
| 8 or more Rooms | 253 (25.7%) | 81 (30.9%) |
| Total | 984 (100.0%) | 262 (100.0%) |
Housing Structure by Heating Type in Barrett
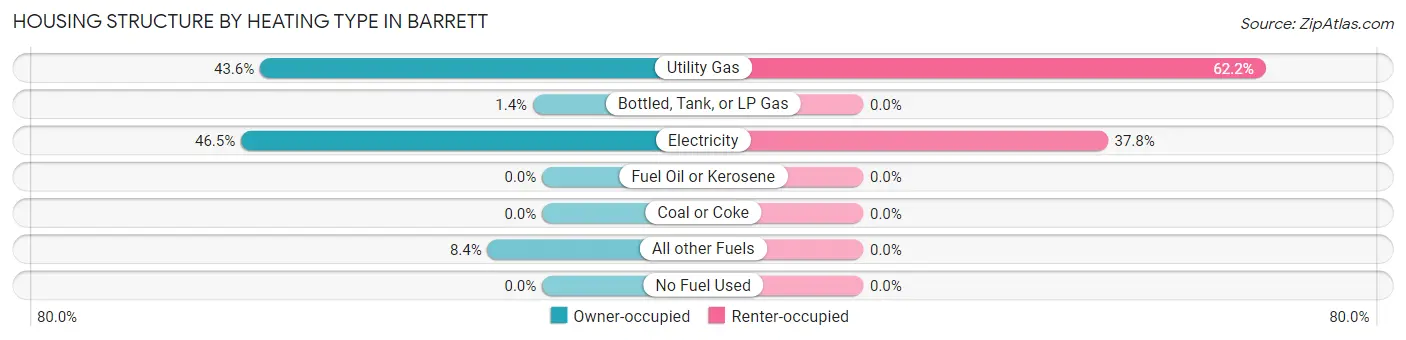
| Heating Type | Owner-occupied | Renter-occupied |
| Utility Gas | 429 (43.6%) | 163 (62.2%) |
| Bottled, Tank, or LP Gas | 14 (1.4%) | 0 (0.0%) |
| Electricity | 458 (46.5%) | 99 (37.8%) |
| Fuel Oil or Kerosene | 0 (0.0%) | 0 (0.0%) |
| Coal or Coke | 0 (0.0%) | 0 (0.0%) |
| All other Fuels | 83 (8.4%) | 0 (0.0%) |
| No Fuel Used | 0 (0.0%) | 0 (0.0%) |
| Total | 984 (100.0%) | 262 (100.0%) |
Household Vehicle Usage in Barrett
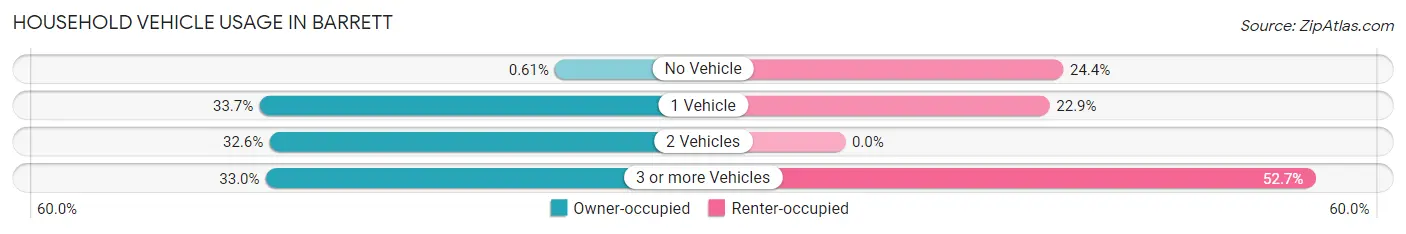
| Vehicles per Household | Owner-occupied | Renter-occupied |
| No Vehicle | 6 (0.6%) | 64 (24.4%) |
| 1 Vehicle | 332 (33.7%) | 60 (22.9%) |
| 2 Vehicles | 321 (32.6%) | 0 (0.0%) |
| 3 or more Vehicles | 325 (33.0%) | 138 (52.7%) |
| Total | 984 (100.0%) | 262 (100.0%) |
Real Estate & Mortgages in Barrett
Real Estate and Mortgage Overview in Barrett
| Characteristic | Without Mortgage | With Mortgage |
| Housing Units | 539 | 445 |
| Median Property Value | $114,400 | $134,600 |
| Median Household Income | $40,133 | $232 |
| Monthly Housing Costs | $517 | $25 |
| Real Estate Taxes | - | - |
Property Value by Mortgage Status in Barrett
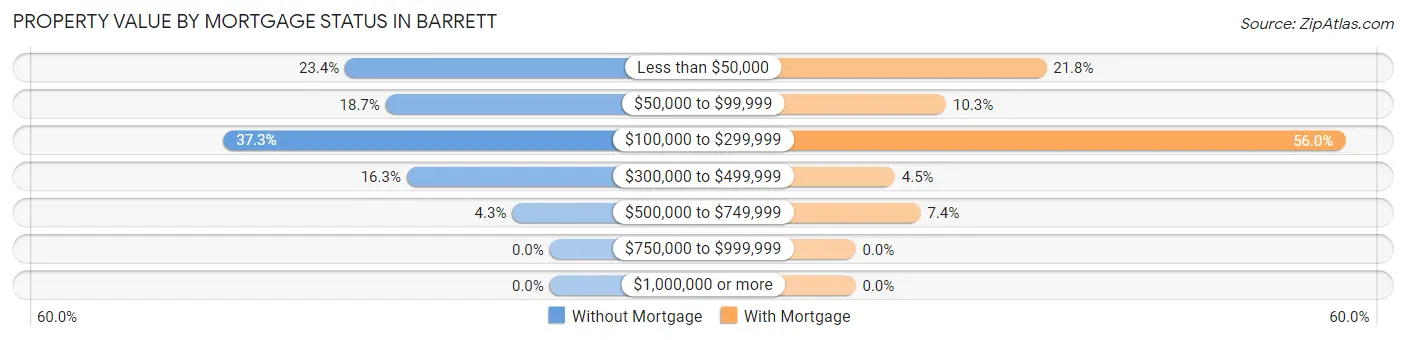
| Property Value | Without Mortgage | With Mortgage |
| Less than $50,000 | 126 (23.4%) | 97 (21.8%) |
| $50,000 to $99,999 | 101 (18.7%) | 46 (10.3%) |
| $100,000 to $299,999 | 201 (37.3%) | 249 (56.0%) |
| $300,000 to $499,999 | 88 (16.3%) | 20 (4.5%) |
| $500,000 to $749,999 | 23 (4.3%) | 33 (7.4%) |
| $750,000 to $999,999 | 0 (0.0%) | 0 (0.0%) |
| $1,000,000 or more | 0 (0.0%) | 0 (0.0%) |
| Total | 539 (100.0%) | 445 (100.0%) |
Household Income by Mortgage Status in Barrett
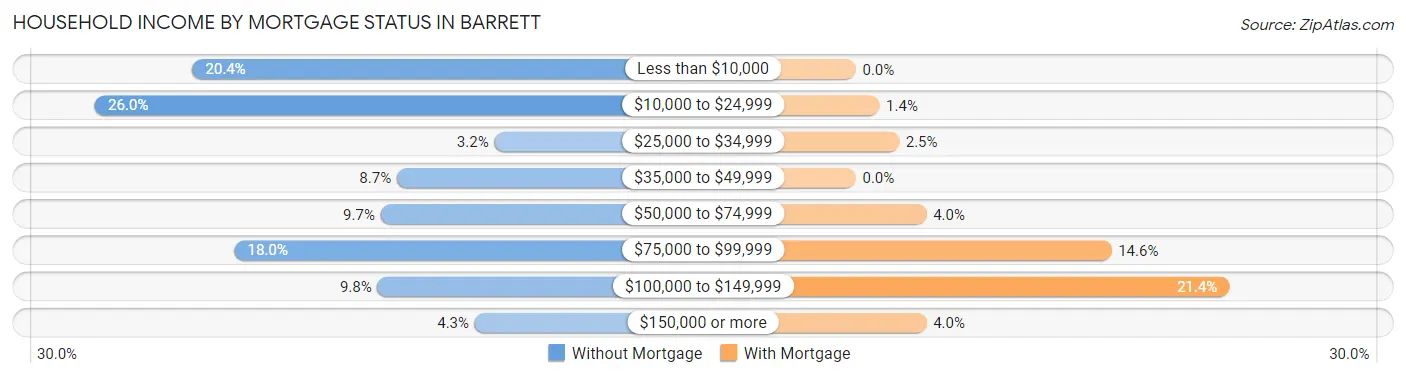
| Household Income | Without Mortgage | With Mortgage |
| Less than $10,000 | 110 (20.4%) | 0 (0.0%) |
| $10,000 to $24,999 | 140 (26.0%) | 6 (1.3%) |
| $25,000 to $34,999 | 17 (3.2%) | 11 (2.5%) |
| $35,000 to $49,999 | 47 (8.7%) | 0 (0.0%) |
| $50,000 to $74,999 | 52 (9.7%) | 18 (4.0%) |
| $75,000 to $99,999 | 97 (18.0%) | 65 (14.6%) |
| $100,000 to $149,999 | 53 (9.8%) | 95 (21.3%) |
| $150,000 or more | 23 (4.3%) | 18 (4.0%) |
| Total | 539 (100.0%) | 445 (100.0%) |
Property Value to Household Income Ratio in Barrett
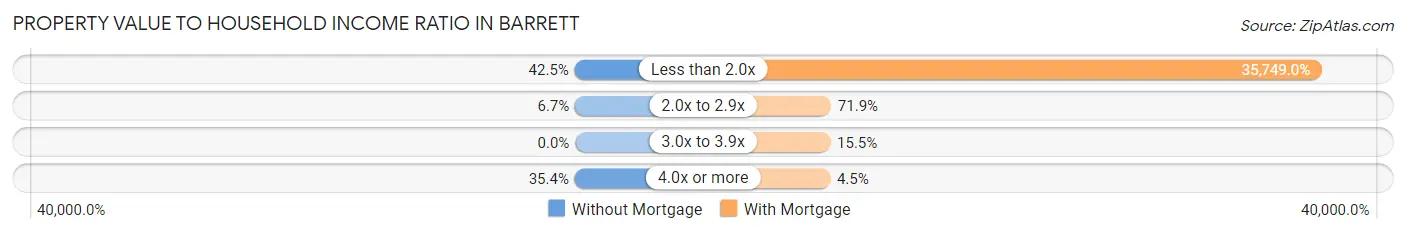
| Value-to-Income Ratio | Without Mortgage | With Mortgage |
| Less than 2.0x | 229 (42.5%) | 159,083 (35,749.0%) |
| 2.0x to 2.9x | 36 (6.7%) | 320 (71.9%) |
| 3.0x to 3.9x | 0 (0.0%) | 69 (15.5%) |
| 4.0x or more | 191 (35.4%) | 20 (4.5%) |
| Total | 539 (100.0%) | 445 (100.0%) |
Real Estate Taxes by Mortgage Status in Barrett
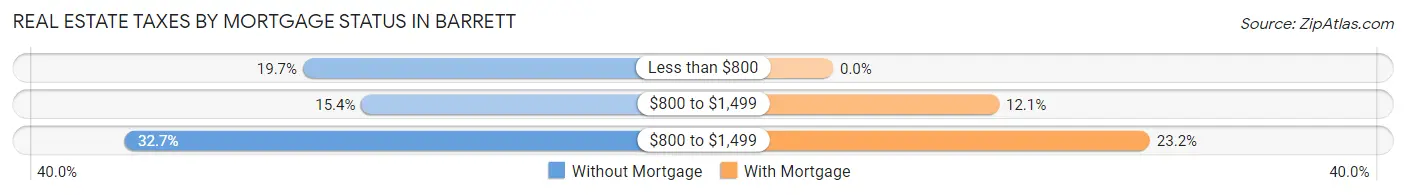
| Property Taxes | Without Mortgage | With Mortgage |
| Less than $800 | 106 (19.7%) | 0 (0.0%) |
| $800 to $1,499 | 83 (15.4%) | 54 (12.1%) |
| $800 to $1,499 | 176 (32.7%) | 103 (23.2%) |
| Total | 539 (100.0%) | 445 (100.0%) |
Health & Disability in Barrett
Health Insurance Coverage by Age in Barrett
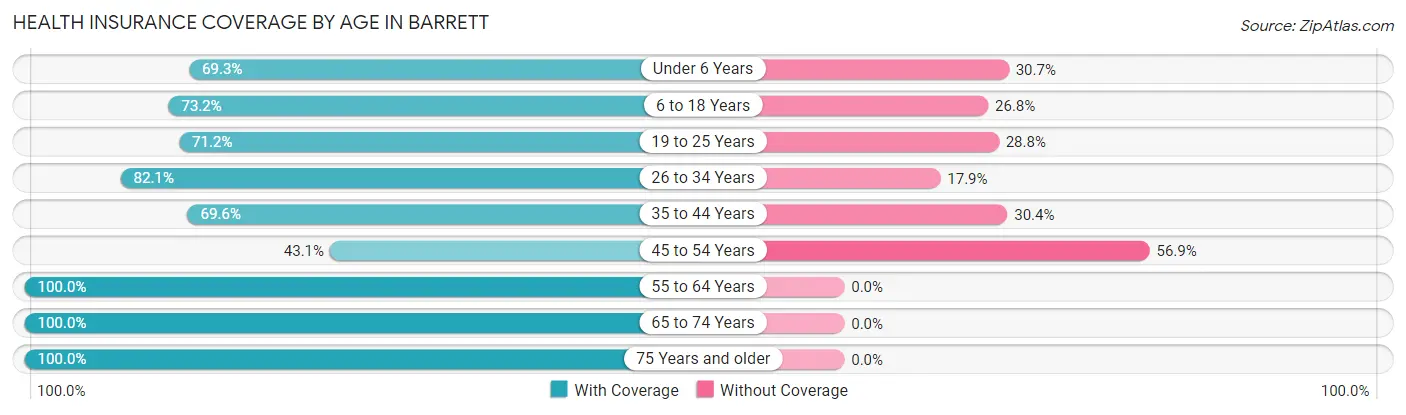
| Age Bracket | With Coverage | Without Coverage |
| Under 6 Years | 285 (69.3%) | 126 (30.7%) |
| 6 to 18 Years | 371 (73.2%) | 136 (26.8%) |
| 19 to 25 Years | 262 (71.2%) | 106 (28.8%) |
| 26 to 34 Years | 385 (82.1%) | 84 (17.9%) |
| 35 to 44 Years | 451 (69.6%) | 197 (30.4%) |
| 45 to 54 Years | 146 (43.1%) | 193 (56.9%) |
| 55 to 64 Years | 279 (100.0%) | 0 (0.0%) |
| 65 to 74 Years | 249 (100.0%) | 0 (0.0%) |
| 75 Years and older | 218 (100.0%) | 0 (0.0%) |
| Total | 2,646 (75.9%) | 842 (24.1%) |
Health Insurance Coverage by Citizenship Status in Barrett
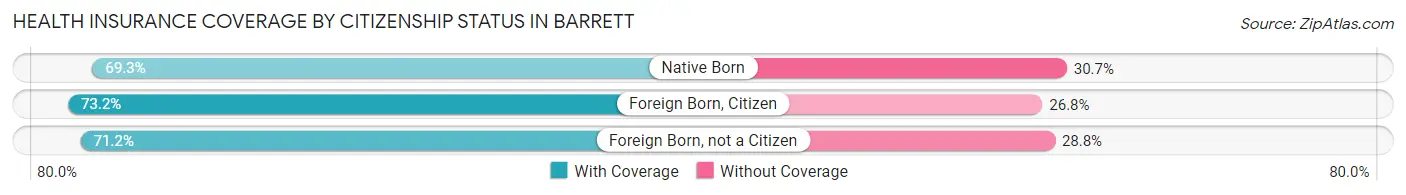
| Citizenship Status | With Coverage | Without Coverage |
| Native Born | 285 (69.3%) | 126 (30.7%) |
| Foreign Born, Citizen | 371 (73.2%) | 136 (26.8%) |
| Foreign Born, not a Citizen | 262 (71.2%) | 106 (28.8%) |
Health Insurance Coverage by Household Income in Barrett
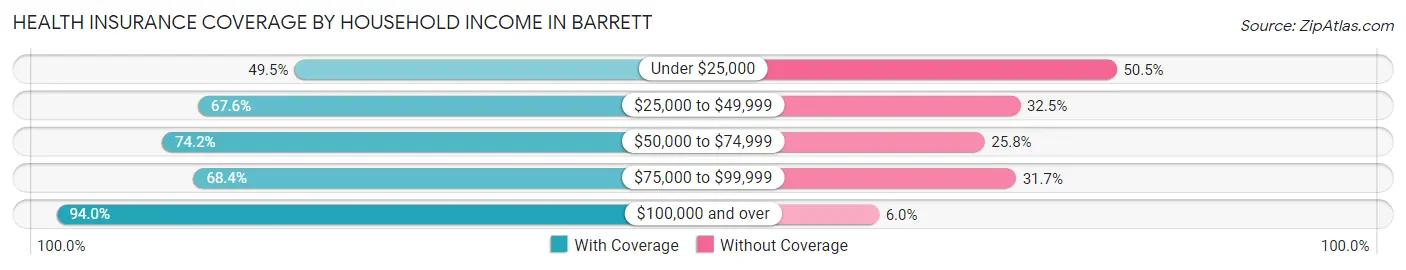
| Household Income | With Coverage | Without Coverage |
| Under $25,000 | 287 (49.5%) | 293 (50.5%) |
| $25,000 to $49,999 | 127 (67.5%) | 61 (32.5%) |
| $50,000 to $74,999 | 547 (74.2%) | 190 (25.8%) |
| $75,000 to $99,999 | 475 (68.3%) | 220 (31.7%) |
| $100,000 and over | 1,210 (94.0%) | 77 (6.0%) |
Public vs Private Health Insurance Coverage by Age in Barrett
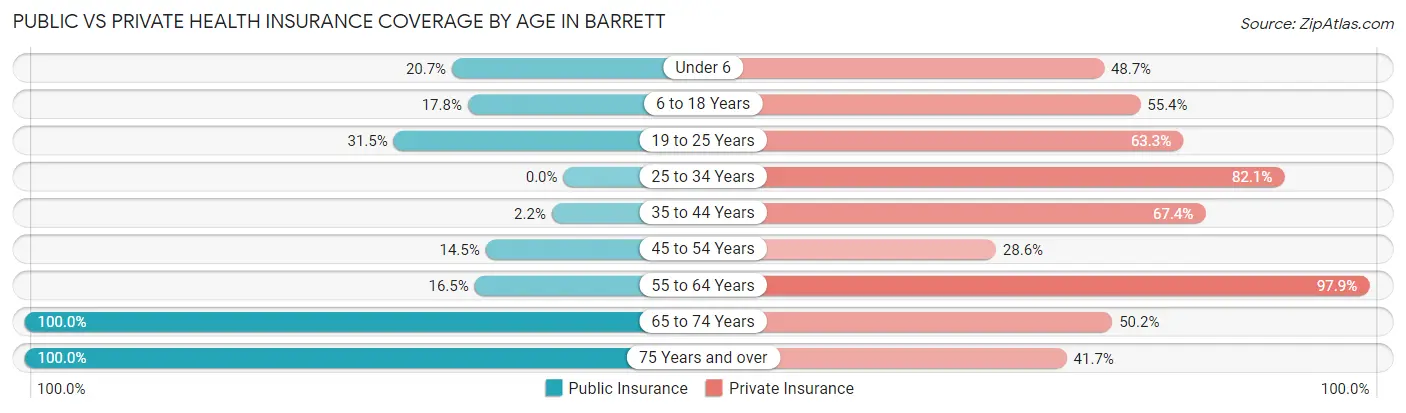
| Age Bracket | Public Insurance | Private Insurance |
| Under 6 | 85 (20.7%) | 200 (48.7%) |
| 6 to 18 Years | 90 (17.7%) | 281 (55.4%) |
| 19 to 25 Years | 116 (31.5%) | 233 (63.3%) |
| 25 to 34 Years | 0 (0.0%) | 385 (82.1%) |
| 35 to 44 Years | 14 (2.2%) | 437 (67.4%) |
| 45 to 54 Years | 49 (14.4%) | 97 (28.6%) |
| 55 to 64 Years | 46 (16.5%) | 273 (97.9%) |
| 65 to 74 Years | 249 (100.0%) | 125 (50.2%) |
| 75 Years and over | 218 (100.0%) | 91 (41.7%) |
| Total | 867 (24.9%) | 2,122 (60.8%) |
Disability Status by Sex by Age in Barrett
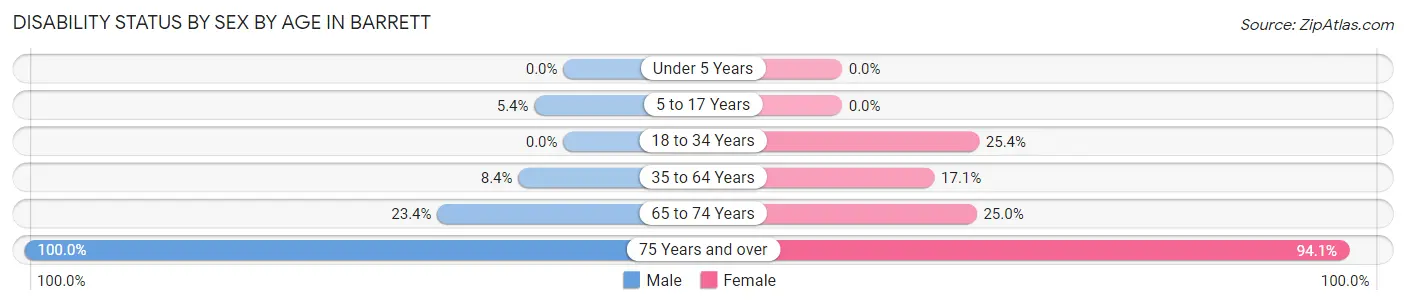
| Age Bracket | Male | Female |
| Under 5 Years | 0 (0.0%) | 0 (0.0%) |
| 5 to 17 Years | 15 (5.4%) | 0 (0.0%) |
| 18 to 34 Years | 0 (0.0%) | 87 (25.4%) |
| 35 to 64 Years | 56 (8.4%) | 102 (17.1%) |
| 65 to 74 Years | 18 (23.4%) | 43 (25.0%) |
| 75 Years and over | 82 (100.0%) | 128 (94.1%) |
Disability Class by Sex by Age in Barrett
Disability Class: Hearing Difficulty
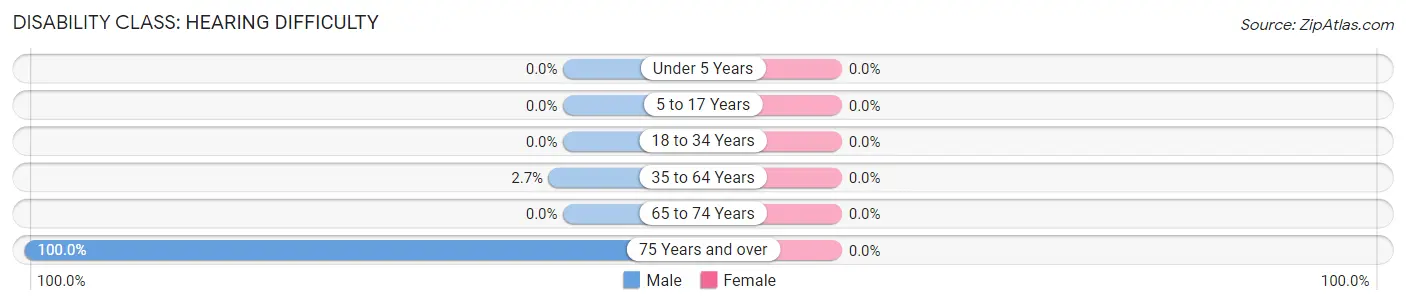
| Age Bracket | Male | Female |
| Under 5 Years | 0 (0.0%) | 0 (0.0%) |
| 5 to 17 Years | 0 (0.0%) | 0 (0.0%) |
| 18 to 34 Years | 0 (0.0%) | 0 (0.0%) |
| 35 to 64 Years | 18 (2.7%) | 0 (0.0%) |
| 65 to 74 Years | 0 (0.0%) | 0 (0.0%) |
| 75 Years and over | 82 (100.0%) | 0 (0.0%) |
Disability Class: Vision Difficulty
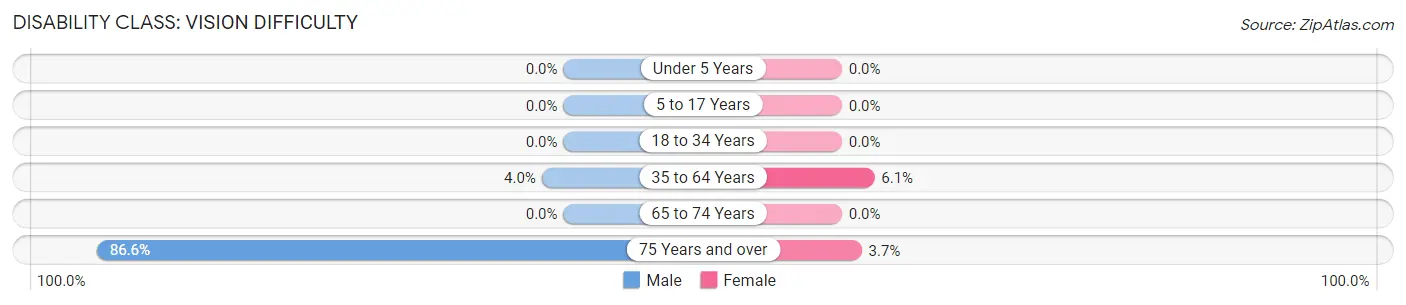
| Age Bracket | Male | Female |
| Under 5 Years | 0 (0.0%) | 0 (0.0%) |
| 5 to 17 Years | 0 (0.0%) | 0 (0.0%) |
| 18 to 34 Years | 0 (0.0%) | 0 (0.0%) |
| 35 to 64 Years | 27 (4.0%) | 36 (6.0%) |
| 65 to 74 Years | 0 (0.0%) | 0 (0.0%) |
| 75 Years and over | 71 (86.6%) | 5 (3.7%) |
Disability Class: Cognitive Difficulty
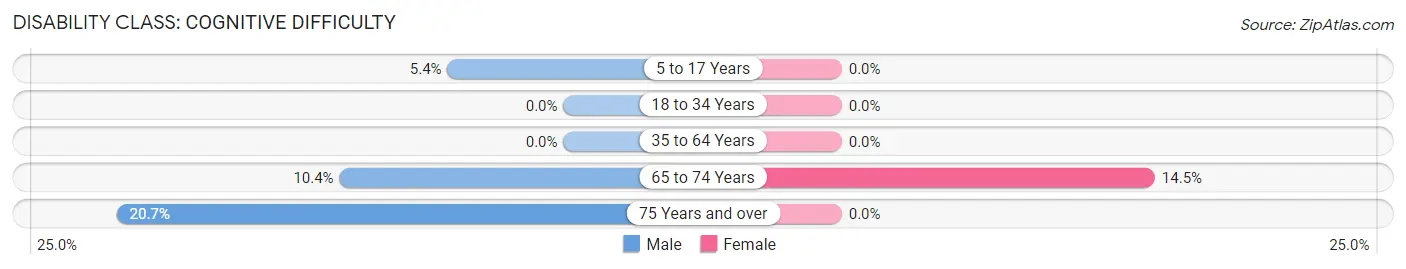
| Age Bracket | Male | Female |
| 5 to 17 Years | 15 (5.4%) | 0 (0.0%) |
| 18 to 34 Years | 0 (0.0%) | 0 (0.0%) |
| 35 to 64 Years | 0 (0.0%) | 0 (0.0%) |
| 65 to 74 Years | 8 (10.4%) | 25 (14.5%) |
| 75 Years and over | 17 (20.7%) | 0 (0.0%) |
Disability Class: Ambulatory Difficulty
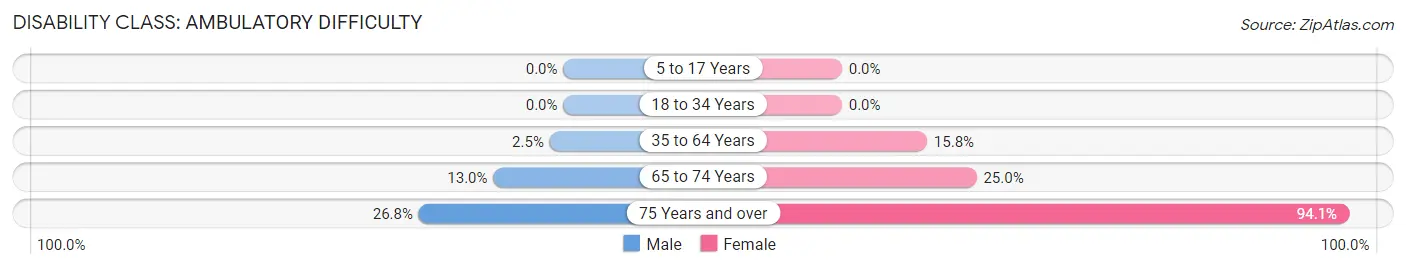
| Age Bracket | Male | Female |
| 5 to 17 Years | 0 (0.0%) | 0 (0.0%) |
| 18 to 34 Years | 0 (0.0%) | 0 (0.0%) |
| 35 to 64 Years | 17 (2.5%) | 94 (15.8%) |
| 65 to 74 Years | 10 (13.0%) | 43 (25.0%) |
| 75 Years and over | 22 (26.8%) | 128 (94.1%) |
Disability Class: Self-Care Difficulty
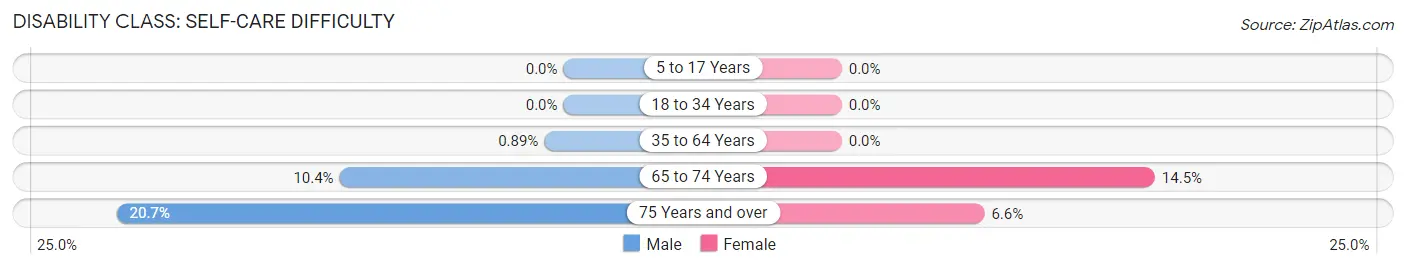
| Age Bracket | Male | Female |
| 5 to 17 Years | 0 (0.0%) | 0 (0.0%) |
| 18 to 34 Years | 0 (0.0%) | 0 (0.0%) |
| 35 to 64 Years | 6 (0.9%) | 0 (0.0%) |
| 65 to 74 Years | 8 (10.4%) | 25 (14.5%) |
| 75 Years and over | 17 (20.7%) | 9 (6.6%) |
Technology Access in Barrett
Computing Device Access in Barrett
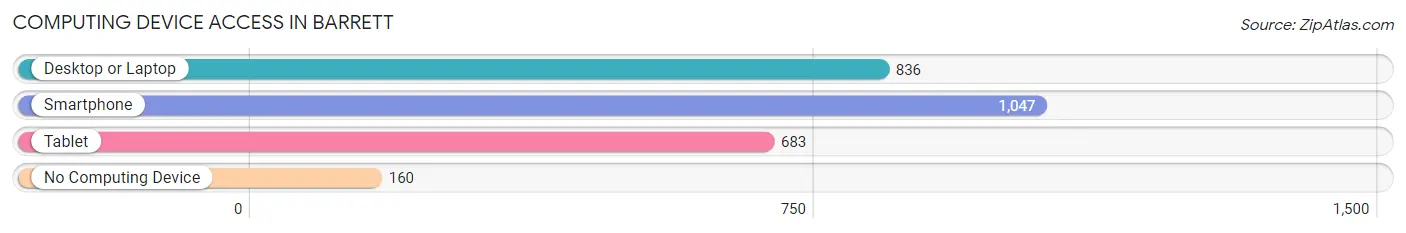
| Device Type | # Households | % Households |
| Desktop or Laptop | 836 | 67.1% |
| Smartphone | 1,047 | 84.0% |
| Tablet | 683 | 54.8% |
| No Computing Device | 160 | 12.8% |
| Total | 1,246 | 100.0% |
Internet Access in Barrett
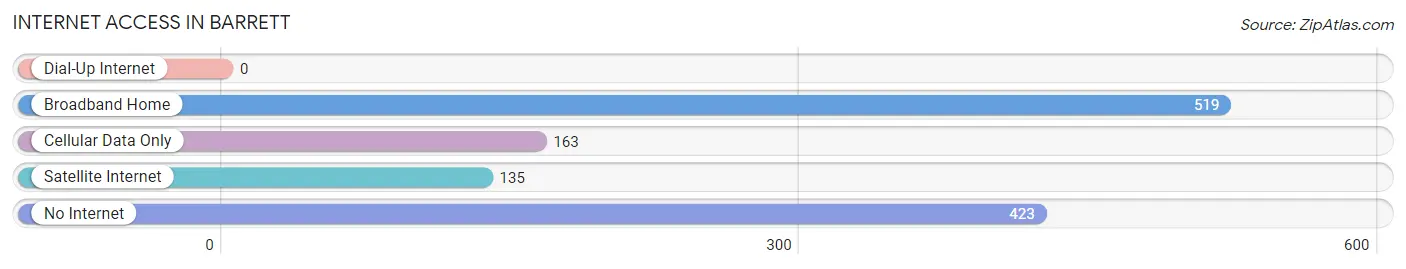
| Internet Type | # Households | % Households |
| Dial-Up Internet | 0 | 0.0% |
| Broadband Home | 519 | 41.6% |
| Cellular Data Only | 163 | 13.1% |
| Satellite Internet | 135 | 10.8% |
| No Internet | 423 | 34.0% |
| Total | 1,246 | 100.0% |
Barrett Summary
Barrett, Texas is a small unincorporated community located in the southeastern corner of Collin County, Texas. It is situated approximately 25 miles northeast of Dallas and is part of the Dallas-Fort Worth metropolitan area. The population of Barrett was estimated to be around 200 people in 2020.
History
Barrett was first settled in the late 1800s by a group of settlers from Kentucky. The town was named after the family of William Barrett, who was one of the first settlers in the area. The town was officially established in 1891 and was incorporated in 1892.
The town was originally a farming community, but it soon became a popular stop for travelers on the Texas and Pacific Railway. The town was also home to a post office, a general store, and a school.
In the early 1900s, the town began to decline as the railroad moved away and the population decreased. However, the town was revitalized in the 1950s when the Dallas-Fort Worth International Airport was built nearby.
Geography
Barrett is located in the southeastern corner of Collin County, Texas. It is situated approximately 25 miles northeast of Dallas and is part of the Dallas-Fort Worth metropolitan area. The town is located on the banks of the Trinity River and is surrounded by rolling hills and farmland.
The climate in Barrett is hot and humid in the summer and mild in the winter. The average temperature in the summer is around 90 degrees Fahrenheit and the average temperature in the winter is around 50 degrees Fahrenheit.
Economy
The economy of Barrett is largely based on agriculture and tourism. The town is home to several farms and ranches, as well as a few small businesses. The town is also a popular destination for tourists, as it is close to the Dallas-Fort Worth International Airport and is home to several historic sites.
Demographics
The population of Barrett was estimated to be around 200 people in 2020. The racial makeup of the town is predominantly white, with a small percentage of African Americans and Hispanics. The median household income in Barrett is around $50,000, and the median home value is around $150,000.
Conclusion
Barrett, Texas is a small unincorporated community located in the southeastern corner of Collin County, Texas. It is situated approximately 25 miles northeast of Dallas and is part of the Dallas-Fort Worth metropolitan area. The population of Barrett was estimated to be around 200 people in 2020. The economy of Barrett is largely based on agriculture and tourism, and the town is home to several farms and ranches, as well as a few small businesses. The racial makeup of the town is predominantly white, with a small percentage of African Americans and Hispanics.
Common Questions
What is the Total Population of Barrett?
Total Population of Barrett is 3,488.
What is the Total Male Population of Barrett?
Total Male Population of Barrett is 1,760.
What is the Total Female Population of Barrett?
Total Female Population of Barrett is 1,728.
What is the Ratio of Males per 100 Females in Barrett?
There are 101.85 Males per 100 Females in Barrett.
What is the Ratio of Females per 100 Males in Barrett?
There are 98.18 Females per 100 Males in Barrett.
What is the Median Population Age in Barrett?
Median Population Age in Barrett is 34.4 Years.
What is the Average Family Size in Barrett
Average Family Size in Barrett is 3.4 People.
What is the Average Household Size in Barrett
Average Household Size in Barrett is 2.8 People.
What is Per Capita Income in Barrett?
Per Capita income in Barrett is $32,286.
What is the Median Family Income in Barrett?
Median Family Income in Barrett is $80,125.
What is the Median Household income in Barrett?
Median Household Income in Barrett is $66,883.
What is Income or Wage Gap in Barrett?
Income or Wage Gap in Barrett is 5.6%.
Women in Barrett earn 94.4 cents for every dollar earned by a man.
What is Inequality or Gini Index in Barrett?
Inequality or Gini Index in Barrett is 0.46.
How Large is the Labor Force in Barrett?
There are 1,837 People in the Labor Forcein in Barrett.
What is the Percentage of People in the Labor Force in Barrett?
69.8% of People are in the Labor Force in Barrett.
What is the Unemployment Rate in Barrett?
Unemployment Rate in Barrett is 7.5%.