Anahuac, TX
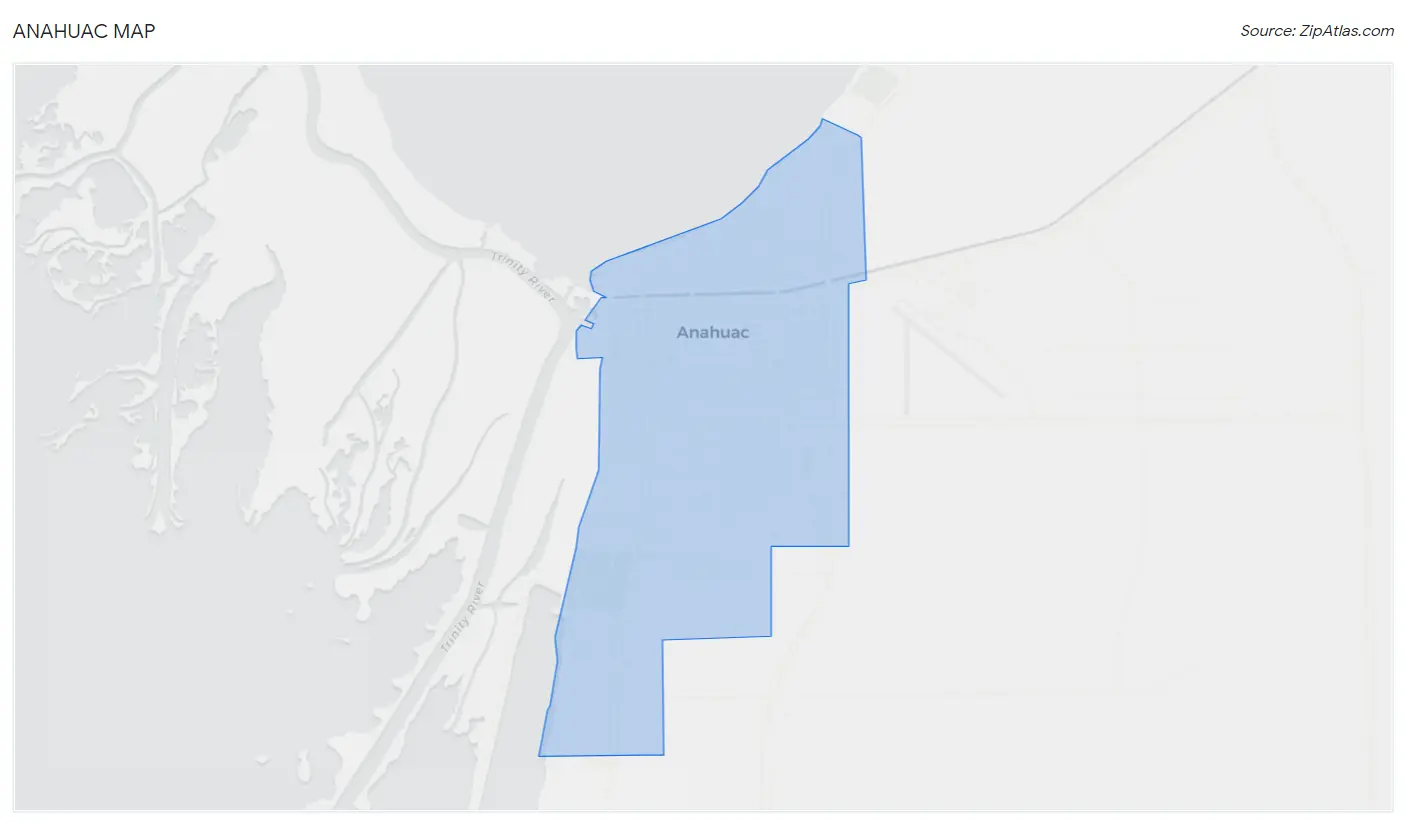
Anahuac Map
Anahuac Overview
2,420
TOTAL POPULATION
1,260
MALE POPULATION
1,160
FEMALE POPULATION
108.62
MALES / 100 FEMALES
92.06
FEMALES / 100 MALES
31.4
MEDIAN AGE
3.4
AVG FAMILY SIZE
2.9
AVG HOUSEHOLD SIZE
$26,767
PER CAPITA INCOME
$78,853
AVG FAMILY INCOME
$69,742
AVG HOUSEHOLD INCOME
61.3%
WAGE / INCOME GAP [ % ]
38.7¢/ $1
WAGE / INCOME GAP [ $ ]
0.39
INEQUALITY / GINI INDEX
1,073
LABOR FORCE [ PEOPLE ]
60.3%
PERCENT IN LABOR FORCE
7.3%
UNEMPLOYMENT RATE
Anahuac Zip Codes
Anahuac Area Codes
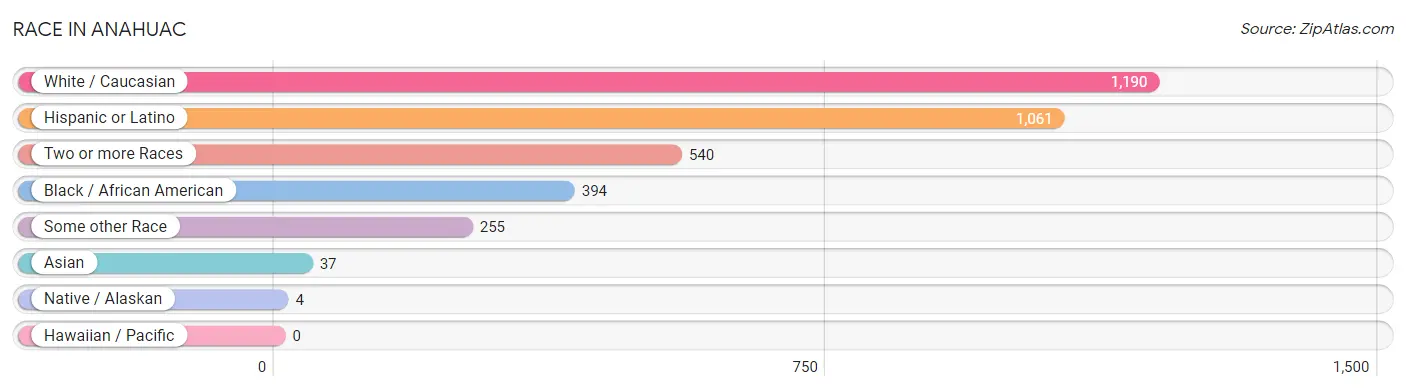
Race in Anahuac
The most populous races in Anahuac are White / Caucasian (1,190 | 49.2%), Hispanic or Latino (1,061 | 43.8%), and Two or more Races (540 | 22.3%).
| Race | # Population | % Population |
| Asian | 37 | 1.5% |
| Black / African American | 394 | 16.3% |
| Hawaiian / Pacific | 0 | 0.0% |
| Hispanic or Latino | 1,061 | 43.8% |
| Native / Alaskan | 4 | 0.2% |
| White / Caucasian | 1,190 | 49.2% |
| Two or more Races | 540 | 22.3% |
| Some other Race | 255 | 10.5% |
| Total | 2,420 | 100.0% |
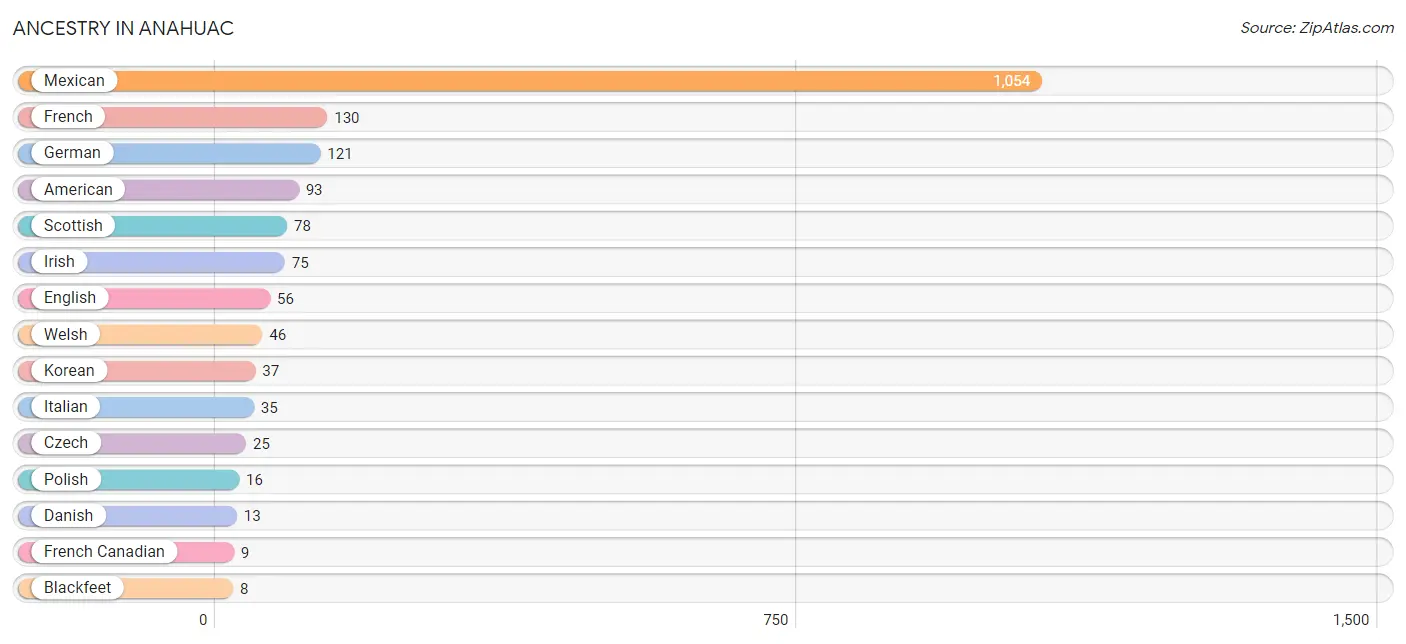
Ancestry in Anahuac
The most populous ancestries reported in Anahuac are Mexican (1,054 | 43.5%), French (130 | 5.4%), German (121 | 5.0%), American (93 | 3.8%), and Scottish (78 | 3.2%), together accounting for 61.0% of all Anahuac residents.
| Ancestry | # Population | % Population |
| American | 93 | 3.8% |
| Blackfeet | 8 | 0.3% |
| Cherokee | 8 | 0.3% |
| Czech | 25 | 1.0% |
| Czechoslovakian | 4 | 0.2% |
| Danish | 13 | 0.5% |
| English | 56 | 2.3% |
| European | 8 | 0.3% |
| French | 130 | 5.4% |
| French Canadian | 9 | 0.4% |
| German | 121 | 5.0% |
| Irish | 75 | 3.1% |
| Italian | 35 | 1.5% |
| Korean | 37 | 1.5% |
| Mexican | 1,054 | 43.5% |
| Polish | 16 | 0.7% |
| Scottish | 78 | 3.2% |
| Welsh | 46 | 1.9% | View All 18 Rows |
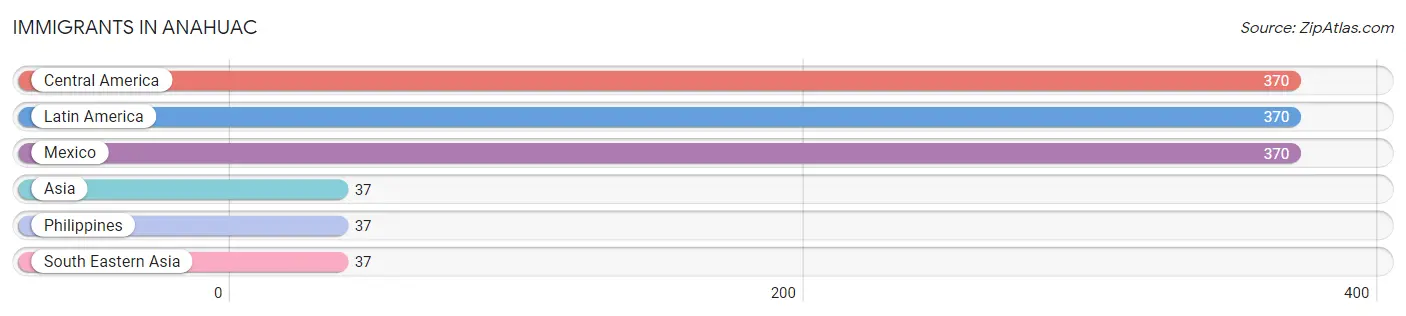
Immigrants in Anahuac
The most numerous immigrant groups reported in Anahuac came from Central America (370 | 15.3%), Latin America (370 | 15.3%), Mexico (370 | 15.3%), Asia (37 | 1.5%), and Philippines (37 | 1.5%), together accounting for 48.9% of all Anahuac residents.
| Immigration Origin | # Population | % Population |
| Asia | 37 | 1.5% |
| Central America | 370 | 15.3% |
| Latin America | 370 | 15.3% |
| Mexico | 370 | 15.3% |
| Philippines | 37 | 1.5% |
| South Eastern Asia | 37 | 1.5% | View All 6 Rows |
Sex and Age in Anahuac
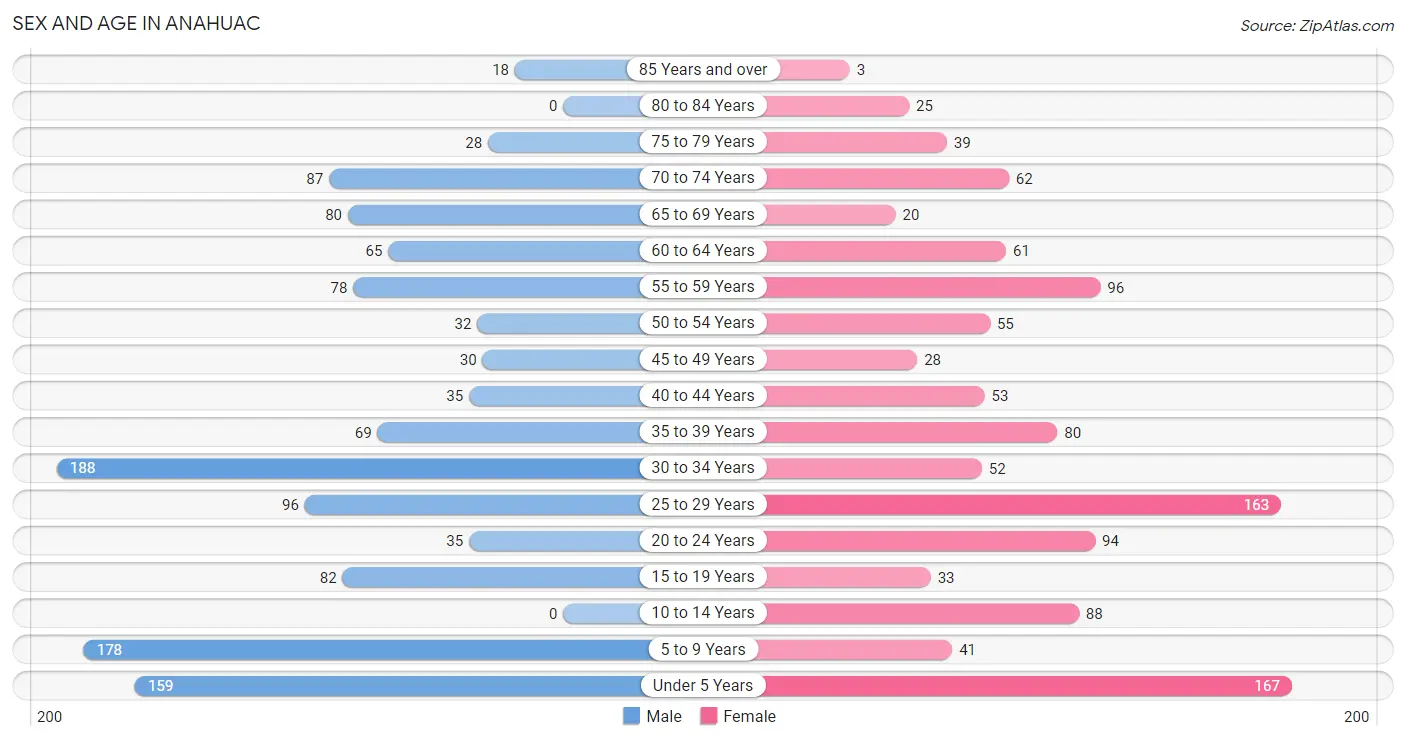
Sex and Age in Anahuac
The most populous age groups in Anahuac are 30 to 34 Years (188 | 14.9%) for men and Under 5 Years (167 | 14.4%) for women.
| Age Bracket | Male | Female |
| Under 5 Years | 159 (12.6%) | 167 (14.4%) |
| 5 to 9 Years | 178 (14.1%) | 41 (3.5%) |
| 10 to 14 Years | 0 (0.0%) | 88 (7.6%) |
| 15 to 19 Years | 82 (6.5%) | 33 (2.8%) |
| 20 to 24 Years | 35 (2.8%) | 94 (8.1%) |
| 25 to 29 Years | 96 (7.6%) | 163 (14.1%) |
| 30 to 34 Years | 188 (14.9%) | 52 (4.5%) |
| 35 to 39 Years | 69 (5.5%) | 80 (6.9%) |
| 40 to 44 Years | 35 (2.8%) | 53 (4.6%) |
| 45 to 49 Years | 30 (2.4%) | 28 (2.4%) |
| 50 to 54 Years | 32 (2.5%) | 55 (4.7%) |
| 55 to 59 Years | 78 (6.2%) | 96 (8.3%) |
| 60 to 64 Years | 65 (5.2%) | 61 (5.3%) |
| 65 to 69 Years | 80 (6.4%) | 20 (1.7%) |
| 70 to 74 Years | 87 (6.9%) | 62 (5.3%) |
| 75 to 79 Years | 28 (2.2%) | 39 (3.4%) |
| 80 to 84 Years | 0 (0.0%) | 25 (2.2%) |
| 85 Years and over | 18 (1.4%) | 3 (0.3%) |
| Total | 1,260 (100.0%) | 1,160 (100.0%) |
Families and Households in Anahuac
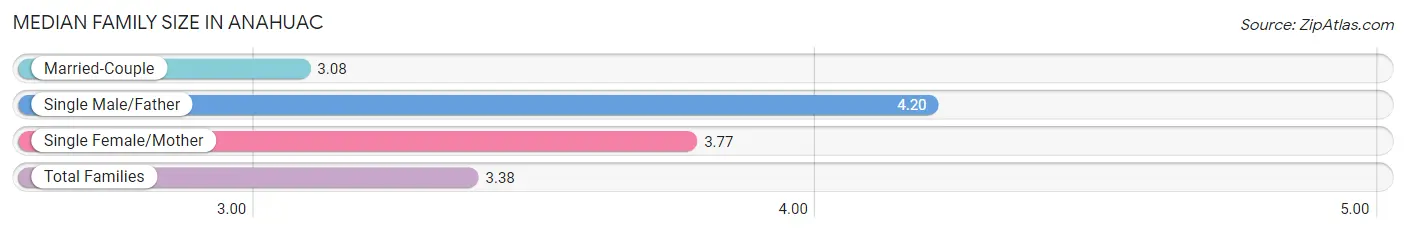
Median Family Size in Anahuac
The median family size in Anahuac is 3.38 persons per family, with single male/father families (95 | 16.8%) accounting for the largest median family size of 4.2 persons per family. On the other hand, married-couple families (381 | 67.2%) represent the smallest median family size with 3.08 persons per family.
| Family Type | # Families | Family Size |
| Married-Couple | 381 (67.2%) | 3.08 |
| Single Male/Father | 95 (16.8%) | 4.20 |
| Single Female/Mother | 91 (16.1%) | 3.77 |
| Total Families | 567 (100.0%) | 3.38 |
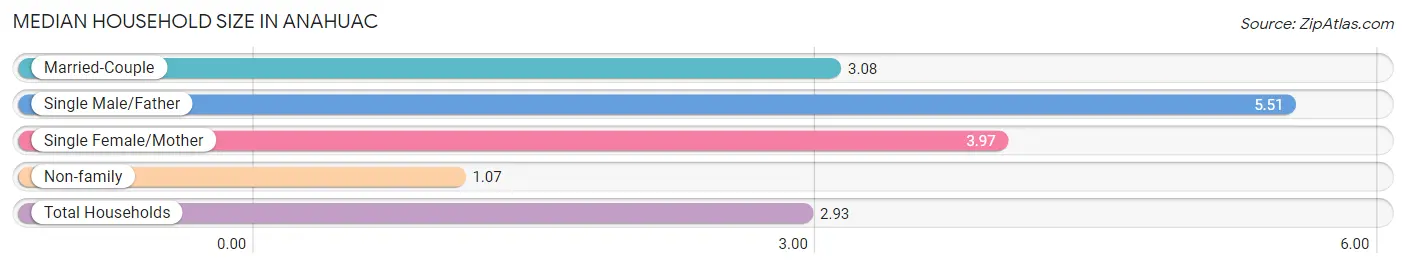
Median Household Size in Anahuac
The median household size in Anahuac is 2.93 persons per household, with single male/father households (95 | 12.2%) accounting for the largest median household size of 5.51 persons per household. non-family households (214 | 27.4%) represent the smallest median household size with 1.07 persons per household.
| Household Type | # Households | Household Size |
| Married-Couple | 381 (48.8%) | 3.08 |
| Single Male/Father | 95 (12.2%) | 5.51 |
| Single Female/Mother | 91 (11.7%) | 3.97 |
| Non-family | 214 (27.4%) | 1.07 |
| Total Households | 781 (100.0%) | 2.93 |
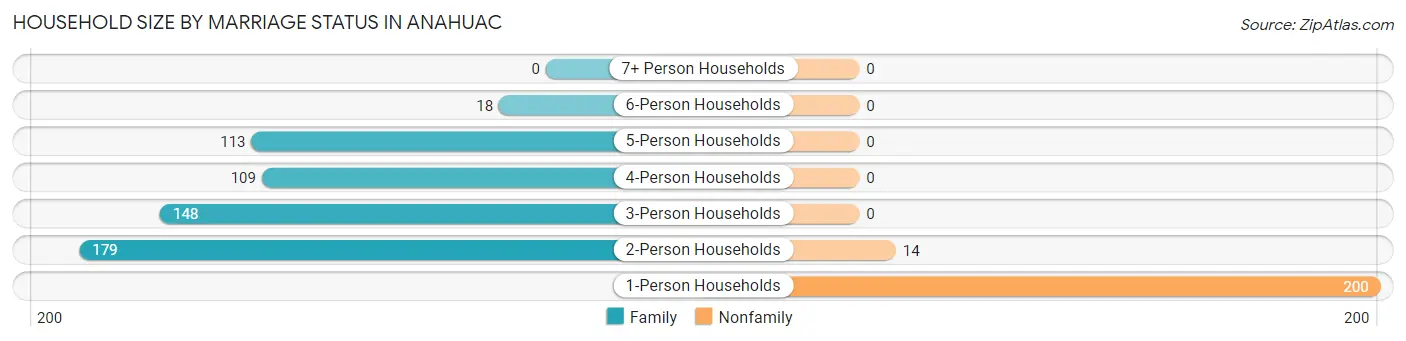
Household Size by Marriage Status in Anahuac
Out of a total of 781 households in Anahuac, 567 (72.6%) are family households, while 214 (27.4%) are nonfamily households. The most numerous type of family households are 2-person households, comprising 179, and the most common type of nonfamily households are 1-person households, comprising 200.
| Household Size | Family Households | Nonfamily Households |
| 1-Person Households | - | 200 (25.6%) |
| 2-Person Households | 179 (22.9%) | 14 (1.8%) |
| 3-Person Households | 148 (19.0%) | 0 (0.0%) |
| 4-Person Households | 109 (14.0%) | 0 (0.0%) |
| 5-Person Households | 113 (14.5%) | 0 (0.0%) |
| 6-Person Households | 18 (2.3%) | 0 (0.0%) |
| 7+ Person Households | 0 (0.0%) | 0 (0.0%) |
| Total | 567 (72.6%) | 214 (27.4%) |
Female Fertility in Anahuac
Fertility by Age in Anahuac
Average fertility rate in Anahuac is 76.0 births per 1,000 women. Women in the age bracket of 35 to 50 years have the highest fertility rate with 105.0 births per 1,000 women. Women in the age bracket of 20 to 34 years acount for 53.8% of all women with births.
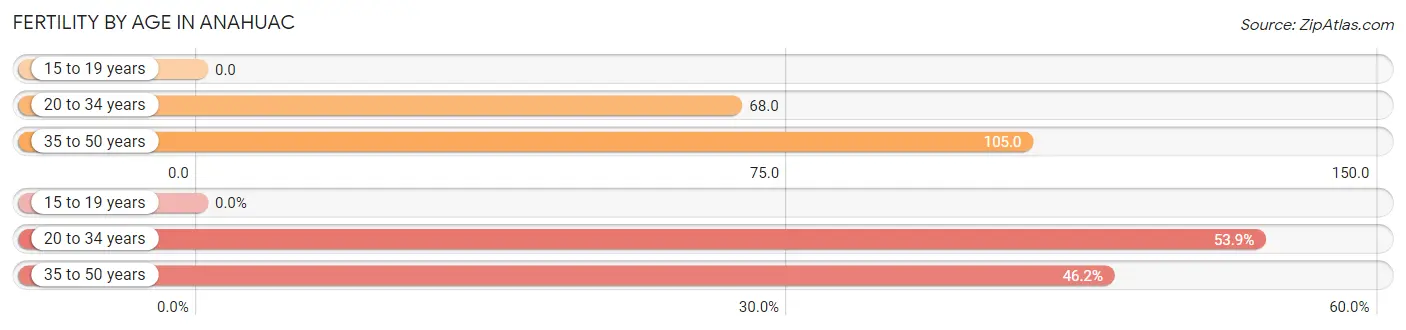
| Age Bracket | Women with Births | Births / 1,000 Women |
| 15 to 19 years | 0 (0.0%) | 0.0 |
| 20 to 34 years | 21 (53.8%) | 68.0 |
| 35 to 50 years | 18 (46.2%) | 105.0 |
| Total | 39 (100.0%) | 76.0 |
Fertility by Age by Marriage Status in Anahuac
79.5% of women with births (39) in Anahuac are married. The highest percentage of unmarried women with births falls into 20 to 34 years age bracket with 38.1% of them unmarried at the time of birth, while the lowest percentage of unmarried women with births belong to 35 to 50 years age bracket with 0.0% of them unmarried.
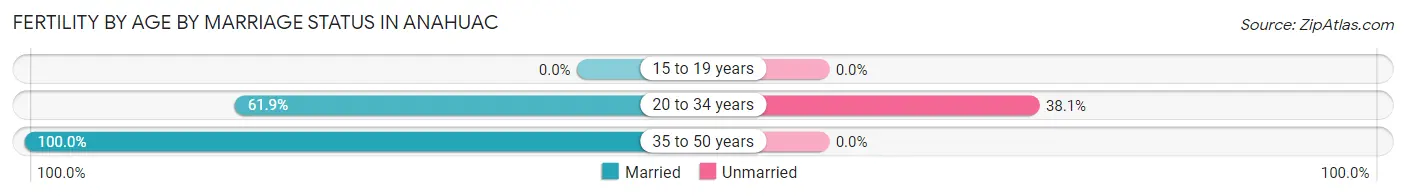
| Age Bracket | Married | Unmarried |
| 15 to 19 years | 0 (0.0%) | 0 (0.0%) |
| 20 to 34 years | 13 (61.9%) | 8 (38.1%) |
| 35 to 50 years | 18 (100.0%) | 0 (0.0%) |
| Total | 31 (79.5%) | 8 (20.5%) |
Fertility by Education in Anahuac
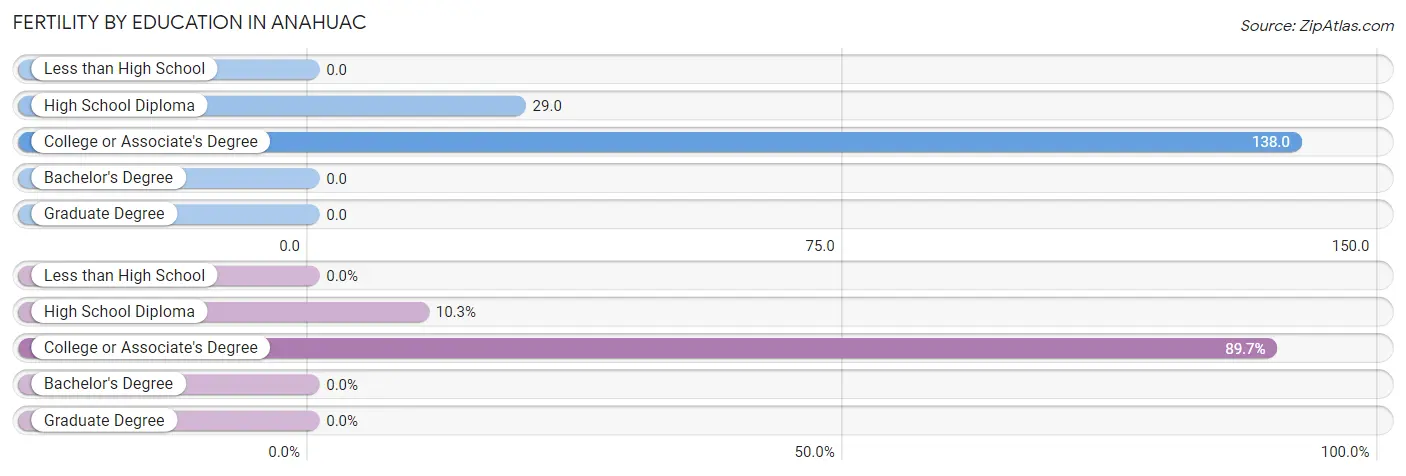
| Educational Attainment | Women with Births | Births / 1,000 Women |
| Less than High School | 0 (0.0%) | 0.0 |
| High School Diploma | 4 (10.3%) | 29.0 |
| College or Associate's Degree | 35 (89.7%) | 138.0 |
| Bachelor's Degree | 0 (0.0%) | 0.0 |
| Graduate Degree | 0 (0.0%) | 0.0 |
| Total | 39 (100.0%) | 76.0 |
Fertility by Education by Marriage Status in Anahuac
20.5% of women with births in Anahuac are unmarried. Women with the educational attainment of college or associate's degree are most likely to be married with 88.6% of them married at childbirth, while women with the educational attainment of high school diploma are least likely to be married with 100.0% of them unmarried at childbirth.
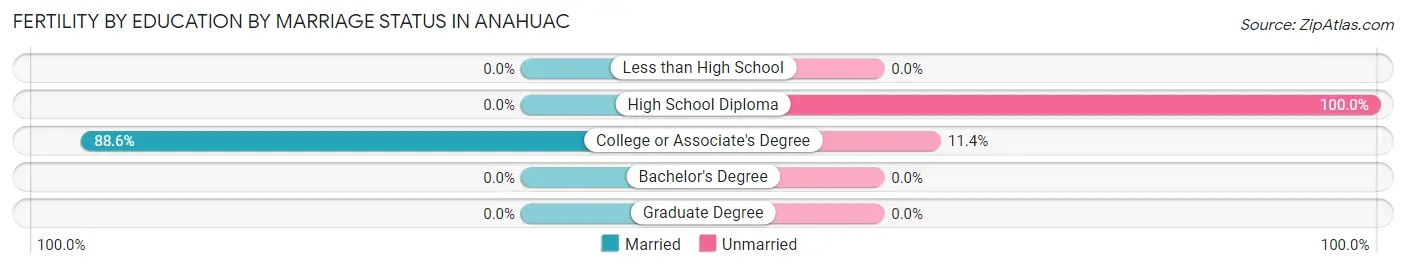
| Educational Attainment | Married | Unmarried |
| Less than High School | 0 (0.0%) | 0 (0.0%) |
| High School Diploma | 0 (0.0%) | 4 (100.0%) |
| College or Associate's Degree | 31 (88.6%) | 4 (11.4%) |
| Bachelor's Degree | 0 (0.0%) | 0 (0.0%) |
| Graduate Degree | 0 (0.0%) | 0 (0.0%) |
| Total | 31 (79.5%) | 8 (20.5%) |
Income in Anahuac
Income Overview in Anahuac
Per Capita Income in Anahuac is $26,767, while median incomes of families and households are $78,853 and $69,742 respectively.
| Characteristic | Number | Measure |
| Per Capita Income | 2,420 | $26,767 |
| Median Family Income | 567 | $78,853 |
| Mean Family Income | 567 | $88,170 |
| Median Household Income | 781 | $69,742 |
| Mean Household Income | 781 | $77,858 |
| Income Deficit | 567 | $0 |
| Wage / Income Gap (%) | 2,420 | 61.35% |
| Wage / Income Gap ($) | 2,420 | 38.65¢ per $1 |
| Gini / Inequality Index | 2,420 | 0.39 |
Earnings by Sex in Anahuac
Average Earnings in Anahuac are $42,770, $58,466 for men and $22,600 for women, a difference of 61.4%.
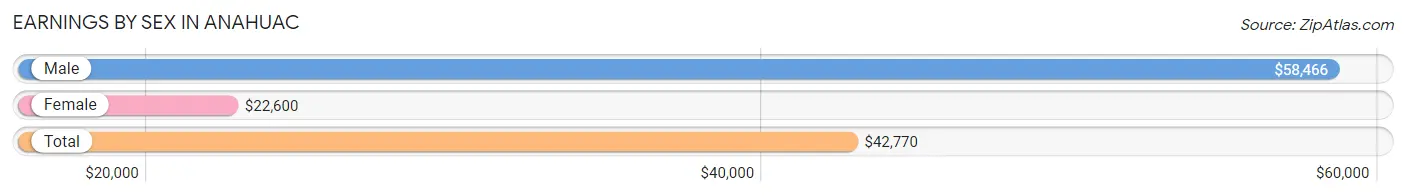
| Sex | Number | Average Earnings |
| Male | 693 (59.9%) | $58,466 |
| Female | 464 (40.1%) | $22,600 |
| Total | 1,157 (100.0%) | $42,770 |
Earnings by Sex by Income Bracket in Anahuac
The most common earnings brackets in Anahuac are $75,000 to $99,999 for men (170 | 24.5%) and $2,499 or less for women (104 | 22.4%).
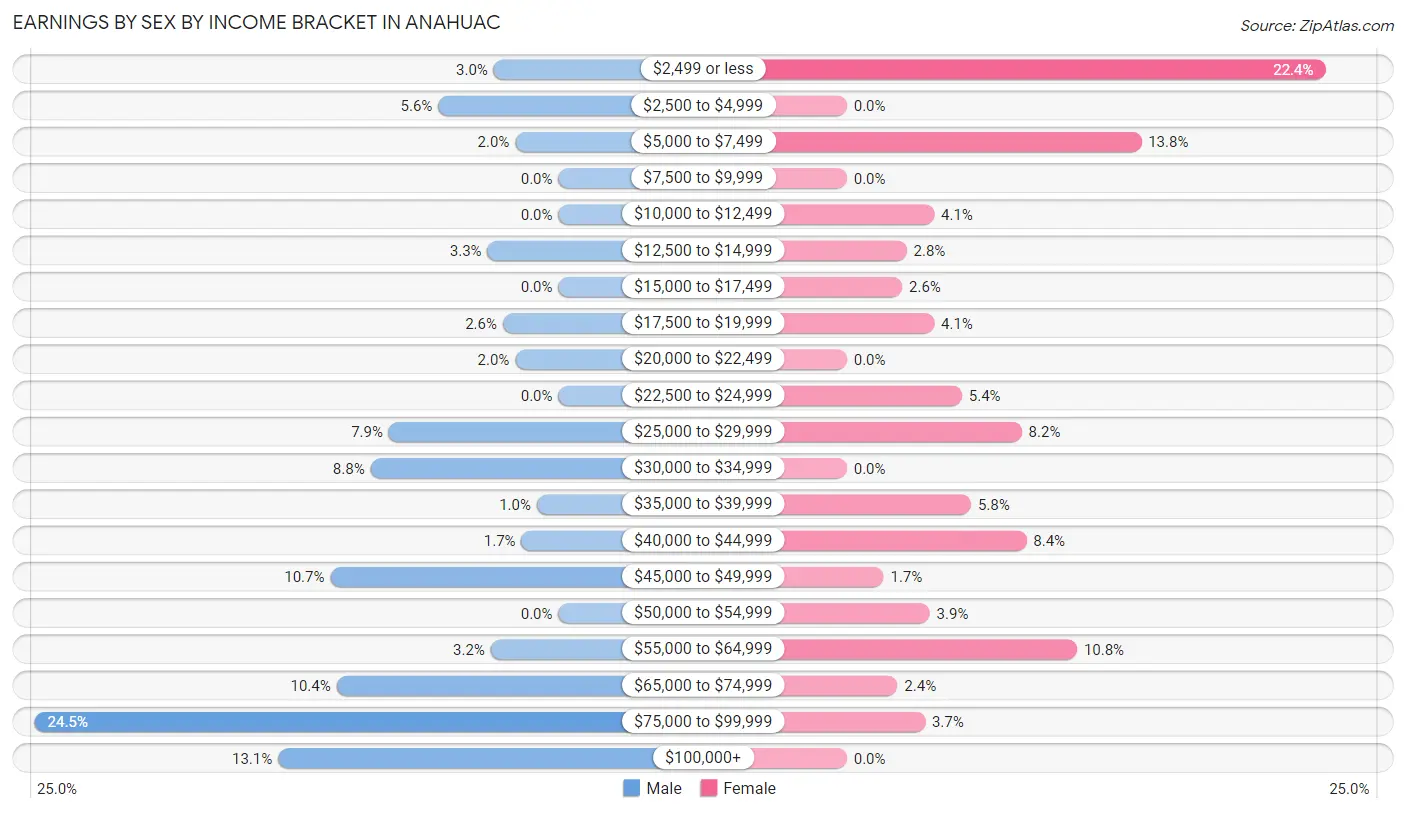
| Income | Male | Female |
| $2,499 or less | 21 (3.0%) | 104 (22.4%) |
| $2,500 to $4,999 | 39 (5.6%) | 0 (0.0%) |
| $5,000 to $7,499 | 14 (2.0%) | 64 (13.8%) |
| $7,500 to $9,999 | 0 (0.0%) | 0 (0.0%) |
| $10,000 to $12,499 | 0 (0.0%) | 19 (4.1%) |
| $12,500 to $14,999 | 23 (3.3%) | 13 (2.8%) |
| $15,000 to $17,499 | 0 (0.0%) | 12 (2.6%) |
| $17,500 to $19,999 | 18 (2.6%) | 19 (4.1%) |
| $20,000 to $22,499 | 14 (2.0%) | 0 (0.0%) |
| $22,500 to $24,999 | 0 (0.0%) | 25 (5.4%) |
| $25,000 to $29,999 | 55 (7.9%) | 38 (8.2%) |
| $30,000 to $34,999 | 61 (8.8%) | 0 (0.0%) |
| $35,000 to $39,999 | 7 (1.0%) | 27 (5.8%) |
| $40,000 to $44,999 | 12 (1.7%) | 39 (8.4%) |
| $45,000 to $49,999 | 74 (10.7%) | 8 (1.7%) |
| $50,000 to $54,999 | 0 (0.0%) | 18 (3.9%) |
| $55,000 to $64,999 | 22 (3.2%) | 50 (10.8%) |
| $65,000 to $74,999 | 72 (10.4%) | 11 (2.4%) |
| $75,000 to $99,999 | 170 (24.5%) | 17 (3.7%) |
| $100,000+ | 91 (13.1%) | 0 (0.0%) |
| Total | 693 (100.0%) | 464 (100.0%) |
Earnings by Sex by Educational Attainment in Anahuac
Average earnings in Anahuac are $68,791 for men and $27,656 for women, a difference of 59.8%. Men with an educational attainment of college or associate's degree enjoy the highest average annual earnings of $78,553, while those with less than high school education earn the least with $67,659. Women with an educational attainment of bachelor's degree earn the most with the average annual earnings of $58,611, while those with high school diploma education have the smallest earnings of $27,813.
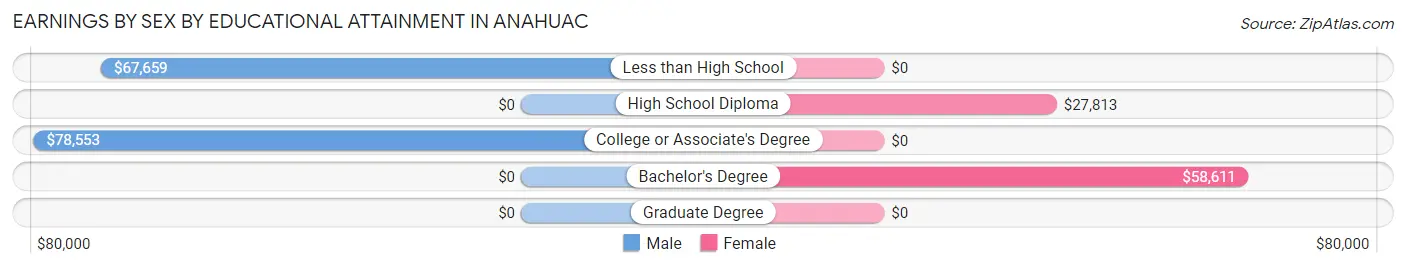
| Educational Attainment | Male Income | Female Income |
| Less than High School | $67,659 | $0 |
| High School Diploma | - | - |
| College or Associate's Degree | $78,553 | $0 |
| Bachelor's Degree | - | - |
| Graduate Degree | - | - |
| Total | $68,791 | $27,656 |
Family Income in Anahuac
Family Income Brackets in Anahuac
According to the Anahuac family income data, there are 137 families falling into the $100,000 to $149,999 income range, which is the most common income bracket and makes up 24.2% of all families. Conversely, the $25,000 to $34,999 income bracket is the least frequent group with only 21 families (3.7%) belonging to this category.
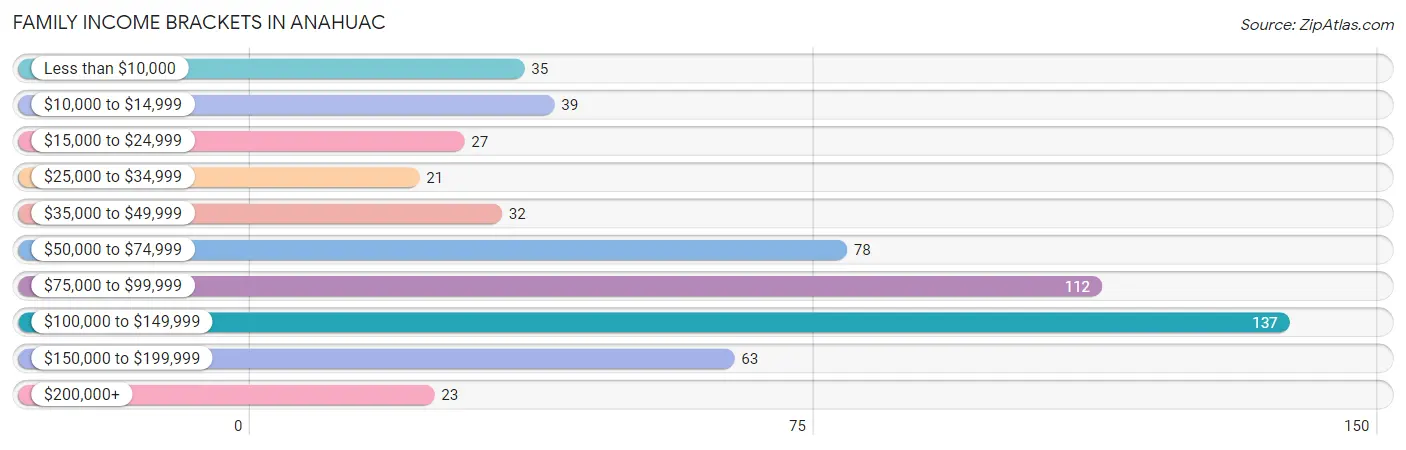
| Income Bracket | # Families | % Families |
| Less than $10,000 | 35 | 6.2% |
| $10,000 to $14,999 | 39 | 6.9% |
| $15,000 to $24,999 | 27 | 4.8% |
| $25,000 to $34,999 | 21 | 3.7% |
| $35,000 to $49,999 | 32 | 5.6% |
| $50,000 to $74,999 | 78 | 13.8% |
| $75,000 to $99,999 | 112 | 19.8% |
| $100,000 to $149,999 | 137 | 24.2% |
| $150,000 to $199,999 | 63 | 11.1% |
| $200,000+ | 23 | 4.1% |
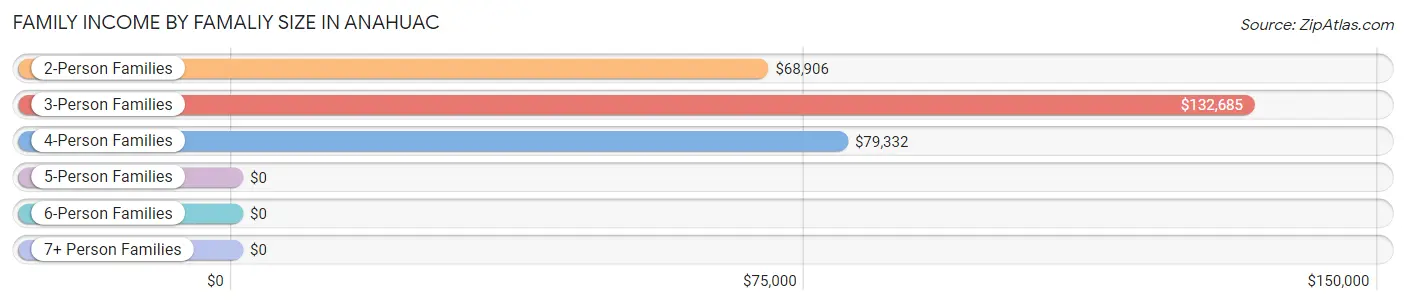
Family Income by Famaliy Size in Anahuac
3-person families (152 | 26.8%) account for the highest median family income in Anahuac with $132,685 per family, while 3-person families (152 | 26.8%) have the highest median income of $44,228 per family member.
| Income Bracket | # Families | Median Income |
| 2-Person Families | 201 (35.4%) | $68,906 |
| 3-Person Families | 152 (26.8%) | $132,685 |
| 4-Person Families | 149 (26.3%) | $79,332 |
| 5-Person Families | 47 (8.3%) | $0 |
| 6-Person Families | 18 (3.2%) | $0 |
| 7+ Person Families | 0 (0.0%) | $0 |
| Total | 567 (100.0%) | $78,853 |
Family Income by Number of Earners in Anahuac

| Number of Earners | # Families | Median Income |
| No Earners | 85 (15.0%) | $24,732 |
| 1 Earner | 196 (34.6%) | $78,699 |
| 2 Earners | 172 (30.3%) | $114,118 |
| 3+ Earners | 114 (20.1%) | $0 |
| Total | 567 (100.0%) | $78,853 |
Household Income in Anahuac
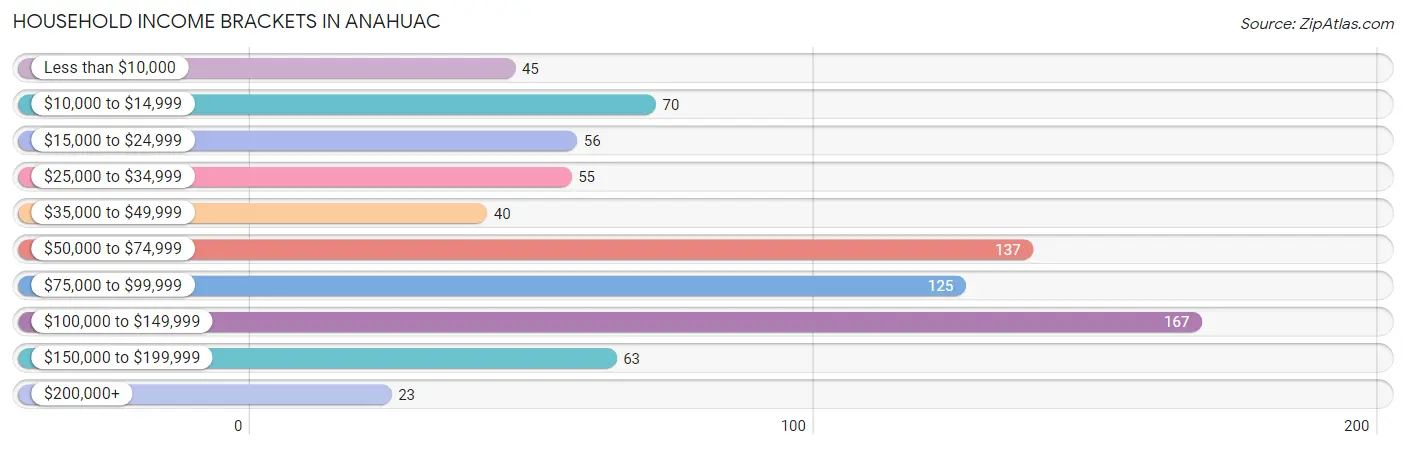
Household Income Brackets in Anahuac
With 167 households falling in the category, the $100,000 to $149,999 income range is the most frequent in Anahuac, accounting for 21.4% of all households. In contrast, only 23 households (2.9%) fall into the $200,000+ income bracket, making it the least populous group.
| Income Bracket | # Households | % Households |
| Less than $10,000 | 45 | 5.8% |
| $10,000 to $14,999 | 70 | 9.0% |
| $15,000 to $24,999 | 56 | 7.2% |
| $25,000 to $34,999 | 55 | 7.0% |
| $35,000 to $49,999 | 40 | 5.1% |
| $50,000 to $74,999 | 137 | 17.5% |
| $75,000 to $99,999 | 125 | 16.0% |
| $100,000 to $149,999 | 167 | 21.4% |
| $150,000 to $199,999 | 63 | 8.1% |
| $200,000+ | 23 | 2.9% |
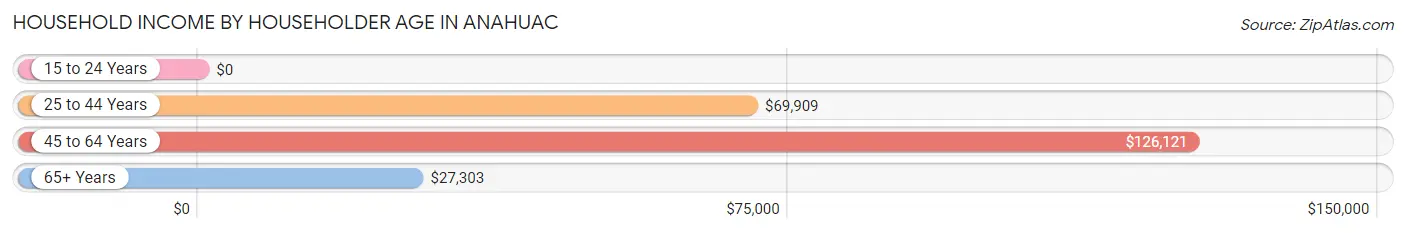
Household Income by Householder Age in Anahuac
The median household income in Anahuac is $69,742, with the highest median household income of $126,121 found in the 45 to 64 years age bracket for the primary householder. A total of 176 households (22.5%) fall into this category. Meanwhile, the 15 to 24 years age bracket for the primary householder has the lowest median household income of $0, with 14 households (1.8%) in this group.
| Income Bracket | # Households | Median Income |
| 15 to 24 Years | 14 (1.8%) | $0 |
| 25 to 44 Years | 388 (49.7%) | $69,909 |
| 45 to 64 Years | 176 (22.5%) | $126,121 |
| 65+ Years | 203 (26.0%) | $27,303 |
| Total | 781 (100.0%) | $69,742 |
Poverty in Anahuac
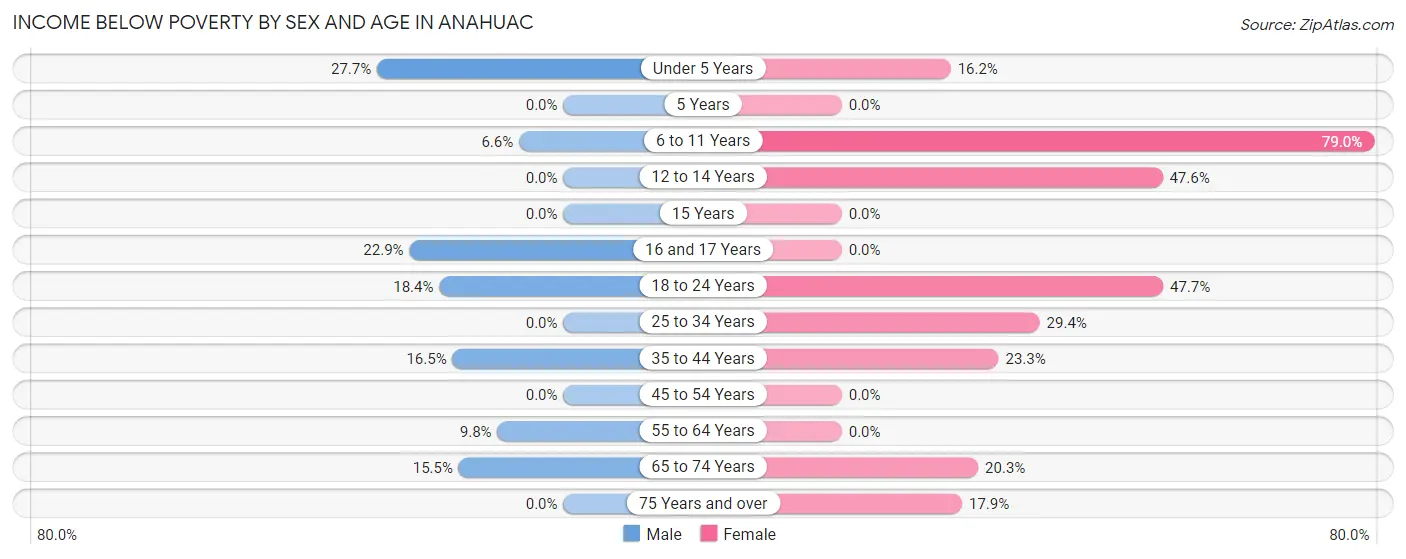
Income Below Poverty by Sex and Age in Anahuac
With 11.0% poverty level for males and 23.4% for females among the residents of Anahuac, under 5 year old males and 6 to 11 year old females are the most vulnerable to poverty, with 44 males (27.7%) and 49 females (79.0%) in their respective age groups living below the poverty level.
| Age Bracket | Male | Female |
| Under 5 Years | 44 (27.7%) | 27 (16.2%) |
| 5 Years | 0 (0.0%) | 0 (0.0%) |
| 6 to 11 Years | 10 (6.6%) | 49 (79.0%) |
| 12 to 14 Years | 0 (0.0%) | 20 (47.6%) |
| 15 Years | 0 (0.0%) | 0 (0.0%) |
| 16 and 17 Years | 8 (22.9%) | 0 (0.0%) |
| 18 to 24 Years | 14 (18.4%) | 52 (47.7%) |
| 25 to 34 Years | 0 (0.0%) | 62 (29.4%) |
| 35 to 44 Years | 13 (16.5%) | 27 (23.3%) |
| 45 to 54 Years | 0 (0.0%) | 0 (0.0%) |
| 55 to 64 Years | 14 (9.8%) | 0 (0.0%) |
| 65 to 74 Years | 25 (15.5%) | 16 (20.3%) |
| 75 Years and over | 0 (0.0%) | 10 (17.9%) |
| Total | 128 (11.0%) | 263 (23.4%) |
Income Above Poverty by Sex and Age in Anahuac
According to the poverty statistics in Anahuac, males aged 5 years and females aged 5 years are the age groups that are most secure financially, with 100.0% of males and 100.0% of females in these age groups living above the poverty line.
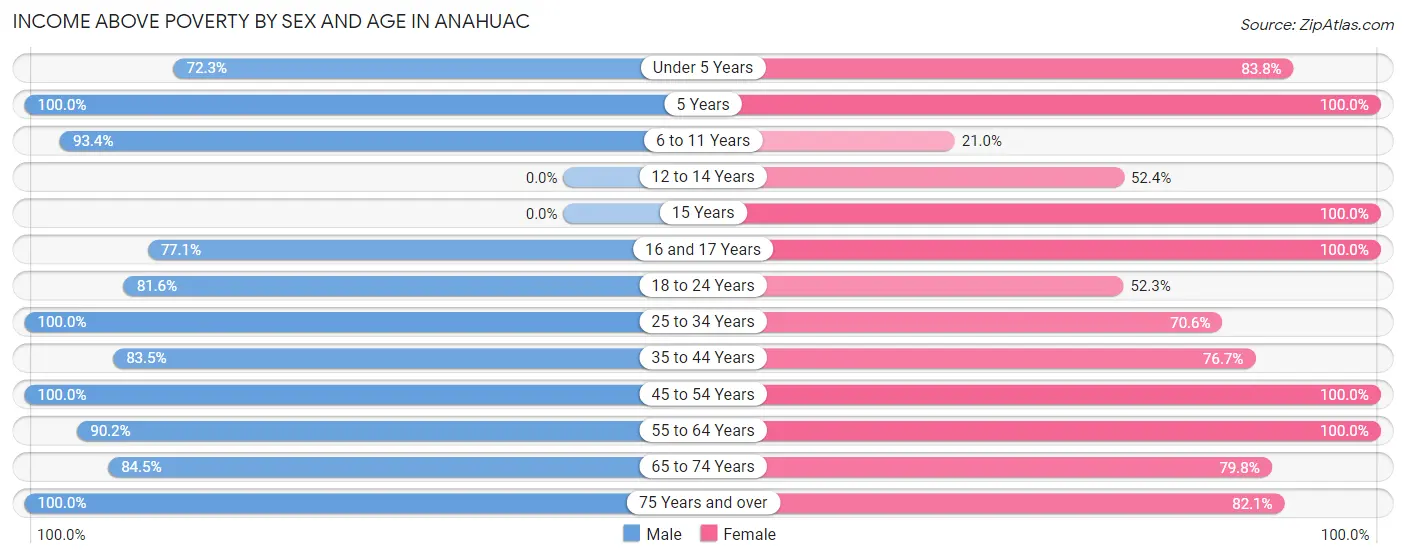
| Age Bracket | Male | Female |
| Under 5 Years | 115 (72.3%) | 140 (83.8%) |
| 5 Years | 26 (100.0%) | 25 (100.0%) |
| 6 to 11 Years | 142 (93.4%) | 13 (21.0%) |
| 12 to 14 Years | 0 (0.0%) | 22 (52.4%) |
| 15 Years | 0 (0.0%) | 8 (100.0%) |
| 16 and 17 Years | 27 (77.1%) | 10 (100.0%) |
| 18 to 24 Years | 62 (81.6%) | 57 (52.3%) |
| 25 to 34 Years | 231 (100.0%) | 149 (70.6%) |
| 35 to 44 Years | 66 (83.5%) | 89 (76.7%) |
| 45 to 54 Years | 58 (100.0%) | 83 (100.0%) |
| 55 to 64 Years | 129 (90.2%) | 157 (100.0%) |
| 65 to 74 Years | 136 (84.5%) | 63 (79.7%) |
| 75 Years and over | 43 (100.0%) | 46 (82.1%) |
| Total | 1,035 (89.0%) | 862 (76.6%) |
Income Below Poverty Among Married-Couple Families in Anahuac
The poverty statistics for married-couple families in Anahuac show that 7.6% or 29 of the total 381 families live below the poverty line. Families with 1 or 2 children have the highest poverty rate of 9.6%, comprising of 12 families. On the other hand, families with 3 or 4 children have the lowest poverty rate of 0.0%, which includes 0 families.
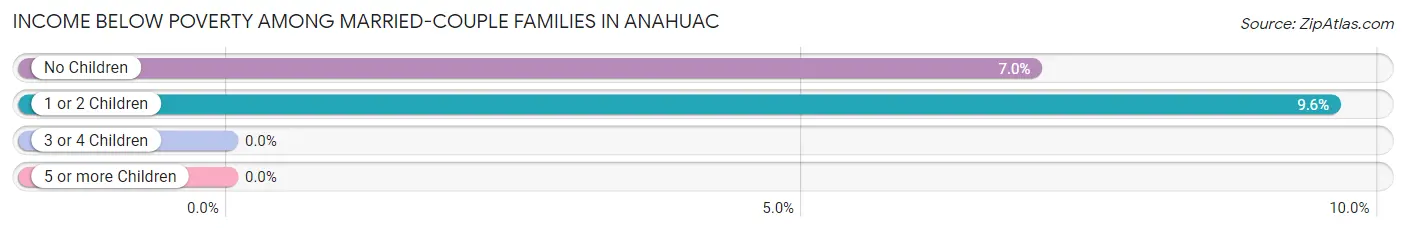
| Children | Above Poverty | Below Poverty |
| No Children | 226 (93.0%) | 17 (7.0%) |
| 1 or 2 Children | 113 (90.4%) | 12 (9.6%) |
| 3 or 4 Children | 13 (100.0%) | 0 (0.0%) |
| 5 or more Children | 0 (0.0%) | 0 (0.0%) |
| Total | 352 (92.4%) | 29 (7.6%) |
Income Below Poverty Among Single-Parent Households in Anahuac
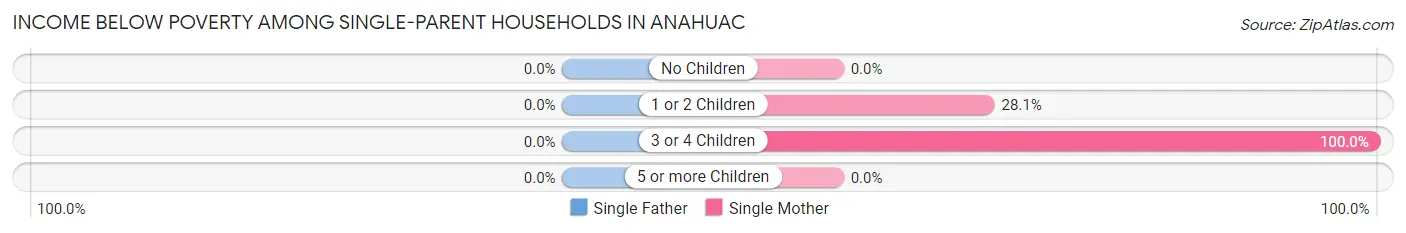
| Children | Single Father | Single Mother |
| No Children | 0 (0.0%) | 0 (0.0%) |
| 1 or 2 Children | 0 (0.0%) | 18 (28.1%) |
| 3 or 4 Children | 0 (0.0%) | 27 (100.0%) |
| 5 or more Children | 0 (0.0%) | 0 (0.0%) |
| Total | 0 (0.0%) | 45 (49.4%) |
Income Below Poverty Among Married-Couple vs Single-Parent Households in Anahuac
The poverty data for Anahuac shows that 29 of the married-couple family households (7.6%) and 45 of the single-parent households (24.2%) are living below the poverty level. Within the married-couple family households, those with 1 or 2 children have the highest poverty rate, with 12 households (9.6%) falling below the poverty line. Among the single-parent households, those with 3 or 4 children have the highest poverty rate, with 27 household (32.1%) living below poverty.
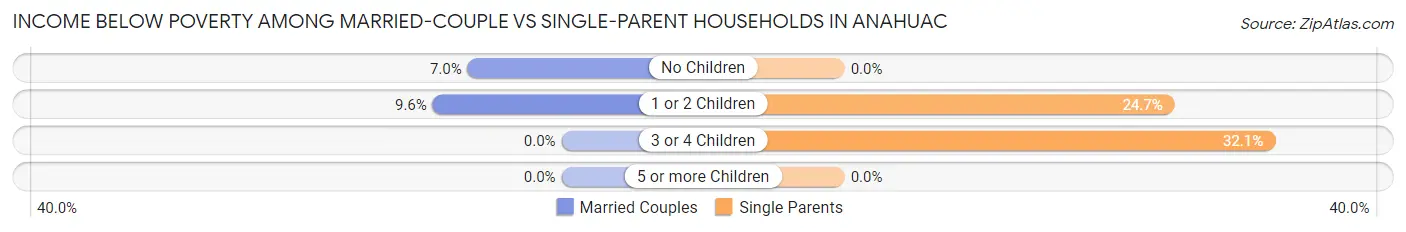
| Children | Married-Couple Families | Single-Parent Households |
| No Children | 17 (7.0%) | 0 (0.0%) |
| 1 or 2 Children | 12 (9.6%) | 18 (24.7%) |
| 3 or 4 Children | 0 (0.0%) | 27 (32.1%) |
| 5 or more Children | 0 (0.0%) | 0 (0.0%) |
| Total | 29 (7.6%) | 45 (24.2%) |
Employment Characteristics in Anahuac
Employment by Class of Employer in Anahuac
Among the 995 employed individuals in Anahuac, private company employees (575 | 57.8%), local government employees (308 | 30.9%), and not-for-profit organizations (58 | 5.8%) make up the most common classes of employment.
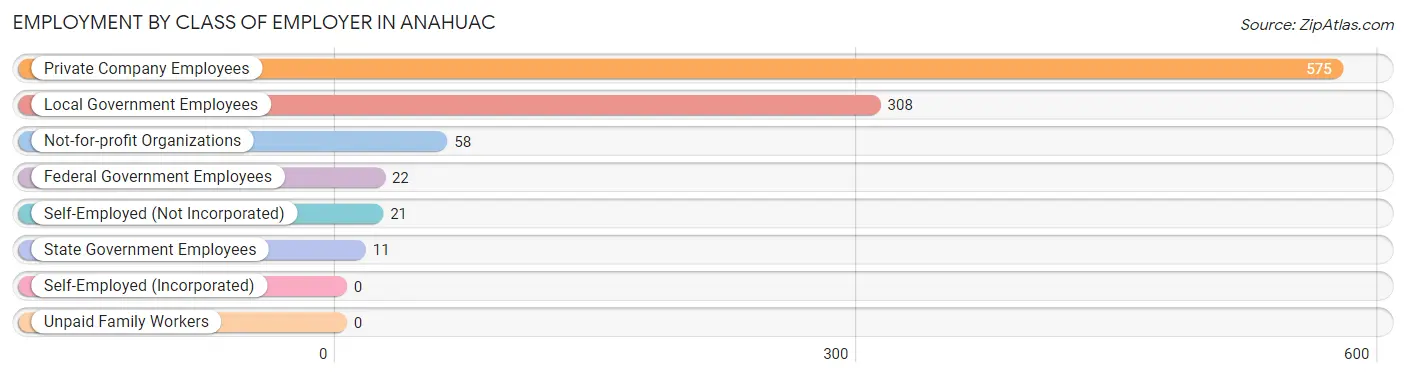
| Employer Class | # Employees | % Employees |
| Private Company Employees | 575 | 57.8% |
| Self-Employed (Incorporated) | 0 | 0.0% |
| Self-Employed (Not Incorporated) | 21 | 2.1% |
| Not-for-profit Organizations | 58 | 5.8% |
| Local Government Employees | 308 | 30.9% |
| State Government Employees | 11 | 1.1% |
| Federal Government Employees | 22 | 2.2% |
| Unpaid Family Workers | 0 | 0.0% |
| Total | 995 | 100.0% |
Employment Status by Age in Anahuac
According to the labor force statistics for Anahuac, out of the total population over 16 years of age (1,779), 60.3% or 1,073 individuals are in the labor force, with 7.3% or 78 of them unemployed. The age group with the highest labor force participation rate is 60 to 64 years, with 97.6% or 123 individuals in the labor force. Within the labor force, the 55 to 59 years age range has the highest percentage of unemployed individuals, with 34.5% or 29 of them being unemployed.
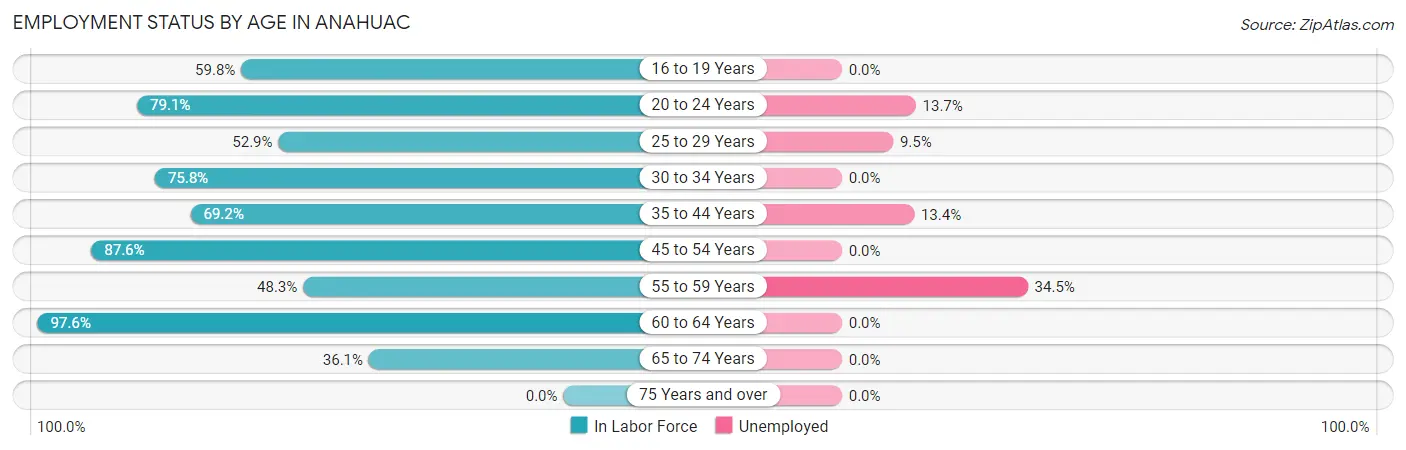
| Age Bracket | In Labor Force | Unemployed |
| 16 to 19 Years | 64 (59.8%) | 0 (0.0%) |
| 20 to 24 Years | 102 (79.1%) | 14 (13.7%) |
| 25 to 29 Years | 137 (52.9%) | 13 (9.5%) |
| 30 to 34 Years | 182 (75.8%) | 0 (0.0%) |
| 35 to 44 Years | 164 (69.2%) | 22 (13.4%) |
| 45 to 54 Years | 127 (87.6%) | 0 (0.0%) |
| 55 to 59 Years | 84 (48.3%) | 29 (34.5%) |
| 60 to 64 Years | 123 (97.6%) | 0 (0.0%) |
| 65 to 74 Years | 90 (36.1%) | 0 (0.0%) |
| 75 Years and over | 0 (0.0%) | 0 (0.0%) |
| Total | 1,073 (60.3%) | 78 (7.3%) |
Employment Status by Educational Attainment in Anahuac
According to labor force statistics for Anahuac, 69.2% of individuals (817) out of the total population between 25 and 64 years of age (1,181) are in the labor force, with 7.8% or 64 of them being unemployed. The group with the highest labor force participation rate are those with the educational attainment of bachelor's degree or higher, with 87.8% or 72 individuals in the labor force. Within the labor force, individuals with less than high school education have the highest percentage of unemployment, with 18.9% or 42 of them being unemployed.
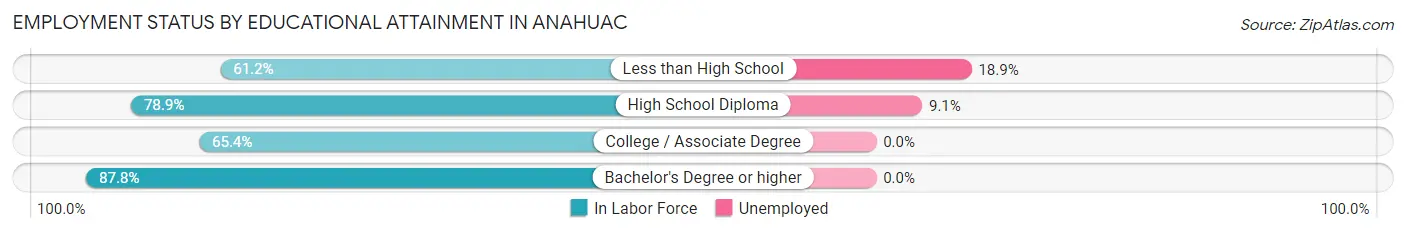
| Educational Attainment | In Labor Force | Unemployed |
| Less than High School | 222 (61.2%) | 69 (18.9%) |
| High School Diploma | 243 (78.9%) | 28 (9.1%) |
| College / Associate Degree | 280 (65.4%) | 0 (0.0%) |
| Bachelor's Degree or higher | 72 (87.8%) | 0 (0.0%) |
| Total | 817 (69.2%) | 92 (7.8%) |
Employment Occupations by Sex in Anahuac
Management, Business, Science and Arts Occupations
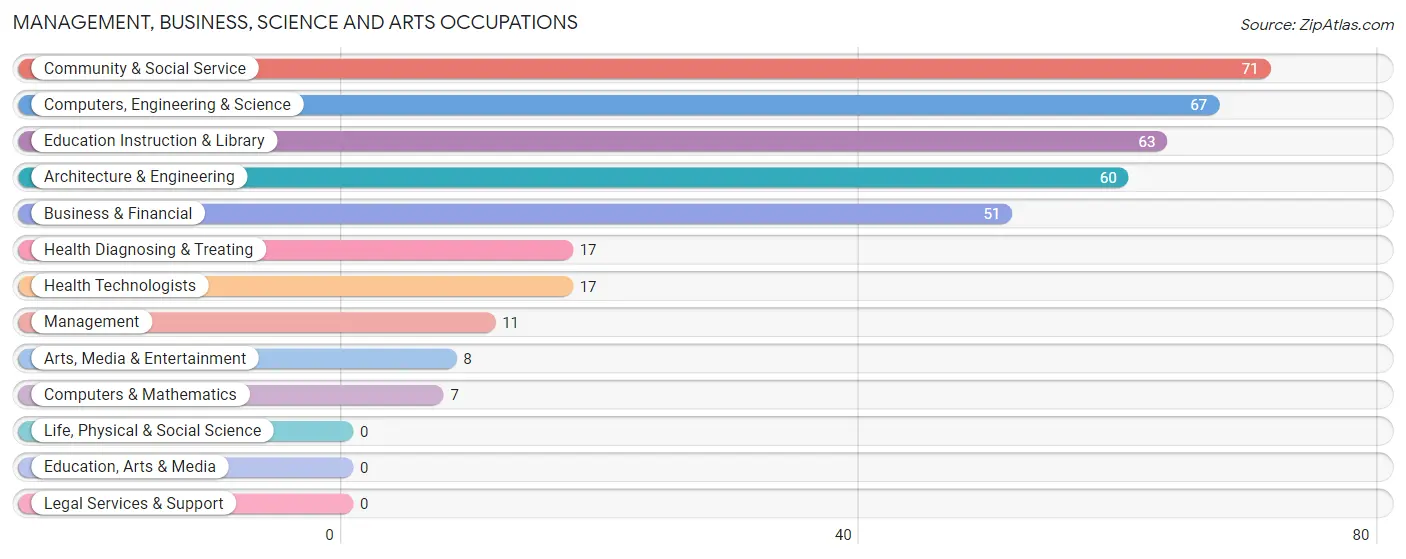
The most common Management, Business, Science and Arts occupations in Anahuac are Community & Social Service (71 | 7.1%), Computers, Engineering & Science (67 | 6.7%), Education Instruction & Library (63 | 6.3%), Architecture & Engineering (60 | 6.0%), and Business & Financial (51 | 5.1%).
Management, Business, Science and Arts Occupations by Sex
Within the Management, Business, Science and Arts occupations in Anahuac, the most male-oriented occupations are Management (100.0%), Computers, Engineering & Science (100.0%), and Computers & Mathematics (100.0%), while the most female-oriented occupations are Arts, Media & Entertainment (100.0%), Health Diagnosing & Treating (100.0%), and Health Technologists (100.0%).
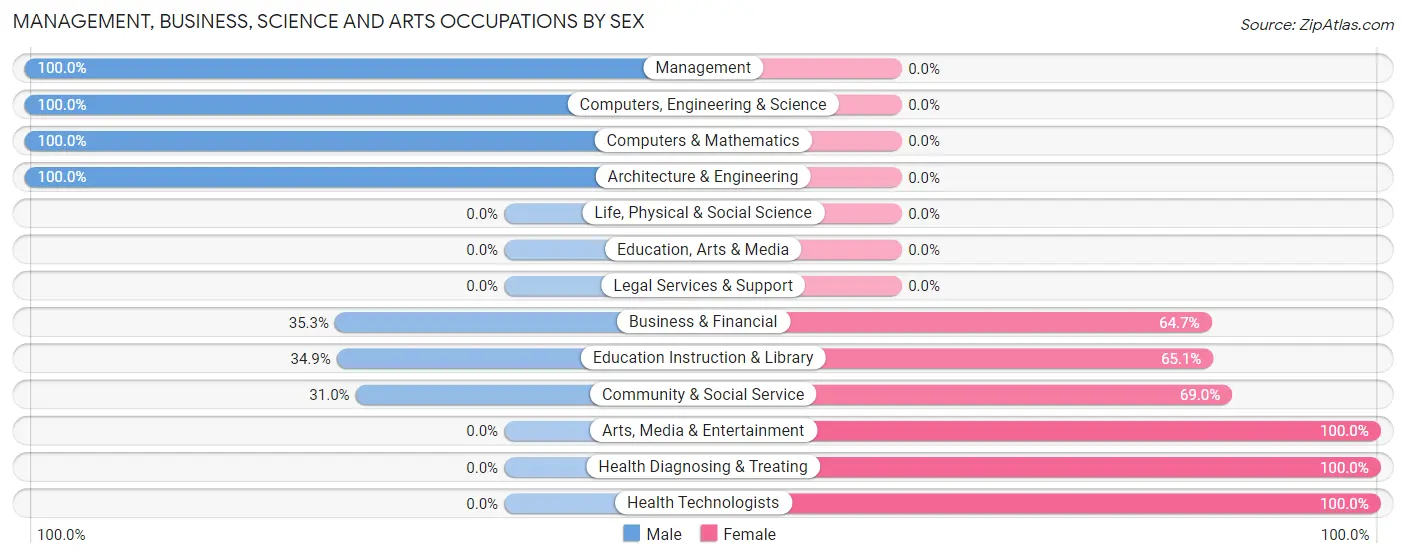
| Occupation | Male | Female |
| Management | 11 (100.0%) | 0 (0.0%) |
| Business & Financial | 18 (35.3%) | 33 (64.7%) |
| Computers, Engineering & Science | 67 (100.0%) | 0 (0.0%) |
| Computers & Mathematics | 7 (100.0%) | 0 (0.0%) |
| Architecture & Engineering | 60 (100.0%) | 0 (0.0%) |
| Life, Physical & Social Science | 0 (0.0%) | 0 (0.0%) |
| Community & Social Service | 22 (31.0%) | 49 (69.0%) |
| Education, Arts & Media | 0 (0.0%) | 0 (0.0%) |
| Legal Services & Support | 0 (0.0%) | 0 (0.0%) |
| Education Instruction & Library | 22 (34.9%) | 41 (65.1%) |
| Arts, Media & Entertainment | 0 (0.0%) | 8 (100.0%) |
| Health Diagnosing & Treating | 0 (0.0%) | 17 (100.0%) |
| Health Technologists | 0 (0.0%) | 17 (100.0%) |
| Total (Category) | 118 (54.4%) | 99 (45.6%) |
| Total (Overall) | 581 (58.4%) | 414 (41.6%) |
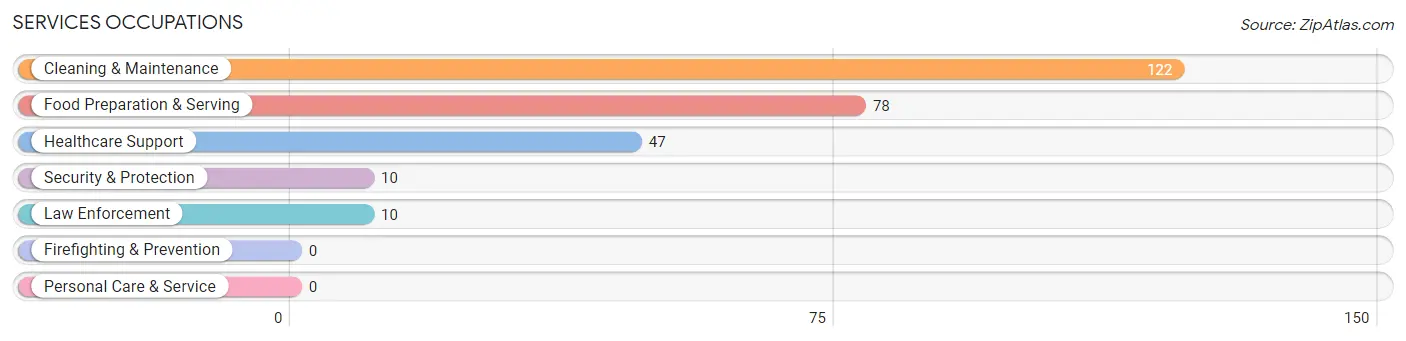
Services Occupations
The most common Services occupations in Anahuac are Cleaning & Maintenance (122 | 12.3%), Food Preparation & Serving (78 | 7.8%), Healthcare Support (47 | 4.7%), Security & Protection (10 | 1.0%), and Law Enforcement (10 | 1.0%).
Services Occupations by Sex
Within the Services occupations in Anahuac, the most male-oriented occupations are Cleaning & Maintenance (52.5%), and Food Preparation & Serving (34.6%), while the most female-oriented occupations are Healthcare Support (100.0%), Security & Protection (100.0%), and Law Enforcement (100.0%).
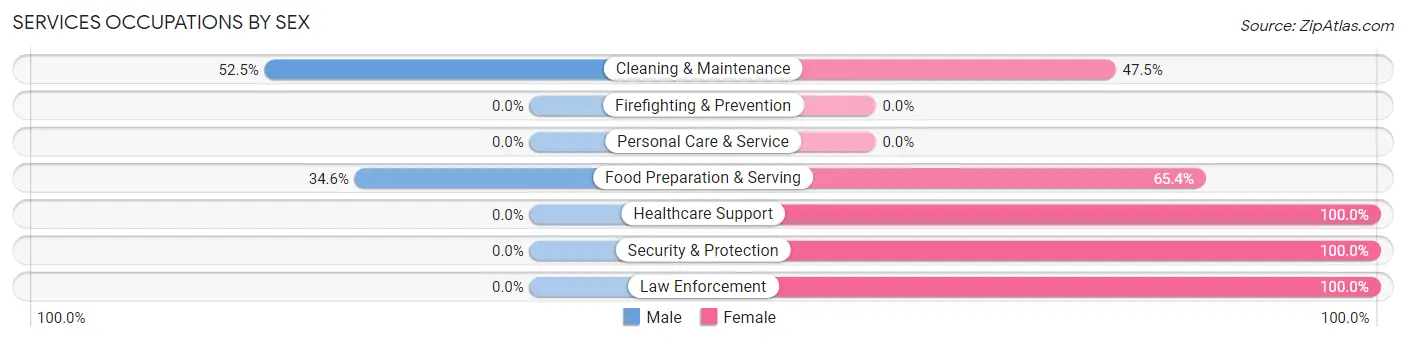
| Occupation | Male | Female |
| Healthcare Support | 0 (0.0%) | 47 (100.0%) |
| Security & Protection | 0 (0.0%) | 10 (100.0%) |
| Firefighting & Prevention | 0 (0.0%) | 0 (0.0%) |
| Law Enforcement | 0 (0.0%) | 10 (100.0%) |
| Food Preparation & Serving | 27 (34.6%) | 51 (65.4%) |
| Cleaning & Maintenance | 64 (52.5%) | 58 (47.5%) |
| Personal Care & Service | 0 (0.0%) | 0 (0.0%) |
| Total (Category) | 91 (35.4%) | 166 (64.6%) |
| Total (Overall) | 581 (58.4%) | 414 (41.6%) |
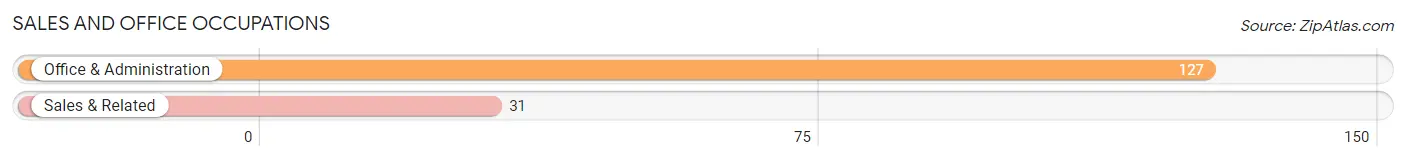
Sales and Office Occupations
The most common Sales and Office occupations in Anahuac are Office & Administration (127 | 12.8%), and Sales & Related (31 | 3.1%).
Sales and Office Occupations by Sex

| Occupation | Male | Female |
| Sales & Related | 8 (25.8%) | 23 (74.2%) |
| Office & Administration | 19 (15.0%) | 108 (85.0%) |
| Total (Category) | 27 (17.1%) | 131 (82.9%) |
| Total (Overall) | 581 (58.4%) | 414 (41.6%) |
Natural Resources, Construction and Maintenance Occupations
The most common Natural Resources, Construction and Maintenance occupations in Anahuac are Construction & Extraction (140 | 14.1%), and Installation, Maintenance & Repair (31 | 3.1%).
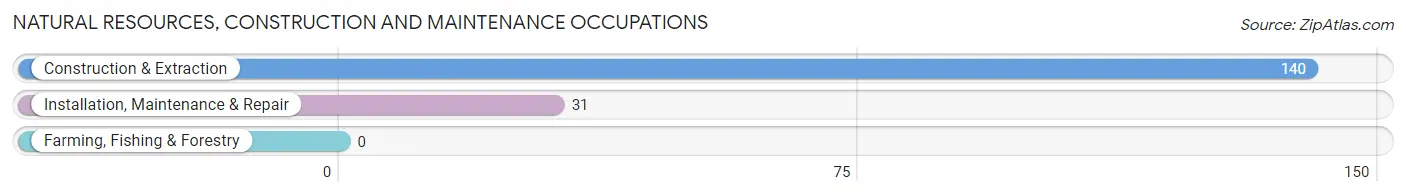
Natural Resources, Construction and Maintenance Occupations by Sex
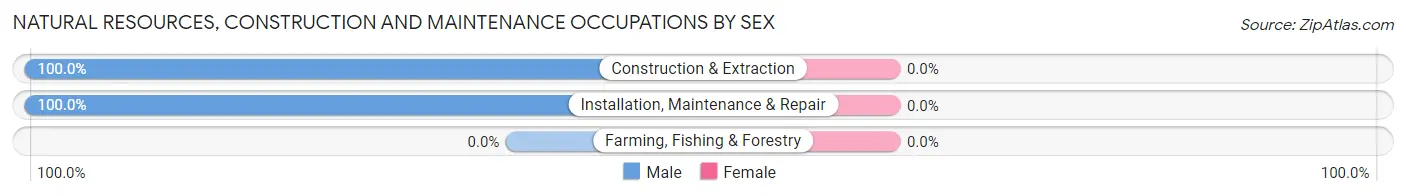
| Occupation | Male | Female |
| Farming, Fishing & Forestry | 0 (0.0%) | 0 (0.0%) |
| Construction & Extraction | 140 (100.0%) | 0 (0.0%) |
| Installation, Maintenance & Repair | 31 (100.0%) | 0 (0.0%) |
| Total (Category) | 171 (100.0%) | 0 (0.0%) |
| Total (Overall) | 581 (58.4%) | 414 (41.6%) |
Production, Transportation and Moving Occupations
The most common Production, Transportation and Moving occupations in Anahuac are Material Moving (86 | 8.6%), Production (66 | 6.6%), and Transportation (40 | 4.0%).
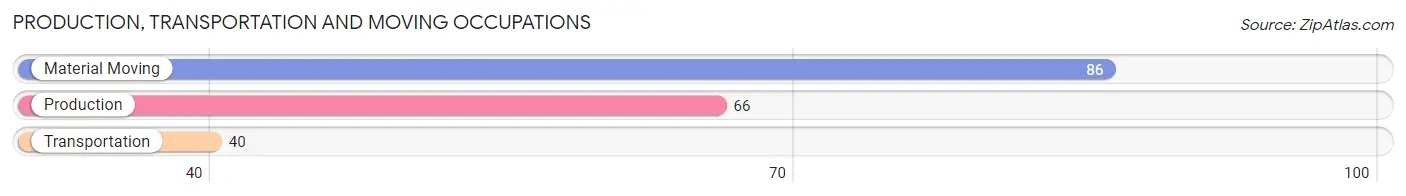
Production, Transportation and Moving Occupations by Sex
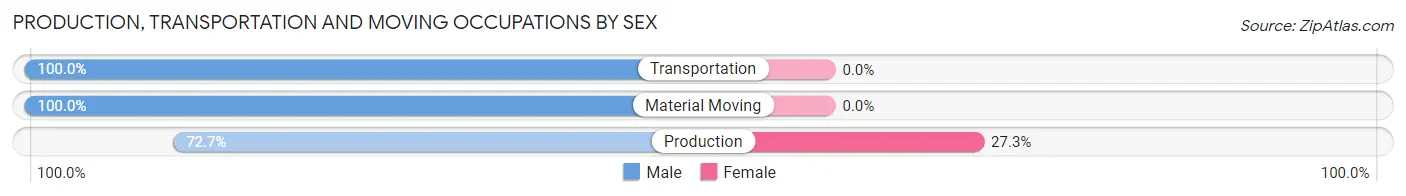
| Occupation | Male | Female |
| Production | 48 (72.7%) | 18 (27.3%) |
| Transportation | 40 (100.0%) | 0 (0.0%) |
| Material Moving | 86 (100.0%) | 0 (0.0%) |
| Total (Category) | 174 (90.6%) | 18 (9.4%) |
| Total (Overall) | 581 (58.4%) | 414 (41.6%) |
Employment Industries by Sex in Anahuac
Employment Industries in Anahuac
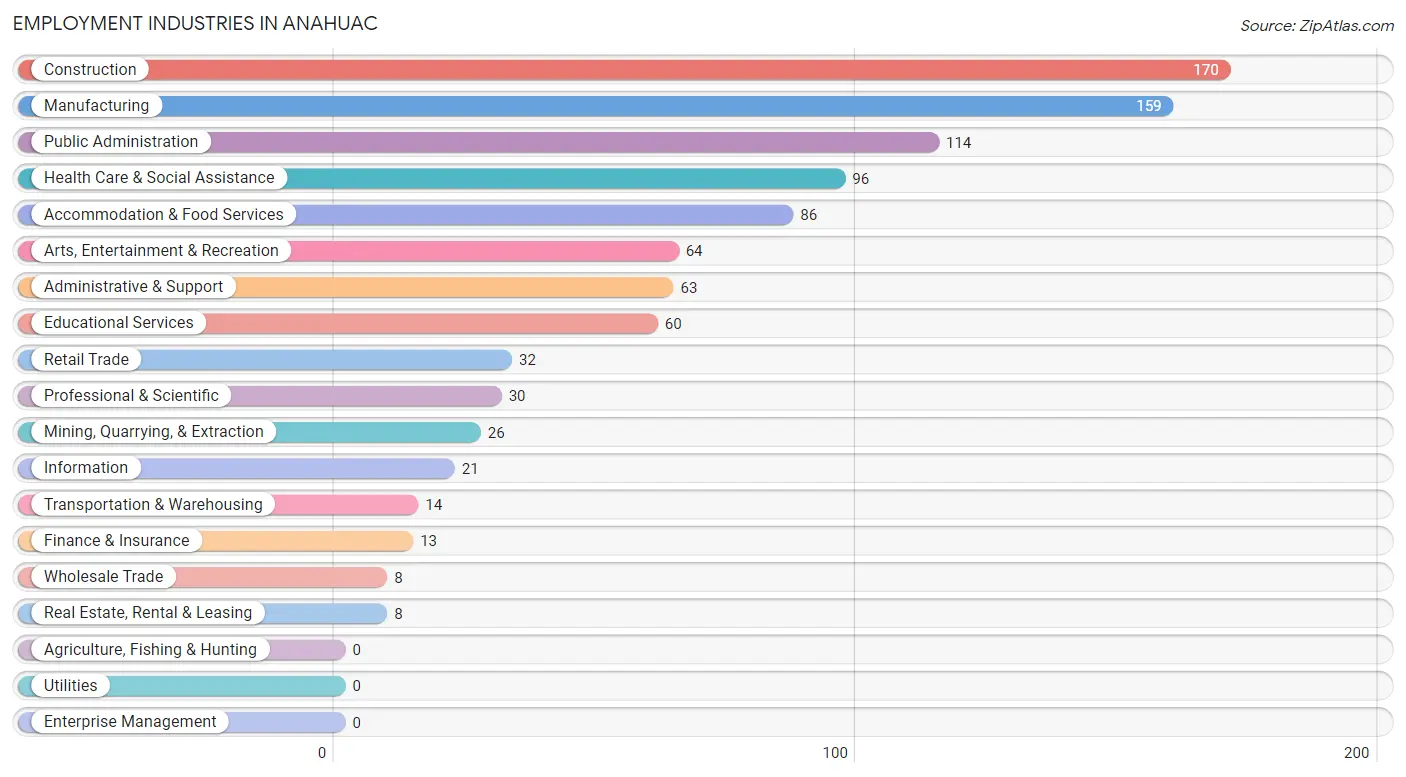
The major employment industries in Anahuac include Construction (170 | 17.1%), Manufacturing (159 | 16.0%), Public Administration (114 | 11.5%), Health Care & Social Assistance (96 | 9.7%), and Accommodation & Food Services (86 | 8.6%).
Employment Industries by Sex in Anahuac
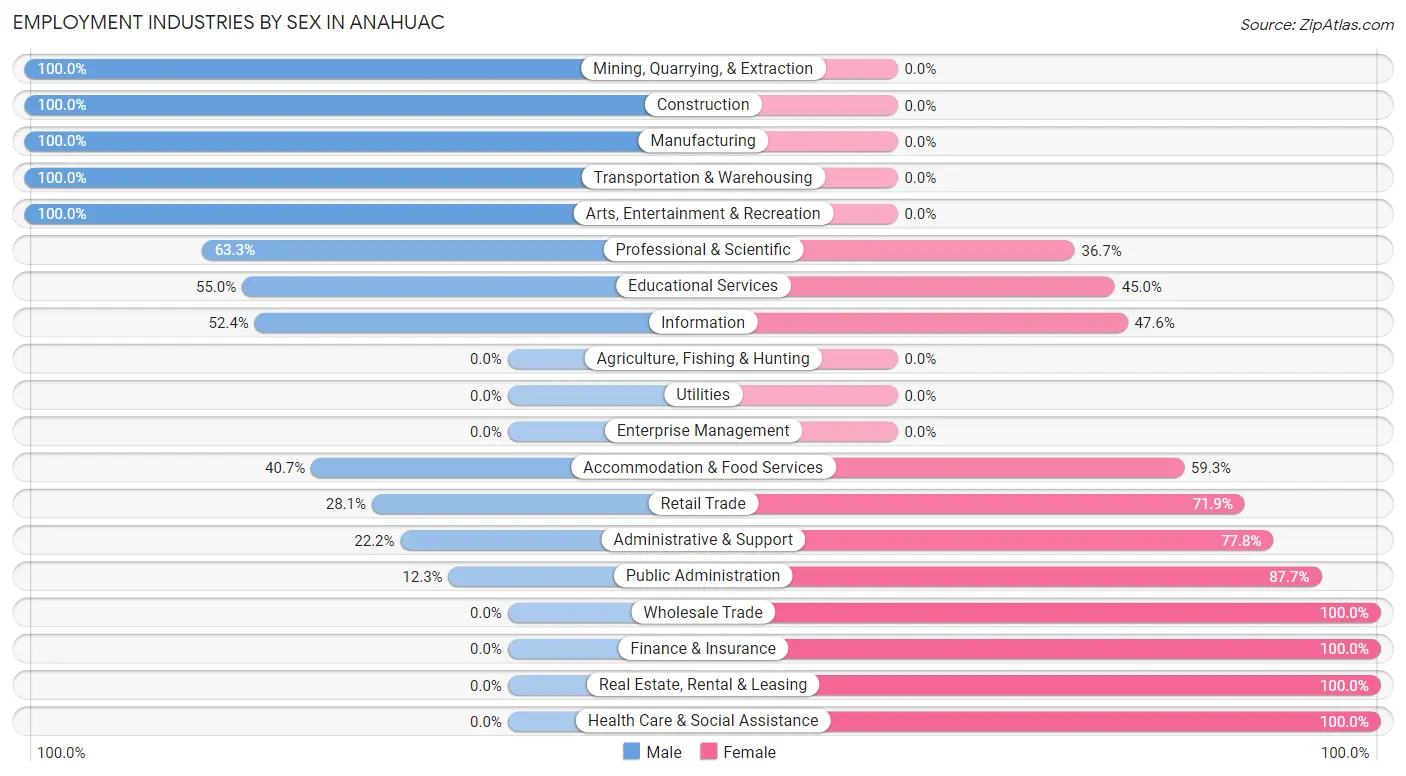
The Anahuac industries that see more men than women are Mining, Quarrying, & Extraction (100.0%), Construction (100.0%), and Manufacturing (100.0%), whereas the industries that tend to have a higher number of women are Wholesale Trade (100.0%), Finance & Insurance (100.0%), and Real Estate, Rental & Leasing (100.0%).
| Industry | Male | Female |
| Agriculture, Fishing & Hunting | 0 (0.0%) | 0 (0.0%) |
| Mining, Quarrying, & Extraction | 26 (100.0%) | 0 (0.0%) |
| Construction | 170 (100.0%) | 0 (0.0%) |
| Manufacturing | 159 (100.0%) | 0 (0.0%) |
| Wholesale Trade | 0 (0.0%) | 8 (100.0%) |
| Retail Trade | 9 (28.1%) | 23 (71.9%) |
| Transportation & Warehousing | 14 (100.0%) | 0 (0.0%) |
| Utilities | 0 (0.0%) | 0 (0.0%) |
| Information | 11 (52.4%) | 10 (47.6%) |
| Finance & Insurance | 0 (0.0%) | 13 (100.0%) |
| Real Estate, Rental & Leasing | 0 (0.0%) | 8 (100.0%) |
| Professional & Scientific | 19 (63.3%) | 11 (36.7%) |
| Enterprise Management | 0 (0.0%) | 0 (0.0%) |
| Administrative & Support | 14 (22.2%) | 49 (77.8%) |
| Educational Services | 33 (55.0%) | 27 (45.0%) |
| Health Care & Social Assistance | 0 (0.0%) | 96 (100.0%) |
| Arts, Entertainment & Recreation | 64 (100.0%) | 0 (0.0%) |
| Accommodation & Food Services | 35 (40.7%) | 51 (59.3%) |
| Public Administration | 14 (12.3%) | 100 (87.7%) |
| Total | 581 (58.4%) | 414 (41.6%) |
Education in Anahuac
School Enrollment in Anahuac
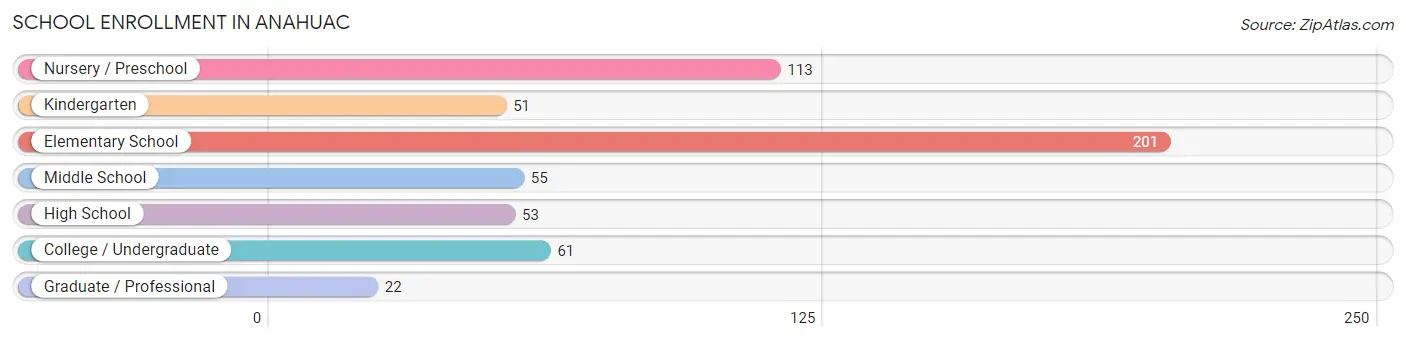
The most common levels of schooling among the 556 students in Anahuac are elementary school (201 | 36.1%), nursery / preschool (113 | 20.3%), and college / undergraduate (61 | 11.0%).
| School Level | # Students | % Students |
| Nursery / Preschool | 113 | 20.3% |
| Kindergarten | 51 | 9.2% |
| Elementary School | 201 | 36.1% |
| Middle School | 55 | 9.9% |
| High School | 53 | 9.5% |
| College / Undergraduate | 61 | 11.0% |
| Graduate / Professional | 22 | 4.0% |
| Total | 556 | 100.0% |
School Enrollment by Age by Funding Source in Anahuac
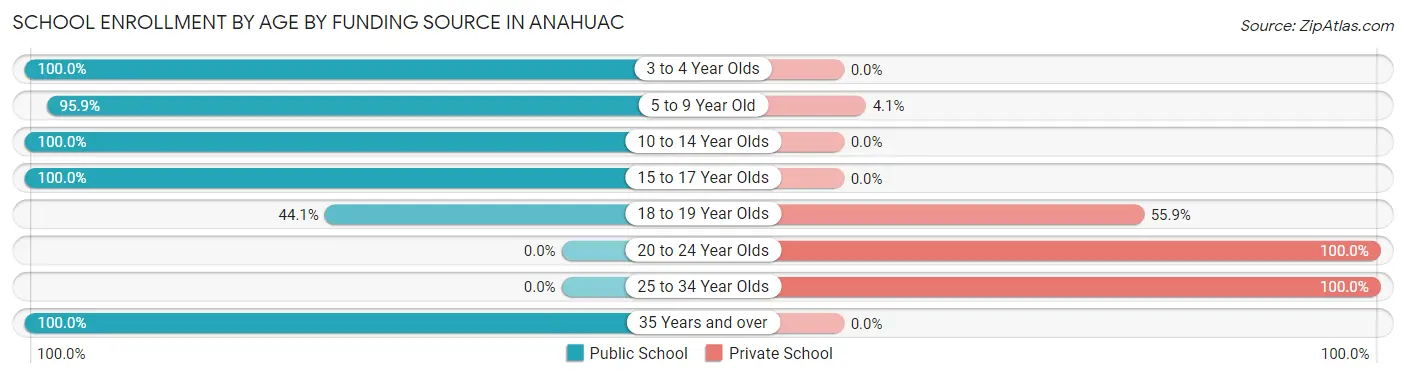
Out of a total of 556 students who are enrolled in schools in Anahuac, 55 (9.9%) attend a private institution, while the remaining 501 (90.1%) are enrolled in public schools. The age group of 20 to 24 year olds has the highest likelihood of being enrolled in private schools, with 17 (100.0% in the age bracket) enrolled. Conversely, the age group of 3 to 4 year olds has the lowest likelihood of being enrolled in a private school, with 113 (100.0% in the age bracket) attending a public institution.
| Age Bracket | Public School | Private School |
| 3 to 4 Year Olds | 113 (100.0%) | 0 (0.0%) |
| 5 to 9 Year Old | 210 (95.9%) | 9 (4.1%) |
| 10 to 14 Year Olds | 88 (100.0%) | 0 (0.0%) |
| 15 to 17 Year Olds | 53 (100.0%) | 0 (0.0%) |
| 18 to 19 Year Olds | 15 (44.1%) | 19 (55.9%) |
| 20 to 24 Year Olds | 0 (0.0%) | 17 (100.0%) |
| 25 to 34 Year Olds | 0 (0.0%) | 10 (100.0%) |
| 35 Years and over | 22 (100.0%) | 0 (0.0%) |
| Total | 501 (90.1%) | 55 (9.9%) |
Educational Attainment by Field of Study in Anahuac
Education (40 | 38.5%), literature & languages (22 | 21.1%), engineering (16 | 15.4%), physical & health sciences (10 | 9.6%), and social sciences (8 | 7.7%) are the most common fields of study among 104 individuals in Anahuac who have obtained a bachelor's degree or higher.
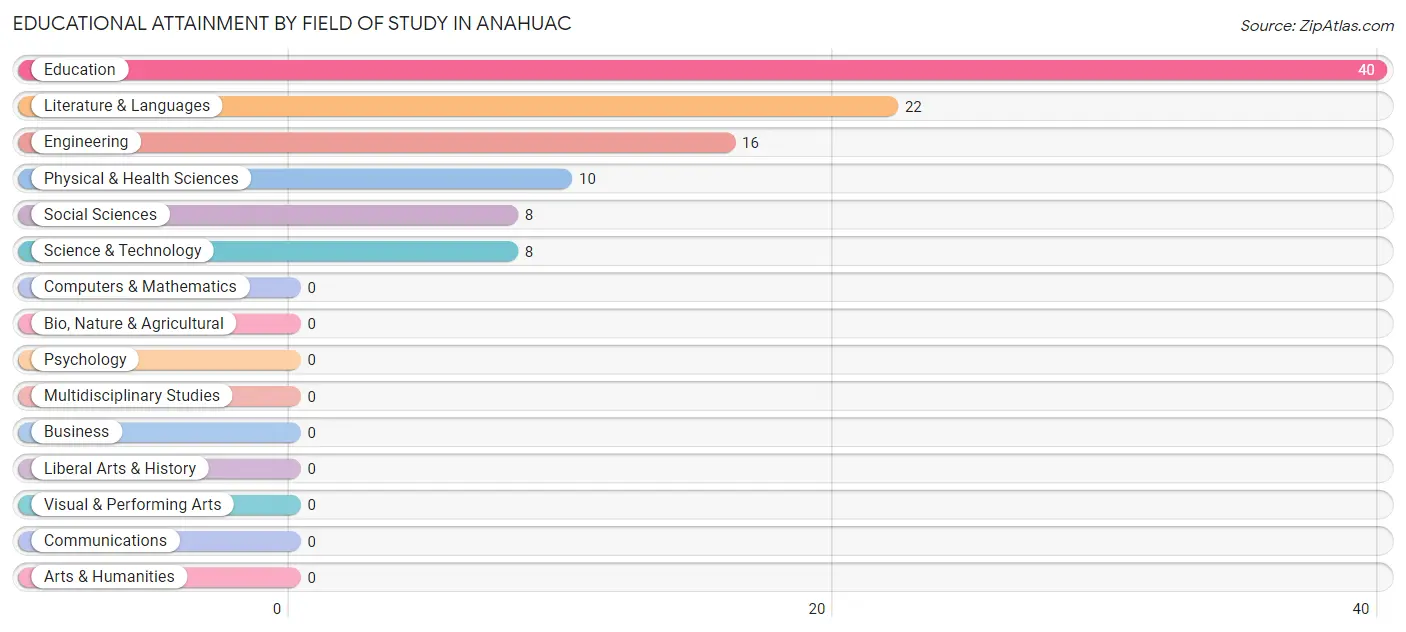
| Field of Study | # Graduates | % Graduates |
| Computers & Mathematics | 0 | 0.0% |
| Bio, Nature & Agricultural | 0 | 0.0% |
| Physical & Health Sciences | 10 | 9.6% |
| Psychology | 0 | 0.0% |
| Social Sciences | 8 | 7.7% |
| Engineering | 16 | 15.4% |
| Multidisciplinary Studies | 0 | 0.0% |
| Science & Technology | 8 | 7.7% |
| Business | 0 | 0.0% |
| Education | 40 | 38.5% |
| Literature & Languages | 22 | 21.1% |
| Liberal Arts & History | 0 | 0.0% |
| Visual & Performing Arts | 0 | 0.0% |
| Communications | 0 | 0.0% |
| Arts & Humanities | 0 | 0.0% |
| Total | 104 | 100.0% |
Transportation & Commute in Anahuac
Vehicle Availability by Sex in Anahuac
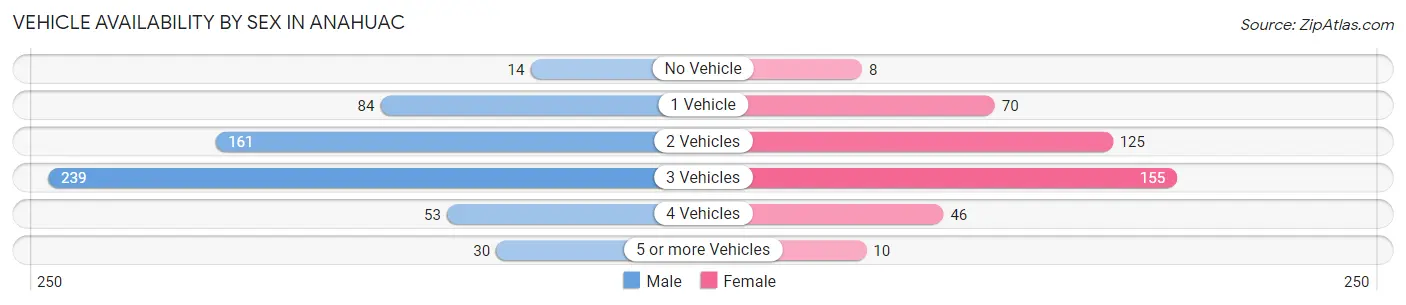
The most prevalent vehicle ownership categories in Anahuac are males with 3 vehicles (239, accounting for 41.1%) and females with 3 vehicles (155, making up 57.7%).
| Vehicles Available | Male | Female |
| No Vehicle | 14 (2.4%) | 8 (1.9%) |
| 1 Vehicle | 84 (14.5%) | 70 (16.9%) |
| 2 Vehicles | 161 (27.7%) | 125 (30.2%) |
| 3 Vehicles | 239 (41.1%) | 155 (37.4%) |
| 4 Vehicles | 53 (9.1%) | 46 (11.1%) |
| 5 or more Vehicles | 30 (5.2%) | 10 (2.4%) |
| Total | 581 (100.0%) | 414 (100.0%) |
Commute Time in Anahuac
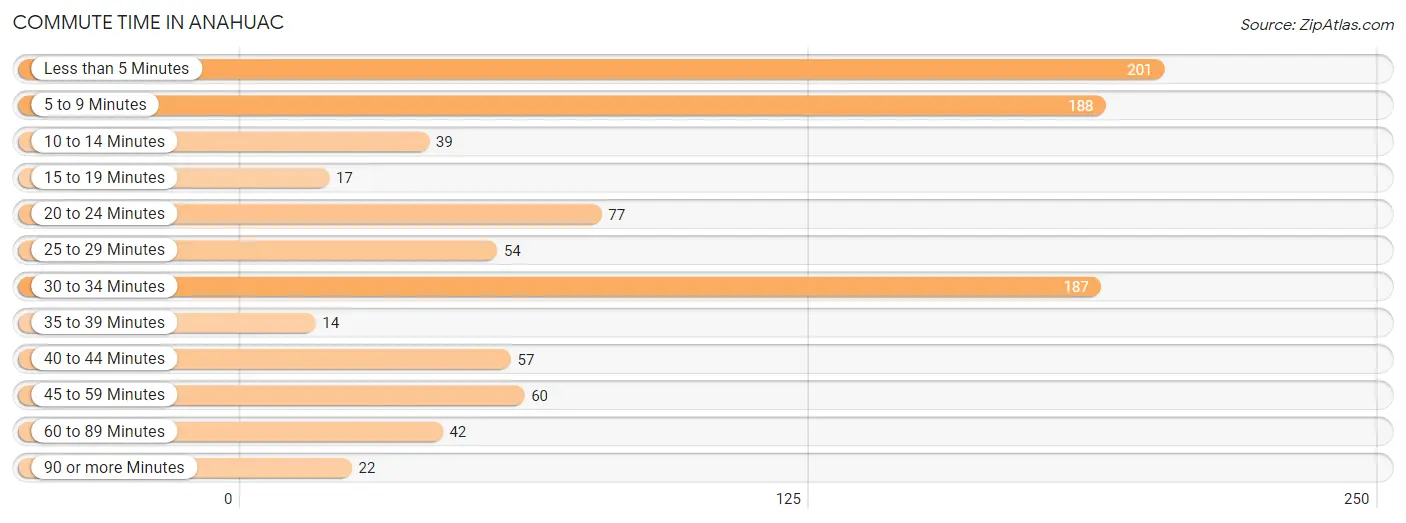
The most frequently occuring commute durations in Anahuac are less than 5 minutes (201 commuters, 21.0%), 5 to 9 minutes (188 commuters, 19.6%), and 30 to 34 minutes (187 commuters, 19.5%).
| Commute Time | # Commuters | % Commuters |
| Less than 5 Minutes | 201 | 21.0% |
| 5 to 9 Minutes | 188 | 19.6% |
| 10 to 14 Minutes | 39 | 4.1% |
| 15 to 19 Minutes | 17 | 1.8% |
| 20 to 24 Minutes | 77 | 8.0% |
| 25 to 29 Minutes | 54 | 5.6% |
| 30 to 34 Minutes | 187 | 19.5% |
| 35 to 39 Minutes | 14 | 1.5% |
| 40 to 44 Minutes | 57 | 5.9% |
| 45 to 59 Minutes | 60 | 6.3% |
| 60 to 89 Minutes | 42 | 4.4% |
| 90 or more Minutes | 22 | 2.3% |
Commute Time by Sex in Anahuac
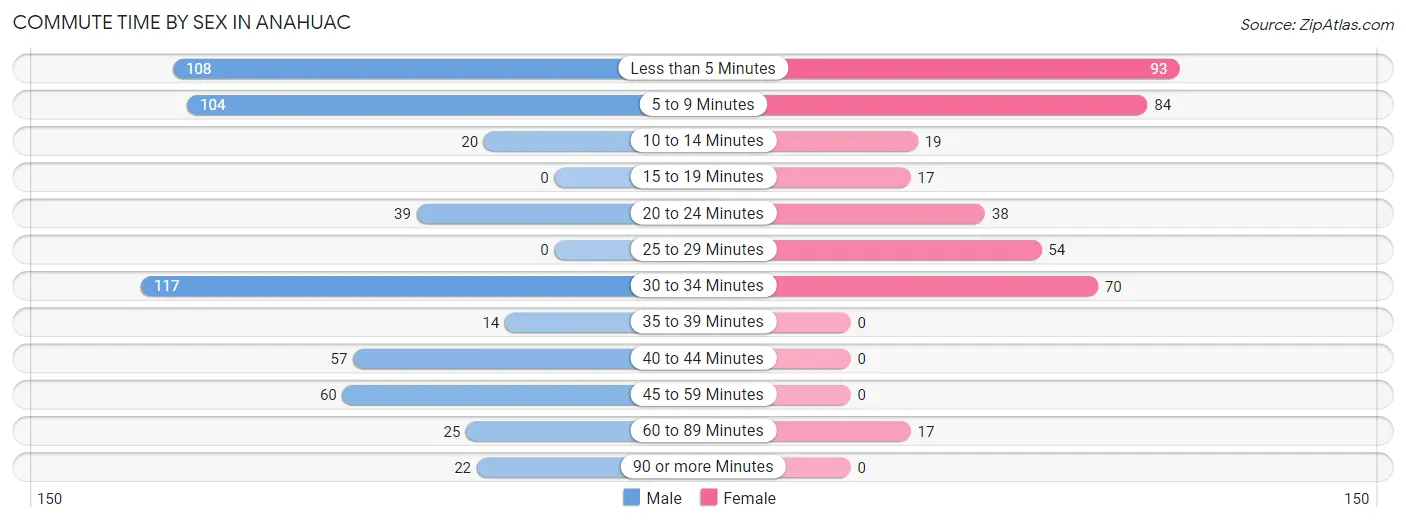
The most common commute times in Anahuac are 30 to 34 minutes (117 commuters, 20.7%) for males and less than 5 minutes (93 commuters, 23.7%) for females.
| Commute Time | Male | Female |
| Less than 5 Minutes | 108 (19.1%) | 93 (23.7%) |
| 5 to 9 Minutes | 104 (18.4%) | 84 (21.4%) |
| 10 to 14 Minutes | 20 (3.5%) | 19 (4.9%) |
| 15 to 19 Minutes | 0 (0.0%) | 17 (4.3%) |
| 20 to 24 Minutes | 39 (6.9%) | 38 (9.7%) |
| 25 to 29 Minutes | 0 (0.0%) | 54 (13.8%) |
| 30 to 34 Minutes | 117 (20.7%) | 70 (17.9%) |
| 35 to 39 Minutes | 14 (2.5%) | 0 (0.0%) |
| 40 to 44 Minutes | 57 (10.1%) | 0 (0.0%) |
| 45 to 59 Minutes | 60 (10.6%) | 0 (0.0%) |
| 60 to 89 Minutes | 25 (4.4%) | 17 (4.3%) |
| 90 or more Minutes | 22 (3.9%) | 0 (0.0%) |
Time of Departure to Work by Sex in Anahuac
The most frequent times of departure to work in Anahuac are 6:00 AM to 6:29 AM (168, 29.7%) for males and 7:30 AM to 7:59 AM (108, 27.6%) for females.
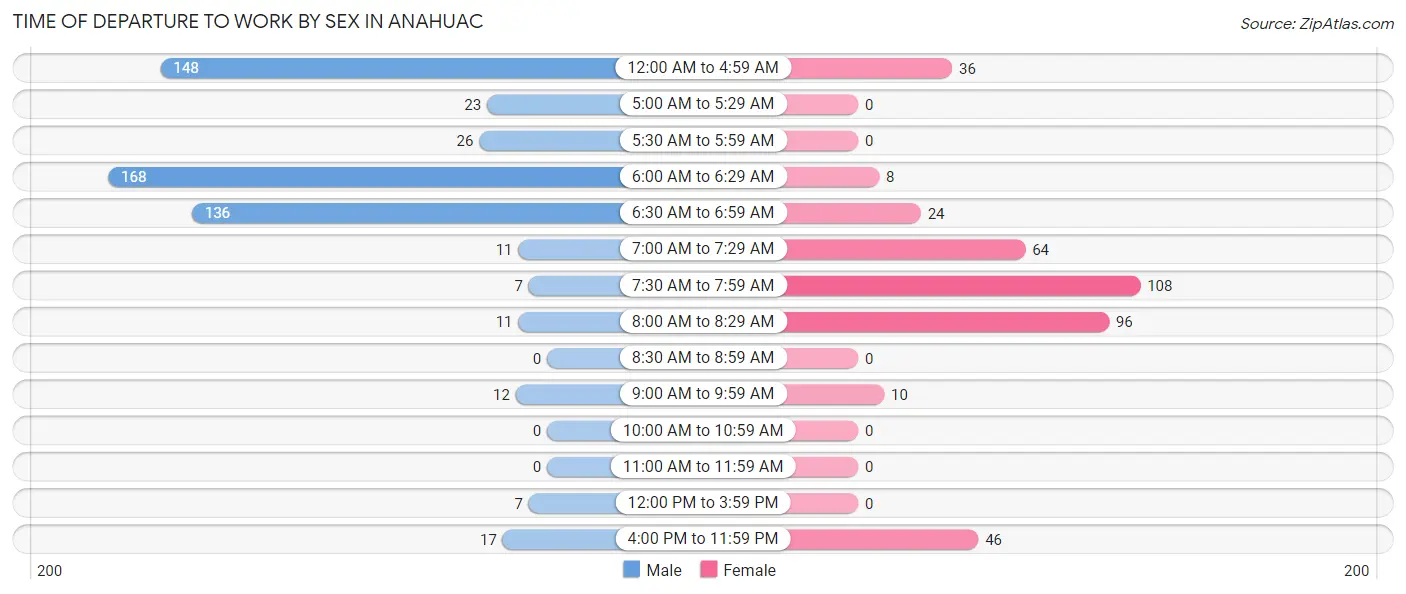
| Time of Departure | Male | Female |
| 12:00 AM to 4:59 AM | 148 (26.2%) | 36 (9.2%) |
| 5:00 AM to 5:29 AM | 23 (4.1%) | 0 (0.0%) |
| 5:30 AM to 5:59 AM | 26 (4.6%) | 0 (0.0%) |
| 6:00 AM to 6:29 AM | 168 (29.7%) | 8 (2.0%) |
| 6:30 AM to 6:59 AM | 136 (24.0%) | 24 (6.1%) |
| 7:00 AM to 7:29 AM | 11 (1.9%) | 64 (16.3%) |
| 7:30 AM to 7:59 AM | 7 (1.2%) | 108 (27.6%) |
| 8:00 AM to 8:29 AM | 11 (1.9%) | 96 (24.5%) |
| 8:30 AM to 8:59 AM | 0 (0.0%) | 0 (0.0%) |
| 9:00 AM to 9:59 AM | 12 (2.1%) | 10 (2.5%) |
| 10:00 AM to 10:59 AM | 0 (0.0%) | 0 (0.0%) |
| 11:00 AM to 11:59 AM | 0 (0.0%) | 0 (0.0%) |
| 12:00 PM to 3:59 PM | 7 (1.2%) | 0 (0.0%) |
| 4:00 PM to 11:59 PM | 17 (3.0%) | 46 (11.7%) |
| Total | 566 (100.0%) | 392 (100.0%) |
Housing Occupancy in Anahuac
Occupancy by Ownership in Anahuac
Of the total 781 dwellings in Anahuac, owner-occupied units account for 565 (72.3%), while renter-occupied units make up 216 (27.7%).
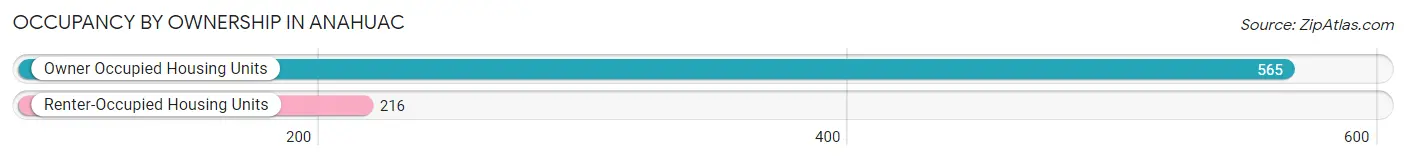
| Occupancy | # Housing Units | % Housing Units |
| Owner Occupied Housing Units | 565 | 72.3% |
| Renter-Occupied Housing Units | 216 | 27.7% |
| Total Occupied Housing Units | 781 | 100.0% |
Occupancy by Household Size in Anahuac
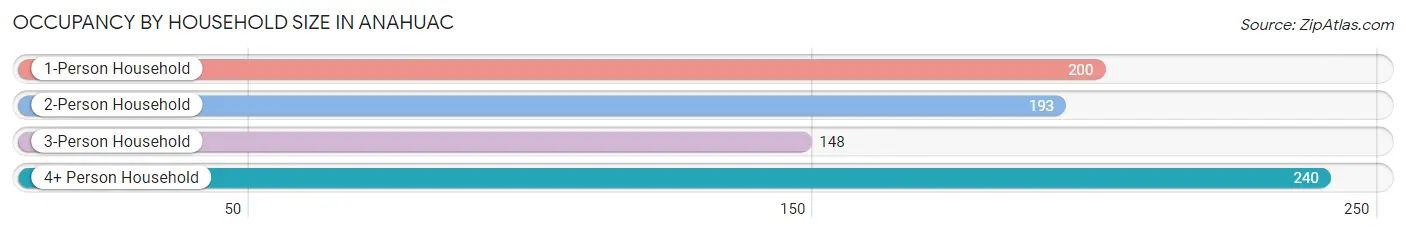
| Household Size | # Housing Units | % Housing Units |
| 1-Person Household | 200 | 25.6% |
| 2-Person Household | 193 | 24.7% |
| 3-Person Household | 148 | 19.0% |
| 4+ Person Household | 240 | 30.7% |
| Total Housing Units | 781 | 100.0% |
Occupancy by Ownership by Household Size in Anahuac
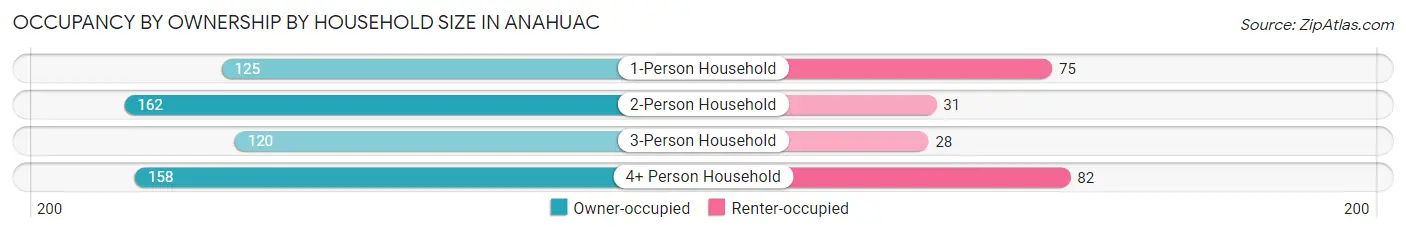
| Household Size | Owner-occupied | Renter-occupied |
| 1-Person Household | 125 (62.5%) | 75 (37.5%) |
| 2-Person Household | 162 (83.9%) | 31 (16.1%) |
| 3-Person Household | 120 (81.1%) | 28 (18.9%) |
| 4+ Person Household | 158 (65.8%) | 82 (34.2%) |
| Total Housing Units | 565 (72.3%) | 216 (27.7%) |
Occupancy by Educational Attainment in Anahuac
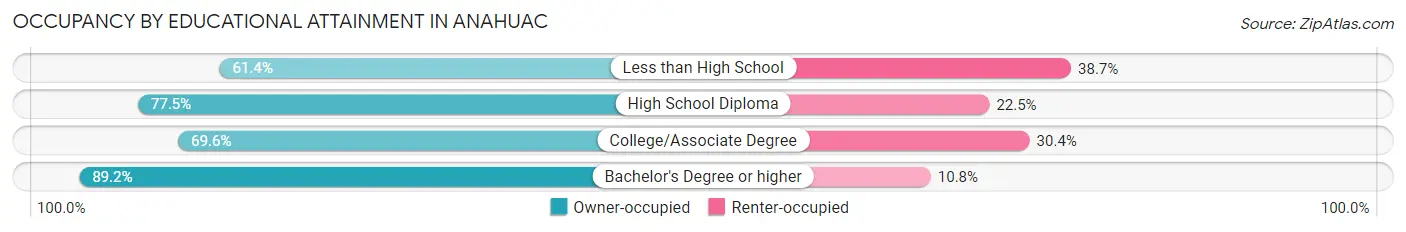
| Household Size | Owner-occupied | Renter-occupied |
| Less than High School | 100 (61.4%) | 63 (38.7%) |
| High School Diploma | 183 (77.5%) | 53 (22.5%) |
| College/Associate Degree | 208 (69.6%) | 91 (30.4%) |
| Bachelor's Degree or higher | 74 (89.2%) | 9 (10.8%) |
Occupancy by Age of Householder in Anahuac
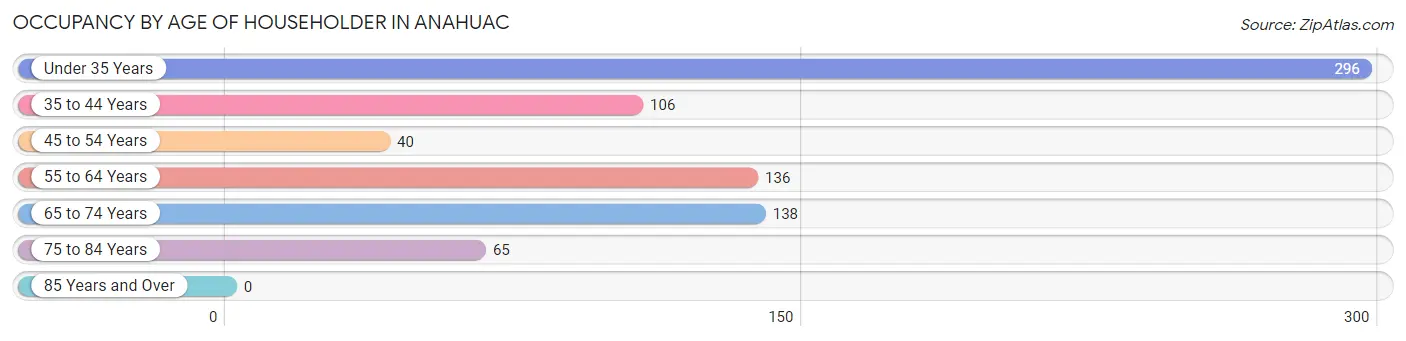
| Age Bracket | # Households | % Households |
| Under 35 Years | 296 | 37.9% |
| 35 to 44 Years | 106 | 13.6% |
| 45 to 54 Years | 40 | 5.1% |
| 55 to 64 Years | 136 | 17.4% |
| 65 to 74 Years | 138 | 17.7% |
| 75 to 84 Years | 65 | 8.3% |
| 85 Years and Over | 0 | 0.0% |
| Total | 781 | 100.0% |
Housing Finances in Anahuac
Median Income by Occupancy in Anahuac
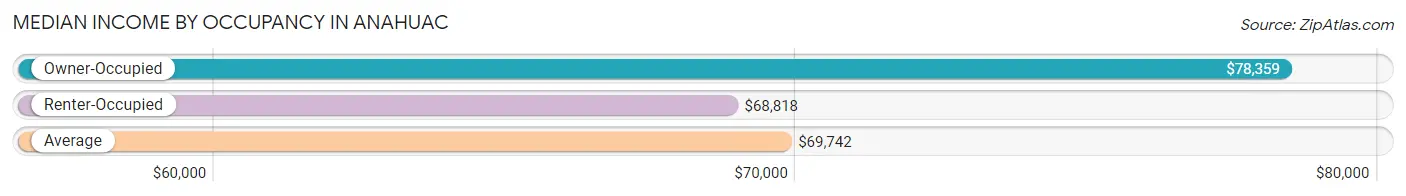
| Occupancy Type | # Households | Median Income |
| Owner-Occupied | 565 (72.3%) | $78,359 |
| Renter-Occupied | 216 (27.7%) | $68,818 |
| Average | 781 (100.0%) | $69,742 |
Occupancy by Householder Income Bracket in Anahuac
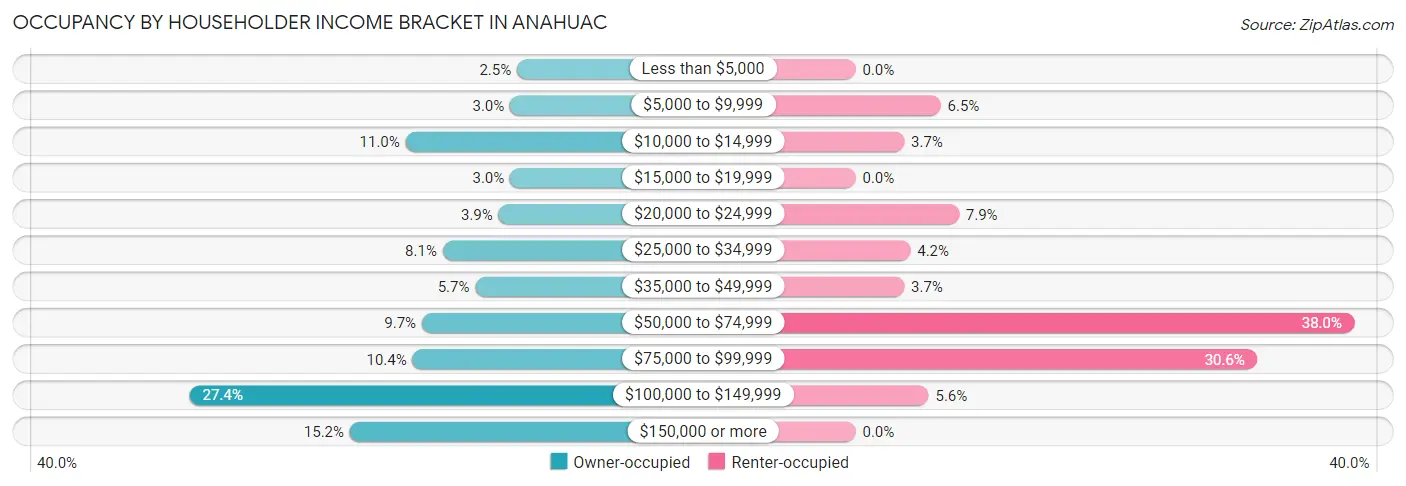
| Income Bracket | Owner-occupied | Renter-occupied |
| Less than $5,000 | 14 (2.5%) | 0 (0.0%) |
| $5,000 to $9,999 | 17 (3.0%) | 14 (6.5%) |
| $10,000 to $14,999 | 62 (11.0%) | 8 (3.7%) |
| $15,000 to $19,999 | 17 (3.0%) | 0 (0.0%) |
| $20,000 to $24,999 | 22 (3.9%) | 17 (7.9%) |
| $25,000 to $34,999 | 46 (8.1%) | 9 (4.2%) |
| $35,000 to $49,999 | 32 (5.7%) | 8 (3.7%) |
| $50,000 to $74,999 | 55 (9.7%) | 82 (38.0%) |
| $75,000 to $99,999 | 59 (10.4%) | 66 (30.6%) |
| $100,000 to $149,999 | 155 (27.4%) | 12 (5.6%) |
| $150,000 or more | 86 (15.2%) | 0 (0.0%) |
| Total | 565 (100.0%) | 216 (100.0%) |
Monthly Housing Cost Tiers in Anahuac
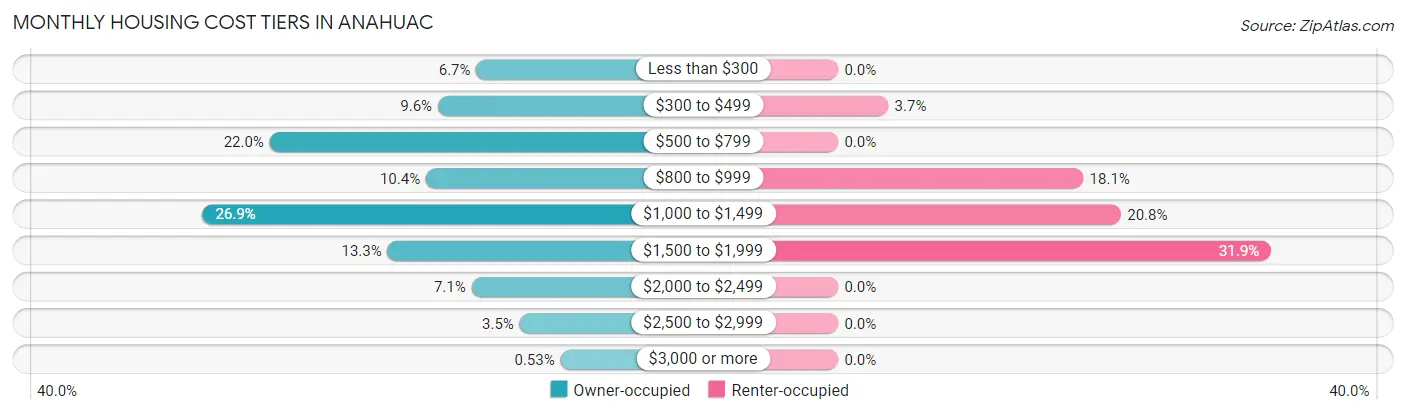
| Monthly Cost | Owner-occupied | Renter-occupied |
| Less than $300 | 38 (6.7%) | 0 (0.0%) |
| $300 to $499 | 54 (9.6%) | 8 (3.7%) |
| $500 to $799 | 124 (22.0%) | 0 (0.0%) |
| $800 to $999 | 59 (10.4%) | 39 (18.1%) |
| $1,000 to $1,499 | 152 (26.9%) | 45 (20.8%) |
| $1,500 to $1,999 | 75 (13.3%) | 69 (31.9%) |
| $2,000 to $2,499 | 40 (7.1%) | 0 (0.0%) |
| $2,500 to $2,999 | 20 (3.5%) | 0 (0.0%) |
| $3,000 or more | 3 (0.5%) | 0 (0.0%) |
| Total | 565 (100.0%) | 216 (100.0%) |
Physical Housing Characteristics in Anahuac
Housing Structures in Anahuac
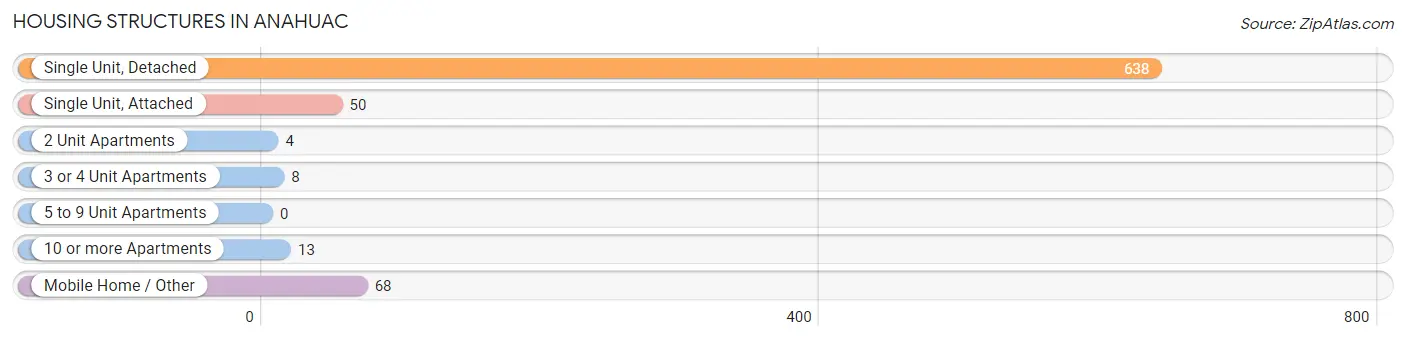
| Structure Type | # Housing Units | % Housing Units |
| Single Unit, Detached | 638 | 81.7% |
| Single Unit, Attached | 50 | 6.4% |
| 2 Unit Apartments | 4 | 0.5% |
| 3 or 4 Unit Apartments | 8 | 1.0% |
| 5 to 9 Unit Apartments | 0 | 0.0% |
| 10 or more Apartments | 13 | 1.7% |
| Mobile Home / Other | 68 | 8.7% |
| Total | 781 | 100.0% |
Housing Structures by Occupancy in Anahuac
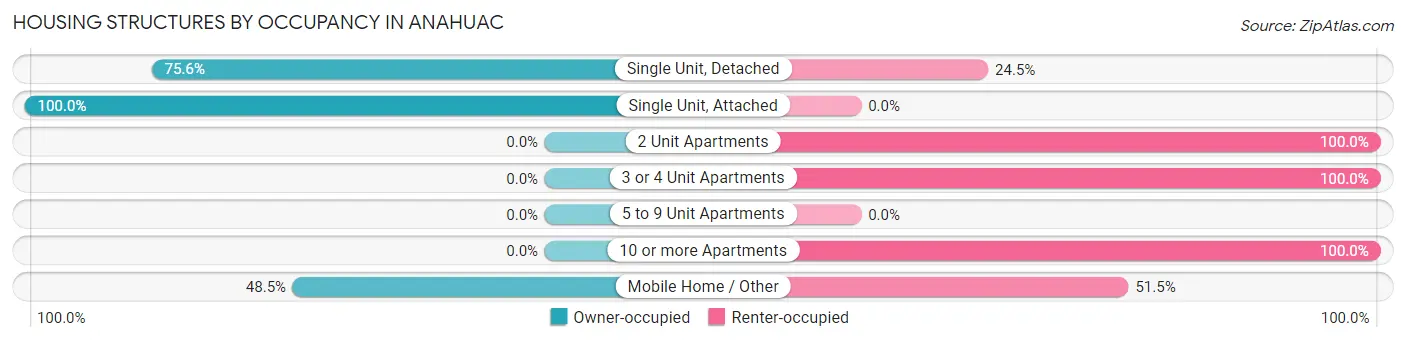
| Structure Type | Owner-occupied | Renter-occupied |
| Single Unit, Detached | 482 (75.5%) | 156 (24.4%) |
| Single Unit, Attached | 50 (100.0%) | 0 (0.0%) |
| 2 Unit Apartments | 0 (0.0%) | 4 (100.0%) |
| 3 or 4 Unit Apartments | 0 (0.0%) | 8 (100.0%) |
| 5 to 9 Unit Apartments | 0 (0.0%) | 0 (0.0%) |
| 10 or more Apartments | 0 (0.0%) | 13 (100.0%) |
| Mobile Home / Other | 33 (48.5%) | 35 (51.5%) |
| Total | 565 (72.3%) | 216 (27.7%) |
Housing Structures by Number of Rooms in Anahuac
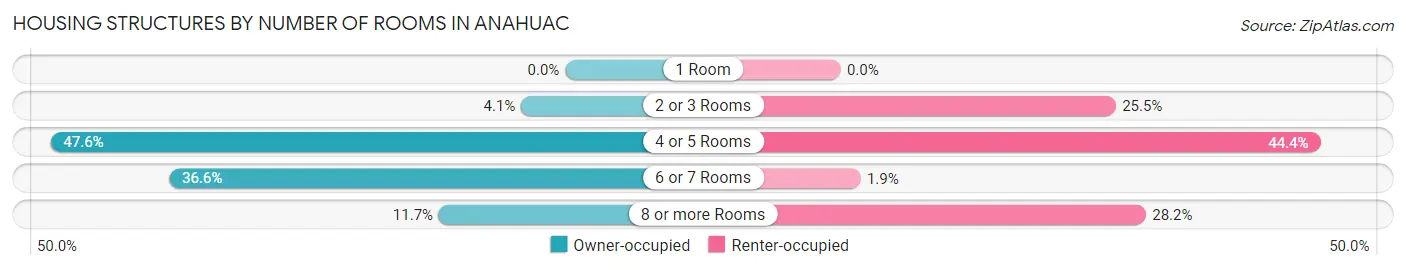
| Number of Rooms | Owner-occupied | Renter-occupied |
| 1 Room | 0 (0.0%) | 0 (0.0%) |
| 2 or 3 Rooms | 23 (4.1%) | 55 (25.5%) |
| 4 or 5 Rooms | 269 (47.6%) | 96 (44.4%) |
| 6 or 7 Rooms | 207 (36.6%) | 4 (1.8%) |
| 8 or more Rooms | 66 (11.7%) | 61 (28.2%) |
| Total | 565 (100.0%) | 216 (100.0%) |
Housing Structure by Heating Type in Anahuac
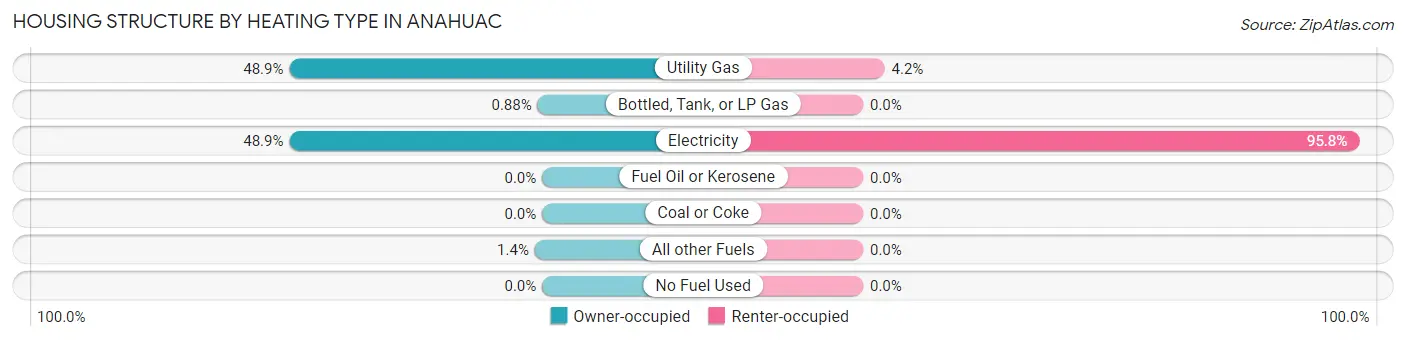
| Heating Type | Owner-occupied | Renter-occupied |
| Utility Gas | 276 (48.8%) | 9 (4.2%) |
| Bottled, Tank, or LP Gas | 5 (0.9%) | 0 (0.0%) |
| Electricity | 276 (48.8%) | 207 (95.8%) |
| Fuel Oil or Kerosene | 0 (0.0%) | 0 (0.0%) |
| Coal or Coke | 0 (0.0%) | 0 (0.0%) |
| All other Fuels | 8 (1.4%) | 0 (0.0%) |
| No Fuel Used | 0 (0.0%) | 0 (0.0%) |
| Total | 565 (100.0%) | 216 (100.0%) |
Household Vehicle Usage in Anahuac
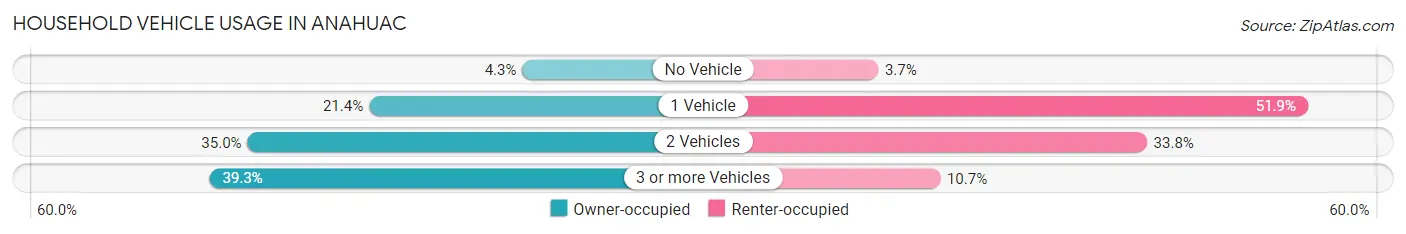
| Vehicles per Household | Owner-occupied | Renter-occupied |
| No Vehicle | 24 (4.3%) | 8 (3.7%) |
| 1 Vehicle | 121 (21.4%) | 112 (51.8%) |
| 2 Vehicles | 198 (35.0%) | 73 (33.8%) |
| 3 or more Vehicles | 222 (39.3%) | 23 (10.6%) |
| Total | 565 (100.0%) | 216 (100.0%) |
Real Estate & Mortgages in Anahuac
Real Estate and Mortgage Overview in Anahuac
| Characteristic | Without Mortgage | With Mortgage |
| Housing Units | 275 | 290 |
| Median Property Value | $138,300 | $187,500 |
| Median Household Income | - | - |
| Monthly Housing Costs | $548 | $3 |
| Real Estate Taxes | $1,274 | $37 |
Property Value by Mortgage Status in Anahuac
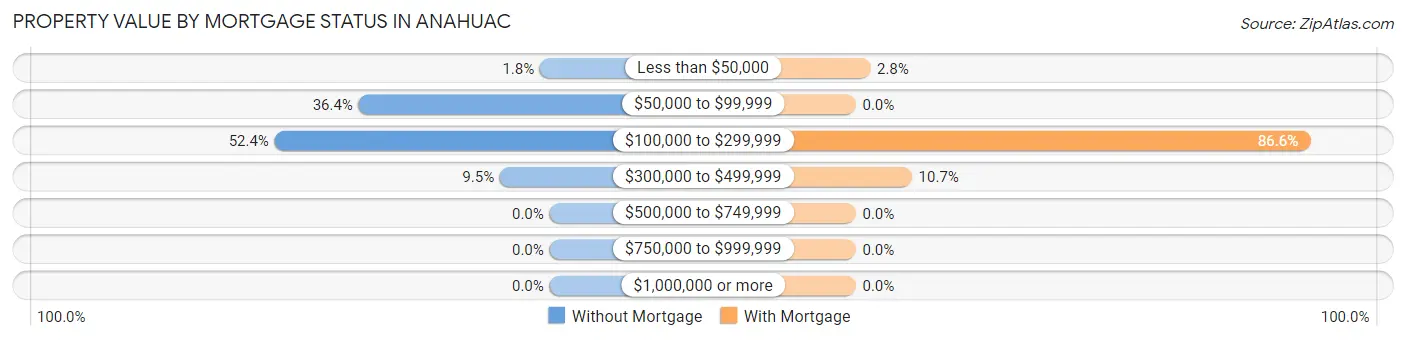
| Property Value | Without Mortgage | With Mortgage |
| Less than $50,000 | 5 (1.8%) | 8 (2.8%) |
| $50,000 to $99,999 | 100 (36.4%) | 0 (0.0%) |
| $100,000 to $299,999 | 144 (52.4%) | 251 (86.6%) |
| $300,000 to $499,999 | 26 (9.5%) | 31 (10.7%) |
| $500,000 to $749,999 | 0 (0.0%) | 0 (0.0%) |
| $750,000 to $999,999 | 0 (0.0%) | 0 (0.0%) |
| $1,000,000 or more | 0 (0.0%) | 0 (0.0%) |
| Total | 275 (100.0%) | 290 (100.0%) |
Household Income by Mortgage Status in Anahuac
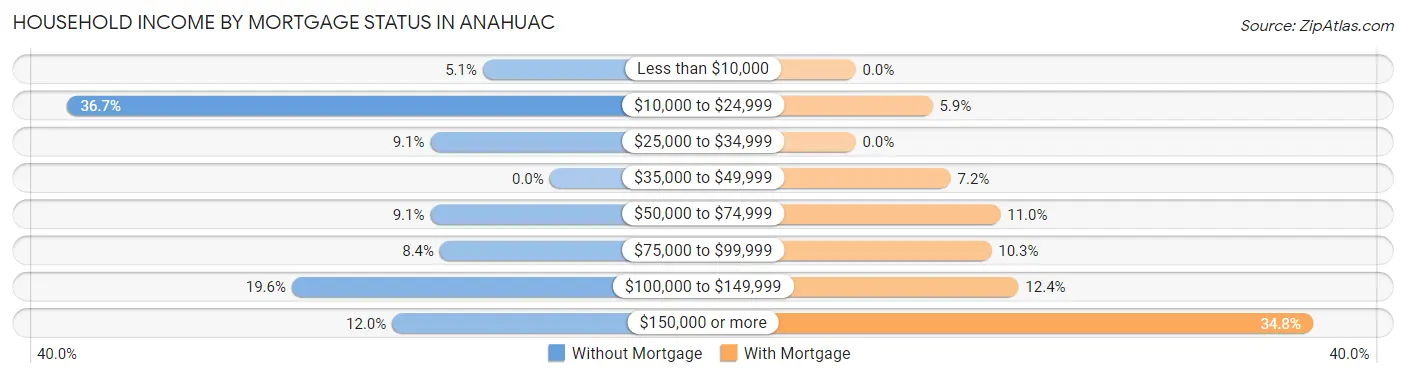
| Household Income | Without Mortgage | With Mortgage |
| Less than $10,000 | 14 (5.1%) | 0 (0.0%) |
| $10,000 to $24,999 | 101 (36.7%) | 17 (5.9%) |
| $25,000 to $34,999 | 25 (9.1%) | 0 (0.0%) |
| $35,000 to $49,999 | 0 (0.0%) | 21 (7.2%) |
| $50,000 to $74,999 | 25 (9.1%) | 32 (11.0%) |
| $75,000 to $99,999 | 23 (8.4%) | 30 (10.3%) |
| $100,000 to $149,999 | 54 (19.6%) | 36 (12.4%) |
| $150,000 or more | 33 (12.0%) | 101 (34.8%) |
| Total | 275 (100.0%) | 290 (100.0%) |
Property Value to Household Income Ratio in Anahuac
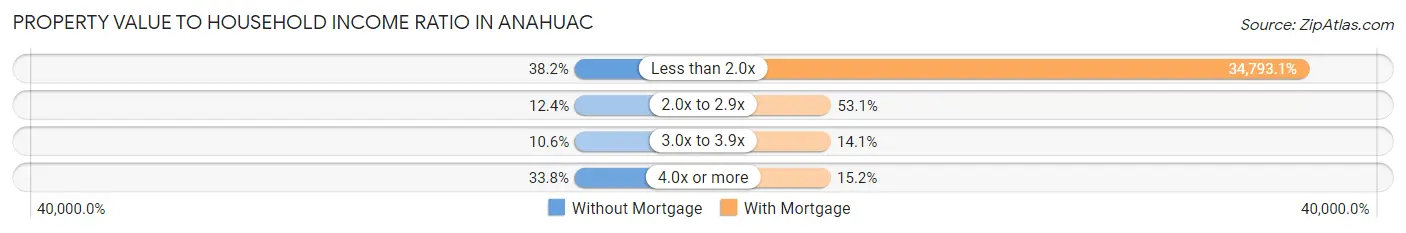
| Value-to-Income Ratio | Without Mortgage | With Mortgage |
| Less than 2.0x | 105 (38.2%) | 100,900 (34,793.1%) |
| 2.0x to 2.9x | 34 (12.4%) | 154 (53.1%) |
| 3.0x to 3.9x | 29 (10.5%) | 41 (14.1%) |
| 4.0x or more | 93 (33.8%) | 44 (15.2%) |
| Total | 275 (100.0%) | 290 (100.0%) |
Real Estate Taxes by Mortgage Status in Anahuac
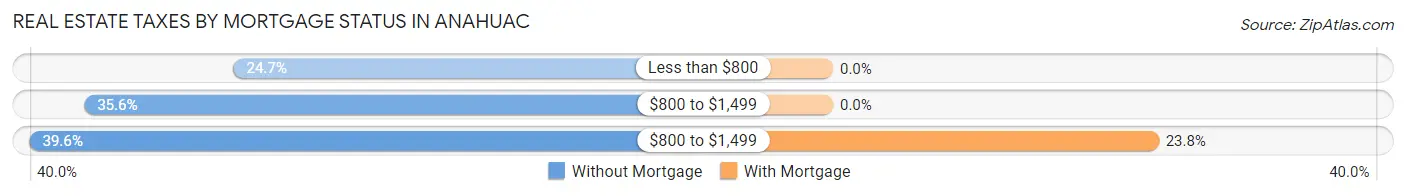
| Property Taxes | Without Mortgage | With Mortgage |
| Less than $800 | 68 (24.7%) | 0 (0.0%) |
| $800 to $1,499 | 98 (35.6%) | 0 (0.0%) |
| $800 to $1,499 | 109 (39.6%) | 69 (23.8%) |
| Total | 275 (100.0%) | 290 (100.0%) |
Health & Disability in Anahuac
Health Insurance Coverage by Age in Anahuac
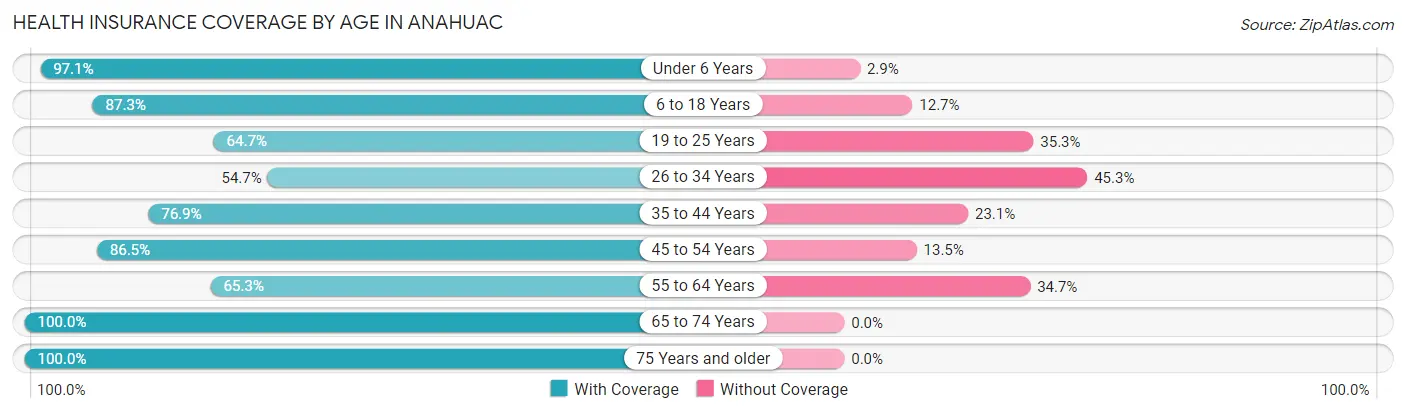
| Age Bracket | With Coverage | Without Coverage |
| Under 6 Years | 366 (97.1%) | 11 (2.9%) |
| 6 to 18 Years | 289 (87.3%) | 42 (12.7%) |
| 19 to 25 Years | 123 (64.7%) | 67 (35.3%) |
| 26 to 34 Years | 227 (54.7%) | 188 (45.3%) |
| 35 to 44 Years | 150 (76.9%) | 45 (23.1%) |
| 45 to 54 Years | 122 (86.5%) | 19 (13.5%) |
| 55 to 64 Years | 196 (65.3%) | 104 (34.7%) |
| 65 to 74 Years | 240 (100.0%) | 0 (0.0%) |
| 75 Years and older | 99 (100.0%) | 0 (0.0%) |
| Total | 1,812 (79.2%) | 476 (20.8%) |
Health Insurance Coverage by Citizenship Status in Anahuac
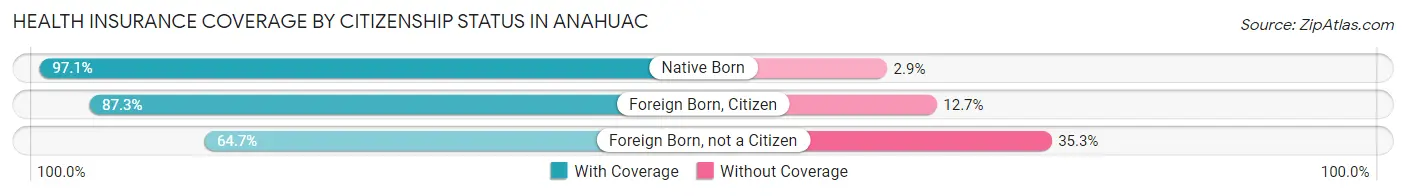
| Citizenship Status | With Coverage | Without Coverage |
| Native Born | 366 (97.1%) | 11 (2.9%) |
| Foreign Born, Citizen | 289 (87.3%) | 42 (12.7%) |
| Foreign Born, not a Citizen | 123 (64.7%) | 67 (35.3%) |
Health Insurance Coverage by Household Income in Anahuac
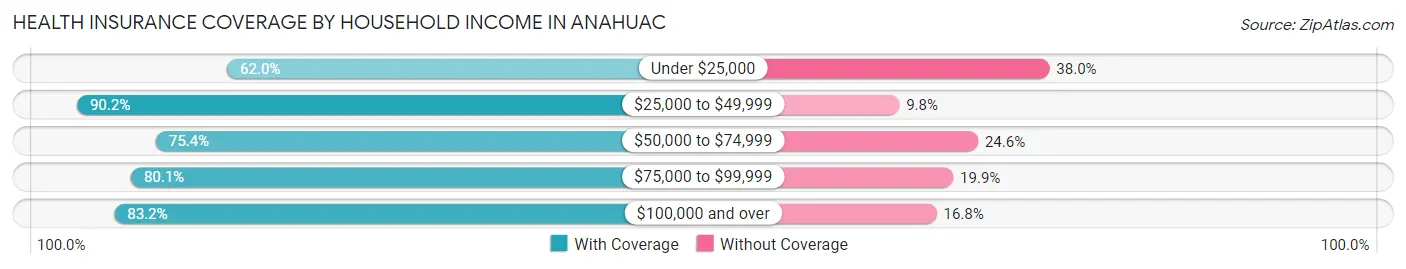
| Household Income | With Coverage | Without Coverage |
| Under $25,000 | 219 (62.0%) | 134 (38.0%) |
| $25,000 to $49,999 | 248 (90.2%) | 27 (9.8%) |
| $50,000 to $74,999 | 181 (75.4%) | 59 (24.6%) |
| $75,000 to $99,999 | 442 (80.1%) | 110 (19.9%) |
| $100,000 and over | 722 (83.2%) | 146 (16.8%) |
Public vs Private Health Insurance Coverage by Age in Anahuac
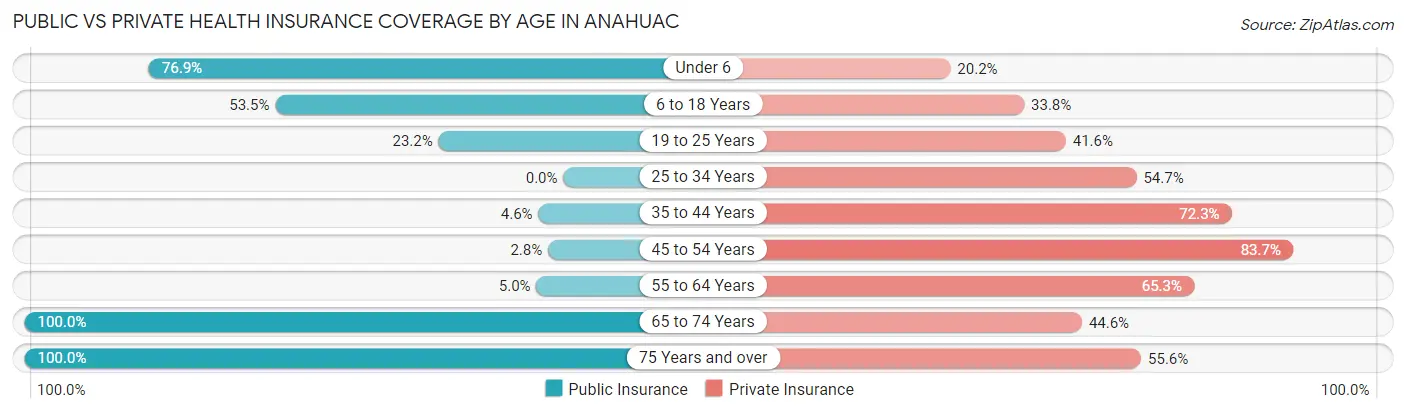
| Age Bracket | Public Insurance | Private Insurance |
| Under 6 | 290 (76.9%) | 76 (20.2%) |
| 6 to 18 Years | 177 (53.5%) | 112 (33.8%) |
| 19 to 25 Years | 44 (23.2%) | 79 (41.6%) |
| 25 to 34 Years | 0 (0.0%) | 227 (54.7%) |
| 35 to 44 Years | 9 (4.6%) | 141 (72.3%) |
| 45 to 54 Years | 4 (2.8%) | 118 (83.7%) |
| 55 to 64 Years | 15 (5.0%) | 196 (65.3%) |
| 65 to 74 Years | 240 (100.0%) | 107 (44.6%) |
| 75 Years and over | 99 (100.0%) | 55 (55.6%) |
| Total | 878 (38.4%) | 1,111 (48.6%) |
Disability Status by Sex by Age in Anahuac
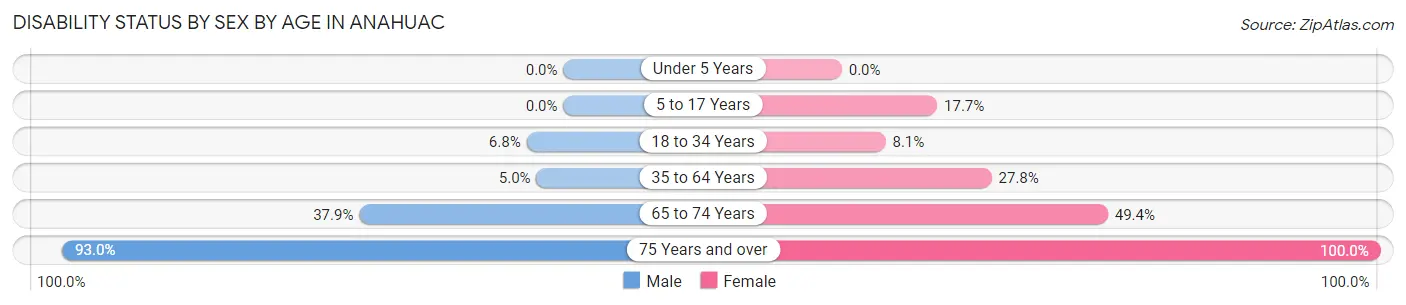
| Age Bracket | Male | Female |
| Under 5 Years | 0 (0.0%) | 0 (0.0%) |
| 5 to 17 Years | 0 (0.0%) | 26 (17.7%) |
| 18 to 34 Years | 21 (6.8%) | 26 (8.1%) |
| 35 to 64 Years | 14 (5.0%) | 99 (27.8%) |
| 65 to 74 Years | 61 (37.9%) | 39 (49.4%) |
| 75 Years and over | 40 (93.0%) | 56 (100.0%) |
Disability Class by Sex by Age in Anahuac
Disability Class: Hearing Difficulty
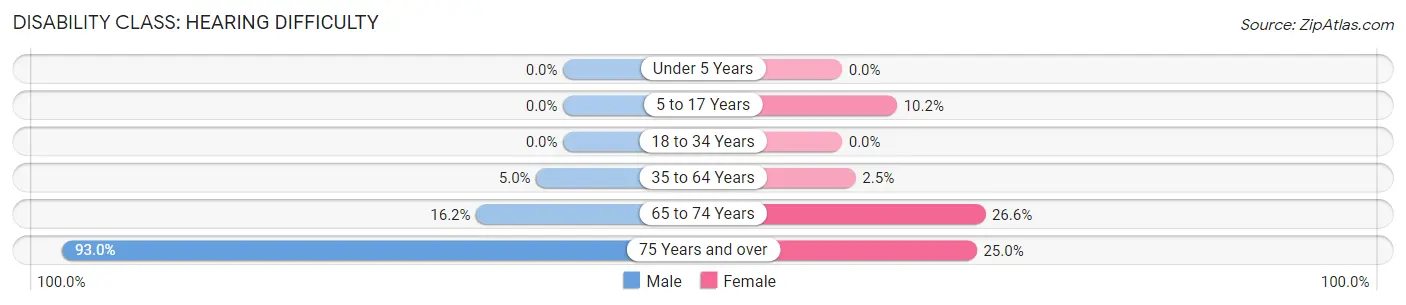
| Age Bracket | Male | Female |
| Under 5 Years | 0 (0.0%) | 0 (0.0%) |
| 5 to 17 Years | 0 (0.0%) | 15 (10.2%) |
| 18 to 34 Years | 0 (0.0%) | 0 (0.0%) |
| 35 to 64 Years | 14 (5.0%) | 9 (2.5%) |
| 65 to 74 Years | 26 (16.2%) | 21 (26.6%) |
| 75 Years and over | 40 (93.0%) | 14 (25.0%) |
Disability Class: Vision Difficulty
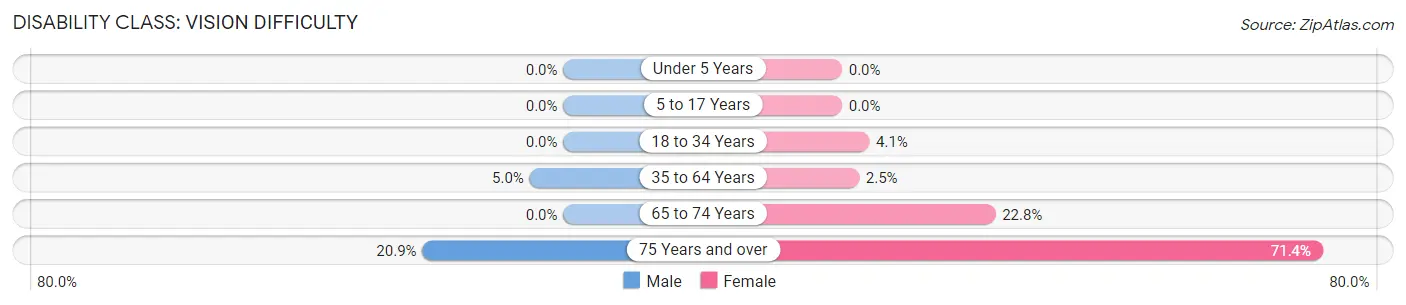
| Age Bracket | Male | Female |
| Under 5 Years | 0 (0.0%) | 0 (0.0%) |
| 5 to 17 Years | 0 (0.0%) | 0 (0.0%) |
| 18 to 34 Years | 0 (0.0%) | 13 (4.1%) |
| 35 to 64 Years | 14 (5.0%) | 9 (2.5%) |
| 65 to 74 Years | 0 (0.0%) | 18 (22.8%) |
| 75 Years and over | 9 (20.9%) | 40 (71.4%) |
Disability Class: Cognitive Difficulty
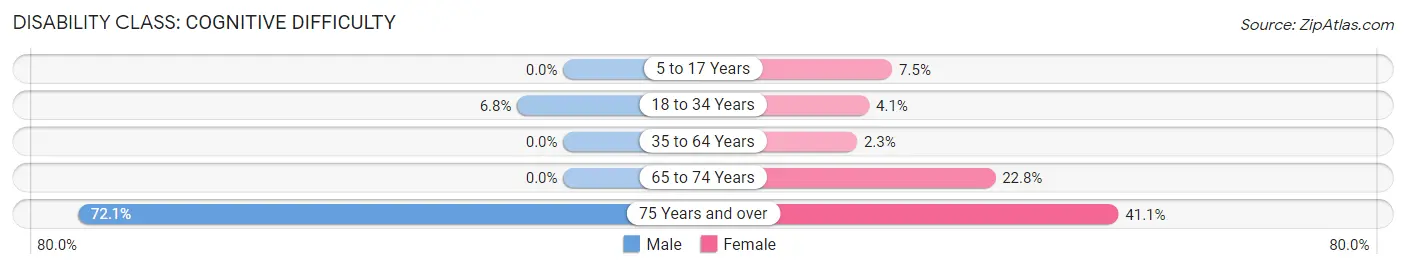
| Age Bracket | Male | Female |
| 5 to 17 Years | 0 (0.0%) | 11 (7.5%) |
| 18 to 34 Years | 21 (6.8%) | 13 (4.1%) |
| 35 to 64 Years | 0 (0.0%) | 8 (2.2%) |
| 65 to 74 Years | 0 (0.0%) | 18 (22.8%) |
| 75 Years and over | 31 (72.1%) | 23 (41.1%) |
Disability Class: Ambulatory Difficulty

| Age Bracket | Male | Female |
| 5 to 17 Years | 0 (0.0%) | 0 (0.0%) |
| 18 to 34 Years | 0 (0.0%) | 0 (0.0%) |
| 35 to 64 Years | 0 (0.0%) | 90 (25.3%) |
| 65 to 74 Years | 40 (24.8%) | 23 (29.1%) |
| 75 Years and over | 31 (72.1%) | 33 (58.9%) |
Disability Class: Self-Care Difficulty
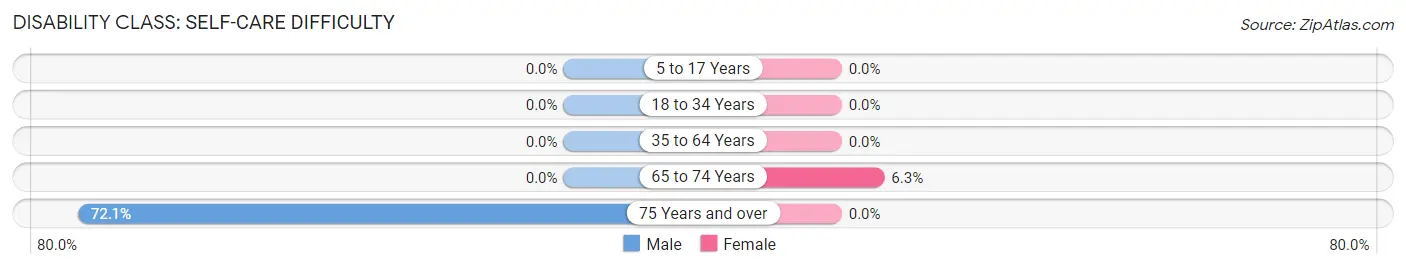
| Age Bracket | Male | Female |
| 5 to 17 Years | 0 (0.0%) | 0 (0.0%) |
| 18 to 34 Years | 0 (0.0%) | 0 (0.0%) |
| 35 to 64 Years | 0 (0.0%) | 0 (0.0%) |
| 65 to 74 Years | 0 (0.0%) | 5 (6.3%) |
| 75 Years and over | 31 (72.1%) | 0 (0.0%) |
Technology Access in Anahuac
Computing Device Access in Anahuac
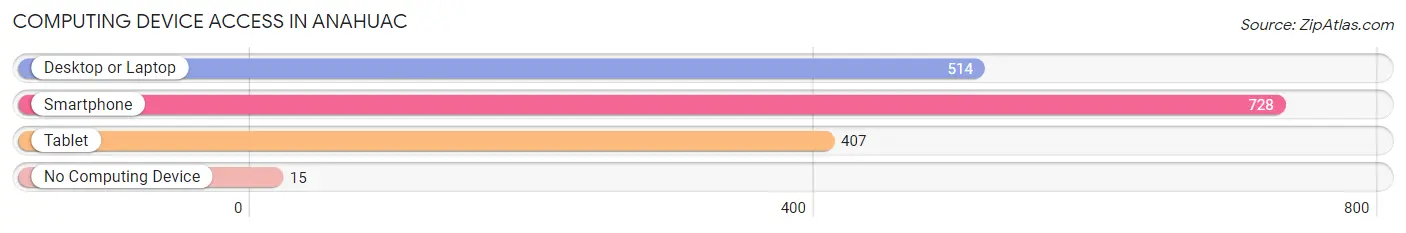
| Device Type | # Households | % Households |
| Desktop or Laptop | 514 | 65.8% |
| Smartphone | 728 | 93.2% |
| Tablet | 407 | 52.1% |
| No Computing Device | 15 | 1.9% |
| Total | 781 | 100.0% |
Internet Access in Anahuac
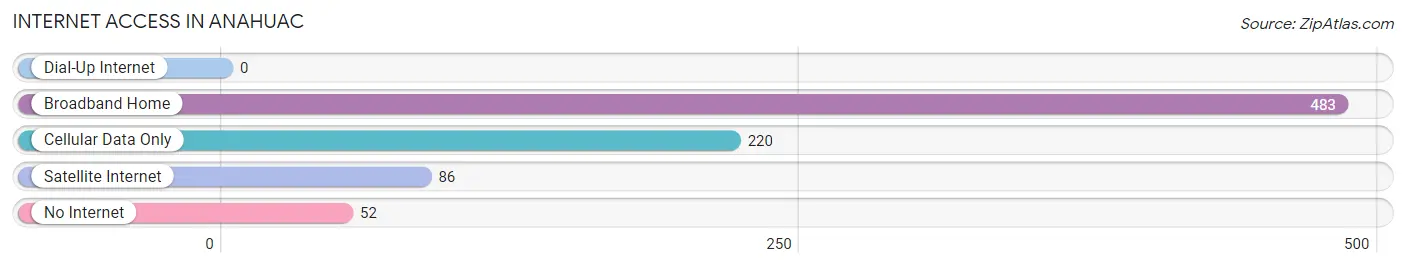
| Internet Type | # Households | % Households |
| Dial-Up Internet | 0 | 0.0% |
| Broadband Home | 483 | 61.8% |
| Cellular Data Only | 220 | 28.2% |
| Satellite Internet | 86 | 11.0% |
| No Internet | 52 | 6.7% |
| Total | 781 | 100.0% |
Anahuac Summary
Anahuac is a small town located in Chambers County, Texas, United States. It is situated on the east bank of Trinity Bay, approximately 40 miles east of Houston. The town was founded in 1832 and is the county seat of Chambers County. As of the 2010 census, the population of Anahuac was 2,243.
History
Anahuac was founded in 1832 by a group of settlers from the United States and Mexico. The town was named after the Aztec word for “place of the clouds”. The settlers were attracted to the area due to its proximity to the Trinity River and the abundance of wildlife.
In 1835, the town was the site of the Battle of Anahuac, a skirmish between the Mexican army and the Texan rebels. The battle was a victory for the Texan rebels, and it helped to spark the Texas Revolution.
In 1836, Anahuac was chosen as the county seat of Chambers County. The town was incorporated in 1837 and has remained the county seat ever since.
Geography
Anahuac is located at 29°47'N 94°41'W (29.78, -94.68). It is situated on the east bank of Trinity Bay, approximately 40 miles east of Houston. The town has a total area of 2.2 square miles, all of which is land.
The climate in Anahuac is classified as humid subtropical, with hot, humid summers and mild winters. The average annual temperature is 70°F, and the average annual precipitation is 48 inches.
Economy
The economy of Anahuac is largely based on agriculture and tourism. The town is home to several large farms, which produce a variety of crops, including cotton, corn, soybeans, and wheat. The town is also a popular destination for birdwatchers, as it is located in the heart of the Texas Gulf Coast Birding Trail.
In addition to agriculture and tourism, Anahuac is home to several small businesses, including restaurants, retail stores, and service providers. The town is also home to a number of manufacturing companies, including a plastics plant and a paper mill.
Demographics
As of the 2010 census, the population of Anahuac was 2,243. The racial makeup of the town was 79.3% White, 15.2% Hispanic or Latino, 2.2% African American, 0.7% Native American, 0.3% Asian, and 2.5% from other races.
The median household income in Anahuac was $37,917, and the median family income was $45,938. The per capita income was $19,845. About 16.2% of the population was below the poverty line.
Conclusion
Anahuac is a small town located in Chambers County, Texas, United States. It was founded in 1832 and is the county seat of Chambers County. The town has a population of 2,243 and is situated on the east bank of Trinity Bay, approximately 40 miles east of Houston. The economy of Anahuac is largely based on agriculture and tourism, and the town is home to several small businesses, manufacturing companies, and farms. The racial makeup of the town is 79.3% White, 15.2% Hispanic or Latino, 2.2% African American, 0.7% Native American, 0.3% Asian, and 2.5% from other races. The median household income in Anahuac was $37,917, and the median family income was $45,938. About 16.2% of the population was below the poverty line.
Common Questions
What is the Total Population of Anahuac?
Total Population of Anahuac is 2,420.
What is the Total Male Population of Anahuac?
Total Male Population of Anahuac is 1,260.
What is the Total Female Population of Anahuac?
Total Female Population of Anahuac is 1,160.
What is the Ratio of Males per 100 Females in Anahuac?
There are 108.62 Males per 100 Females in Anahuac.
What is the Ratio of Females per 100 Males in Anahuac?
There are 92.06 Females per 100 Males in Anahuac.
What is the Median Population Age in Anahuac?
Median Population Age in Anahuac is 31.4 Years.
What is the Average Family Size in Anahuac
Average Family Size in Anahuac is 3.4 People.
What is the Average Household Size in Anahuac
Average Household Size in Anahuac is 2.9 People.
What is Per Capita Income in Anahuac?
Per Capita income in Anahuac is $26,767.
What is the Median Family Income in Anahuac?
Median Family Income in Anahuac is $78,853.
What is the Median Household income in Anahuac?
Median Household Income in Anahuac is $69,742.
What is Income or Wage Gap in Anahuac?
Income or Wage Gap in Anahuac is 61.3%.
Women in Anahuac earn 38.7 cents for every dollar earned by a man.
What is Inequality or Gini Index in Anahuac?
Inequality or Gini Index in Anahuac is 0.39.
How Large is the Labor Force in Anahuac?
There are 1,073 People in the Labor Forcein in Anahuac.
What is the Percentage of People in the Labor Force in Anahuac?
60.3% of People are in the Labor Force in Anahuac.
What is the Unemployment Rate in Anahuac?
Unemployment Rate in Anahuac is 7.3%.