Lake City, SC
Lake City Map
Lake City Overview
6,080
TOTAL POPULATION
2,734
MALE POPULATION
3,346
FEMALE POPULATION
81.71
MALES / 100 FEMALES
122.38
FEMALES / 100 MALES
41.2
MEDIAN AGE
3.7
AVG FAMILY SIZE
2.5
AVG HOUSEHOLD SIZE
$22,245
PER CAPITA INCOME
$49,808
AVG FAMILY INCOME
$37,013
AVG HOUSEHOLD INCOME
7.4%
WAGE / INCOME GAP [ % ]
92.6¢/ $1
WAGE / INCOME GAP [ $ ]
0.47
INEQUALITY / GINI INDEX
2,942
LABOR FORCE [ PEOPLE ]
57.1%
PERCENT IN LABOR FORCE
8.6%
UNEMPLOYMENT RATE
Lake City Zip Codes
Lake City Area Codes
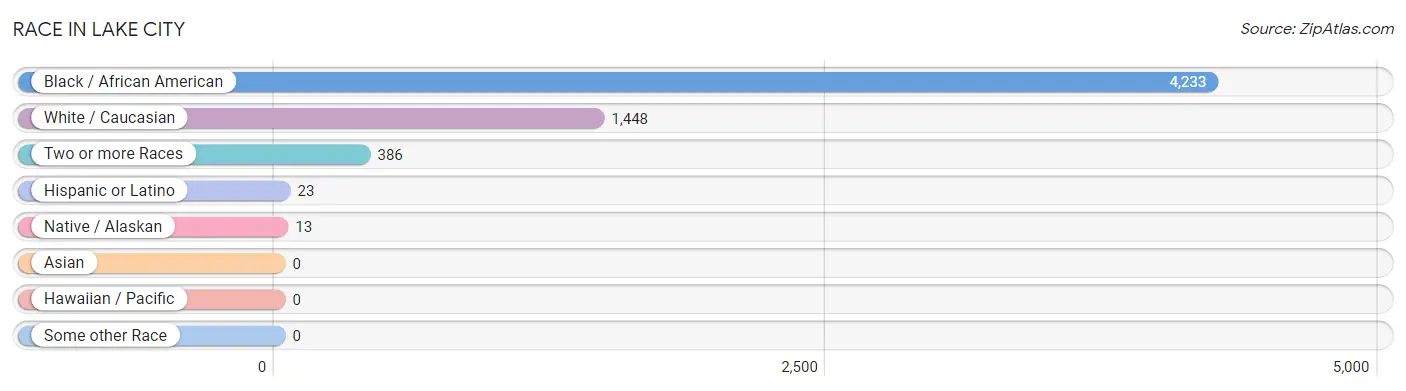
Race in Lake City
The most populous races in Lake City are Black / African American (4,233 | 69.6%), White / Caucasian (1,448 | 23.8%), and Two or more Races (386 | 6.4%).
| Race | # Population | % Population |
| Asian | 0 | 0.0% |
| Black / African American | 4,233 | 69.6% |
| Hawaiian / Pacific | 0 | 0.0% |
| Hispanic or Latino | 23 | 0.4% |
| Native / Alaskan | 13 | 0.2% |
| White / Caucasian | 1,448 | 23.8% |
| Two or more Races | 386 | 6.4% |
| Some other Race | 0 | 0.0% |
| Total | 6,080 | 100.0% |
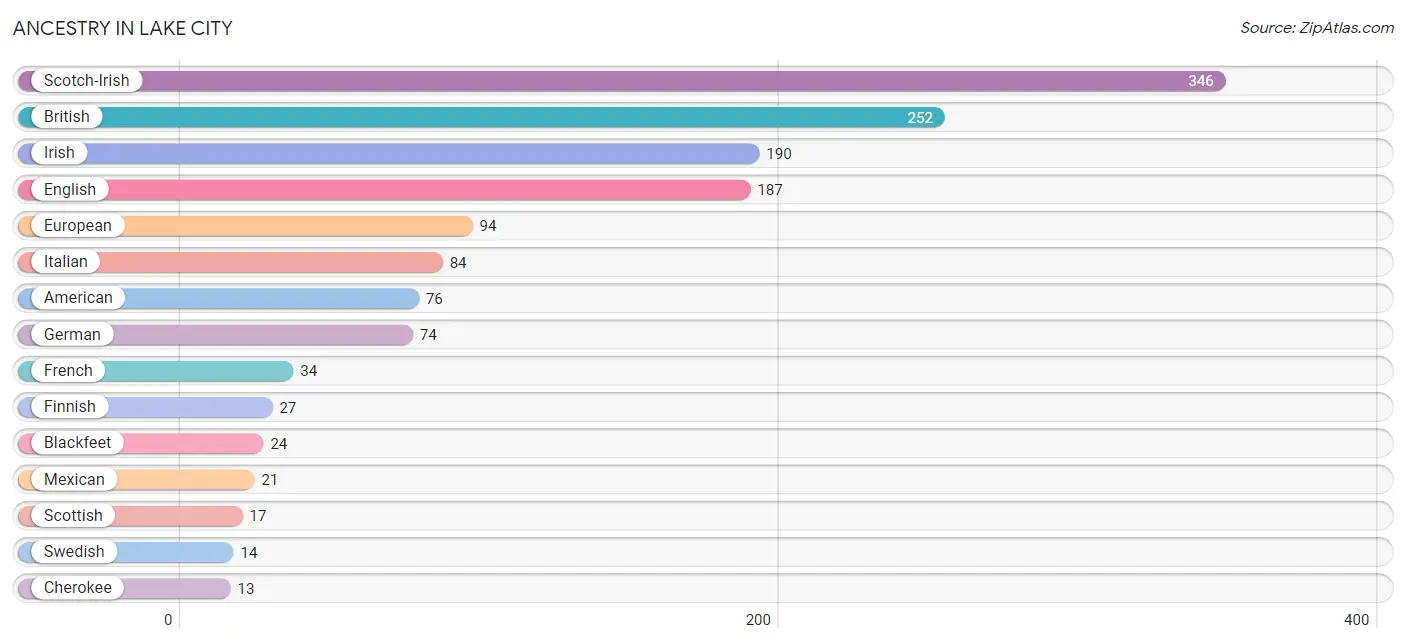
Ancestry in Lake City
The most populous ancestries reported in Lake City are Scotch-Irish (346 | 5.7%), British (252 | 4.1%), Irish (190 | 3.1%), English (187 | 3.1%), and European (94 | 1.5%), together accounting for 17.6% of all Lake City residents.
| Ancestry | # Population | % Population |
| African | 2 | 0.0% |
| American | 76 | 1.3% |
| Blackfeet | 24 | 0.4% |
| British | 252 | 4.1% |
| Cherokee | 13 | 0.2% |
| Crow | 13 | 0.2% |
| English | 187 | 3.1% |
| European | 94 | 1.5% |
| Finnish | 27 | 0.4% |
| French | 34 | 0.6% |
| German | 74 | 1.2% |
| Irish | 190 | 3.1% |
| Italian | 84 | 1.4% |
| Mexican | 21 | 0.4% |
| Polish | 8 | 0.1% |
| Puerto Rican | 2 | 0.0% |
| Russian | 8 | 0.1% |
| Scotch-Irish | 346 | 5.7% |
| Scottish | 17 | 0.3% |
| Subsaharan African | 2 | 0.0% |
| Swedish | 14 | 0.2% | View All 21 Rows |
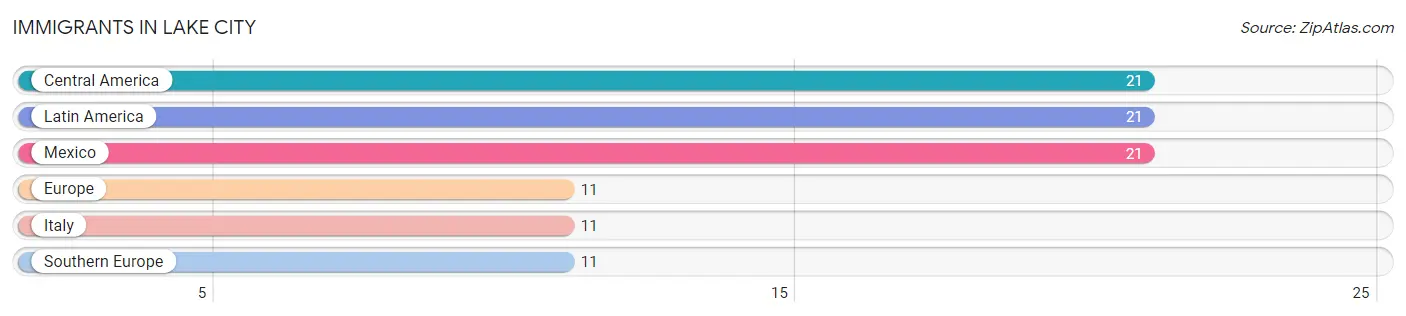
Immigrants in Lake City
The most numerous immigrant groups reported in Lake City came from Central America (21 | 0.4%), Latin America (21 | 0.4%), Mexico (21 | 0.4%), Europe (11 | 0.2%), and Italy (11 | 0.2%), together accounting for 1.4% of all Lake City residents.
| Immigration Origin | # Population | % Population |
| Central America | 21 | 0.4% |
| Europe | 11 | 0.2% |
| Italy | 11 | 0.2% |
| Latin America | 21 | 0.4% |
| Mexico | 21 | 0.4% |
| Southern Europe | 11 | 0.2% | View All 6 Rows |
Sex and Age in Lake City
Sex and Age in Lake City
The most populous age groups in Lake City are 15 to 19 Years (355 | 13.0%) for men and 30 to 34 Years (470 | 14.1%) for women.
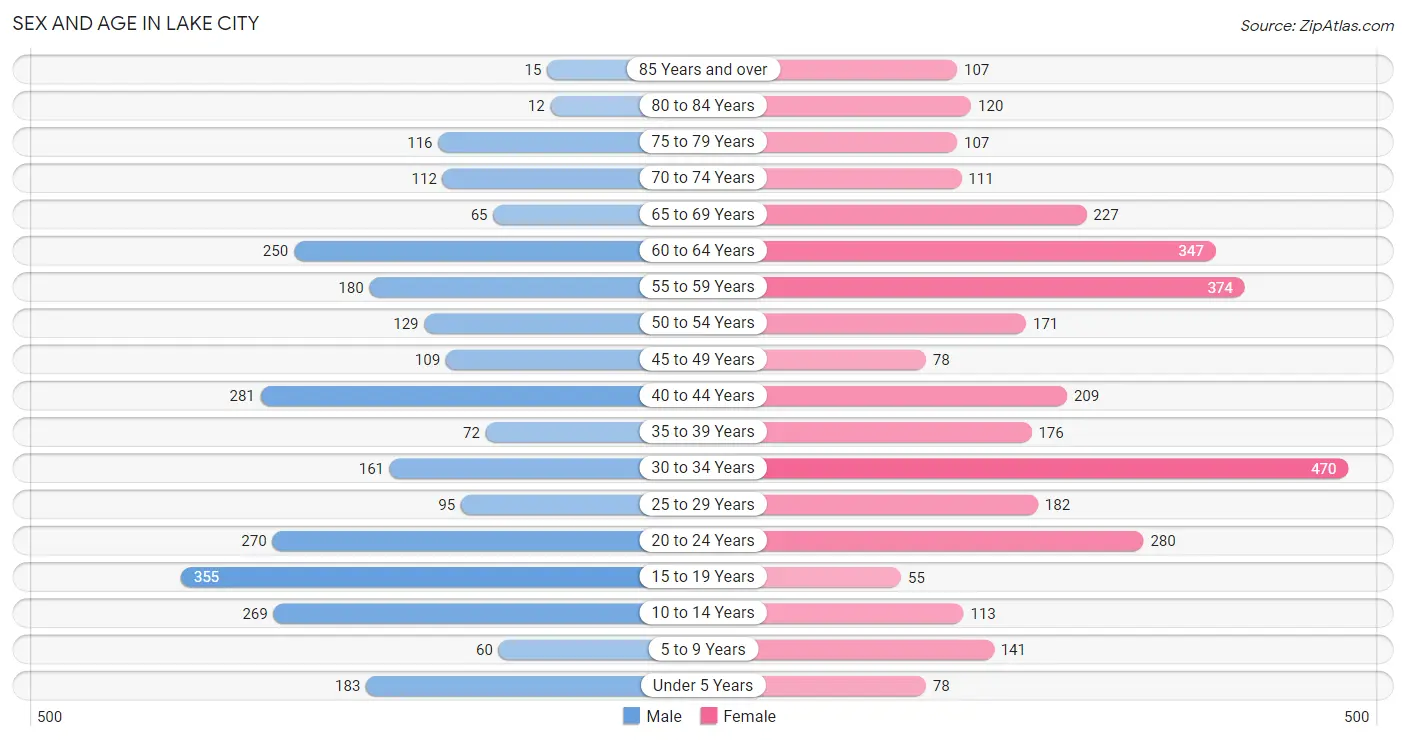
| Age Bracket | Male | Female |
| Under 5 Years | 183 (6.7%) | 78 (2.3%) |
| 5 to 9 Years | 60 (2.2%) | 141 (4.2%) |
| 10 to 14 Years | 269 (9.8%) | 113 (3.4%) |
| 15 to 19 Years | 355 (13.0%) | 55 (1.6%) |
| 20 to 24 Years | 270 (9.9%) | 280 (8.4%) |
| 25 to 29 Years | 95 (3.5%) | 182 (5.4%) |
| 30 to 34 Years | 161 (5.9%) | 470 (14.1%) |
| 35 to 39 Years | 72 (2.6%) | 176 (5.3%) |
| 40 to 44 Years | 281 (10.3%) | 209 (6.2%) |
| 45 to 49 Years | 109 (4.0%) | 78 (2.3%) |
| 50 to 54 Years | 129 (4.7%) | 171 (5.1%) |
| 55 to 59 Years | 180 (6.6%) | 374 (11.2%) |
| 60 to 64 Years | 250 (9.1%) | 347 (10.4%) |
| 65 to 69 Years | 65 (2.4%) | 227 (6.8%) |
| 70 to 74 Years | 112 (4.1%) | 111 (3.3%) |
| 75 to 79 Years | 116 (4.2%) | 107 (3.2%) |
| 80 to 84 Years | 12 (0.4%) | 120 (3.6%) |
| 85 Years and over | 15 (0.5%) | 107 (3.2%) |
| Total | 2,734 (100.0%) | 3,346 (100.0%) |
Families and Households in Lake City
Median Family Size in Lake City
The median family size in Lake City is 3.66 persons per family, with single female/mother families (635 | 51.8%) accounting for the largest median family size of 3.94 persons per family. On the other hand, single male/father families (152 | 12.4%) represent the smallest median family size with 2.71 persons per family.
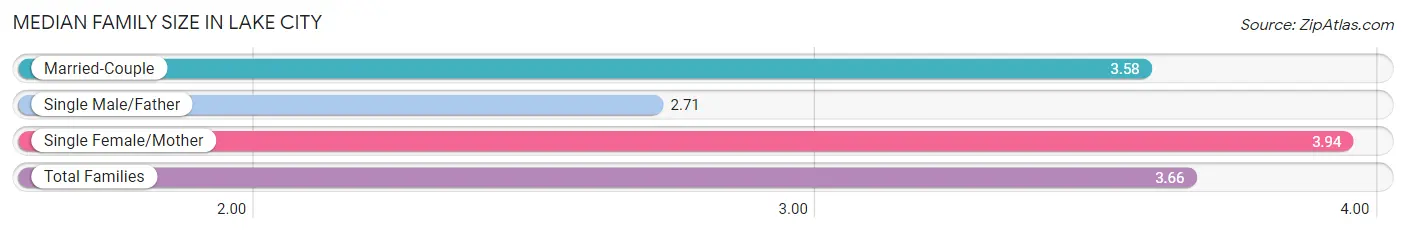
| Family Type | # Families | Family Size |
| Married-Couple | 439 (35.8%) | 3.58 |
| Single Male/Father | 152 (12.4%) | 2.71 |
| Single Female/Mother | 635 (51.8%) | 3.94 |
| Total Families | 1,226 (100.0%) | 3.66 |
Median Household Size in Lake City
The median household size in Lake City is 2.50 persons per household, with single female/mother households (635 | 26.2%) accounting for the largest median household size of 4.27 persons per household. non-family households (1,200 | 49.5%) represent the smallest median household size with 1.10 persons per household.
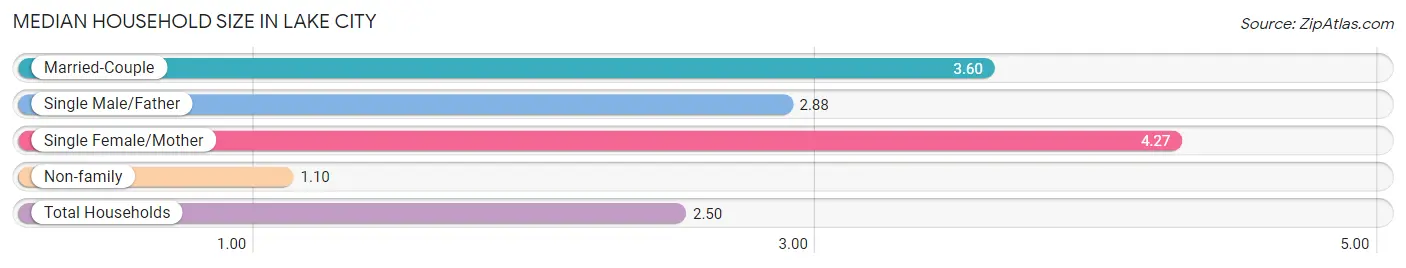
| Household Type | # Households | Household Size |
| Married-Couple | 439 (18.1%) | 3.60 |
| Single Male/Father | 152 (6.3%) | 2.88 |
| Single Female/Mother | 635 (26.2%) | 4.27 |
| Non-family | 1,200 (49.5%) | 1.10 |
| Total Households | 2,426 (100.0%) | 2.50 |
Household Size by Marriage Status in Lake City
Out of a total of 2,426 households in Lake City, 1,226 (50.5%) are family households, while 1,200 (49.5%) are nonfamily households. The most numerous type of family households are 3-person households, comprising 455, and the most common type of nonfamily households are 1-person households, comprising 1,100.
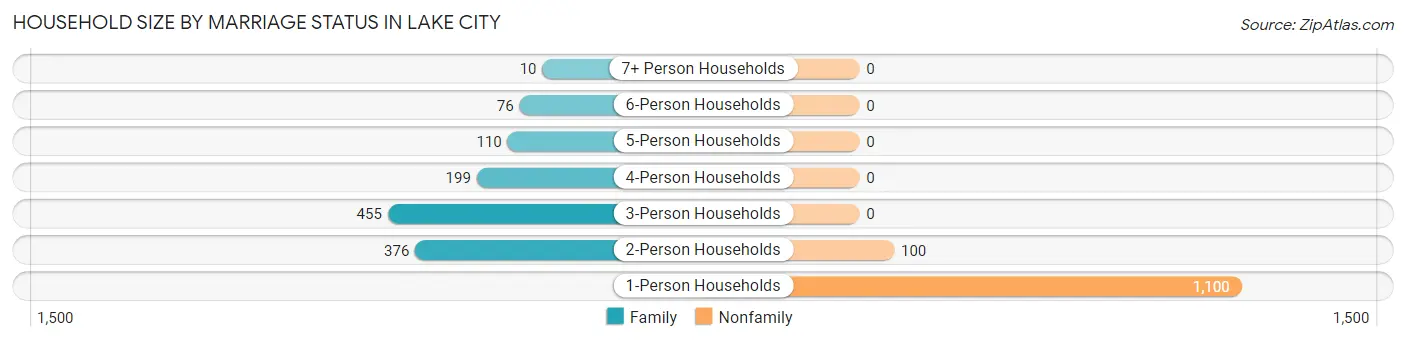
| Household Size | Family Households | Nonfamily Households |
| 1-Person Households | - | 1,100 (45.3%) |
| 2-Person Households | 376 (15.5%) | 100 (4.1%) |
| 3-Person Households | 455 (18.8%) | 0 (0.0%) |
| 4-Person Households | 199 (8.2%) | 0 (0.0%) |
| 5-Person Households | 110 (4.5%) | 0 (0.0%) |
| 6-Person Households | 76 (3.1%) | 0 (0.0%) |
| 7+ Person Households | 10 (0.4%) | 0 (0.0%) |
| Total | 1,226 (50.5%) | 1,200 (49.5%) |
Female Fertility in Lake City
Fertility by Age in Lake City
Average fertility rate in Lake City is 36.0 births per 1,000 women. Women in the age bracket of 35 to 50 years have the highest fertility rate with 111.0 births per 1,000 women. Women in the age bracket of 35 to 50 years acount for 100.0% of all women with births.
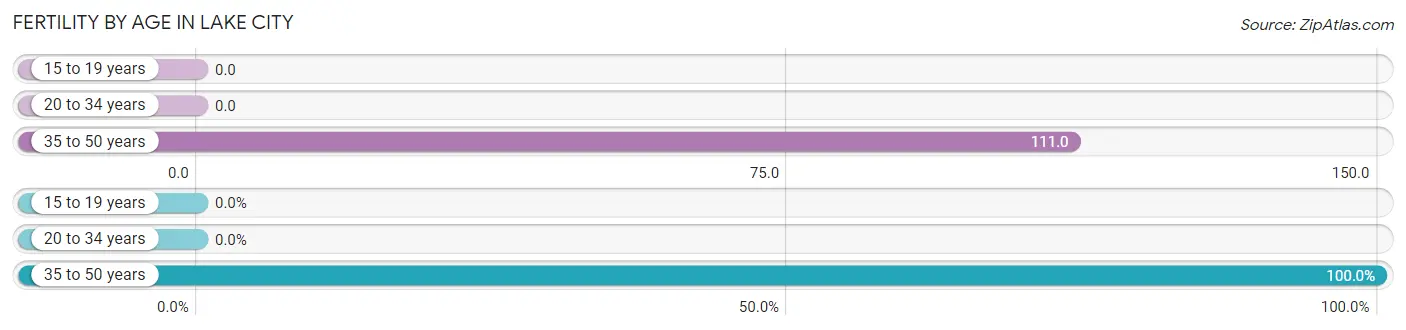
| Age Bracket | Women with Births | Births / 1,000 Women |
| 15 to 19 years | 0 (0.0%) | 0.0 |
| 20 to 34 years | 0 (0.0%) | 0.0 |
| 35 to 50 years | 52 (100.0%) | 111.0 |
| Total | 52 (100.0%) | 36.0 |
Fertility by Age by Marriage Status in Lake City
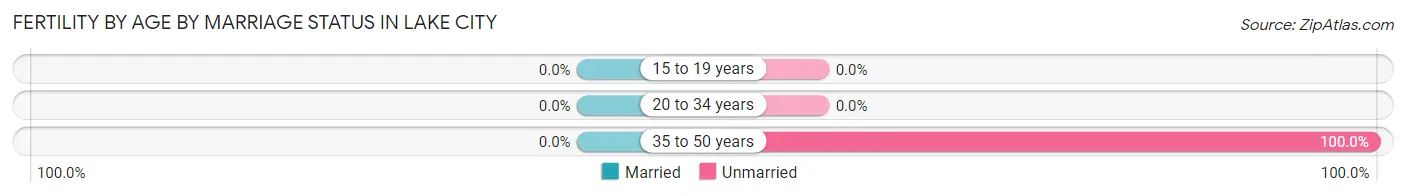
| Age Bracket | Married | Unmarried |
| 15 to 19 years | 0 (0.0%) | 0 (0.0%) |
| 20 to 34 years | 0 (0.0%) | 0 (0.0%) |
| 35 to 50 years | 0 (0.0%) | 52 (100.0%) |
| Total | 0 (0.0%) | 52 (100.0%) |
Fertility by Education in Lake City
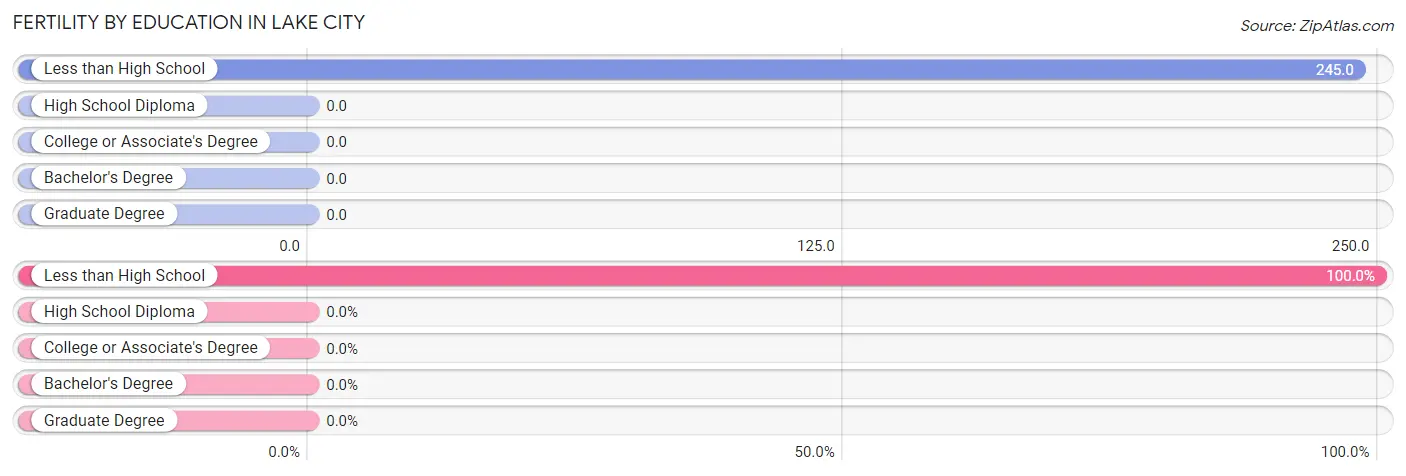
| Educational Attainment | Women with Births | Births / 1,000 Women |
| Less than High School | 52 (100.0%) | 245.0 |
| High School Diploma | 0 (0.0%) | 0.0 |
| College or Associate's Degree | 0 (0.0%) | 0.0 |
| Bachelor's Degree | 0 (0.0%) | 0.0 |
| Graduate Degree | 0 (0.0%) | 0.0 |
| Total | 52 (100.0%) | 36.0 |
Fertility by Education by Marriage Status in Lake City
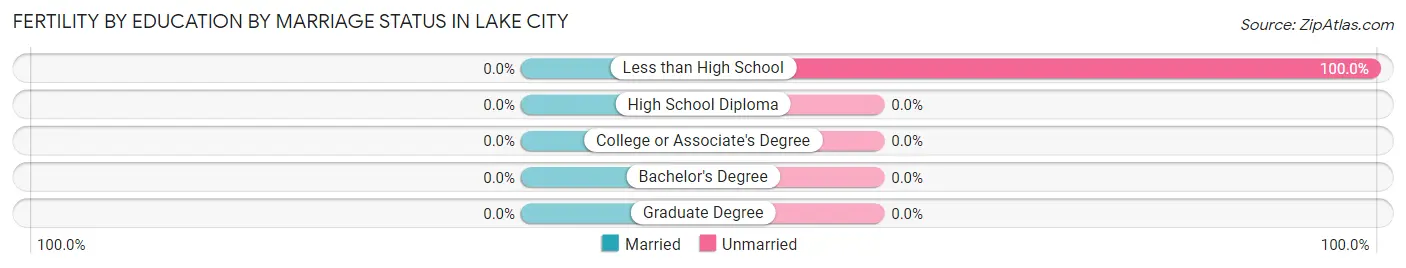
| Educational Attainment | Married | Unmarried |
| Less than High School | 0 (0.0%) | 52 (100.0%) |
| High School Diploma | 0 (0.0%) | 0 (0.0%) |
| College or Associate's Degree | 0 (0.0%) | 0 (0.0%) |
| Bachelor's Degree | 0 (0.0%) | 0 (0.0%) |
| Graduate Degree | 0 (0.0%) | 0 (0.0%) |
| Total | 0 (0.0%) | 52 (100.0%) |
Income in Lake City
Income Overview in Lake City
Per Capita Income in Lake City is $22,245, while median incomes of families and households are $49,808 and $37,013 respectively.
| Characteristic | Number | Measure |
| Per Capita Income | 6,080 | $22,245 |
| Median Family Income | 1,226 | $49,808 |
| Mean Family Income | 1,226 | $63,250 |
| Median Household Income | 2,426 | $37,013 |
| Mean Household Income | 2,426 | $50,938 |
| Income Deficit | 1,226 | $0 |
| Wage / Income Gap (%) | 6,080 | 7.45% |
| Wage / Income Gap ($) | 6,080 | 92.55¢ per $1 |
| Gini / Inequality Index | 6,080 | 0.47 |
Earnings by Sex in Lake City
Average Earnings in Lake City are $27,666, $26,354 for men and $28,475 for women, a difference of 7.4%.
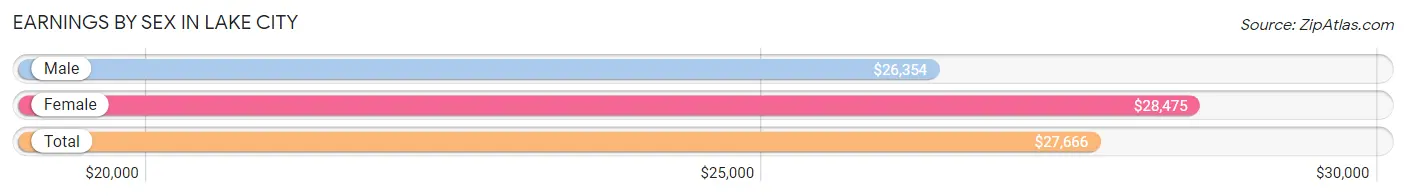
| Sex | Number | Average Earnings |
| Male | 1,266 (42.7%) | $26,354 |
| Female | 1,701 (57.3%) | $28,475 |
| Total | 2,967 (100.0%) | $27,666 |
Earnings by Sex by Income Bracket in Lake City
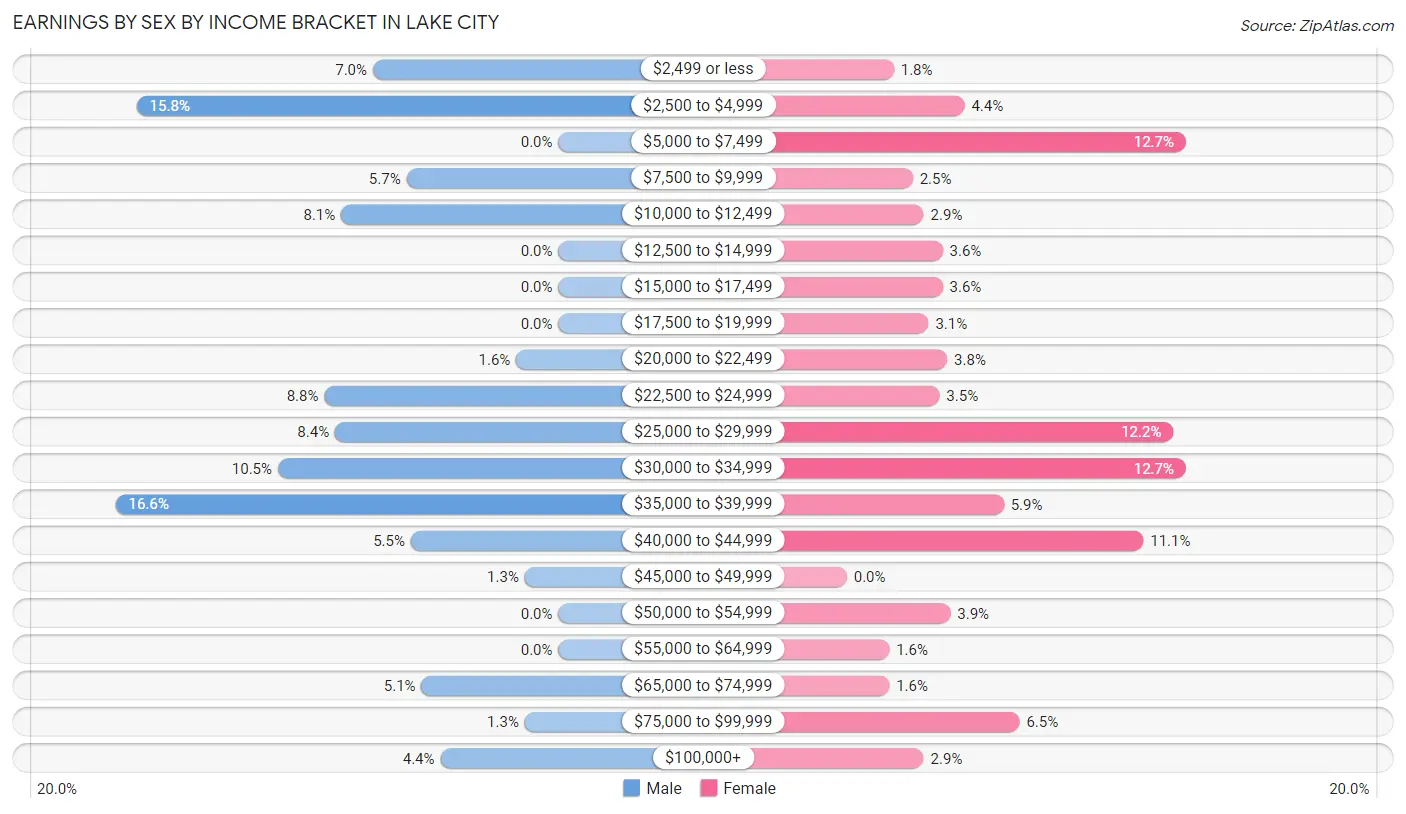
The most common earnings brackets in Lake City are $35,000 to $39,999 for men (210 | 16.6%) and $5,000 to $7,499 for women (216 | 12.7%).
| Income | Male | Female |
| $2,499 or less | 88 (7.0%) | 30 (1.8%) |
| $2,500 to $4,999 | 200 (15.8%) | 75 (4.4%) |
| $5,000 to $7,499 | 0 (0.0%) | 216 (12.7%) |
| $7,500 to $9,999 | 72 (5.7%) | 42 (2.5%) |
| $10,000 to $12,499 | 103 (8.1%) | 49 (2.9%) |
| $12,500 to $14,999 | 0 (0.0%) | 61 (3.6%) |
| $15,000 to $17,499 | 0 (0.0%) | 61 (3.6%) |
| $17,500 to $19,999 | 0 (0.0%) | 52 (3.1%) |
| $20,000 to $22,499 | 20 (1.6%) | 64 (3.8%) |
| $22,500 to $24,999 | 111 (8.8%) | 59 (3.5%) |
| $25,000 to $29,999 | 106 (8.4%) | 208 (12.2%) |
| $30,000 to $34,999 | 133 (10.5%) | 216 (12.7%) |
| $35,000 to $39,999 | 210 (16.6%) | 100 (5.9%) |
| $40,000 to $44,999 | 70 (5.5%) | 189 (11.1%) |
| $45,000 to $49,999 | 16 (1.3%) | 0 (0.0%) |
| $50,000 to $54,999 | 0 (0.0%) | 66 (3.9%) |
| $55,000 to $64,999 | 0 (0.0%) | 27 (1.6%) |
| $65,000 to $74,999 | 65 (5.1%) | 27 (1.6%) |
| $75,000 to $99,999 | 16 (1.3%) | 110 (6.5%) |
| $100,000+ | 56 (4.4%) | 49 (2.9%) |
| Total | 1,266 (100.0%) | 1,701 (100.0%) |
Earnings by Sex by Educational Attainment in Lake City
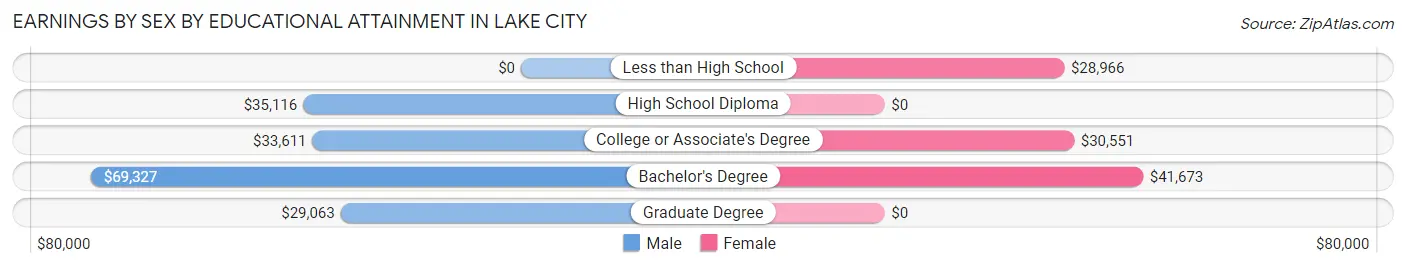
Average earnings in Lake City are $34,073 for men and $30,475 for women, a difference of 10.6%. Men with an educational attainment of bachelor's degree enjoy the highest average annual earnings of $69,327, while those with graduate degree education earn the least with $29,063. Women with an educational attainment of bachelor's degree earn the most with the average annual earnings of $41,673, while those with less than high school education have the smallest earnings of $28,966.
| Educational Attainment | Male Income | Female Income |
| Less than High School | - | - |
| High School Diploma | $35,116 | $0 |
| College or Associate's Degree | $33,611 | $30,551 |
| Bachelor's Degree | $69,327 | $41,673 |
| Graduate Degree | $29,063 | $0 |
| Total | $34,073 | $30,475 |
Family Income in Lake City
Family Income Brackets in Lake City
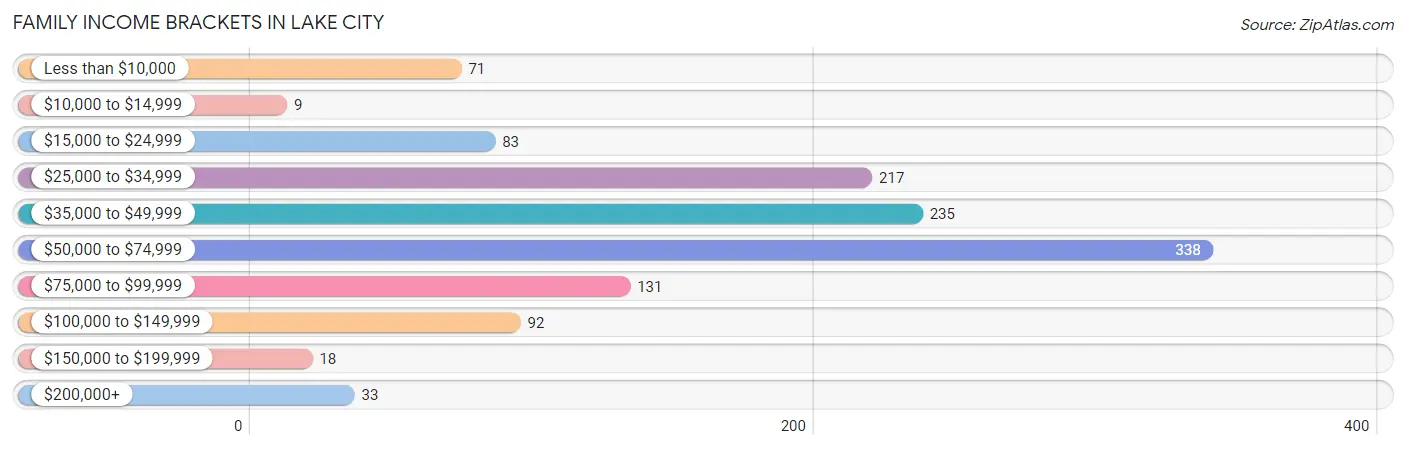
According to the Lake City family income data, there are 338 families falling into the $50,000 to $74,999 income range, which is the most common income bracket and makes up 27.6% of all families. Conversely, the $10,000 to $14,999 income bracket is the least frequent group with only 9 families (0.7%) belonging to this category.
| Income Bracket | # Families | % Families |
| Less than $10,000 | 71 | 5.8% |
| $10,000 to $14,999 | 9 | 0.7% |
| $15,000 to $24,999 | 83 | 6.8% |
| $25,000 to $34,999 | 217 | 17.7% |
| $35,000 to $49,999 | 235 | 19.2% |
| $50,000 to $74,999 | 338 | 27.6% |
| $75,000 to $99,999 | 131 | 10.7% |
| $100,000 to $149,999 | 92 | 7.5% |
| $150,000 to $199,999 | 18 | 1.5% |
| $200,000+ | 33 | 2.7% |
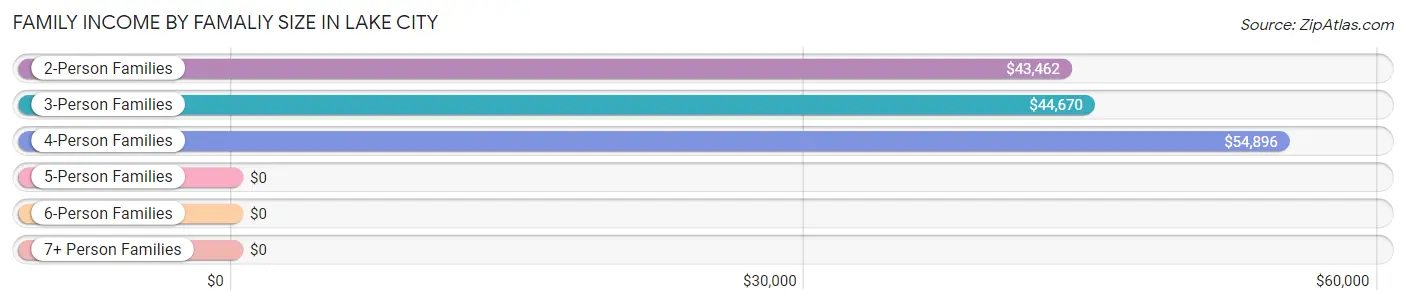
Family Income by Famaliy Size in Lake City
4-person families (237 | 19.3%) account for the highest median family income in Lake City with $54,896 per family, while 2-person families (376 | 30.7%) have the highest median income of $21,731 per family member.
| Income Bracket | # Families | Median Income |
| 2-Person Families | 376 (30.7%) | $43,462 |
| 3-Person Families | 497 (40.5%) | $44,670 |
| 4-Person Families | 237 (19.3%) | $54,896 |
| 5-Person Families | 72 (5.9%) | $0 |
| 6-Person Families | 44 (3.6%) | $0 |
| 7+ Person Families | 0 (0.0%) | $0 |
| Total | 1,226 (100.0%) | $49,808 |
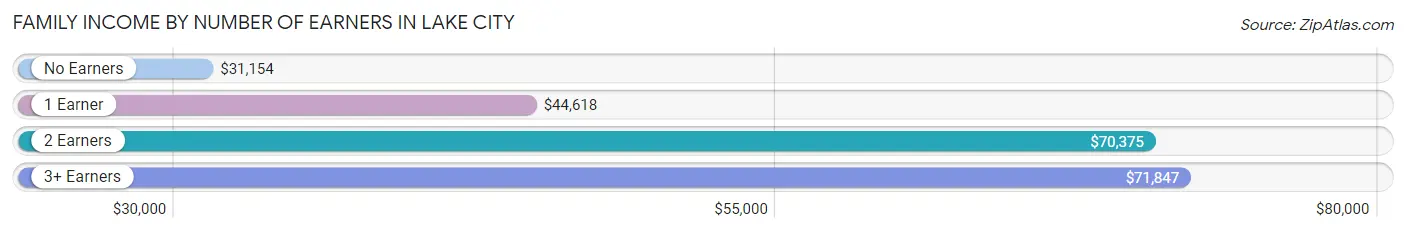
Family Income by Number of Earners in Lake City
The median family income in Lake City is $49,808, with families comprising 3+ earners (157) having the highest median family income of $71,847, while families with no earners (130) have the lowest median family income of $31,154, accounting for 12.8% and 10.6% of families, respectively.
| Number of Earners | # Families | Median Income |
| No Earners | 130 (10.6%) | $31,154 |
| 1 Earner | 656 (53.5%) | $44,618 |
| 2 Earners | 283 (23.1%) | $70,375 |
| 3+ Earners | 157 (12.8%) | $71,847 |
| Total | 1,226 (100.0%) | $49,808 |
Household Income in Lake City
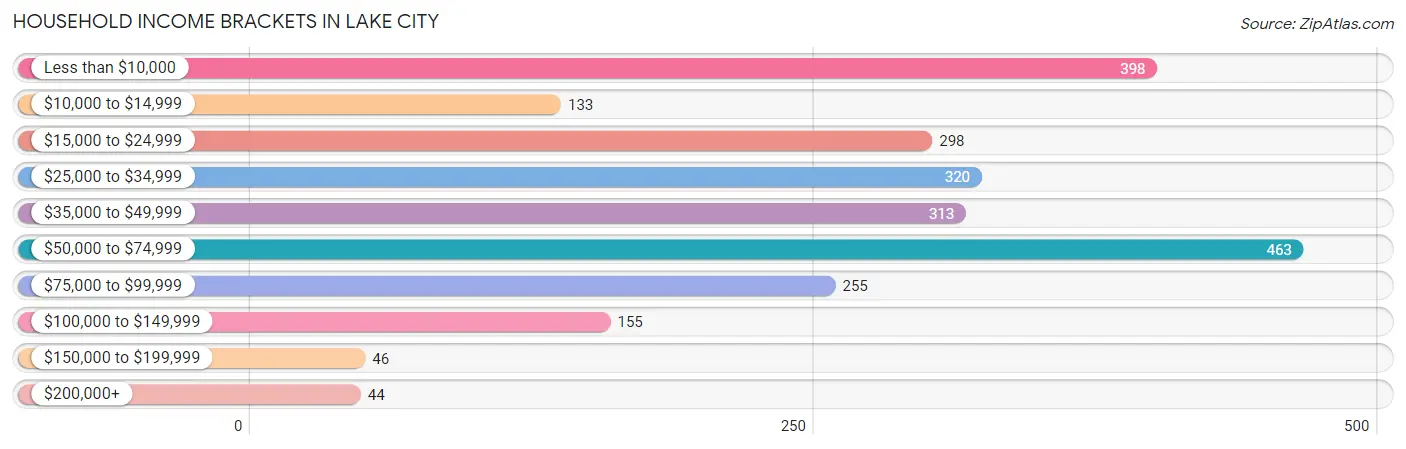
Household Income Brackets in Lake City
With 463 households falling in the category, the $50,000 to $74,999 income range is the most frequent in Lake City, accounting for 19.1% of all households. In contrast, only 44 households (1.8%) fall into the $200,000+ income bracket, making it the least populous group.
| Income Bracket | # Households | % Households |
| Less than $10,000 | 398 | 16.4% |
| $10,000 to $14,999 | 133 | 5.5% |
| $15,000 to $24,999 | 298 | 12.3% |
| $25,000 to $34,999 | 320 | 13.2% |
| $35,000 to $49,999 | 313 | 12.9% |
| $50,000 to $74,999 | 463 | 19.1% |
| $75,000 to $99,999 | 255 | 10.5% |
| $100,000 to $149,999 | 155 | 6.4% |
| $150,000 to $199,999 | 46 | 1.9% |
| $200,000+ | 44 | 1.8% |
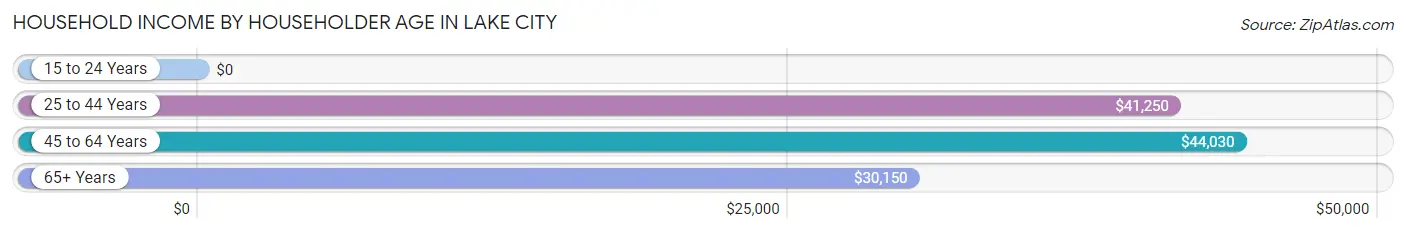
Household Income by Householder Age in Lake City
The median household income in Lake City is $37,013, with the highest median household income of $44,030 found in the 45 to 64 years age bracket for the primary householder. A total of 988 households (40.7%) fall into this category. Meanwhile, the 15 to 24 years age bracket for the primary householder has the lowest median household income of $0, with 61 households (2.5%) in this group.
| Income Bracket | # Households | Median Income |
| 15 to 24 Years | 61 (2.5%) | $0 |
| 25 to 44 Years | 769 (31.7%) | $41,250 |
| 45 to 64 Years | 988 (40.7%) | $44,030 |
| 65+ Years | 608 (25.1%) | $30,150 |
| Total | 2,426 (100.0%) | $37,013 |
Poverty in Lake City
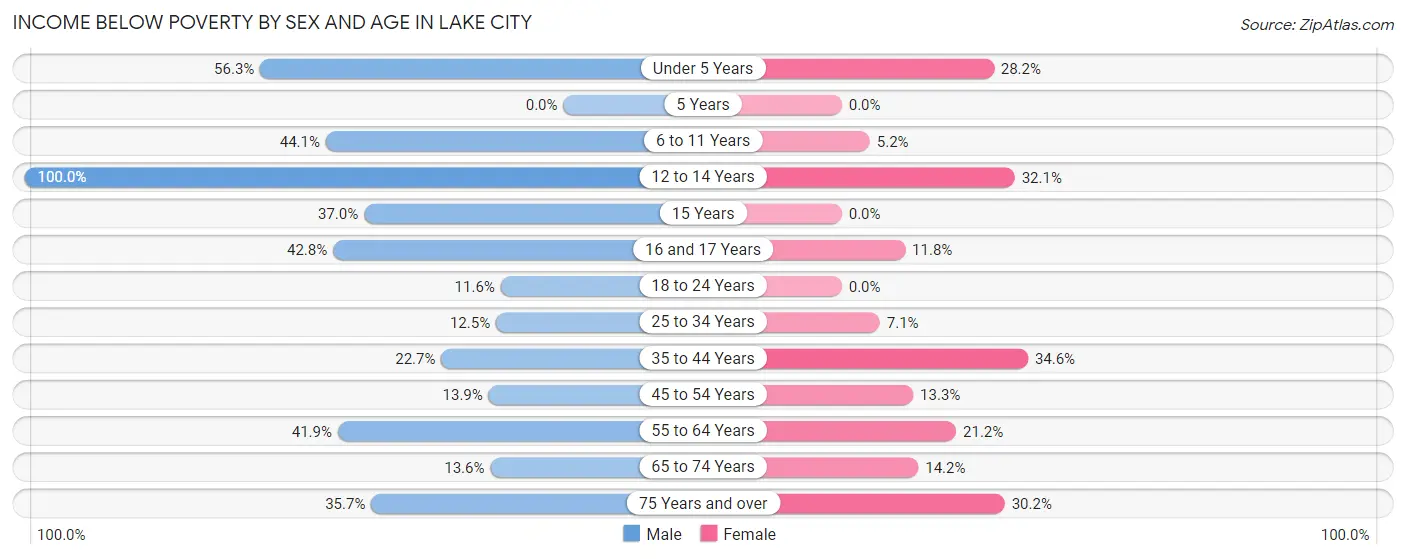
Income Below Poverty by Sex and Age in Lake City
With 28.9% poverty level for males and 17.1% for females among the residents of Lake City, 12 to 14 year old males and 35 to 44 year old females are the most vulnerable to poverty, with 26 males (100.0%) and 133 females (34.5%) in their respective age groups living below the poverty level.
| Age Bracket | Male | Female |
| Under 5 Years | 103 (56.3%) | 22 (28.2%) |
| 5 Years | 0 (0.0%) | 0 (0.0%) |
| 6 to 11 Years | 127 (44.1%) | 9 (5.2%) |
| 12 to 14 Years | 26 (100.0%) | 26 (32.1%) |
| 15 Years | 27 (37.0%) | 0 (0.0%) |
| 16 and 17 Years | 56 (42.7%) | 2 (11.8%) |
| 18 to 24 Years | 49 (11.6%) | 0 (0.0%) |
| 25 to 34 Years | 32 (12.5%) | 46 (7.1%) |
| 35 to 44 Years | 80 (22.7%) | 133 (34.5%) |
| 45 to 54 Years | 33 (13.9%) | 33 (13.3%) |
| 55 to 64 Years | 180 (41.9%) | 153 (21.2%) |
| 65 to 74 Years | 24 (13.6%) | 48 (14.2%) |
| 75 Years and over | 51 (35.7%) | 101 (30.2%) |
| Total | 788 (28.9%) | 573 (17.1%) |
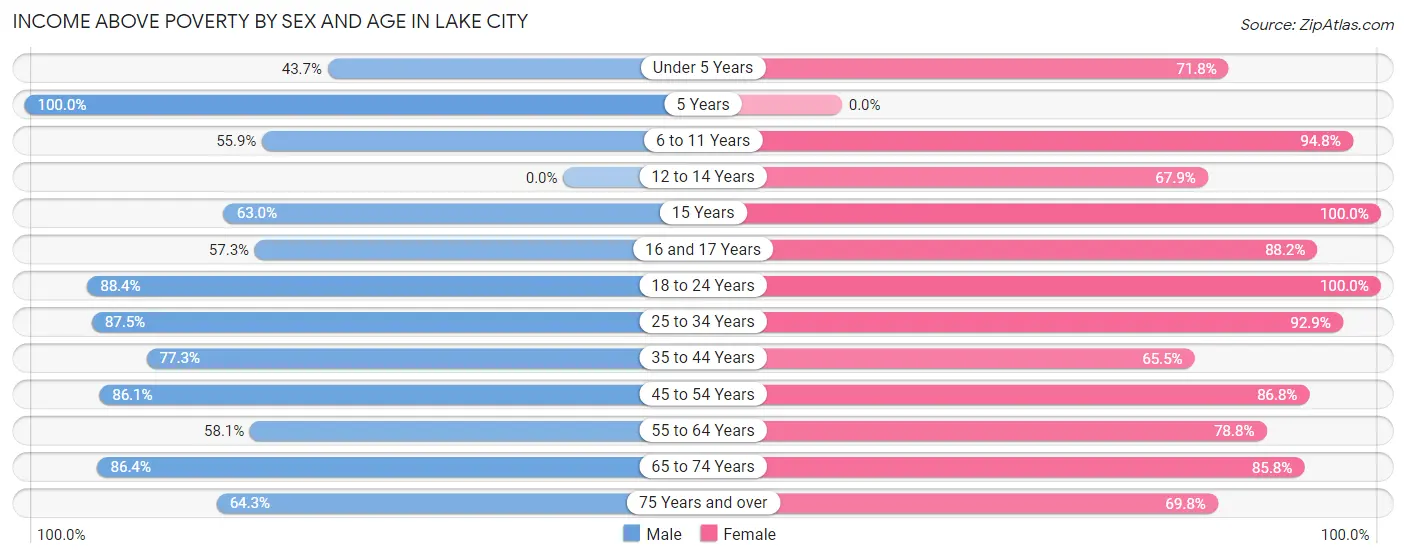
Income Above Poverty by Sex and Age in Lake City
According to the poverty statistics in Lake City, males aged 5 years and females aged 15 years are the age groups that are most secure financially, with 100.0% of males and 100.0% of females in these age groups living above the poverty line.
| Age Bracket | Male | Female |
| Under 5 Years | 80 (43.7%) | 56 (71.8%) |
| 5 Years | 7 (100.0%) | 0 (0.0%) |
| 6 to 11 Years | 161 (55.9%) | 164 (94.8%) |
| 12 to 14 Years | 0 (0.0%) | 55 (67.9%) |
| 15 Years | 46 (63.0%) | 10 (100.0%) |
| 16 and 17 Years | 75 (57.3%) | 15 (88.2%) |
| 18 to 24 Years | 372 (88.4%) | 308 (100.0%) |
| 25 to 34 Years | 224 (87.5%) | 606 (92.9%) |
| 35 to 44 Years | 273 (77.3%) | 252 (65.4%) |
| 45 to 54 Years | 205 (86.1%) | 216 (86.8%) |
| 55 to 64 Years | 250 (58.1%) | 568 (78.8%) |
| 65 to 74 Years | 153 (86.4%) | 290 (85.8%) |
| 75 Years and over | 92 (64.3%) | 233 (69.8%) |
| Total | 1,938 (71.1%) | 2,773 (82.9%) |
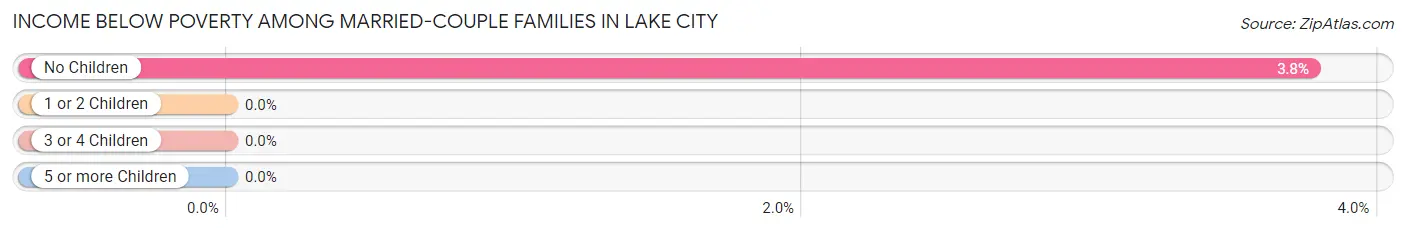
Income Below Poverty Among Married-Couple Families in Lake City
The poverty statistics for married-couple families in Lake City show that 2.3% or 10 of the total 439 families live below the poverty line. Families with no children have the highest poverty rate of 3.8%, comprising of 10 families. On the other hand, families with 1 or 2 children have the lowest poverty rate of 0.0%, which includes 0 families.
| Children | Above Poverty | Below Poverty |
| No Children | 255 (96.2%) | 10 (3.8%) |
| 1 or 2 Children | 167 (100.0%) | 0 (0.0%) |
| 3 or 4 Children | 7 (100.0%) | 0 (0.0%) |
| 5 or more Children | 0 (0.0%) | 0 (0.0%) |
| Total | 429 (97.7%) | 10 (2.3%) |
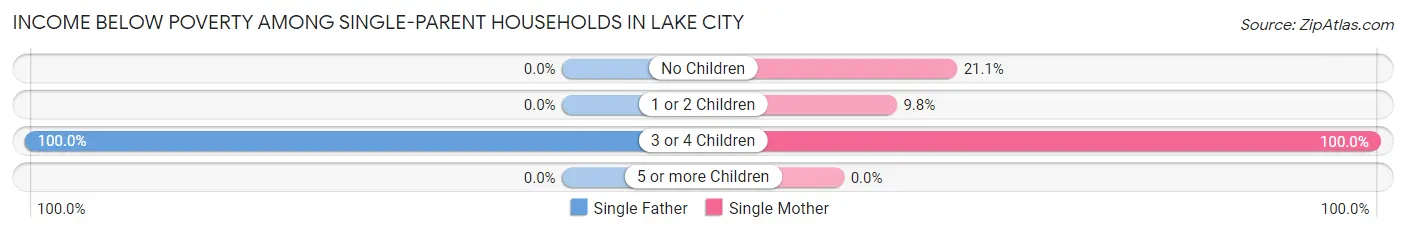
Income Below Poverty Among Single-Parent Households in Lake City
According to the poverty data in Lake City, 21.0% or 32 single-father households and 22.5% or 143 single-mother households are living below the poverty line. Among single-father households, those with 3 or 4 children have the highest poverty rate, with 32 households (100.0%) experiencing poverty. Likewise, among single-mother households, those with 3 or 4 children have the highest poverty rate, with 61 households (100.0%) falling below the poverty line.
| Children | Single Father | Single Mother |
| No Children | 0 (0.0%) | 48 (21.0%) |
| 1 or 2 Children | 0 (0.0%) | 34 (9.8%) |
| 3 or 4 Children | 32 (100.0%) | 61 (100.0%) |
| 5 or more Children | 0 (0.0%) | 0 (0.0%) |
| Total | 32 (21.0%) | 143 (22.5%) |
Income Below Poverty Among Married-Couple vs Single-Parent Households in Lake City
The poverty data for Lake City shows that 10 of the married-couple family households (2.3%) and 175 of the single-parent households (22.2%) are living below the poverty level. Within the married-couple family households, those with no children have the highest poverty rate, with 10 households (3.8%) falling below the poverty line. Among the single-parent households, those with 3 or 4 children have the highest poverty rate, with 93 household (100.0%) living below poverty.
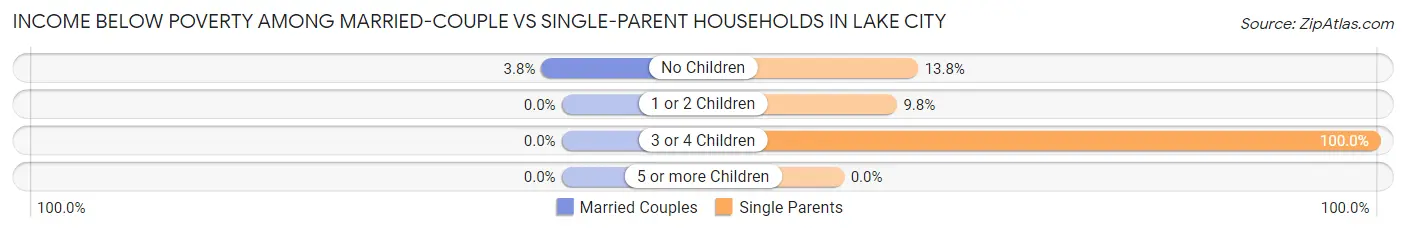
| Children | Married-Couple Families | Single-Parent Households |
| No Children | 10 (3.8%) | 48 (13.8%) |
| 1 or 2 Children | 0 (0.0%) | 34 (9.8%) |
| 3 or 4 Children | 0 (0.0%) | 93 (100.0%) |
| 5 or more Children | 0 (0.0%) | 0 (0.0%) |
| Total | 10 (2.3%) | 175 (22.2%) |
Employment Characteristics in Lake City
Employment by Class of Employer in Lake City
Among the 2,662 employed individuals in Lake City, private company employees (1,807 | 67.9%), not-for-profit organizations (333 | 12.5%), and state government employees (223 | 8.4%) make up the most common classes of employment.
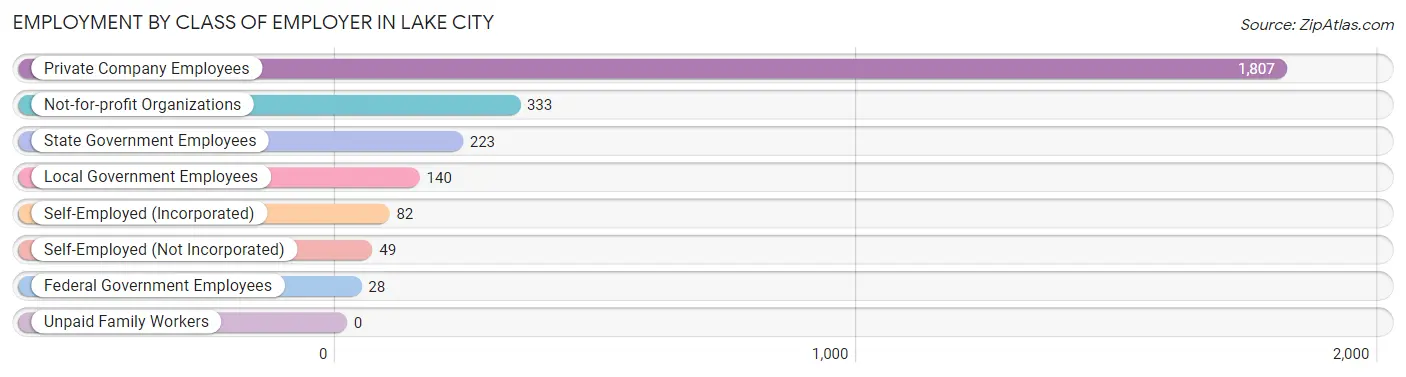
| Employer Class | # Employees | % Employees |
| Private Company Employees | 1,807 | 67.9% |
| Self-Employed (Incorporated) | 82 | 3.1% |
| Self-Employed (Not Incorporated) | 49 | 1.8% |
| Not-for-profit Organizations | 333 | 12.5% |
| Local Government Employees | 140 | 5.3% |
| State Government Employees | 223 | 8.4% |
| Federal Government Employees | 28 | 1.1% |
| Unpaid Family Workers | 0 | 0.0% |
| Total | 2,662 | 100.0% |
Employment Status by Age in Lake City
According to the labor force statistics for Lake City, out of the total population over 16 years of age (5,153), 57.1% or 2,942 individuals are in the labor force, with 8.6% or 253 of them unemployed. The age group with the highest labor force participation rate is 30 to 34 years, with 94.5% or 596 individuals in the labor force. Within the labor force, the 75 years and over age range has the highest percentage of unemployed individuals, with 22.9% or 16 of them being unemployed.
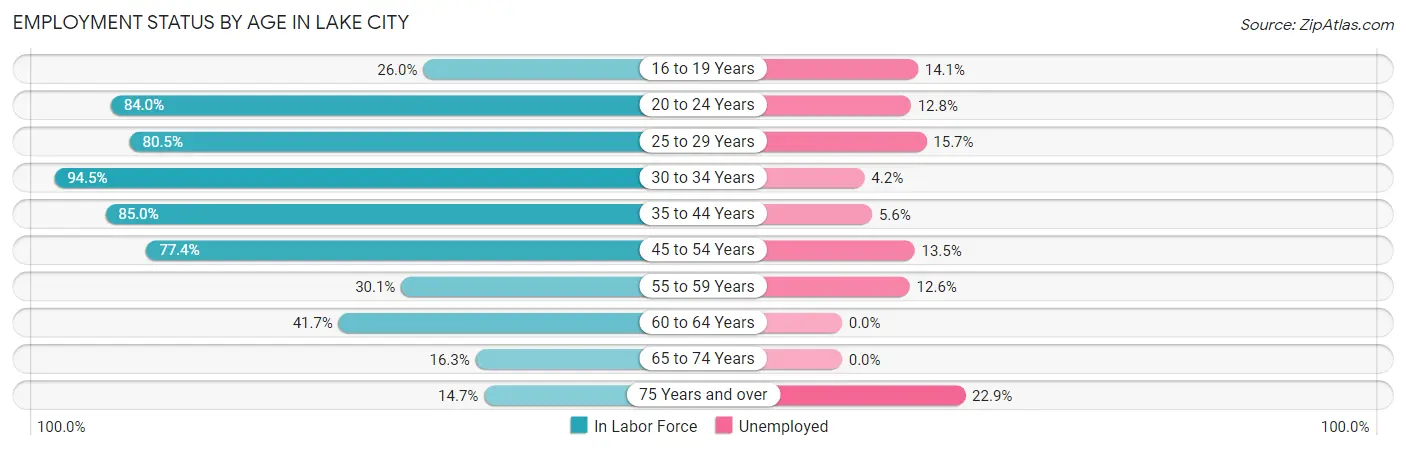
| Age Bracket | In Labor Force | Unemployed |
| 16 to 19 Years | 85 (26.0%) | 12 (14.1%) |
| 20 to 24 Years | 462 (84.0%) | 59 (12.8%) |
| 25 to 29 Years | 223 (80.5%) | 35 (15.7%) |
| 30 to 34 Years | 596 (94.5%) | 25 (4.2%) |
| 35 to 44 Years | 627 (85.0%) | 35 (5.6%) |
| 45 to 54 Years | 377 (77.4%) | 51 (13.5%) |
| 55 to 59 Years | 167 (30.1%) | 21 (12.6%) |
| 60 to 64 Years | 249 (41.7%) | 0 (0.0%) |
| 65 to 74 Years | 84 (16.3%) | 0 (0.0%) |
| 75 Years and over | 70 (14.7%) | 16 (22.9%) |
| Total | 2,942 (57.1%) | 253 (8.6%) |
Employment Status by Educational Attainment in Lake City
According to labor force statistics for Lake City, 68.2% of individuals (2,240) out of the total population between 25 and 64 years of age (3,284) are in the labor force, with 7.5% or 168 of them being unemployed. The group with the highest labor force participation rate are those with the educational attainment of college / associate degree, with 80.9% or 678 individuals in the labor force. Within the labor force, individuals with less than high school education have the highest percentage of unemployment, with 16.8% or 25 of them being unemployed.
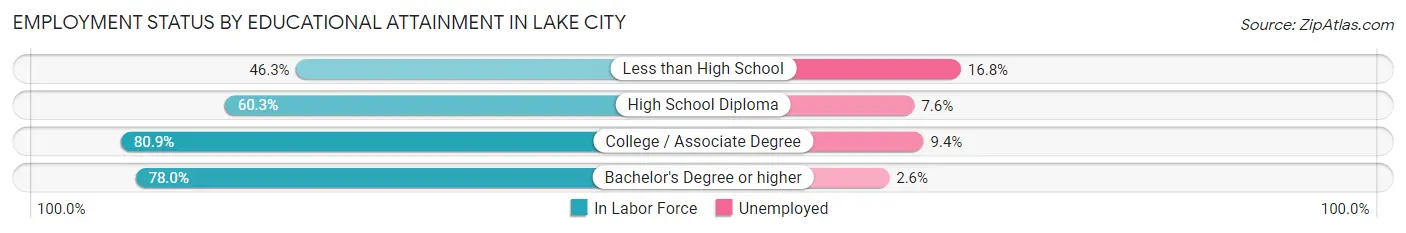
| Educational Attainment | In Labor Force | Unemployed |
| Less than High School | 149 (46.3%) | 54 (16.8%) |
| High School Diploma | 832 (60.3%) | 105 (7.6%) |
| College / Associate Degree | 678 (80.9%) | 79 (9.4%) |
| Bachelor's Degree or higher | 581 (78.0%) | 19 (2.6%) |
| Total | 2,240 (68.2%) | 246 (7.5%) |
Employment Occupations by Sex in Lake City
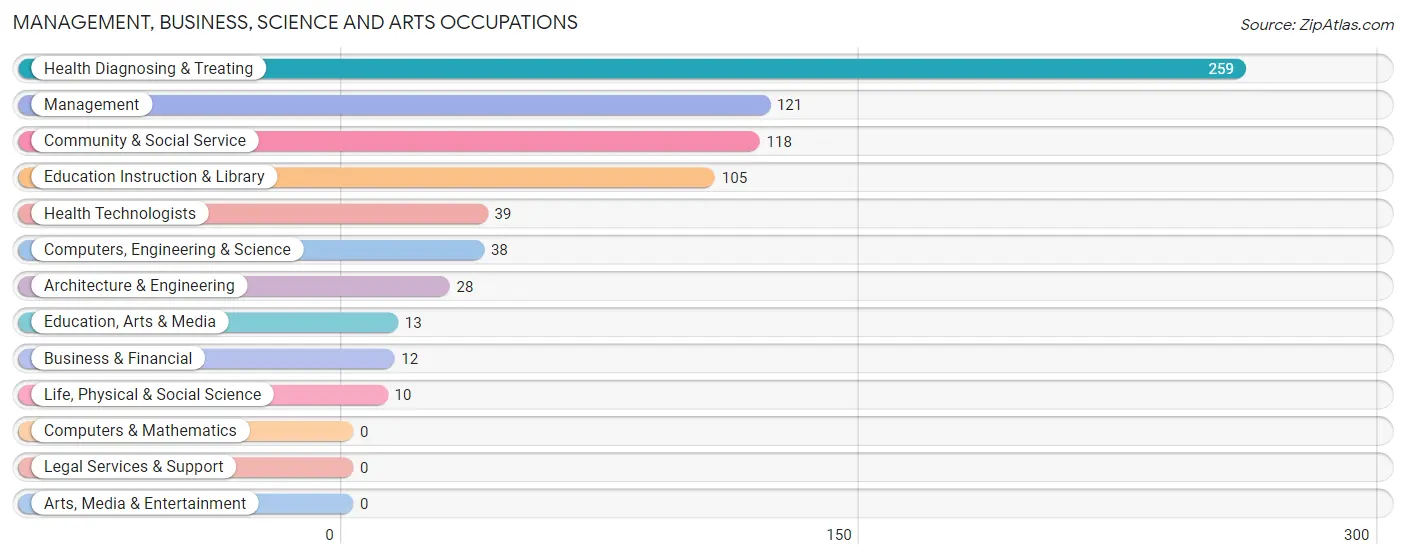
Management, Business, Science and Arts Occupations
The most common Management, Business, Science and Arts occupations in Lake City are Health Diagnosing & Treating (259 | 9.6%), Management (121 | 4.5%), Community & Social Service (118 | 4.4%), Education Instruction & Library (105 | 3.9%), and Health Technologists (39 | 1.5%).
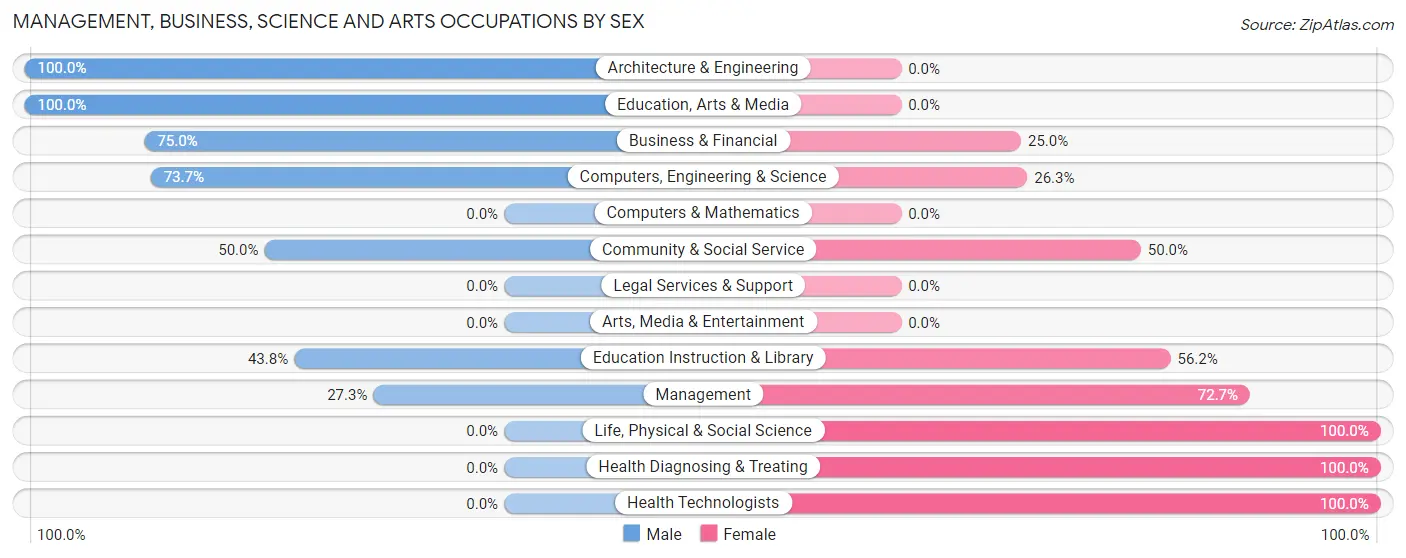
Management, Business, Science and Arts Occupations by Sex
Within the Management, Business, Science and Arts occupations in Lake City, the most male-oriented occupations are Architecture & Engineering (100.0%), Education, Arts & Media (100.0%), and Business & Financial (75.0%), while the most female-oriented occupations are Life, Physical & Social Science (100.0%), Health Diagnosing & Treating (100.0%), and Health Technologists (100.0%).
| Occupation | Male | Female |
| Management | 33 (27.3%) | 88 (72.7%) |
| Business & Financial | 9 (75.0%) | 3 (25.0%) |
| Computers, Engineering & Science | 28 (73.7%) | 10 (26.3%) |
| Computers & Mathematics | 0 (0.0%) | 0 (0.0%) |
| Architecture & Engineering | 28 (100.0%) | 0 (0.0%) |
| Life, Physical & Social Science | 0 (0.0%) | 10 (100.0%) |
| Community & Social Service | 59 (50.0%) | 59 (50.0%) |
| Education, Arts & Media | 13 (100.0%) | 0 (0.0%) |
| Legal Services & Support | 0 (0.0%) | 0 (0.0%) |
| Education Instruction & Library | 46 (43.8%) | 59 (56.2%) |
| Arts, Media & Entertainment | 0 (0.0%) | 0 (0.0%) |
| Health Diagnosing & Treating | 0 (0.0%) | 259 (100.0%) |
| Health Technologists | 0 (0.0%) | 39 (100.0%) |
| Total (Category) | 129 (23.5%) | 419 (76.5%) |
| Total (Overall) | 1,105 (41.1%) | 1,581 (58.9%) |
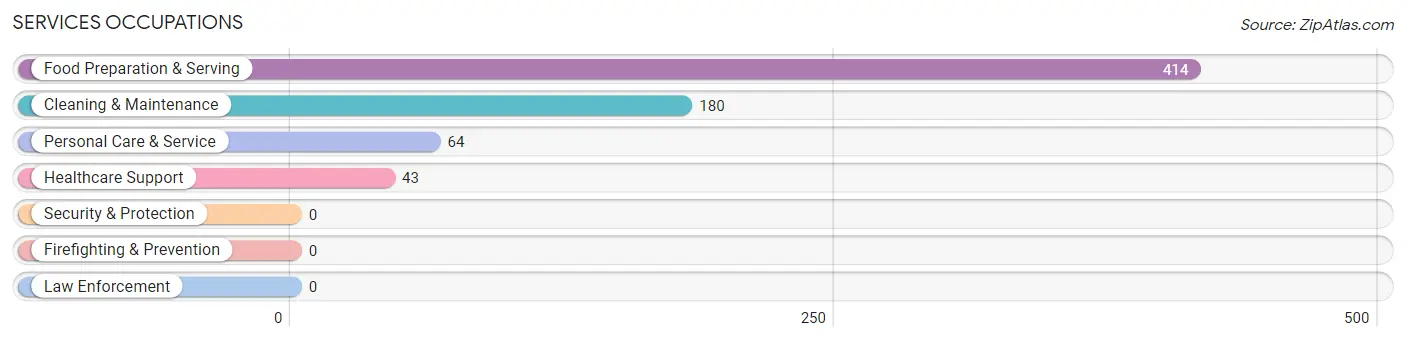
Services Occupations
The most common Services occupations in Lake City are Food Preparation & Serving (414 | 15.4%), Cleaning & Maintenance (180 | 6.7%), Personal Care & Service (64 | 2.4%), and Healthcare Support (43 | 1.6%).
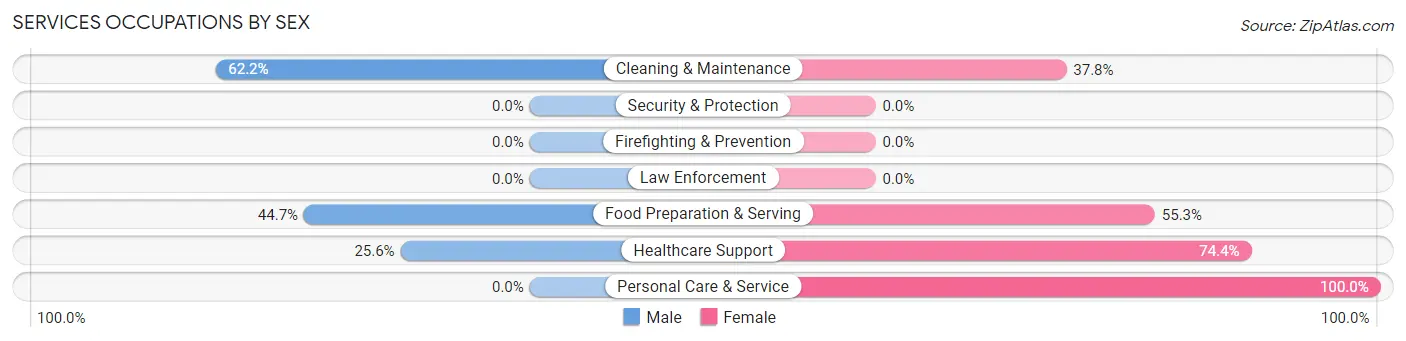
Services Occupations by Sex
Within the Services occupations in Lake City, the most male-oriented occupations are Cleaning & Maintenance (62.2%), Food Preparation & Serving (44.7%), and Healthcare Support (25.6%), while the most female-oriented occupations are Personal Care & Service (100.0%), Healthcare Support (74.4%), and Food Preparation & Serving (55.3%).
| Occupation | Male | Female |
| Healthcare Support | 11 (25.6%) | 32 (74.4%) |
| Security & Protection | 0 (0.0%) | 0 (0.0%) |
| Firefighting & Prevention | 0 (0.0%) | 0 (0.0%) |
| Law Enforcement | 0 (0.0%) | 0 (0.0%) |
| Food Preparation & Serving | 185 (44.7%) | 229 (55.3%) |
| Cleaning & Maintenance | 112 (62.2%) | 68 (37.8%) |
| Personal Care & Service | 0 (0.0%) | 64 (100.0%) |
| Total (Category) | 308 (43.9%) | 393 (56.1%) |
| Total (Overall) | 1,105 (41.1%) | 1,581 (58.9%) |
Sales and Office Occupations
The most common Sales and Office occupations in Lake City are Sales & Related (617 | 23.0%), and Office & Administration (361 | 13.4%).
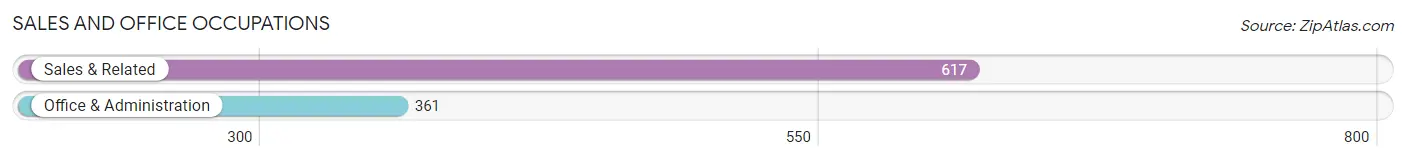
Sales and Office Occupations by Sex
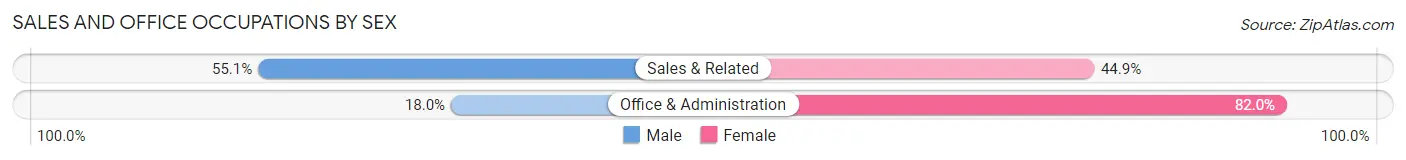
| Occupation | Male | Female |
| Sales & Related | 340 (55.1%) | 277 (44.9%) |
| Office & Administration | 65 (18.0%) | 296 (82.0%) |
| Total (Category) | 405 (41.4%) | 573 (58.6%) |
| Total (Overall) | 1,105 (41.1%) | 1,581 (58.9%) |
Natural Resources, Construction and Maintenance Occupations
The most common Natural Resources, Construction and Maintenance occupations in Lake City are , and Construction & Extraction (58 | 2.2%).
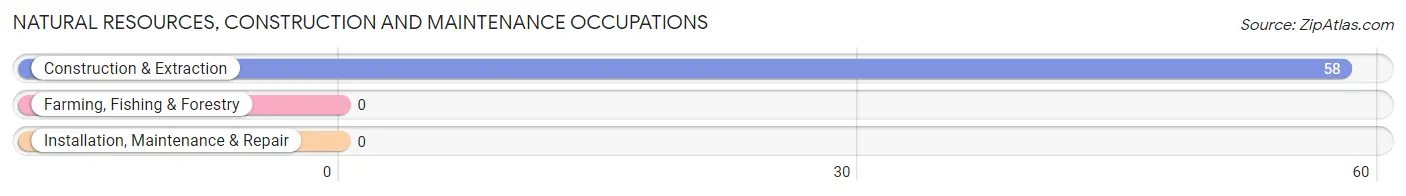
Natural Resources, Construction and Maintenance Occupations by Sex
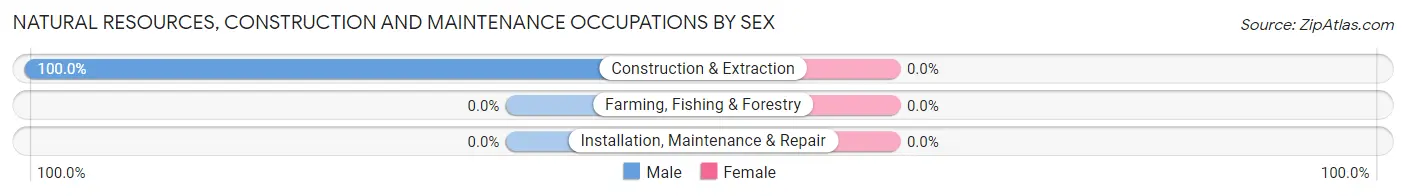
| Occupation | Male | Female |
| Farming, Fishing & Forestry | 0 (0.0%) | 0 (0.0%) |
| Construction & Extraction | 58 (100.0%) | 0 (0.0%) |
| Installation, Maintenance & Repair | 0 (0.0%) | 0 (0.0%) |
| Total (Category) | 58 (100.0%) | 0 (0.0%) |
| Total (Overall) | 1,105 (41.1%) | 1,581 (58.9%) |
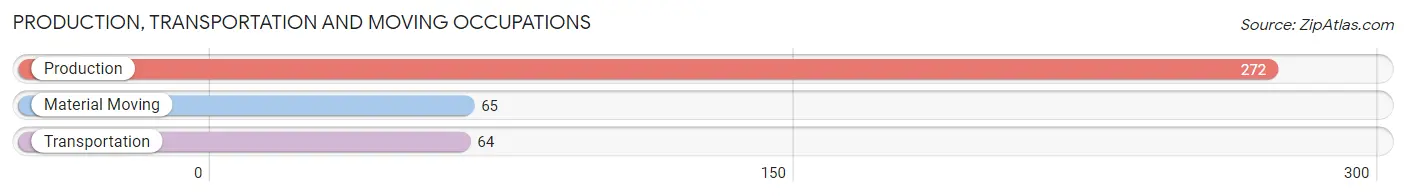
Production, Transportation and Moving Occupations
The most common Production, Transportation and Moving occupations in Lake City are Production (272 | 10.1%), Material Moving (65 | 2.4%), and Transportation (64 | 2.4%).
Production, Transportation and Moving Occupations by Sex
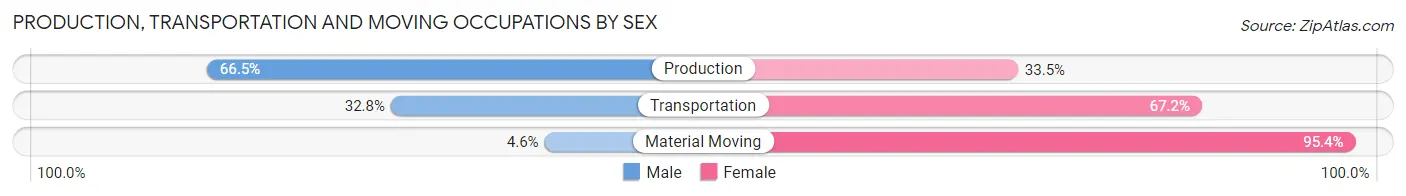
| Occupation | Male | Female |
| Production | 181 (66.5%) | 91 (33.5%) |
| Transportation | 21 (32.8%) | 43 (67.2%) |
| Material Moving | 3 (4.6%) | 62 (95.4%) |
| Total (Category) | 205 (51.1%) | 196 (48.9%) |
| Total (Overall) | 1,105 (41.1%) | 1,581 (58.9%) |
Employment Industries by Sex in Lake City
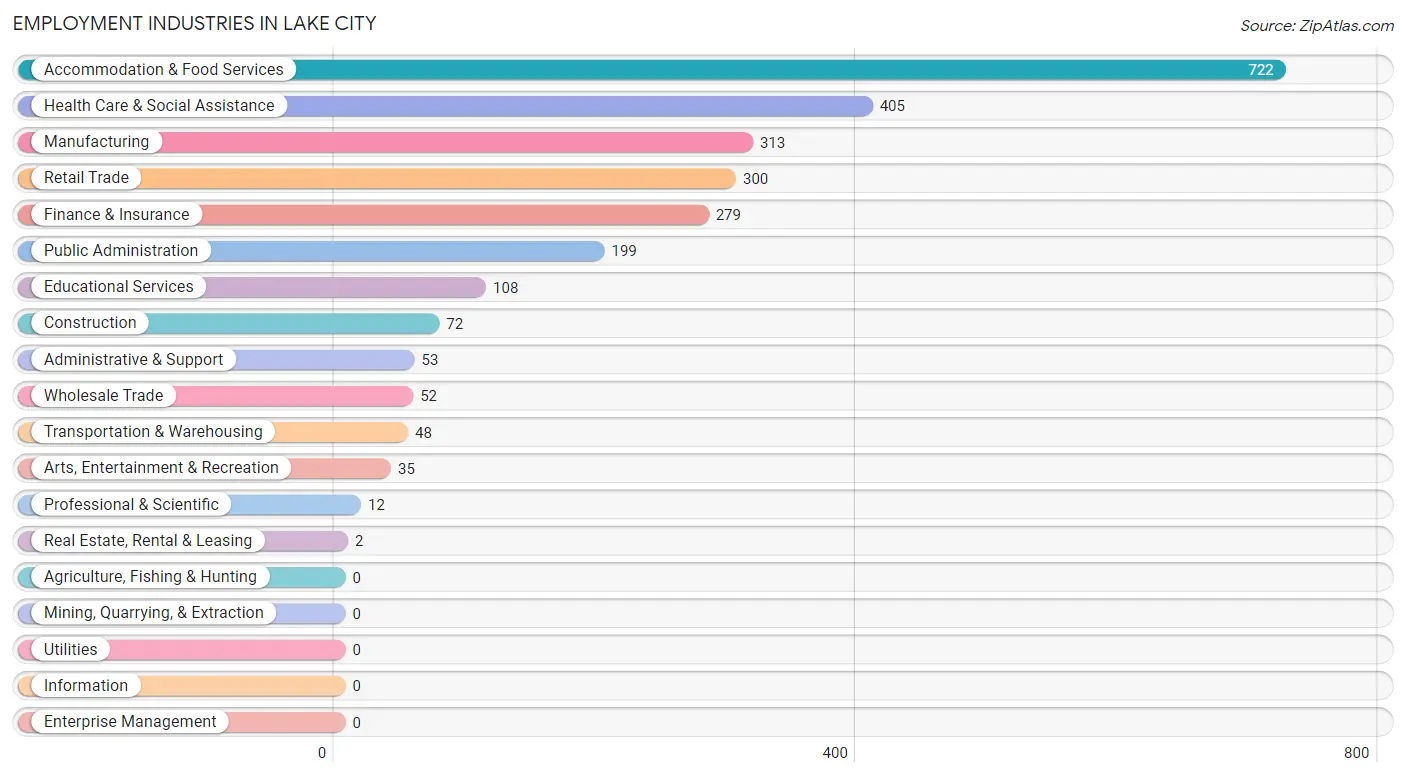
Employment Industries in Lake City
The major employment industries in Lake City include Accommodation & Food Services (722 | 26.9%), Health Care & Social Assistance (405 | 15.1%), Manufacturing (313 | 11.7%), Retail Trade (300 | 11.2%), and Finance & Insurance (279 | 10.4%).
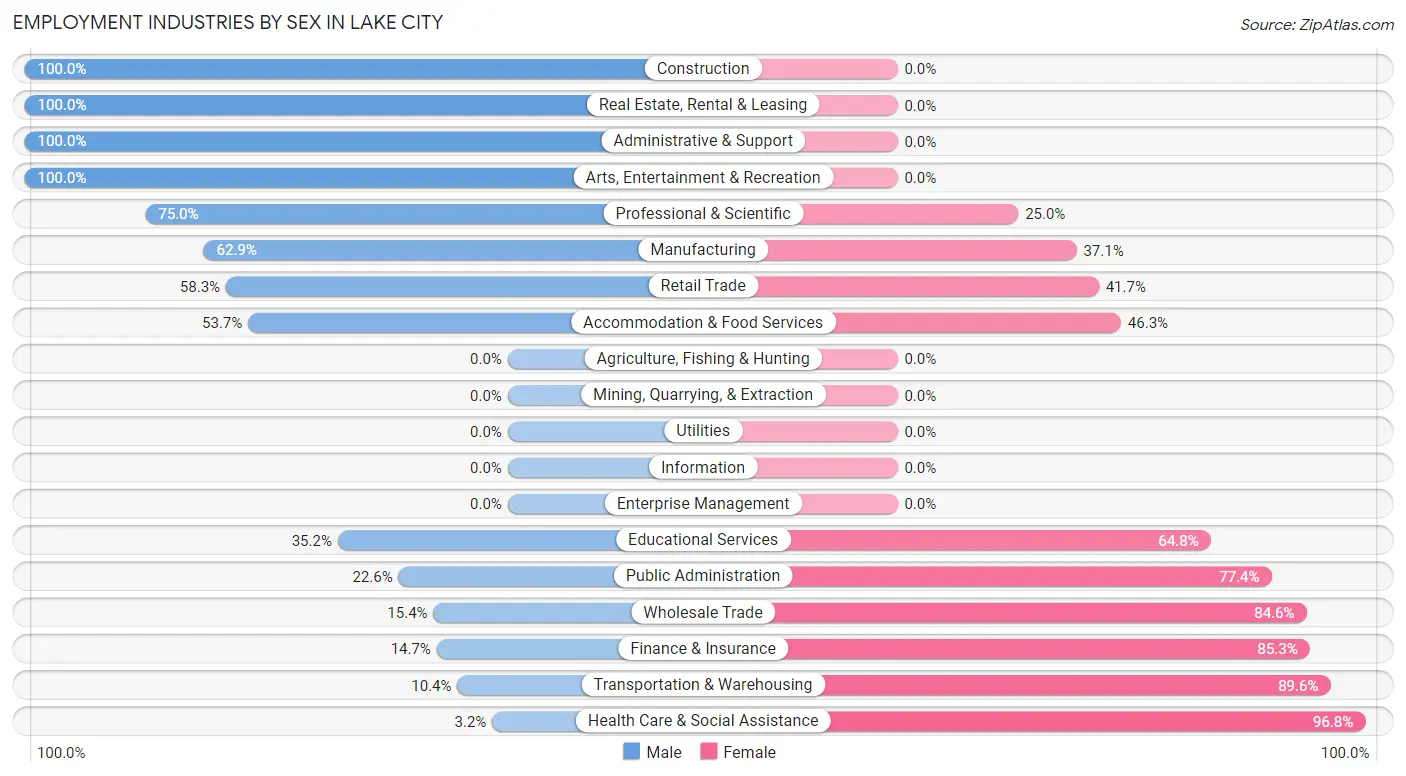
Employment Industries by Sex in Lake City
The Lake City industries that see more men than women are Construction (100.0%), Real Estate, Rental & Leasing (100.0%), and Administrative & Support (100.0%), whereas the industries that tend to have a higher number of women are Health Care & Social Assistance (96.8%), Transportation & Warehousing (89.6%), and Finance & Insurance (85.3%).
| Industry | Male | Female |
| Agriculture, Fishing & Hunting | 0 (0.0%) | 0 (0.0%) |
| Mining, Quarrying, & Extraction | 0 (0.0%) | 0 (0.0%) |
| Construction | 72 (100.0%) | 0 (0.0%) |
| Manufacturing | 197 (62.9%) | 116 (37.1%) |
| Wholesale Trade | 8 (15.4%) | 44 (84.6%) |
| Retail Trade | 175 (58.3%) | 125 (41.7%) |
| Transportation & Warehousing | 5 (10.4%) | 43 (89.6%) |
| Utilities | 0 (0.0%) | 0 (0.0%) |
| Information | 0 (0.0%) | 0 (0.0%) |
| Finance & Insurance | 41 (14.7%) | 238 (85.3%) |
| Real Estate, Rental & Leasing | 2 (100.0%) | 0 (0.0%) |
| Professional & Scientific | 9 (75.0%) | 3 (25.0%) |
| Enterprise Management | 0 (0.0%) | 0 (0.0%) |
| Administrative & Support | 53 (100.0%) | 0 (0.0%) |
| Educational Services | 38 (35.2%) | 70 (64.8%) |
| Health Care & Social Assistance | 13 (3.2%) | 392 (96.8%) |
| Arts, Entertainment & Recreation | 35 (100.0%) | 0 (0.0%) |
| Accommodation & Food Services | 388 (53.7%) | 334 (46.3%) |
| Public Administration | 45 (22.6%) | 154 (77.4%) |
| Total | 1,105 (41.1%) | 1,581 (58.9%) |
Education in Lake City
School Enrollment in Lake City
The most common levels of schooling among the 1,234 students in Lake City are high school (376 | 30.5%), elementary school (324 | 26.3%), and middle school (266 | 21.6%).
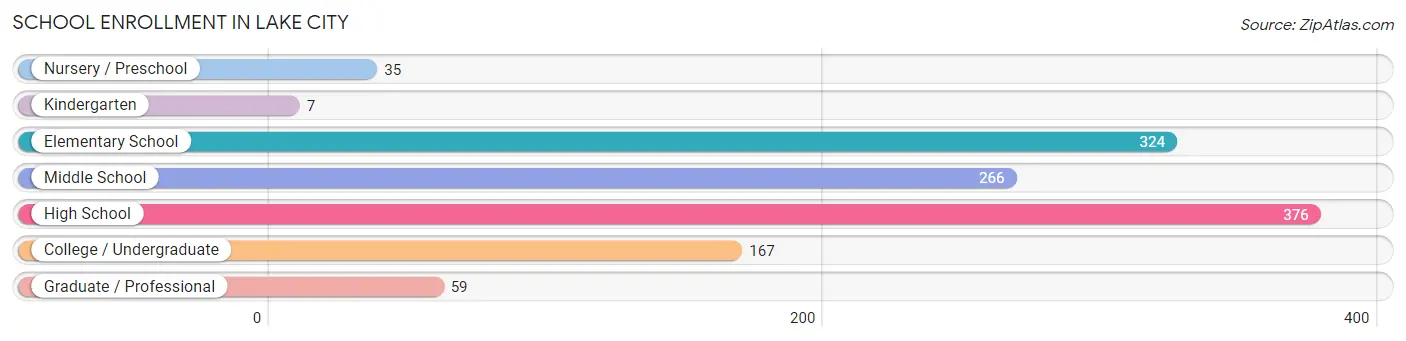
| School Level | # Students | % Students |
| Nursery / Preschool | 35 | 2.8% |
| Kindergarten | 7 | 0.6% |
| Elementary School | 324 | 26.3% |
| Middle School | 266 | 21.6% |
| High School | 376 | 30.5% |
| College / Undergraduate | 167 | 13.5% |
| Graduate / Professional | 59 | 4.8% |
| Total | 1,234 | 100.0% |
School Enrollment by Age by Funding Source in Lake City
Out of a total of 1,234 students who are enrolled in schools in Lake City, 80 (6.5%) attend a private institution, while the remaining 1,154 (93.5%) are enrolled in public schools. The age group of 3 to 4 year olds has the highest likelihood of being enrolled in private schools, with 25 (71.4% in the age bracket) enrolled. Conversely, the age group of 5 to 9 year old has the lowest likelihood of being enrolled in a private school, with 169 (100.0% in the age bracket) attending a public institution.
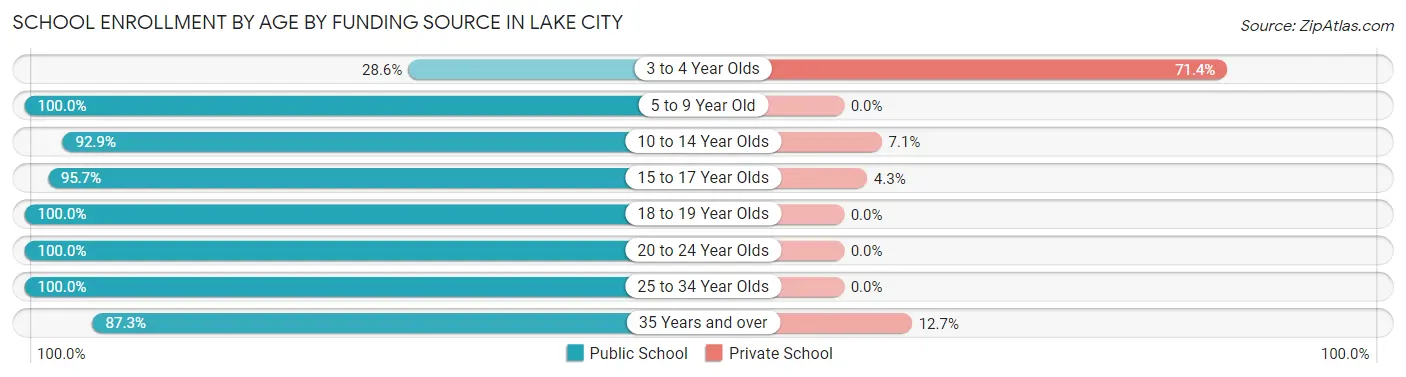
| Age Bracket | Public School | Private School |
| 3 to 4 Year Olds | 10 (28.6%) | 25 (71.4%) |
| 5 to 9 Year Old | 169 (100.0%) | 0 (0.0%) |
| 10 to 14 Year Olds | 355 (92.9%) | 27 (7.1%) |
| 15 to 17 Year Olds | 221 (95.7%) | 10 (4.3%) |
| 18 to 19 Year Olds | 39 (100.0%) | 0 (0.0%) |
| 20 to 24 Year Olds | 220 (100.0%) | 0 (0.0%) |
| 25 to 34 Year Olds | 16 (100.0%) | 0 (0.0%) |
| 35 Years and over | 124 (87.3%) | 18 (12.7%) |
| Total | 1,154 (93.5%) | 80 (6.5%) |
Educational Attainment by Field of Study in Lake City
Education (215 | 22.4%), psychology (206 | 21.4%), business (109 | 11.3%), physical & health sciences (100 | 10.4%), and arts & humanities (60 | 6.2%) are the most common fields of study among 961 individuals in Lake City who have obtained a bachelor's degree or higher.
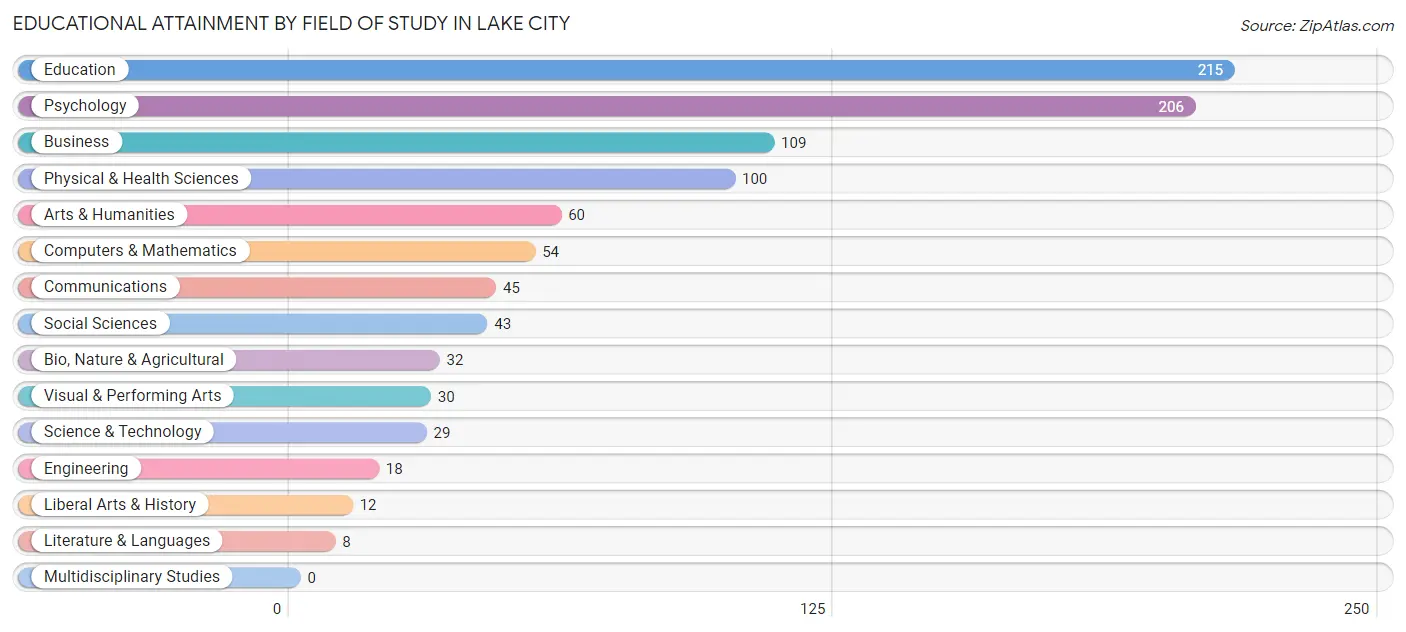
| Field of Study | # Graduates | % Graduates |
| Computers & Mathematics | 54 | 5.6% |
| Bio, Nature & Agricultural | 32 | 3.3% |
| Physical & Health Sciences | 100 | 10.4% |
| Psychology | 206 | 21.4% |
| Social Sciences | 43 | 4.5% |
| Engineering | 18 | 1.9% |
| Multidisciplinary Studies | 0 | 0.0% |
| Science & Technology | 29 | 3.0% |
| Business | 109 | 11.3% |
| Education | 215 | 22.4% |
| Literature & Languages | 8 | 0.8% |
| Liberal Arts & History | 12 | 1.3% |
| Visual & Performing Arts | 30 | 3.1% |
| Communications | 45 | 4.7% |
| Arts & Humanities | 60 | 6.2% |
| Total | 961 | 100.0% |
Transportation & Commute in Lake City
Vehicle Availability by Sex in Lake City
The most prevalent vehicle ownership categories in Lake City are males with 2 vehicles (580, accounting for 53.7%) and females with 2 vehicles (636, making up 36.7%).
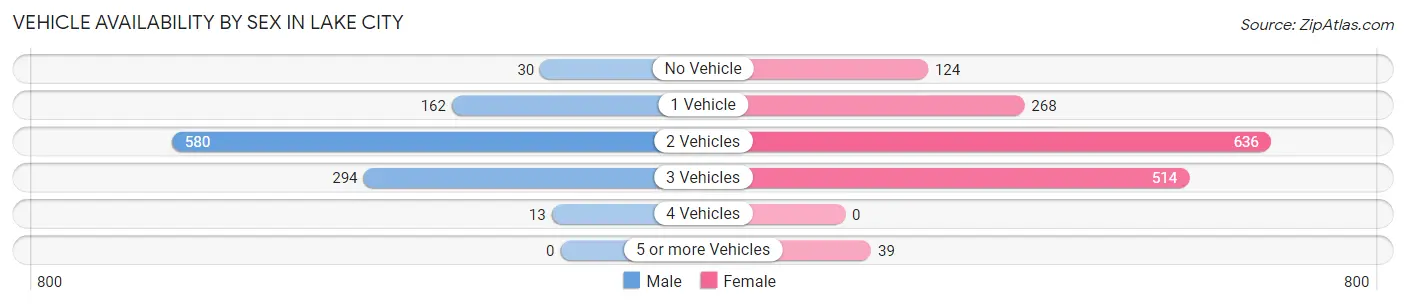
| Vehicles Available | Male | Female |
| No Vehicle | 30 (2.8%) | 124 (7.8%) |
| 1 Vehicle | 162 (15.0%) | 268 (17.0%) |
| 2 Vehicles | 580 (53.7%) | 636 (40.2%) |
| 3 Vehicles | 294 (27.3%) | 514 (32.5%) |
| 4 Vehicles | 13 (1.2%) | 0 (0.0%) |
| 5 or more Vehicles | 0 (0.0%) | 39 (2.5%) |
| Total | 1,079 (100.0%) | 1,581 (100.0%) |
Commute Time in Lake City
The most frequently occuring commute durations in Lake City are 10 to 14 minutes (701 commuters, 26.7%), 5 to 9 minutes (511 commuters, 19.5%), and 30 to 34 minutes (309 commuters, 11.8%).
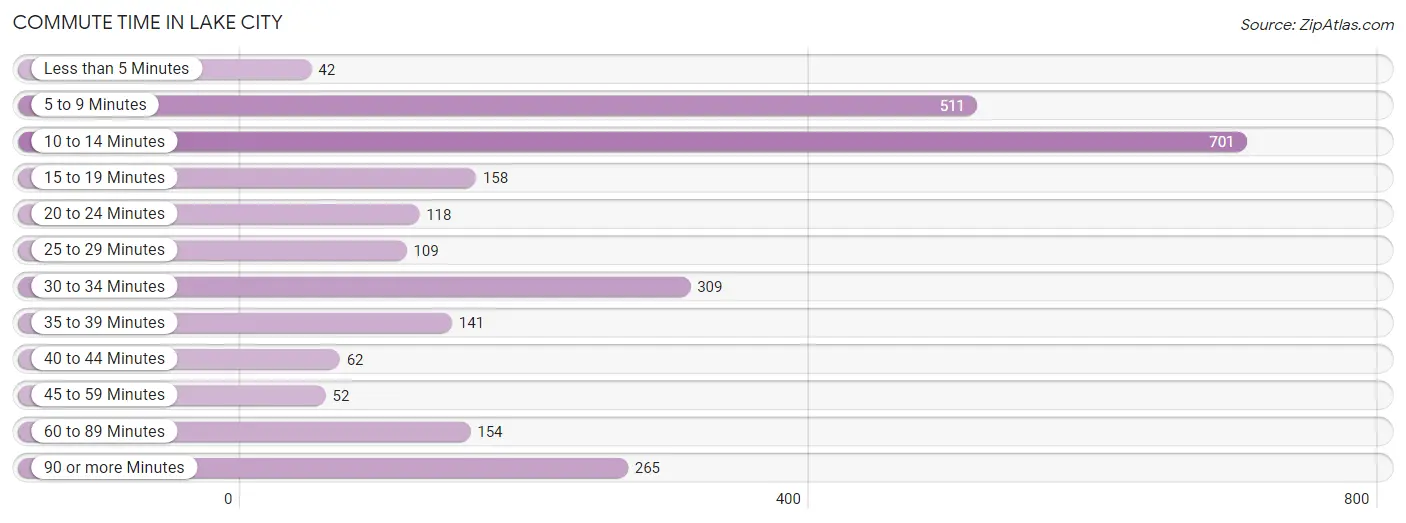
| Commute Time | # Commuters | % Commuters |
| Less than 5 Minutes | 42 | 1.6% |
| 5 to 9 Minutes | 511 | 19.5% |
| 10 to 14 Minutes | 701 | 26.7% |
| 15 to 19 Minutes | 158 | 6.0% |
| 20 to 24 Minutes | 118 | 4.5% |
| 25 to 29 Minutes | 109 | 4.2% |
| 30 to 34 Minutes | 309 | 11.8% |
| 35 to 39 Minutes | 141 | 5.4% |
| 40 to 44 Minutes | 62 | 2.4% |
| 45 to 59 Minutes | 52 | 2.0% |
| 60 to 89 Minutes | 154 | 5.9% |
| 90 or more Minutes | 265 | 10.1% |
Commute Time by Sex in Lake City
The most common commute times in Lake City are 10 to 14 minutes (333 commuters, 32.0%) for males and 5 to 9 minutes (375 commuters, 23.7%) for females.
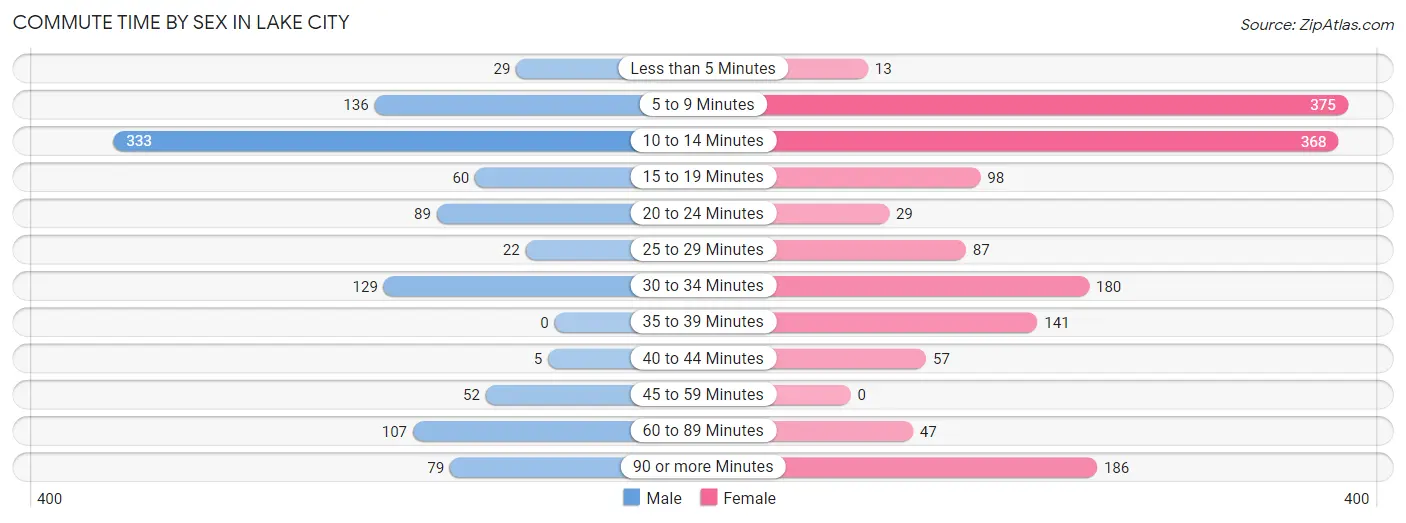
| Commute Time | Male | Female |
| Less than 5 Minutes | 29 (2.8%) | 13 (0.8%) |
| 5 to 9 Minutes | 136 (13.1%) | 375 (23.7%) |
| 10 to 14 Minutes | 333 (32.0%) | 368 (23.3%) |
| 15 to 19 Minutes | 60 (5.8%) | 98 (6.2%) |
| 20 to 24 Minutes | 89 (8.6%) | 29 (1.8%) |
| 25 to 29 Minutes | 22 (2.1%) | 87 (5.5%) |
| 30 to 34 Minutes | 129 (12.4%) | 180 (11.4%) |
| 35 to 39 Minutes | 0 (0.0%) | 141 (8.9%) |
| 40 to 44 Minutes | 5 (0.5%) | 57 (3.6%) |
| 45 to 59 Minutes | 52 (5.0%) | 0 (0.0%) |
| 60 to 89 Minutes | 107 (10.3%) | 47 (3.0%) |
| 90 or more Minutes | 79 (7.6%) | 186 (11.8%) |
Time of Departure to Work by Sex in Lake City
The most frequent times of departure to work in Lake City are 7:00 AM to 7:29 AM (236, 22.7%) for males and 8:00 AM to 8:29 AM (275, 17.4%) for females.
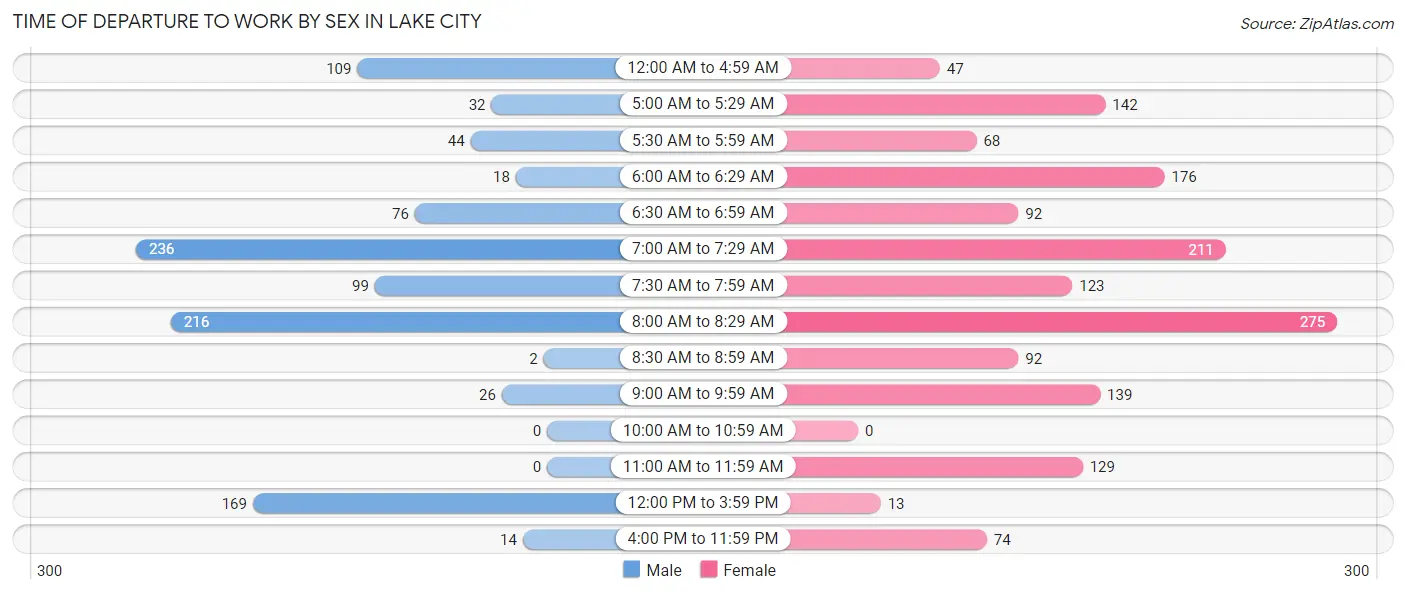
| Time of Departure | Male | Female |
| 12:00 AM to 4:59 AM | 109 (10.5%) | 47 (3.0%) |
| 5:00 AM to 5:29 AM | 32 (3.1%) | 142 (9.0%) |
| 5:30 AM to 5:59 AM | 44 (4.2%) | 68 (4.3%) |
| 6:00 AM to 6:29 AM | 18 (1.7%) | 176 (11.1%) |
| 6:30 AM to 6:59 AM | 76 (7.3%) | 92 (5.8%) |
| 7:00 AM to 7:29 AM | 236 (22.7%) | 211 (13.4%) |
| 7:30 AM to 7:59 AM | 99 (9.5%) | 123 (7.8%) |
| 8:00 AM to 8:29 AM | 216 (20.7%) | 275 (17.4%) |
| 8:30 AM to 8:59 AM | 2 (0.2%) | 92 (5.8%) |
| 9:00 AM to 9:59 AM | 26 (2.5%) | 139 (8.8%) |
| 10:00 AM to 10:59 AM | 0 (0.0%) | 0 (0.0%) |
| 11:00 AM to 11:59 AM | 0 (0.0%) | 129 (8.2%) |
| 12:00 PM to 3:59 PM | 169 (16.2%) | 13 (0.8%) |
| 4:00 PM to 11:59 PM | 14 (1.3%) | 74 (4.7%) |
| Total | 1,041 (100.0%) | 1,581 (100.0%) |
Housing Occupancy in Lake City
Occupancy by Ownership in Lake City
Of the total 2,426 dwellings in Lake City, owner-occupied units account for 1,076 (44.4%), while renter-occupied units make up 1,350 (55.6%).
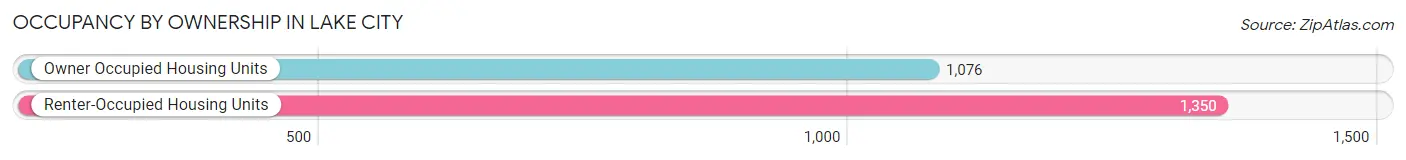
| Occupancy | # Housing Units | % Housing Units |
| Owner Occupied Housing Units | 1,076 | 44.4% |
| Renter-Occupied Housing Units | 1,350 | 55.6% |
| Total Occupied Housing Units | 2,426 | 100.0% |
Occupancy by Household Size in Lake City
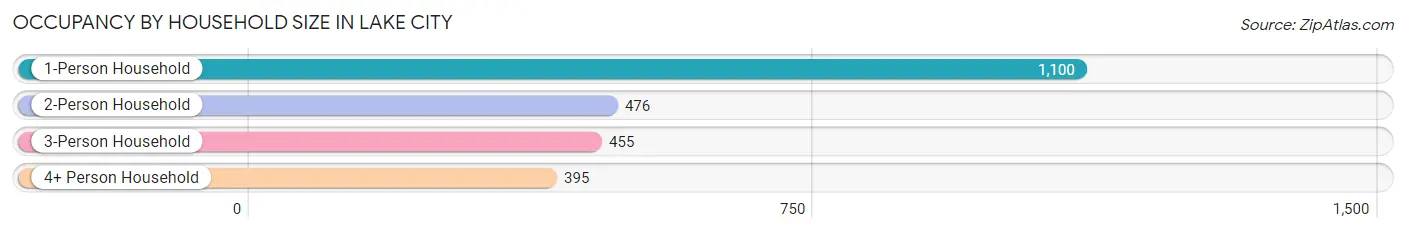
| Household Size | # Housing Units | % Housing Units |
| 1-Person Household | 1,100 | 45.3% |
| 2-Person Household | 476 | 19.6% |
| 3-Person Household | 455 | 18.8% |
| 4+ Person Household | 395 | 16.3% |
| Total Housing Units | 2,426 | 100.0% |
Occupancy by Ownership by Household Size in Lake City
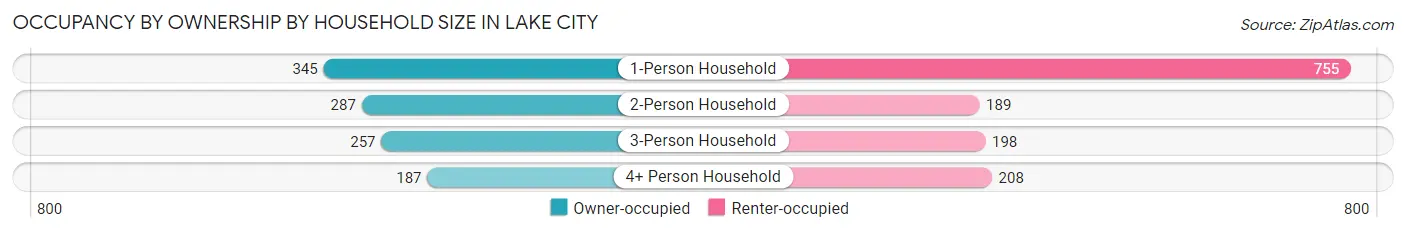
| Household Size | Owner-occupied | Renter-occupied |
| 1-Person Household | 345 (31.4%) | 755 (68.6%) |
| 2-Person Household | 287 (60.3%) | 189 (39.7%) |
| 3-Person Household | 257 (56.5%) | 198 (43.5%) |
| 4+ Person Household | 187 (47.3%) | 208 (52.7%) |
| Total Housing Units | 1,076 (44.4%) | 1,350 (55.6%) |
Occupancy by Educational Attainment in Lake City
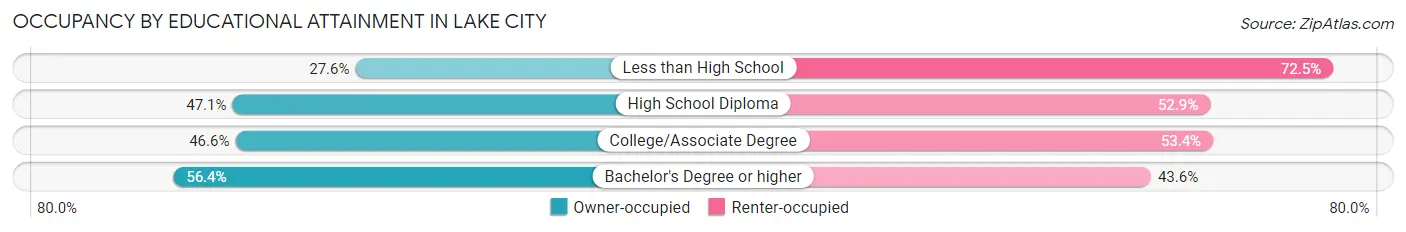
| Household Size | Owner-occupied | Renter-occupied |
| Less than High School | 162 (27.6%) | 426 (72.5%) |
| High School Diploma | 408 (47.1%) | 459 (52.9%) |
| College/Associate Degree | 198 (46.6%) | 227 (53.4%) |
| Bachelor's Degree or higher | 308 (56.4%) | 238 (43.6%) |
Occupancy by Age of Householder in Lake City
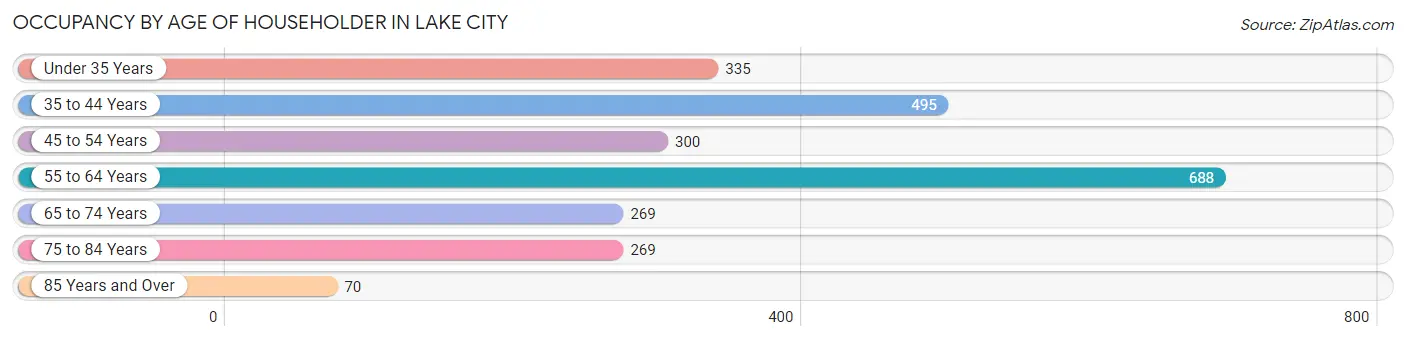
| Age Bracket | # Households | % Households |
| Under 35 Years | 335 | 13.8% |
| 35 to 44 Years | 495 | 20.4% |
| 45 to 54 Years | 300 | 12.4% |
| 55 to 64 Years | 688 | 28.4% |
| 65 to 74 Years | 269 | 11.1% |
| 75 to 84 Years | 269 | 11.1% |
| 85 Years and Over | 70 | 2.9% |
| Total | 2,426 | 100.0% |
Housing Finances in Lake City
Median Income by Occupancy in Lake City
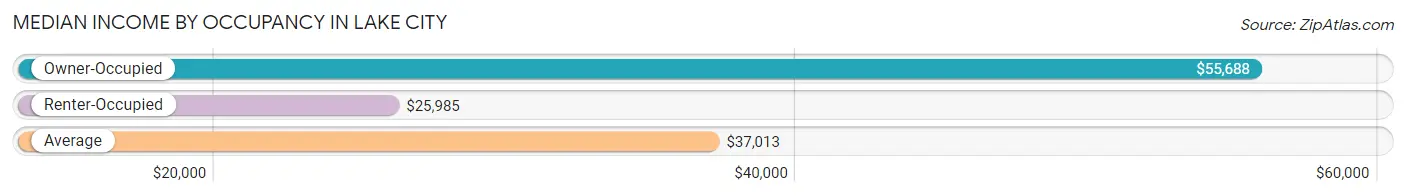
| Occupancy Type | # Households | Median Income |
| Owner-Occupied | 1,076 (44.4%) | $55,688 |
| Renter-Occupied | 1,350 (55.6%) | $25,985 |
| Average | 2,426 (100.0%) | $37,013 |
Occupancy by Householder Income Bracket in Lake City
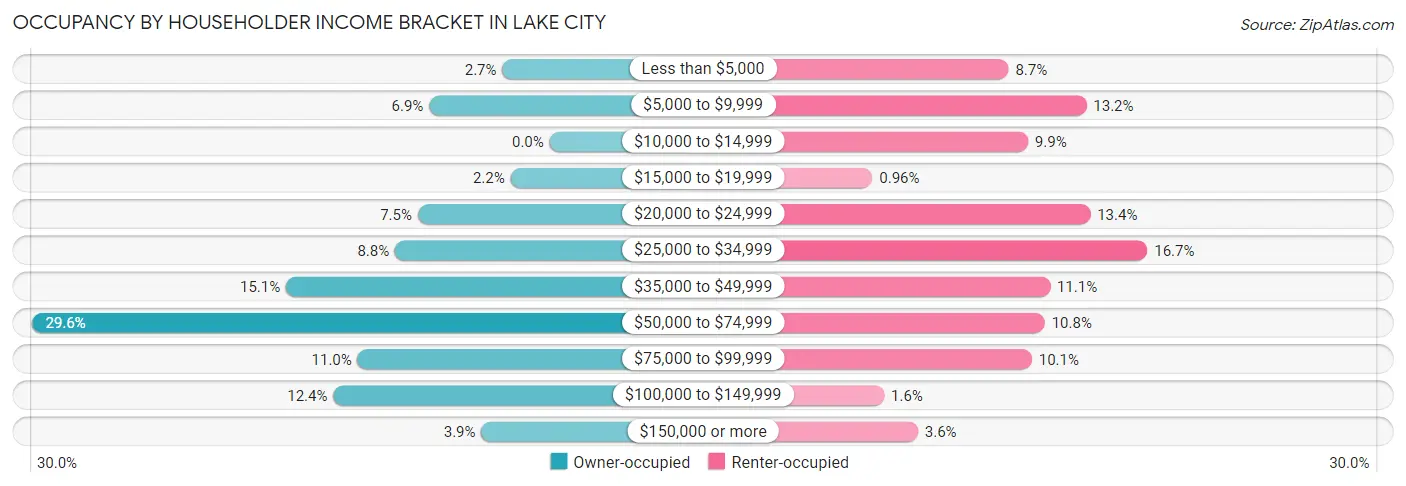
| Income Bracket | Owner-occupied | Renter-occupied |
| Less than $5,000 | 29 (2.7%) | 118 (8.7%) |
| $5,000 to $9,999 | 74 (6.9%) | 178 (13.2%) |
| $10,000 to $14,999 | 0 (0.0%) | 133 (9.9%) |
| $15,000 to $19,999 | 24 (2.2%) | 13 (1.0%) |
| $20,000 to $24,999 | 81 (7.5%) | 181 (13.4%) |
| $25,000 to $34,999 | 95 (8.8%) | 225 (16.7%) |
| $35,000 to $49,999 | 162 (15.1%) | 150 (11.1%) |
| $50,000 to $74,999 | 318 (29.5%) | 146 (10.8%) |
| $75,000 to $99,999 | 118 (11.0%) | 136 (10.1%) |
| $100,000 to $149,999 | 133 (12.4%) | 22 (1.6%) |
| $150,000 or more | 42 (3.9%) | 48 (3.6%) |
| Total | 1,076 (100.0%) | 1,350 (100.0%) |
Monthly Housing Cost Tiers in Lake City
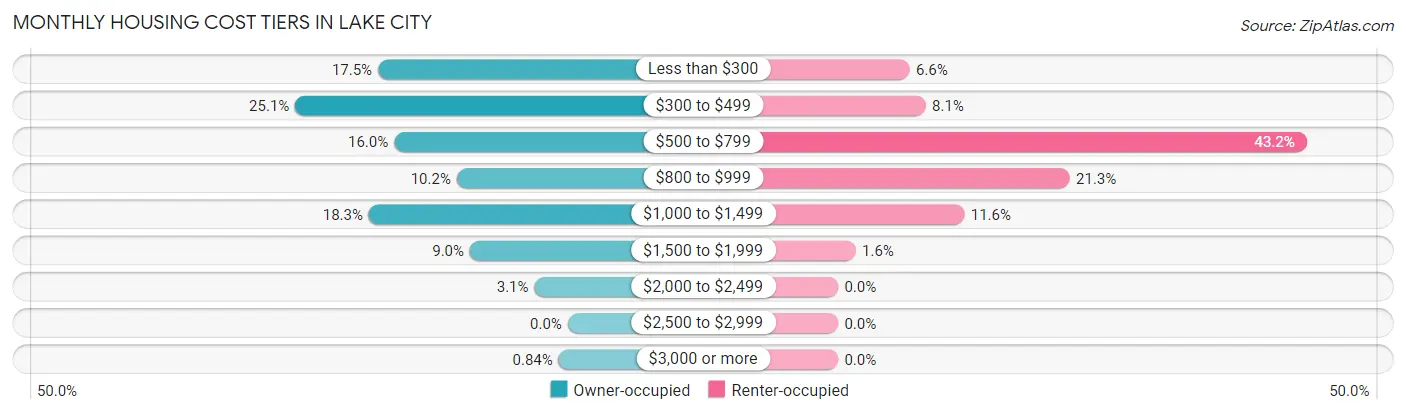
| Monthly Cost | Owner-occupied | Renter-occupied |
| Less than $300 | 188 (17.5%) | 89 (6.6%) |
| $300 to $499 | 270 (25.1%) | 109 (8.1%) |
| $500 to $799 | 172 (16.0%) | 583 (43.2%) |
| $800 to $999 | 110 (10.2%) | 288 (21.3%) |
| $1,000 to $1,499 | 197 (18.3%) | 157 (11.6%) |
| $1,500 to $1,999 | 97 (9.0%) | 22 (1.6%) |
| $2,000 to $2,499 | 33 (3.1%) | 0 (0.0%) |
| $2,500 to $2,999 | 0 (0.0%) | 0 (0.0%) |
| $3,000 or more | 9 (0.8%) | 0 (0.0%) |
| Total | 1,076 (100.0%) | 1,350 (100.0%) |
Physical Housing Characteristics in Lake City
Housing Structures in Lake City
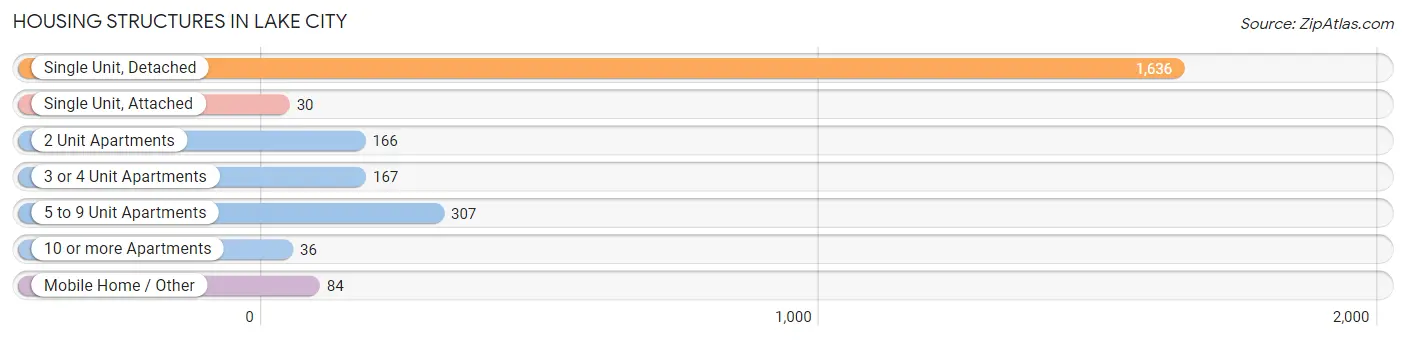
| Structure Type | # Housing Units | % Housing Units |
| Single Unit, Detached | 1,636 | 67.4% |
| Single Unit, Attached | 30 | 1.2% |
| 2 Unit Apartments | 166 | 6.8% |
| 3 or 4 Unit Apartments | 167 | 6.9% |
| 5 to 9 Unit Apartments | 307 | 12.7% |
| 10 or more Apartments | 36 | 1.5% |
| Mobile Home / Other | 84 | 3.5% |
| Total | 2,426 | 100.0% |
Housing Structures by Occupancy in Lake City
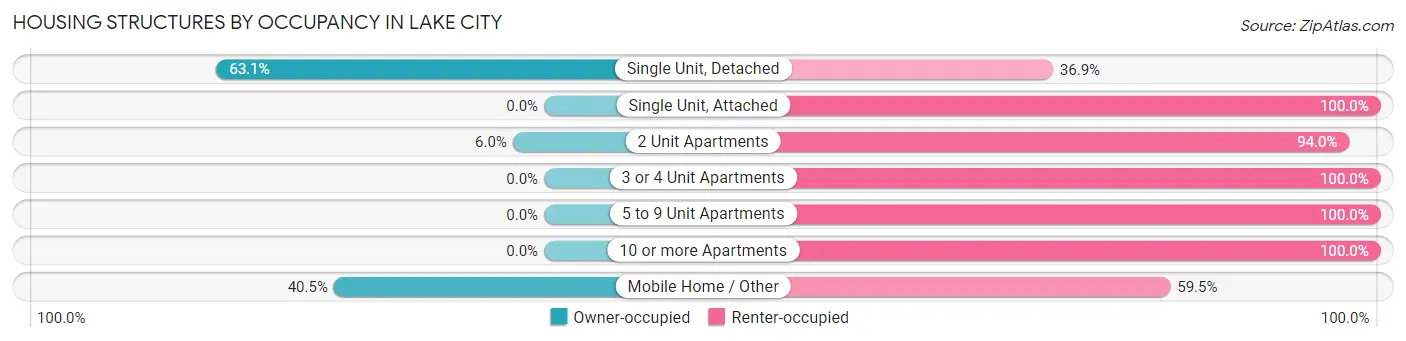
| Structure Type | Owner-occupied | Renter-occupied |
| Single Unit, Detached | 1,032 (63.1%) | 604 (36.9%) |
| Single Unit, Attached | 0 (0.0%) | 30 (100.0%) |
| 2 Unit Apartments | 10 (6.0%) | 156 (94.0%) |
| 3 or 4 Unit Apartments | 0 (0.0%) | 167 (100.0%) |
| 5 to 9 Unit Apartments | 0 (0.0%) | 307 (100.0%) |
| 10 or more Apartments | 0 (0.0%) | 36 (100.0%) |
| Mobile Home / Other | 34 (40.5%) | 50 (59.5%) |
| Total | 1,076 (44.4%) | 1,350 (55.6%) |
Housing Structures by Number of Rooms in Lake City
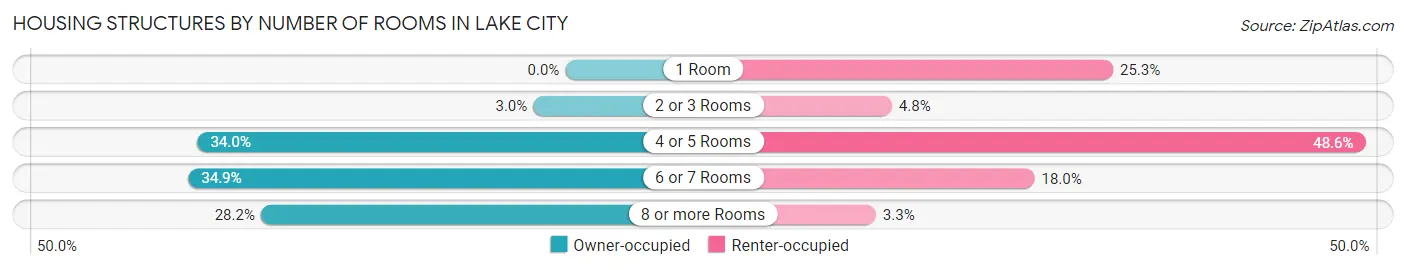
| Number of Rooms | Owner-occupied | Renter-occupied |
| 1 Room | 0 (0.0%) | 341 (25.3%) |
| 2 or 3 Rooms | 32 (3.0%) | 65 (4.8%) |
| 4 or 5 Rooms | 366 (34.0%) | 656 (48.6%) |
| 6 or 7 Rooms | 375 (34.8%) | 243 (18.0%) |
| 8 or more Rooms | 303 (28.2%) | 45 (3.3%) |
| Total | 1,076 (100.0%) | 1,350 (100.0%) |
Housing Structure by Heating Type in Lake City
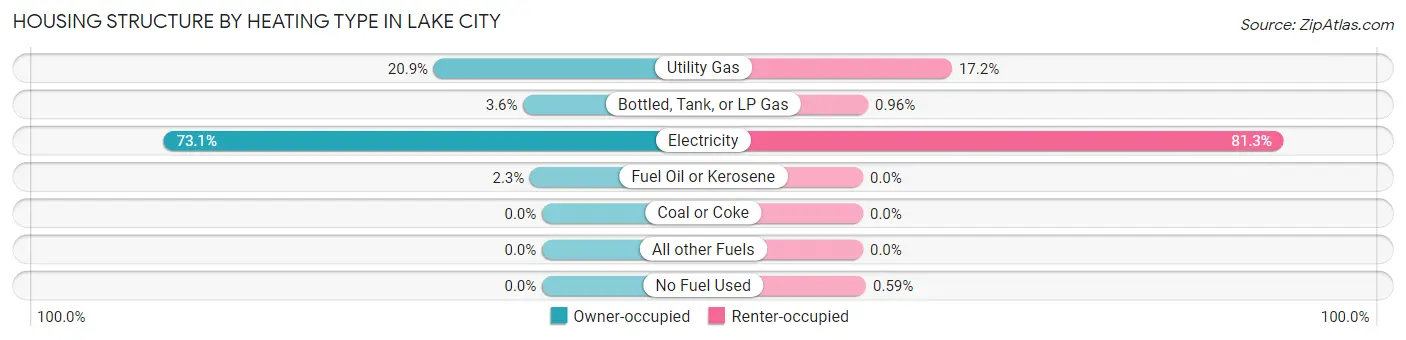
| Heating Type | Owner-occupied | Renter-occupied |
| Utility Gas | 225 (20.9%) | 232 (17.2%) |
| Bottled, Tank, or LP Gas | 39 (3.6%) | 13 (1.0%) |
| Electricity | 787 (73.1%) | 1,097 (81.3%) |
| Fuel Oil or Kerosene | 25 (2.3%) | 0 (0.0%) |
| Coal or Coke | 0 (0.0%) | 0 (0.0%) |
| All other Fuels | 0 (0.0%) | 0 (0.0%) |
| No Fuel Used | 0 (0.0%) | 8 (0.6%) |
| Total | 1,076 (100.0%) | 1,350 (100.0%) |
Household Vehicle Usage in Lake City
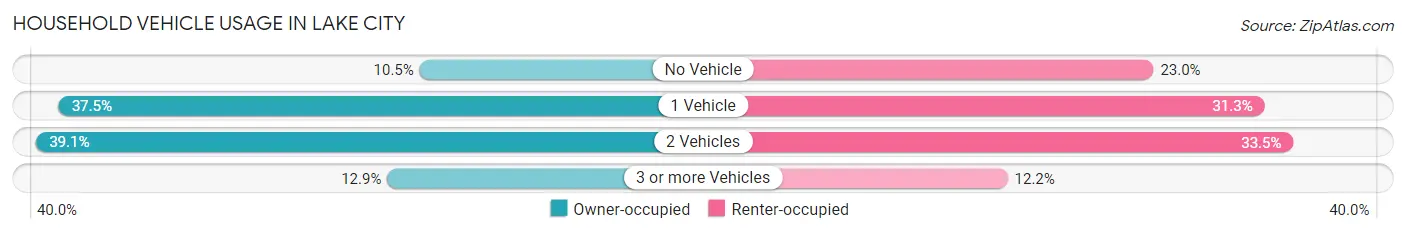
| Vehicles per Household | Owner-occupied | Renter-occupied |
| No Vehicle | 113 (10.5%) | 311 (23.0%) |
| 1 Vehicle | 403 (37.4%) | 423 (31.3%) |
| 2 Vehicles | 421 (39.1%) | 452 (33.5%) |
| 3 or more Vehicles | 139 (12.9%) | 164 (12.1%) |
| Total | 1,076 (100.0%) | 1,350 (100.0%) |
Real Estate & Mortgages in Lake City
Real Estate and Mortgage Overview in Lake City
| Characteristic | Without Mortgage | With Mortgage |
| Housing Units | 537 | 539 |
| Median Property Value | $103,800 | $150,700 |
| Median Household Income | $55,615 | $42 |
| Monthly Housing Costs | $331 | $9 |
| Real Estate Taxes | $522 | $0 |
Property Value by Mortgage Status in Lake City
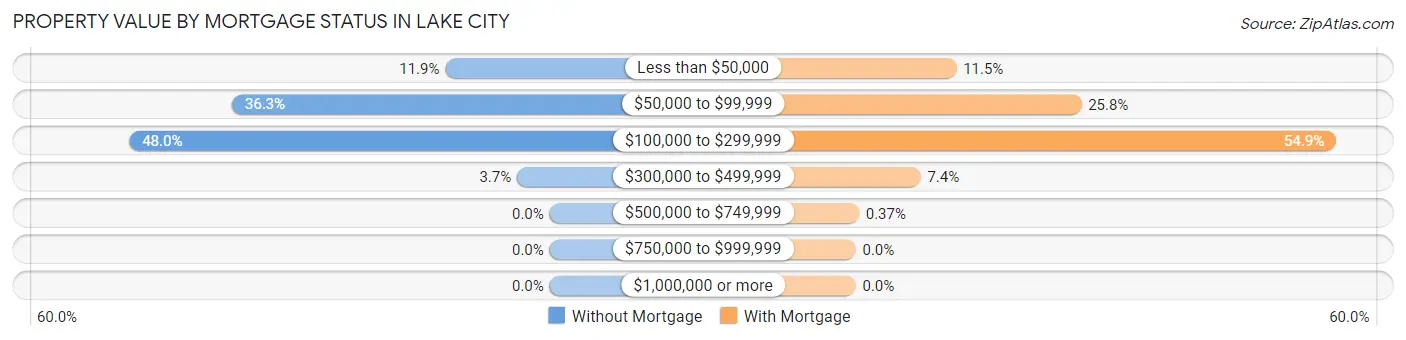
| Property Value | Without Mortgage | With Mortgage |
| Less than $50,000 | 64 (11.9%) | 62 (11.5%) |
| $50,000 to $99,999 | 195 (36.3%) | 139 (25.8%) |
| $100,000 to $299,999 | 258 (48.0%) | 296 (54.9%) |
| $300,000 to $499,999 | 20 (3.7%) | 40 (7.4%) |
| $500,000 to $749,999 | 0 (0.0%) | 2 (0.4%) |
| $750,000 to $999,999 | 0 (0.0%) | 0 (0.0%) |
| $1,000,000 or more | 0 (0.0%) | 0 (0.0%) |
| Total | 537 (100.0%) | 539 (100.0%) |
Household Income by Mortgage Status in Lake City
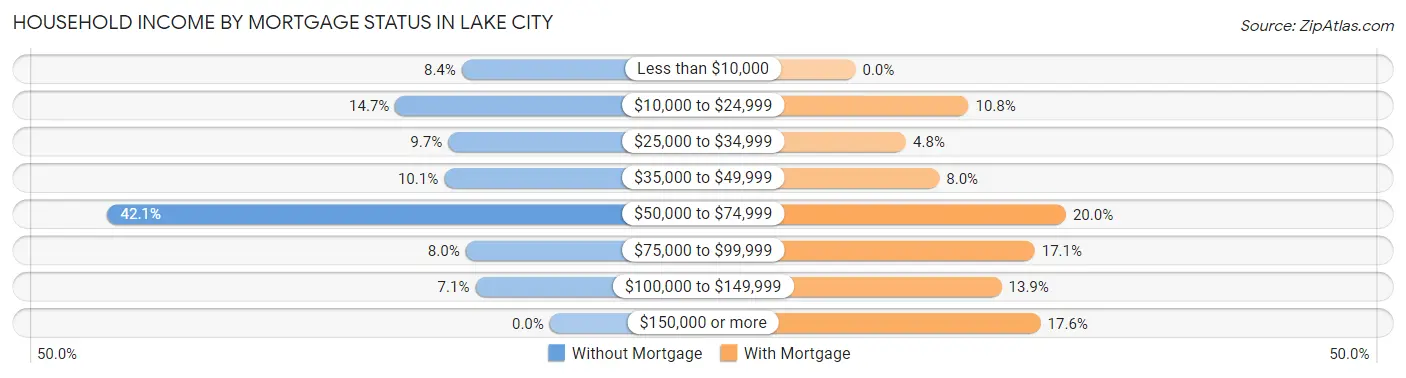
| Household Income | Without Mortgage | With Mortgage |
| Less than $10,000 | 45 (8.4%) | 0 (0.0%) |
| $10,000 to $24,999 | 79 (14.7%) | 58 (10.8%) |
| $25,000 to $34,999 | 52 (9.7%) | 26 (4.8%) |
| $35,000 to $49,999 | 54 (10.1%) | 43 (8.0%) |
| $50,000 to $74,999 | 226 (42.1%) | 108 (20.0%) |
| $75,000 to $99,999 | 43 (8.0%) | 92 (17.1%) |
| $100,000 to $149,999 | 38 (7.1%) | 75 (13.9%) |
| $150,000 or more | 0 (0.0%) | 95 (17.6%) |
| Total | 537 (100.0%) | 539 (100.0%) |
Property Value to Household Income Ratio in Lake City
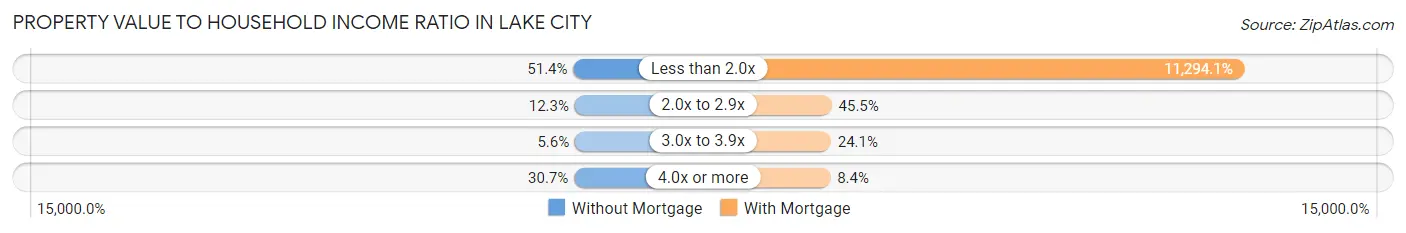
| Value-to-Income Ratio | Without Mortgage | With Mortgage |
| Less than 2.0x | 276 (51.4%) | 60,875 (11,294.1%) |
| 2.0x to 2.9x | 66 (12.3%) | 245 (45.5%) |
| 3.0x to 3.9x | 30 (5.6%) | 130 (24.1%) |
| 4.0x or more | 165 (30.7%) | 45 (8.4%) |
| Total | 537 (100.0%) | 539 (100.0%) |
Real Estate Taxes by Mortgage Status in Lake City
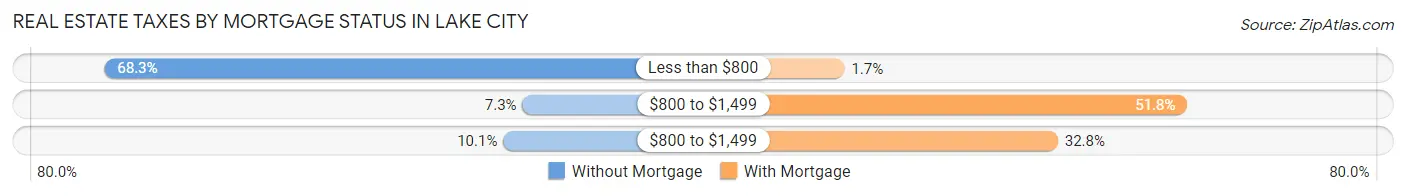
| Property Taxes | Without Mortgage | With Mortgage |
| Less than $800 | 367 (68.3%) | 9 (1.7%) |
| $800 to $1,499 | 39 (7.3%) | 279 (51.8%) |
| $800 to $1,499 | 54 (10.1%) | 177 (32.8%) |
| Total | 537 (100.0%) | 539 (100.0%) |
Health & Disability in Lake City
Health Insurance Coverage by Age in Lake City
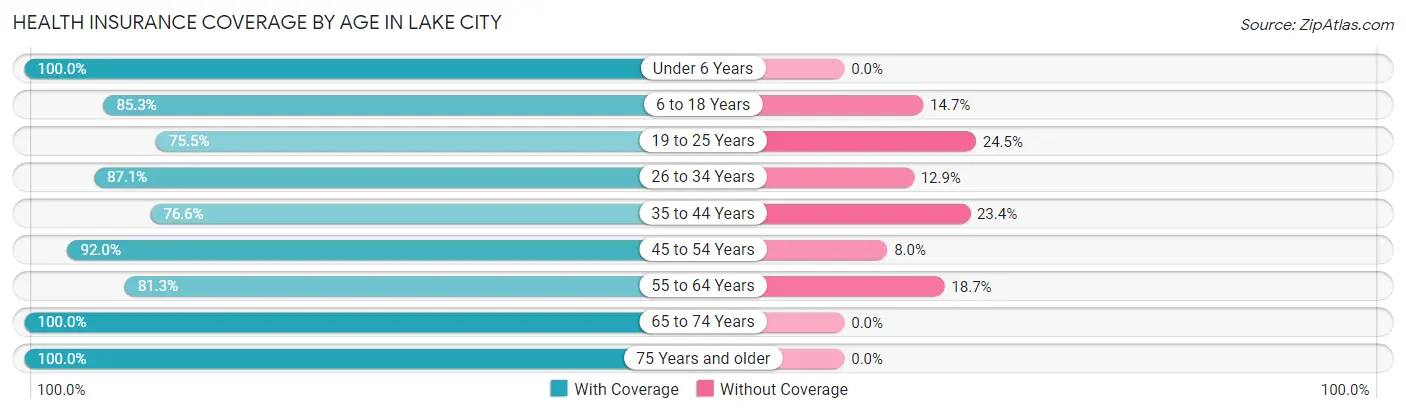
| Age Bracket | With Coverage | Without Coverage |
| Under 6 Years | 268 (100.0%) | 0 (0.0%) |
| 6 to 18 Years | 829 (85.3%) | 143 (14.7%) |
| 19 to 25 Years | 446 (75.5%) | 145 (24.5%) |
| 26 to 34 Years | 767 (87.1%) | 114 (12.9%) |
| 35 to 44 Years | 565 (76.6%) | 173 (23.4%) |
| 45 to 54 Years | 448 (92.0%) | 39 (8.0%) |
| 55 to 64 Years | 936 (81.3%) | 215 (18.7%) |
| 65 to 74 Years | 515 (100.0%) | 0 (0.0%) |
| 75 Years and older | 477 (100.0%) | 0 (0.0%) |
| Total | 5,251 (86.4%) | 829 (13.6%) |
Health Insurance Coverage by Citizenship Status in Lake City
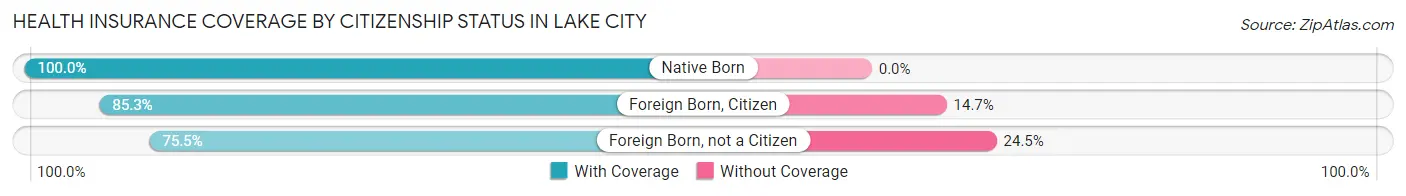
| Citizenship Status | With Coverage | Without Coverage |
| Native Born | 268 (100.0%) | 0 (0.0%) |
| Foreign Born, Citizen | 829 (85.3%) | 143 (14.7%) |
| Foreign Born, not a Citizen | 446 (75.5%) | 145 (24.5%) |
Health Insurance Coverage by Household Income in Lake City
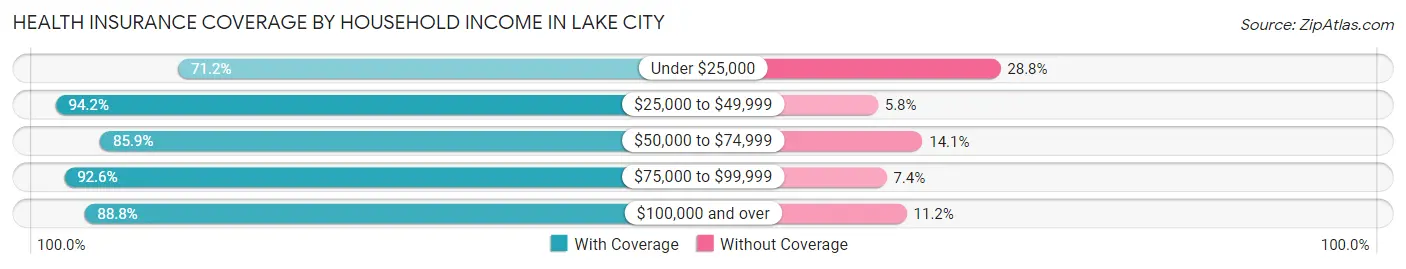
| Household Income | With Coverage | Without Coverage |
| Under $25,000 | 869 (71.2%) | 351 (28.8%) |
| $25,000 to $49,999 | 1,636 (94.2%) | 101 (5.8%) |
| $50,000 to $74,999 | 1,494 (85.9%) | 246 (14.1%) |
| $75,000 to $99,999 | 523 (92.6%) | 42 (7.4%) |
| $100,000 and over | 705 (88.8%) | 89 (11.2%) |
Public vs Private Health Insurance Coverage by Age in Lake City
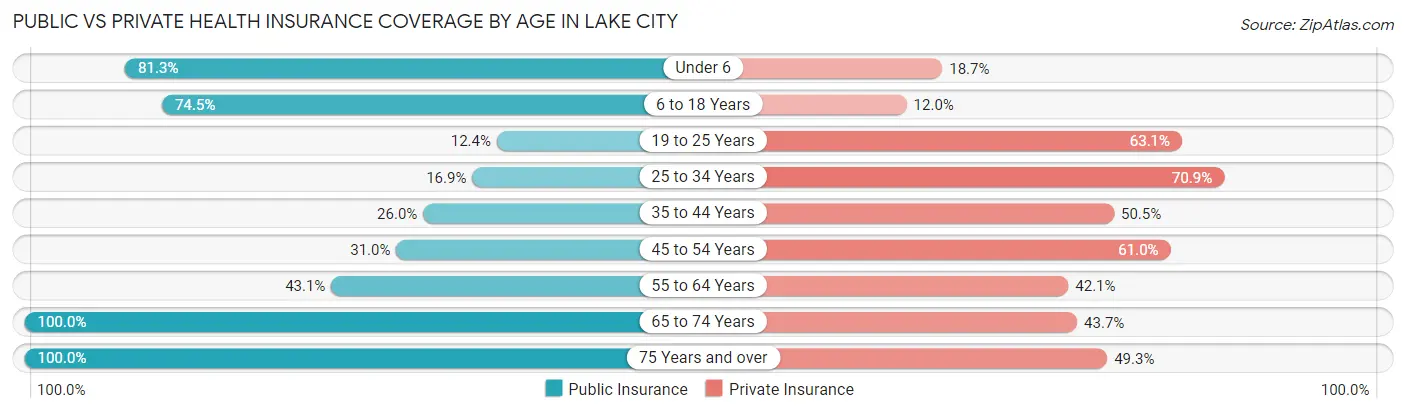
| Age Bracket | Public Insurance | Private Insurance |
| Under 6 | 218 (81.3%) | 50 (18.7%) |
| 6 to 18 Years | 724 (74.5%) | 117 (12.0%) |
| 19 to 25 Years | 73 (12.3%) | 373 (63.1%) |
| 25 to 34 Years | 149 (16.9%) | 625 (70.9%) |
| 35 to 44 Years | 192 (26.0%) | 373 (50.5%) |
| 45 to 54 Years | 151 (31.0%) | 297 (61.0%) |
| 55 to 64 Years | 496 (43.1%) | 484 (42.0%) |
| 65 to 74 Years | 515 (100.0%) | 225 (43.7%) |
| 75 Years and over | 477 (100.0%) | 235 (49.3%) |
| Total | 2,995 (49.3%) | 2,779 (45.7%) |
Disability Status by Sex by Age in Lake City
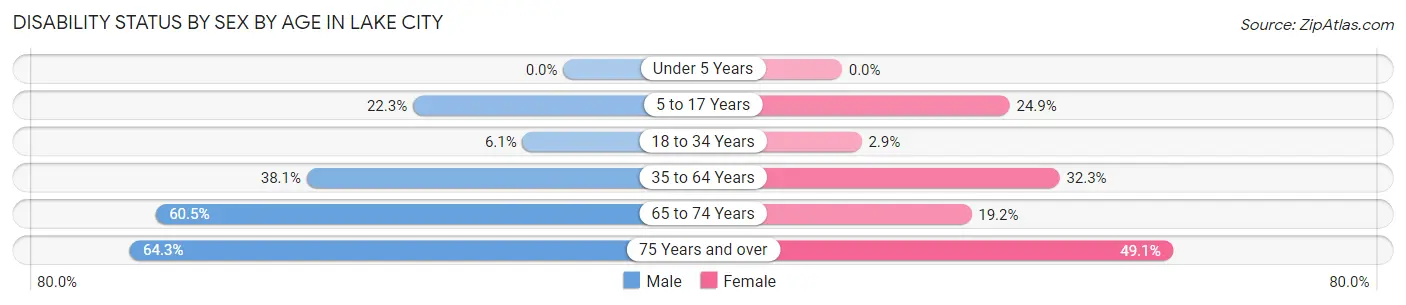
| Age Bracket | Male | Female |
| Under 5 Years | 0 (0.0%) | 0 (0.0%) |
| 5 to 17 Years | 119 (22.3%) | 70 (24.9%) |
| 18 to 34 Years | 41 (6.1%) | 28 (2.9%) |
| 35 to 64 Years | 389 (38.1%) | 438 (32.3%) |
| 65 to 74 Years | 107 (60.5%) | 65 (19.2%) |
| 75 Years and over | 92 (64.3%) | 164 (49.1%) |
Disability Class by Sex by Age in Lake City
Disability Class: Hearing Difficulty
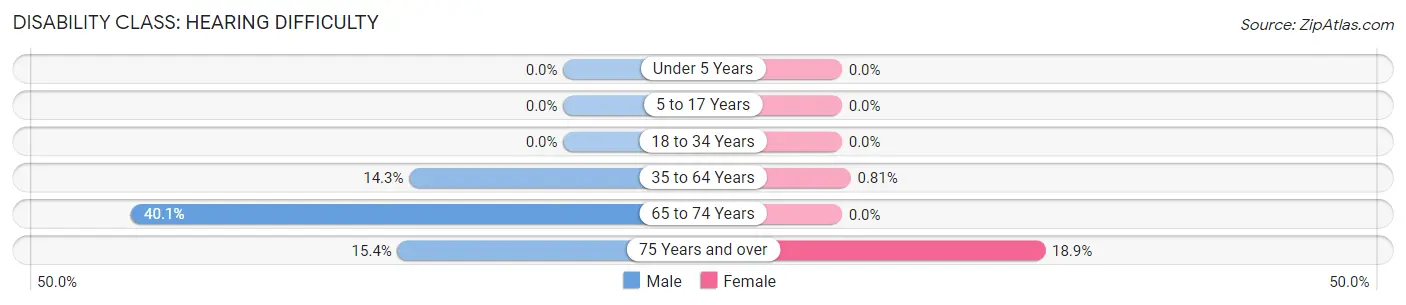
| Age Bracket | Male | Female |
| Under 5 Years | 0 (0.0%) | 0 (0.0%) |
| 5 to 17 Years | 0 (0.0%) | 0 (0.0%) |
| 18 to 34 Years | 0 (0.0%) | 0 (0.0%) |
| 35 to 64 Years | 146 (14.3%) | 11 (0.8%) |
| 65 to 74 Years | 71 (40.1%) | 0 (0.0%) |
| 75 Years and over | 22 (15.4%) | 63 (18.9%) |
Disability Class: Vision Difficulty
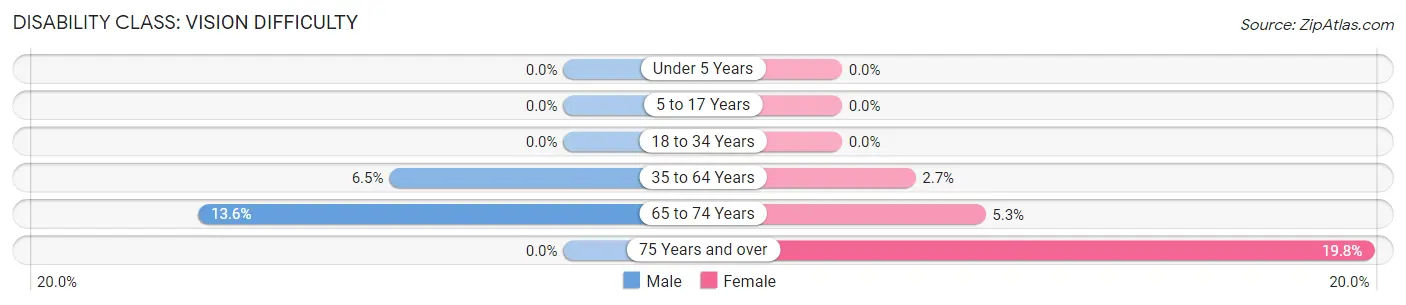
| Age Bracket | Male | Female |
| Under 5 Years | 0 (0.0%) | 0 (0.0%) |
| 5 to 17 Years | 0 (0.0%) | 0 (0.0%) |
| 18 to 34 Years | 0 (0.0%) | 0 (0.0%) |
| 35 to 64 Years | 66 (6.5%) | 37 (2.7%) |
| 65 to 74 Years | 24 (13.6%) | 18 (5.3%) |
| 75 Years and over | 0 (0.0%) | 66 (19.8%) |
Disability Class: Cognitive Difficulty
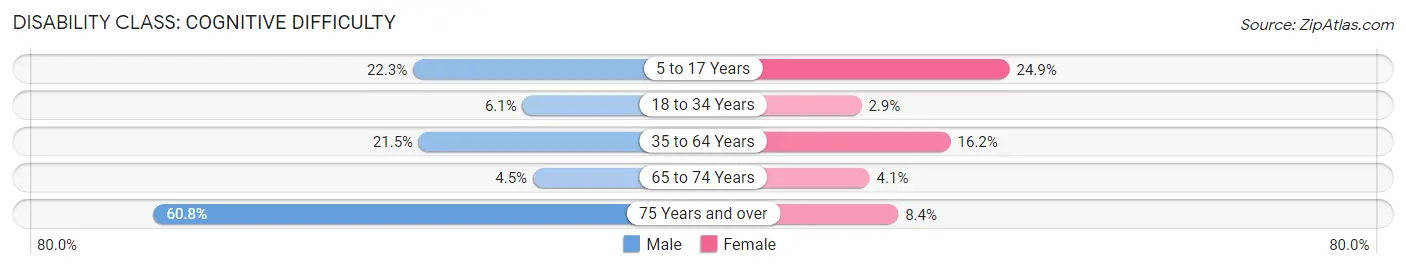
| Age Bracket | Male | Female |
| 5 to 17 Years | 119 (22.3%) | 70 (24.9%) |
| 18 to 34 Years | 41 (6.1%) | 28 (2.9%) |
| 35 to 64 Years | 219 (21.4%) | 219 (16.2%) |
| 65 to 74 Years | 8 (4.5%) | 14 (4.1%) |
| 75 Years and over | 87 (60.8%) | 28 (8.4%) |
Disability Class: Ambulatory Difficulty
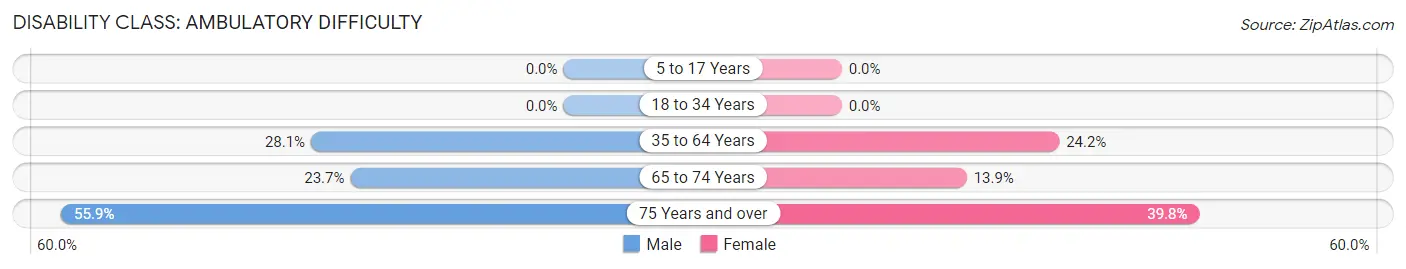
| Age Bracket | Male | Female |
| 5 to 17 Years | 0 (0.0%) | 0 (0.0%) |
| 18 to 34 Years | 0 (0.0%) | 0 (0.0%) |
| 35 to 64 Years | 287 (28.1%) | 328 (24.2%) |
| 65 to 74 Years | 42 (23.7%) | 47 (13.9%) |
| 75 Years and over | 80 (55.9%) | 133 (39.8%) |
Disability Class: Self-Care Difficulty
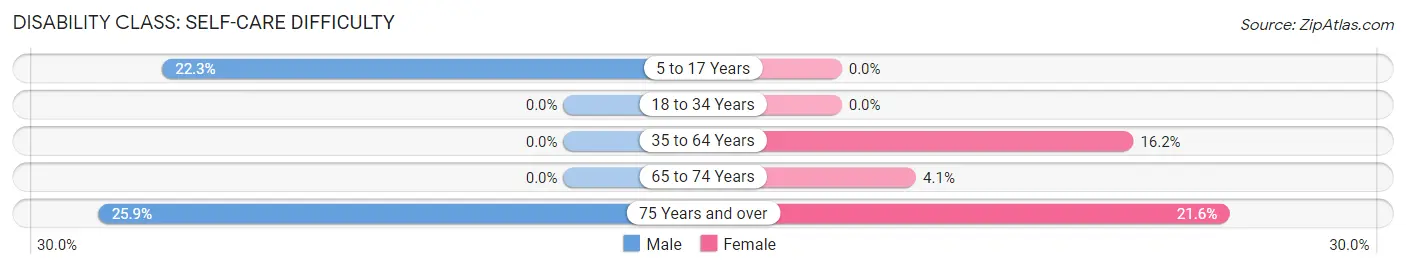
| Age Bracket | Male | Female |
| 5 to 17 Years | 119 (22.3%) | 0 (0.0%) |
| 18 to 34 Years | 0 (0.0%) | 0 (0.0%) |
| 35 to 64 Years | 0 (0.0%) | 220 (16.2%) |
| 65 to 74 Years | 0 (0.0%) | 14 (4.1%) |
| 75 Years and over | 37 (25.9%) | 72 (21.6%) |
Technology Access in Lake City
Computing Device Access in Lake City
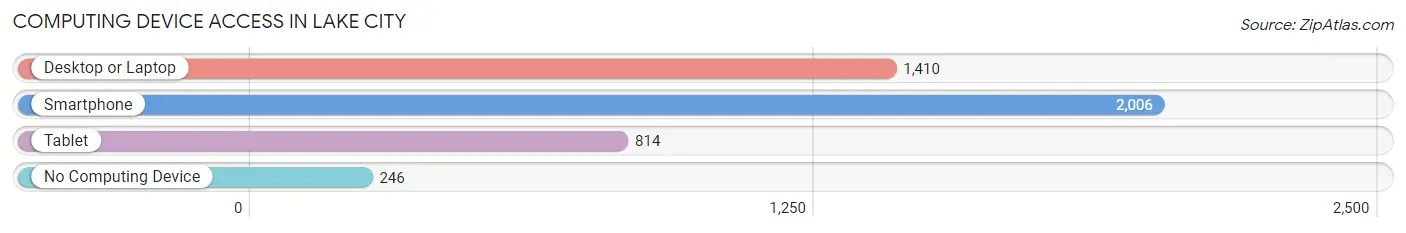
| Device Type | # Households | % Households |
| Desktop or Laptop | 1,410 | 58.1% |
| Smartphone | 2,006 | 82.7% |
| Tablet | 814 | 33.6% |
| No Computing Device | 246 | 10.1% |
| Total | 2,426 | 100.0% |
Internet Access in Lake City
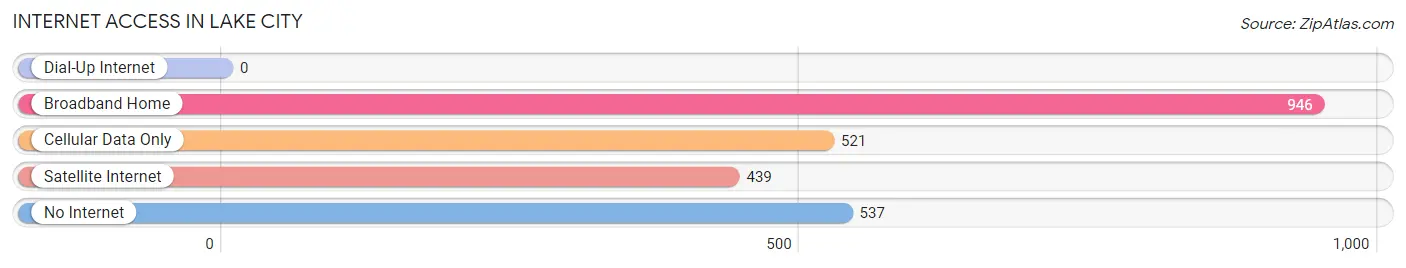
| Internet Type | # Households | % Households |
| Dial-Up Internet | 0 | 0.0% |
| Broadband Home | 946 | 39.0% |
| Cellular Data Only | 521 | 21.5% |
| Satellite Internet | 439 | 18.1% |
| No Internet | 537 | 22.1% |
| Total | 2,426 | 100.0% |
Lake City Summary
City of Lake City South Carolina
Lake City is a small city located in Florence County, South Carolina. It is the county seat of Florence County and is located in the Pee Dee region of the state. The city is situated on the banks of Lake Marion, a large lake that is part of the Santee Cooper Lakes system. The city has a population of 6,839 as of the 2010 census, making it the second-largest city in Florence County.
History
The area that is now Lake City was first settled in the late 1700s by European settlers. The town was originally known as "Cross Roads" due to its location at the intersection of two major roads. In 1872, the town was renamed "Lake City" due to its proximity to Lake Marion.
In the late 1800s, Lake City became a major center for the timber industry. The city was home to several sawmills and lumber companies, and the timber industry was the primary source of employment for the city's residents.
In the early 1900s, Lake City began to experience a period of growth and development. The city was incorporated in 1908 and the first mayor was elected in 1909. The city's population grew steadily throughout the 20th century, reaching a peak of 8,845 in the 2000 census.
Geography
Lake City is located in the Pee Dee region of South Carolina, in the northeastern corner of Florence County. The city is situated on the banks of Lake Marion, a large lake that is part of the Santee Cooper Lakes system. The city is located approximately 30 miles east of Florence, the county seat, and approximately 60 miles northwest of Myrtle Beach.
The city has a total area of 8.2 square miles, of which 8.1 square miles is land and 0.1 square miles is water. The city is located at an elevation of approximately 150 feet above sea level.
Economy
The economy of Lake City is largely based on manufacturing and agriculture. The city is home to several manufacturing companies, including a paper mill, a furniture factory, and a plastics plant. The city is also home to several agricultural operations, including a large poultry farm and several smaller farms that produce vegetables, fruits, and grains.
The city is also home to several retail stores, restaurants, and other businesses. The city is served by two major highways, US Highway 52 and US Highway 301, which provide access to nearby cities and towns.
Demographics
As of the 2010 census, the population of Lake City was 6,839. The racial makeup of the city was 57.3% White, 37.7% African American, 0.3% Native American, 0.7% Asian, 0.1% Pacific Islander, 1.7% from other races, and 2.1% from two or more races. Hispanic or Latino of any race were 4.2% of the population.
The median household income in Lake City was $30,945, and the median family income was $37,917. The per capita income for the city was $17,845. About 19.3% of the population was below the poverty line.
Conclusion
Lake City is a small city located in Florence County, South Carolina. It is the county seat of Florence County and is located in the Pee Dee region of the state. The city is situated on the banks of Lake Marion, a large lake that is part of the Santee Cooper Lakes system. The city has a population of 6,839 as of the 2010 census, making it the second-largest city in Florence County. The economy of Lake City is largely based on manufacturing and agriculture, and the city is home to several retail stores, restaurants, and other businesses. The racial makeup of the city is 57.3% White, 37.7% African American, 0.3% Native American, 0.7% Asian, 0.1% Pacific Islander, 1.7% from other races, and 2.1% from two or more races. The median household income in Lake City was $30,945, and the median family income was $37,917. About 19.3% of the population was below the poverty line.
Common Questions
What is the Total Population of Lake City?
Total Population of Lake City is 6,080.
What is the Total Male Population of Lake City?
Total Male Population of Lake City is 2,734.
What is the Total Female Population of Lake City?
Total Female Population of Lake City is 3,346.
What is the Ratio of Males per 100 Females in Lake City?
There are 81.71 Males per 100 Females in Lake City.
What is the Ratio of Females per 100 Males in Lake City?
There are 122.38 Females per 100 Males in Lake City.
What is the Median Population Age in Lake City?
Median Population Age in Lake City is 41.2 Years.
What is the Average Family Size in Lake City
Average Family Size in Lake City is 3.7 People.
What is the Average Household Size in Lake City
Average Household Size in Lake City is 2.5 People.
What is Per Capita Income in Lake City?
Per Capita income in Lake City is $22,245.
What is the Median Family Income in Lake City?
Median Family Income in Lake City is $49,808.
What is the Median Household income in Lake City?
Median Household Income in Lake City is $37,013.
What is Income or Wage Gap in Lake City?
Income or Wage Gap in Lake City is 7.4%.
Women in Lake City earn 92.6 cents for every dollar earned by a man.
What is Inequality or Gini Index in Lake City?
Inequality or Gini Index in Lake City is 0.47.
How Large is the Labor Force in Lake City?
There are 2,942 People in the Labor Forcein in Lake City.
What is the Percentage of People in the Labor Force in Lake City?
57.1% of People are in the Labor Force in Lake City.
What is the Unemployment Rate in Lake City?
Unemployment Rate in Lake City is 8.6%.