Pueblo vs Portuguese Receiving Food Stamps

COMPARE

Pueblo
Race
Ancestry
AfghanAfricanAlaska NativeAlaskan AthabascanAlbanianAleutAlsatianAmericanApacheArabArapahoArgentineanArmenianAssyrian/Chaldean/SyriacAustralianAustrianBahamianBangladeshiBarbadianBasqueBelgianBelizeanBermudanBhutaneseBlackfeetBolivianBrazilianBritishBritish West IndianBulgarianBurmeseCajunCambodianCanadianCape VerdeanCarpatho RusynCelticCentral AmericanCentral American IndianCherokeeCheyenneChickasawChileanChineseChippewaChoctawColombianColvilleComancheCosta RicanCreeCreekCroatianCrowCubanCypriotCzechCzechoslovakianDanishDelawareDominicanDutchDutch West IndianEastern EuropeanEcuadorianEgyptianEnglishEstonianEthiopianEuropeanFijianFilipinoFinnishFrenchFrench American IndianFrench CanadianGermanGerman RussianGhanaianGreekGuamanian/ChamorroGuatemalanGuyaneseHaitianHmongHonduranHopiHoumaHungarianIcelanderIndian (Asian)IndonesianInupiatIranianIraqiIrishIroquoisIsraeliItalianJamaicanJapaneseJordanianKenyanKiowaKoreanLaotianLatvianLebaneseLiberianLithuanianLumbeeLuxembourgerMacedonianMalaysianMalteseMarshalleseMenomineeMexicanMexican American IndianMongolianMoroccanNative HawaiianNavajoNepaleseNew ZealanderNicaraguanNigerianNorthern EuropeanNorwegianOkinawanOsageOttawaPaiutePakistaniPalestinianPanamanianParaguayanPennsylvania GermanPeruvianPimaPolishPotawatomiPuebloPuerto RicanPuget Sound SalishRomanianRussianSalvadoranSamoanScandinavianScotch-IrishScottishSeminoleSenegaleseSerbianShoshoneSierra LeoneanSiouxSlavicSlovakSloveneSomaliSouth AfricanSouth AmericanSouth American IndianSoviet UnionSpaniardSpanishSpanish AmericanSpanish American IndianSri LankanSubsaharan AfricanSudaneseSwedishSwissSyrianTaiwaneseThaiTlingit-HaidaTohono O'OdhamTonganTrinidadian and TobagonianTsimshianTurkishU.S. Virgin IslanderUgandanUkrainianUruguayanUteVenezuelanVietnameseWelshWest IndianYakamaYaquiYugoslavianYumanYup'ikZimbabwean
Immigration
NonimmigrantsImmigrantsAfghanistanAfricaAlbaniaArgentinaArmeniaAsiaAustraliaAustriaBahamasBangladeshBarbadosBelarusBelgiumBelizeBoliviaBosnia and HerzegovinaBrazilBulgariaBurma/MyanmarCabo VerdeCambodiaCameroonCanadaCaribbeanCentral AmericaChileChinaColombiaCongoCosta RicaCroatiaCubaCzechoslovakiaDenmarkDominicaDominican RepublicEastern AfricaEastern AsiaEastern EuropeEcuadorEgyptEl SalvadorEnglandEritreaEthiopiaEuropeFijiFranceGermanyGhanaGreeceGrenadaGuatemalaGuyanaHaitiHondurasHong KongHungaryIndiaIndonesiaIranIraqIrelandIsraelItalyJamaicaJapanJordanKazakhstanKenyaKoreaKuwaitLaosLatin AmericaLatviaLebanonLiberiaLithuaniaMalaysiaMexicoMicronesiaMiddle AfricaMoldovaMoroccoNepalNetherlandsNicaraguaNigeriaNorth AmericaNorth MacedoniaNorthern AfricaNorthern EuropeNorwayOceaniaPakistanPanamaPeruPhilippinesPolandPortugalRomaniaRussiaSaudi ArabiaScotlandSenegalSerbiaSierra LeoneSingaporeSomaliaSouth AfricaSouth AmericaSouth Central AsiaSouth Eastern AsiaSouthern EuropeSpainSri LankaSt. Vincent and the GrenadinesSudanSwedenSwitzerlandSyriaTaiwanThailandTrinidad and TobagoTurkeyUgandaUkraineUruguayUzbekistanVenezuelaVietnamWest IndiesWestern AfricaWestern AsiaWestern EuropeYemenZaireZimbabweAzores
Portuguese
Race
Ancestry
AfghanAfricanAlaska NativeAlaskan AthabascanAlbanianAleutAlsatianAmericanApacheArabArapahoArgentineanArmenianAssyrian/Chaldean/SyriacAustralianAustrianBahamianBangladeshiBarbadianBasqueBelgianBelizeanBermudanBhutaneseBlackfeetBolivianBrazilianBritishBritish West IndianBulgarianBurmeseCajunCambodianCanadianCape VerdeanCarpatho RusynCelticCentral AmericanCentral American IndianCherokeeCheyenneChickasawChileanChineseChippewaChoctawColombianColvilleComancheCosta RicanCreeCreekCroatianCrowCubanCypriotCzechCzechoslovakianDanishDelawareDominicanDutchDutch West IndianEastern EuropeanEcuadorianEgyptianEnglishEstonianEthiopianEuropeanFijianFilipinoFinnishFrenchFrench American IndianFrench CanadianGermanGerman RussianGhanaianGreekGuamanian/ChamorroGuatemalanGuyaneseHaitianHmongHonduranHopiHoumaHungarianIcelanderIndian (Asian)IndonesianInupiatIranianIraqiIrishIroquoisIsraeliItalianJamaicanJapaneseJordanianKenyanKiowaKoreanLaotianLatvianLebaneseLiberianLithuanianLumbeeLuxembourgerMacedonianMalaysianMalteseMarshalleseMenomineeMexicanMexican American IndianMongolianMoroccanNative HawaiianNavajoNepaleseNew ZealanderNicaraguanNigerianNorthern EuropeanNorwegianOkinawanOsageOttawaPaiutePakistaniPalestinianPanamanianParaguayanPennsylvania GermanPeruvianPimaPolishPortuguesePotawatomiPuerto RicanPuget Sound SalishRomanianRussianSalvadoranSamoanScandinavianScotch-IrishScottishSeminoleSenegaleseSerbianShoshoneSierra LeoneanSiouxSlavicSlovakSloveneSomaliSouth AfricanSouth AmericanSouth American IndianSoviet UnionSpaniardSpanishSpanish AmericanSpanish American IndianSri LankanSubsaharan AfricanSudaneseSwedishSwissSyrianTaiwaneseThaiTlingit-HaidaTohono O'OdhamTonganTrinidadian and TobagonianTsimshianTurkishU.S. Virgin IslanderUgandanUkrainianUruguayanUteVenezuelanVietnameseWelshWest IndianYakamaYaquiYugoslavianYumanYup'ikZimbabwean
Immigration
NonimmigrantsImmigrantsAfghanistanAfricaAlbaniaArgentinaArmeniaAsiaAustraliaAustriaBahamasBangladeshBarbadosBelarusBelgiumBelizeBoliviaBosnia and HerzegovinaBrazilBulgariaBurma/MyanmarCabo VerdeCambodiaCameroonCanadaCaribbeanCentral AmericaChileChinaColombiaCongoCosta RicaCroatiaCubaCzechoslovakiaDenmarkDominicaDominican RepublicEastern AfricaEastern AsiaEastern EuropeEcuadorEgyptEl SalvadorEnglandEritreaEthiopiaEuropeFijiFranceGermanyGhanaGreeceGrenadaGuatemalaGuyanaHaitiHondurasHong KongHungaryIndiaIndonesiaIranIraqIrelandIsraelItalyJamaicaJapanJordanKazakhstanKenyaKoreaKuwaitLaosLatin AmericaLatviaLebanonLiberiaLithuaniaMalaysiaMexicoMicronesiaMiddle AfricaMoldovaMoroccoNepalNetherlandsNicaraguaNigeriaNorth AmericaNorth MacedoniaNorthern AfricaNorthern EuropeNorwayOceaniaPakistanPanamaPeruPhilippinesPolandPortugalRomaniaRussiaSaudi ArabiaScotlandSenegalSerbiaSierra LeoneSingaporeSomaliaSouth AfricaSouth AmericaSouth Central AsiaSouth Eastern AsiaSouthern EuropeSpainSri LankaSt. Vincent and the GrenadinesSudanSwedenSwitzerlandSyriaTaiwanThailandTrinidad and TobagoTurkeyUgandaUkraineUruguayUzbekistanVenezuelaVietnamWest IndiesWestern AfricaWestern AsiaWestern EuropeYemenZaireZimbabweAzores
Receiving Food Stamps
Income
Poverty
Unemployment
Labor Participation
Family Structure
Vehicle Availability
Education Level
Disability

Receiving Food Stamps Comparison

Pueblo

Portuguese

Tragic
Fair
19.9%
RECEIVING FOOD STAMPS
0.0/ 100
METRIC RATING
332nd/ 347
METRIC RANK
12.2%
RECEIVING FOOD STAMPS
25.1/ 100
METRIC RATING
199th/ 347
METRIC RANK

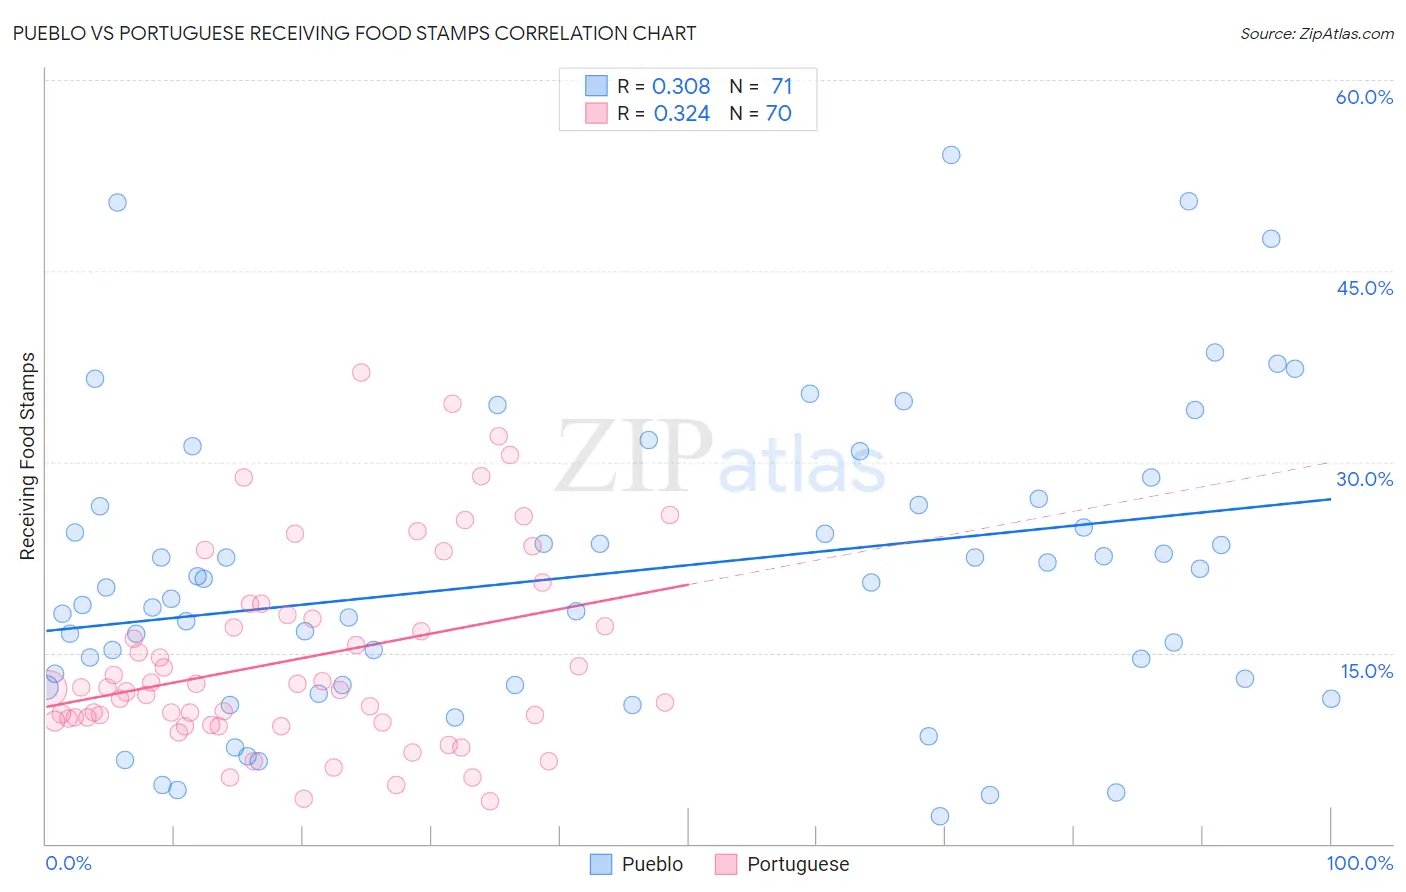
Pueblo vs Portuguese Receiving Food Stamps Correlation Chart

The statistical analysis conducted on geographies consisting of 120,026,955 people shows a mild positive correlation between the proportion of Pueblo and percentage of population receiving government assistance and/or food stamps in the United States with a correlation coefficient (R) of 0.308 and weighted average of 19.9%. Similarly, the statistical analysis conducted on geographies consisting of 448,612,640 people shows a mild positive correlation between the proportion of Portuguese and percentage of population receiving government assistance and/or food stamps in the United States with a correlation coefficient (R) of 0.324 and weighted average of 12.2%, a difference of 63.3%.
Pueblo vs Portuguese Receiving Food Stamps

Receiving Food Stamps Correlation Summary

MeasurementPuebloPortuguese
Minimum2.2%3.3%
Maximum54.1%37.0%
Range51.9%33.7%
Mean21.2%14.6%
Median20.2%12.2%
Interquartile 25% (IQ1)12.5%9.6%
Interquartile 75% (IQ3)26.6%17.9%
Interquartile Range (IQR)14.1%8.3%
Standard Deviation (Sample)11.7%7.7%
Standard Deviation (Population)11.6%7.7%

Similar Demographics by Receiving Food Stamps

Demographics Similar to Pueblo by Receiving Food Stamps

In terms of receiving food stamps, the demographic groups most similar to Pueblo are Inupiat (20.1%, a difference of 0.73%), Immigrants from Caribbean (19.6%, a difference of 1.5%), Yuman (20.2%, a difference of 1.6%), Immigrants from Cuba (20.8%, a difference of 4.6%), and Pima (19.0%, a difference of 5.0%).
DemographicsRating | RankReceiving Food Stamps
Immigrants | Haiti
0.0
/100
|
#325
Tragic
18.2%
Cubans
0.0
/100
|
#326
Tragic
18.2%
Apache
0.0
/100
|
#327
Tragic
18.3%
Colville
0.0
/100
|
#328
Tragic
18.3%
Immigrants | Dominica
0.0
/100
|
#329
Tragic
18.4%
Pima
0.0
/100
|
#330
Tragic
19.0%
Immigrants | Caribbean
0.0
/100
|
#331
Tragic
19.6%
Pueblo
0.0
/100
|
#332
Tragic
19.9%
Inupiat
0.0
/100
|
#333
Tragic
20.1%
Yuman
0.0
/100
|
#334
Tragic
20.2%
Immigrants | Cuba
0.0
/100
|
#335
Tragic
20.8%
Navajo
0.0
/100
|
#336
Tragic
21.1%
Cape Verdeans
0.0
/100
|
#337
Tragic
21.1%
Dominicans
0.0
/100
|
#338
Tragic
21.4%
Yakama
0.0
/100
|
#339
Tragic
21.4%

Demographics Similar to Portuguese by Receiving Food Stamps

In terms of receiving food stamps, the demographic groups most similar to Portuguese are Immigrants from Costa Rica (12.2%, a difference of 0.050%), Delaware (12.2%, a difference of 0.18%), Iraqi (12.2%, a difference of 0.26%), Sierra Leonean (12.2%, a difference of 0.28%), and American (12.2%, a difference of 0.29%).
DemographicsRating | RankReceiving Food Stamps
Samoans
31.0
/100
|
#192
Fair
12.1%
Immigrants | Fiji
27.8
/100
|
#193
Fair
12.1%
Immigrants | Sudan
27.1
/100
|
#194
Fair
12.1%
Americans
26.7
/100
|
#195
Fair
12.2%
Iraqis
26.6
/100
|
#196
Fair
12.2%
Delaware
26.1
/100
|
#197
Fair
12.2%
Immigrants | Costa Rica
25.4
/100
|
#198
Fair
12.2%
Portuguese
25.1
/100
|
#199
Fair
12.2%
Sierra Leoneans
23.6
/100
|
#200
Fair
12.2%
Ugandans
22.5
/100
|
#201
Fair
12.2%
Immigrants | Venezuela
20.1
/100
|
#202
Fair
12.3%
Shoshone
17.7
/100
|
#203
Poor
12.4%
Immigrants | Nonimmigrants
17.6
/100
|
#204
Poor
12.4%
Aleuts
17.3
/100
|
#205
Poor
12.4%
Immigrants | Thailand
17.0
/100
|
#206
Poor
12.4%