Cities with the Highest Percentage of Thai Population in Pennsylvania
RELATED REPORTS & OPTIONS
Thai
Pennsylvania
Compare Cities
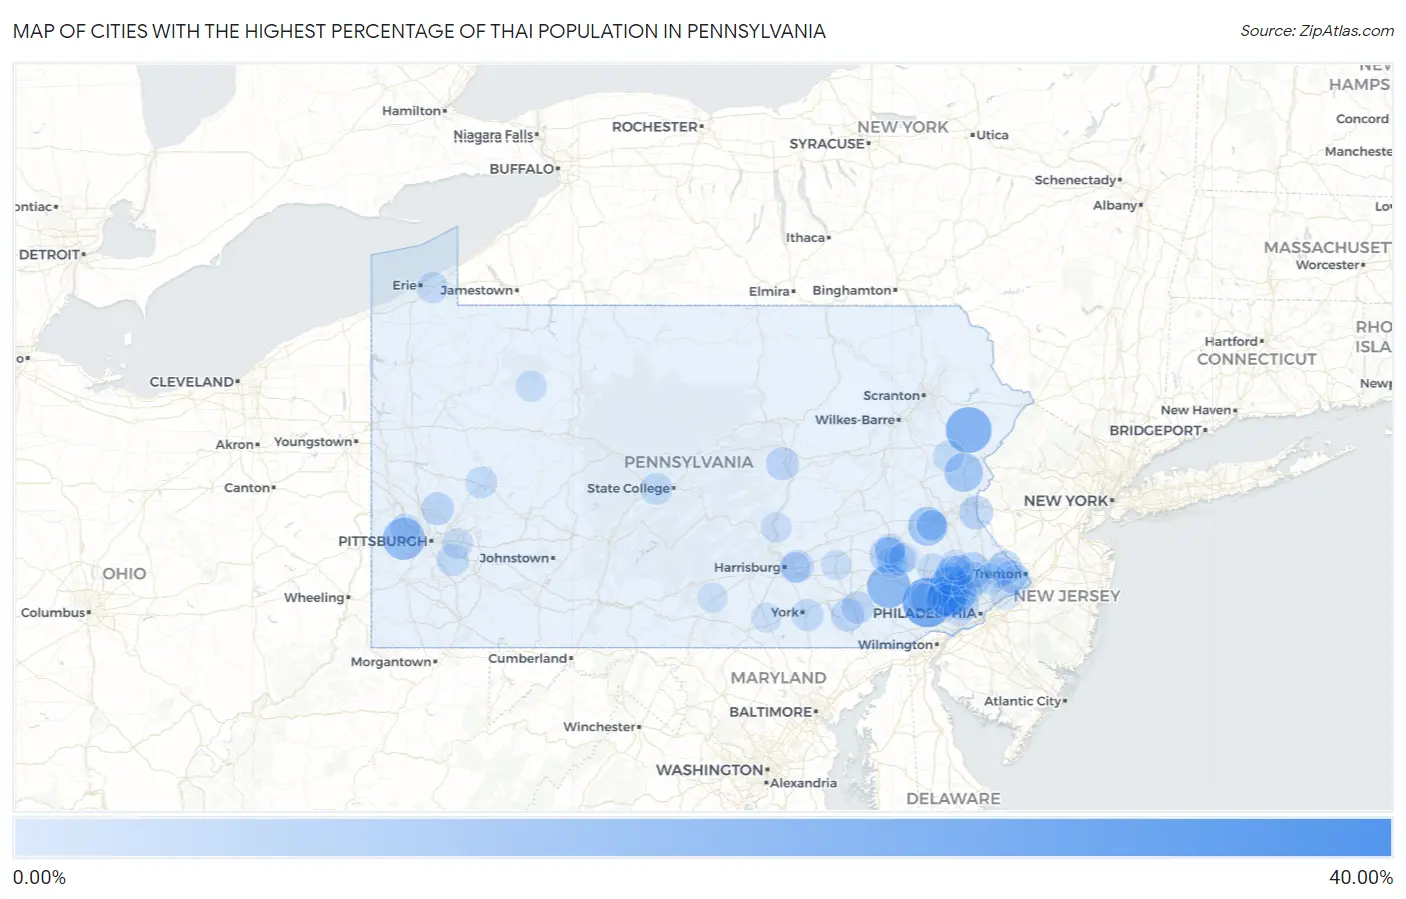
Map of Cities with the Highest Percentage of Thai Population in Pennsylvania
0.00%
40.00%
Cities with the Highest Percentage of Thai Population in Pennsylvania
| City | Thai | vs State | vs National | |
| 1. | Millbourne Borough | 36.84% | 1.28%(+35.6)#1 | 1.44%(+35.4)#17 |
| 2. | Frazer | 32.12% | 1.28%(+30.8)#2 | 1.44%(+30.7)#24 |
| 3. | Exton | 25.06% | 1.28%(+23.8)#3 | 1.44%(+23.6)#46 |
| 4. | Mountainhome | 20.72% | 1.28%(+19.4)#4 | 1.44%(+19.3)#63 |
| 5. | Hatfield Borough | 18.83% | 1.28%(+17.5)#5 | 1.44%(+17.4)#75 |
| 6. | Churchtown | 17.70% | 1.28%(+16.4)#6 | 1.44%(+16.3)#87 |
| 7. | Enlow | 16.43% | 1.28%(+15.2)#7 | 1.44%(+15.0)#102 |
| 8. | Audubon | 15.51% | 1.28%(+14.2)#8 | 1.44%(+14.1)#107 |
| 9. | King Of Prussia | 14.23% | 1.28%(+12.9)#9 | 1.44%(+12.8)#127 |
| 10. | Chesterbrook | 13.95% | 1.28%(+12.7)#10 | 1.44%(+12.5)#130 |
| 11. | Breinigsville | 12.52% | 1.28%(+11.2)#11 | 1.44%(+11.1)#159 |
| 12. | Saylorsburg | 12.07% | 1.28%(+10.8)#12 | 1.44%(+10.6)#168 |
| 13. | Franklin Park Borough | 9.50% | 1.28%(+8.22)#13 | 1.44%(+8.06)#240 |
| 14. | Eagle | 9.47% | 1.28%(+8.19)#14 | 1.44%(+8.04)#241 |
| 15. | Georgetown Cdp Lancaster County | 9.31% | 1.28%(+8.03)#15 | 1.44%(+7.88)#249 |
| 16. | Skippack | 8.98% | 1.28%(+7.70)#16 | 1.44%(+7.54)#265 |
| 17. | Colony Park | 8.91% | 1.28%(+7.63)#17 | 1.44%(+7.47)#267 |
| 18. | Montgomeryville | 8.78% | 1.28%(+7.50)#18 | 1.44%(+7.34)#274 |
| 19. | Paoli | 7.02% | 1.28%(+5.74)#19 | 1.44%(+5.59)#386 |
| 20. | Spring House | 6.94% | 1.28%(+5.66)#20 | 1.44%(+5.50)#396 |
| 21. | Newtown Grant | 6.84% | 1.28%(+5.56)#21 | 1.44%(+5.40)#407 |
| 22. | Raubsville | 6.75% | 1.28%(+5.47)#22 | 1.44%(+5.31)#416 |
| 23. | Dilworthtown | 6.60% | 1.28%(+5.32)#23 | 1.44%(+5.17)#425 |
| 24. | Berwyn | 6.30% | 1.28%(+5.02)#24 | 1.44%(+4.86)#450 |
| 25. | Clarks Green Borough | 6.21% | 1.28%(+4.93)#25 | 1.44%(+4.77)#460 |
| 26. | Fairview Borough | 6.19% | 1.28%(+4.90)#26 | 1.44%(+4.75)#463 |
| 27. | Sinking Spring Borough | 6.13% | 1.28%(+4.84)#27 | 1.44%(+4.69)#471 |
| 28. | East Lansdowne Borough | 5.99% | 1.28%(+4.71)#28 | 1.44%(+4.56)#487 |
| 29. | Conestoga | 5.94% | 1.28%(+4.66)#29 | 1.44%(+4.51)#494 |
| 30. | Lansdale Borough | 5.90% | 1.28%(+4.61)#30 | 1.44%(+4.46)#497 |
| 31. | Linntown | 5.87% | 1.28%(+4.59)#31 | 1.44%(+4.43)#501 |
| 32. | Green Tree Borough | 5.67% | 1.28%(+4.39)#32 | 1.44%(+4.23)#524 |
| 33. | Downingtown Borough | 5.59% | 1.28%(+4.31)#33 | 1.44%(+4.15)#534 |
| 34. | Bakerstown | 5.53% | 1.28%(+4.25)#34 | 1.44%(+4.09)#545 |
| 35. | Evansburg | 5.43% | 1.28%(+4.15)#35 | 1.44%(+3.99)#555 |
| 36. | Matamoras Borough | 5.38% | 1.28%(+4.10)#36 | 1.44%(+3.95)#558 |
| 37. | Lampeter | 5.21% | 1.28%(+3.93)#37 | 1.44%(+3.78)#580 |
| 38. | Wormleysburg Borough | 5.20% | 1.28%(+3.92)#38 | 1.44%(+3.76)#583 |
| 39. | Rutherford | 5.19% | 1.28%(+3.91)#39 | 1.44%(+3.75)#584 |
| 40. | Woodbourne | 5.11% | 1.28%(+3.83)#40 | 1.44%(+3.67)#596 |
| 41. | Queens Gate | 4.74% | 1.28%(+3.46)#41 | 1.44%(+3.30)#653 |
| 42. | Greenock | 4.70% | 1.28%(+3.42)#42 | 1.44%(+3.26)#663 |
| 43. | West Reading Borough | 4.68% | 1.28%(+3.40)#43 | 1.44%(+3.24)#666 |
| 44. | Hyde Park Borough | 4.59% | 1.28%(+3.31)#44 | 1.44%(+3.15)#683 |
| 45. | Stormstown | 4.42% | 1.28%(+3.14)#45 | 1.44%(+2.99)#718 |
| 46. | Throop Borough | 4.36% | 1.28%(+3.08)#46 | 1.44%(+2.92)#734 |
| 47. | West Hills | 4.35% | 1.28%(+3.07)#47 | 1.44%(+2.92)#735 |
| 48. | Bald Eagle | 4.35% | 1.28%(+3.07)#48 | 1.44%(+2.91)#738 |
| 49. | Grill | 4.32% | 1.28%(+3.04)#49 | 1.44%(+2.88)#751 |
| 50. | Carlisle Barracks | 4.29% | 1.28%(+3.01)#50 | 1.44%(+2.85)#757 |
| 51. | Millville Borough | 4.20% | 1.28%(+2.92)#51 | 1.44%(+2.76)#780 |
| 52. | Ancient Oaks | 4.20% | 1.28%(+2.92)#52 | 1.44%(+2.76)#781 |
| 53. | Sierra View | 4.09% | 1.28%(+2.80)#53 | 1.44%(+2.65)#814 |
| 54. | Yatesville Borough | 4.06% | 1.28%(+2.78)#54 | 1.44%(+2.62)#821 |
| 55. | Reiffton | 4.05% | 1.28%(+2.76)#55 | 1.44%(+2.61)#826 |
| 56. | Sewickley Hills Borough | 4.02% | 1.28%(+2.74)#56 | 1.44%(+2.58)#840 |
| 57. | Warminster Heights | 3.99% | 1.28%(+2.71)#57 | 1.44%(+2.55)#845 |
| 58. | West Conshohocken Borough | 3.96% | 1.28%(+2.68)#58 | 1.44%(+2.52)#856 |
| 59. | St. Davids | 3.96% | 1.28%(+2.68)#59 | 1.44%(+2.52)#858 |
| 60. | Whitehall Borough | 3.95% | 1.28%(+2.67)#60 | 1.44%(+2.51)#859 |
| 61. | Penn State Erie Behrend | 3.82% | 1.28%(+2.54)#61 | 1.44%(+2.39)#909 |
| 62. | Mckinley | 3.76% | 1.28%(+2.48)#62 | 1.44%(+2.32)#922 |
| 63. | Monroeville | 3.61% | 1.28%(+2.33)#63 | 1.44%(+2.17)#968 |
| 64. | Lionville | 3.60% | 1.28%(+2.32)#64 | 1.44%(+2.16)#972 |
| 65. | Haverford College | 3.49% | 1.28%(+2.21)#65 | 1.44%(+2.05)#997 |
| 66. | Lawnton | 3.45% | 1.28%(+2.17)#66 | 1.44%(+2.01)#1,016 |
| 67. | Marienville | 3.32% | 1.28%(+2.04)#67 | 1.44%(+1.88)#1,051 |
| 68. | Plymouth Meeting | 3.32% | 1.28%(+2.03)#68 | 1.44%(+1.88)#1,053 |
| 69. | Sanatoga | 3.31% | 1.28%(+2.03)#69 | 1.44%(+1.87)#1,058 |
| 70. | Clifton Heights Borough | 3.31% | 1.28%(+2.03)#70 | 1.44%(+1.87)#1,059 |
| 71. | Pottstown Borough | 3.30% | 1.28%(+2.02)#71 | 1.44%(+1.86)#1,061 |
| 72. | Greenfields | 3.24% | 1.28%(+1.96)#72 | 1.44%(+1.80)#1,093 |
| 73. | Harleysville | 3.20% | 1.28%(+1.92)#73 | 1.44%(+1.77)#1,113 |
| 74. | Ivyland Borough | 3.18% | 1.28%(+1.90)#74 | 1.44%(+1.74)#1,125 |
| 75. | Stillwater Borough | 3.17% | 1.28%(+1.89)#75 | 1.44%(+1.73)#1,130 |
| 76. | Richboro | 3.15% | 1.28%(+1.87)#76 | 1.44%(+1.71)#1,141 |
| 77. | Dunmore Borough | 3.10% | 1.28%(+1.82)#77 | 1.44%(+1.67)#1,162 |
| 78. | Lenkerville | 3.08% | 1.28%(+1.80)#78 | 1.44%(+1.64)#1,173 |
| 79. | Mckees Rocks Borough | 3.02% | 1.28%(+1.74)#79 | 1.44%(+1.58)#1,203 |
| 80. | Camp Hill Borough | 3.01% | 1.28%(+1.73)#80 | 1.44%(+1.57)#1,207 |
| 81. | Alburtis Borough | 3.00% | 1.28%(+1.72)#81 | 1.44%(+1.56)#1,211 |
| 82. | Macungie Borough | 2.95% | 1.28%(+1.67)#82 | 1.44%(+1.52)#1,235 |
| 83. | Eagleview | 2.95% | 1.28%(+1.67)#83 | 1.44%(+1.52)#1,237 |
| 84. | Riverview Park | 2.94% | 1.28%(+1.66)#84 | 1.44%(+1.50)#1,245 |
| 85. | Kulpsville | 2.92% | 1.28%(+1.64)#85 | 1.44%(+1.48)#1,253 |
| 86. | Fairless Hills | 2.83% | 1.28%(+1.55)#86 | 1.44%(+1.39)#1,293 |
| 87. | Carnot Moon | 2.78% | 1.28%(+1.50)#87 | 1.44%(+1.34)#1,316 |
| 88. | Trexlertown | 2.76% | 1.28%(+1.48)#88 | 1.44%(+1.32)#1,333 |
| 89. | Malvern Borough | 2.71% | 1.28%(+1.43)#89 | 1.44%(+1.28)#1,356 |
| 90. | Quentin | 2.66% | 1.28%(+1.38)#90 | 1.44%(+1.23)#1,379 |
| 91. | Thornburg Borough | 2.64% | 1.28%(+1.36)#91 | 1.44%(+1.21)#1,390 |
| 92. | Cornwells Heights | 2.61% | 1.28%(+1.33)#92 | 1.44%(+1.18)#1,412 |
| 93. | Shippensburg University | 2.60% | 1.28%(+1.32)#93 | 1.44%(+1.16)#1,421 |
| 94. | Hampton | 2.59% | 1.28%(+1.31)#94 | 1.44%(+1.15)#1,426 |
| 95. | Manor Borough | 2.57% | 1.28%(+1.28)#95 | 1.44%(+1.13)#1,440 |
| 96. | Jacksonwald | 2.55% | 1.28%(+1.27)#96 | 1.44%(+1.12)#1,447 |
| 97. | Eagleville Cdp Montgomery County | 2.52% | 1.28%(+1.24)#97 | 1.44%(+1.08)#1,461 |
| 98. | Broomall | 2.40% | 1.28%(+1.12)#98 | 1.44%(+0.963)#1,522 |
| 99. | Villanova | 2.36% | 1.28%(+1.08)#99 | 1.44%(+0.926)#1,547 |
| 100. | Chester Heights Borough | 2.35% | 1.28%(+1.07)#100 | 1.44%(+0.910)#1,562 |
Common Questions
What are the Top 10 Cities with the Highest Percentage of Thai Population in Pennsylvania?
Top 10 Cities with the Highest Percentage of Thai Population in Pennsylvania are:
#1
25.06%
#2
20.72%
#3
17.70%
#4
16.43%
#5
15.51%
#6
14.23%
#7
13.95%
#8
12.52%
#9
12.07%
#10
8.98%
What city has the Highest Percentage of Thai Population in Pennsylvania?
Exton has the Highest Percentage of Thai Population in Pennsylvania with 25.06%.
What is the Percentage of Thai Population in the State of Pennsylvania?
Percentage of Thai Population in Pennsylvania is 1.28%.
What is the Percentage of Thai Population in the United States?
Percentage of Thai Population in the United States is 1.44%.