Maple Glen, PA
Maple Glen Map
Maple Glen Overview
6,637
TOTAL POPULATION
3,256
MALE POPULATION
3,381
FEMALE POPULATION
96.30
MALES / 100 FEMALES
103.84
FEMALES / 100 MALES
44.8
MEDIAN AGE
3.2
AVG FAMILY SIZE
2.9
AVG HOUSEHOLD SIZE
$72,124
PER CAPITA INCOME
$183,164
AVG FAMILY INCOME
$166,316
AVG HOUSEHOLD INCOME
7.5%
WAGE / INCOME GAP [ % ]
92.5¢/ $1
WAGE / INCOME GAP [ $ ]
0.40
INEQUALITY / GINI INDEX
3,976
LABOR FORCE [ PEOPLE ]
72.6%
PERCENT IN LABOR FORCE
3.7%
UNEMPLOYMENT RATE
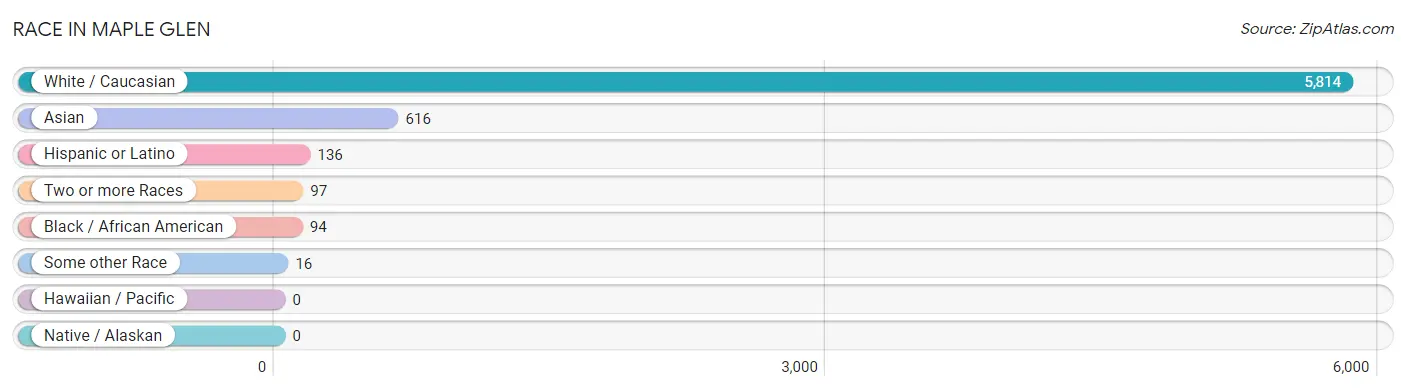
Race in Maple Glen
The most populous races in Maple Glen are White / Caucasian (5,814 | 87.6%), Asian (616 | 9.3%), and Hispanic or Latino (136 | 2.1%).
| Race | # Population | % Population |
| Asian | 616 | 9.3% |
| Black / African American | 94 | 1.4% |
| Hawaiian / Pacific | 0 | 0.0% |
| Hispanic or Latino | 136 | 2.1% |
| Native / Alaskan | 0 | 0.0% |
| White / Caucasian | 5,814 | 87.6% |
| Two or more Races | 97 | 1.5% |
| Some other Race | 16 | 0.2% |
| Total | 6,637 | 100.0% |
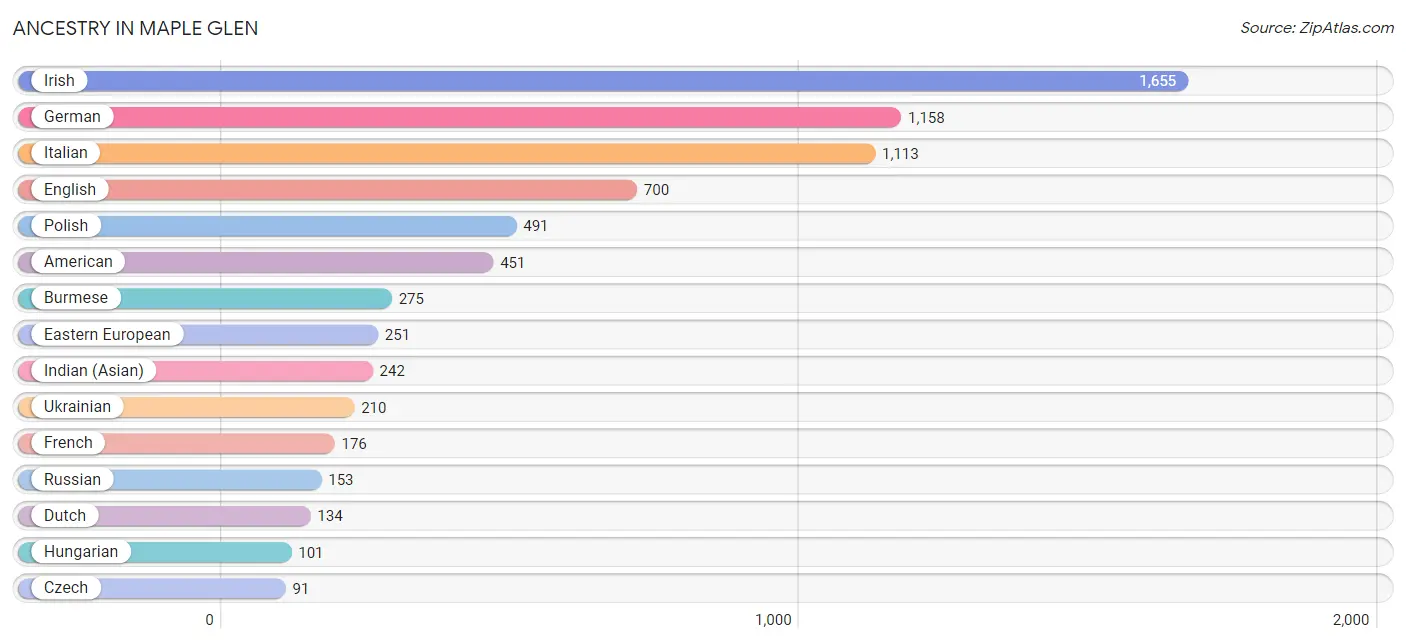
Ancestry in Maple Glen
The most populous ancestries reported in Maple Glen are Irish (1,655 | 24.9%), German (1,158 | 17.4%), Italian (1,113 | 16.8%), English (700 | 10.5%), and Polish (491 | 7.4%), together accounting for 77.1% of all Maple Glen residents.
| Ancestry | # Population | % Population |
| American | 451 | 6.8% |
| Arab | 62 | 0.9% |
| Argentinean | 37 | 0.6% |
| Austrian | 35 | 0.5% |
| Brazilian | 34 | 0.5% |
| British | 33 | 0.5% |
| Bulgarian | 10 | 0.2% |
| Burmese | 275 | 4.1% |
| Carpatho Rusyn | 82 | 1.2% |
| Central American | 13 | 0.2% |
| Croatian | 5 | 0.1% |
| Cuban | 9 | 0.1% |
| Czech | 91 | 1.4% |
| Danish | 22 | 0.3% |
| Dutch | 134 | 2.0% |
| Eastern European | 251 | 3.8% |
| English | 700 | 10.5% |
| Estonian | 9 | 0.1% |
| European | 23 | 0.4% |
| Finnish | 10 | 0.2% |
| French | 176 | 2.6% |
| French Canadian | 17 | 0.3% |
| German | 1,158 | 17.4% |
| Greek | 48 | 0.7% |
| Hungarian | 101 | 1.5% |
| Indian (Asian) | 242 | 3.6% |
| Irish | 1,655 | 24.9% |
| Italian | 1,113 | 16.8% |
| Korean | 26 | 0.4% |
| Laotian | 8 | 0.1% |
| Lebanese | 11 | 0.2% |
| Lithuanian | 30 | 0.4% |
| Mexican | 13 | 0.2% |
| Nicaraguan | 13 | 0.2% |
| Pakistani | 13 | 0.2% |
| Palestinian | 51 | 0.8% |
| Pennsylvania German | 21 | 0.3% |
| Polish | 491 | 7.4% |
| Puerto Rican | 47 | 0.7% |
| Russian | 153 | 2.3% |
| Scandinavian | 20 | 0.3% |
| Scotch-Irish | 48 | 0.7% |
| Scottish | 58 | 0.9% |
| Slavic | 10 | 0.2% |
| South African | 9 | 0.1% |
| South American | 37 | 0.6% |
| Spanish | 9 | 0.1% |
| Sri Lankan | 38 | 0.6% |
| Subsaharan African | 9 | 0.1% |
| Swedish | 26 | 0.4% |
| Swiss | 32 | 0.5% |
| Thai | 30 | 0.4% |
| Turkish | 31 | 0.5% |
| Ukrainian | 210 | 3.2% |
| Welsh | 42 | 0.6% | View All 55 Rows |
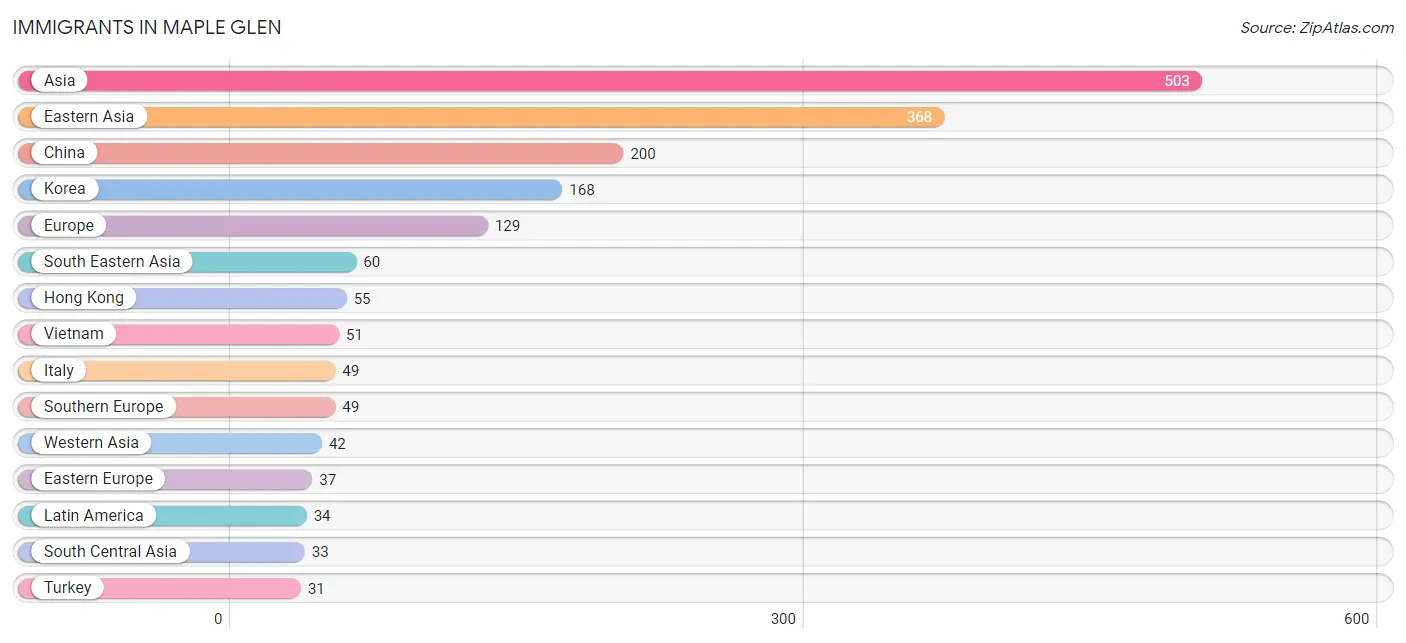
Immigrants in Maple Glen
The most numerous immigrant groups reported in Maple Glen came from Asia (503 | 7.6%), Eastern Asia (368 | 5.5%), China (200 | 3.0%), Korea (168 | 2.5%), and Europe (129 | 1.9%), together accounting for 20.6% of all Maple Glen residents.
| Immigration Origin | # Population | % Population |
| Africa | 9 | 0.1% |
| Asia | 503 | 7.6% |
| Bulgaria | 10 | 0.2% |
| Caribbean | 21 | 0.3% |
| Central America | 13 | 0.2% |
| China | 200 | 3.0% |
| Cuba | 9 | 0.1% |
| Denmark | 11 | 0.2% |
| Eastern Asia | 368 | 5.5% |
| Eastern Europe | 37 | 0.6% |
| England | 7 | 0.1% |
| Europe | 129 | 1.9% |
| France | 8 | 0.1% |
| Germany | 17 | 0.3% |
| Hong Kong | 55 | 0.8% |
| Hungary | 7 | 0.1% |
| India | 24 | 0.4% |
| Iraq | 11 | 0.2% |
| Italy | 49 | 0.7% |
| Kazakhstan | 9 | 0.1% |
| Korea | 168 | 2.5% |
| Latin America | 34 | 0.5% |
| Mexico | 13 | 0.2% |
| Northern Europe | 18 | 0.3% |
| Philippines | 9 | 0.1% |
| Poland | 11 | 0.2% |
| Russia | 9 | 0.1% |
| South Africa | 9 | 0.1% |
| South Central Asia | 33 | 0.5% |
| South Eastern Asia | 60 | 0.9% |
| Southern Europe | 49 | 0.7% |
| Turkey | 31 | 0.5% |
| Vietnam | 51 | 0.8% |
| Western Asia | 42 | 0.6% |
| Western Europe | 25 | 0.4% | View All 35 Rows |
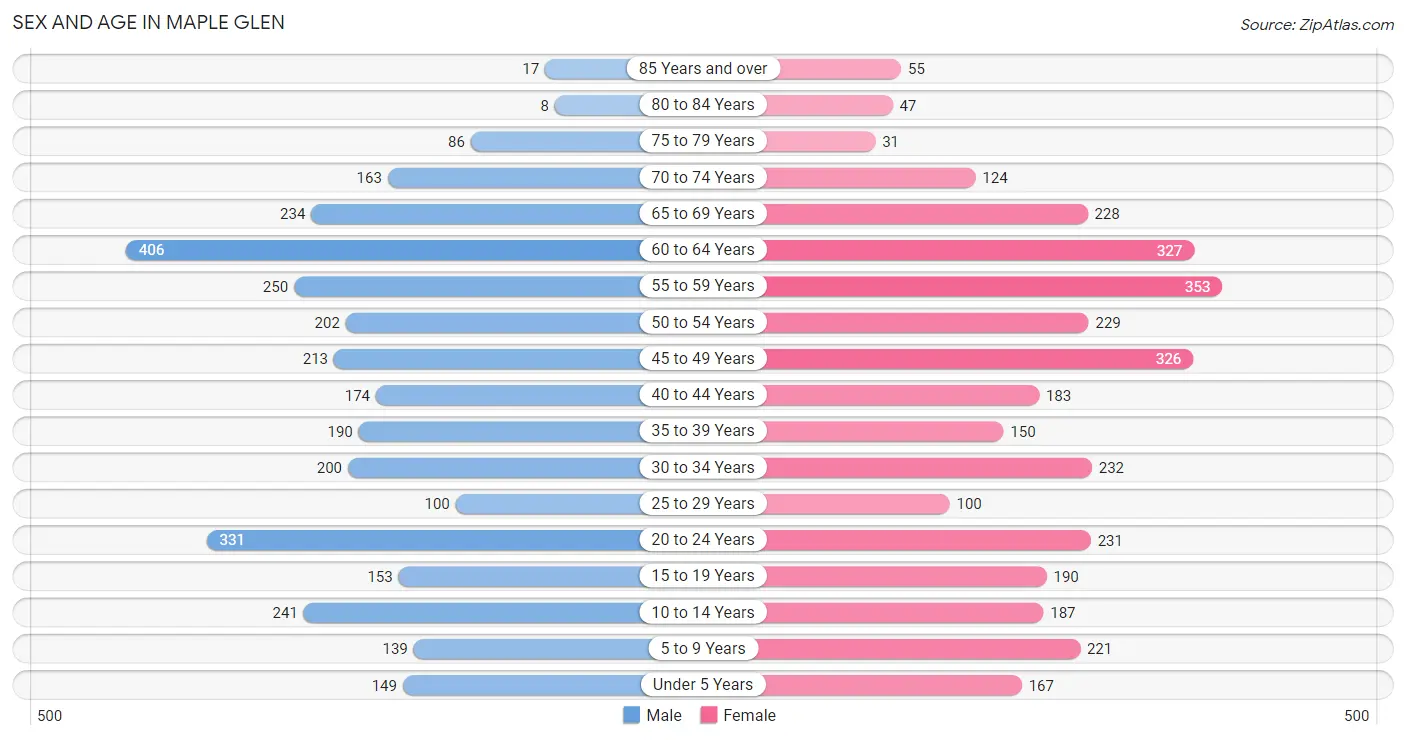
Sex and Age in Maple Glen
Sex and Age in Maple Glen
The most populous age groups in Maple Glen are 60 to 64 Years (406 | 12.5%) for men and 55 to 59 Years (353 | 10.4%) for women.
| Age Bracket | Male | Female |
| Under 5 Years | 149 (4.6%) | 167 (4.9%) |
| 5 to 9 Years | 139 (4.3%) | 221 (6.5%) |
| 10 to 14 Years | 241 (7.4%) | 187 (5.5%) |
| 15 to 19 Years | 153 (4.7%) | 190 (5.6%) |
| 20 to 24 Years | 331 (10.2%) | 231 (6.8%) |
| 25 to 29 Years | 100 (3.1%) | 100 (3.0%) |
| 30 to 34 Years | 200 (6.1%) | 232 (6.9%) |
| 35 to 39 Years | 190 (5.8%) | 150 (4.4%) |
| 40 to 44 Years | 174 (5.3%) | 183 (5.4%) |
| 45 to 49 Years | 213 (6.5%) | 326 (9.6%) |
| 50 to 54 Years | 202 (6.2%) | 229 (6.8%) |
| 55 to 59 Years | 250 (7.7%) | 353 (10.4%) |
| 60 to 64 Years | 406 (12.5%) | 327 (9.7%) |
| 65 to 69 Years | 234 (7.2%) | 228 (6.7%) |
| 70 to 74 Years | 163 (5.0%) | 124 (3.7%) |
| 75 to 79 Years | 86 (2.6%) | 31 (0.9%) |
| 80 to 84 Years | 8 (0.3%) | 47 (1.4%) |
| 85 Years and over | 17 (0.5%) | 55 (1.6%) |
| Total | 3,256 (100.0%) | 3,381 (100.0%) |
Families and Households in Maple Glen
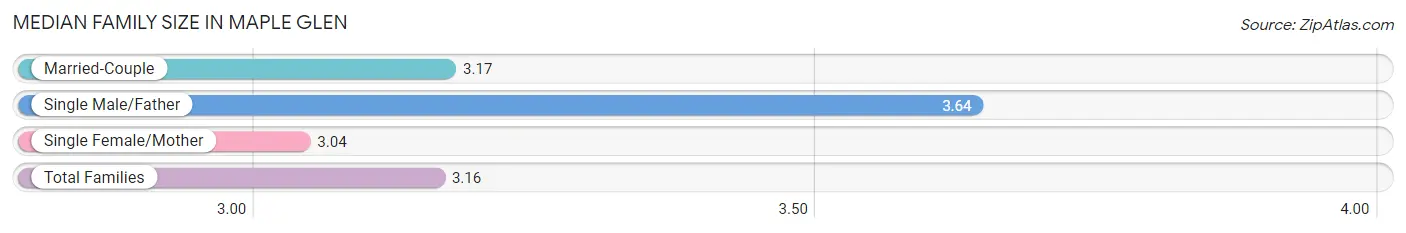
Median Family Size in Maple Glen
The median family size in Maple Glen is 3.16 persons per family, with single male/father families (22 | 1.1%) accounting for the largest median family size of 3.64 persons per family. On the other hand, single female/mother families (217 | 11.2%) represent the smallest median family size with 3.04 persons per family.
| Family Type | # Families | Family Size |
| Married-Couple | 1,694 (87.6%) | 3.17 |
| Single Male/Father | 22 (1.1%) | 3.64 |
| Single Female/Mother | 217 (11.2%) | 3.04 |
| Total Families | 1,933 (100.0%) | 3.16 |
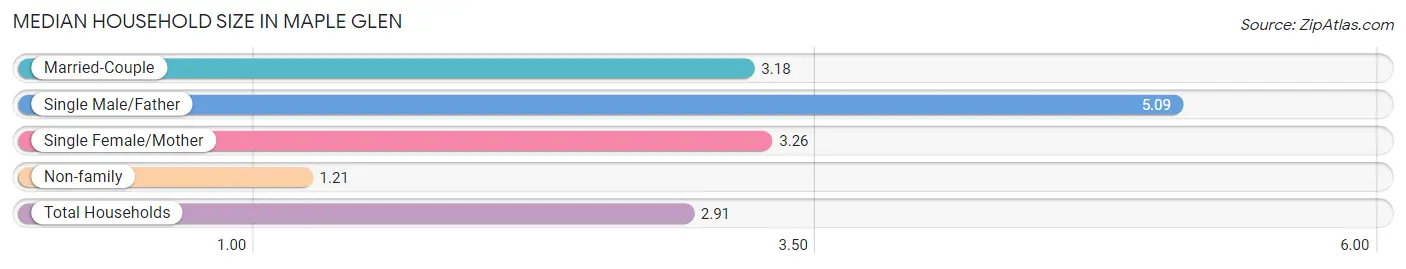
Median Household Size in Maple Glen
The median household size in Maple Glen is 2.91 persons per household, with single male/father households (22 | 1.0%) accounting for the largest median household size of 5.09 persons per household. non-family households (337 | 14.8%) represent the smallest median household size with 1.21 persons per household.
| Household Type | # Households | Household Size |
| Married-Couple | 1,694 (74.6%) | 3.18 |
| Single Male/Father | 22 (1.0%) | 5.09 |
| Single Female/Mother | 217 (9.6%) | 3.26 |
| Non-family | 337 (14.8%) | 1.21 |
| Total Households | 2,270 (100.0%) | 2.91 |
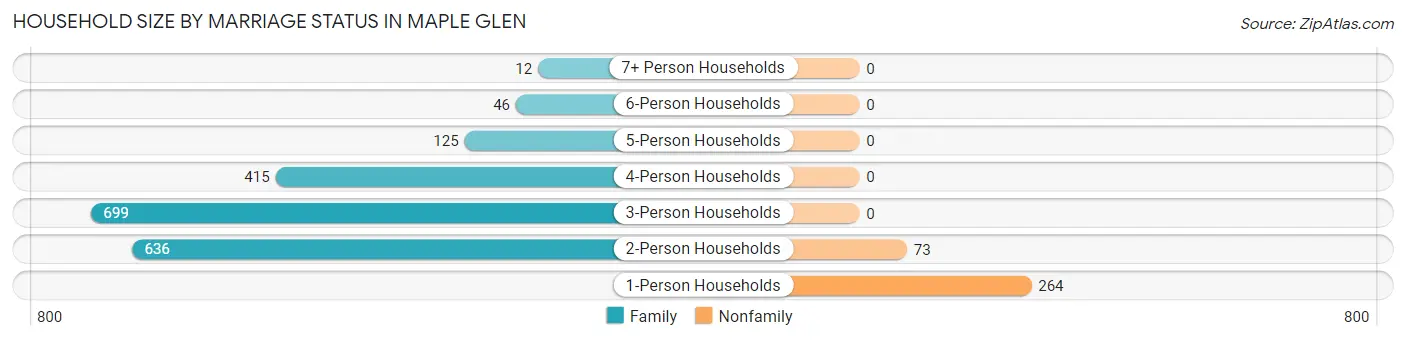
Household Size by Marriage Status in Maple Glen
Out of a total of 2,270 households in Maple Glen, 1,933 (85.2%) are family households, while 337 (14.8%) are nonfamily households. The most numerous type of family households are 3-person households, comprising 699, and the most common type of nonfamily households are 1-person households, comprising 264.
| Household Size | Family Households | Nonfamily Households |
| 1-Person Households | - | 264 (11.6%) |
| 2-Person Households | 636 (28.0%) | 73 (3.2%) |
| 3-Person Households | 699 (30.8%) | 0 (0.0%) |
| 4-Person Households | 415 (18.3%) | 0 (0.0%) |
| 5-Person Households | 125 (5.5%) | 0 (0.0%) |
| 6-Person Households | 46 (2.0%) | 0 (0.0%) |
| 7+ Person Households | 12 (0.5%) | 0 (0.0%) |
| Total | 1,933 (85.2%) | 337 (14.8%) |
Female Fertility in Maple Glen
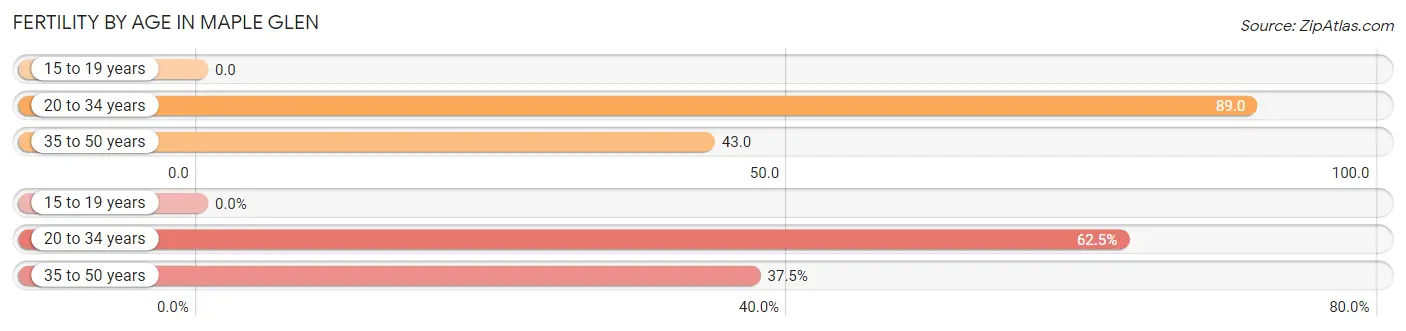
Fertility by Age in Maple Glen
Average fertility rate in Maple Glen is 55.0 births per 1,000 women. Women in the age bracket of 20 to 34 years have the highest fertility rate with 89.0 births per 1,000 women. Women in the age bracket of 20 to 34 years acount for 62.5% of all women with births.
| Age Bracket | Women with Births | Births / 1,000 Women |
| 15 to 19 years | 0 (0.0%) | 0.0 |
| 20 to 34 years | 50 (62.5%) | 89.0 |
| 35 to 50 years | 30 (37.5%) | 43.0 |
| Total | 80 (100.0%) | 55.0 |
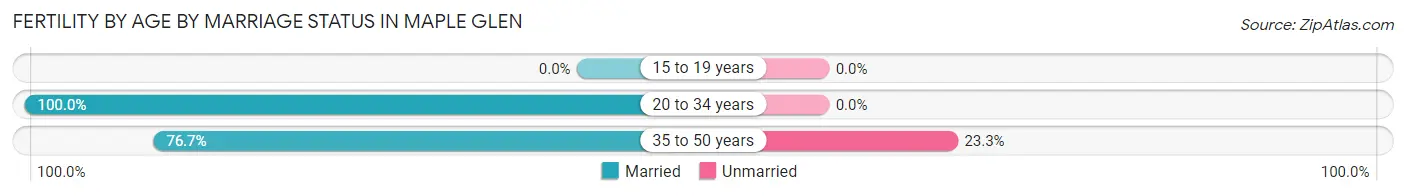
Fertility by Age by Marriage Status in Maple Glen
91.2% of women with births (80) in Maple Glen are married. The highest percentage of unmarried women with births falls into 35 to 50 years age bracket with 23.3% of them unmarried at the time of birth, while the lowest percentage of unmarried women with births belong to 20 to 34 years age bracket with 0.0% of them unmarried.
| Age Bracket | Married | Unmarried |
| 15 to 19 years | 0 (0.0%) | 0 (0.0%) |
| 20 to 34 years | 50 (100.0%) | 0 (0.0%) |
| 35 to 50 years | 23 (76.7%) | 7 (23.3%) |
| Total | 73 (91.2%) | 7 (8.7%) |
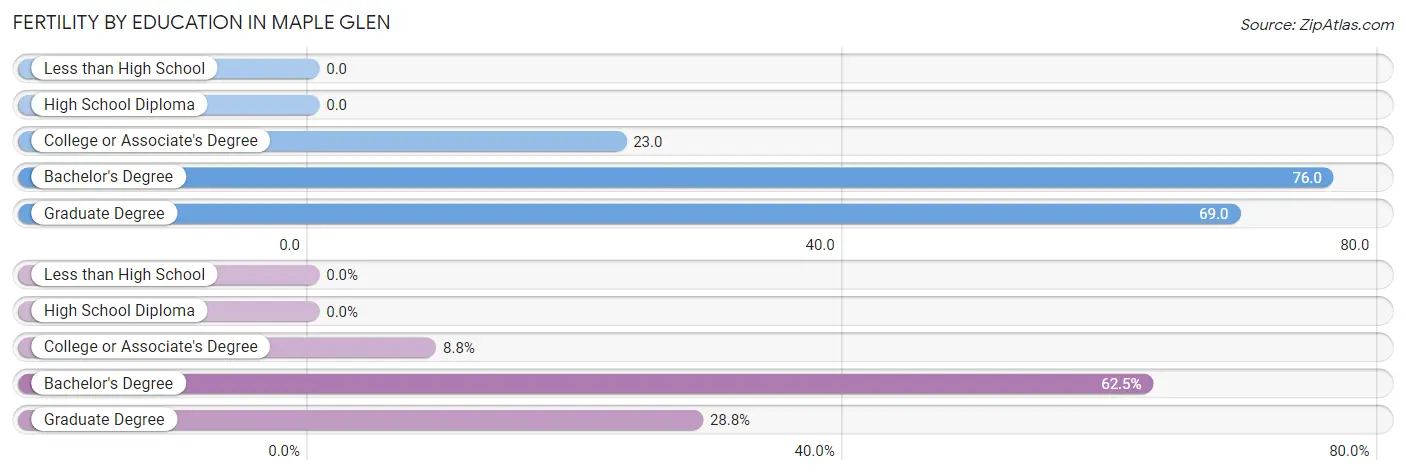
Fertility by Education in Maple Glen
| Educational Attainment | Women with Births | Births / 1,000 Women |
| Less than High School | 0 (0.0%) | 0.0 |
| High School Diploma | 0 (0.0%) | 0.0 |
| College or Associate's Degree | 7 (8.7%) | 23.0 |
| Bachelor's Degree | 50 (62.5%) | 76.0 |
| Graduate Degree | 23 (28.7%) | 69.0 |
| Total | 80 (100.0%) | 55.0 |
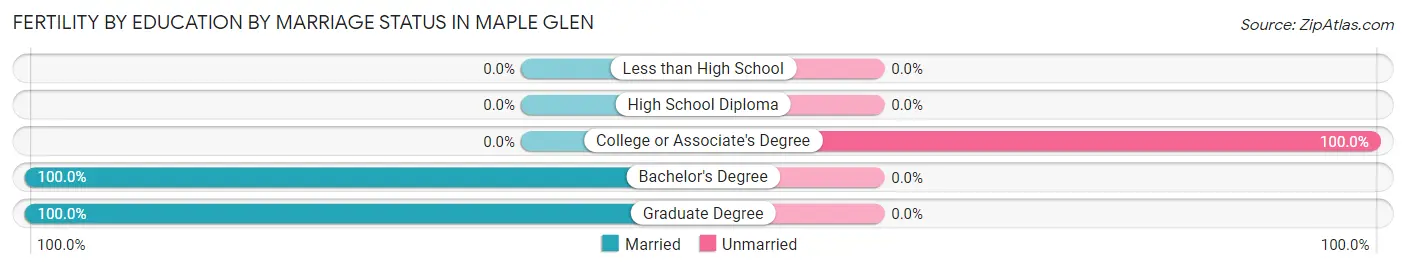
Fertility by Education by Marriage Status in Maple Glen
8.7% of women with births in Maple Glen are unmarried. Women with the educational attainment of bachelor's degree are most likely to be married with 100.0% of them married at childbirth, while women with the educational attainment of college or associate's degree are least likely to be married with 100.0% of them unmarried at childbirth.
| Educational Attainment | Married | Unmarried |
| Less than High School | 0 (0.0%) | 0 (0.0%) |
| High School Diploma | 0 (0.0%) | 0 (0.0%) |
| College or Associate's Degree | 0 (0.0%) | 7 (100.0%) |
| Bachelor's Degree | 50 (100.0%) | 0 (0.0%) |
| Graduate Degree | 23 (100.0%) | 0 (0.0%) |
| Total | 73 (91.2%) | 7 (8.7%) |
Income in Maple Glen
Income Overview in Maple Glen
Per Capita Income in Maple Glen is $72,124, while median incomes of families and households are $183,164 and $166,316 respectively.
| Characteristic | Number | Measure |
| Per Capita Income | 6,637 | $72,124 |
| Median Family Income | 1,933 | $183,164 |
| Mean Family Income | 1,933 | $217,829 |
| Median Household Income | 2,270 | $166,316 |
| Mean Household Income | 2,270 | $203,203 |
| Income Deficit | 1,933 | $0 |
| Wage / Income Gap (%) | 6,637 | 7.54% |
| Wage / Income Gap ($) | 6,637 | 92.46¢ per $1 |
| Gini / Inequality Index | 6,637 | 0.40 |
Earnings by Sex in Maple Glen
Average Earnings in Maple Glen are $69,947, $73,002 for men and $67,500 for women, a difference of 7.5%.
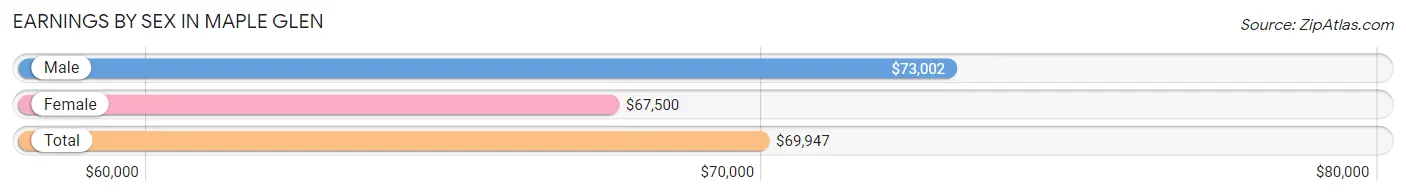
| Sex | Number | Average Earnings |
| Male | 2,223 (53.0%) | $73,002 |
| Female | 1,974 (47.0%) | $67,500 |
| Total | 4,197 (100.0%) | $69,947 |
Earnings by Sex by Income Bracket in Maple Glen
The most common earnings brackets in Maple Glen are $100,000+ for men (789 | 35.5%) and $100,000+ for women (609 | 30.8%).
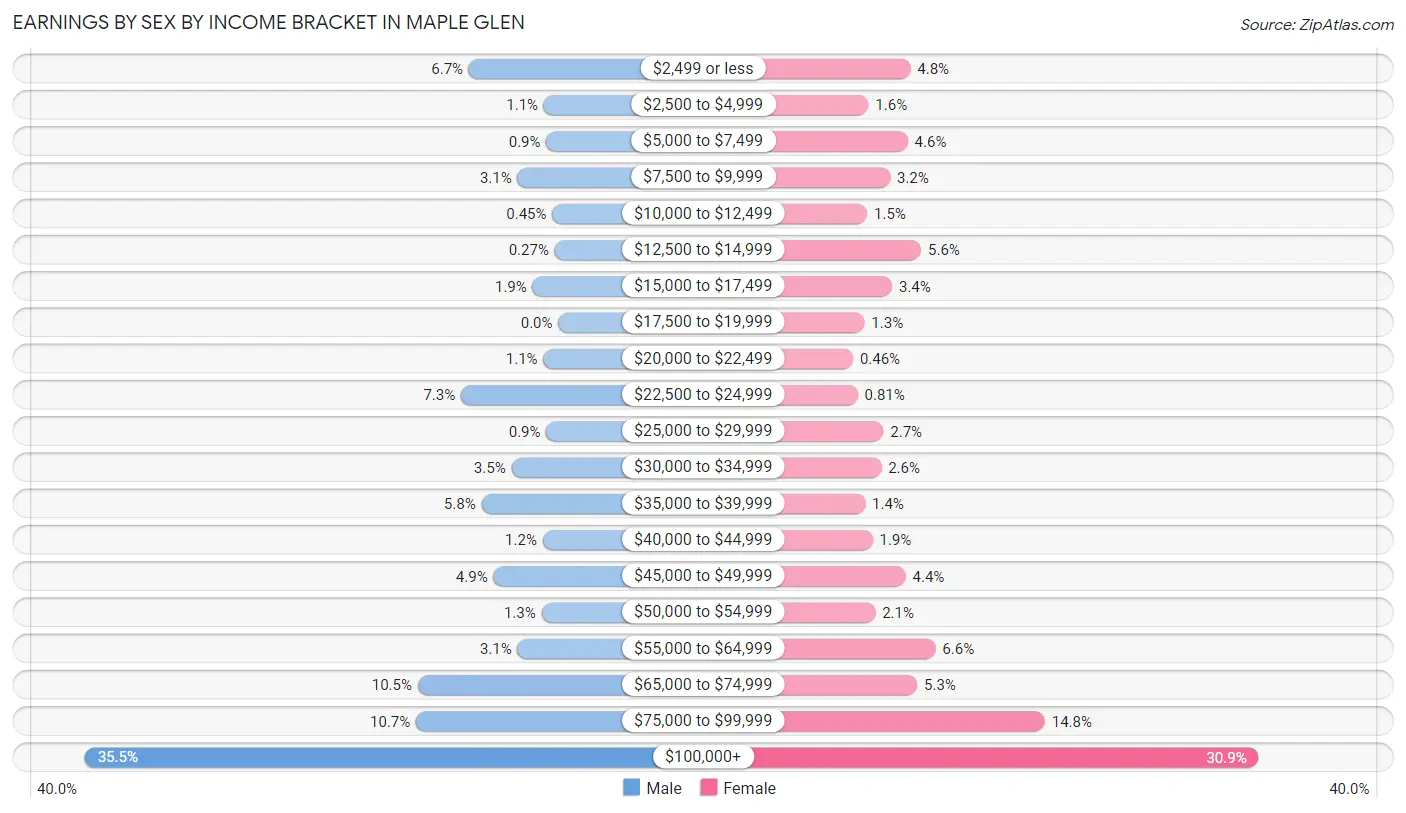
| Income | Male | Female |
| $2,499 or less | 149 (6.7%) | 94 (4.8%) |
| $2,500 to $4,999 | 24 (1.1%) | 32 (1.6%) |
| $5,000 to $7,499 | 20 (0.9%) | 90 (4.6%) |
| $7,500 to $9,999 | 68 (3.1%) | 64 (3.2%) |
| $10,000 to $12,499 | 10 (0.4%) | 30 (1.5%) |
| $12,500 to $14,999 | 6 (0.3%) | 110 (5.6%) |
| $15,000 to $17,499 | 43 (1.9%) | 67 (3.4%) |
| $17,500 to $19,999 | 0 (0.0%) | 26 (1.3%) |
| $20,000 to $22,499 | 25 (1.1%) | 9 (0.5%) |
| $22,500 to $24,999 | 162 (7.3%) | 16 (0.8%) |
| $25,000 to $29,999 | 20 (0.9%) | 54 (2.7%) |
| $30,000 to $34,999 | 78 (3.5%) | 51 (2.6%) |
| $35,000 to $39,999 | 128 (5.8%) | 27 (1.4%) |
| $40,000 to $44,999 | 26 (1.2%) | 38 (1.9%) |
| $45,000 to $49,999 | 108 (4.9%) | 87 (4.4%) |
| $50,000 to $54,999 | 28 (1.3%) | 42 (2.1%) |
| $55,000 to $64,999 | 68 (3.1%) | 131 (6.6%) |
| $65,000 to $74,999 | 234 (10.5%) | 104 (5.3%) |
| $75,000 to $99,999 | 237 (10.7%) | 293 (14.8%) |
| $100,000+ | 789 (35.5%) | 609 (30.8%) |
| Total | 2,223 (100.0%) | 1,974 (100.0%) |
Earnings by Sex by Educational Attainment in Maple Glen
Average earnings in Maple Glen are $86,199 for men and $76,667 for women, a difference of 11.1%. Men with an educational attainment of graduate degree enjoy the highest average annual earnings of $133,625, while those with high school diploma education earn the least with $36,720. Women with an educational attainment of graduate degree earn the most with the average annual earnings of $118,125, while those with high school diploma education have the smallest earnings of $15,368.
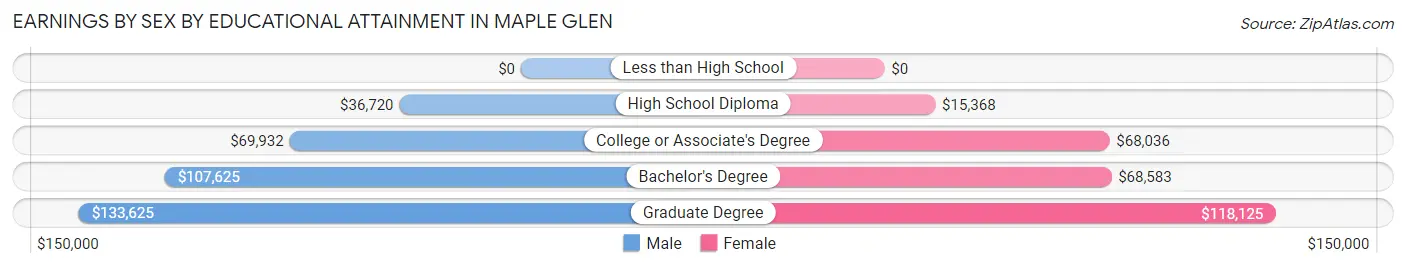
| Educational Attainment | Male Income | Female Income |
| Less than High School | - | - |
| High School Diploma | $36,720 | $15,368 |
| College or Associate's Degree | $69,932 | $68,036 |
| Bachelor's Degree | $107,625 | $68,583 |
| Graduate Degree | $133,625 | $118,125 |
| Total | $86,199 | $76,667 |
Family Income in Maple Glen
Family Income Brackets in Maple Glen
According to the Maple Glen family income data, there are 878 families falling into the $200,000+ income range, which is the most common income bracket and makes up 45.4% of all families.
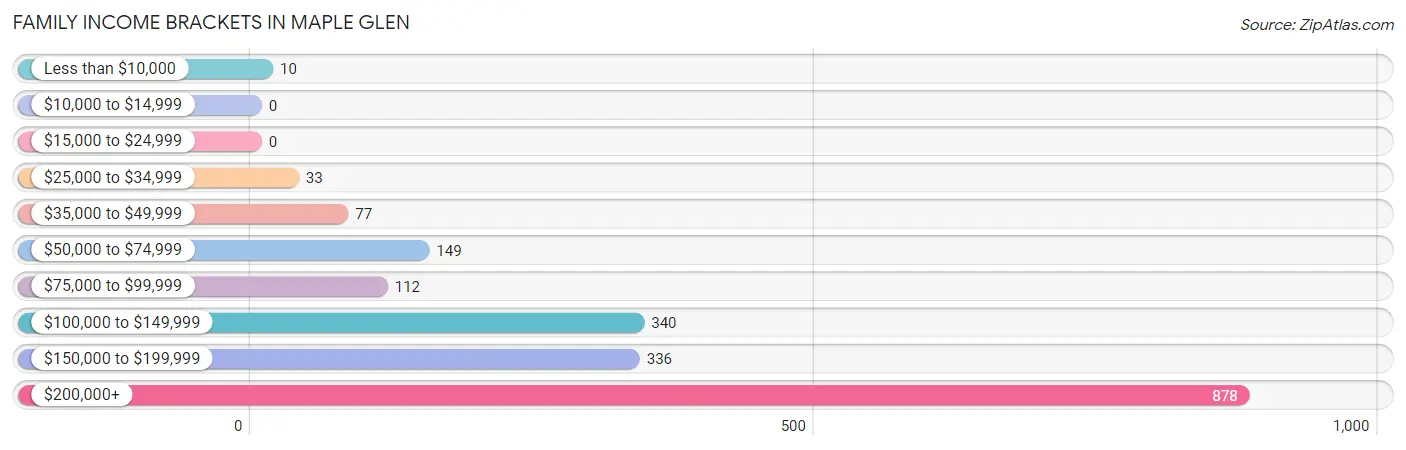
| Income Bracket | # Families | % Families |
| Less than $10,000 | 10 | 0.5% |
| $10,000 to $14,999 | 0 | 0.0% |
| $15,000 to $24,999 | 0 | 0.0% |
| $25,000 to $34,999 | 33 | 1.7% |
| $35,000 to $49,999 | 77 | 4.0% |
| $50,000 to $74,999 | 149 | 7.7% |
| $75,000 to $99,999 | 112 | 5.8% |
| $100,000 to $149,999 | 340 | 17.6% |
| $150,000 to $199,999 | 336 | 17.4% |
| $200,000+ | 878 | 45.4% |
Family Income by Famaliy Size in Maple Glen
6-person families (46 | 2.4%) account for the highest median family income in Maple Glen with $250,001 per family, while 2-person families (686 | 35.5%) have the highest median income of $91,625 per family member.
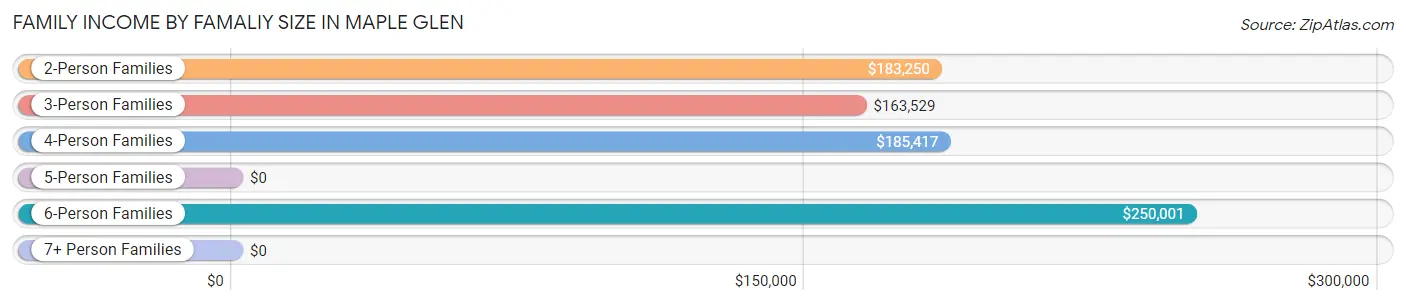
| Income Bracket | # Families | Median Income |
| 2-Person Families | 686 (35.5%) | $183,250 |
| 3-Person Families | 674 (34.9%) | $163,529 |
| 4-Person Families | 398 (20.6%) | $185,417 |
| 5-Person Families | 117 (6.0%) | $0 |
| 6-Person Families | 46 (2.4%) | $250,001 |
| 7+ Person Families | 12 (0.6%) | $0 |
| Total | 1,933 (100.0%) | $183,164 |
Family Income by Number of Earners in Maple Glen
The median family income in Maple Glen is $183,164, with families comprising 2 earners (856) having the highest median family income of $196,429, while families with no earners (143) have the lowest median family income of $115,694, accounting for 44.3% and 7.4% of families, respectively.
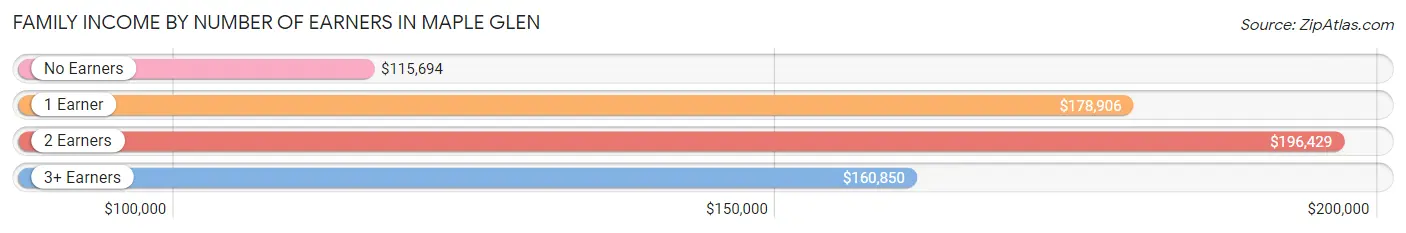
| Number of Earners | # Families | Median Income |
| No Earners | 143 (7.4%) | $115,694 |
| 1 Earner | 473 (24.5%) | $178,906 |
| 2 Earners | 856 (44.3%) | $196,429 |
| 3+ Earners | 461 (23.8%) | $160,850 |
| Total | 1,933 (100.0%) | $183,164 |
Household Income in Maple Glen
Household Income Brackets in Maple Glen
With 922 households falling in the category, the $200,000+ income range is the most frequent in Maple Glen, accounting for 40.6% of all households. In contrast, only 16 households (0.7%) fall into the $10,000 to $14,999 income bracket, making it the least populous group.
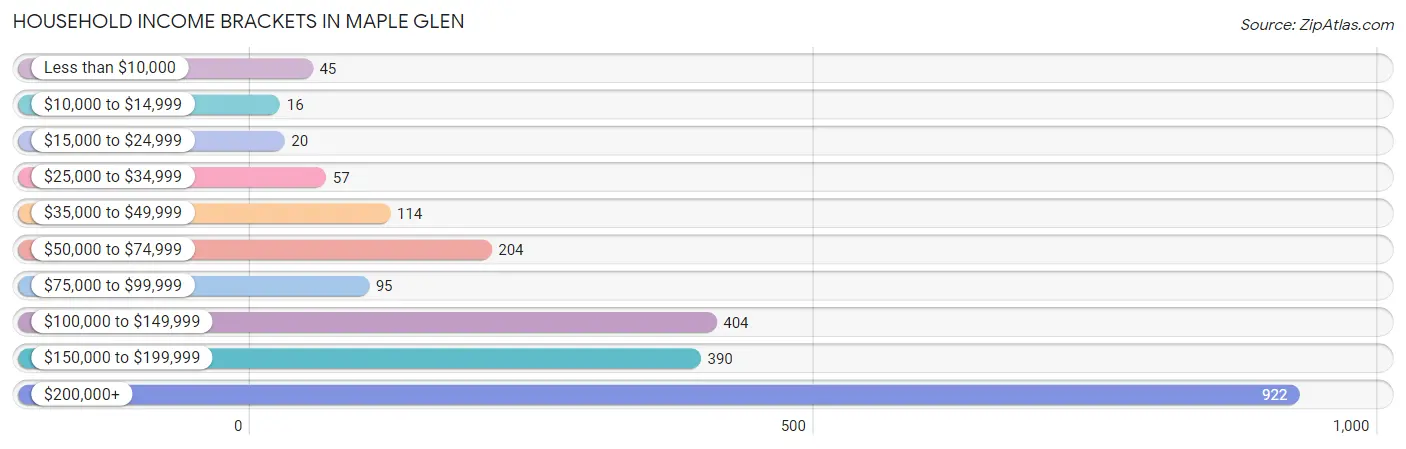
| Income Bracket | # Households | % Households |
| Less than $10,000 | 45 | 2.0% |
| $10,000 to $14,999 | 16 | 0.7% |
| $15,000 to $24,999 | 20 | 0.9% |
| $25,000 to $34,999 | 57 | 2.5% |
| $35,000 to $49,999 | 114 | 5.0% |
| $50,000 to $74,999 | 204 | 9.0% |
| $75,000 to $99,999 | 95 | 4.2% |
| $100,000 to $149,999 | 404 | 17.8% |
| $150,000 to $199,999 | 390 | 17.2% |
| $200,000+ | 922 | 40.6% |
Household Income by Householder Age in Maple Glen
The median household income in Maple Glen is $166,316, with the highest median household income of $184,318 found in the 25 to 44 years age bracket for the primary householder. A total of 464 households (20.4%) fall into this category.
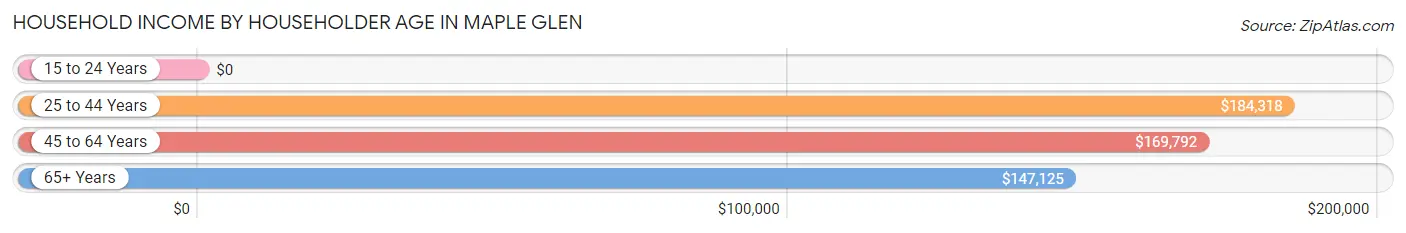
| Income Bracket | # Households | Median Income |
| 15 to 24 Years | 0 (0.0%) | $0 |
| 25 to 44 Years | 464 (20.4%) | $184,318 |
| 45 to 64 Years | 1,267 (55.8%) | $169,792 |
| 65+ Years | 539 (23.7%) | $147,125 |
| Total | 2,270 (100.0%) | $166,316 |
Poverty in Maple Glen
Income Below Poverty by Sex and Age in Maple Glen
With 2.3% poverty level for males and 1.5% for females among the residents of Maple Glen, 75 year old and over males and 5 year old females are the most vulnerable to poverty, with 9 males (8.1%) and 9 females (26.5%) in their respective age groups living below the poverty level.
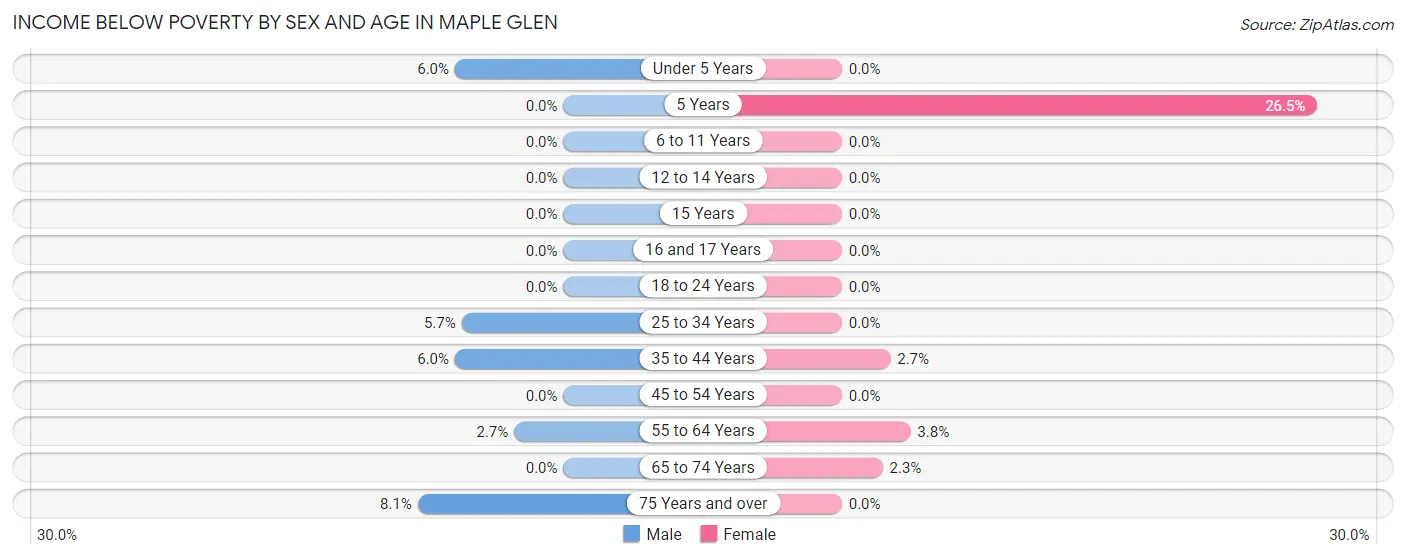
| Age Bracket | Male | Female |
| Under 5 Years | 9 (6.0%) | 0 (0.0%) |
| 5 Years | 0 (0.0%) | 9 (26.5%) |
| 6 to 11 Years | 0 (0.0%) | 0 (0.0%) |
| 12 to 14 Years | 0 (0.0%) | 0 (0.0%) |
| 15 Years | 0 (0.0%) | 0 (0.0%) |
| 16 and 17 Years | 0 (0.0%) | 0 (0.0%) |
| 18 to 24 Years | 0 (0.0%) | 0 (0.0%) |
| 25 to 34 Years | 17 (5.7%) | 0 (0.0%) |
| 35 to 44 Years | 22 (6.0%) | 9 (2.7%) |
| 45 to 54 Years | 0 (0.0%) | 0 (0.0%) |
| 55 to 64 Years | 18 (2.7%) | 26 (3.8%) |
| 65 to 74 Years | 0 (0.0%) | 8 (2.3%) |
| 75 Years and over | 9 (8.1%) | 0 (0.0%) |
| Total | 75 (2.3%) | 52 (1.5%) |
Income Above Poverty by Sex and Age in Maple Glen
According to the poverty statistics in Maple Glen, males aged 6 to 11 years and females aged under 5 years are the age groups that are most secure financially, with 100.0% of males and 100.0% of females in these age groups living above the poverty line.
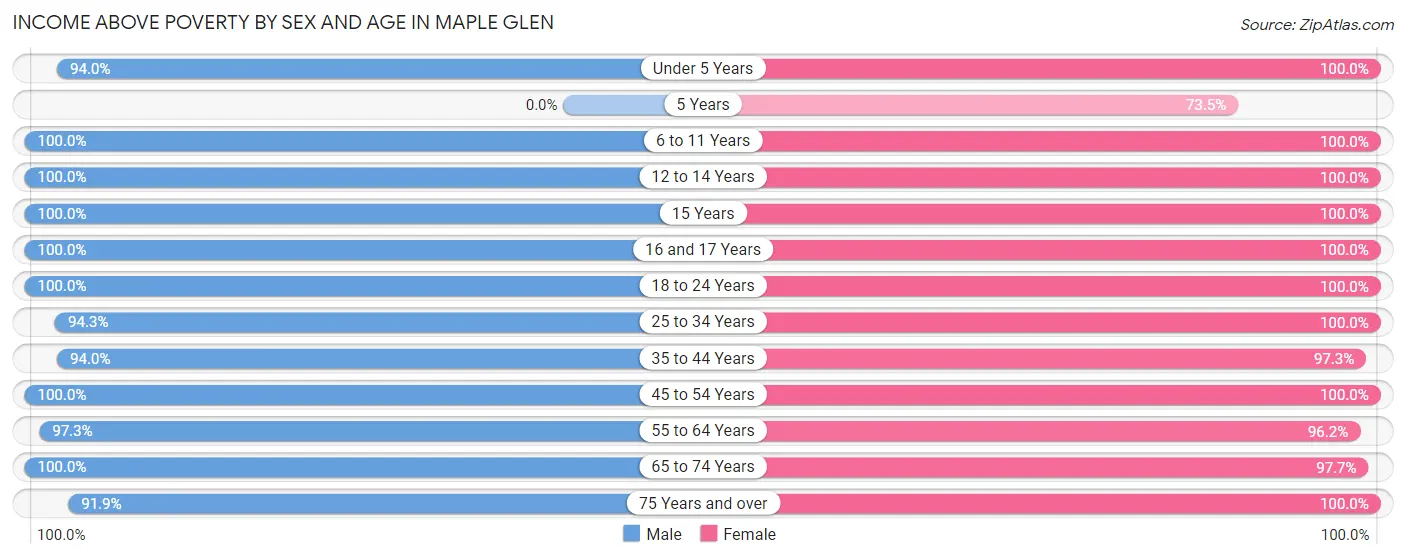
| Age Bracket | Male | Female |
| Under 5 Years | 140 (94.0%) | 167 (100.0%) |
| 5 Years | 0 (0.0%) | 25 (73.5%) |
| 6 to 11 Years | 206 (100.0%) | 223 (100.0%) |
| 12 to 14 Years | 158 (100.0%) | 151 (100.0%) |
| 15 Years | 33 (100.0%) | 23 (100.0%) |
| 16 and 17 Years | 101 (100.0%) | 70 (100.0%) |
| 18 to 24 Years | 350 (100.0%) | 328 (100.0%) |
| 25 to 34 Years | 283 (94.3%) | 332 (100.0%) |
| 35 to 44 Years | 342 (94.0%) | 324 (97.3%) |
| 45 to 54 Years | 415 (100.0%) | 555 (100.0%) |
| 55 to 64 Years | 638 (97.3%) | 654 (96.2%) |
| 65 to 74 Years | 397 (100.0%) | 344 (97.7%) |
| 75 Years and over | 102 (91.9%) | 133 (100.0%) |
| Total | 3,165 (97.7%) | 3,329 (98.5%) |
Income Below Poverty Among Married-Couple Families in Maple Glen
The poverty statistics for married-couple families in Maple Glen show that 0.5% or 9 of the total 1,694 families live below the poverty line. Families with 1 or 2 children have the highest poverty rate of 1.5%, comprising of 9 families. On the other hand, families with no children have the lowest poverty rate of 0.0%, which includes 0 families.
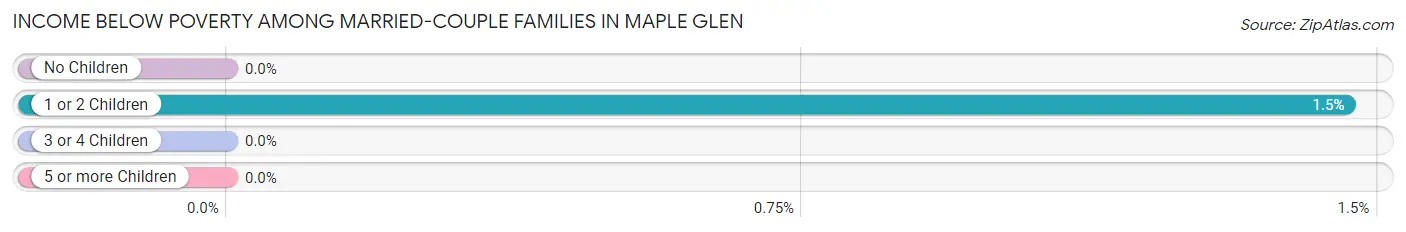
| Children | Above Poverty | Below Poverty |
| No Children | 975 (100.0%) | 0 (0.0%) |
| 1 or 2 Children | 607 (98.5%) | 9 (1.5%) |
| 3 or 4 Children | 91 (100.0%) | 0 (0.0%) |
| 5 or more Children | 12 (100.0%) | 0 (0.0%) |
| Total | 1,685 (99.5%) | 9 (0.5%) |
Income Below Poverty Among Single-Parent Households in Maple Glen
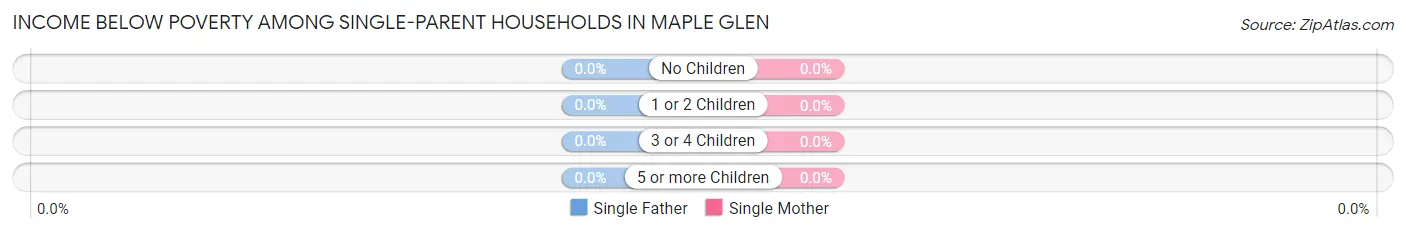
| Children | Single Father | Single Mother |
| No Children | 0 (0.0%) | 0 (0.0%) |
| 1 or 2 Children | 0 (0.0%) | 0 (0.0%) |
| 3 or 4 Children | 0 (0.0%) | 0 (0.0%) |
| 5 or more Children | 0 (0.0%) | 0 (0.0%) |
| Total | 0 (0.0%) | 0 (0.0%) |
Income Below Poverty Among Married-Couple vs Single-Parent Households in Maple Glen
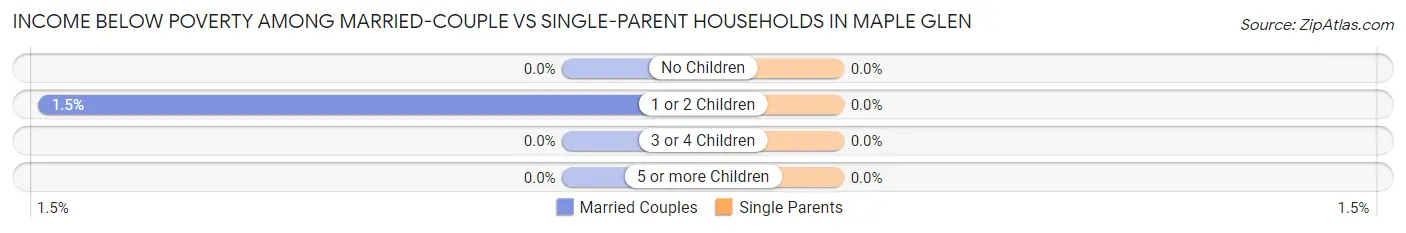
| Children | Married-Couple Families | Single-Parent Households |
| No Children | 0 (0.0%) | 0 (0.0%) |
| 1 or 2 Children | 9 (1.5%) | 0 (0.0%) |
| 3 or 4 Children | 0 (0.0%) | 0 (0.0%) |
| 5 or more Children | 0 (0.0%) | 0 (0.0%) |
| Total | 9 (0.5%) | 0 (0.0%) |
Employment Characteristics in Maple Glen
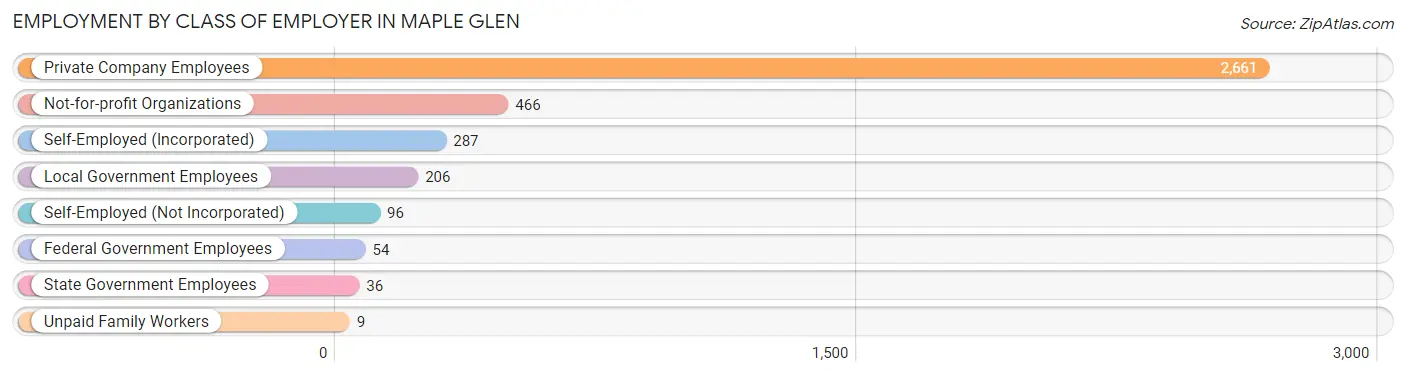
Employment by Class of Employer in Maple Glen
Among the 3,815 employed individuals in Maple Glen, private company employees (2,661 | 69.8%), not-for-profit organizations (466 | 12.2%), and self-employed (incorporated) (287 | 7.5%) make up the most common classes of employment.
| Employer Class | # Employees | % Employees |
| Private Company Employees | 2,661 | 69.8% |
| Self-Employed (Incorporated) | 287 | 7.5% |
| Self-Employed (Not Incorporated) | 96 | 2.5% |
| Not-for-profit Organizations | 466 | 12.2% |
| Local Government Employees | 206 | 5.4% |
| State Government Employees | 36 | 0.9% |
| Federal Government Employees | 54 | 1.4% |
| Unpaid Family Workers | 9 | 0.2% |
| Total | 3,815 | 100.0% |
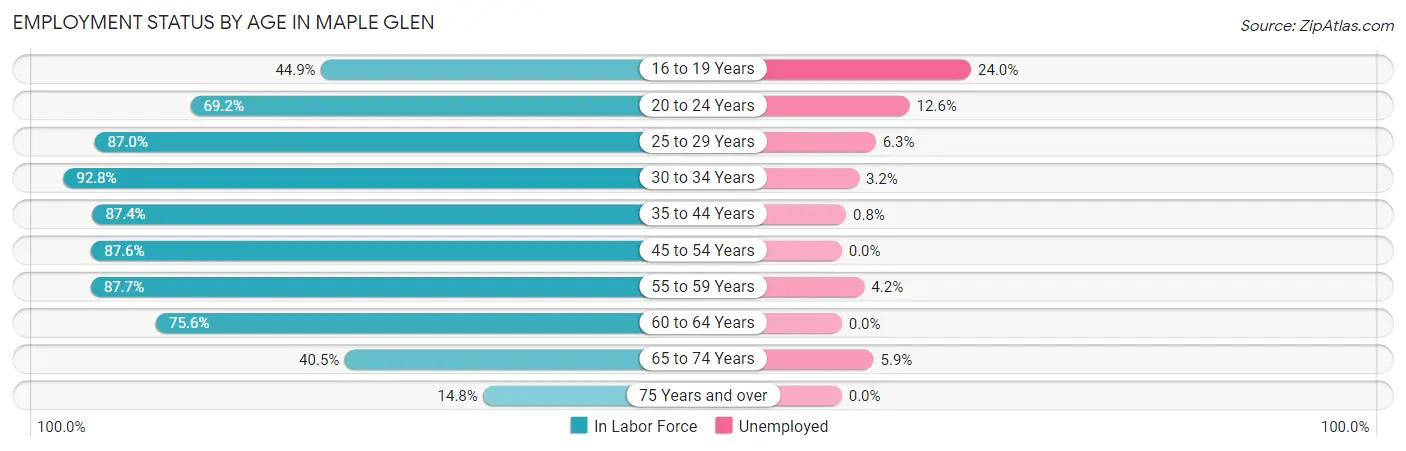
Employment Status by Age in Maple Glen
According to the labor force statistics for Maple Glen, out of the total population over 16 years of age (5,477), 72.6% or 3,976 individuals are in the labor force, with 3.7% or 147 of them unemployed. The age group with the highest labor force participation rate is 30 to 34 years, with 92.8% or 401 individuals in the labor force. Within the labor force, the 16 to 19 years age range has the highest percentage of unemployed individuals, with 24.0% or 31 of them being unemployed.
| Age Bracket | In Labor Force | Unemployed |
| 16 to 19 Years | 129 (44.9%) | 31 (24.0%) |
| 20 to 24 Years | 389 (69.2%) | 49 (12.6%) |
| 25 to 29 Years | 174 (87.0%) | 11 (6.3%) |
| 30 to 34 Years | 401 (92.8%) | 13 (3.2%) |
| 35 to 44 Years | 609 (87.4%) | 5 (0.8%) |
| 45 to 54 Years | 850 (87.6%) | 0 (0.0%) |
| 55 to 59 Years | 529 (87.7%) | 22 (4.2%) |
| 60 to 64 Years | 554 (75.6%) | 0 (0.0%) |
| 65 to 74 Years | 303 (40.5%) | 18 (5.9%) |
| 75 Years and over | 36 (14.8%) | 0 (0.0%) |
| Total | 3,976 (72.6%) | 147 (3.7%) |
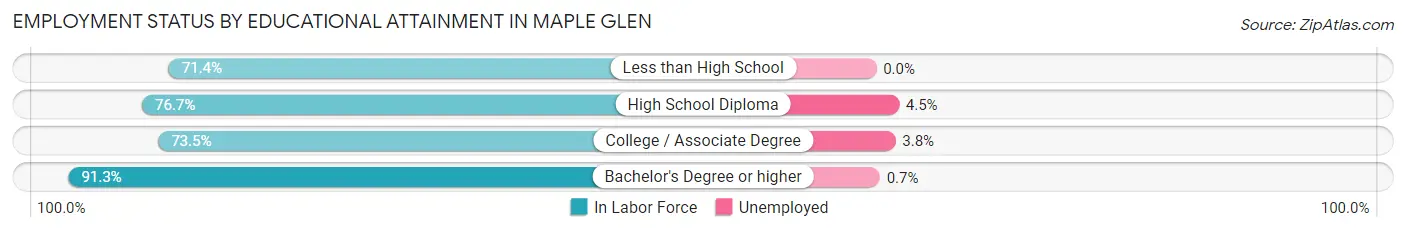
Employment Status by Educational Attainment in Maple Glen
According to labor force statistics for Maple Glen, 85.7% of individuals (3,115) out of the total population between 25 and 64 years of age (3,635) are in the labor force, with 1.6% or 50 of them being unemployed. The group with the highest labor force participation rate are those with the educational attainment of bachelor's degree or higher, with 91.3% or 2,226 individuals in the labor force. Within the labor force, individuals with high school diploma education have the highest percentage of unemployment, with 4.5% or 13 of them being unemployed.
| Educational Attainment | In Labor Force | Unemployed |
| Less than High School | 25 (71.4%) | 0 (0.0%) |
| High School Diploma | 290 (76.7%) | 17 (4.5%) |
| College / Associate Degree | 576 (73.5%) | 30 (3.8%) |
| Bachelor's Degree or higher | 2,226 (91.3%) | 17 (0.7%) |
| Total | 3,115 (85.7%) | 58 (1.6%) |
Employment Occupations by Sex in Maple Glen
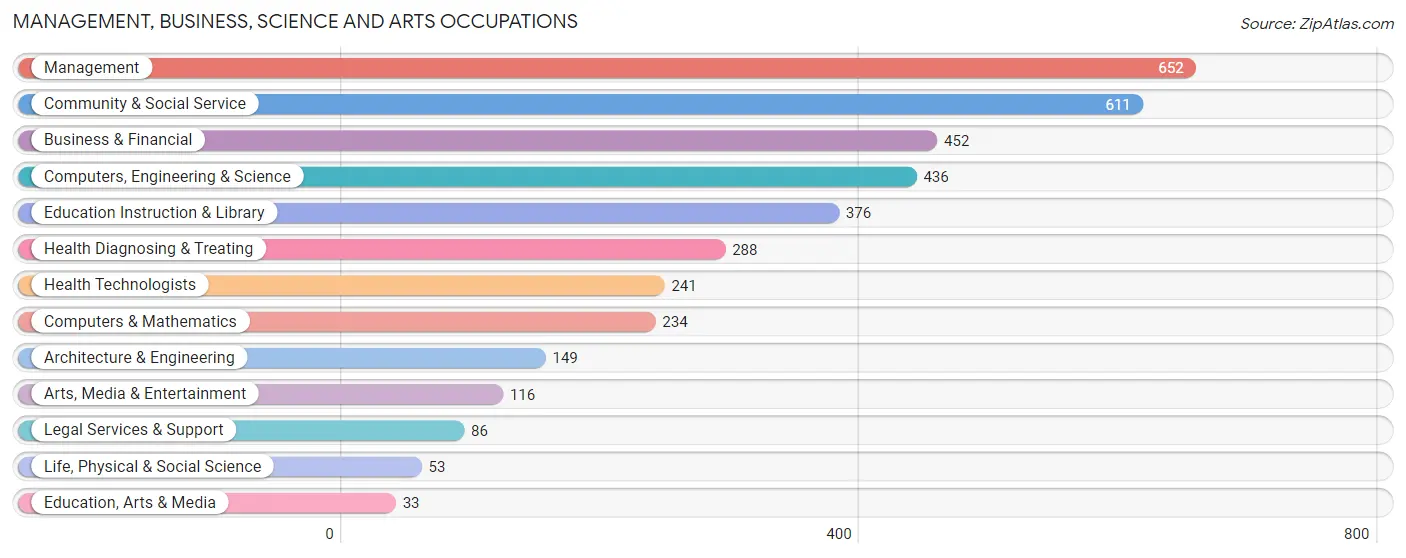
Management, Business, Science and Arts Occupations
The most common Management, Business, Science and Arts occupations in Maple Glen are Management (652 | 17.1%), Community & Social Service (611 | 16.0%), Business & Financial (452 | 11.8%), Computers, Engineering & Science (436 | 11.4%), and Education Instruction & Library (376 | 9.8%).
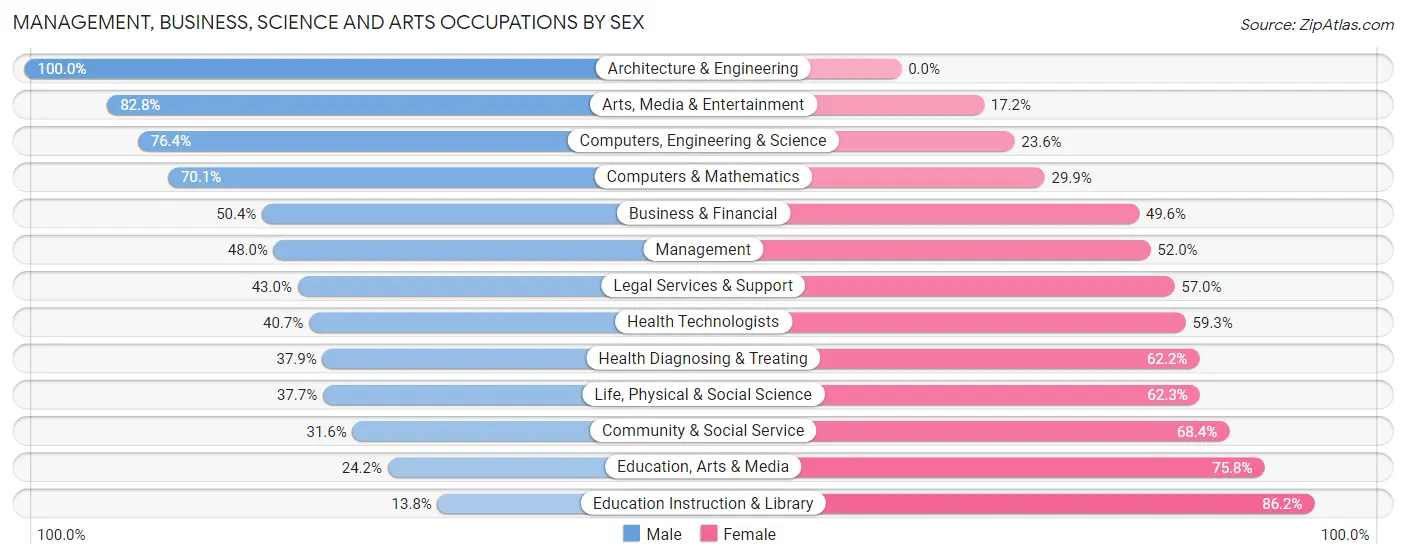
Management, Business, Science and Arts Occupations by Sex
Within the Management, Business, Science and Arts occupations in Maple Glen, the most male-oriented occupations are Architecture & Engineering (100.0%), Arts, Media & Entertainment (82.8%), and Computers, Engineering & Science (76.4%), while the most female-oriented occupations are Education Instruction & Library (86.2%), Education, Arts & Media (75.8%), and Community & Social Service (68.4%).
| Occupation | Male | Female |
| Management | 313 (48.0%) | 339 (52.0%) |
| Business & Financial | 228 (50.4%) | 224 (49.6%) |
| Computers, Engineering & Science | 333 (76.4%) | 103 (23.6%) |
| Computers & Mathematics | 164 (70.1%) | 70 (29.9%) |
| Architecture & Engineering | 149 (100.0%) | 0 (0.0%) |
| Life, Physical & Social Science | 20 (37.7%) | 33 (62.3%) |
| Community & Social Service | 193 (31.6%) | 418 (68.4%) |
| Education, Arts & Media | 8 (24.2%) | 25 (75.8%) |
| Legal Services & Support | 37 (43.0%) | 49 (57.0%) |
| Education Instruction & Library | 52 (13.8%) | 324 (86.2%) |
| Arts, Media & Entertainment | 96 (82.8%) | 20 (17.2%) |
| Health Diagnosing & Treating | 109 (37.9%) | 179 (62.2%) |
| Health Technologists | 98 (40.7%) | 143 (59.3%) |
| Total (Category) | 1,176 (48.2%) | 1,263 (51.8%) |
| Total (Overall) | 2,038 (53.3%) | 1,787 (46.7%) |
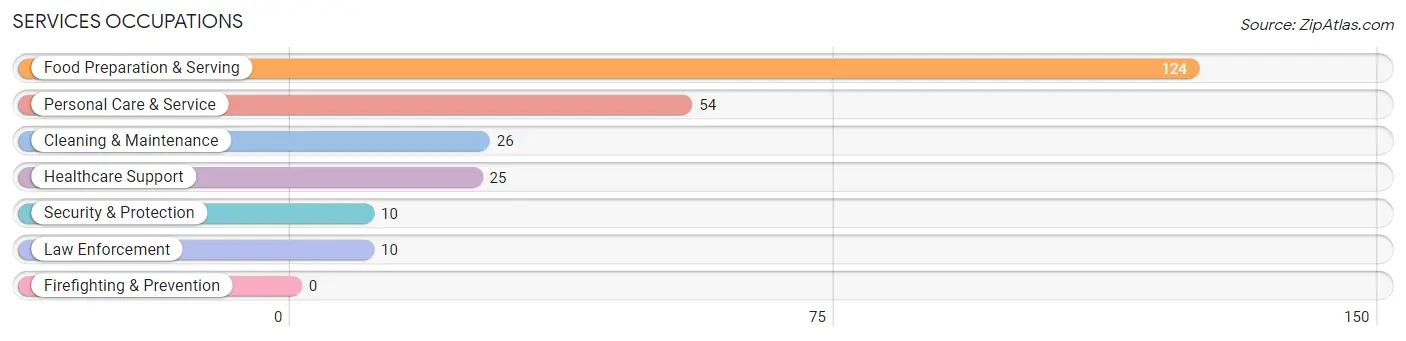
Services Occupations
The most common Services occupations in Maple Glen are Food Preparation & Serving (124 | 3.2%), Personal Care & Service (54 | 1.4%), Cleaning & Maintenance (26 | 0.7%), Healthcare Support (25 | 0.6%), and Security & Protection (10 | 0.3%).
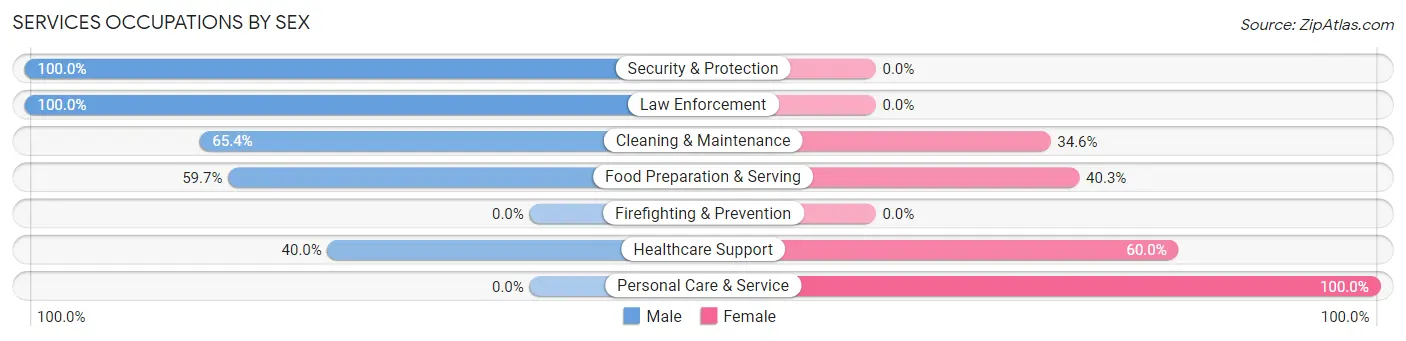
Services Occupations by Sex
Within the Services occupations in Maple Glen, the most male-oriented occupations are Security & Protection (100.0%), Law Enforcement (100.0%), and Cleaning & Maintenance (65.4%), while the most female-oriented occupations are Personal Care & Service (100.0%), Healthcare Support (60.0%), and Food Preparation & Serving (40.3%).
| Occupation | Male | Female |
| Healthcare Support | 10 (40.0%) | 15 (60.0%) |
| Security & Protection | 10 (100.0%) | 0 (0.0%) |
| Firefighting & Prevention | 0 (0.0%) | 0 (0.0%) |
| Law Enforcement | 10 (100.0%) | 0 (0.0%) |
| Food Preparation & Serving | 74 (59.7%) | 50 (40.3%) |
| Cleaning & Maintenance | 17 (65.4%) | 9 (34.6%) |
| Personal Care & Service | 0 (0.0%) | 54 (100.0%) |
| Total (Category) | 111 (46.4%) | 128 (53.6%) |
| Total (Overall) | 2,038 (53.3%) | 1,787 (46.7%) |
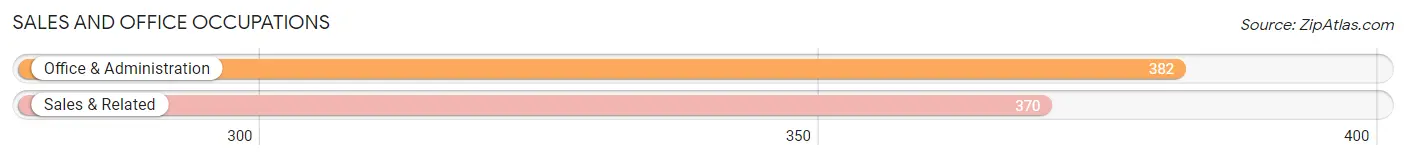
Sales and Office Occupations
The most common Sales and Office occupations in Maple Glen are Office & Administration (382 | 10.0%), and Sales & Related (370 | 9.7%).
Sales and Office Occupations by Sex
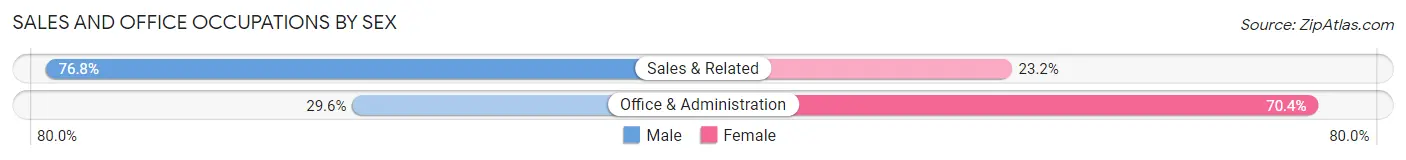
| Occupation | Male | Female |
| Sales & Related | 284 (76.8%) | 86 (23.2%) |
| Office & Administration | 113 (29.6%) | 269 (70.4%) |
| Total (Category) | 397 (52.8%) | 355 (47.2%) |
| Total (Overall) | 2,038 (53.3%) | 1,787 (46.7%) |
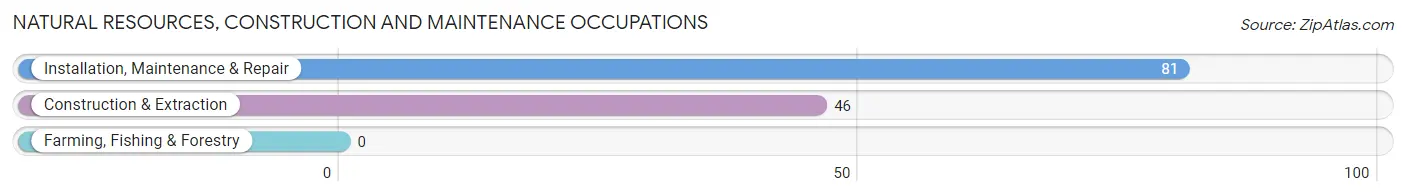
Natural Resources, Construction and Maintenance Occupations
The most common Natural Resources, Construction and Maintenance occupations in Maple Glen are Installation, Maintenance & Repair (81 | 2.1%), and Construction & Extraction (46 | 1.2%).
Natural Resources, Construction and Maintenance Occupations by Sex
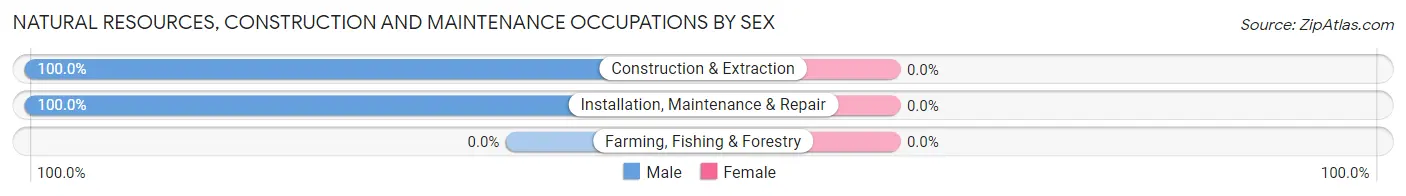
| Occupation | Male | Female |
| Farming, Fishing & Forestry | 0 (0.0%) | 0 (0.0%) |
| Construction & Extraction | 46 (100.0%) | 0 (0.0%) |
| Installation, Maintenance & Repair | 81 (100.0%) | 0 (0.0%) |
| Total (Category) | 127 (100.0%) | 0 (0.0%) |
| Total (Overall) | 2,038 (53.3%) | 1,787 (46.7%) |
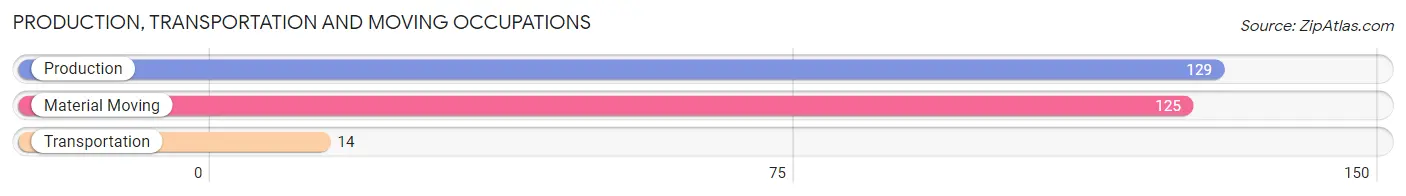
Production, Transportation and Moving Occupations
The most common Production, Transportation and Moving occupations in Maple Glen are Production (129 | 3.4%), Material Moving (125 | 3.3%), and Transportation (14 | 0.4%).
Production, Transportation and Moving Occupations by Sex
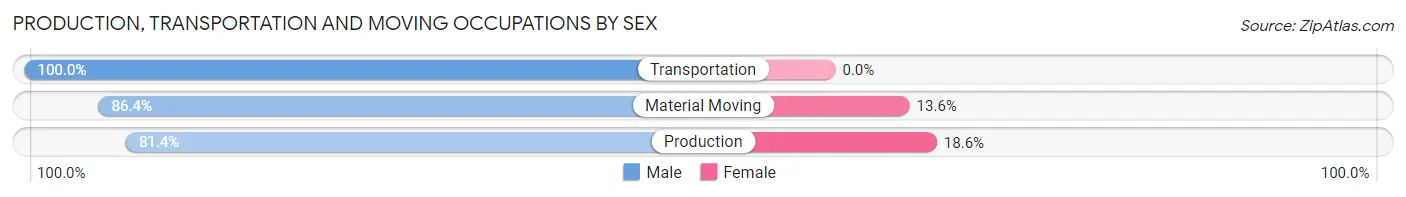
| Occupation | Male | Female |
| Production | 105 (81.4%) | 24 (18.6%) |
| Transportation | 14 (100.0%) | 0 (0.0%) |
| Material Moving | 108 (86.4%) | 17 (13.6%) |
| Total (Category) | 227 (84.7%) | 41 (15.3%) |
| Total (Overall) | 2,038 (53.3%) | 1,787 (46.7%) |
Employment Industries by Sex in Maple Glen
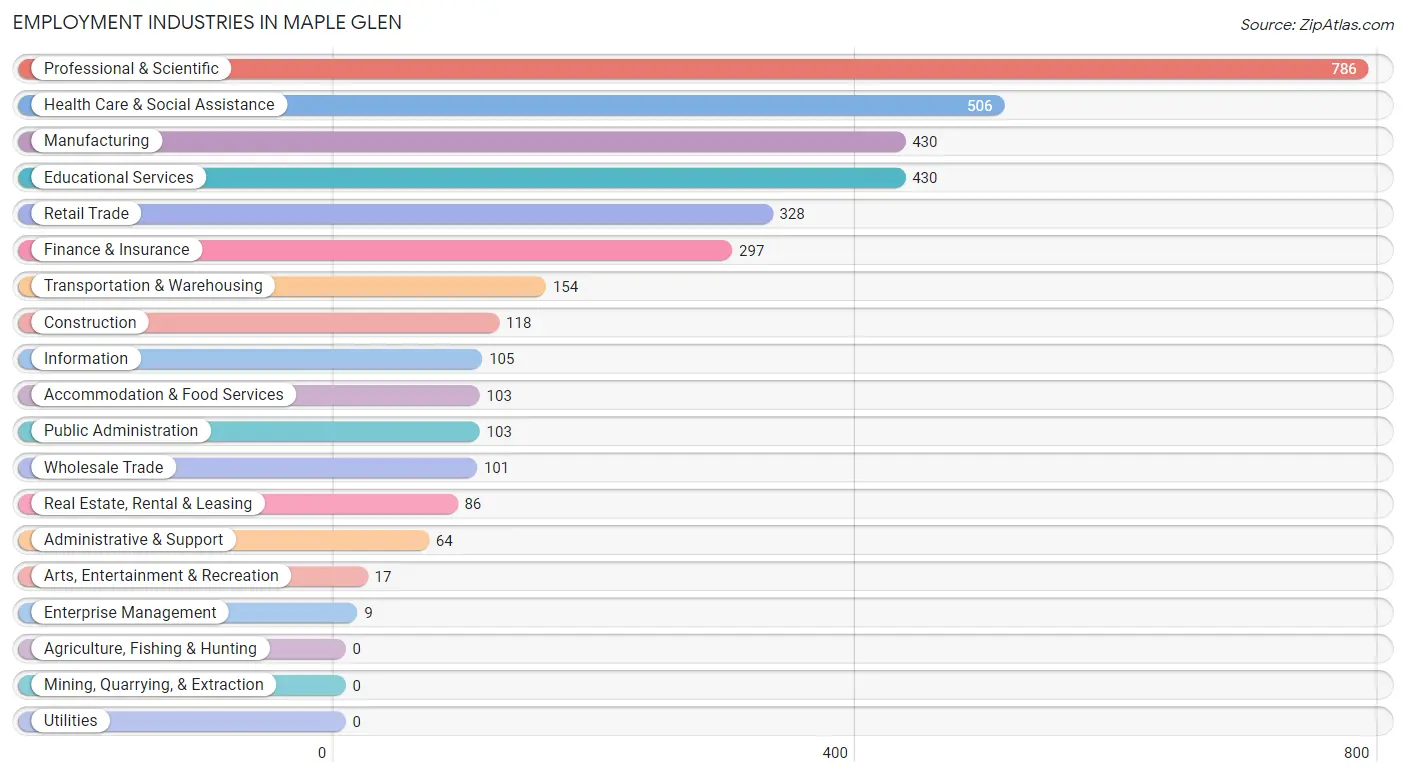
Employment Industries in Maple Glen
The major employment industries in Maple Glen include Professional & Scientific (786 | 20.5%), Health Care & Social Assistance (506 | 13.2%), Manufacturing (430 | 11.2%), Educational Services (430 | 11.2%), and Retail Trade (328 | 8.6%).
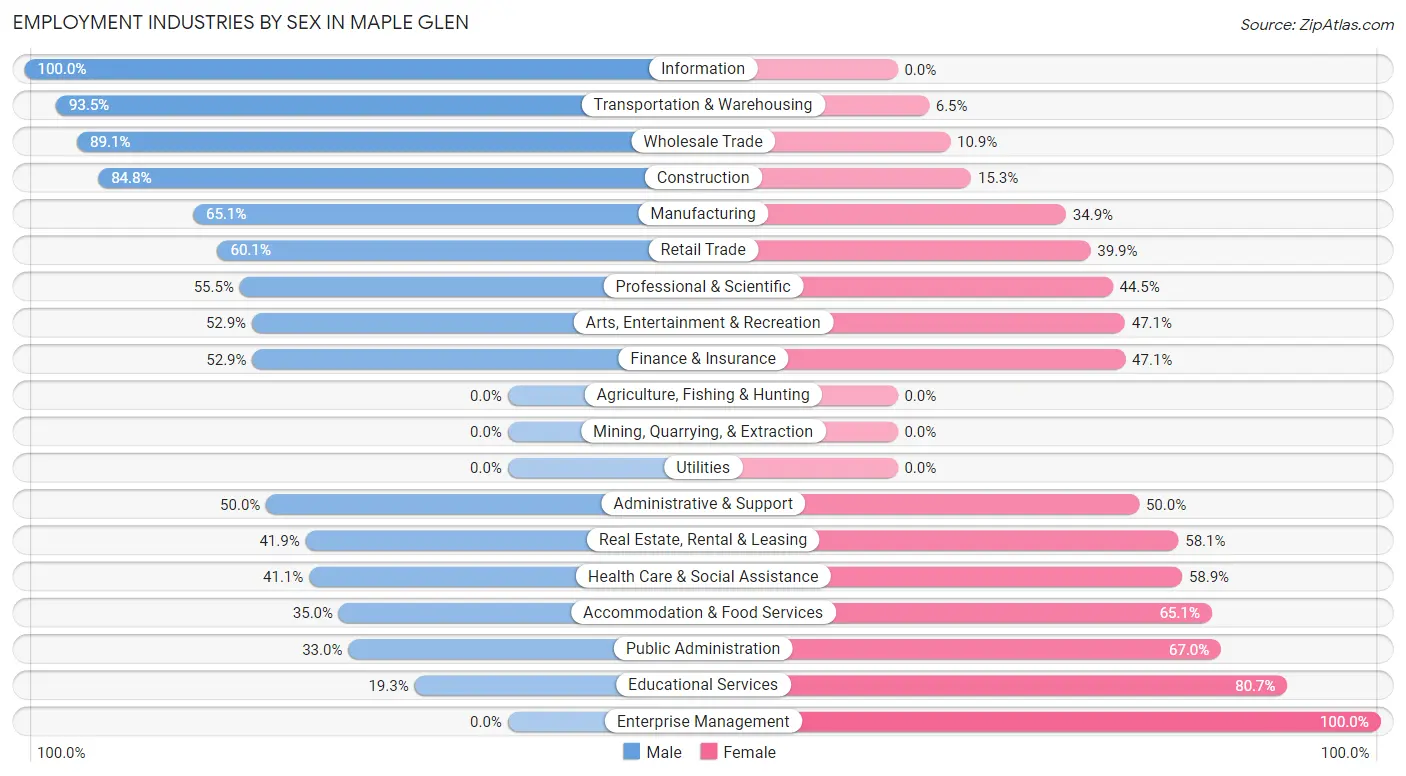
Employment Industries by Sex in Maple Glen
The Maple Glen industries that see more men than women are Information (100.0%), Transportation & Warehousing (93.5%), and Wholesale Trade (89.1%), whereas the industries that tend to have a higher number of women are Enterprise Management (100.0%), Educational Services (80.7%), and Public Administration (67.0%).
| Industry | Male | Female |
| Agriculture, Fishing & Hunting | 0 (0.0%) | 0 (0.0%) |
| Mining, Quarrying, & Extraction | 0 (0.0%) | 0 (0.0%) |
| Construction | 100 (84.8%) | 18 (15.2%) |
| Manufacturing | 280 (65.1%) | 150 (34.9%) |
| Wholesale Trade | 90 (89.1%) | 11 (10.9%) |
| Retail Trade | 197 (60.1%) | 131 (39.9%) |
| Transportation & Warehousing | 144 (93.5%) | 10 (6.5%) |
| Utilities | 0 (0.0%) | 0 (0.0%) |
| Information | 105 (100.0%) | 0 (0.0%) |
| Finance & Insurance | 157 (52.9%) | 140 (47.1%) |
| Real Estate, Rental & Leasing | 36 (41.9%) | 50 (58.1%) |
| Professional & Scientific | 436 (55.5%) | 350 (44.5%) |
| Enterprise Management | 0 (0.0%) | 9 (100.0%) |
| Administrative & Support | 32 (50.0%) | 32 (50.0%) |
| Educational Services | 83 (19.3%) | 347 (80.7%) |
| Health Care & Social Assistance | 208 (41.1%) | 298 (58.9%) |
| Arts, Entertainment & Recreation | 9 (52.9%) | 8 (47.1%) |
| Accommodation & Food Services | 36 (34.9%) | 67 (65.0%) |
| Public Administration | 34 (33.0%) | 69 (67.0%) |
| Total | 2,038 (53.3%) | 1,787 (46.7%) |
Education in Maple Glen
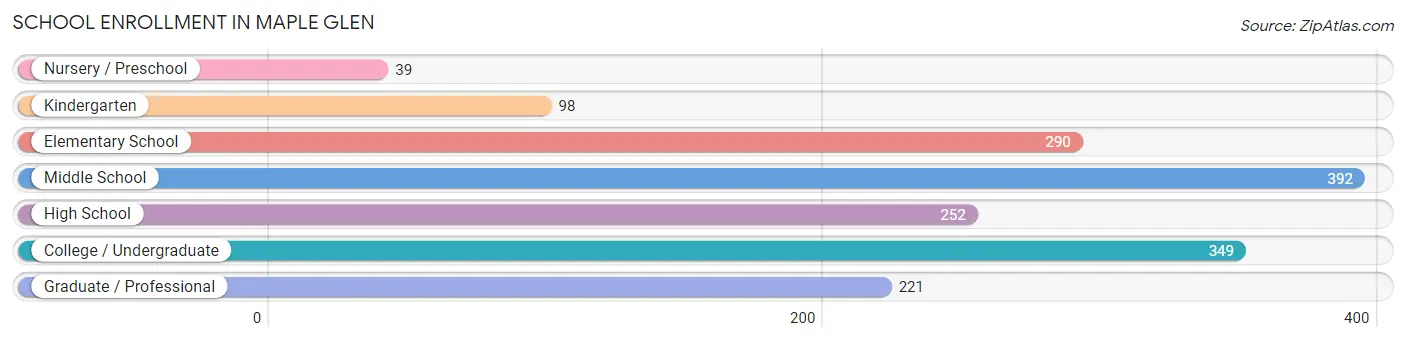
School Enrollment in Maple Glen
The most common levels of schooling among the 1,641 students in Maple Glen are middle school (392 | 23.9%), college / undergraduate (349 | 21.3%), and elementary school (290 | 17.7%).
| School Level | # Students | % Students |
| Nursery / Preschool | 39 | 2.4% |
| Kindergarten | 98 | 6.0% |
| Elementary School | 290 | 17.7% |
| Middle School | 392 | 23.9% |
| High School | 252 | 15.4% |
| College / Undergraduate | 349 | 21.3% |
| Graduate / Professional | 221 | 13.5% |
| Total | 1,641 | 100.0% |
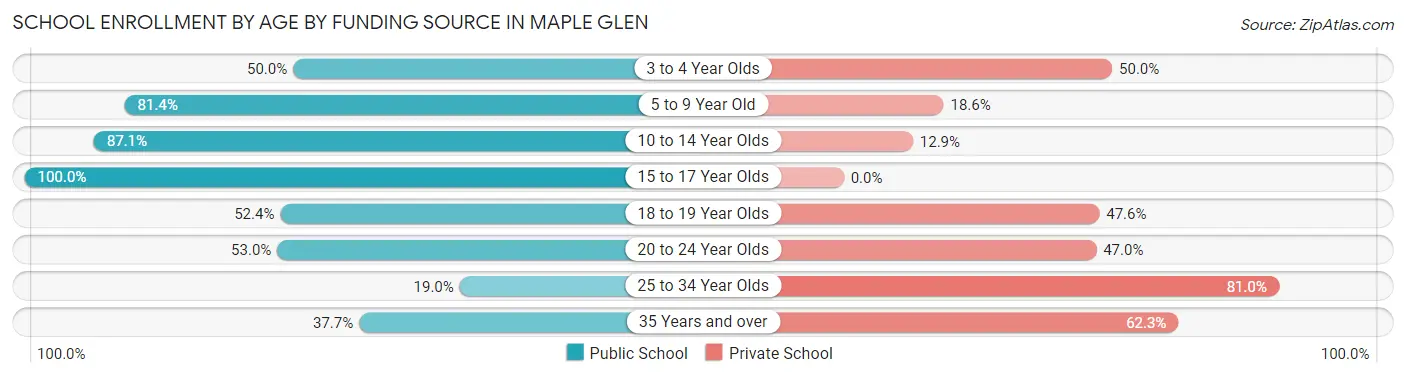
School Enrollment by Age by Funding Source in Maple Glen
Out of a total of 1,641 students who are enrolled in schools in Maple Glen, 459 (28.0%) attend a private institution, while the remaining 1,182 (72.0%) are enrolled in public schools. The age group of 25 to 34 year olds has the highest likelihood of being enrolled in private schools, with 47 (81.0% in the age bracket) enrolled. Conversely, the age group of 15 to 17 year olds has the lowest likelihood of being enrolled in a private school, with 227 (100.0% in the age bracket) attending a public institution.
| Age Bracket | Public School | Private School |
| 3 to 4 Year Olds | 23 (50.0%) | 23 (50.0%) |
| 5 to 9 Year Old | 293 (81.4%) | 67 (18.6%) |
| 10 to 14 Year Olds | 365 (87.1%) | 54 (12.9%) |
| 15 to 17 Year Olds | 227 (100.0%) | 0 (0.0%) |
| 18 to 19 Year Olds | 55 (52.4%) | 50 (47.6%) |
| 20 to 24 Year Olds | 161 (53.0%) | 143 (47.0%) |
| 25 to 34 Year Olds | 11 (19.0%) | 47 (81.0%) |
| 35 Years and over | 46 (37.7%) | 76 (62.3%) |
| Total | 1,182 (72.0%) | 459 (28.0%) |
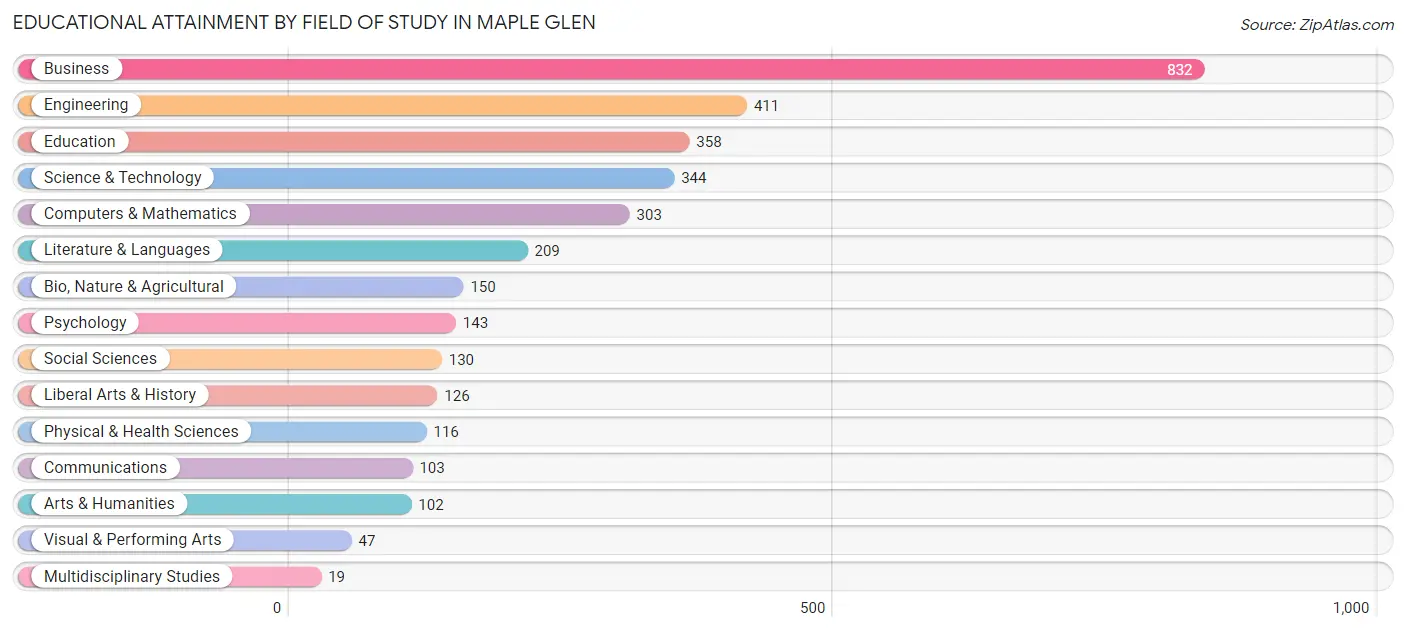
Educational Attainment by Field of Study in Maple Glen
Business (832 | 24.5%), engineering (411 | 12.1%), education (358 | 10.5%), science & technology (344 | 10.1%), and computers & mathematics (303 | 8.9%) are the most common fields of study among 3,393 individuals in Maple Glen who have obtained a bachelor's degree or higher.
| Field of Study | # Graduates | % Graduates |
| Computers & Mathematics | 303 | 8.9% |
| Bio, Nature & Agricultural | 150 | 4.4% |
| Physical & Health Sciences | 116 | 3.4% |
| Psychology | 143 | 4.2% |
| Social Sciences | 130 | 3.8% |
| Engineering | 411 | 12.1% |
| Multidisciplinary Studies | 19 | 0.6% |
| Science & Technology | 344 | 10.1% |
| Business | 832 | 24.5% |
| Education | 358 | 10.5% |
| Literature & Languages | 209 | 6.2% |
| Liberal Arts & History | 126 | 3.7% |
| Visual & Performing Arts | 47 | 1.4% |
| Communications | 103 | 3.0% |
| Arts & Humanities | 102 | 3.0% |
| Total | 3,393 | 100.0% |
Transportation & Commute in Maple Glen
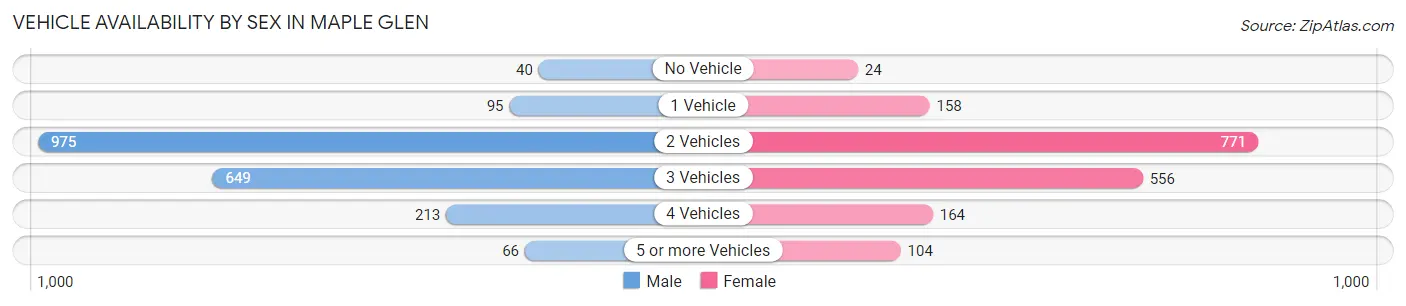
Vehicle Availability by Sex in Maple Glen
The most prevalent vehicle ownership categories in Maple Glen are males with 2 vehicles (975, accounting for 47.8%) and females with 2 vehicles (771, making up 54.9%).
| Vehicles Available | Male | Female |
| No Vehicle | 40 (2.0%) | 24 (1.3%) |
| 1 Vehicle | 95 (4.7%) | 158 (8.9%) |
| 2 Vehicles | 975 (47.8%) | 771 (43.4%) |
| 3 Vehicles | 649 (31.8%) | 556 (31.3%) |
| 4 Vehicles | 213 (10.4%) | 164 (9.2%) |
| 5 or more Vehicles | 66 (3.2%) | 104 (5.9%) |
| Total | 2,038 (100.0%) | 1,777 (100.0%) |
Commute Time in Maple Glen
The most frequently occuring commute durations in Maple Glen are 45 to 59 minutes (459 commuters, 15.5%), 30 to 34 minutes (426 commuters, 14.4%), and 10 to 14 minutes (368 commuters, 12.4%).
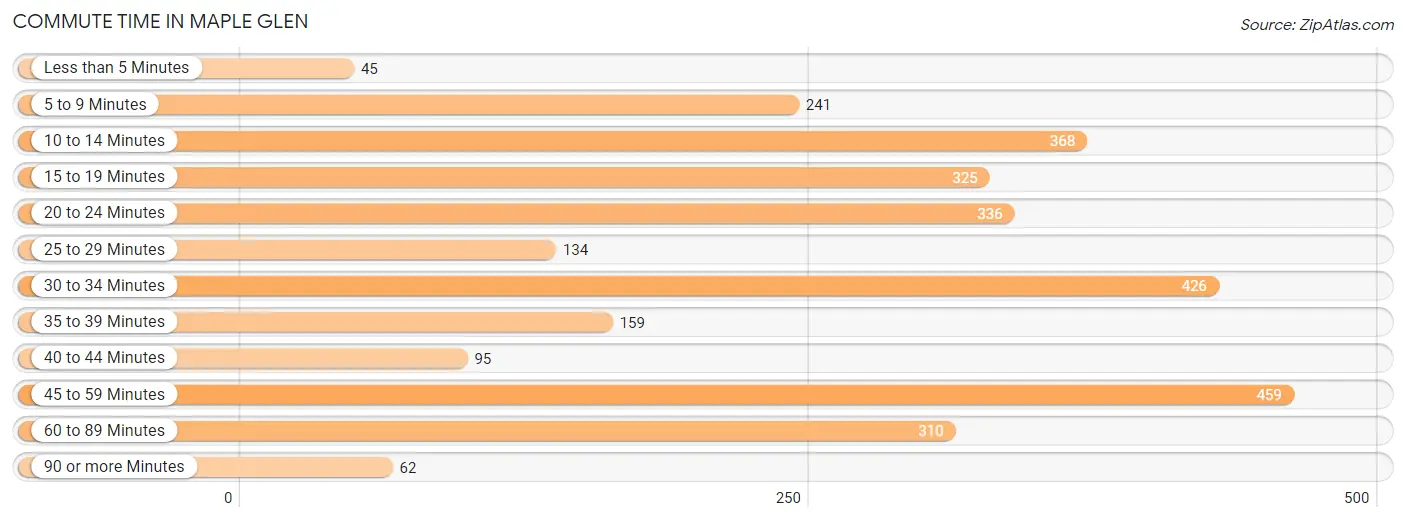
| Commute Time | # Commuters | % Commuters |
| Less than 5 Minutes | 45 | 1.5% |
| 5 to 9 Minutes | 241 | 8.1% |
| 10 to 14 Minutes | 368 | 12.4% |
| 15 to 19 Minutes | 325 | 11.0% |
| 20 to 24 Minutes | 336 | 11.4% |
| 25 to 29 Minutes | 134 | 4.5% |
| 30 to 34 Minutes | 426 | 14.4% |
| 35 to 39 Minutes | 159 | 5.4% |
| 40 to 44 Minutes | 95 | 3.2% |
| 45 to 59 Minutes | 459 | 15.5% |
| 60 to 89 Minutes | 310 | 10.5% |
| 90 or more Minutes | 62 | 2.1% |
Commute Time by Sex in Maple Glen
The most common commute times in Maple Glen are 45 to 59 minutes (249 commuters, 16.1%) for males and 30 to 34 minutes (237 commuters, 16.8%) for females.
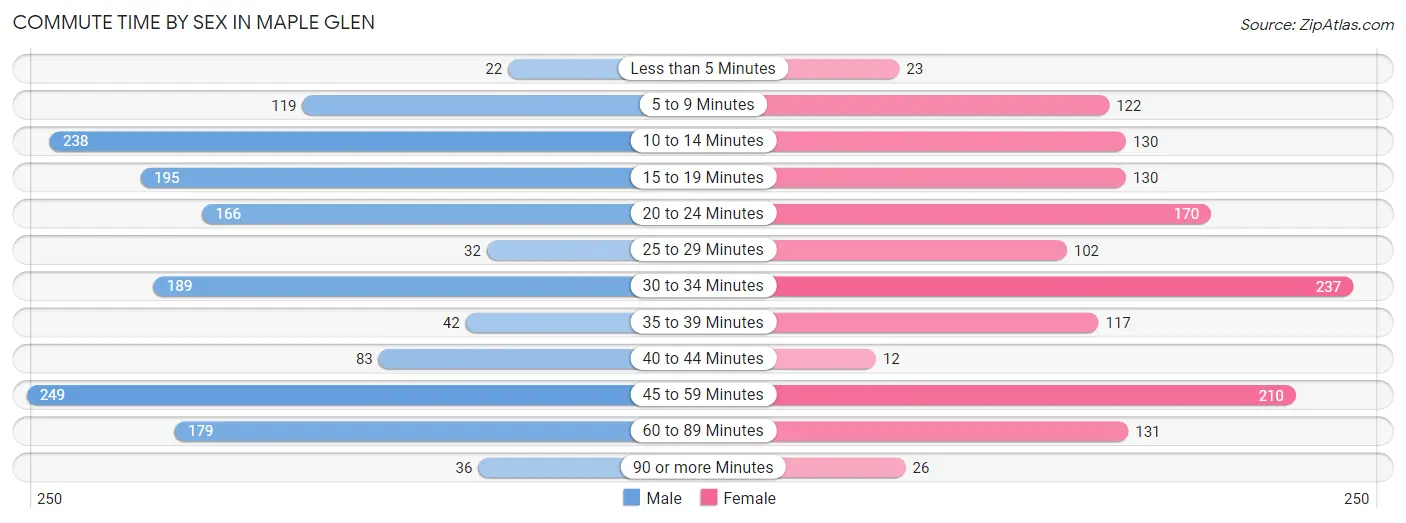
| Commute Time | Male | Female |
| Less than 5 Minutes | 22 (1.4%) | 23 (1.6%) |
| 5 to 9 Minutes | 119 (7.7%) | 122 (8.6%) |
| 10 to 14 Minutes | 238 (15.3%) | 130 (9.2%) |
| 15 to 19 Minutes | 195 (12.6%) | 130 (9.2%) |
| 20 to 24 Minutes | 166 (10.7%) | 170 (12.1%) |
| 25 to 29 Minutes | 32 (2.1%) | 102 (7.2%) |
| 30 to 34 Minutes | 189 (12.2%) | 237 (16.8%) |
| 35 to 39 Minutes | 42 (2.7%) | 117 (8.3%) |
| 40 to 44 Minutes | 83 (5.3%) | 12 (0.9%) |
| 45 to 59 Minutes | 249 (16.1%) | 210 (14.9%) |
| 60 to 89 Minutes | 179 (11.6%) | 131 (9.3%) |
| 90 or more Minutes | 36 (2.3%) | 26 (1.8%) |
Time of Departure to Work by Sex in Maple Glen
The most frequent times of departure to work in Maple Glen are 7:00 AM to 7:29 AM (284, 18.3%) for males and 9:00 AM to 9:59 AM (291, 20.6%) for females.
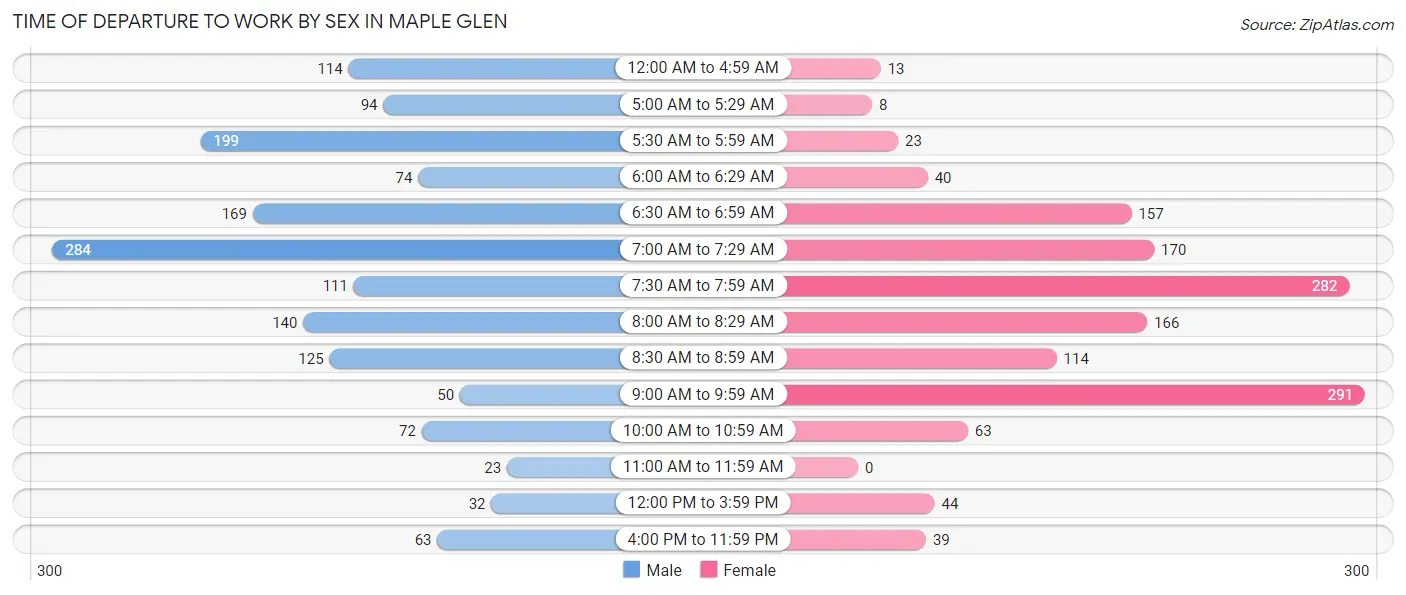
| Time of Departure | Male | Female |
| 12:00 AM to 4:59 AM | 114 (7.3%) | 13 (0.9%) |
| 5:00 AM to 5:29 AM | 94 (6.1%) | 8 (0.6%) |
| 5:30 AM to 5:59 AM | 199 (12.8%) | 23 (1.6%) |
| 6:00 AM to 6:29 AM | 74 (4.8%) | 40 (2.8%) |
| 6:30 AM to 6:59 AM | 169 (10.9%) | 157 (11.1%) |
| 7:00 AM to 7:29 AM | 284 (18.3%) | 170 (12.1%) |
| 7:30 AM to 7:59 AM | 111 (7.2%) | 282 (20.0%) |
| 8:00 AM to 8:29 AM | 140 (9.0%) | 166 (11.8%) |
| 8:30 AM to 8:59 AM | 125 (8.1%) | 114 (8.1%) |
| 9:00 AM to 9:59 AM | 50 (3.2%) | 291 (20.6%) |
| 10:00 AM to 10:59 AM | 72 (4.6%) | 63 (4.5%) |
| 11:00 AM to 11:59 AM | 23 (1.5%) | 0 (0.0%) |
| 12:00 PM to 3:59 PM | 32 (2.1%) | 44 (3.1%) |
| 4:00 PM to 11:59 PM | 63 (4.1%) | 39 (2.8%) |
| Total | 1,550 (100.0%) | 1,410 (100.0%) |
Housing Occupancy in Maple Glen
Occupancy by Ownership in Maple Glen
Of the total 2,270 dwellings in Maple Glen, owner-occupied units account for 2,072 (91.3%), while renter-occupied units make up 198 (8.7%).
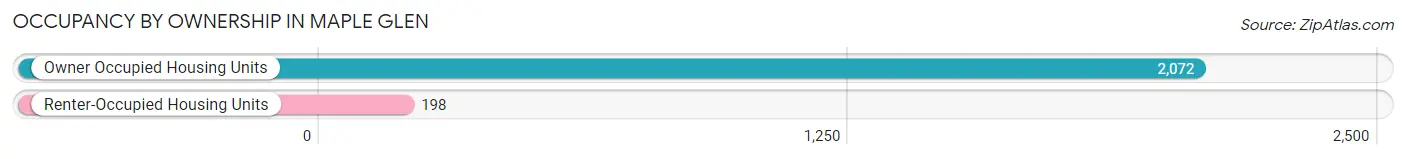
| Occupancy | # Housing Units | % Housing Units |
| Owner Occupied Housing Units | 2,072 | 91.3% |
| Renter-Occupied Housing Units | 198 | 8.7% |
| Total Occupied Housing Units | 2,270 | 100.0% |
Occupancy by Household Size in Maple Glen
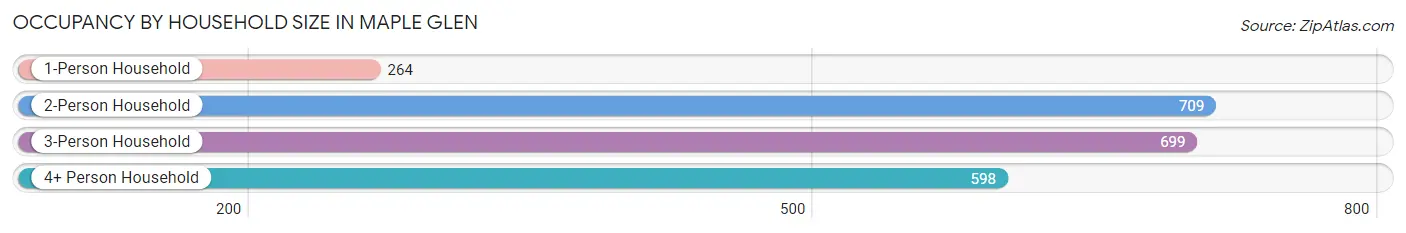
| Household Size | # Housing Units | % Housing Units |
| 1-Person Household | 264 | 11.6% |
| 2-Person Household | 709 | 31.2% |
| 3-Person Household | 699 | 30.8% |
| 4+ Person Household | 598 | 26.3% |
| Total Housing Units | 2,270 | 100.0% |
Occupancy by Ownership by Household Size in Maple Glen
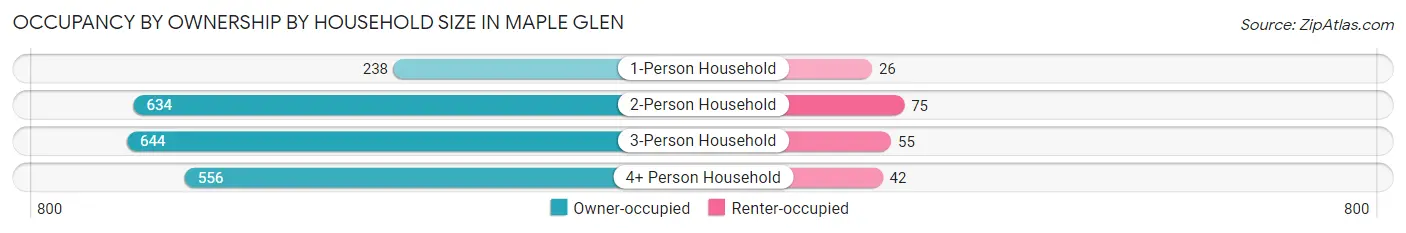
| Household Size | Owner-occupied | Renter-occupied |
| 1-Person Household | 238 (90.1%) | 26 (9.9%) |
| 2-Person Household | 634 (89.4%) | 75 (10.6%) |
| 3-Person Household | 644 (92.1%) | 55 (7.9%) |
| 4+ Person Household | 556 (93.0%) | 42 (7.0%) |
| Total Housing Units | 2,072 (91.3%) | 198 (8.7%) |
Occupancy by Educational Attainment in Maple Glen
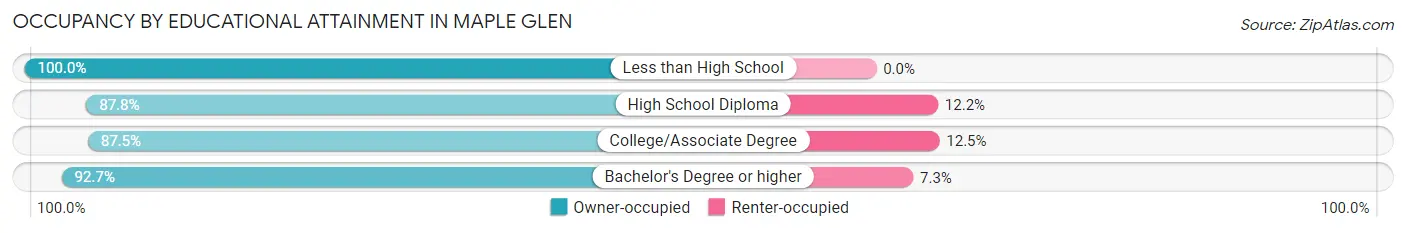
| Household Size | Owner-occupied | Renter-occupied |
| Less than High School | 29 (100.0%) | 0 (0.0%) |
| High School Diploma | 251 (87.8%) | 35 (12.2%) |
| College/Associate Degree | 335 (87.5%) | 48 (12.5%) |
| Bachelor's Degree or higher | 1,457 (92.7%) | 115 (7.3%) |
Occupancy by Age of Householder in Maple Glen
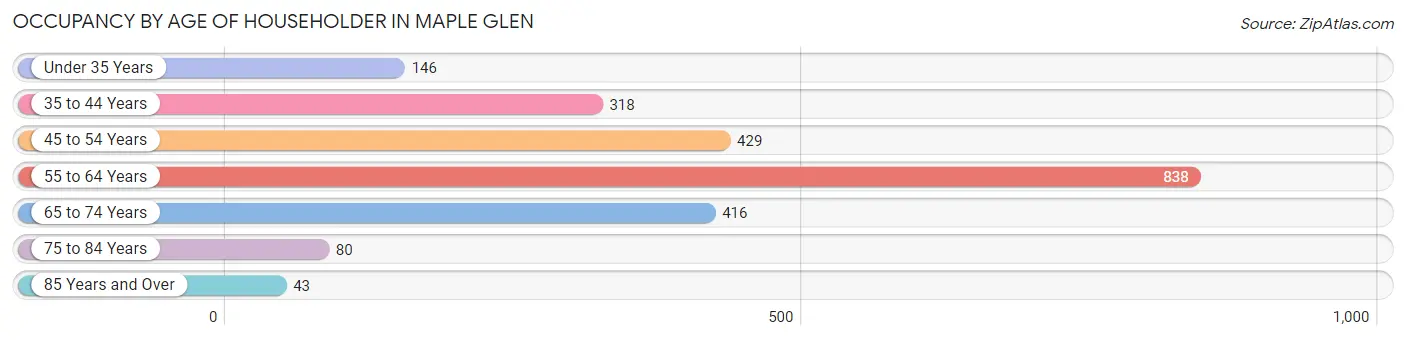
| Age Bracket | # Households | % Households |
| Under 35 Years | 146 | 6.4% |
| 35 to 44 Years | 318 | 14.0% |
| 45 to 54 Years | 429 | 18.9% |
| 55 to 64 Years | 838 | 36.9% |
| 65 to 74 Years | 416 | 18.3% |
| 75 to 84 Years | 80 | 3.5% |
| 85 Years and Over | 43 | 1.9% |
| Total | 2,270 | 100.0% |
Housing Finances in Maple Glen
Median Income by Occupancy in Maple Glen
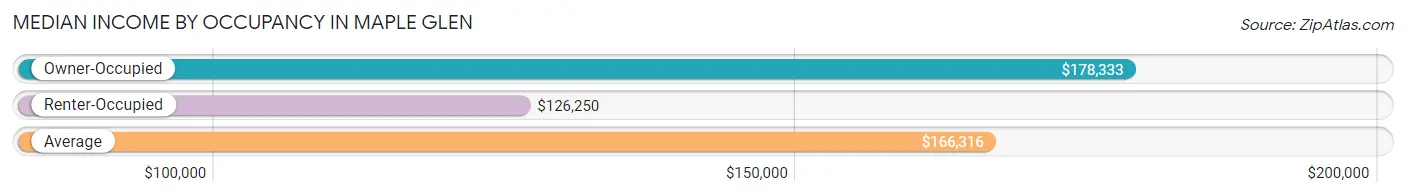
| Occupancy Type | # Households | Median Income |
| Owner-Occupied | 2,072 (91.3%) | $178,333 |
| Renter-Occupied | 198 (8.7%) | $126,250 |
| Average | 2,270 (100.0%) | $166,316 |
Occupancy by Householder Income Bracket in Maple Glen
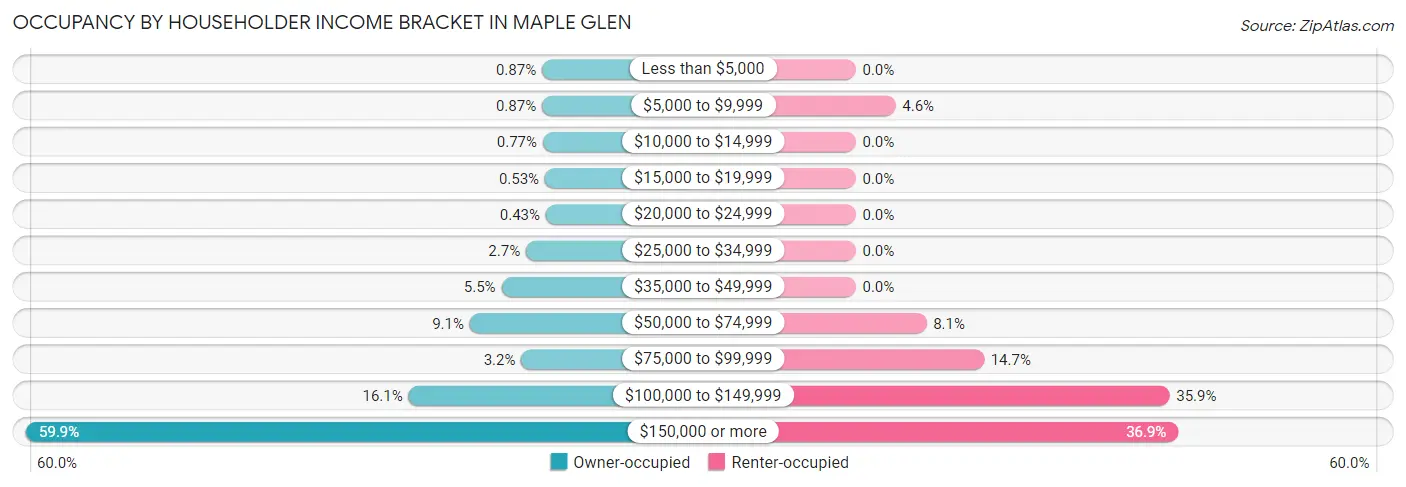
| Income Bracket | Owner-occupied | Renter-occupied |
| Less than $5,000 | 18 (0.9%) | 0 (0.0%) |
| $5,000 to $9,999 | 18 (0.9%) | 9 (4.5%) |
| $10,000 to $14,999 | 16 (0.8%) | 0 (0.0%) |
| $15,000 to $19,999 | 11 (0.5%) | 0 (0.0%) |
| $20,000 to $24,999 | 9 (0.4%) | 0 (0.0%) |
| $25,000 to $34,999 | 56 (2.7%) | 0 (0.0%) |
| $35,000 to $49,999 | 114 (5.5%) | 0 (0.0%) |
| $50,000 to $74,999 | 189 (9.1%) | 16 (8.1%) |
| $75,000 to $99,999 | 67 (3.2%) | 29 (14.6%) |
| $100,000 to $149,999 | 334 (16.1%) | 71 (35.9%) |
| $150,000 or more | 1,240 (59.9%) | 73 (36.9%) |
| Total | 2,072 (100.0%) | 198 (100.0%) |
Monthly Housing Cost Tiers in Maple Glen
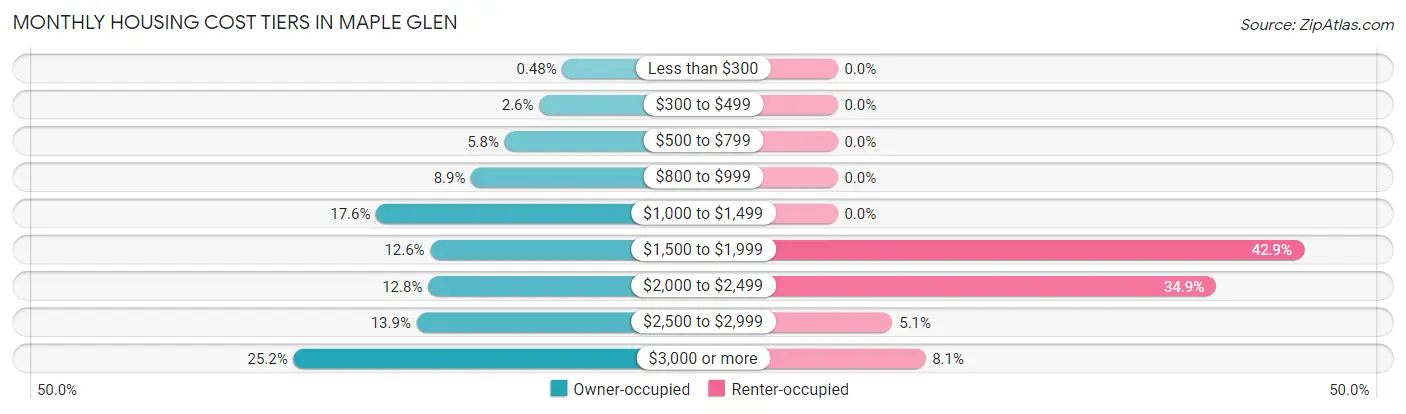
| Monthly Cost | Owner-occupied | Renter-occupied |
| Less than $300 | 10 (0.5%) | 0 (0.0%) |
| $300 to $499 | 54 (2.6%) | 0 (0.0%) |
| $500 to $799 | 120 (5.8%) | 0 (0.0%) |
| $800 to $999 | 184 (8.9%) | 0 (0.0%) |
| $1,000 to $1,499 | 365 (17.6%) | 0 (0.0%) |
| $1,500 to $1,999 | 262 (12.6%) | 85 (42.9%) |
| $2,000 to $2,499 | 266 (12.8%) | 69 (34.8%) |
| $2,500 to $2,999 | 288 (13.9%) | 10 (5.1%) |
| $3,000 or more | 523 (25.2%) | 16 (8.1%) |
| Total | 2,072 (100.0%) | 198 (100.0%) |
Physical Housing Characteristics in Maple Glen
Housing Structures in Maple Glen
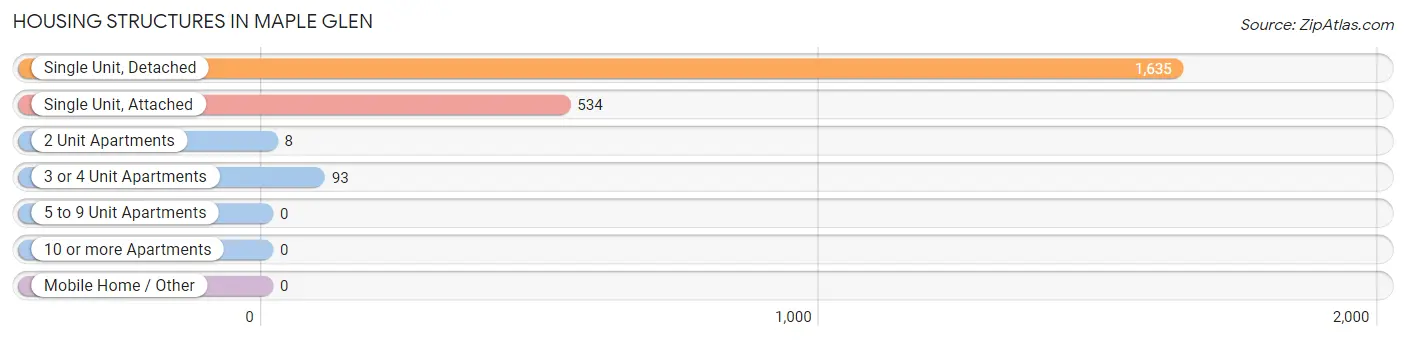
| Structure Type | # Housing Units | % Housing Units |
| Single Unit, Detached | 1,635 | 72.0% |
| Single Unit, Attached | 534 | 23.5% |
| 2 Unit Apartments | 8 | 0.4% |
| 3 or 4 Unit Apartments | 93 | 4.1% |
| 5 to 9 Unit Apartments | 0 | 0.0% |
| 10 or more Apartments | 0 | 0.0% |
| Mobile Home / Other | 0 | 0.0% |
| Total | 2,270 | 100.0% |
Housing Structures by Occupancy in Maple Glen
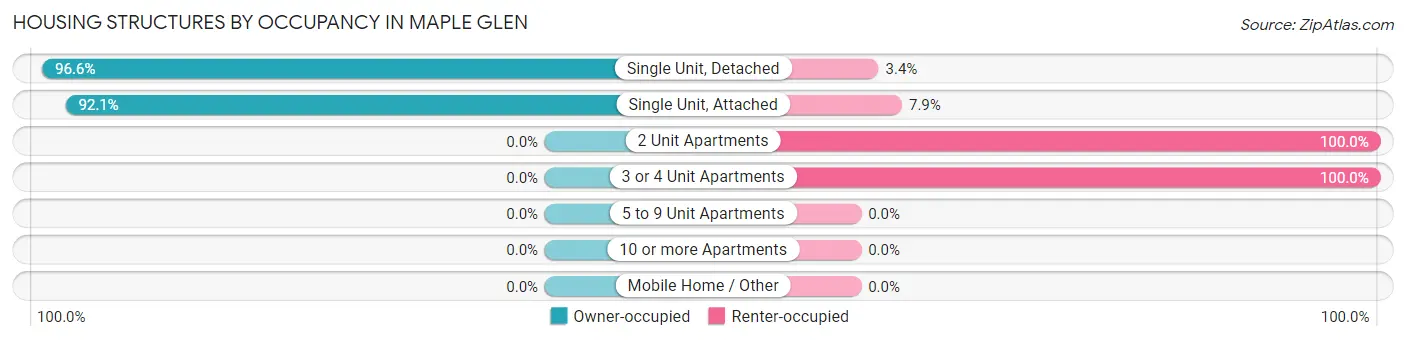
| Structure Type | Owner-occupied | Renter-occupied |
| Single Unit, Detached | 1,580 (96.6%) | 55 (3.4%) |
| Single Unit, Attached | 492 (92.1%) | 42 (7.9%) |
| 2 Unit Apartments | 0 (0.0%) | 8 (100.0%) |
| 3 or 4 Unit Apartments | 0 (0.0%) | 93 (100.0%) |
| 5 to 9 Unit Apartments | 0 (0.0%) | 0 (0.0%) |
| 10 or more Apartments | 0 (0.0%) | 0 (0.0%) |
| Mobile Home / Other | 0 (0.0%) | 0 (0.0%) |
| Total | 2,072 (91.3%) | 198 (8.7%) |
Housing Structures by Number of Rooms in Maple Glen
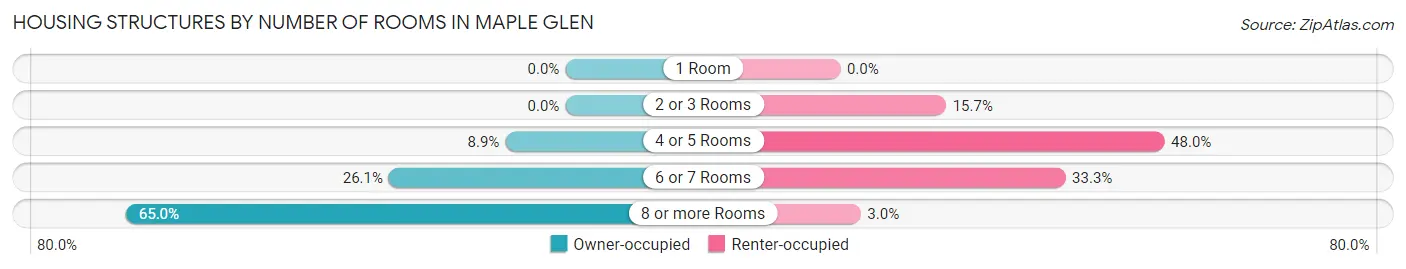
| Number of Rooms | Owner-occupied | Renter-occupied |
| 1 Room | 0 (0.0%) | 0 (0.0%) |
| 2 or 3 Rooms | 0 (0.0%) | 31 (15.7%) |
| 4 or 5 Rooms | 184 (8.9%) | 95 (48.0%) |
| 6 or 7 Rooms | 541 (26.1%) | 66 (33.3%) |
| 8 or more Rooms | 1,347 (65.0%) | 6 (3.0%) |
| Total | 2,072 (100.0%) | 198 (100.0%) |
Housing Structure by Heating Type in Maple Glen
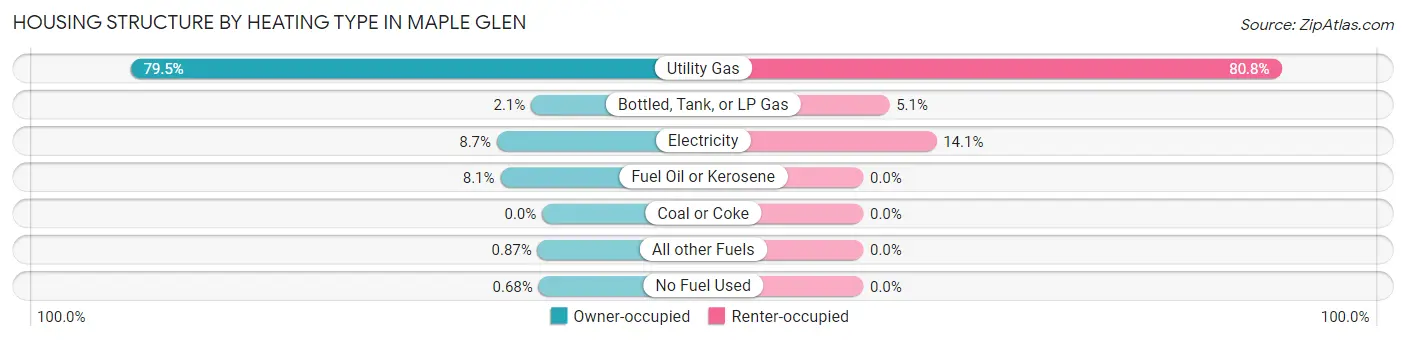
| Heating Type | Owner-occupied | Renter-occupied |
| Utility Gas | 1,648 (79.5%) | 160 (80.8%) |
| Bottled, Tank, or LP Gas | 44 (2.1%) | 10 (5.1%) |
| Electricity | 181 (8.7%) | 28 (14.1%) |
| Fuel Oil or Kerosene | 167 (8.1%) | 0 (0.0%) |
| Coal or Coke | 0 (0.0%) | 0 (0.0%) |
| All other Fuels | 18 (0.9%) | 0 (0.0%) |
| No Fuel Used | 14 (0.7%) | 0 (0.0%) |
| Total | 2,072 (100.0%) | 198 (100.0%) |
Household Vehicle Usage in Maple Glen
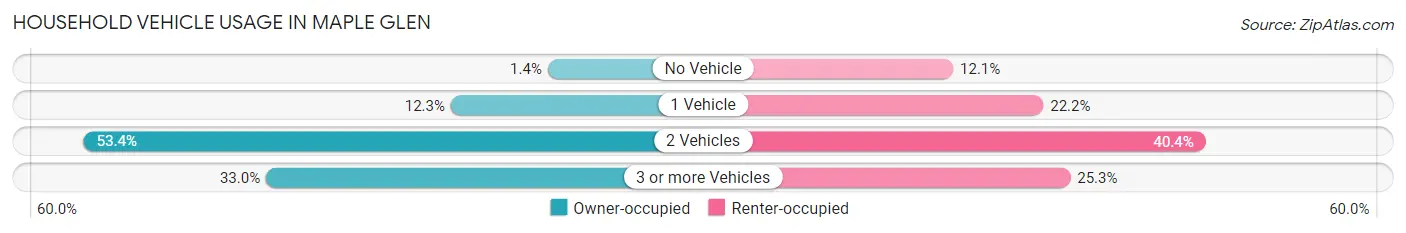
| Vehicles per Household | Owner-occupied | Renter-occupied |
| No Vehicle | 29 (1.4%) | 24 (12.1%) |
| 1 Vehicle | 254 (12.3%) | 44 (22.2%) |
| 2 Vehicles | 1,106 (53.4%) | 80 (40.4%) |
| 3 or more Vehicles | 683 (33.0%) | 50 (25.3%) |
| Total | 2,072 (100.0%) | 198 (100.0%) |
Real Estate & Mortgages in Maple Glen
Real Estate and Mortgage Overview in Maple Glen
| Characteristic | Without Mortgage | With Mortgage |
| Housing Units | 728 | 1,344 |
| Median Property Value | $500,000 | $490,200 |
| Median Household Income | $154,063 | $871 |
| Monthly Housing Costs | $1,122 | $488 |
| Real Estate Taxes | $8,164 | $0 |
Property Value by Mortgage Status in Maple Glen
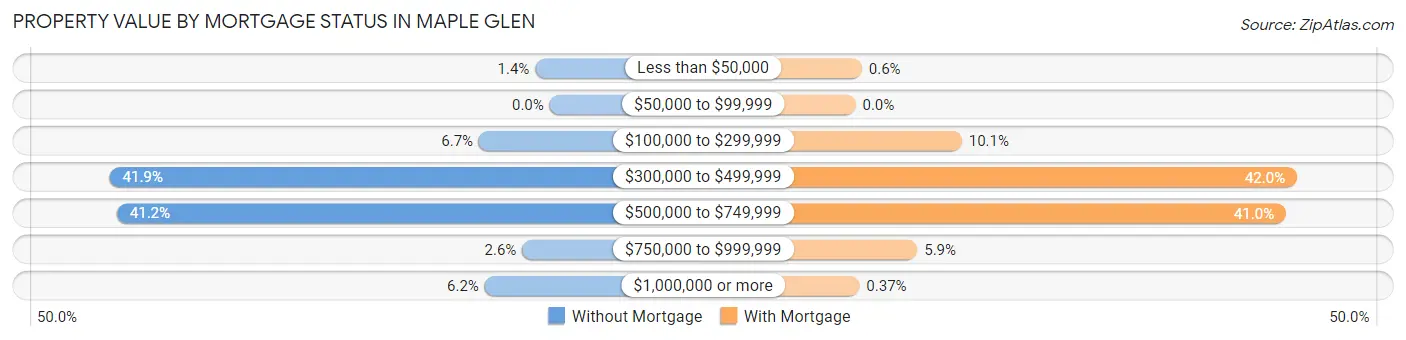
| Property Value | Without Mortgage | With Mortgage |
| Less than $50,000 | 10 (1.4%) | 8 (0.6%) |
| $50,000 to $99,999 | 0 (0.0%) | 0 (0.0%) |
| $100,000 to $299,999 | 49 (6.7%) | 136 (10.1%) |
| $300,000 to $499,999 | 305 (41.9%) | 565 (42.0%) |
| $500,000 to $749,999 | 300 (41.2%) | 551 (41.0%) |
| $750,000 to $999,999 | 19 (2.6%) | 79 (5.9%) |
| $1,000,000 or more | 45 (6.2%) | 5 (0.4%) |
| Total | 728 (100.0%) | 1,344 (100.0%) |
Household Income by Mortgage Status in Maple Glen
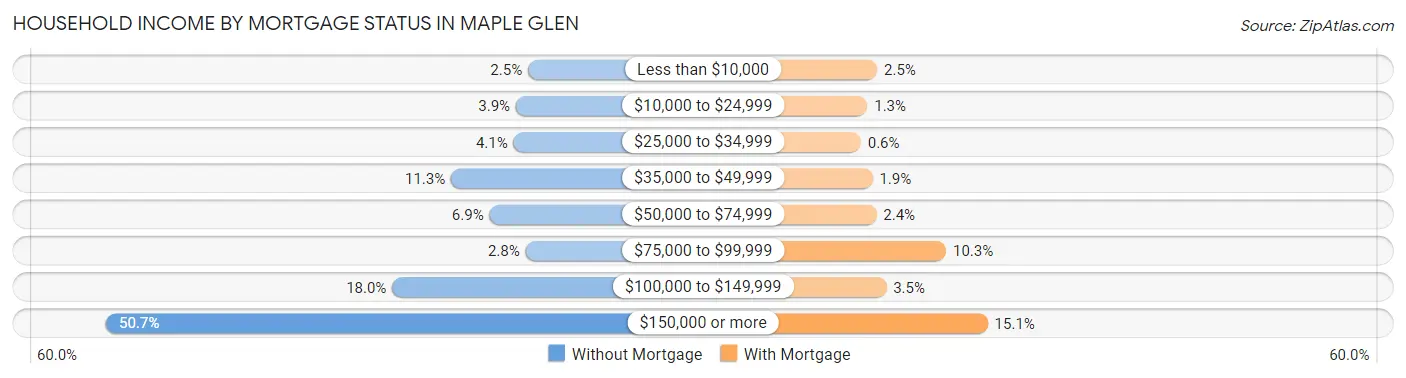
| Household Income | Without Mortgage | With Mortgage |
| Less than $10,000 | 18 (2.5%) | 33 (2.5%) |
| $10,000 to $24,999 | 28 (3.8%) | 18 (1.3%) |
| $25,000 to $34,999 | 30 (4.1%) | 8 (0.6%) |
| $35,000 to $49,999 | 82 (11.3%) | 26 (1.9%) |
| $50,000 to $74,999 | 50 (6.9%) | 32 (2.4%) |
| $75,000 to $99,999 | 20 (2.8%) | 139 (10.3%) |
| $100,000 to $149,999 | 131 (18.0%) | 47 (3.5%) |
| $150,000 or more | 369 (50.7%) | 203 (15.1%) |
| Total | 728 (100.0%) | 1,344 (100.0%) |
Property Value to Household Income Ratio in Maple Glen
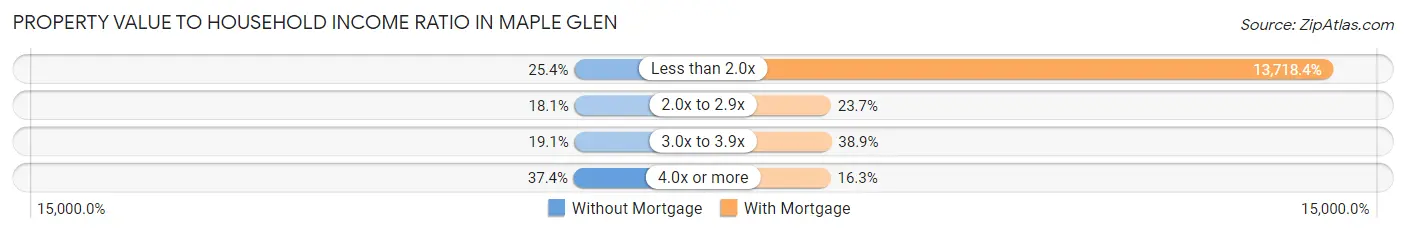
| Value-to-Income Ratio | Without Mortgage | With Mortgage |
| Less than 2.0x | 185 (25.4%) | 184,375 (13,718.4%) |
| 2.0x to 2.9x | 132 (18.1%) | 318 (23.7%) |
| 3.0x to 3.9x | 139 (19.1%) | 523 (38.9%) |
| 4.0x or more | 272 (37.4%) | 219 (16.3%) |
| Total | 728 (100.0%) | 1,344 (100.0%) |
Real Estate Taxes by Mortgage Status in Maple Glen
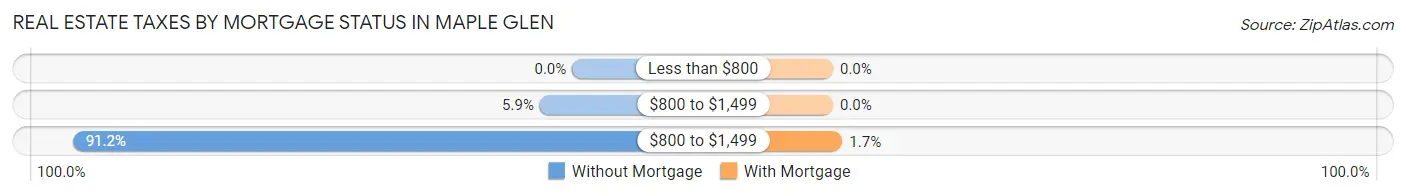
| Property Taxes | Without Mortgage | With Mortgage |
| Less than $800 | 0 (0.0%) | 0 (0.0%) |
| $800 to $1,499 | 43 (5.9%) | 0 (0.0%) |
| $800 to $1,499 | 664 (91.2%) | 23 (1.7%) |
| Total | 728 (100.0%) | 1,344 (100.0%) |
Health & Disability in Maple Glen
Health Insurance Coverage by Age in Maple Glen
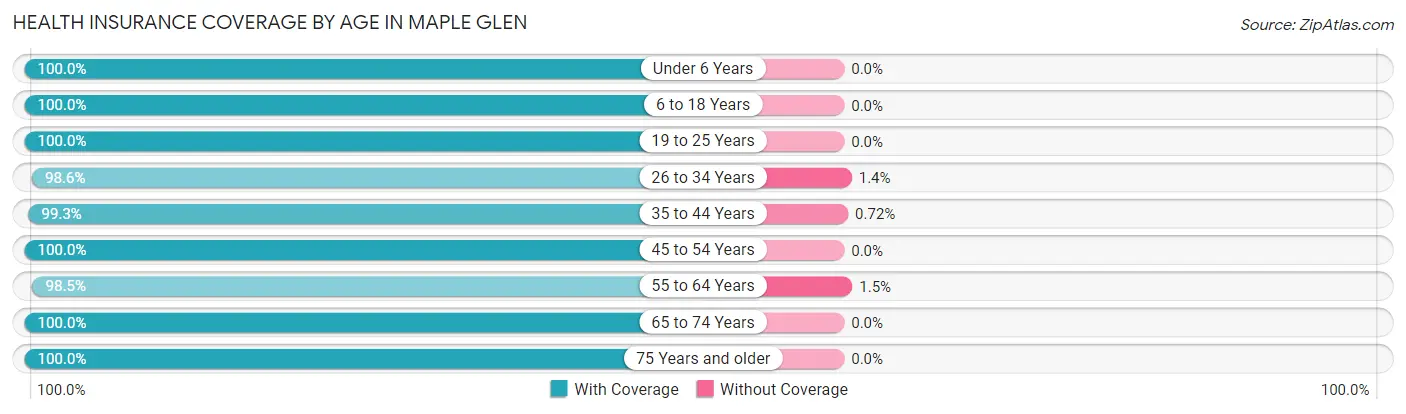
| Age Bracket | With Coverage | Without Coverage |
| Under 6 Years | 350 (100.0%) | 0 (0.0%) |
| 6 to 18 Years | 1,031 (100.0%) | 0 (0.0%) |
| 19 to 25 Years | 688 (100.0%) | 0 (0.0%) |
| 26 to 34 Years | 564 (98.6%) | 8 (1.4%) |
| 35 to 44 Years | 692 (99.3%) | 5 (0.7%) |
| 45 to 54 Years | 970 (100.0%) | 0 (0.0%) |
| 55 to 64 Years | 1,316 (98.5%) | 20 (1.5%) |
| 65 to 74 Years | 749 (100.0%) | 0 (0.0%) |
| 75 Years and older | 244 (100.0%) | 0 (0.0%) |
| Total | 6,604 (99.5%) | 33 (0.5%) |
Health Insurance Coverage by Citizenship Status in Maple Glen
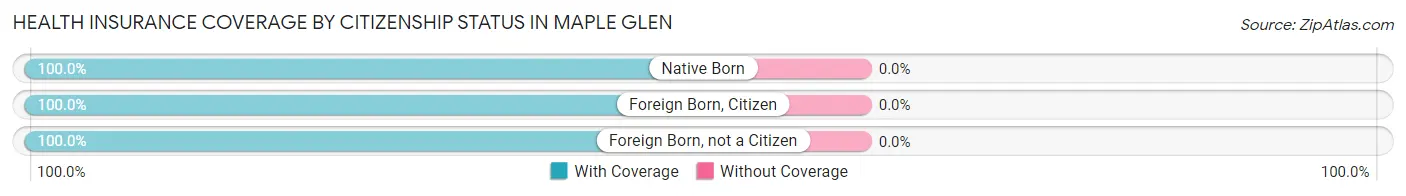
| Citizenship Status | With Coverage | Without Coverage |
| Native Born | 350 (100.0%) | 0 (0.0%) |
| Foreign Born, Citizen | 1,031 (100.0%) | 0 (0.0%) |
| Foreign Born, not a Citizen | 688 (100.0%) | 0 (0.0%) |
Health Insurance Coverage by Household Income in Maple Glen
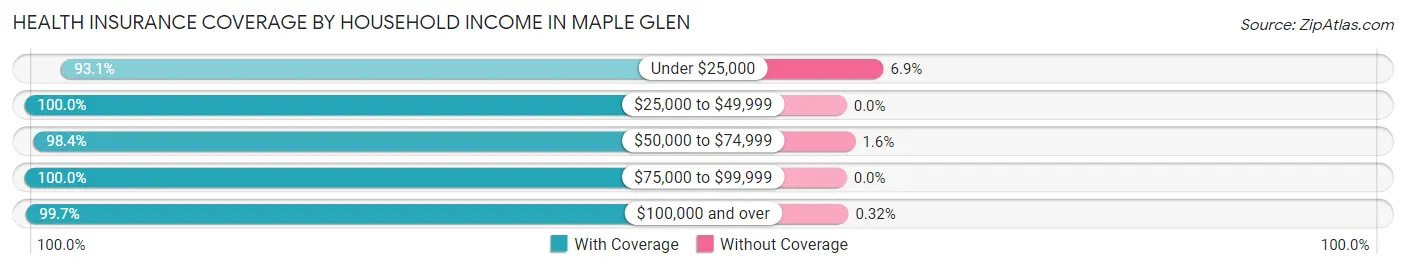
| Household Income | With Coverage | Without Coverage |
| Under $25,000 | 108 (93.1%) | 8 (6.9%) |
| $25,000 to $49,999 | 324 (100.0%) | 0 (0.0%) |
| $50,000 to $74,999 | 483 (98.4%) | 8 (1.6%) |
| $75,000 to $99,999 | 346 (100.0%) | 0 (0.0%) |
| $100,000 and over | 5,315 (99.7%) | 17 (0.3%) |
Public vs Private Health Insurance Coverage by Age in Maple Glen
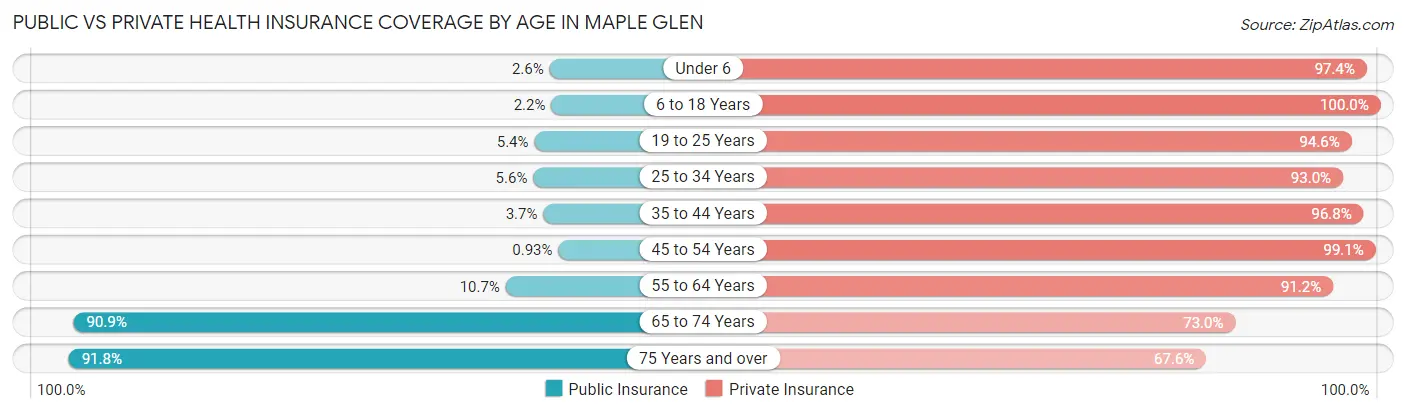
| Age Bracket | Public Insurance | Private Insurance |
| Under 6 | 9 (2.6%) | 341 (97.4%) |
| 6 to 18 Years | 23 (2.2%) | 1,031 (100.0%) |
| 19 to 25 Years | 37 (5.4%) | 651 (94.6%) |
| 25 to 34 Years | 32 (5.6%) | 532 (93.0%) |
| 35 to 44 Years | 26 (3.7%) | 675 (96.8%) |
| 45 to 54 Years | 9 (0.9%) | 961 (99.1%) |
| 55 to 64 Years | 143 (10.7%) | 1,218 (91.2%) |
| 65 to 74 Years | 681 (90.9%) | 547 (73.0%) |
| 75 Years and over | 224 (91.8%) | 165 (67.6%) |
| Total | 1,184 (17.8%) | 6,121 (92.2%) |
Disability Status by Sex by Age in Maple Glen
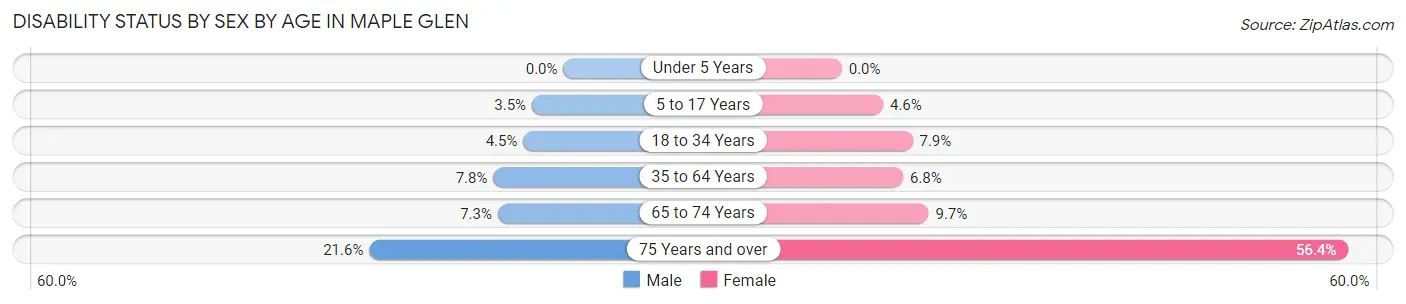
| Age Bracket | Male | Female |
| Under 5 Years | 0 (0.0%) | 0 (0.0%) |
| 5 to 17 Years | 18 (3.5%) | 23 (4.6%) |
| 18 to 34 Years | 29 (4.5%) | 52 (7.9%) |
| 35 to 64 Years | 112 (7.8%) | 107 (6.8%) |
| 65 to 74 Years | 29 (7.3%) | 34 (9.7%) |
| 75 Years and over | 24 (21.6%) | 75 (56.4%) |
Disability Class by Sex by Age in Maple Glen
Disability Class: Hearing Difficulty
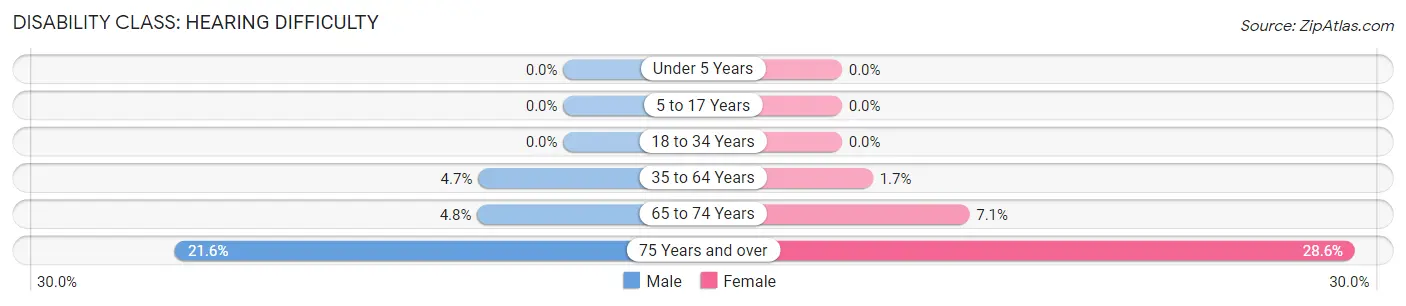
| Age Bracket | Male | Female |
| Under 5 Years | 0 (0.0%) | 0 (0.0%) |
| 5 to 17 Years | 0 (0.0%) | 0 (0.0%) |
| 18 to 34 Years | 0 (0.0%) | 0 (0.0%) |
| 35 to 64 Years | 68 (4.7%) | 27 (1.7%) |
| 65 to 74 Years | 19 (4.8%) | 25 (7.1%) |
| 75 Years and over | 24 (21.6%) | 38 (28.6%) |
Disability Class: Vision Difficulty
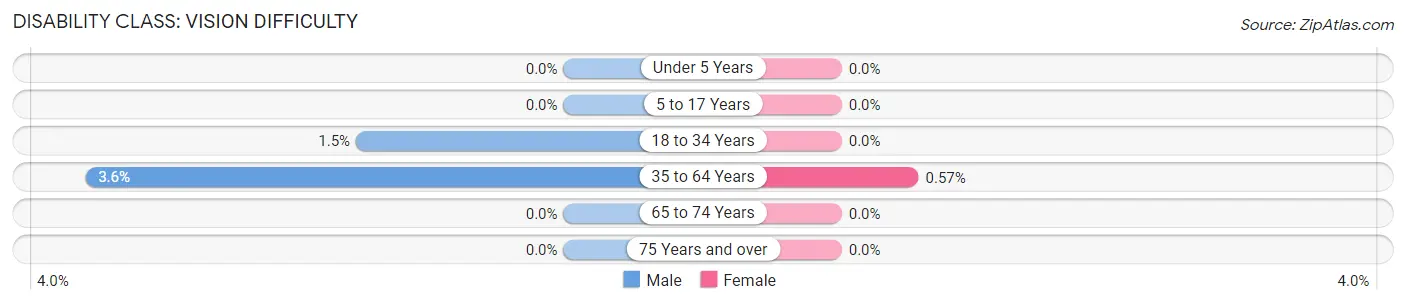
| Age Bracket | Male | Female |
| Under 5 Years | 0 (0.0%) | 0 (0.0%) |
| 5 to 17 Years | 0 (0.0%) | 0 (0.0%) |
| 18 to 34 Years | 10 (1.5%) | 0 (0.0%) |
| 35 to 64 Years | 51 (3.5%) | 9 (0.6%) |
| 65 to 74 Years | 0 (0.0%) | 0 (0.0%) |
| 75 Years and over | 0 (0.0%) | 0 (0.0%) |
Disability Class: Cognitive Difficulty
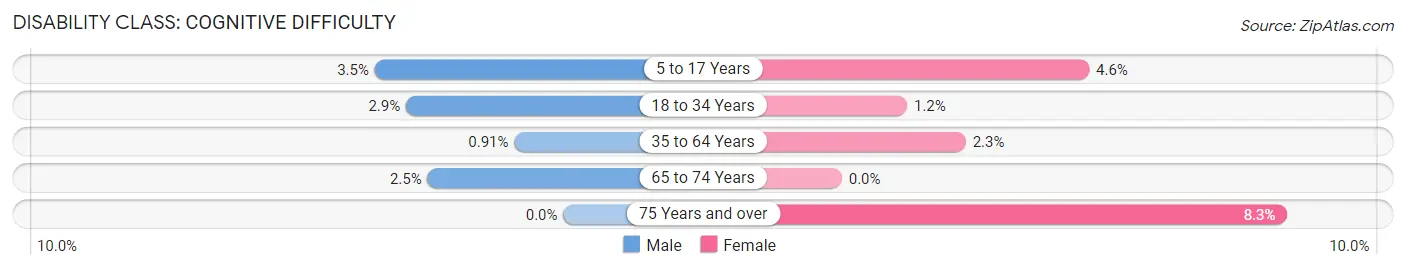
| Age Bracket | Male | Female |
| 5 to 17 Years | 18 (3.5%) | 23 (4.6%) |
| 18 to 34 Years | 19 (2.9%) | 8 (1.2%) |
| 35 to 64 Years | 13 (0.9%) | 36 (2.3%) |
| 65 to 74 Years | 10 (2.5%) | 0 (0.0%) |
| 75 Years and over | 0 (0.0%) | 11 (8.3%) |
Disability Class: Ambulatory Difficulty
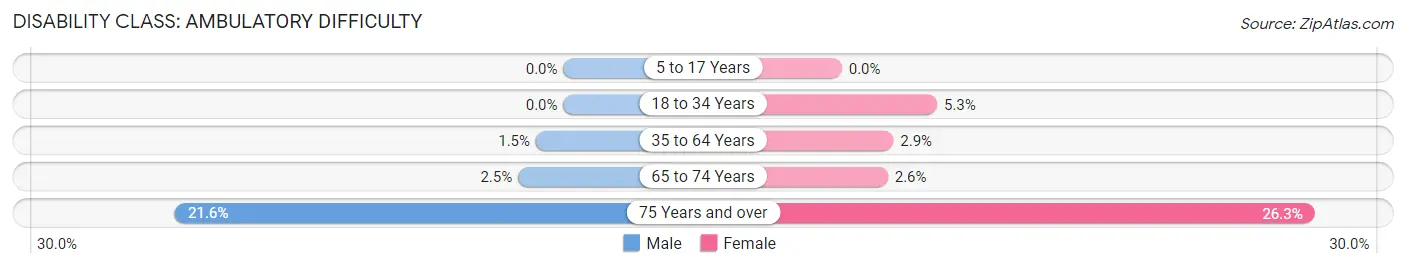
| Age Bracket | Male | Female |
| 5 to 17 Years | 0 (0.0%) | 0 (0.0%) |
| 18 to 34 Years | 0 (0.0%) | 35 (5.3%) |
| 35 to 64 Years | 22 (1.5%) | 45 (2.9%) |
| 65 to 74 Years | 10 (2.5%) | 9 (2.6%) |
| 75 Years and over | 24 (21.6%) | 35 (26.3%) |
Disability Class: Self-Care Difficulty
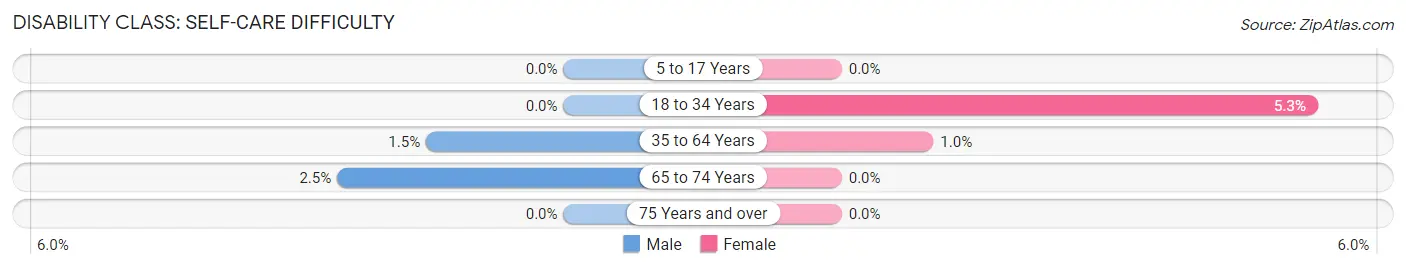
| Age Bracket | Male | Female |
| 5 to 17 Years | 0 (0.0%) | 0 (0.0%) |
| 18 to 34 Years | 0 (0.0%) | 35 (5.3%) |
| 35 to 64 Years | 22 (1.5%) | 16 (1.0%) |
| 65 to 74 Years | 10 (2.5%) | 0 (0.0%) |
| 75 Years and over | 0 (0.0%) | 0 (0.0%) |
Technology Access in Maple Glen
Computing Device Access in Maple Glen
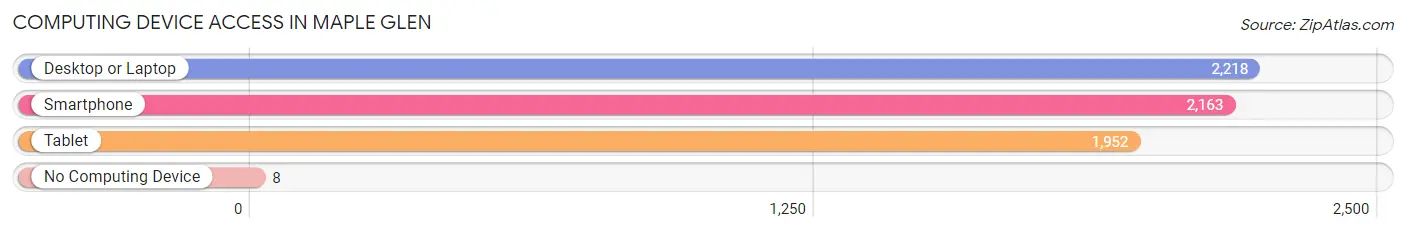
| Device Type | # Households | % Households |
| Desktop or Laptop | 2,218 | 97.7% |
| Smartphone | 2,163 | 95.3% |
| Tablet | 1,952 | 86.0% |
| No Computing Device | 8 | 0.4% |
| Total | 2,270 | 100.0% |
Internet Access in Maple Glen
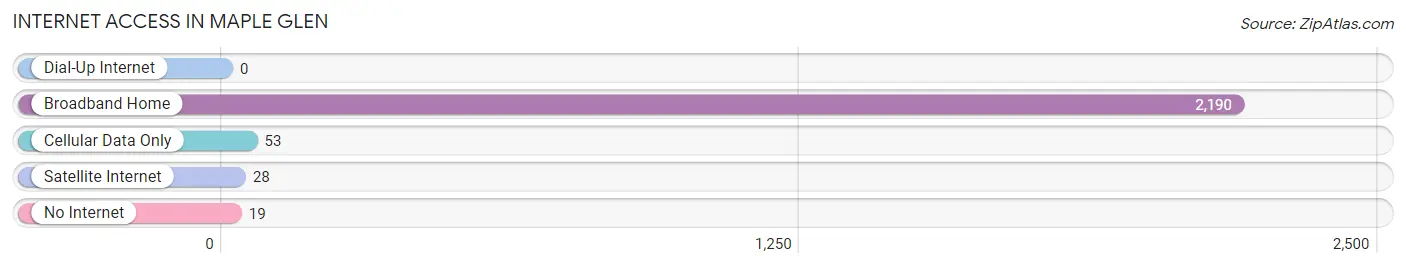
| Internet Type | # Households | % Households |
| Dial-Up Internet | 0 | 0.0% |
| Broadband Home | 2,190 | 96.5% |
| Cellular Data Only | 53 | 2.3% |
| Satellite Internet | 28 | 1.2% |
| No Internet | 19 | 0.8% |
| Total | 2,270 | 100.0% |
Maple Glen Summary
Maple Glen is a census-designated place located in Montgomery County, Pennsylvania. It is situated in the Upper Dublin Township, and is part of the Philadelphia metropolitan area. The population of Maple Glen was 8,945 at the 2010 census.
History
Maple Glen was first settled in the late 1700s by a group of German immigrants. The area was originally known as “Germantown”, but the name was changed to Maple Glen in 1876. The name was chosen to reflect the abundance of maple trees in the area.
In the late 1800s, Maple Glen was a rural farming community. The area was known for its dairy farms and orchards. In the early 1900s, Maple Glen began to experience a population boom as more people moved to the area. This growth was spurred by the development of the Pennsylvania Railroad, which connected Maple Glen to Philadelphia and other major cities.
Geography
Maple Glen is located at 40°09'45" North, 75°09'45" West (40.1625, -75.1625). It is situated in the Upper Dublin Township, and is part of the Philadelphia metropolitan area. The total area of Maple Glen is 4.2 square miles, all of which is land.
The climate in Maple Glen is characterized by hot, humid summers and cold, wet winters. The average annual temperature is around 54°F, and the average annual precipitation is around 43 inches.
Economy
The economy of Maple Glen is largely based on the service industry. The area is home to a number of restaurants, retail stores, and other businesses. Maple Glen is also home to several corporate offices, including those of the pharmaceutical company GlaxoSmithKline and the financial services company SEI Investments.
Demographics
As of the 2010 census, the population of Maple Glen was 8,945. The racial makeup of the town was 87.3% White, 5.2% African American, 0.3% Native American, 4.2% Asian, and 2.9% from other races. The median household income was $90,945, and the median family income was $103,945.
Conclusion
Maple Glen is a census-designated place located in Montgomery County, Pennsylvania. It is situated in the Upper Dublin Township, and is part of the Philadelphia metropolitan area. The population of Maple Glen was 8,945 at the 2010 census. The economy of Maple Glen is largely based on the service industry, and the town is home to several corporate offices. The racial makeup of the town was 87.3% White, 5.2% African American, 0.3% Native American, 4.2% Asian, and 2.9% from other races. The median household income was $90,945, and the median family income was $103,945.
Common Questions
What is the Total Population of Maple Glen?
Total Population of Maple Glen is 6,637.
What is the Total Male Population of Maple Glen?
Total Male Population of Maple Glen is 3,256.
What is the Total Female Population of Maple Glen?
Total Female Population of Maple Glen is 3,381.
What is the Ratio of Males per 100 Females in Maple Glen?
There are 96.30 Males per 100 Females in Maple Glen.
What is the Ratio of Females per 100 Males in Maple Glen?
There are 103.84 Females per 100 Males in Maple Glen.
What is the Median Population Age in Maple Glen?
Median Population Age in Maple Glen is 44.8 Years.
What is the Average Family Size in Maple Glen
Average Family Size in Maple Glen is 3.2 People.
What is the Average Household Size in Maple Glen
Average Household Size in Maple Glen is 2.9 People.
What is Per Capita Income in Maple Glen?
Per Capita income in Maple Glen is $72,124.
What is the Median Family Income in Maple Glen?
Median Family Income in Maple Glen is $183,164.
What is the Median Household income in Maple Glen?
Median Household Income in Maple Glen is $166,316.
What is Income or Wage Gap in Maple Glen?
Income or Wage Gap in Maple Glen is 7.5%.
Women in Maple Glen earn 92.5 cents for every dollar earned by a man.
What is Inequality or Gini Index in Maple Glen?
Inequality or Gini Index in Maple Glen is 0.40.
How Large is the Labor Force in Maple Glen?
There are 3,976 People in the Labor Forcein in Maple Glen.
What is the Percentage of People in the Labor Force in Maple Glen?
72.6% of People are in the Labor Force in Maple Glen.
What is the Unemployment Rate in Maple Glen?
Unemployment Rate in Maple Glen is 3.7%.