Cherryville, PA
Cherryville Map
Cherryville Overview
1,472
TOTAL POPULATION
703
MALE POPULATION
769
FEMALE POPULATION
91.42
MALES / 100 FEMALES
109.39
FEMALES / 100 MALES
51.7
MEDIAN AGE
2.9
AVG FAMILY SIZE
2.7
AVG HOUSEHOLD SIZE
$40,137
PER CAPITA INCOME
$82,348
AVG FAMILY INCOME
$90,298
AVG HOUSEHOLD INCOME
0.29
INEQUALITY / GINI INDEX
789
LABOR FORCE [ PEOPLE ]
61.7%
PERCENT IN LABOR FORCE
7.4%
UNEMPLOYMENT RATE
Cherryville Zip Codes
Cherryville Area Codes
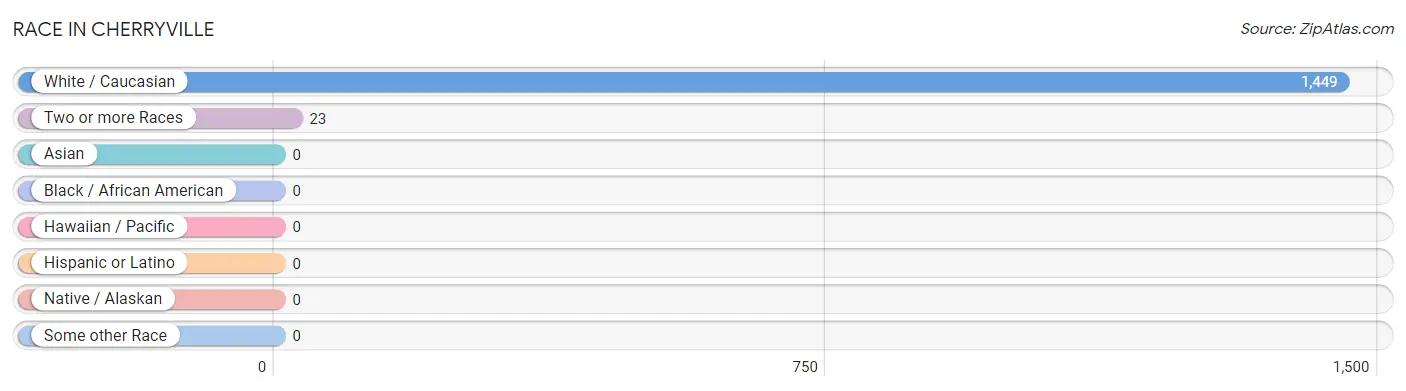
Race in Cherryville
The most populous races in Cherryville are White / Caucasian (1,449 | 98.4%), and Two or more Races (23 | 1.6%).
| Race | # Population | % Population |
| Asian | 0 | 0.0% |
| Black / African American | 0 | 0.0% |
| Hawaiian / Pacific | 0 | 0.0% |
| Hispanic or Latino | 0 | 0.0% |
| Native / Alaskan | 0 | 0.0% |
| White / Caucasian | 1,449 | 98.4% |
| Two or more Races | 23 | 1.6% |
| Some other Race | 0 | 0.0% |
| Total | 1,472 | 100.0% |
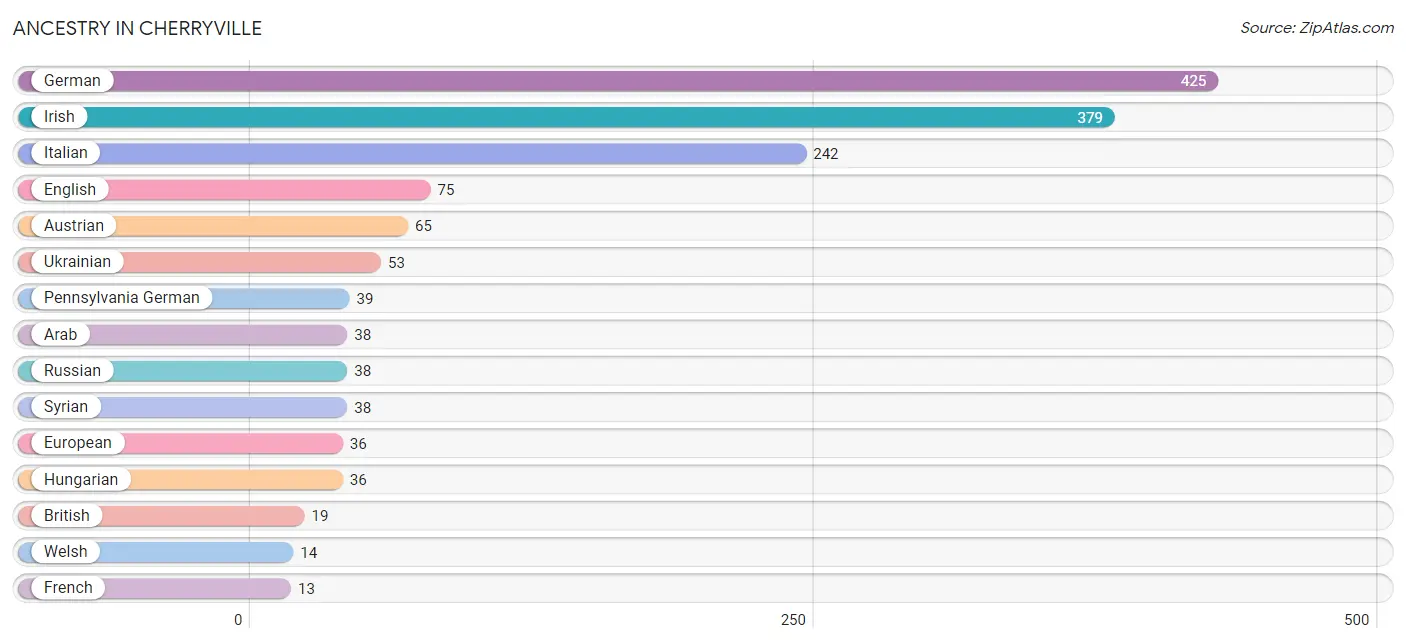
Ancestry in Cherryville
The most populous ancestries reported in Cherryville are German (425 | 28.9%), Irish (379 | 25.8%), Italian (242 | 16.4%), English (75 | 5.1%), and Austrian (65 | 4.4%), together accounting for 80.6% of all Cherryville residents.
| Ancestry | # Population | % Population |
| Arab | 38 | 2.6% |
| Austrian | 65 | 4.4% |
| British | 19 | 1.3% |
| English | 75 | 5.1% |
| European | 36 | 2.5% |
| French | 13 | 0.9% |
| German | 425 | 28.9% |
| Greek | 12 | 0.8% |
| Hungarian | 36 | 2.5% |
| Irish | 379 | 25.8% |
| Italian | 242 | 16.4% |
| Pennsylvania German | 39 | 2.6% |
| Russian | 38 | 2.6% |
| Scottish | 9 | 0.6% |
| Slovak | 13 | 0.9% |
| Swedish | 8 | 0.5% |
| Syrian | 38 | 2.6% |
| Ukrainian | 53 | 3.6% |
| Welsh | 14 | 0.9% | View All 19 Rows |
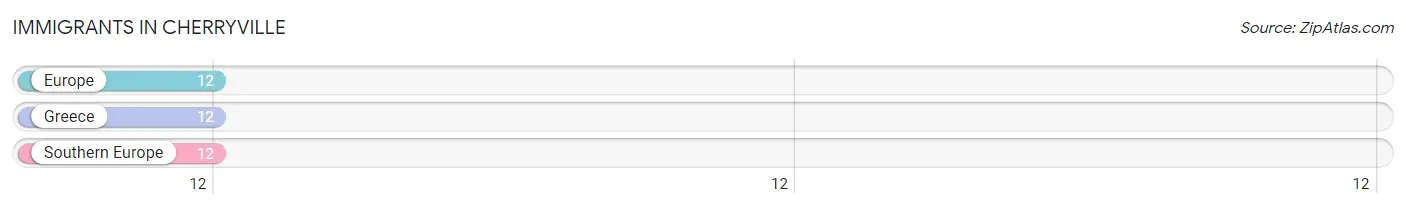
Immigrants in Cherryville
The most numerous immigrant groups reported in Cherryville came from Europe (12 | 0.8%), Greece (12 | 0.8%), and Southern Europe (12 | 0.8%), together accounting for 2.5% of all Cherryville residents.
| Immigration Origin | # Population | % Population |
| Europe | 12 | 0.8% |
| Greece | 12 | 0.8% |
| Southern Europe | 12 | 0.8% | View All 3 Rows |
Sex and Age in Cherryville
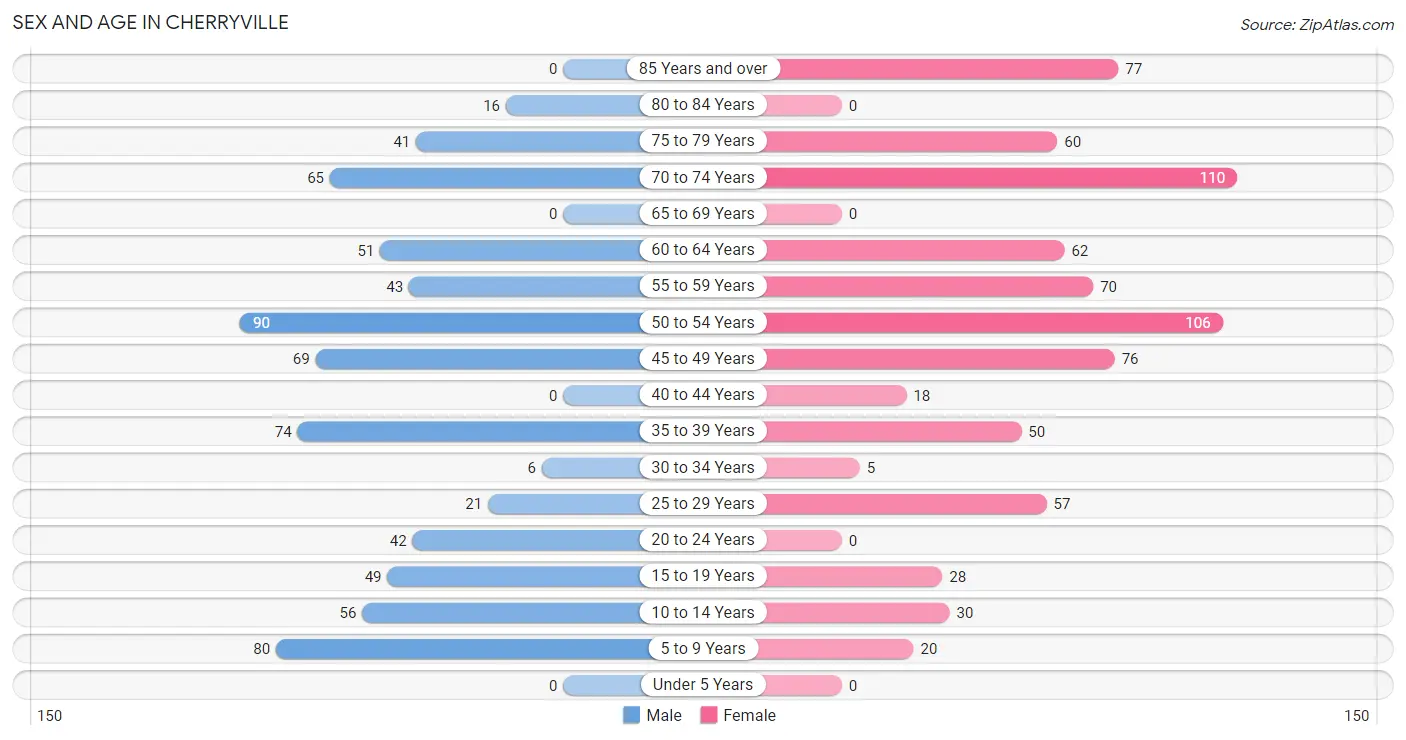
Sex and Age in Cherryville
The most populous age groups in Cherryville are 50 to 54 Years (90 | 12.8%) for men and 70 to 74 Years (110 | 14.3%) for women.
| Age Bracket | Male | Female |
| Under 5 Years | 0 (0.0%) | 0 (0.0%) |
| 5 to 9 Years | 80 (11.4%) | 20 (2.6%) |
| 10 to 14 Years | 56 (8.0%) | 30 (3.9%) |
| 15 to 19 Years | 49 (7.0%) | 28 (3.6%) |
| 20 to 24 Years | 42 (6.0%) | 0 (0.0%) |
| 25 to 29 Years | 21 (3.0%) | 57 (7.4%) |
| 30 to 34 Years | 6 (0.9%) | 5 (0.6%) |
| 35 to 39 Years | 74 (10.5%) | 50 (6.5%) |
| 40 to 44 Years | 0 (0.0%) | 18 (2.3%) |
| 45 to 49 Years | 69 (9.8%) | 76 (9.9%) |
| 50 to 54 Years | 90 (12.8%) | 106 (13.8%) |
| 55 to 59 Years | 43 (6.1%) | 70 (9.1%) |
| 60 to 64 Years | 51 (7.2%) | 62 (8.1%) |
| 65 to 69 Years | 0 (0.0%) | 0 (0.0%) |
| 70 to 74 Years | 65 (9.2%) | 110 (14.3%) |
| 75 to 79 Years | 41 (5.8%) | 60 (7.8%) |
| 80 to 84 Years | 16 (2.3%) | 0 (0.0%) |
| 85 Years and over | 0 (0.0%) | 77 (10.0%) |
| Total | 703 (100.0%) | 769 (100.0%) |
Families and Households in Cherryville
Median Family Size in Cherryville
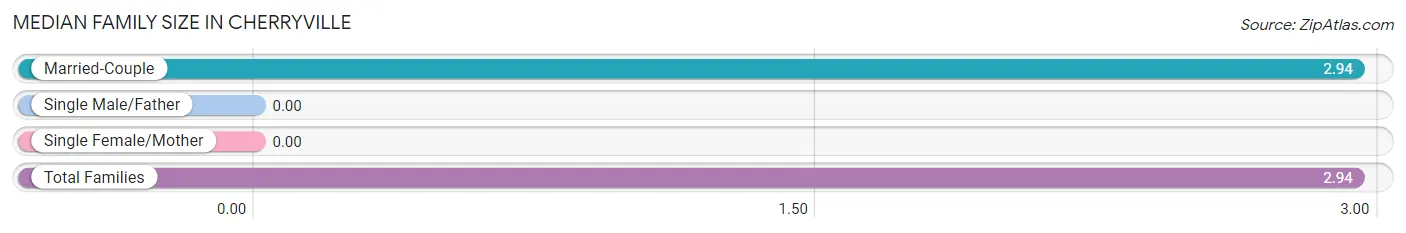
| Family Type | # Families | Family Size |
| Married-Couple | 436 (100.0%) | 2.94 |
| Single Male/Father | 0 (0.0%) | - |
| Single Female/Mother | 0 (0.0%) | - |
| Total Families | 436 (100.0%) | 2.94 |
Median Household Size in Cherryville
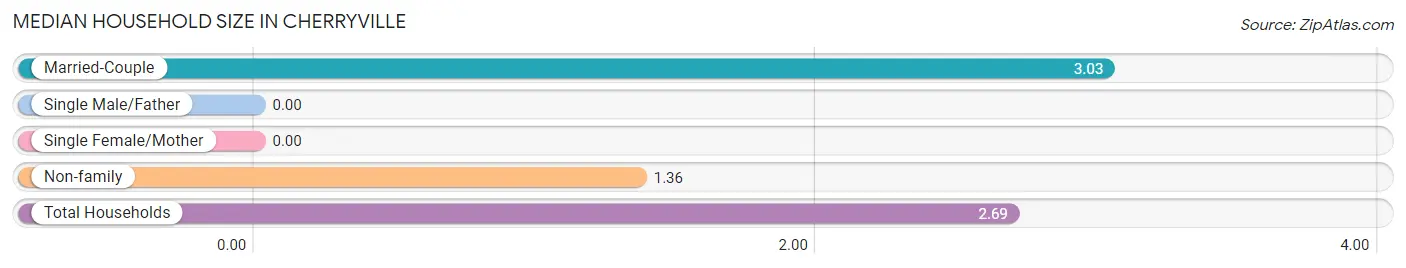
| Household Type | # Households | Household Size |
| Married-Couple | 436 (79.7%) | 3.03 |
| Single Male/Father | 0 (0.0%) | - |
| Single Female/Mother | 0 (0.0%) | - |
| Non-family | 111 (20.3%) | 1.36 |
| Total Households | 547 (100.0%) | 2.69 |
Household Size by Marriage Status in Cherryville
Out of a total of 547 households in Cherryville, 436 (79.7%) are family households, while 111 (20.3%) are nonfamily households. The most numerous type of family households are 2-person households, comprising 164, and the most common type of nonfamily households are 1-person households, comprising 70.
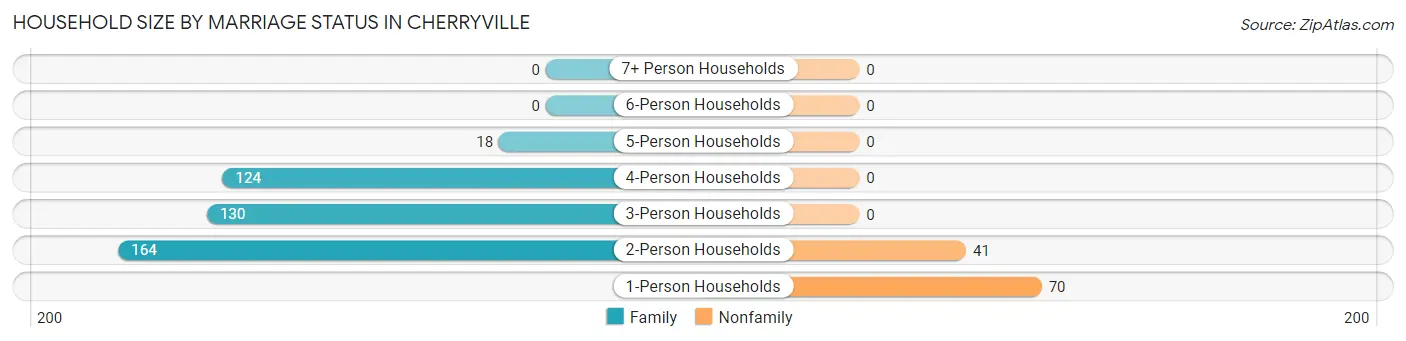
| Household Size | Family Households | Nonfamily Households |
| 1-Person Households | - | 70 (12.8%) |
| 2-Person Households | 164 (30.0%) | 41 (7.5%) |
| 3-Person Households | 130 (23.8%) | 0 (0.0%) |
| 4-Person Households | 124 (22.7%) | 0 (0.0%) |
| 5-Person Households | 18 (3.3%) | 0 (0.0%) |
| 6-Person Households | 0 (0.0%) | 0 (0.0%) |
| 7+ Person Households | 0 (0.0%) | 0 (0.0%) |
| Total | 436 (79.7%) | 111 (20.3%) |
Female Fertility in Cherryville
Fertility by Age in Cherryville
| Age Bracket | Women with Births | Births / 1,000 Women |
| 15 to 19 years | 0 (0.0%) | 0.0 |
| 20 to 34 years | 0 (0.0%) | 0.0 |
| 35 to 50 years | 0 (0.0%) | 0.0 |
| Total | 0 (0.0%) | 0.0 |
Fertility by Age by Marriage Status in Cherryville
| Age Bracket | Married | Unmarried |
| 15 to 19 years | 0 (0.0%) | 0 (0.0%) |
| 20 to 34 years | 0 (0.0%) | 0 (0.0%) |
| 35 to 50 years | 0 (0.0%) | 0 (0.0%) |
| Total | 0 (0.0%) | 0 (0.0%) |
Fertility by Education in Cherryville
| Educational Attainment | Women with Births | Births / 1,000 Women |
| Less than High School | 0 (0.0%) | 0.0 |
| High School Diploma | 0 (0.0%) | 0.0 |
| College or Associate's Degree | 0 (0.0%) | 0.0 |
| Bachelor's Degree | 0 (0.0%) | 0.0 |
| Graduate Degree | 0 (0.0%) | 0.0 |
| Total | 0 (0.0%) | 0.0 |
Fertility by Education by Marriage Status in Cherryville
| Educational Attainment | Married | Unmarried |
| Less than High School | 0 (0.0%) | 0 (0.0%) |
| High School Diploma | 0 (0.0%) | 0 (0.0%) |
| College or Associate's Degree | 0 (0.0%) | 0 (0.0%) |
| Bachelor's Degree | 0 (0.0%) | 0 (0.0%) |
| Graduate Degree | 0 (0.0%) | 0 (0.0%) |
| Total | 0 (0.0%) | 0 (0.0%) |
Income in Cherryville
Income Overview in Cherryville
Per Capita Income in Cherryville is $40,137, while median incomes of families and households are $82,348 and $90,298 respectively.
| Characteristic | Number | Measure |
| Per Capita Income | 1,472 | $40,137 |
| Median Family Income | 436 | $82,348 |
| Mean Family Income | 436 | $110,424 |
| Median Household Income | 547 | $90,298 |
| Mean Household Income | 547 | $107,933 |
| Income Deficit | 436 | $0 |
| Wage / Income Gap (%) | 1,472 | 0.00% |
| Wage / Income Gap ($) | 1,472 | 100.00¢ per $1 |
| Gini / Inequality Index | 1,472 | 0.29 |
Earnings by Sex in Cherryville
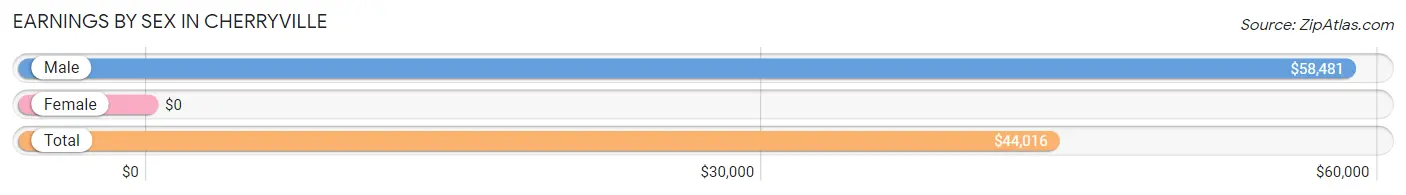
| Sex | Number | Average Earnings |
| Male | 376 (47.3%) | $58,481 |
| Female | 419 (52.7%) | $0 |
| Total | 795 (100.0%) | $44,016 |
Earnings by Sex by Income Bracket in Cherryville
The most common earnings brackets in Cherryville are $55,000 to $64,999 for men (107 | 28.5%) and $2,499 or less for women (91 | 21.7%).
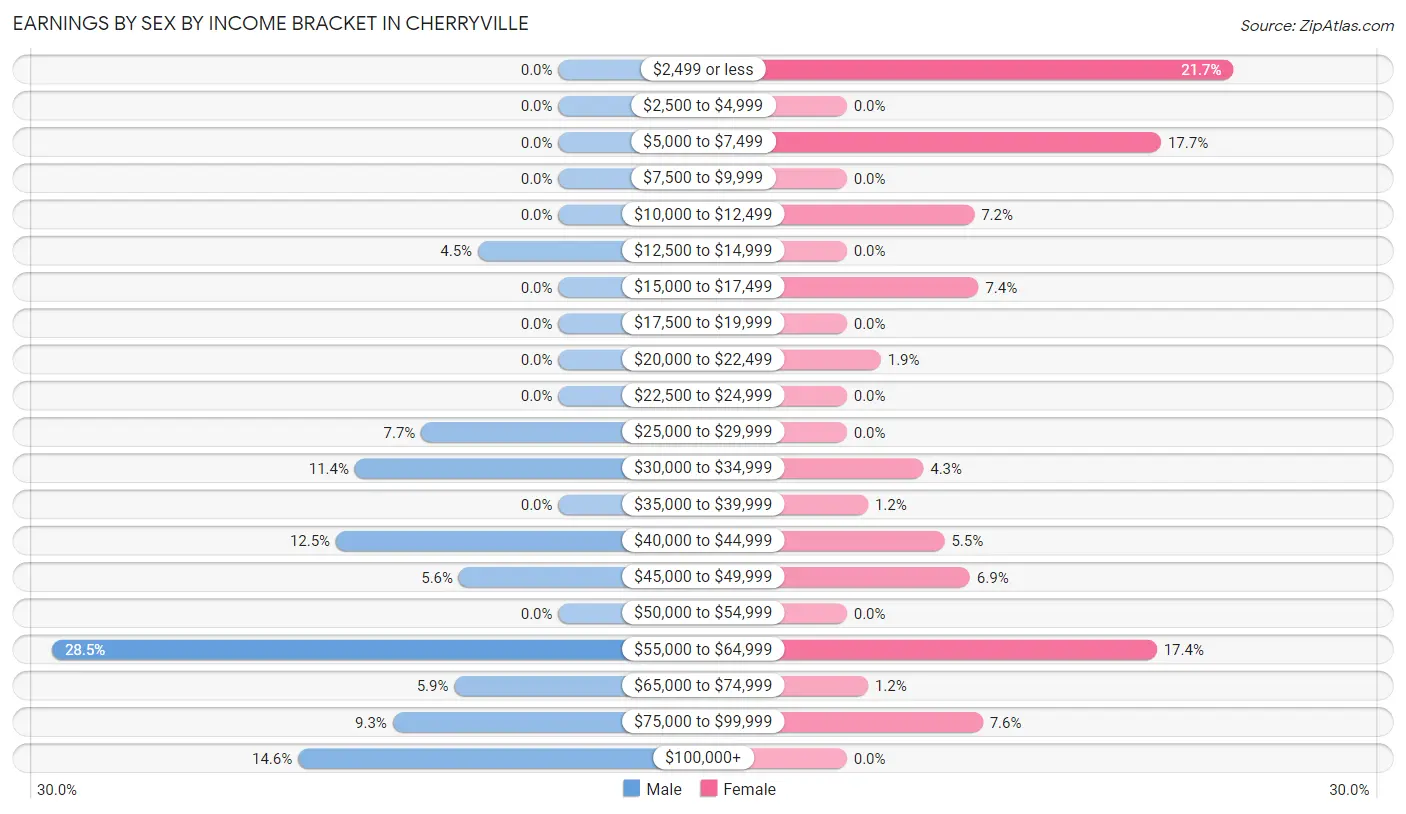
| Income | Male | Female |
| $2,499 or less | 0 (0.0%) | 91 (21.7%) |
| $2,500 to $4,999 | 0 (0.0%) | 0 (0.0%) |
| $5,000 to $7,499 | 0 (0.0%) | 74 (17.7%) |
| $7,500 to $9,999 | 0 (0.0%) | 0 (0.0%) |
| $10,000 to $12,499 | 0 (0.0%) | 30 (7.2%) |
| $12,500 to $14,999 | 17 (4.5%) | 0 (0.0%) |
| $15,000 to $17,499 | 0 (0.0%) | 31 (7.4%) |
| $17,500 to $19,999 | 0 (0.0%) | 0 (0.0%) |
| $20,000 to $22,499 | 0 (0.0%) | 8 (1.9%) |
| $22,500 to $24,999 | 0 (0.0%) | 0 (0.0%) |
| $25,000 to $29,999 | 29 (7.7%) | 0 (0.0%) |
| $30,000 to $34,999 | 43 (11.4%) | 18 (4.3%) |
| $35,000 to $39,999 | 0 (0.0%) | 5 (1.2%) |
| $40,000 to $44,999 | 47 (12.5%) | 23 (5.5%) |
| $45,000 to $49,999 | 21 (5.6%) | 29 (6.9%) |
| $50,000 to $54,999 | 0 (0.0%) | 0 (0.0%) |
| $55,000 to $64,999 | 107 (28.5%) | 73 (17.4%) |
| $65,000 to $74,999 | 22 (5.9%) | 5 (1.2%) |
| $75,000 to $99,999 | 35 (9.3%) | 32 (7.6%) |
| $100,000+ | 55 (14.6%) | 0 (0.0%) |
| Total | 376 (100.0%) | 419 (100.0%) |
Earnings by Sex by Educational Attainment in Cherryville
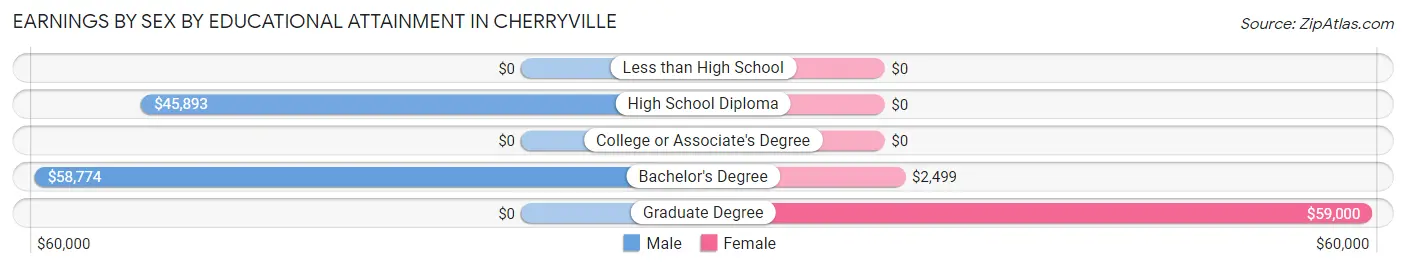
| Educational Attainment | Male Income | Female Income |
| Less than High School | - | - |
| High School Diploma | $45,893 | $0 |
| College or Associate's Degree | - | - |
| Bachelor's Degree | $58,774 | $2,499 |
| Graduate Degree | - | - |
| Total | $59,146 | $0 |
Family Income in Cherryville
Family Income Brackets in Cherryville
According to the Cherryville family income data, there are 112 families falling into the $50,000 to $74,999 income range, which is the most common income bracket and makes up 25.7% of all families.
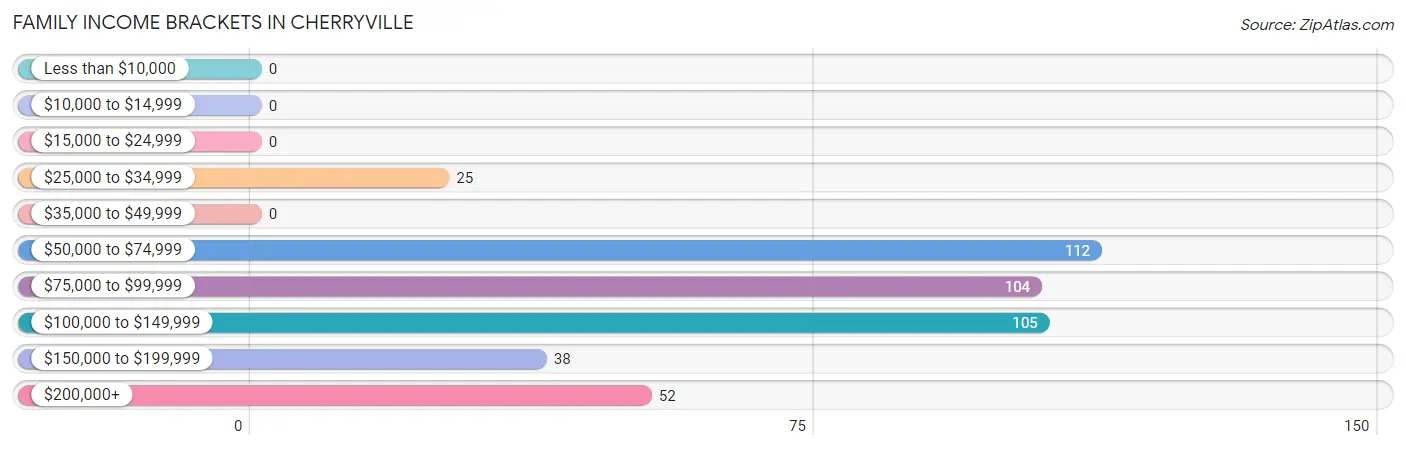
| Income Bracket | # Families | % Families |
| Less than $10,000 | 0 | 0.0% |
| $10,000 to $14,999 | 0 | 0.0% |
| $15,000 to $24,999 | 0 | 0.0% |
| $25,000 to $34,999 | 25 | 5.7% |
| $35,000 to $49,999 | 0 | 0.0% |
| $50,000 to $74,999 | 112 | 25.7% |
| $75,000 to $99,999 | 104 | 23.9% |
| $100,000 to $149,999 | 105 | 24.1% |
| $150,000 to $199,999 | 38 | 8.7% |
| $200,000+ | 52 | 11.9% |
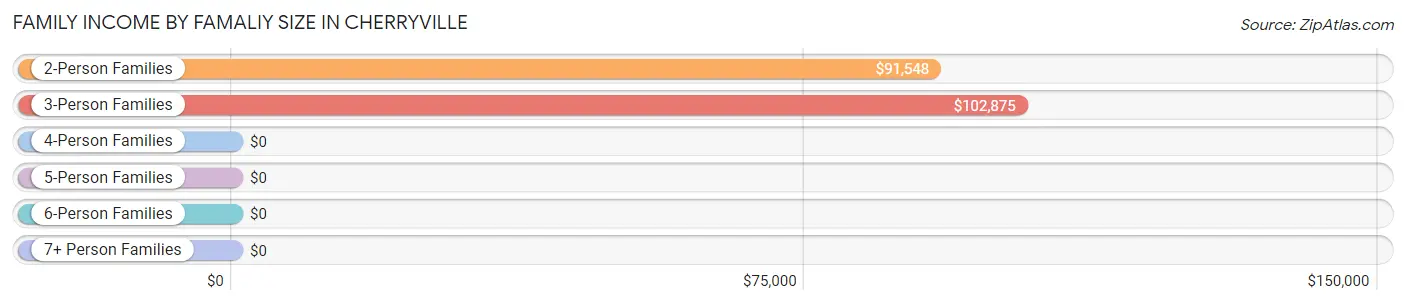
Family Income by Famaliy Size in Cherryville
3-person families (92 | 21.1%) account for the highest median family income in Cherryville with $102,875 per family, while 2-person families (202 | 46.3%) have the highest median income of $45,774 per family member.
| Income Bracket | # Families | Median Income |
| 2-Person Families | 202 (46.3%) | $91,548 |
| 3-Person Families | 92 (21.1%) | $102,875 |
| 4-Person Families | 124 (28.4%) | $0 |
| 5-Person Families | 18 (4.1%) | $0 |
| 6-Person Families | 0 (0.0%) | $0 |
| 7+ Person Families | 0 (0.0%) | $0 |
| Total | 436 (100.0%) | $82,348 |
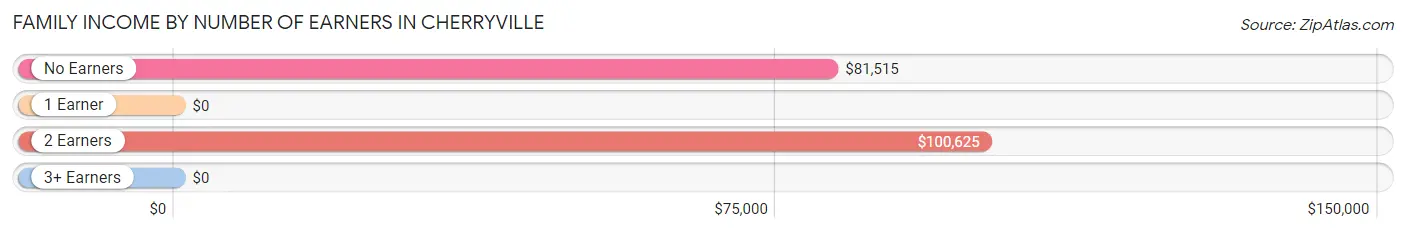
Family Income by Number of Earners in Cherryville
| Number of Earners | # Families | Median Income |
| No Earners | 144 (33.0%) | $81,515 |
| 1 Earner | 7 (1.6%) | $0 |
| 2 Earners | 179 (41.1%) | $100,625 |
| 3+ Earners | 106 (24.3%) | $0 |
| Total | 436 (100.0%) | $82,348 |
Household Income in Cherryville
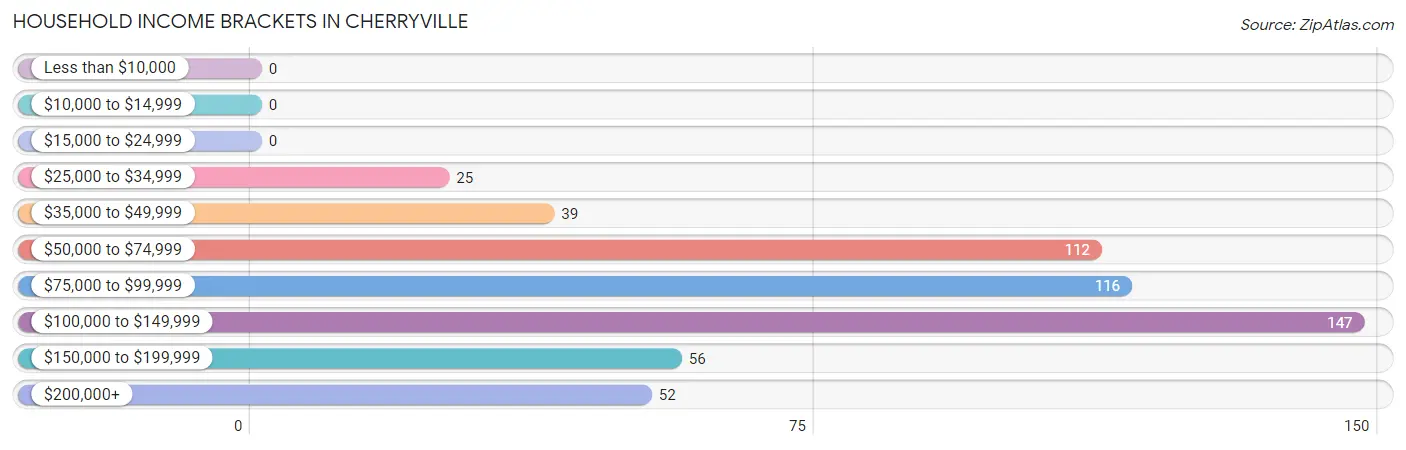
Household Income Brackets in Cherryville
With 147 households falling in the category, the $100,000 to $149,999 income range is the most frequent in Cherryville, accounting for 26.9% of all households.
| Income Bracket | # Households | % Households |
| Less than $10,000 | 0 | 0.0% |
| $10,000 to $14,999 | 0 | 0.0% |
| $15,000 to $24,999 | 0 | 0.0% |
| $25,000 to $34,999 | 25 | 4.6% |
| $35,000 to $49,999 | 39 | 7.1% |
| $50,000 to $74,999 | 112 | 20.5% |
| $75,000 to $99,999 | 116 | 21.2% |
| $100,000 to $149,999 | 147 | 26.9% |
| $150,000 to $199,999 | 56 | 10.2% |
| $200,000+ | 52 | 9.5% |
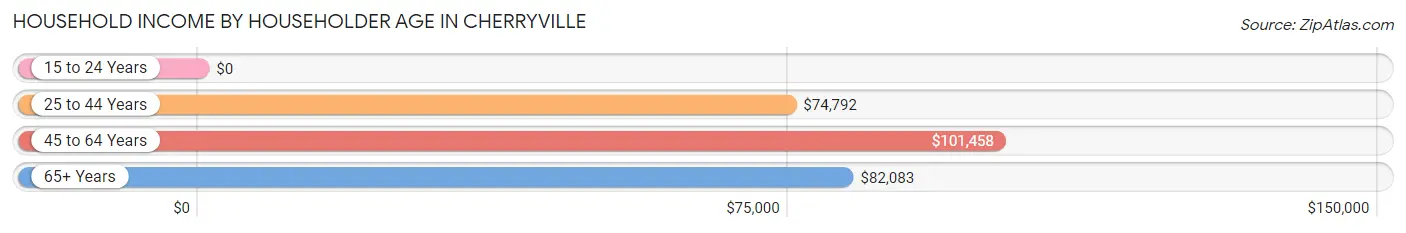
Household Income by Householder Age in Cherryville
The median household income in Cherryville is $90,298, with the highest median household income of $101,458 found in the 45 to 64 years age bracket for the primary householder. A total of 301 households (55.0%) fall into this category.
| Income Bracket | # Households | Median Income |
| 15 to 24 Years | 0 (0.0%) | $0 |
| 25 to 44 Years | 55 (10.1%) | $74,792 |
| 45 to 64 Years | 301 (55.0%) | $101,458 |
| 65+ Years | 191 (34.9%) | $82,083 |
| Total | 547 (100.0%) | $90,298 |
Poverty in Cherryville
Income Below Poverty by Sex and Age in Cherryville
With 2.4% poverty level for males and 10.0% for females among the residents of Cherryville, 6 to 11 year old males and 12 to 14 year old females are the most vulnerable to poverty, with 8 males (10.3%) and 9 females (100.0%) in their respective age groups living below the poverty level.
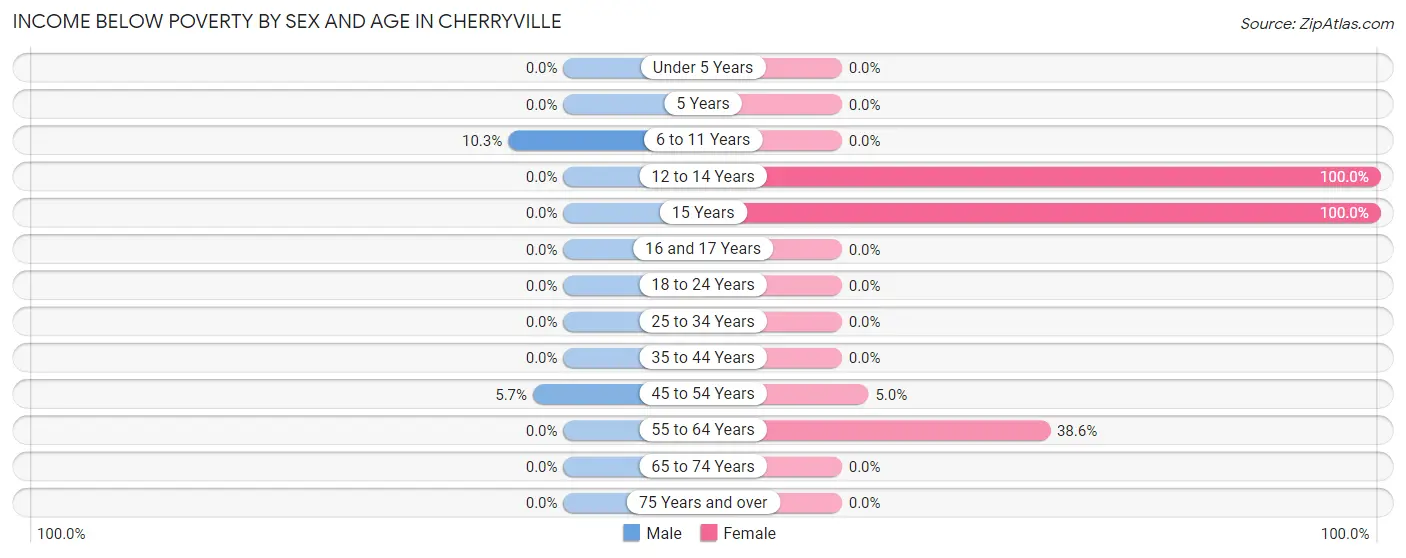
| Age Bracket | Male | Female |
| Under 5 Years | 0 (0.0%) | 0 (0.0%) |
| 5 Years | 0 (0.0%) | 0 (0.0%) |
| 6 to 11 Years | 8 (10.3%) | 0 (0.0%) |
| 12 to 14 Years | 0 (0.0%) | 9 (100.0%) |
| 15 Years | 0 (0.0%) | 8 (100.0%) |
| 16 and 17 Years | 0 (0.0%) | 0 (0.0%) |
| 18 to 24 Years | 0 (0.0%) | 0 (0.0%) |
| 25 to 34 Years | 0 (0.0%) | 0 (0.0%) |
| 35 to 44 Years | 0 (0.0%) | 0 (0.0%) |
| 45 to 54 Years | 9 (5.7%) | 9 (5.0%) |
| 55 to 64 Years | 0 (0.0%) | 51 (38.6%) |
| 65 to 74 Years | 0 (0.0%) | 0 (0.0%) |
| 75 Years and over | 0 (0.0%) | 0 (0.0%) |
| Total | 17 (2.4%) | 77 (10.0%) |
Income Above Poverty by Sex and Age in Cherryville
According to the poverty statistics in Cherryville, males aged 5 years and females aged 6 to 11 years are the age groups that are most secure financially, with 100.0% of males and 100.0% of females in these age groups living above the poverty line.
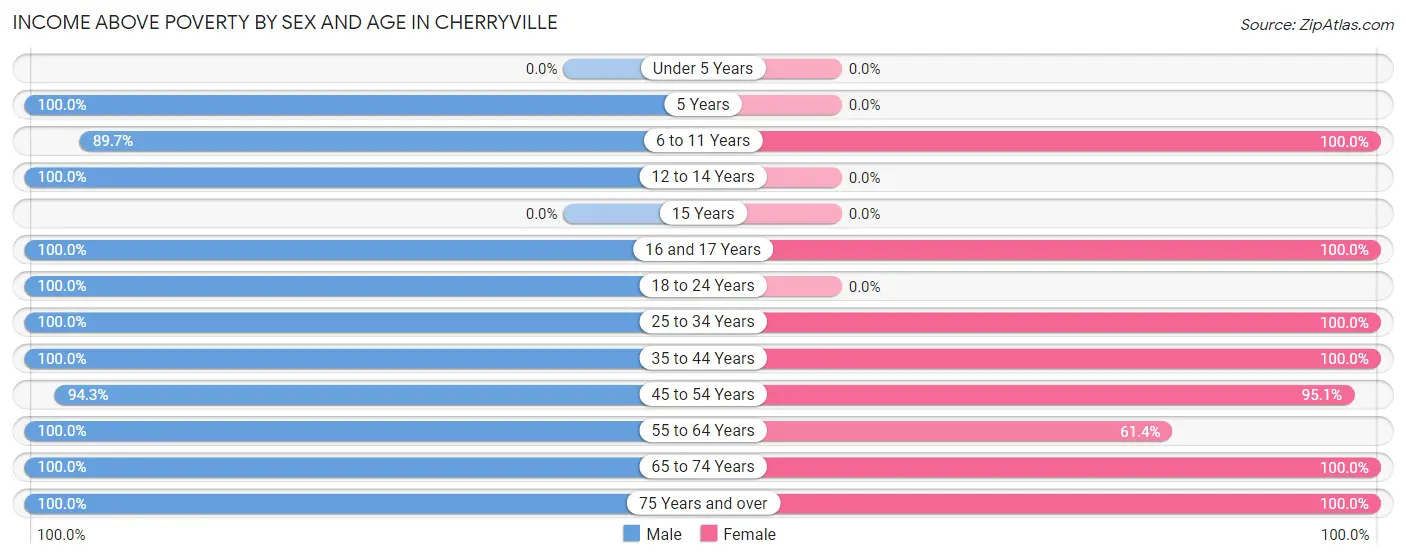
| Age Bracket | Male | Female |
| Under 5 Years | 0 (0.0%) | 0 (0.0%) |
| 5 Years | 10 (100.0%) | 0 (0.0%) |
| 6 to 11 Years | 70 (89.7%) | 41 (100.0%) |
| 12 to 14 Years | 48 (100.0%) | 0 (0.0%) |
| 15 Years | 0 (0.0%) | 0 (0.0%) |
| 16 and 17 Years | 49 (100.0%) | 20 (100.0%) |
| 18 to 24 Years | 42 (100.0%) | 0 (0.0%) |
| 25 to 34 Years | 27 (100.0%) | 62 (100.0%) |
| 35 to 44 Years | 74 (100.0%) | 68 (100.0%) |
| 45 to 54 Years | 150 (94.3%) | 173 (95.1%) |
| 55 to 64 Years | 94 (100.0%) | 81 (61.4%) |
| 65 to 74 Years | 65 (100.0%) | 110 (100.0%) |
| 75 Years and over | 57 (100.0%) | 137 (100.0%) |
| Total | 686 (97.6%) | 692 (90.0%) |
Income Below Poverty Among Married-Couple Families in Cherryville
The poverty statistics for married-couple families in Cherryville show that 2.1% or 9 of the total 436 families live below the poverty line. Families with 3 or 4 children have the highest poverty rate of 50.0%, comprising of 9 families. On the other hand, families with no children have the lowest poverty rate of 0.0%, which includes 0 families.
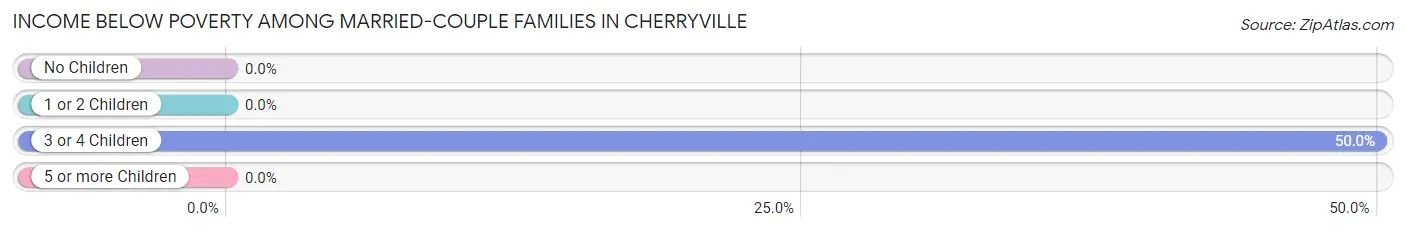
| Children | Above Poverty | Below Poverty |
| No Children | 266 (100.0%) | 0 (0.0%) |
| 1 or 2 Children | 152 (100.0%) | 0 (0.0%) |
| 3 or 4 Children | 9 (50.0%) | 9 (50.0%) |
| 5 or more Children | 0 (0.0%) | 0 (0.0%) |
| Total | 427 (97.9%) | 9 (2.1%) |
Income Below Poverty Among Single-Parent Households in Cherryville
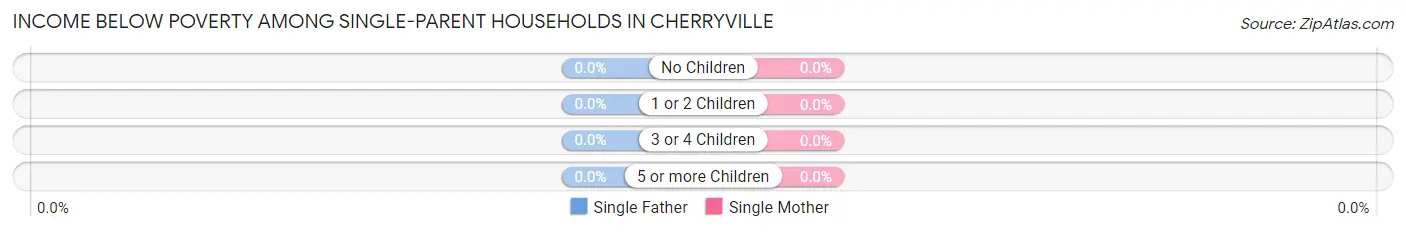
| Children | Single Father | Single Mother |
| No Children | 0 (0.0%) | 0 (0.0%) |
| 1 or 2 Children | 0 (0.0%) | 0 (0.0%) |
| 3 or 4 Children | 0 (0.0%) | 0 (0.0%) |
| 5 or more Children | 0 (0.0%) | 0 (0.0%) |
| Total | 0 (0.0%) | 0 (0.0%) |
Income Below Poverty Among Married-Couple vs Single-Parent Households in Cherryville
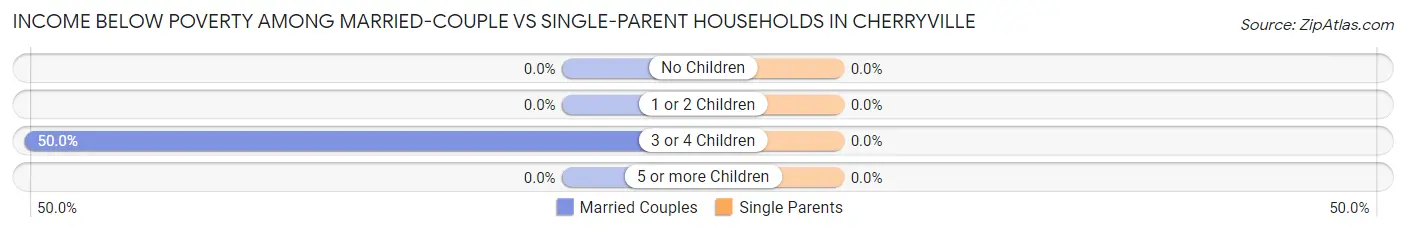
| Children | Married-Couple Families | Single-Parent Households |
| No Children | 0 (0.0%) | 0 (0.0%) |
| 1 or 2 Children | 0 (0.0%) | 0 (0.0%) |
| 3 or 4 Children | 9 (50.0%) | 0 (0.0%) |
| 5 or more Children | 0 (0.0%) | 0 (0.0%) |
| Total | 9 (2.1%) | 0 (0.0%) |
Employment Characteristics in Cherryville
Employment by Class of Employer in Cherryville
Among the 704 employed individuals in Cherryville, private company employees (503 | 71.5%), local government employees (101 | 14.3%), and not-for-profit organizations (56 | 8.0%) make up the most common classes of employment.
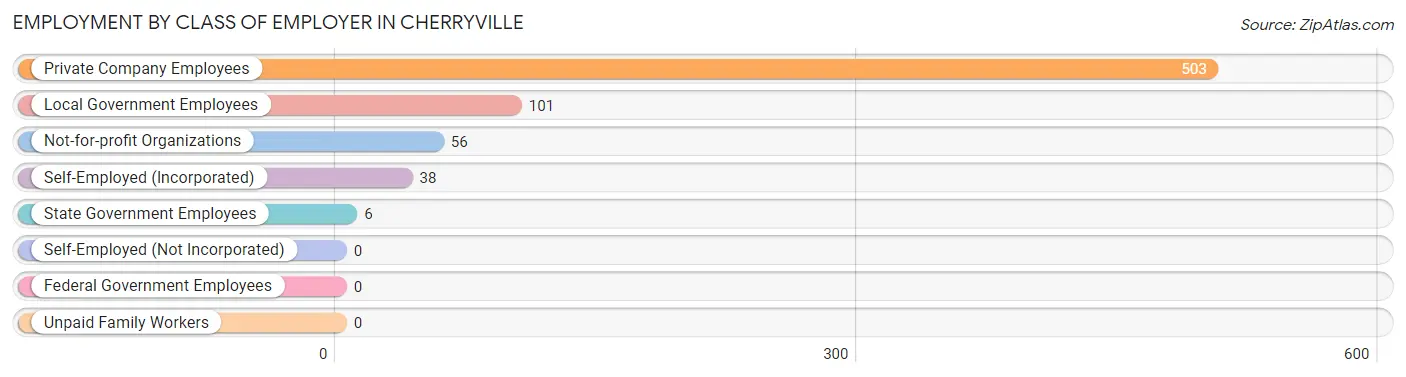
| Employer Class | # Employees | % Employees |
| Private Company Employees | 503 | 71.5% |
| Self-Employed (Incorporated) | 38 | 5.4% |
| Self-Employed (Not Incorporated) | 0 | 0.0% |
| Not-for-profit Organizations | 56 | 8.0% |
| Local Government Employees | 101 | 14.3% |
| State Government Employees | 6 | 0.9% |
| Federal Government Employees | 0 | 0.0% |
| Unpaid Family Workers | 0 | 0.0% |
| Total | 704 | 100.0% |
Employment Status by Age in Cherryville
According to the labor force statistics for Cherryville, out of the total population over 16 years of age (1,278), 61.7% or 789 individuals are in the labor force, with 7.4% or 58 of them unemployed. The age group with the highest labor force participation rate is 25 to 29 years, with 100.0% or 78 individuals in the labor force. Within the labor force, the 16 to 19 years age range has the highest percentage of unemployed individuals, with 86.0% or 49 of them being unemployed.
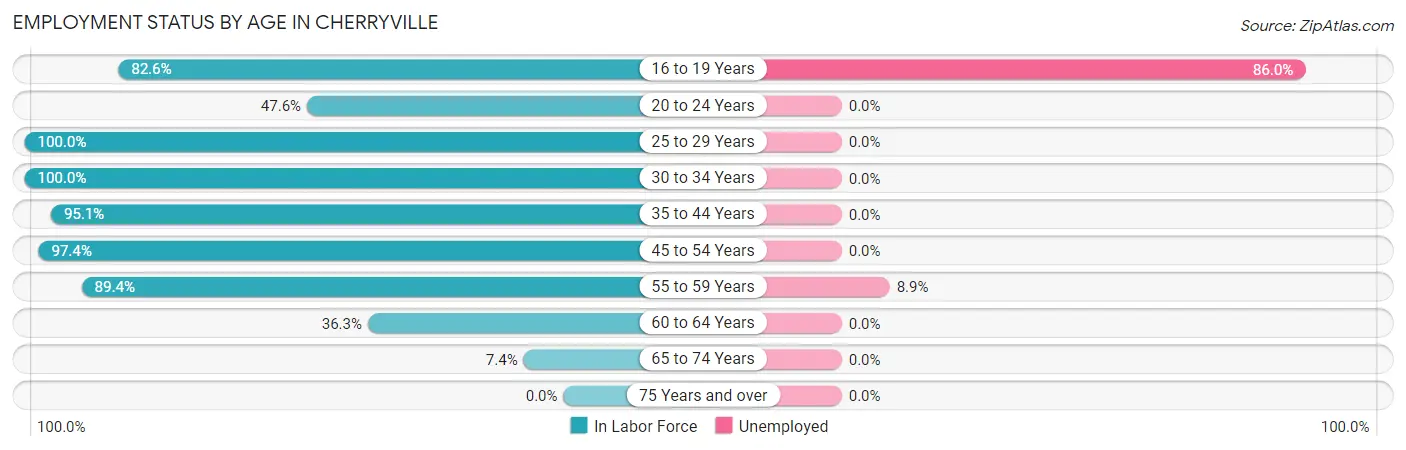
| Age Bracket | In Labor Force | Unemployed |
| 16 to 19 Years | 57 (82.6%) | 49 (86.0%) |
| 20 to 24 Years | 20 (47.6%) | 0 (0.0%) |
| 25 to 29 Years | 78 (100.0%) | 0 (0.0%) |
| 30 to 34 Years | 11 (100.0%) | 0 (0.0%) |
| 35 to 44 Years | 135 (95.1%) | 0 (0.0%) |
| 45 to 54 Years | 332 (97.4%) | 0 (0.0%) |
| 55 to 59 Years | 101 (89.4%) | 9 (8.9%) |
| 60 to 64 Years | 41 (36.3%) | 0 (0.0%) |
| 65 to 74 Years | 13 (7.4%) | 0 (0.0%) |
| 75 Years and over | 0 (0.0%) | 0 (0.0%) |
| Total | 789 (61.7%) | 58 (7.4%) |
Employment Status by Educational Attainment in Cherryville
According to labor force statistics for Cherryville, 87.5% of individuals (698) out of the total population between 25 and 64 years of age (798) are in the labor force, with 1.3% or 9 of them being unemployed. The group with the highest labor force participation rate are those with the educational attainment of less than high school, with 100.0% or 68 individuals in the labor force. Within the labor force, individuals with bachelor's degree or higher education have the highest percentage of unemployment, with 2.4% or 9 of them being unemployed.
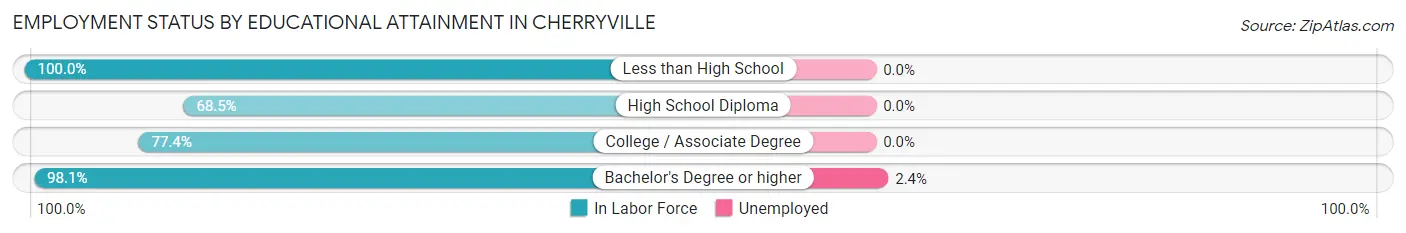
| Educational Attainment | In Labor Force | Unemployed |
| Less than High School | 68 (100.0%) | 0 (0.0%) |
| High School Diploma | 98 (68.5%) | 0 (0.0%) |
| College / Associate Degree | 164 (77.4%) | 0 (0.0%) |
| Bachelor's Degree or higher | 368 (98.1%) | 9 (2.4%) |
| Total | 698 (87.5%) | 10 (1.3%) |
Employment Occupations by Sex in Cherryville
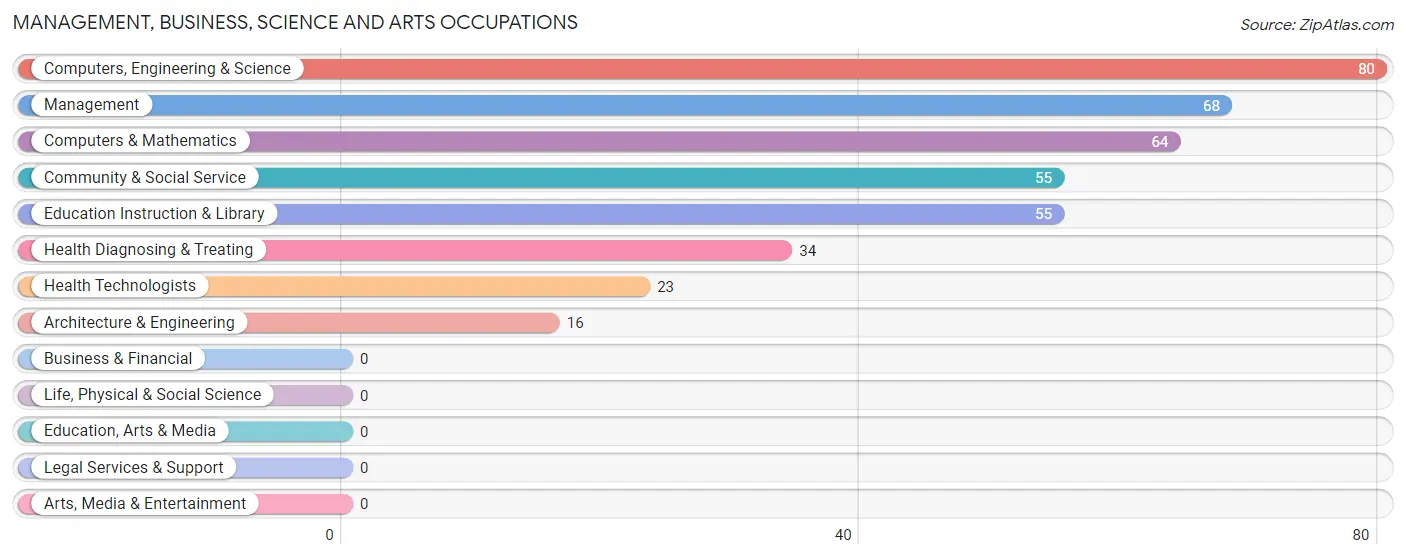
Management, Business, Science and Arts Occupations
The most common Management, Business, Science and Arts occupations in Cherryville are Computers, Engineering & Science (80 | 11.0%), Management (68 | 9.3%), Computers & Mathematics (64 | 8.8%), Community & Social Service (55 | 7.5%), and Education Instruction & Library (55 | 7.5%).
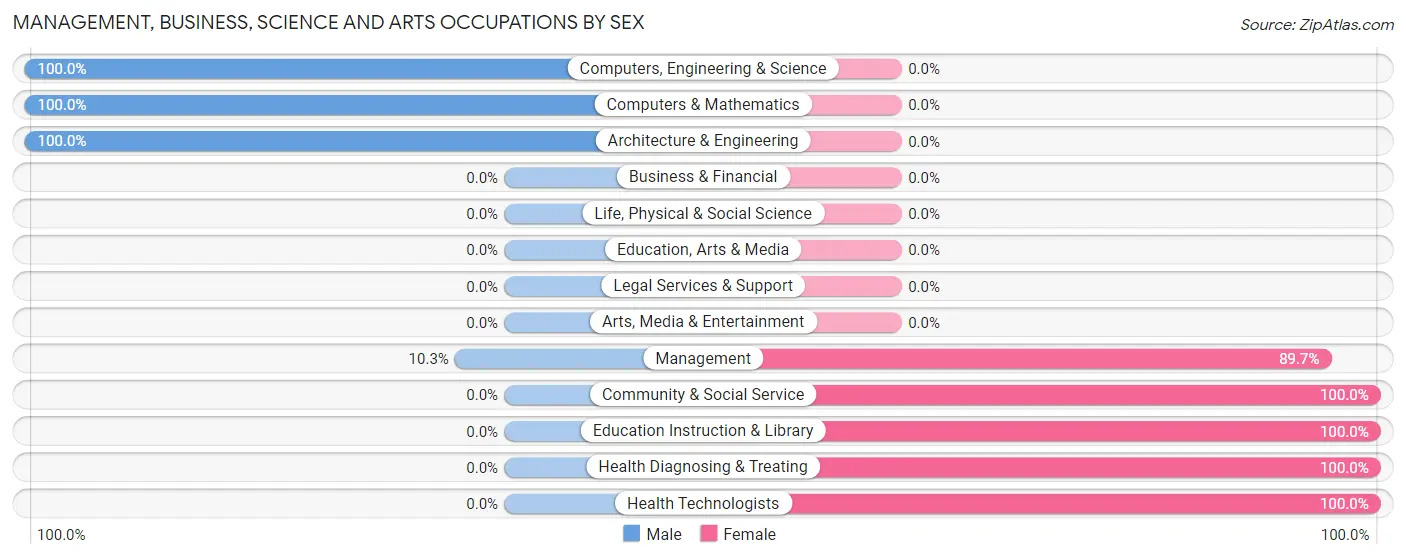
Management, Business, Science and Arts Occupations by Sex
Within the Management, Business, Science and Arts occupations in Cherryville, the most male-oriented occupations are Computers, Engineering & Science (100.0%), Computers & Mathematics (100.0%), and Architecture & Engineering (100.0%), while the most female-oriented occupations are Community & Social Service (100.0%), Education Instruction & Library (100.0%), and Health Diagnosing & Treating (100.0%).
| Occupation | Male | Female |
| Management | 7 (10.3%) | 61 (89.7%) |
| Business & Financial | 0 (0.0%) | 0 (0.0%) |
| Computers, Engineering & Science | 80 (100.0%) | 0 (0.0%) |
| Computers & Mathematics | 64 (100.0%) | 0 (0.0%) |
| Architecture & Engineering | 16 (100.0%) | 0 (0.0%) |
| Life, Physical & Social Science | 0 (0.0%) | 0 (0.0%) |
| Community & Social Service | 0 (0.0%) | 55 (100.0%) |
| Education, Arts & Media | 0 (0.0%) | 0 (0.0%) |
| Legal Services & Support | 0 (0.0%) | 0 (0.0%) |
| Education Instruction & Library | 0 (0.0%) | 55 (100.0%) |
| Arts, Media & Entertainment | 0 (0.0%) | 0 (0.0%) |
| Health Diagnosing & Treating | 0 (0.0%) | 34 (100.0%) |
| Health Technologists | 0 (0.0%) | 23 (100.0%) |
| Total (Category) | 87 (36.7%) | 150 (63.3%) |
| Total (Overall) | 341 (46.7%) | 389 (53.3%) |
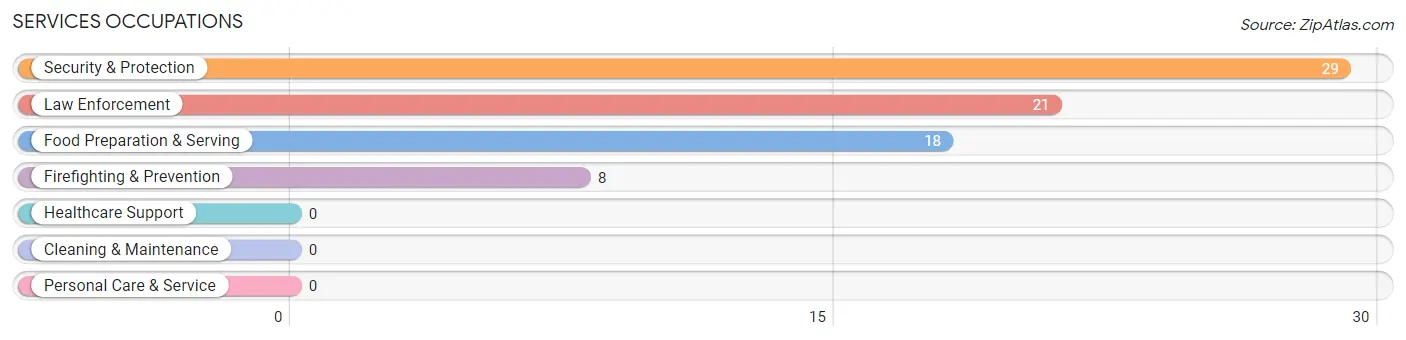
Services Occupations
The most common Services occupations in Cherryville are Security & Protection (29 | 4.0%), Law Enforcement (21 | 2.9%), Food Preparation & Serving (18 | 2.5%), and Firefighting & Prevention (8 | 1.1%).
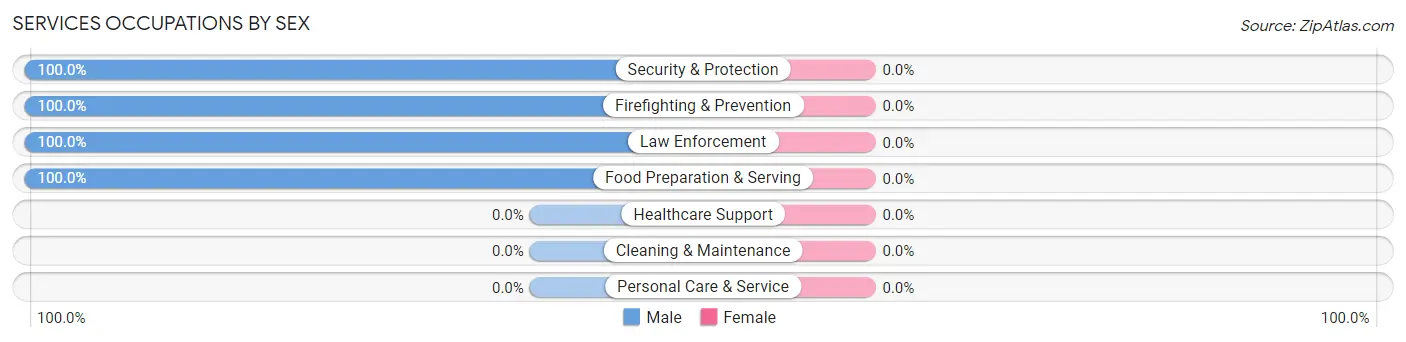
Services Occupations by Sex
| Occupation | Male | Female |
| Healthcare Support | 0 (0.0%) | 0 (0.0%) |
| Security & Protection | 29 (100.0%) | 0 (0.0%) |
| Firefighting & Prevention | 8 (100.0%) | 0 (0.0%) |
| Law Enforcement | 21 (100.0%) | 0 (0.0%) |
| Food Preparation & Serving | 18 (100.0%) | 0 (0.0%) |
| Cleaning & Maintenance | 0 (0.0%) | 0 (0.0%) |
| Personal Care & Service | 0 (0.0%) | 0 (0.0%) |
| Total (Category) | 47 (100.0%) | 0 (0.0%) |
| Total (Overall) | 341 (46.7%) | 389 (53.3%) |
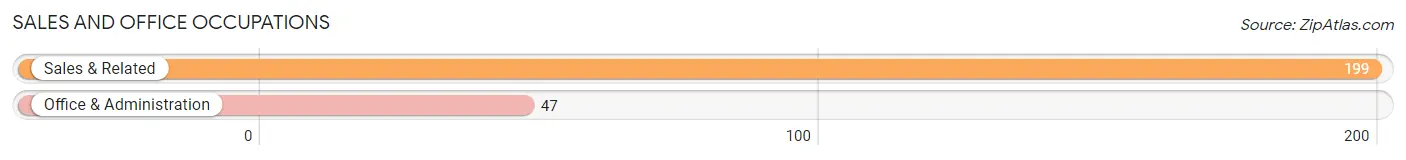
Sales and Office Occupations
The most common Sales and Office occupations in Cherryville are Sales & Related (199 | 27.3%), and Office & Administration (47 | 6.4%).
Sales and Office Occupations by Sex
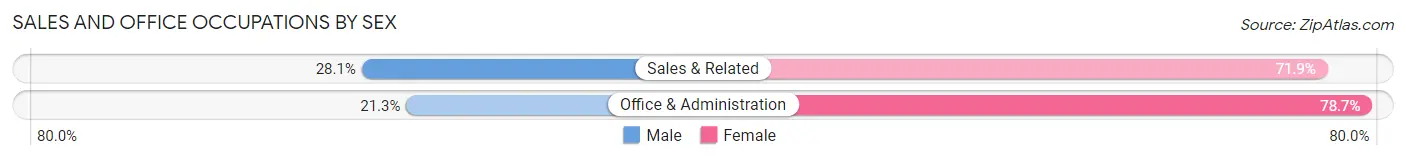
| Occupation | Male | Female |
| Sales & Related | 56 (28.1%) | 143 (71.9%) |
| Office & Administration | 10 (21.3%) | 37 (78.7%) |
| Total (Category) | 66 (26.8%) | 180 (73.2%) |
| Total (Overall) | 341 (46.7%) | 389 (53.3%) |
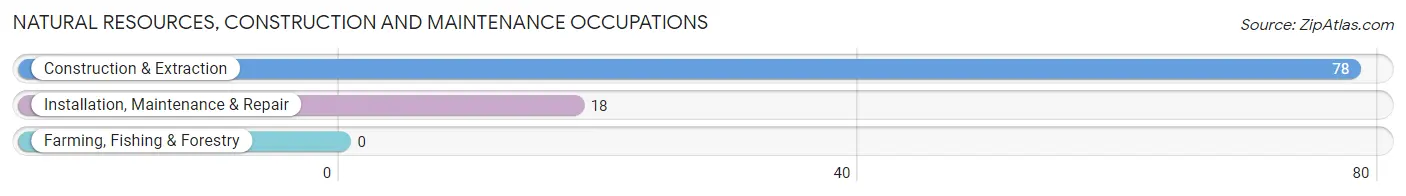
Natural Resources, Construction and Maintenance Occupations
The most common Natural Resources, Construction and Maintenance occupations in Cherryville are Construction & Extraction (78 | 10.7%), and Installation, Maintenance & Repair (18 | 2.5%).
Natural Resources, Construction and Maintenance Occupations by Sex
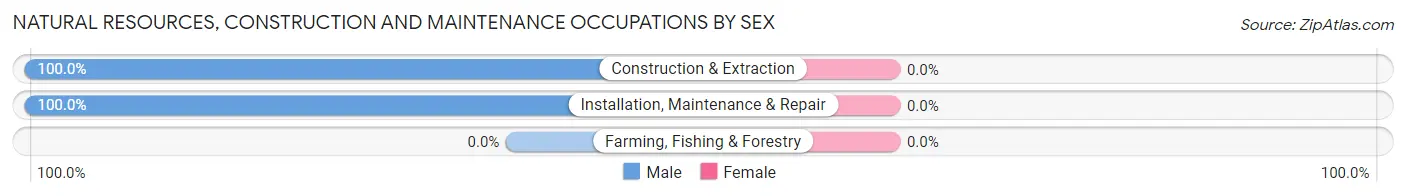
| Occupation | Male | Female |
| Farming, Fishing & Forestry | 0 (0.0%) | 0 (0.0%) |
| Construction & Extraction | 78 (100.0%) | 0 (0.0%) |
| Installation, Maintenance & Repair | 18 (100.0%) | 0 (0.0%) |
| Total (Category) | 96 (100.0%) | 0 (0.0%) |
| Total (Overall) | 341 (46.7%) | 389 (53.3%) |
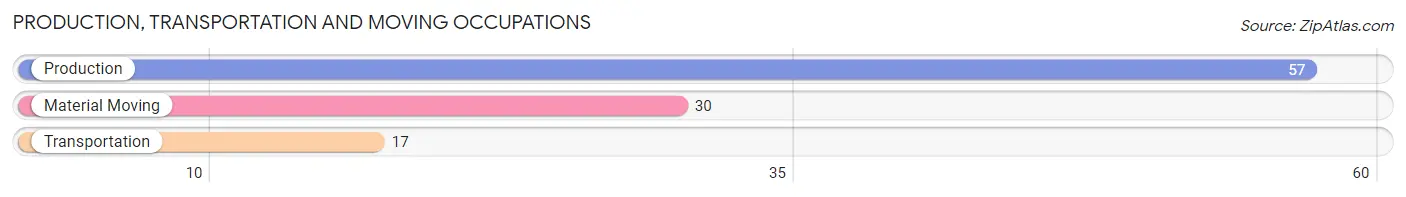
Production, Transportation and Moving Occupations
The most common Production, Transportation and Moving occupations in Cherryville are Production (57 | 7.8%), Material Moving (30 | 4.1%), and Transportation (17 | 2.3%).
Production, Transportation and Moving Occupations by Sex
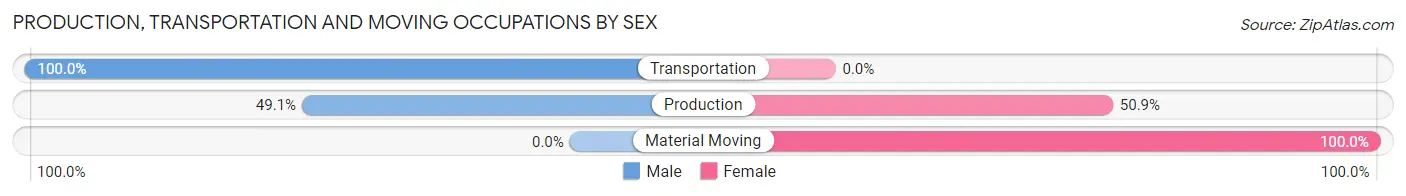
| Occupation | Male | Female |
| Production | 28 (49.1%) | 29 (50.9%) |
| Transportation | 17 (100.0%) | 0 (0.0%) |
| Material Moving | 0 (0.0%) | 30 (100.0%) |
| Total (Category) | 45 (43.3%) | 59 (56.7%) |
| Total (Overall) | 341 (46.7%) | 389 (53.3%) |
Employment Industries by Sex in Cherryville
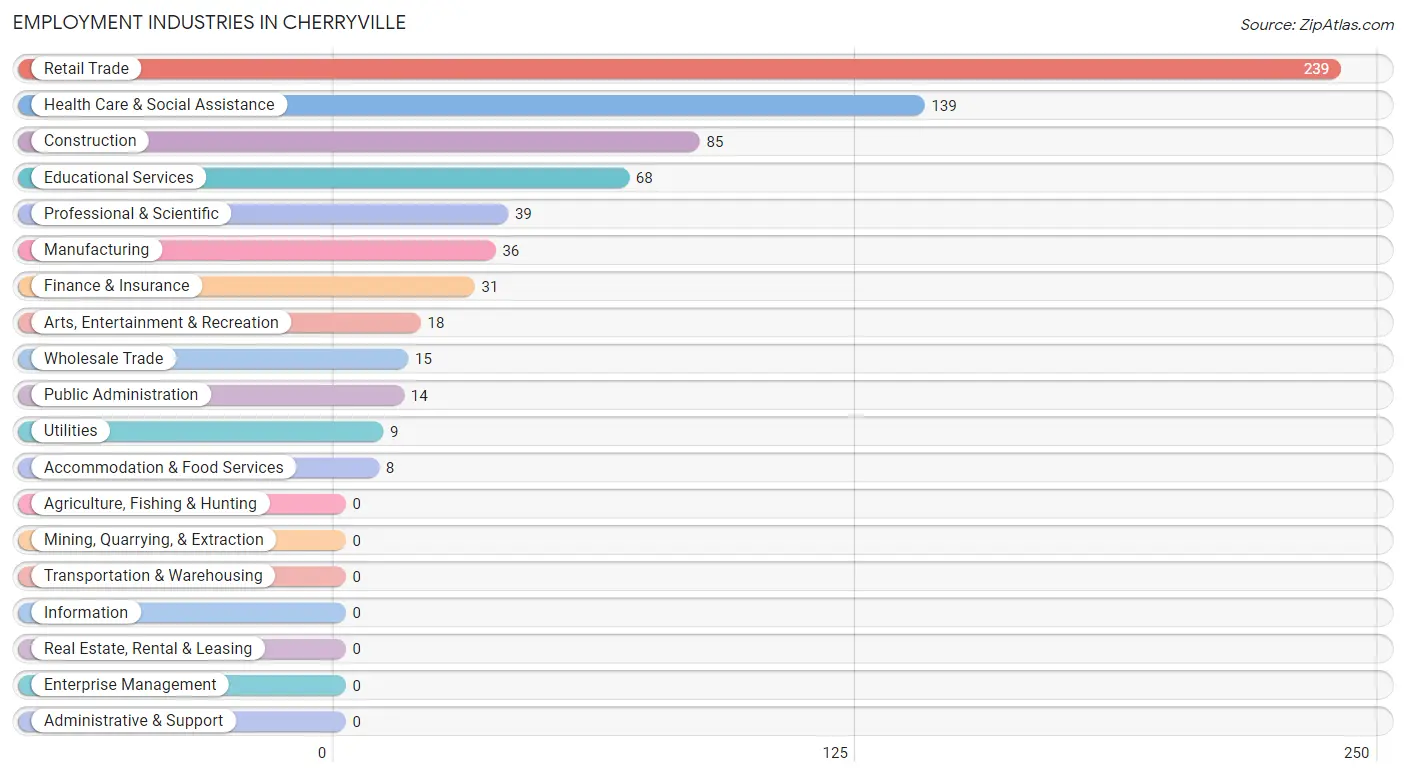
Employment Industries in Cherryville
The major employment industries in Cherryville include Retail Trade (239 | 32.7%), Health Care & Social Assistance (139 | 19.0%), Construction (85 | 11.6%), Educational Services (68 | 9.3%), and Professional & Scientific (39 | 5.3%).
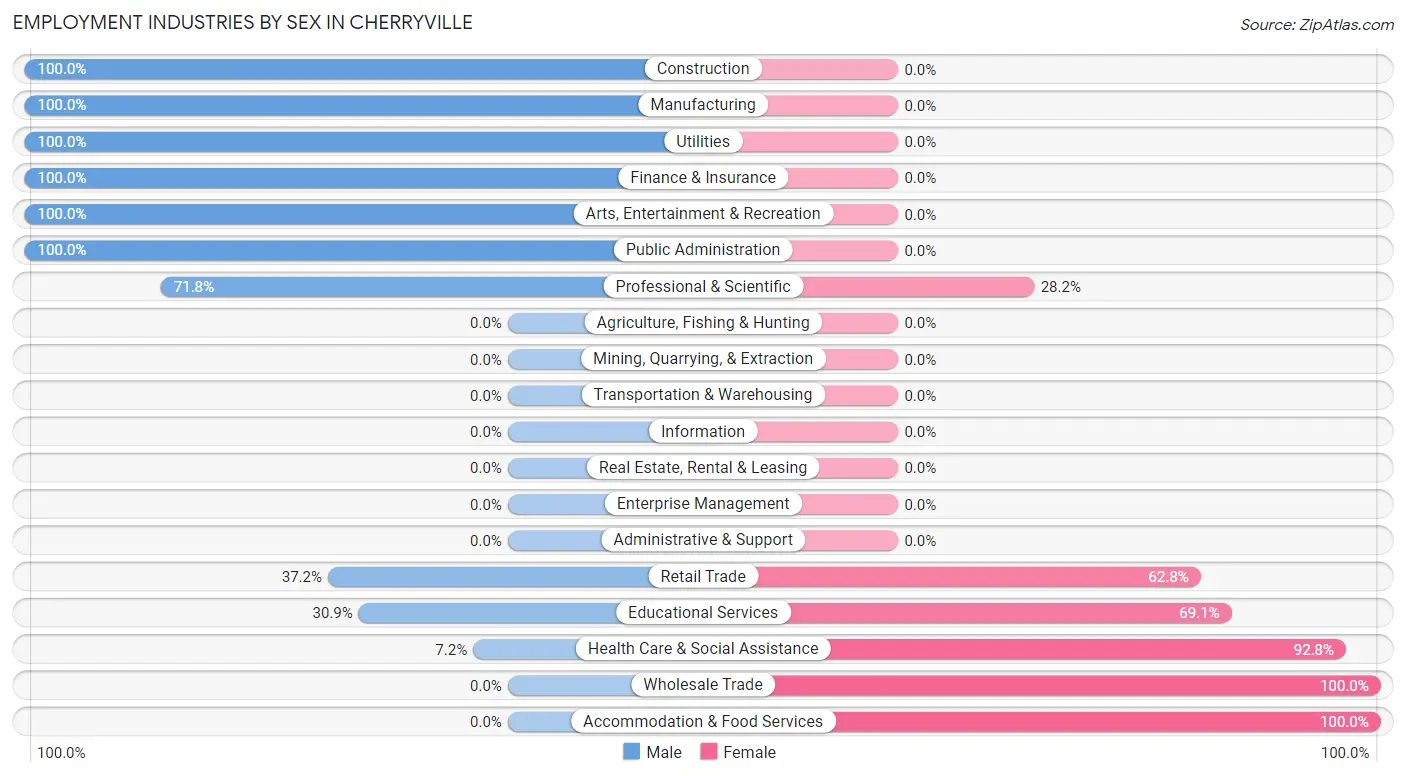
Employment Industries by Sex in Cherryville
The Cherryville industries that see more men than women are Construction (100.0%), Manufacturing (100.0%), and Utilities (100.0%), whereas the industries that tend to have a higher number of women are Wholesale Trade (100.0%), Accommodation & Food Services (100.0%), and Health Care & Social Assistance (92.8%).
| Industry | Male | Female |
| Agriculture, Fishing & Hunting | 0 (0.0%) | 0 (0.0%) |
| Mining, Quarrying, & Extraction | 0 (0.0%) | 0 (0.0%) |
| Construction | 85 (100.0%) | 0 (0.0%) |
| Manufacturing | 36 (100.0%) | 0 (0.0%) |
| Wholesale Trade | 0 (0.0%) | 15 (100.0%) |
| Retail Trade | 89 (37.2%) | 150 (62.8%) |
| Transportation & Warehousing | 0 (0.0%) | 0 (0.0%) |
| Utilities | 9 (100.0%) | 0 (0.0%) |
| Information | 0 (0.0%) | 0 (0.0%) |
| Finance & Insurance | 31 (100.0%) | 0 (0.0%) |
| Real Estate, Rental & Leasing | 0 (0.0%) | 0 (0.0%) |
| Professional & Scientific | 28 (71.8%) | 11 (28.2%) |
| Enterprise Management | 0 (0.0%) | 0 (0.0%) |
| Administrative & Support | 0 (0.0%) | 0 (0.0%) |
| Educational Services | 21 (30.9%) | 47 (69.1%) |
| Health Care & Social Assistance | 10 (7.2%) | 129 (92.8%) |
| Arts, Entertainment & Recreation | 18 (100.0%) | 0 (0.0%) |
| Accommodation & Food Services | 0 (0.0%) | 8 (100.0%) |
| Public Administration | 14 (100.0%) | 0 (0.0%) |
| Total | 341 (46.7%) | 389 (53.3%) |
Education in Cherryville
School Enrollment in Cherryville
The most common levels of schooling among the 350 students in Cherryville are elementary school (90 | 25.7%), middle school (86 | 24.6%), and college / undergraduate (79 | 22.6%).
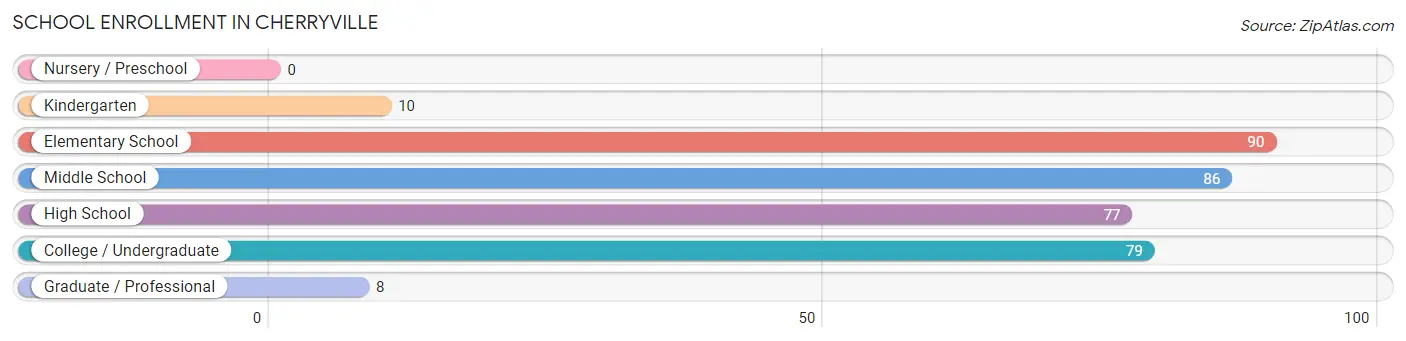
| School Level | # Students | % Students |
| Nursery / Preschool | 0 | 0.0% |
| Kindergarten | 10 | 2.9% |
| Elementary School | 90 | 25.7% |
| Middle School | 86 | 24.6% |
| High School | 77 | 22.0% |
| College / Undergraduate | 79 | 22.6% |
| Graduate / Professional | 8 | 2.3% |
| Total | 350 | 100.0% |
School Enrollment by Age by Funding Source in Cherryville
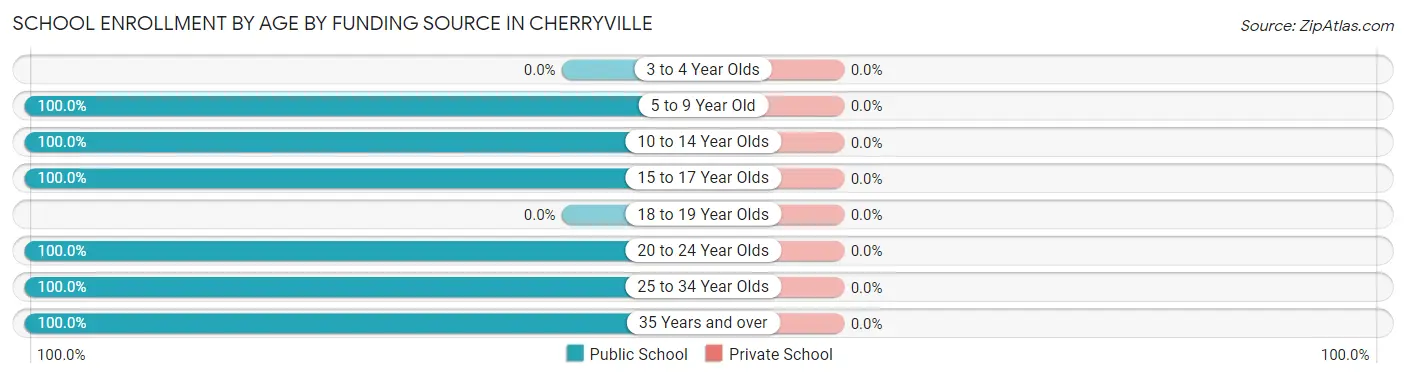
| Age Bracket | Public School | Private School |
| 3 to 4 Year Olds | 0 (0.0%) | 0 (0.0%) |
| 5 to 9 Year Old | 100 (100.0%) | 0 (0.0%) |
| 10 to 14 Year Olds | 86 (100.0%) | 0 (0.0%) |
| 15 to 17 Year Olds | 77 (100.0%) | 0 (0.0%) |
| 18 to 19 Year Olds | 0 (0.0%) | 0 (0.0%) |
| 20 to 24 Year Olds | 22 (100.0%) | 0 (0.0%) |
| 25 to 34 Year Olds | 57 (100.0%) | 0 (0.0%) |
| 35 Years and over | 8 (100.0%) | 0 (0.0%) |
| Total | 350 (100.0%) | 0 (0.0%) |
Educational Attainment by Field of Study in Cherryville
Education (93 | 20.8%), computers & mathematics (80 | 17.9%), literature & languages (50 | 11.2%), arts & humanities (44 | 9.8%), and bio, nature & agricultural (38 | 8.5%) are the most common fields of study among 447 individuals in Cherryville who have obtained a bachelor's degree or higher.
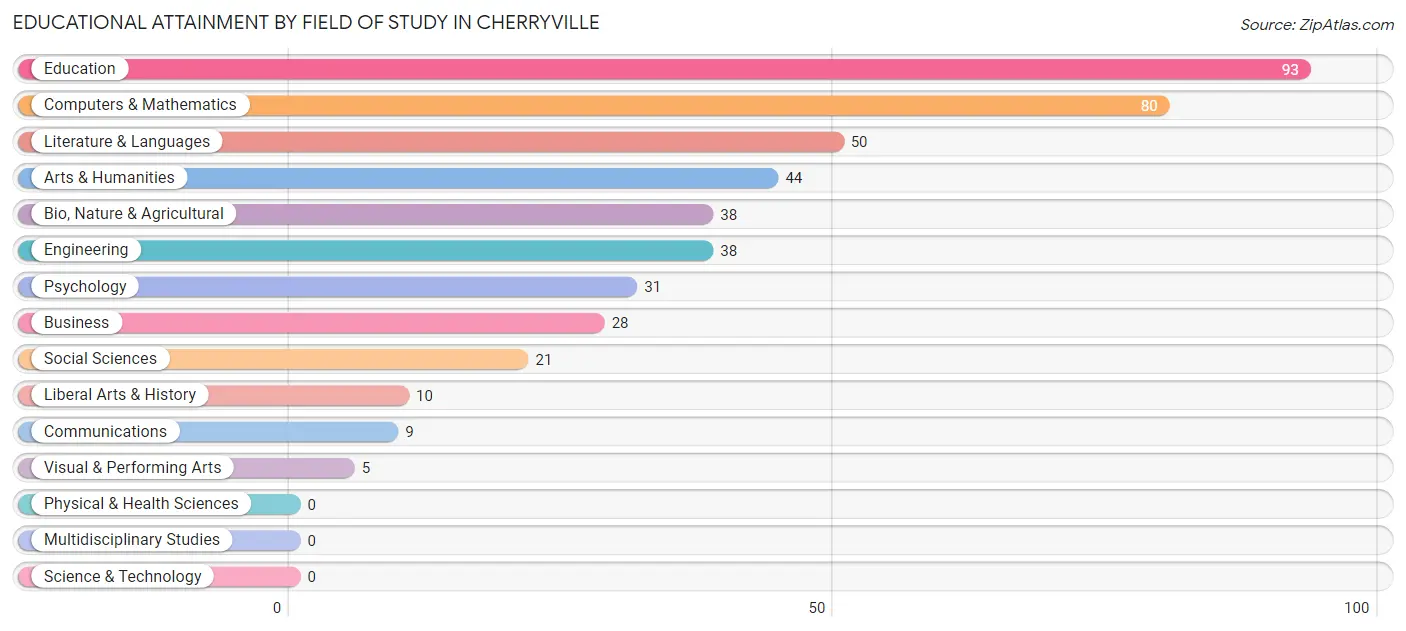
| Field of Study | # Graduates | % Graduates |
| Computers & Mathematics | 80 | 17.9% |
| Bio, Nature & Agricultural | 38 | 8.5% |
| Physical & Health Sciences | 0 | 0.0% |
| Psychology | 31 | 6.9% |
| Social Sciences | 21 | 4.7% |
| Engineering | 38 | 8.5% |
| Multidisciplinary Studies | 0 | 0.0% |
| Science & Technology | 0 | 0.0% |
| Business | 28 | 6.3% |
| Education | 93 | 20.8% |
| Literature & Languages | 50 | 11.2% |
| Liberal Arts & History | 10 | 2.2% |
| Visual & Performing Arts | 5 | 1.1% |
| Communications | 9 | 2.0% |
| Arts & Humanities | 44 | 9.8% |
| Total | 447 | 100.0% |
Transportation & Commute in Cherryville
Vehicle Availability by Sex in Cherryville
The most prevalent vehicle ownership categories in Cherryville are males with 2 vehicles (199, accounting for 61.4%) and females with 2 vehicles (256, making up 52.4%).
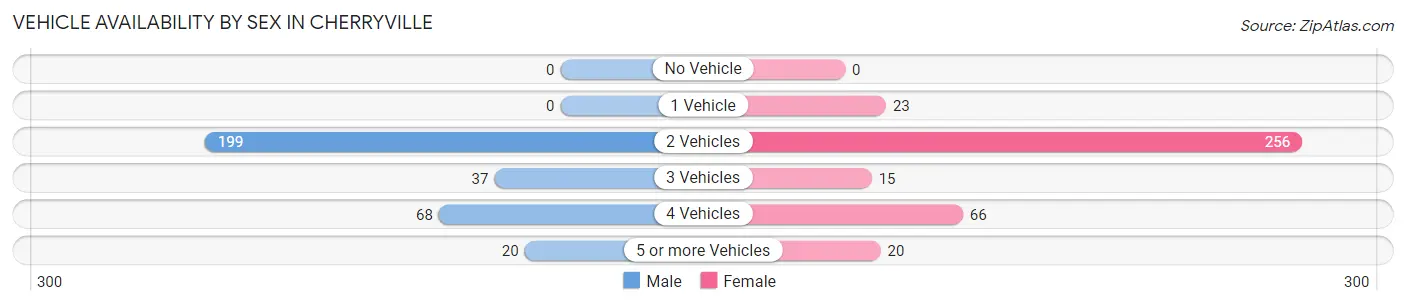
| Vehicles Available | Male | Female |
| No Vehicle | 0 (0.0%) | 0 (0.0%) |
| 1 Vehicle | 0 (0.0%) | 23 (6.0%) |
| 2 Vehicles | 199 (61.4%) | 256 (67.4%) |
| 3 Vehicles | 37 (11.4%) | 15 (4.0%) |
| 4 Vehicles | 68 (21.0%) | 66 (17.4%) |
| 5 or more Vehicles | 20 (6.2%) | 20 (5.3%) |
| Total | 324 (100.0%) | 380 (100.0%) |
Commute Time in Cherryville
The most frequently occuring commute durations in Cherryville are 20 to 24 minutes (221 commuters, 32.5%), 25 to 29 minutes (82 commuters, 12.0%), and 45 to 59 minutes (80 commuters, 11.7%).
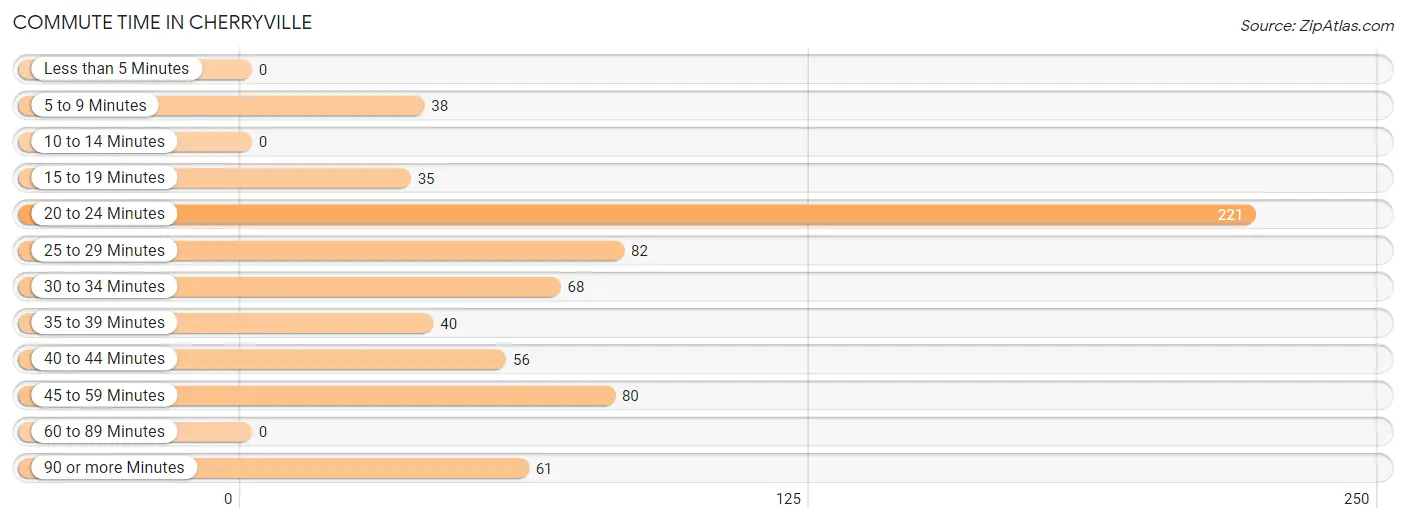
| Commute Time | # Commuters | % Commuters |
| Less than 5 Minutes | 0 | 0.0% |
| 5 to 9 Minutes | 38 | 5.6% |
| 10 to 14 Minutes | 0 | 0.0% |
| 15 to 19 Minutes | 35 | 5.1% |
| 20 to 24 Minutes | 221 | 32.5% |
| 25 to 29 Minutes | 82 | 12.0% |
| 30 to 34 Minutes | 68 | 10.0% |
| 35 to 39 Minutes | 40 | 5.9% |
| 40 to 44 Minutes | 56 | 8.2% |
| 45 to 59 Minutes | 80 | 11.7% |
| 60 to 89 Minutes | 0 | 0.0% |
| 90 or more Minutes | 61 | 9.0% |
Commute Time by Sex in Cherryville
The most common commute times in Cherryville are 20 to 24 minutes (86 commuters, 26.5%) for males and 20 to 24 minutes (135 commuters, 37.8%) for females.
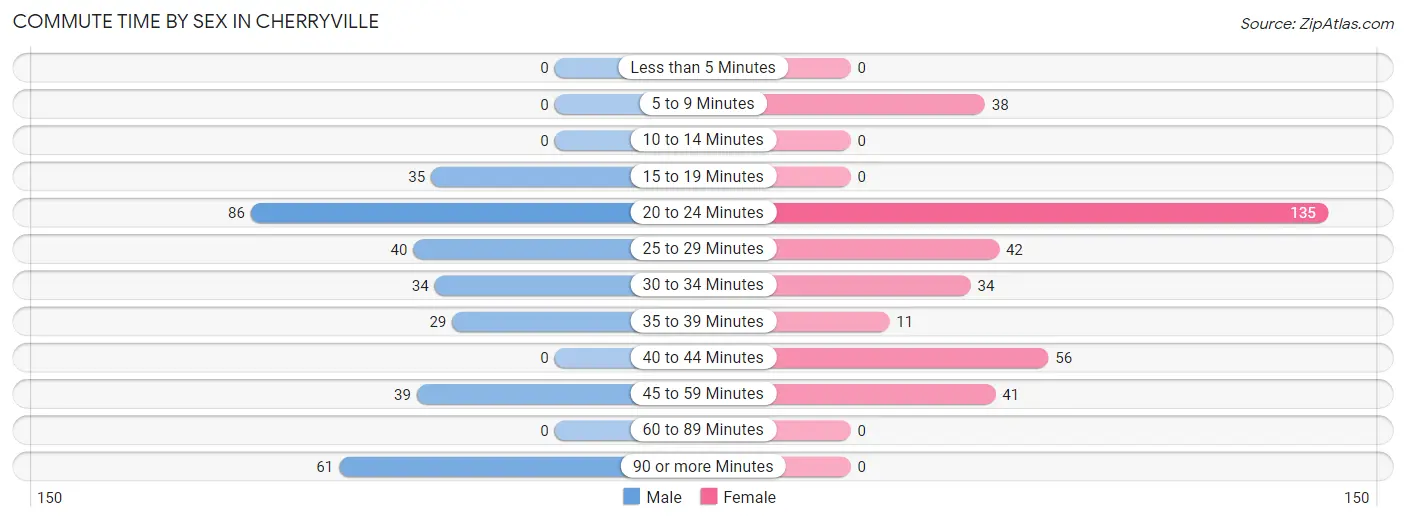
| Commute Time | Male | Female |
| Less than 5 Minutes | 0 (0.0%) | 0 (0.0%) |
| 5 to 9 Minutes | 0 (0.0%) | 38 (10.6%) |
| 10 to 14 Minutes | 0 (0.0%) | 0 (0.0%) |
| 15 to 19 Minutes | 35 (10.8%) | 0 (0.0%) |
| 20 to 24 Minutes | 86 (26.5%) | 135 (37.8%) |
| 25 to 29 Minutes | 40 (12.3%) | 42 (11.8%) |
| 30 to 34 Minutes | 34 (10.5%) | 34 (9.5%) |
| 35 to 39 Minutes | 29 (8.9%) | 11 (3.1%) |
| 40 to 44 Minutes | 0 (0.0%) | 56 (15.7%) |
| 45 to 59 Minutes | 39 (12.0%) | 41 (11.5%) |
| 60 to 89 Minutes | 0 (0.0%) | 0 (0.0%) |
| 90 or more Minutes | 61 (18.8%) | 0 (0.0%) |
Time of Departure to Work by Sex in Cherryville
The most frequent times of departure to work in Cherryville are 6:30 AM to 6:59 AM (82, 25.3%) for males and 7:00 AM to 7:29 AM (136, 38.1%) for females.
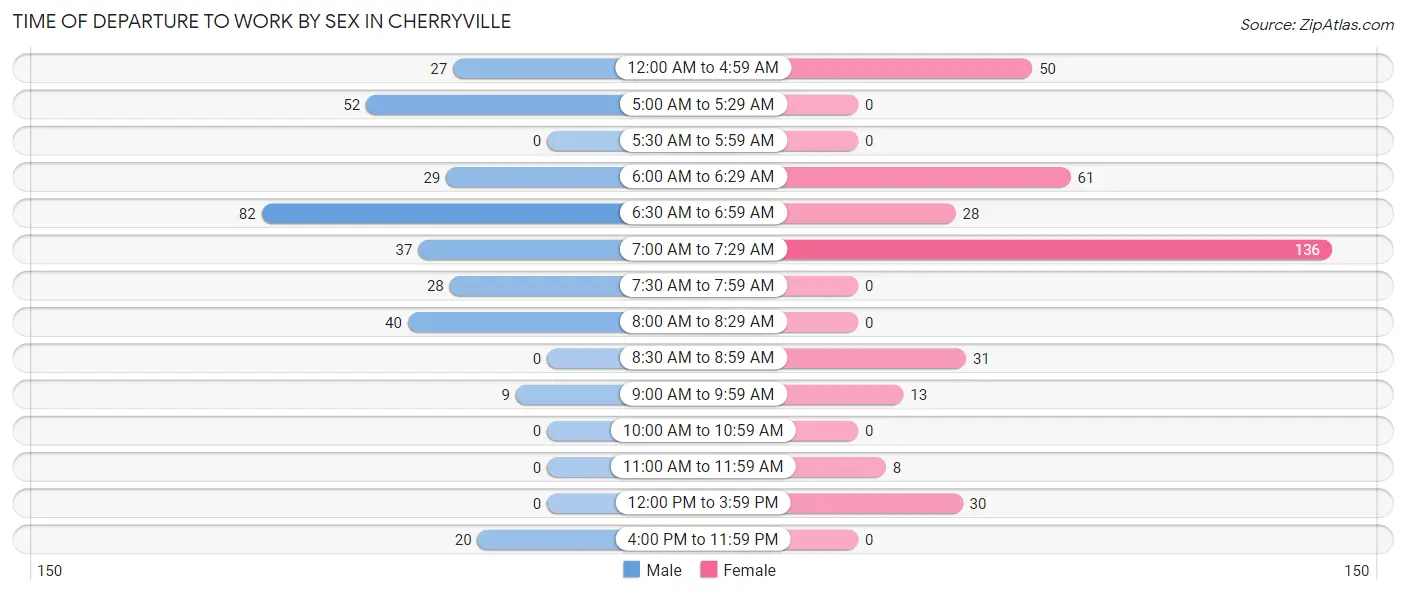
| Time of Departure | Male | Female |
| 12:00 AM to 4:59 AM | 27 (8.3%) | 50 (14.0%) |
| 5:00 AM to 5:29 AM | 52 (16.1%) | 0 (0.0%) |
| 5:30 AM to 5:59 AM | 0 (0.0%) | 0 (0.0%) |
| 6:00 AM to 6:29 AM | 29 (8.9%) | 61 (17.1%) |
| 6:30 AM to 6:59 AM | 82 (25.3%) | 28 (7.8%) |
| 7:00 AM to 7:29 AM | 37 (11.4%) | 136 (38.1%) |
| 7:30 AM to 7:59 AM | 28 (8.6%) | 0 (0.0%) |
| 8:00 AM to 8:29 AM | 40 (12.3%) | 0 (0.0%) |
| 8:30 AM to 8:59 AM | 0 (0.0%) | 31 (8.7%) |
| 9:00 AM to 9:59 AM | 9 (2.8%) | 13 (3.6%) |
| 10:00 AM to 10:59 AM | 0 (0.0%) | 0 (0.0%) |
| 11:00 AM to 11:59 AM | 0 (0.0%) | 8 (2.2%) |
| 12:00 PM to 3:59 PM | 0 (0.0%) | 30 (8.4%) |
| 4:00 PM to 11:59 PM | 20 (6.2%) | 0 (0.0%) |
| Total | 324 (100.0%) | 357 (100.0%) |
Housing Occupancy in Cherryville
Occupancy by Ownership in Cherryville
Of the total 547 dwellings in Cherryville, owner-occupied units account for 499 (91.2%), while renter-occupied units make up 48 (8.8%).
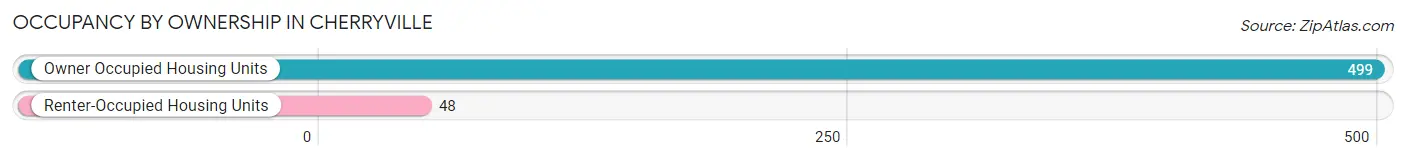
| Occupancy | # Housing Units | % Housing Units |
| Owner Occupied Housing Units | 499 | 91.2% |
| Renter-Occupied Housing Units | 48 | 8.8% |
| Total Occupied Housing Units | 547 | 100.0% |
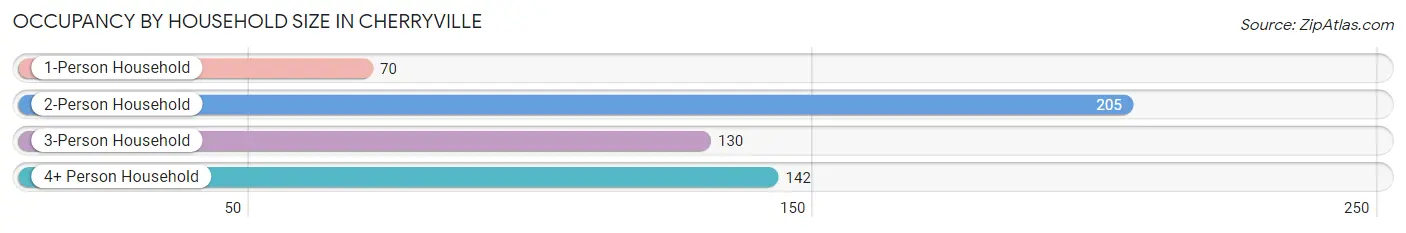
Occupancy by Household Size in Cherryville
| Household Size | # Housing Units | % Housing Units |
| 1-Person Household | 70 | 12.8% |
| 2-Person Household | 205 | 37.5% |
| 3-Person Household | 130 | 23.8% |
| 4+ Person Household | 142 | 26.0% |
| Total Housing Units | 547 | 100.0% |
Occupancy by Ownership by Household Size in Cherryville
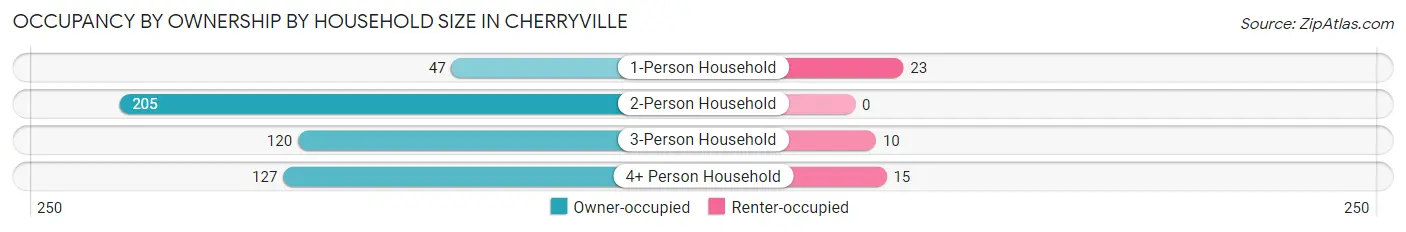
| Household Size | Owner-occupied | Renter-occupied |
| 1-Person Household | 47 (67.1%) | 23 (32.9%) |
| 2-Person Household | 205 (100.0%) | 0 (0.0%) |
| 3-Person Household | 120 (92.3%) | 10 (7.7%) |
| 4+ Person Household | 127 (89.4%) | 15 (10.6%) |
| Total Housing Units | 499 (91.2%) | 48 (8.8%) |
Occupancy by Educational Attainment in Cherryville
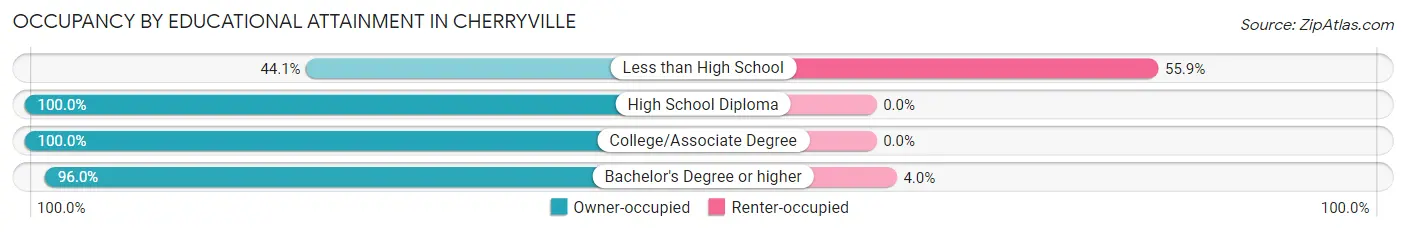
| Household Size | Owner-occupied | Renter-occupied |
| Less than High School | 30 (44.1%) | 38 (55.9%) |
| High School Diploma | 103 (100.0%) | 0 (0.0%) |
| College/Associate Degree | 128 (100.0%) | 0 (0.0%) |
| Bachelor's Degree or higher | 238 (96.0%) | 10 (4.0%) |
Occupancy by Age of Householder in Cherryville
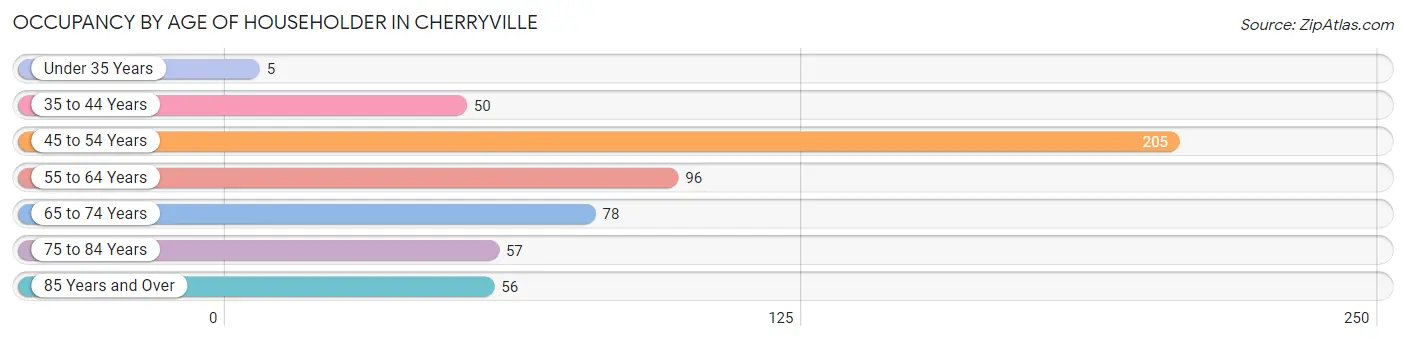
| Age Bracket | # Households | % Households |
| Under 35 Years | 5 | 0.9% |
| 35 to 44 Years | 50 | 9.1% |
| 45 to 54 Years | 205 | 37.5% |
| 55 to 64 Years | 96 | 17.5% |
| 65 to 74 Years | 78 | 14.3% |
| 75 to 84 Years | 57 | 10.4% |
| 85 Years and Over | 56 | 10.2% |
| Total | 547 | 100.0% |
Housing Finances in Cherryville
Median Income by Occupancy in Cherryville
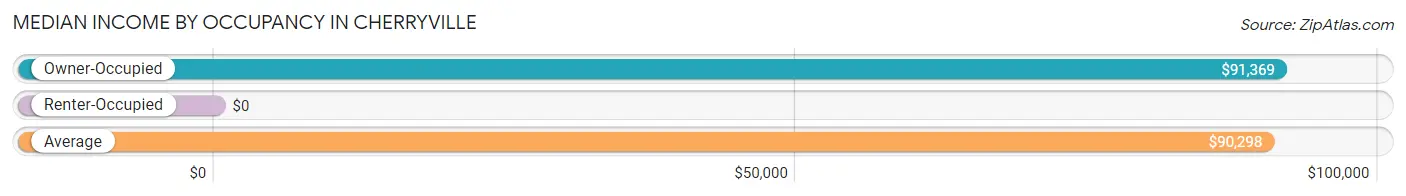
| Occupancy Type | # Households | Median Income |
| Owner-Occupied | 499 (91.2%) | $91,369 |
| Renter-Occupied | 48 (8.8%) | $0 |
| Average | 547 (100.0%) | $90,298 |
Occupancy by Householder Income Bracket in Cherryville
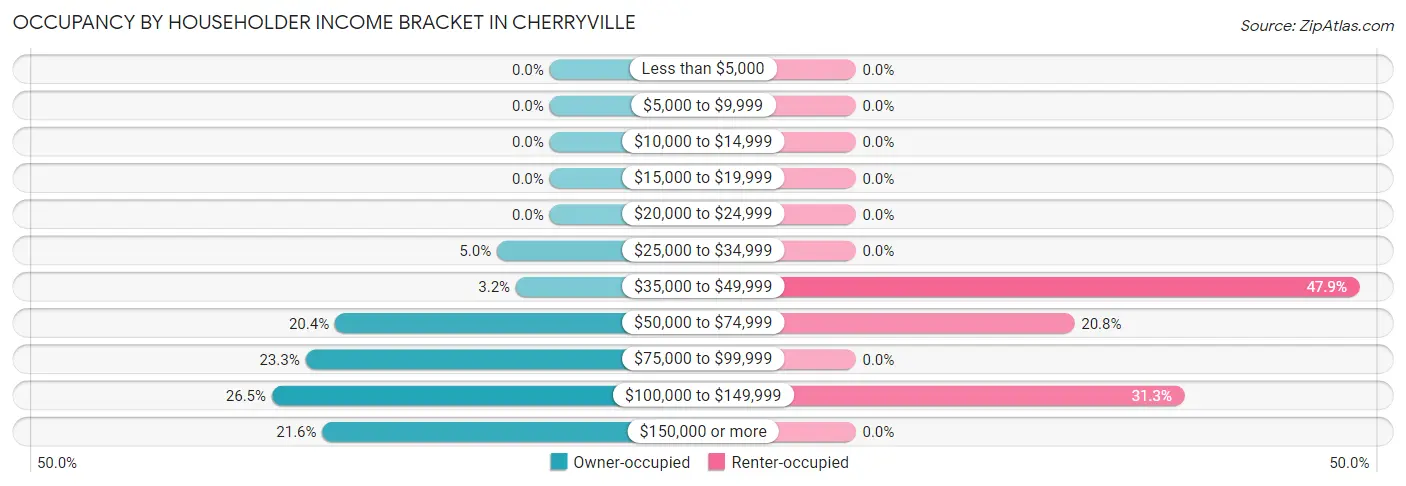
| Income Bracket | Owner-occupied | Renter-occupied |
| Less than $5,000 | 0 (0.0%) | 0 (0.0%) |
| $5,000 to $9,999 | 0 (0.0%) | 0 (0.0%) |
| $10,000 to $14,999 | 0 (0.0%) | 0 (0.0%) |
| $15,000 to $19,999 | 0 (0.0%) | 0 (0.0%) |
| $20,000 to $24,999 | 0 (0.0%) | 0 (0.0%) |
| $25,000 to $34,999 | 25 (5.0%) | 0 (0.0%) |
| $35,000 to $49,999 | 16 (3.2%) | 23 (47.9%) |
| $50,000 to $74,999 | 102 (20.4%) | 10 (20.8%) |
| $75,000 to $99,999 | 116 (23.3%) | 0 (0.0%) |
| $100,000 to $149,999 | 132 (26.5%) | 15 (31.2%) |
| $150,000 or more | 108 (21.6%) | 0 (0.0%) |
| Total | 499 (100.0%) | 48 (100.0%) |
Monthly Housing Cost Tiers in Cherryville
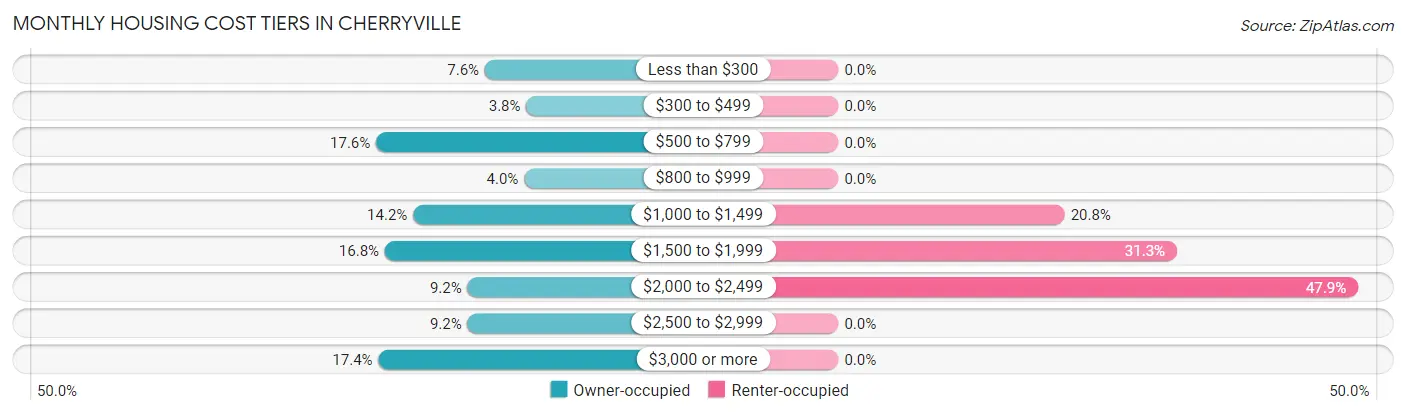
| Monthly Cost | Owner-occupied | Renter-occupied |
| Less than $300 | 38 (7.6%) | 0 (0.0%) |
| $300 to $499 | 19 (3.8%) | 0 (0.0%) |
| $500 to $799 | 88 (17.6%) | 0 (0.0%) |
| $800 to $999 | 20 (4.0%) | 0 (0.0%) |
| $1,000 to $1,499 | 71 (14.2%) | 10 (20.8%) |
| $1,500 to $1,999 | 84 (16.8%) | 15 (31.2%) |
| $2,000 to $2,499 | 46 (9.2%) | 23 (47.9%) |
| $2,500 to $2,999 | 46 (9.2%) | 0 (0.0%) |
| $3,000 or more | 87 (17.4%) | 0 (0.0%) |
| Total | 499 (100.0%) | 48 (100.0%) |
Physical Housing Characteristics in Cherryville
Housing Structures in Cherryville
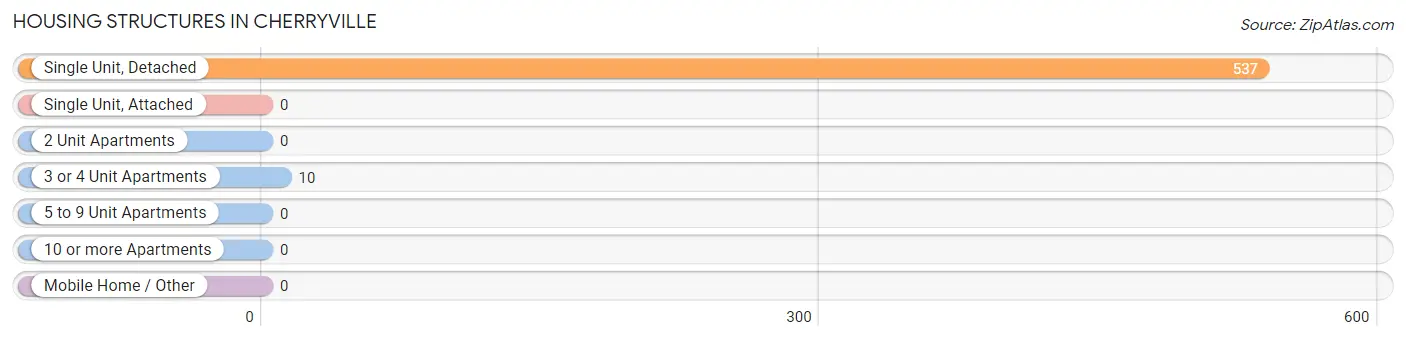
| Structure Type | # Housing Units | % Housing Units |
| Single Unit, Detached | 537 | 98.2% |
| Single Unit, Attached | 0 | 0.0% |
| 2 Unit Apartments | 0 | 0.0% |
| 3 or 4 Unit Apartments | 10 | 1.8% |
| 5 to 9 Unit Apartments | 0 | 0.0% |
| 10 or more Apartments | 0 | 0.0% |
| Mobile Home / Other | 0 | 0.0% |
| Total | 547 | 100.0% |
Housing Structures by Occupancy in Cherryville
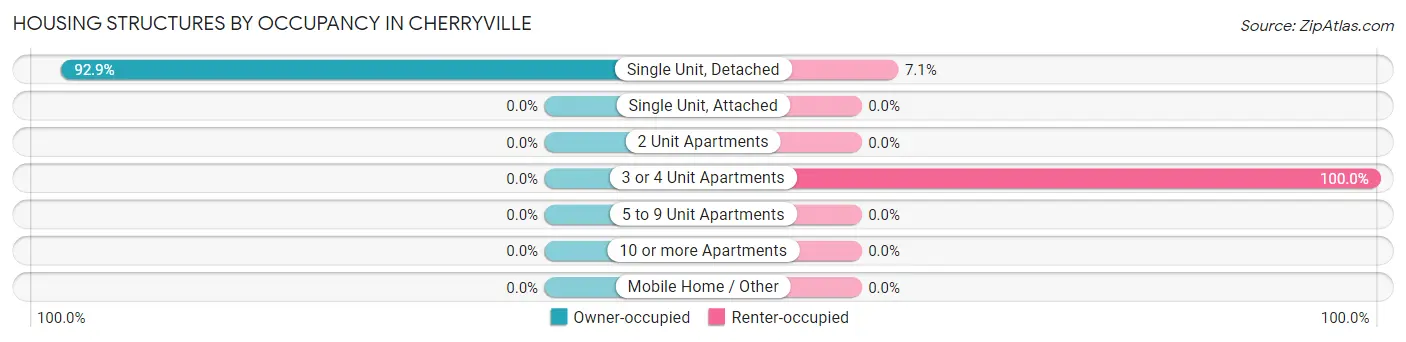
| Structure Type | Owner-occupied | Renter-occupied |
| Single Unit, Detached | 499 (92.9%) | 38 (7.1%) |
| Single Unit, Attached | 0 (0.0%) | 0 (0.0%) |
| 2 Unit Apartments | 0 (0.0%) | 0 (0.0%) |
| 3 or 4 Unit Apartments | 0 (0.0%) | 10 (100.0%) |
| 5 to 9 Unit Apartments | 0 (0.0%) | 0 (0.0%) |
| 10 or more Apartments | 0 (0.0%) | 0 (0.0%) |
| Mobile Home / Other | 0 (0.0%) | 0 (0.0%) |
| Total | 499 (91.2%) | 48 (8.8%) |
Housing Structures by Number of Rooms in Cherryville
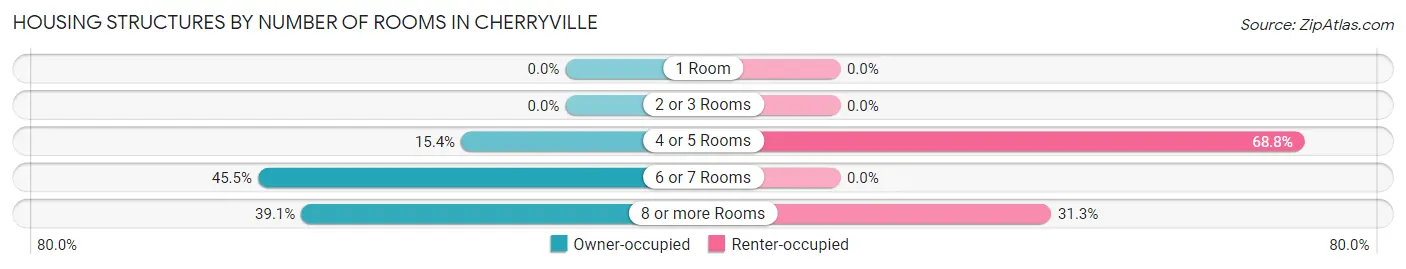
| Number of Rooms | Owner-occupied | Renter-occupied |
| 1 Room | 0 (0.0%) | 0 (0.0%) |
| 2 or 3 Rooms | 0 (0.0%) | 0 (0.0%) |
| 4 or 5 Rooms | 77 (15.4%) | 33 (68.8%) |
| 6 or 7 Rooms | 227 (45.5%) | 0 (0.0%) |
| 8 or more Rooms | 195 (39.1%) | 15 (31.2%) |
| Total | 499 (100.0%) | 48 (100.0%) |
Housing Structure by Heating Type in Cherryville
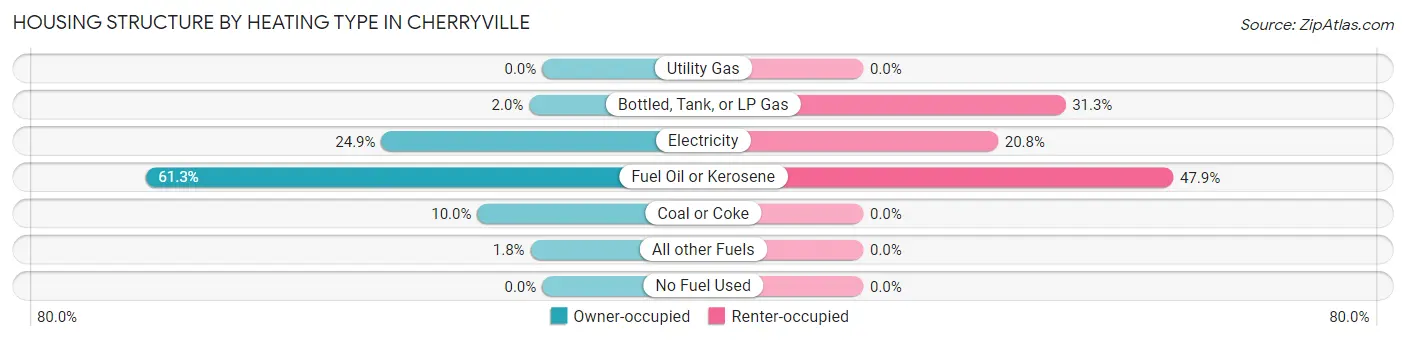
| Heating Type | Owner-occupied | Renter-occupied |
| Utility Gas | 0 (0.0%) | 0 (0.0%) |
| Bottled, Tank, or LP Gas | 10 (2.0%) | 15 (31.2%) |
| Electricity | 124 (24.8%) | 10 (20.8%) |
| Fuel Oil or Kerosene | 306 (61.3%) | 23 (47.9%) |
| Coal or Coke | 50 (10.0%) | 0 (0.0%) |
| All other Fuels | 9 (1.8%) | 0 (0.0%) |
| No Fuel Used | 0 (0.0%) | 0 (0.0%) |
| Total | 499 (100.0%) | 48 (100.0%) |
Household Vehicle Usage in Cherryville
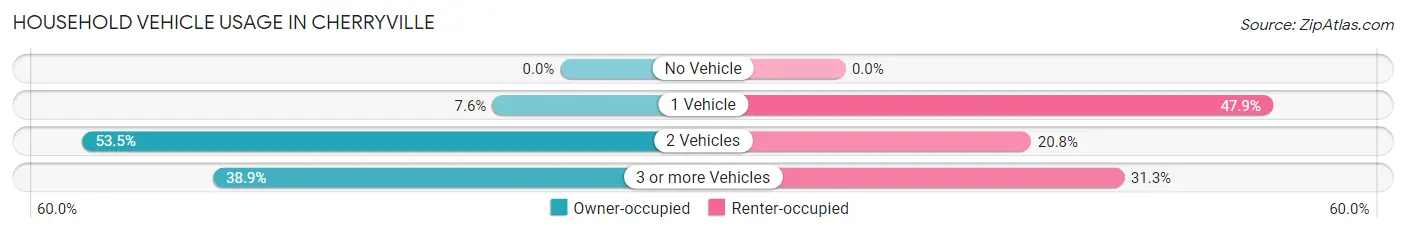
| Vehicles per Household | Owner-occupied | Renter-occupied |
| No Vehicle | 0 (0.0%) | 0 (0.0%) |
| 1 Vehicle | 38 (7.6%) | 23 (47.9%) |
| 2 Vehicles | 267 (53.5%) | 10 (20.8%) |
| 3 or more Vehicles | 194 (38.9%) | 15 (31.2%) |
| Total | 499 (100.0%) | 48 (100.0%) |
Real Estate & Mortgages in Cherryville
Real Estate and Mortgage Overview in Cherryville
| Characteristic | Without Mortgage | With Mortgage |
| Housing Units | 198 | 301 |
| Median Property Value | $283,000 | $387,500 |
| Median Household Income | $80,833 | $90 |
| Monthly Housing Costs | $654 | $87 |
| Real Estate Taxes | $5,967 | $0 |
Property Value by Mortgage Status in Cherryville
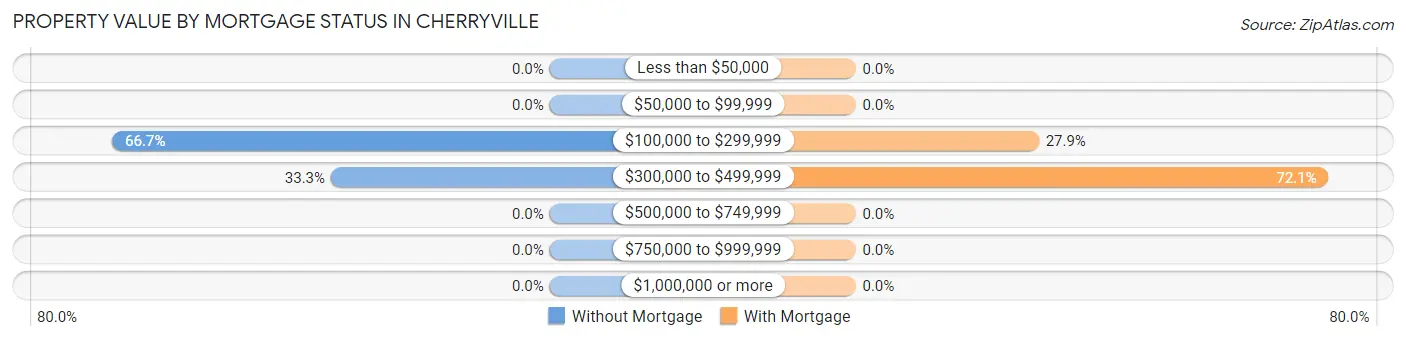
| Property Value | Without Mortgage | With Mortgage |
| Less than $50,000 | 0 (0.0%) | 0 (0.0%) |
| $50,000 to $99,999 | 0 (0.0%) | 0 (0.0%) |
| $100,000 to $299,999 | 132 (66.7%) | 84 (27.9%) |
| $300,000 to $499,999 | 66 (33.3%) | 217 (72.1%) |
| $500,000 to $749,999 | 0 (0.0%) | 0 (0.0%) |
| $750,000 to $999,999 | 0 (0.0%) | 0 (0.0%) |
| $1,000,000 or more | 0 (0.0%) | 0 (0.0%) |
| Total | 198 (100.0%) | 301 (100.0%) |
Household Income by Mortgage Status in Cherryville
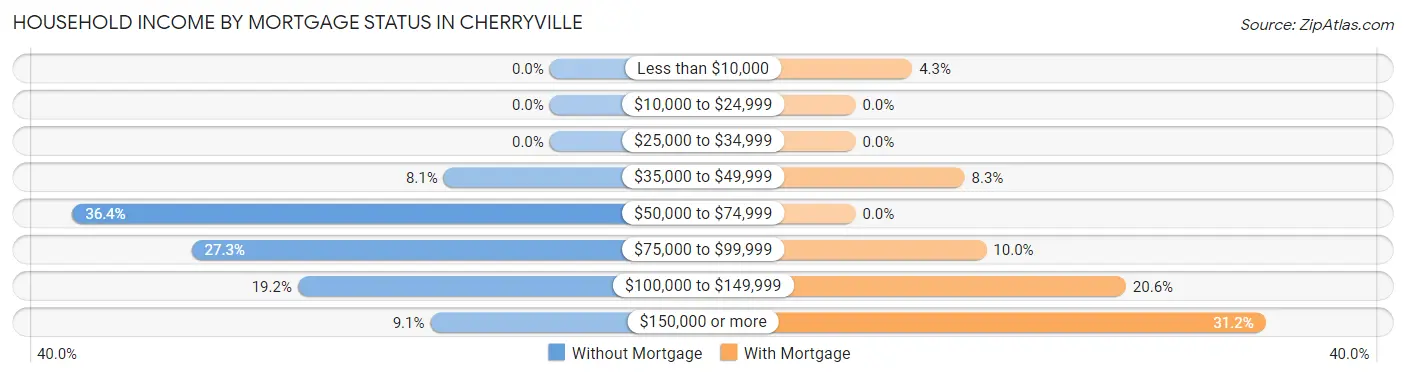
| Household Income | Without Mortgage | With Mortgage |
| Less than $10,000 | 0 (0.0%) | 13 (4.3%) |
| $10,000 to $24,999 | 0 (0.0%) | 0 (0.0%) |
| $25,000 to $34,999 | 0 (0.0%) | 0 (0.0%) |
| $35,000 to $49,999 | 16 (8.1%) | 25 (8.3%) |
| $50,000 to $74,999 | 72 (36.4%) | 0 (0.0%) |
| $75,000 to $99,999 | 54 (27.3%) | 30 (10.0%) |
| $100,000 to $149,999 | 38 (19.2%) | 62 (20.6%) |
| $150,000 or more | 18 (9.1%) | 94 (31.2%) |
| Total | 198 (100.0%) | 301 (100.0%) |
Property Value to Household Income Ratio in Cherryville
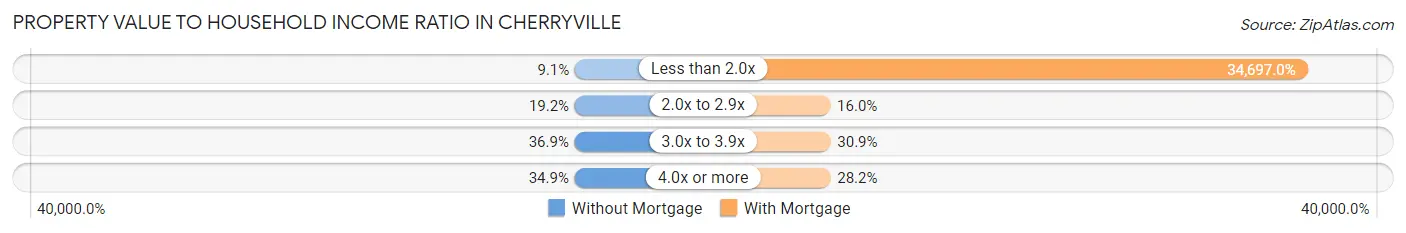
| Value-to-Income Ratio | Without Mortgage | With Mortgage |
| Less than 2.0x | 18 (9.1%) | 104,438 (34,697.0%) |
| 2.0x to 2.9x | 38 (19.2%) | 48 (16.0%) |
| 3.0x to 3.9x | 73 (36.9%) | 93 (30.9%) |
| 4.0x or more | 69 (34.8%) | 85 (28.2%) |
| Total | 198 (100.0%) | 301 (100.0%) |
Real Estate Taxes by Mortgage Status in Cherryville
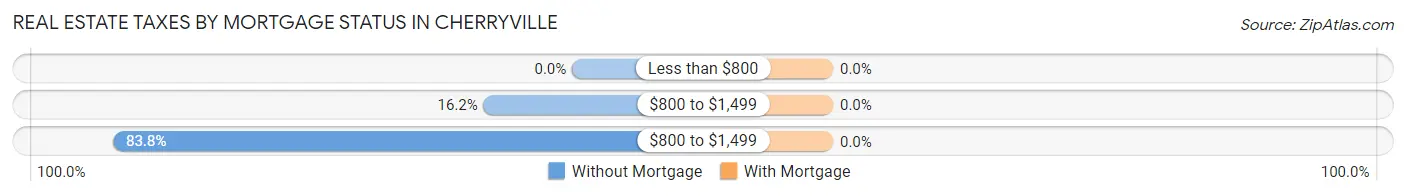
| Property Taxes | Without Mortgage | With Mortgage |
| Less than $800 | 0 (0.0%) | 0 (0.0%) |
| $800 to $1,499 | 32 (16.2%) | 0 (0.0%) |
| $800 to $1,499 | 166 (83.8%) | 0 (0.0%) |
| Total | 198 (100.0%) | 301 (100.0%) |
Health & Disability in Cherryville
Health Insurance Coverage by Age in Cherryville
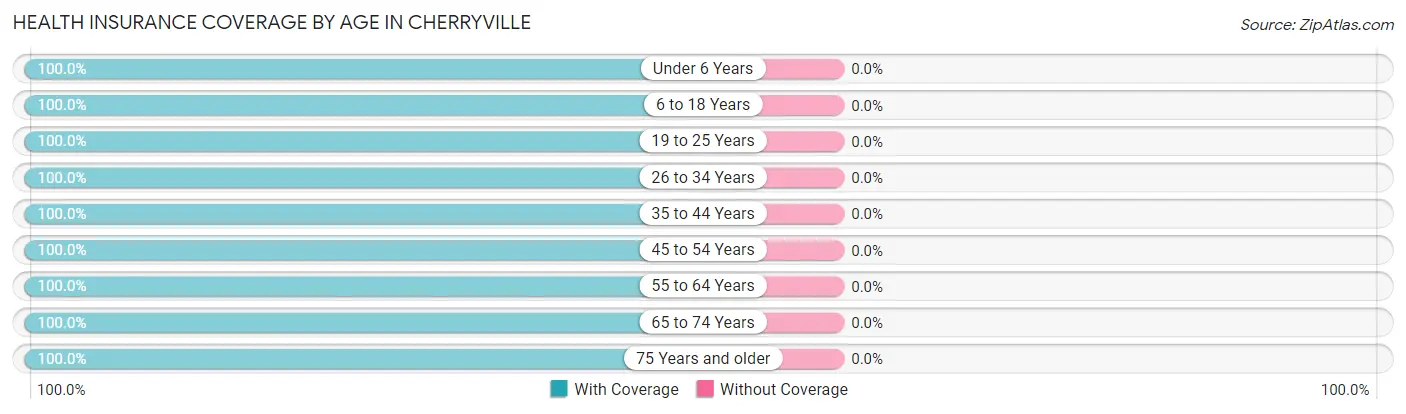
| Age Bracket | With Coverage | Without Coverage |
| Under 6 Years | 10 (100.0%) | 0 (0.0%) |
| 6 to 18 Years | 253 (100.0%) | 0 (0.0%) |
| 19 to 25 Years | 99 (100.0%) | 0 (0.0%) |
| 26 to 34 Years | 32 (100.0%) | 0 (0.0%) |
| 35 to 44 Years | 142 (100.0%) | 0 (0.0%) |
| 45 to 54 Years | 341 (100.0%) | 0 (0.0%) |
| 55 to 64 Years | 226 (100.0%) | 0 (0.0%) |
| 65 to 74 Years | 175 (100.0%) | 0 (0.0%) |
| 75 Years and older | 194 (100.0%) | 0 (0.0%) |
| Total | 1,472 (100.0%) | 0 (0.0%) |
Health Insurance Coverage by Citizenship Status in Cherryville
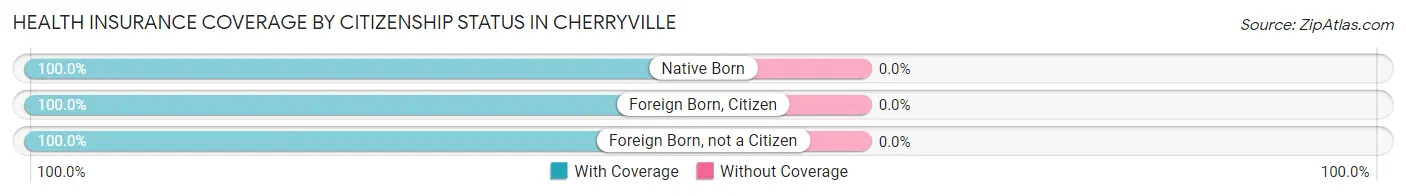
| Citizenship Status | With Coverage | Without Coverage |
| Native Born | 10 (100.0%) | 0 (0.0%) |
| Foreign Born, Citizen | 253 (100.0%) | 0 (0.0%) |
| Foreign Born, not a Citizen | 99 (100.0%) | 0 (0.0%) |
Health Insurance Coverage by Household Income in Cherryville
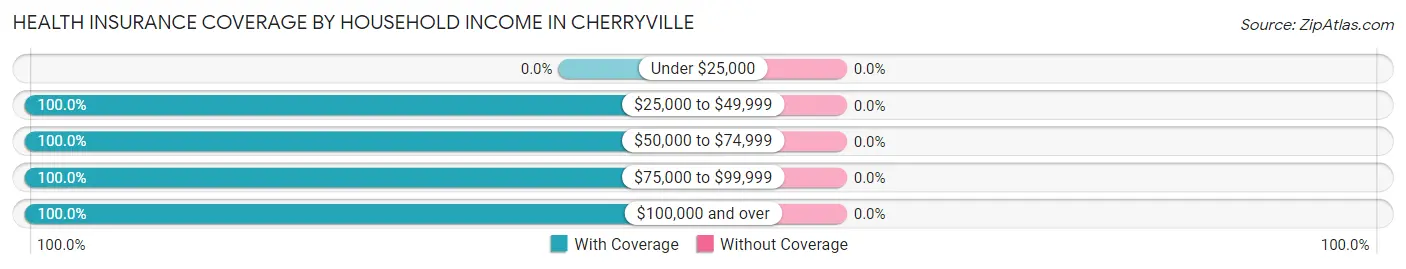
| Household Income | With Coverage | Without Coverage |
| Under $25,000 | 0 (0.0%) | 0 (0.0%) |
| $25,000 to $49,999 | 115 (100.0%) | 0 (0.0%) |
| $50,000 to $74,999 | 308 (100.0%) | 0 (0.0%) |
| $75,000 to $99,999 | 366 (100.0%) | 0 (0.0%) |
| $100,000 and over | 683 (100.0%) | 0 (0.0%) |
Public vs Private Health Insurance Coverage by Age in Cherryville
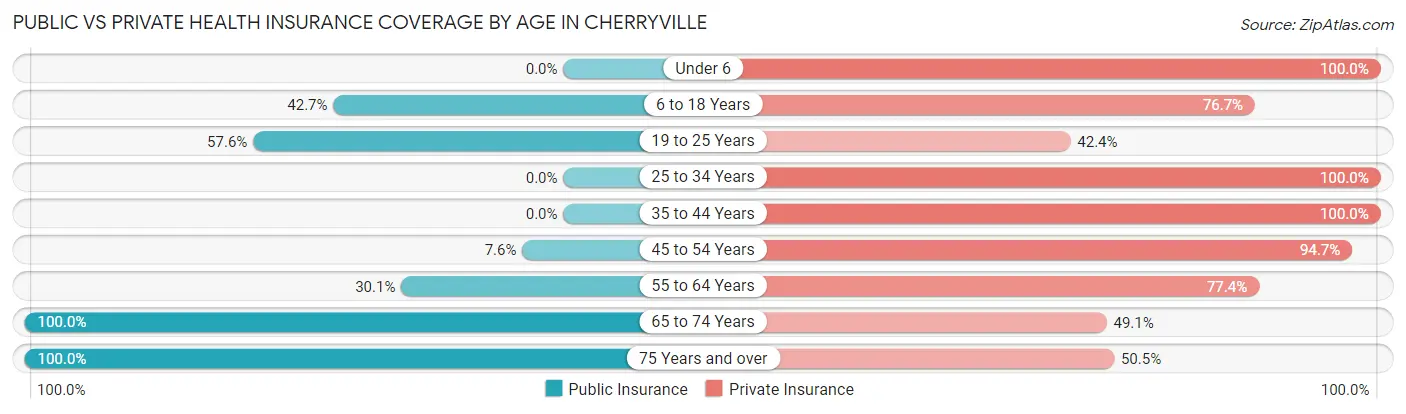
| Age Bracket | Public Insurance | Private Insurance |
| Under 6 | 0 (0.0%) | 10 (100.0%) |
| 6 to 18 Years | 108 (42.7%) | 194 (76.7%) |
| 19 to 25 Years | 57 (57.6%) | 42 (42.4%) |
| 25 to 34 Years | 0 (0.0%) | 32 (100.0%) |
| 35 to 44 Years | 0 (0.0%) | 142 (100.0%) |
| 45 to 54 Years | 26 (7.6%) | 323 (94.7%) |
| 55 to 64 Years | 68 (30.1%) | 175 (77.4%) |
| 65 to 74 Years | 175 (100.0%) | 86 (49.1%) |
| 75 Years and over | 194 (100.0%) | 98 (50.5%) |
| Total | 628 (42.7%) | 1,102 (74.9%) |
Disability Status by Sex by Age in Cherryville
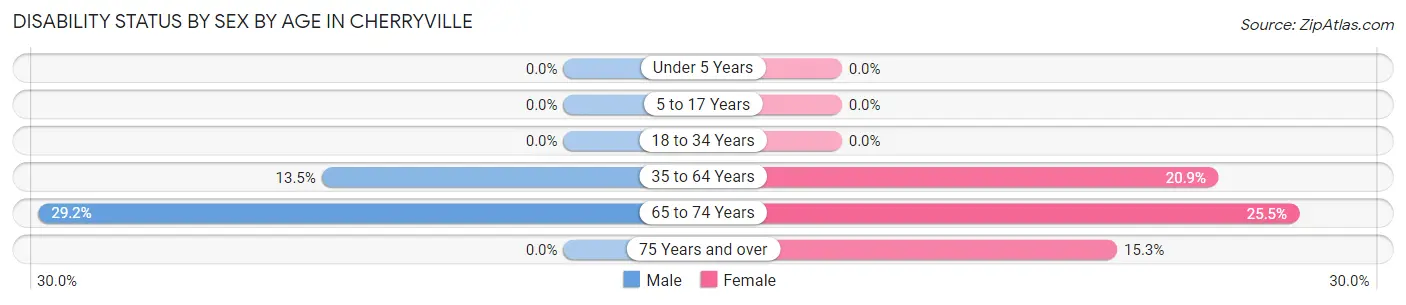
| Age Bracket | Male | Female |
| Under 5 Years | 0 (0.0%) | 0 (0.0%) |
| 5 to 17 Years | 0 (0.0%) | 0 (0.0%) |
| 18 to 34 Years | 0 (0.0%) | 0 (0.0%) |
| 35 to 64 Years | 44 (13.5%) | 80 (20.9%) |
| 65 to 74 Years | 19 (29.2%) | 28 (25.5%) |
| 75 Years and over | 0 (0.0%) | 21 (15.3%) |
Disability Class by Sex by Age in Cherryville
Disability Class: Hearing Difficulty
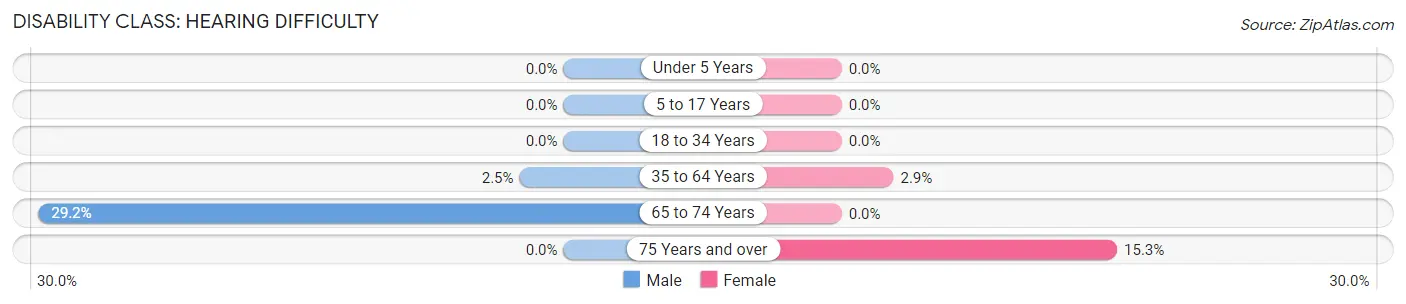
| Age Bracket | Male | Female |
| Under 5 Years | 0 (0.0%) | 0 (0.0%) |
| 5 to 17 Years | 0 (0.0%) | 0 (0.0%) |
| 18 to 34 Years | 0 (0.0%) | 0 (0.0%) |
| 35 to 64 Years | 8 (2.5%) | 11 (2.9%) |
| 65 to 74 Years | 19 (29.2%) | 0 (0.0%) |
| 75 Years and over | 0 (0.0%) | 21 (15.3%) |
Disability Class: Vision Difficulty
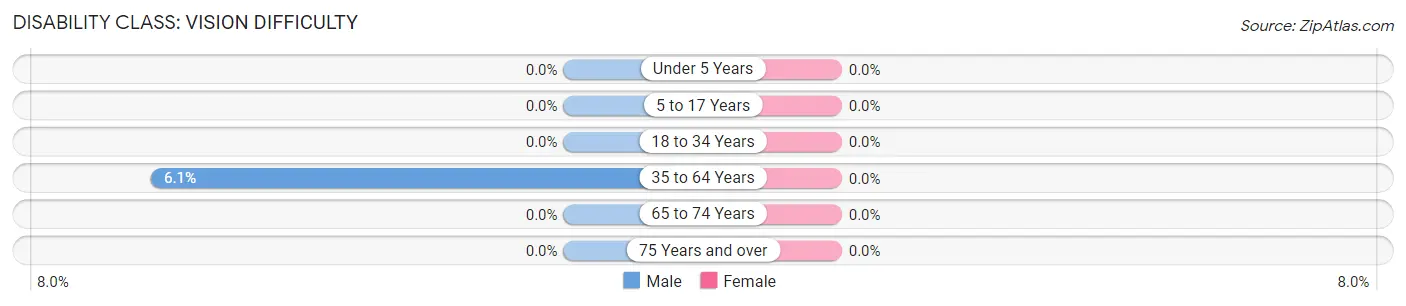
| Age Bracket | Male | Female |
| Under 5 Years | 0 (0.0%) | 0 (0.0%) |
| 5 to 17 Years | 0 (0.0%) | 0 (0.0%) |
| 18 to 34 Years | 0 (0.0%) | 0 (0.0%) |
| 35 to 64 Years | 20 (6.1%) | 0 (0.0%) |
| 65 to 74 Years | 0 (0.0%) | 0 (0.0%) |
| 75 Years and over | 0 (0.0%) | 0 (0.0%) |
Disability Class: Cognitive Difficulty
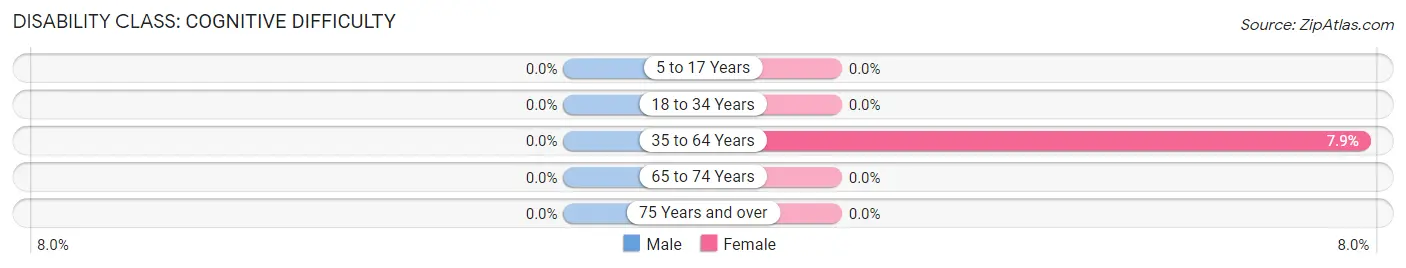
| Age Bracket | Male | Female |
| 5 to 17 Years | 0 (0.0%) | 0 (0.0%) |
| 18 to 34 Years | 0 (0.0%) | 0 (0.0%) |
| 35 to 64 Years | 0 (0.0%) | 30 (7.9%) |
| 65 to 74 Years | 0 (0.0%) | 0 (0.0%) |
| 75 Years and over | 0 (0.0%) | 0 (0.0%) |
Disability Class: Ambulatory Difficulty
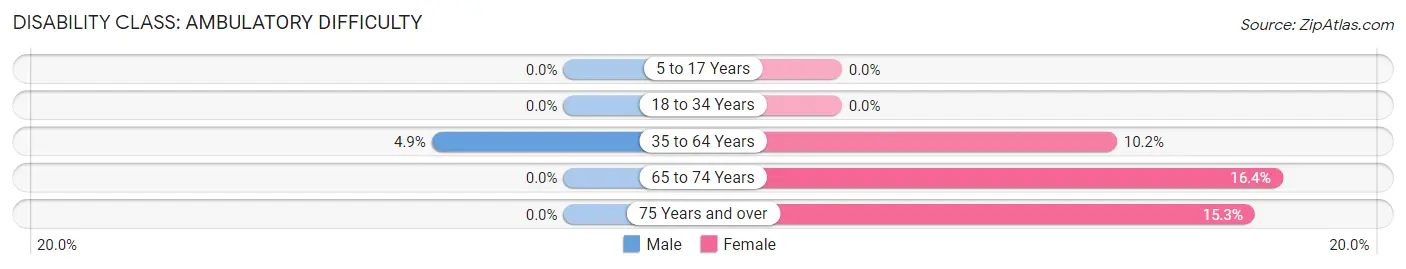
| Age Bracket | Male | Female |
| 5 to 17 Years | 0 (0.0%) | 0 (0.0%) |
| 18 to 34 Years | 0 (0.0%) | 0 (0.0%) |
| 35 to 64 Years | 16 (4.9%) | 39 (10.2%) |
| 65 to 74 Years | 0 (0.0%) | 18 (16.4%) |
| 75 Years and over | 0 (0.0%) | 21 (15.3%) |
Disability Class: Self-Care Difficulty
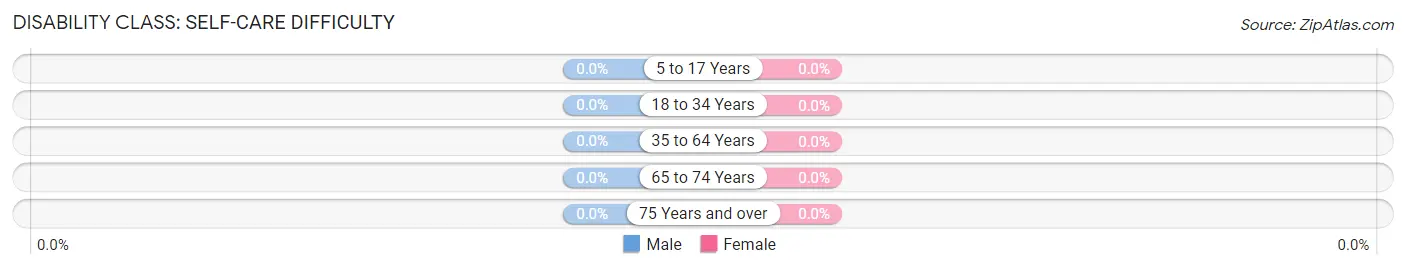
| Age Bracket | Male | Female |
| 5 to 17 Years | 0 (0.0%) | 0 (0.0%) |
| 18 to 34 Years | 0 (0.0%) | 0 (0.0%) |
| 35 to 64 Years | 0 (0.0%) | 0 (0.0%) |
| 65 to 74 Years | 0 (0.0%) | 0 (0.0%) |
| 75 Years and over | 0 (0.0%) | 0 (0.0%) |
Technology Access in Cherryville
Computing Device Access in Cherryville
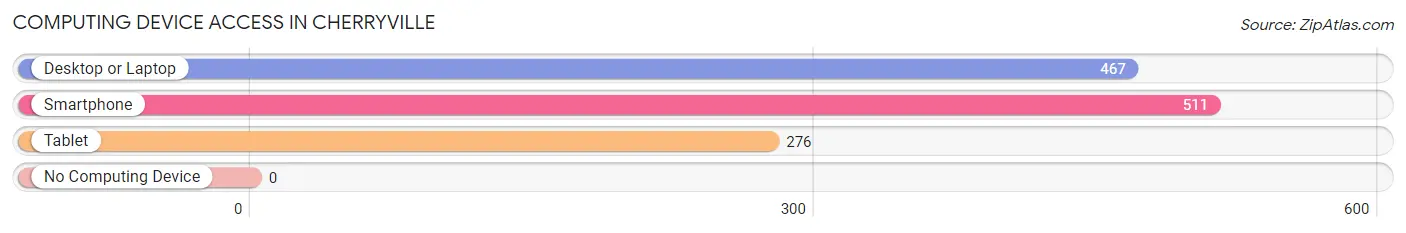
| Device Type | # Households | % Households |
| Desktop or Laptop | 467 | 85.4% |
| Smartphone | 511 | 93.4% |
| Tablet | 276 | 50.5% |
| No Computing Device | 0 | 0.0% |
| Total | 547 | 100.0% |
Internet Access in Cherryville
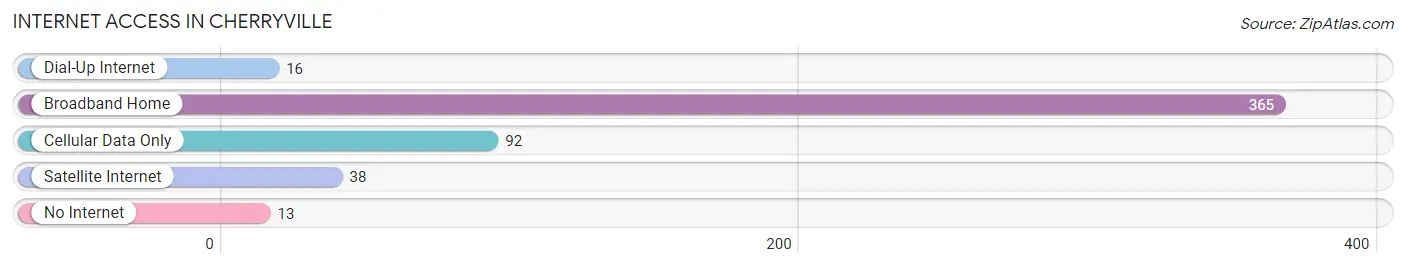
| Internet Type | # Households | % Households |
| Dial-Up Internet | 16 | 2.9% |
| Broadband Home | 365 | 66.7% |
| Cellular Data Only | 92 | 16.8% |
| Satellite Internet | 38 | 7.0% |
| No Internet | 13 | 2.4% |
| Total | 547 | 100.0% |
Cherryville Summary
Cherryville, Pennsylvania is a small borough located in Northampton County, Pennsylvania. It is situated in the Lehigh Valley region of the state, approximately 10 miles north of Easton and about 20 miles west of Allentown. The population of Cherryville was 1,845 at the 2010 census.
History
Cherryville was founded in 1790 by a group of German settlers who had migrated from the Palatinate region of Germany. The settlers named the town after the abundance of cherry trees in the area. The town was incorporated in 1845 and was the first borough in Northampton County.
In the 19th century, Cherryville was a thriving agricultural community. The town was known for its production of wheat, oats, corn, potatoes, and other crops. The town also had a number of small businesses, including a grist mill, a saw mill, a tannery, and a blacksmith shop.
In the early 20th century, Cherryville began to experience a decline in its agricultural industry. This was due to the introduction of new farming techniques and the development of larger farms in other parts of the state. As a result, many of the town’s residents began to look for work in the nearby cities of Easton and Allentown.
Geography
Cherryville is located in Northampton County, Pennsylvania. It is situated in the Lehigh Valley region of the state, approximately 10 miles north of Easton and about 20 miles west of Allentown. The borough is bordered by the townships of Moore, Bushkill, and Lower Nazareth.
The terrain of Cherryville is mostly flat, with some rolling hills in the northern part of the borough. The town is located in the Lehigh Valley, which is known for its fertile soil and mild climate.
The climate of Cherryville is classified as humid continental, with hot summers and cold winters. The average temperature in the summer is around 75 degrees Fahrenheit, while the average temperature in the winter is around 30 degrees Fahrenheit.
Economy
Cherryville’s economy is largely based on agriculture and light manufacturing. The town is home to a number of small businesses, including a grist mill, a saw mill, a tannery, and a blacksmith shop.
The town is also home to a number of small retail stores, restaurants, and other businesses. The town is also home to a number of small industrial parks, which provide employment for many of the town’s residents.
Demographics
As of the 2010 census, the population of Cherryville was 1,845. The racial makeup of the town was 94.3% White, 2.2% African American, 0.3% Native American, 0.7% Asian, 0.1% Pacific Islander, 0.7% from other races, and 1.9% from two or more races. Hispanic or Latino of any race were 2.2% of the population.
The median household income in Cherryville was $45,938, and the median family income was $54,844. The per capita income for the town was $20,945. About 8.2% of families and 10.2% of the population were below the poverty line, including 14.2% of those under age 18 and 5.2% of those age 65 or over.
Cherryville is a small borough with a rich history and a diverse population. The town is home to a number of small businesses and industries, and is a popular destination for tourists and outdoor enthusiasts. The town’s economy is largely based on agriculture and light manufacturing, and the town’s residents enjoy a high quality of life.
Common Questions
What is the Total Population of Cherryville?
Total Population of Cherryville is 1,472.
What is the Total Male Population of Cherryville?
Total Male Population of Cherryville is 703.
What is the Total Female Population of Cherryville?
Total Female Population of Cherryville is 769.
What is the Ratio of Males per 100 Females in Cherryville?
There are 91.42 Males per 100 Females in Cherryville.
What is the Ratio of Females per 100 Males in Cherryville?
There are 109.39 Females per 100 Males in Cherryville.
What is the Median Population Age in Cherryville?
Median Population Age in Cherryville is 51.7 Years.
What is the Average Family Size in Cherryville
Average Family Size in Cherryville is 2.9 People.
What is the Average Household Size in Cherryville
Average Household Size in Cherryville is 2.7 People.
What is Per Capita Income in Cherryville?
Per Capita income in Cherryville is $40,137.
What is the Median Family Income in Cherryville?
Median Family Income in Cherryville is $82,348.
What is the Median Household income in Cherryville?
Median Household Income in Cherryville is $90,298.
What is Inequality or Gini Index in Cherryville?
Inequality or Gini Index in Cherryville is 0.29.
How Large is the Labor Force in Cherryville?
There are 789 People in the Labor Forcein in Cherryville.
What is the Percentage of People in the Labor Force in Cherryville?
61.7% of People are in the Labor Force in Cherryville.
What is the Unemployment Rate in Cherryville?
Unemployment Rate in Cherryville is 7.4%.