Cities with the Highest Percentage of Federal Government Employees in Pennsylvania
RELATED REPORTS & OPTIONS
Federal Government Employees
Pennsylvania
Compare Cities
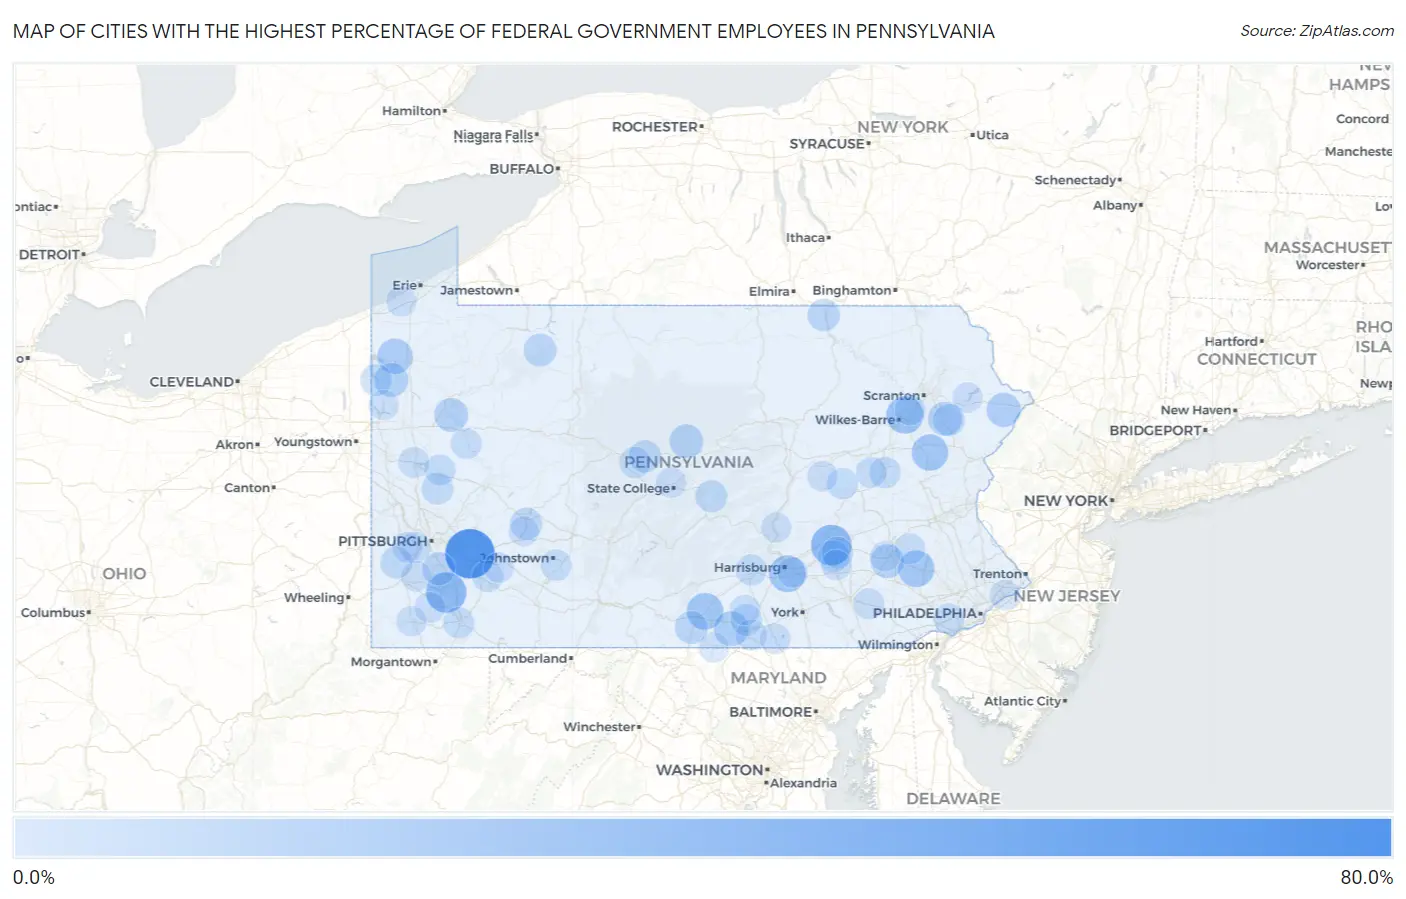
Map of Cities with the Highest Percentage of Federal Government Employees in Pennsylvania
0.0%
80.0%
Cities with the Highest Percentage of Federal Government Employees in Pennsylvania
| City | % Federal Government Employees | vs State | vs National | |
| 1. | Carlisle Barracks | 61.2% | 2.2%(+59.0)#1 | 3.4%(+57.8)#126 |
| 2. | Harrison City | 57.1% | 2.2%(+54.9)#2 | 3.4%(+53.8)#140 |
| 3. | Jonestown | 33.3% | 2.2%(+31.1)#3 | 3.4%(+30.0)#334 |
| 4. | Allenport | 32.9% | 2.2%(+30.7)#4 | 3.4%(+29.6)#347 |
| 5. | Clintonville Borough | 31.6% | 2.2%(+29.4)#5 | 3.4%(+28.2)#371 |
| 6. | Blue Knob | 27.3% | 2.2%(+25.1)#6 | 3.4%(+23.9)#477 |
| 7. | Hudson | 25.3% | 2.2%(+23.1)#7 | 3.4%(+21.9)#550 |
| 8. | New Market | 23.7% | 2.2%(+21.5)#8 | 3.4%(+20.3)#623 |
| 9. | Scotland | 23.3% | 2.2%(+21.1)#9 | 3.4%(+20.0)#640 |
| 10. | Douglassville | 23.1% | 2.2%(+20.9)#10 | 3.4%(+19.7)#655 |
| 11. | Holiday Pocono | 22.9% | 2.2%(+20.7)#11 | 3.4%(+19.5)#664 |
| 12. | Yellow Springs | 21.7% | 2.2%(+19.5)#12 | 3.4%(+18.4)#740 |
| 13. | Harmonsburg | 19.7% | 2.2%(+17.5)#13 | 3.4%(+16.3)#855 |
| 14. | Orrtanna | 18.2% | 2.2%(+16.0)#14 | 3.4%(+14.8)#976 |
| 15. | Sunrise Lake | 17.3% | 2.2%(+15.1)#15 | 3.4%(+13.9)#1,051 |
| 16. | Orangeville Borough | 16.9% | 2.2%(+14.7)#16 | 3.4%(+13.5)#1,087 |
| 17. | Atlantic | 16.7% | 2.2%(+14.5)#17 | 3.4%(+13.3)#1,105 |
| 18. | Big Bass Lake | 16.3% | 2.2%(+14.1)#18 | 3.4%(+13.0)#1,137 |
| 19. | Kennerdell | 16.0% | 2.2%(+13.8)#19 | 3.4%(+12.6)#1,185 |
| 20. | Orviston | 15.8% | 2.2%(+13.6)#20 | 3.4%(+12.4)#1,200 |
| 21. | Montrose Manor | 15.4% | 2.2%(+13.1)#21 | 3.4%(+12.0)#1,257 |
| 22. | Elrama | 14.3% | 2.2%(+12.1)#22 | 3.4%(+10.9)#1,376 |
| 23. | Cassville Borough | 14.1% | 2.2%(+11.9)#23 | 3.4%(+10.7)#1,428 |
| 24. | Marion | 13.5% | 2.2%(+11.3)#24 | 3.4%(+10.1)#1,501 |
| 25. | Sheffield | 13.5% | 2.2%(+11.3)#25 | 3.4%(+10.1)#1,504 |
| 26. | Greens Landing | 12.8% | 2.2%(+10.6)#26 | 3.4%(+9.42)#1,613 |
| 27. | Grassflat | 12.2% | 2.2%(+10.0)#27 | 3.4%(+8.86)#1,712 |
| 28. | Fairfield Borough | 12.1% | 2.2%(+9.86)#28 | 3.4%(+8.68)#1,745 |
| 29. | Lucerne Mines | 11.9% | 2.2%(+9.72)#29 | 3.4%(+8.54)#1,769 |
| 30. | Gouldsboro | 11.7% | 2.2%(+9.53)#30 | 3.4%(+8.36)#1,813 |
| 31. | Siglerville | 11.4% | 2.2%(+9.16)#31 | 3.4%(+7.99)#1,893 |
| 32. | Hickory | 11.1% | 2.2%(+8.91)#32 | 3.4%(+7.73)#1,936 |
| 33. | Swarthmore Borough | 10.8% | 2.2%(+8.64)#33 | 3.4%(+7.47)#2,000 |
| 34. | Pymatuning South | 10.8% | 2.2%(+8.62)#34 | 3.4%(+7.45)#2,004 |
| 35. | Nixon | 10.7% | 2.2%(+8.51)#35 | 3.4%(+7.33)#2,035 |
| 36. | Pleasant Hill | 10.7% | 2.2%(+8.46)#36 | 3.4%(+7.28)#2,043 |
| 37. | Sand Hill | 10.3% | 2.2%(+8.07)#37 | 3.4%(+6.89)#2,134 |
| 38. | Table Rock | 10.2% | 2.2%(+8.00)#38 | 3.4%(+6.83)#2,157 |
| 39. | Modena Borough | 10.2% | 2.2%(+7.98)#39 | 3.4%(+6.80)#2,164 |
| 40. | Blain Borough | 9.9% | 2.2%(+7.72)#40 | 3.4%(+6.54)#2,228 |
| 41. | Allport | 9.9% | 2.2%(+7.65)#41 | 3.4%(+6.47)#2,244 |
| 42. | Kelayres | 9.7% | 2.2%(+7.48)#42 | 3.4%(+6.30)#2,283 |
| 43. | Schlusser | 9.6% | 2.2%(+7.39)#43 | 3.4%(+6.21)#2,314 |
| 44. | Norvelt | 9.6% | 2.2%(+7.39)#44 | 3.4%(+6.21)#2,316 |
| 45. | Wilburton Number Two | 9.5% | 2.2%(+7.32)#45 | 3.4%(+6.15)#2,338 |
| 46. | Loop | 9.4% | 2.2%(+7.25)#46 | 3.4%(+6.07)#2,364 |
| 47. | Waymart Borough | 9.4% | 2.2%(+7.15)#47 | 3.4%(+5.97)#2,395 |
| 48. | South Uniontown | 9.3% | 2.2%(+7.05)#48 | 3.4%(+5.87)#2,436 |
| 49. | Scalp Level Borough | 9.2% | 2.2%(+6.98)#49 | 3.4%(+5.80)#2,464 |
| 50. | Shanor Northvue | 9.2% | 2.2%(+6.95)#50 | 3.4%(+5.77)#2,471 |
| 51. | Belmont | 9.1% | 2.2%(+6.91)#51 | 3.4%(+5.73)#2,479 |
| 52. | New Morgan Borough | 9.1% | 2.2%(+6.89)#52 | 3.4%(+5.71)#2,500 |
| 53. | Lake Heritage | 8.9% | 2.2%(+6.72)#53 | 3.4%(+5.55)#2,541 |
| 54. | Lake Arthur Estates | 8.9% | 2.2%(+6.72)#54 | 3.4%(+5.54)#2,542 |
| 55. | Rennerdale | 8.9% | 2.2%(+6.69)#55 | 3.4%(+5.52)#2,555 |
| 56. | Soudersburg | 8.7% | 2.2%(+6.49)#56 | 3.4%(+5.32)#2,630 |
| 57. | Noblestown | 8.7% | 2.2%(+6.48)#57 | 3.4%(+5.30)#2,646 |
| 58. | Coal Center Borough | 8.6% | 2.2%(+6.44)#58 | 3.4%(+5.26)#2,661 |
| 59. | Parker | 8.5% | 2.2%(+6.33)#59 | 3.4%(+5.15)#2,692 |
| 60. | Sheppton | 8.5% | 2.2%(+6.29)#60 | 3.4%(+5.11)#2,708 |
| 61. | Wopsononock | 8.4% | 2.2%(+6.21)#61 | 3.4%(+5.03)#2,755 |
| 62. | Parkville | 8.4% | 2.2%(+6.19)#62 | 3.4%(+5.01)#2,760 |
| 63. | Lima | 8.4% | 2.2%(+6.18)#63 | 3.4%(+5.01)#2,762 |
| 64. | Oley | 8.4% | 2.2%(+6.18)#64 | 3.4%(+5.00)#2,763 |
| 65. | Courtdale Borough | 8.2% | 2.2%(+6.04)#65 | 3.4%(+4.87)#2,817 |
| 66. | Browntown | 8.2% | 2.2%(+6.00)#66 | 3.4%(+4.83)#2,836 |
| 67. | Runville | 8.0% | 2.2%(+5.84)#67 | 3.4%(+4.67)#2,900 |
| 68. | West Sunbury Borough | 8.0% | 2.2%(+5.76)#68 | 3.4%(+4.59)#2,926 |
| 69. | Montgomery Borough | 8.0% | 2.2%(+5.76)#69 | 3.4%(+4.58)#2,928 |
| 70. | Millsboro | 7.9% | 2.2%(+5.73)#70 | 3.4%(+4.55)#2,939 |
| 71. | Wylandville | 7.9% | 2.2%(+5.70)#71 | 3.4%(+4.53)#2,948 |
| 72. | Richland Borough | 7.8% | 2.2%(+5.62)#72 | 3.4%(+4.44)#2,978 |
| 73. | Aspers | 7.8% | 2.2%(+5.60)#73 | 3.4%(+4.42)#2,990 |
| 74. | Cornwells Heights | 7.8% | 2.2%(+5.56)#74 | 3.4%(+4.39)#3,007 |
| 75. | Elysburg | 7.7% | 2.2%(+5.51)#75 | 3.4%(+4.33)#3,019 |
| 76. | Fairview | 7.7% | 2.2%(+5.47)#76 | 3.4%(+4.29)#3,045 |
| 77. | Toftrees | 7.6% | 2.2%(+5.36)#77 | 3.4%(+4.18)#3,098 |
| 78. | Parkside Borough | 7.5% | 2.2%(+5.31)#78 | 3.4%(+4.14)#3,112 |
| 79. | Emlenton Borough | 7.5% | 2.2%(+5.29)#79 | 3.4%(+4.11)#3,130 |
| 80. | Finleyville Borough | 7.5% | 2.2%(+5.28)#80 | 3.4%(+4.10)#3,135 |
| 81. | Lenkerville | 7.5% | 2.2%(+5.25)#81 | 3.4%(+4.08)#3,146 |
| 82. | Lykens Borough | 7.4% | 2.2%(+5.18)#82 | 3.4%(+4.00)#3,187 |
| 83. | Rockhill Borough | 7.4% | 2.2%(+5.16)#83 | 3.4%(+3.98)#3,194 |
| 84. | Wallenpaupack Lake Estates | 7.3% | 2.2%(+5.14)#84 | 3.4%(+3.97)#3,201 |
| 85. | Morrisville | 7.3% | 2.2%(+5.10)#85 | 3.4%(+3.93)#3,217 |
| 86. | Hostetter | 7.3% | 2.2%(+5.09)#86 | 3.4%(+3.91)#3,227 |
| 87. | Goldsboro Borough | 7.3% | 2.2%(+5.09)#87 | 3.4%(+3.91)#3,231 |
| 88. | Quentin | 7.3% | 2.2%(+5.08)#88 | 3.4%(+3.90)#3,234 |
| 89. | Bressler | 7.3% | 2.2%(+5.05)#89 | 3.4%(+3.88)#3,245 |
| 90. | Whitfield | 7.2% | 2.2%(+5.03)#90 | 3.4%(+3.85)#3,263 |
| 91. | East Lansdowne Borough | 7.2% | 2.2%(+5.00)#91 | 3.4%(+3.82)#3,283 |
| 92. | Sharon Hill Borough | 7.2% | 2.2%(+4.97)#92 | 3.4%(+3.79)#3,286 |
| 93. | Clifton Heights Borough | 7.2% | 2.2%(+4.96)#93 | 3.4%(+3.78)#3,290 |
| 94. | Coaldale Borough Bedford County | 7.1% | 2.2%(+4.94)#94 | 3.4%(+3.77)#3,305 |
| 95. | Reynolds Heights | 7.1% | 2.2%(+4.88)#95 | 3.4%(+3.70)#3,337 |
| 96. | Jonestown Borough | 7.1% | 2.2%(+4.85)#96 | 3.4%(+3.67)#3,350 |
| 97. | Troutville Borough | 7.0% | 2.2%(+4.84)#97 | 3.4%(+3.66)#3,355 |
| 98. | Pen Mar | 7.0% | 2.2%(+4.79)#98 | 3.4%(+3.62)#3,396 |
| 99. | Coral | 6.9% | 2.2%(+4.72)#99 | 3.4%(+3.54)#3,441 |
| 100. | Watsontown Borough | 6.8% | 2.2%(+4.62)#100 | 3.4%(+3.45)#3,495 |
Common Questions
What are the Top 10 Cities with the Highest Percentage of Federal Government Employees in Pennsylvania?
Top 10 Cities with the Highest Percentage of Federal Government Employees in Pennsylvania are:
#1
57.1%
#2
33.3%
#3
32.9%
#4
25.3%
#5
23.7%
#6
23.3%
#7
23.1%
#8
22.9%
#9
19.7%
#10
18.2%
What city has the Highest Percentage of Federal Government Employees in Pennsylvania?
Harrison City has the Highest Percentage of Federal Government Employees in Pennsylvania with 57.1%.
What is the Percentage of Federal Government Employees in the State of Pennsylvania?
Percentage of Federal Government Employees in Pennsylvania is 2.2%.
What is the Percentage of Federal Government Employees in the United States?
Percentage of Federal Government Employees in the United States is 3.4%.