Cities with the Lowest Child Poverty Level Among Boys Under the Age of 16 in Pennsylvania
RELATED REPORTS & OPTIONS
Lowest Poverty | Boys 0-16
Pennsylvania
Compare Cities
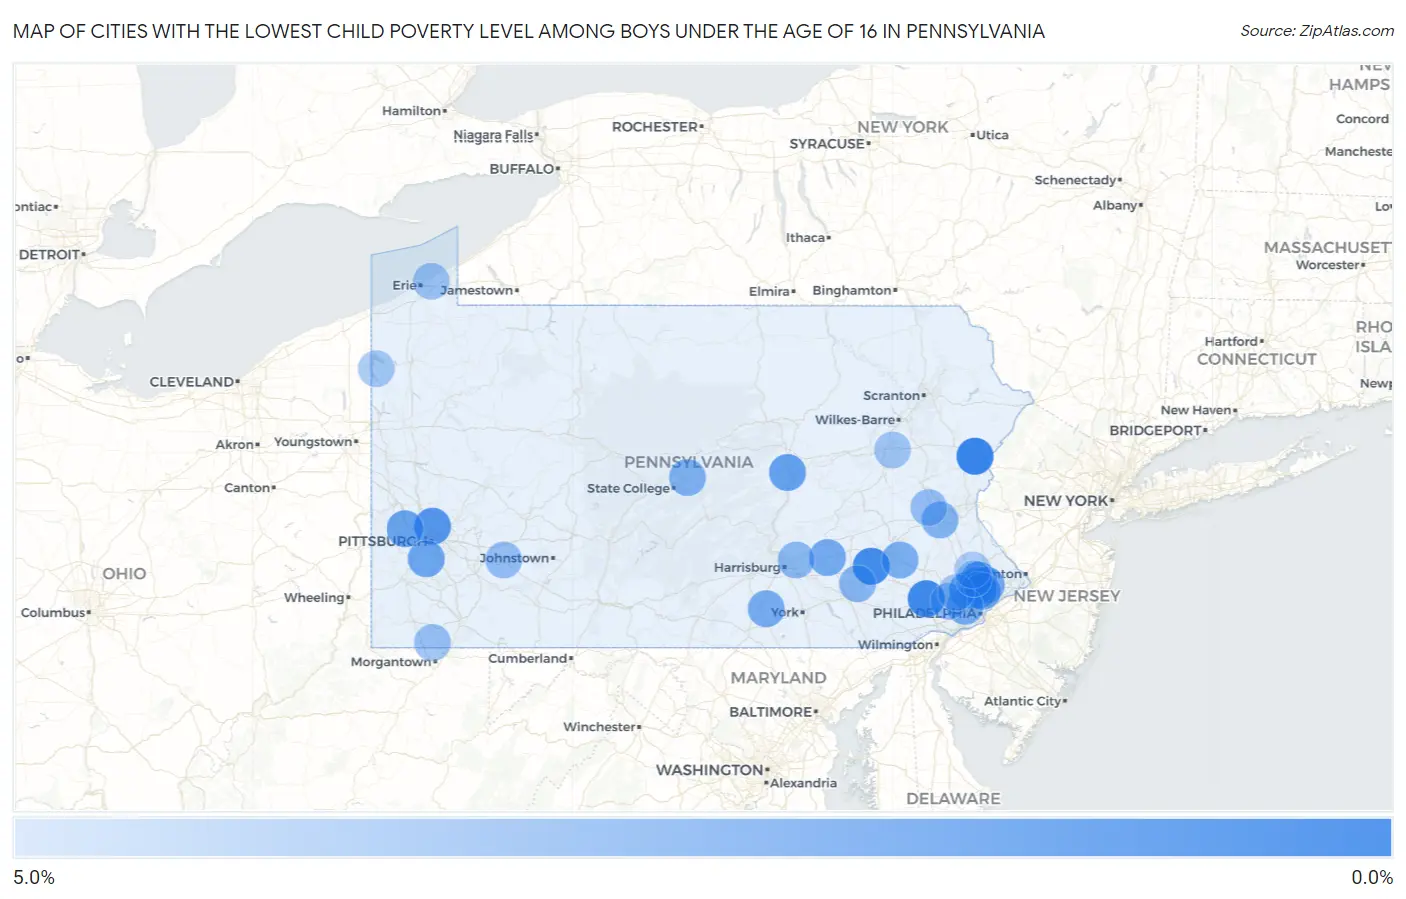
Map of Cities with the Lowest Child Poverty Level Among Boys Under the Age of 16 in Pennsylvania
5.0%
0.0%
Cities with the Lowest Child Poverty Level Among Boys Under the Age of 16 in Pennsylvania
| City | Child Poverty (Boys) | vs State | vs National | |
| 1. | Arlington Heights | 0.43% | 16.5%(-16.0)#1 | 16.9%(-16.5)#25 |
| 2. | Plum Borough | 0.48% | 16.5%(-16.0)#2 | 16.9%(-16.4)#34 |
| 3. | Doylestown Borough | 0.61% | 16.5%(-15.9)#3 | 16.9%(-16.3)#59 |
| 4. | Lionville | 0.72% | 16.5%(-15.7)#4 | 16.9%(-16.2)#88 |
| 5. | Reinholds | 0.75% | 16.5%(-15.7)#5 | 16.9%(-16.2)#95 |
| 6. | Topton Borough | 0.76% | 16.5%(-15.7)#6 | 16.9%(-16.1)#100 |
| 7. | Oakmont Borough | 0.90% | 16.5%(-15.6)#7 | 16.9%(-16.0)#136 |
| 8. | New Britain Borough | 1.2% | 16.5%(-15.2)#8 | 16.9%(-15.7)#269 |
| 9. | State College Borough | 1.4% | 16.5%(-15.1)#9 | 16.9%(-15.5)#323 |
| 10. | Glenshaw | 1.4% | 16.5%(-15.1)#10 | 16.9%(-15.5)#329 |
| 11. | West Middlesex Borough | 1.4% | 16.5%(-15.1)#11 | 16.9%(-15.5)#333 |
| 12. | Fox Chapel Borough | 1.5% | 16.5%(-15.0)#12 | 16.9%(-15.4)#360 |
| 13. | Clarks Summit Borough | 1.5% | 16.5%(-14.9)#13 | 16.9%(-15.4)#371 |
| 14. | Maple Glen | 1.6% | 16.5%(-14.8)#14 | 16.9%(-15.3)#423 |
| 15. | Indiana Borough | 1.6% | 16.5%(-14.8)#15 | 16.9%(-15.3)#426 |
| 16. | Plymouth Meeting | 1.7% | 16.5%(-14.8)#16 | 16.9%(-15.2)#464 |
| 17. | Chester Heights Borough | 1.7% | 16.5%(-14.7)#17 | 16.9%(-15.2)#473 |
| 18. | Lititz Borough | 1.9% | 16.5%(-14.6)#18 | 16.9%(-15.0)#575 |
| 19. | Winfield | 1.9% | 16.5%(-14.5)#19 | 16.9%(-15.0)#584 |
| 20. | Duncansville Borough | 1.9% | 16.5%(-14.5)#20 | 16.9%(-15.0)#595 |
| 21. | Fort Washington | 2.0% | 16.5%(-14.5)#21 | 16.9%(-14.9)#605 |
| 22. | Carnot Moon | 2.0% | 16.5%(-14.5)#22 | 16.9%(-14.9)#623 |
| 23. | Bell Acres Borough | 2.1% | 16.5%(-14.4)#23 | 16.9%(-14.8)#672 |
| 24. | Crafton Borough | 2.1% | 16.5%(-14.4)#24 | 16.9%(-14.8)#698 |
| 25. | Bethel Park | 2.1% | 16.5%(-14.3)#25 | 16.9%(-14.8)#717 |
| 26. | Hellertown Borough | 2.2% | 16.5%(-14.3)#26 | 16.9%(-14.7)#751 |
| 27. | Willow Grove | 2.2% | 16.5%(-14.2)#27 | 16.9%(-14.7)#785 |
| 28. | Ashland Borough | 2.3% | 16.5%(-14.2)#28 | 16.9%(-14.6)#810 |
| 29. | Oreland | 2.3% | 16.5%(-14.2)#29 | 16.9%(-14.6)#813 |
| 30. | Eau Claire Borough | 2.3% | 16.5%(-14.1)#30 | 16.9%(-14.6)#833 |
| 31. | Alburtis Borough | 2.3% | 16.5%(-14.1)#31 | 16.9%(-14.6)#841 |
| 32. | Glenside | 2.4% | 16.5%(-14.1)#32 | 16.9%(-14.5)#861 |
| 33. | Annville | 2.4% | 16.5%(-14.1)#33 | 16.9%(-14.5)#876 |
| 34. | Conyngham Borough | 2.4% | 16.5%(-14.0)#34 | 16.9%(-14.5)#896 |
| 35. | Ardmore | 2.4% | 16.5%(-14.0)#35 | 16.9%(-14.5)#900 |
| 36. | Lake Meade | 2.5% | 16.5%(-14.0)#36 | 16.9%(-14.4)#913 |
| 37. | Montgomery Borough | 2.5% | 16.5%(-14.0)#37 | 16.9%(-14.4)#916 |
| 38. | Wilmore Borough | 2.5% | 16.5%(-14.0)#38 | 16.9%(-14.4)#931 |
| 39. | Reiffton | 2.6% | 16.5%(-13.9)#39 | 16.9%(-14.3)#990 |
| 40. | Elkins Park | 2.7% | 16.5%(-13.8)#40 | 16.9%(-14.3)#1,018 |
| 41. | Seven Fields Borough | 2.7% | 16.5%(-13.8)#41 | 16.9%(-14.2)#1,024 |
| 42. | Bonneauville Borough | 2.7% | 16.5%(-13.8)#42 | 16.9%(-14.2)#1,029 |
| 43. | Albion Borough | 2.7% | 16.5%(-13.8)#43 | 16.9%(-14.2)#1,049 |
| 44. | Vanderbilt Borough | 2.7% | 16.5%(-13.8)#44 | 16.9%(-14.2)#1,054 |
| 45. | Fleetwood Borough | 2.7% | 16.5%(-13.7)#45 | 16.9%(-14.2)#1,063 |
| 46. | Pleasant Gap | 2.7% | 16.5%(-13.7)#46 | 16.9%(-14.2)#1,068 |
| 47. | Mifflinburg Borough | 2.8% | 16.5%(-13.7)#47 | 16.9%(-14.1)#1,084 |
| 48. | Southmont Borough | 2.8% | 16.5%(-13.7)#48 | 16.9%(-14.1)#1,111 |
| 49. | Dorneyville | 2.8% | 16.5%(-13.6)#49 | 16.9%(-14.1)#1,119 |
| 50. | Brookhaven Borough | 2.8% | 16.5%(-13.6)#50 | 16.9%(-14.1)#1,128 |
| 51. | Langhorne Borough | 2.9% | 16.5%(-13.6)#51 | 16.9%(-14.0)#1,135 |
| 52. | Foxburg Borough | 2.9% | 16.5%(-13.6)#52 | 16.9%(-14.0)#1,140 |
| 53. | Throop Borough | 2.9% | 16.5%(-13.6)#53 | 16.9%(-14.0)#1,163 |
| 54. | Riegelsville Borough | 3.0% | 16.5%(-13.5)#54 | 16.9%(-13.9)#1,220 |
| 55. | Rothsville | 3.0% | 16.5%(-13.5)#55 | 16.9%(-13.9)#1,232 |
| 56. | Kane Borough | 3.0% | 16.5%(-13.4)#56 | 16.9%(-13.9)#1,241 |
| 57. | Paxtonia | 3.0% | 16.5%(-13.4)#57 | 16.9%(-13.9)#1,244 |
| 58. | West Grove Borough | 3.1% | 16.5%(-13.4)#58 | 16.9%(-13.9)#1,263 |
| 59. | Montoursville Borough | 3.1% | 16.5%(-13.4)#59 | 16.9%(-13.8)#1,268 |
| 60. | Richland Borough | 3.1% | 16.5%(-13.4)#60 | 16.9%(-13.8)#1,301 |
| 61. | Port Vue Borough | 3.2% | 16.5%(-13.3)#61 | 16.9%(-13.7)#1,356 |
| 62. | Camp Hill Borough | 3.2% | 16.5%(-13.2)#62 | 16.9%(-13.7)#1,390 |
| 63. | Apollo Borough | 3.3% | 16.5%(-13.2)#63 | 16.9%(-13.6)#1,408 |
| 64. | Applewold Borough | 3.3% | 16.5%(-13.1)#64 | 16.9%(-13.6)#1,451 |
| 65. | Media Borough | 3.4% | 16.5%(-13.1)#65 | 16.9%(-13.5)#1,469 |
| 66. | West Easton Borough | 3.4% | 16.5%(-13.1)#66 | 16.9%(-13.5)#1,475 |
| 67. | Loyalhanna | 3.4% | 16.5%(-13.1)#67 | 16.9%(-13.5)#1,487 |
| 68. | Schnecksville | 3.4% | 16.5%(-13.1)#68 | 16.9%(-13.5)#1,490 |
| 69. | Berwyn | 3.4% | 16.5%(-13.1)#69 | 16.9%(-13.5)#1,495 |
| 70. | Kenhorst Borough | 3.4% | 16.5%(-13.0)#70 | 16.9%(-13.5)#1,497 |
| 71. | Freemansburg Borough | 3.4% | 16.5%(-13.0)#71 | 16.9%(-13.5)#1,511 |
| 72. | Bobtown | 3.4% | 16.5%(-13.0)#72 | 16.9%(-13.5)#1,515 |
| 73. | Pleasant Hills Borough | 3.5% | 16.5%(-13.0)#73 | 16.9%(-13.4)#1,540 |
| 74. | Northwest Harborcreek | 3.6% | 16.5%(-12.9)#74 | 16.9%(-13.3)#1,597 |
| 75. | Catasauqua Borough | 3.7% | 16.5%(-12.8)#75 | 16.9%(-13.2)#1,631 |
| 76. | Honey Brook Borough | 3.7% | 16.5%(-12.8)#76 | 16.9%(-13.2)#1,633 |
| 77. | Beech Mountain Lakes | 3.7% | 16.5%(-12.8)#77 | 16.9%(-13.2)#1,651 |
| 78. | Centerport Borough | 3.7% | 16.5%(-12.8)#78 | 16.9%(-13.2)#1,662 |
| 79. | Pymatuning Central | 3.8% | 16.5%(-12.6)#79 | 16.9%(-13.1)#1,719 |
| 80. | Bruin Borough | 3.8% | 16.5%(-12.6)#80 | 16.9%(-13.1)#1,737 |
| 81. | Penn Farms | 3.9% | 16.5%(-12.6)#81 | 16.9%(-13.0)#1,744 |
| 82. | Edinboro Borough | 3.9% | 16.5%(-12.6)#82 | 16.9%(-13.0)#1,753 |
| 83. | Myerstown Borough | 3.9% | 16.5%(-12.6)#83 | 16.9%(-13.0)#1,771 |
| 84. | King Of Prussia | 3.9% | 16.5%(-12.5)#84 | 16.9%(-13.0)#1,790 |
| 85. | Old Forge Borough | 4.0% | 16.5%(-12.4)#85 | 16.9%(-12.9)#1,842 |
| 86. | Jonestown Borough | 4.0% | 16.5%(-12.4)#86 | 16.9%(-12.9)#1,853 |
| 87. | Montgomeryville | 4.1% | 16.5%(-12.4)#87 | 16.9%(-12.8)#1,860 |
| 88. | Sewickley Borough | 4.2% | 16.5%(-12.3)#88 | 16.9%(-12.7)#1,923 |
| 89. | Canonsburg Borough | 4.2% | 16.5%(-12.3)#89 | 16.9%(-12.7)#1,927 |
| 90. | Spring House | 4.2% | 16.5%(-12.3)#90 | 16.9%(-12.7)#1,932 |
| 91. | Hulmeville Borough | 4.2% | 16.5%(-12.3)#91 | 16.9%(-12.7)#1,933 |
| 92. | Houtzdale Borough | 4.2% | 16.5%(-12.2)#92 | 16.9%(-12.7)#1,945 |
| 93. | Chalfont Borough | 4.2% | 16.5%(-12.2)#93 | 16.9%(-12.7)#1,953 |
| 94. | Sellersville Borough | 4.2% | 16.5%(-12.2)#94 | 16.9%(-12.7)#1,955 |
| 95. | Harrisville Borough | 4.3% | 16.5%(-12.2)#95 | 16.9%(-12.6)#1,981 |
| 96. | Gettysburg Borough | 4.3% | 16.5%(-12.2)#96 | 16.9%(-12.6)#1,993 |
| 97. | Corsica Borough | 4.3% | 16.5%(-12.1)#97 | 16.9%(-12.6)#2,025 |
| 98. | Clarion Borough | 4.4% | 16.5%(-12.1)#98 | 16.9%(-12.5)#2,060 |
| 99. | Carrolltown Borough | 4.4% | 16.5%(-12.0)#99 | 16.9%(-12.5)#2,078 |
| 100. | Nottingham | 4.5% | 16.5%(-12.0)#100 | 16.9%(-12.4)#2,091 |
Common Questions
What are the Top 10 Cities with the Lowest Child Poverty Level Among Boys Under the Age of 16 in Pennsylvania?
Top 10 Cities with the Lowest Child Poverty Level Among Boys Under the Age of 16 in Pennsylvania are:
#1
0.43%
#2
0.72%
#3
0.75%
#4
1.4%
#5
1.6%
#6
1.7%
#7
1.9%
#8
2.0%
#9
2.0%
#10
2.1%
What city has the Lowest Child Poverty Level Among Boys Under the Age of 16 in Pennsylvania?
Arlington Heights has the Lowest Child Poverty Level Among Boys Under the Age of 16 in Pennsylvania with 0.43%.
What is the Poverty Level Among Boys Under the Age of 16 in the State of Pennsylvania?
Poverty Level Among Boys Under the Age of 16 in Pennsylvania is 16.5%.
What is the Poverty Level Among Boys Under the Age of 16 in the United States?
Poverty Level Among Boys Under the Age of 16 in the United States is 16.9%.