Cities with the Highest Percentage of Population Employed in Construction in Pennsylvania
RELATED REPORTS & OPTIONS
Construction
Pennsylvania
Compare Cities
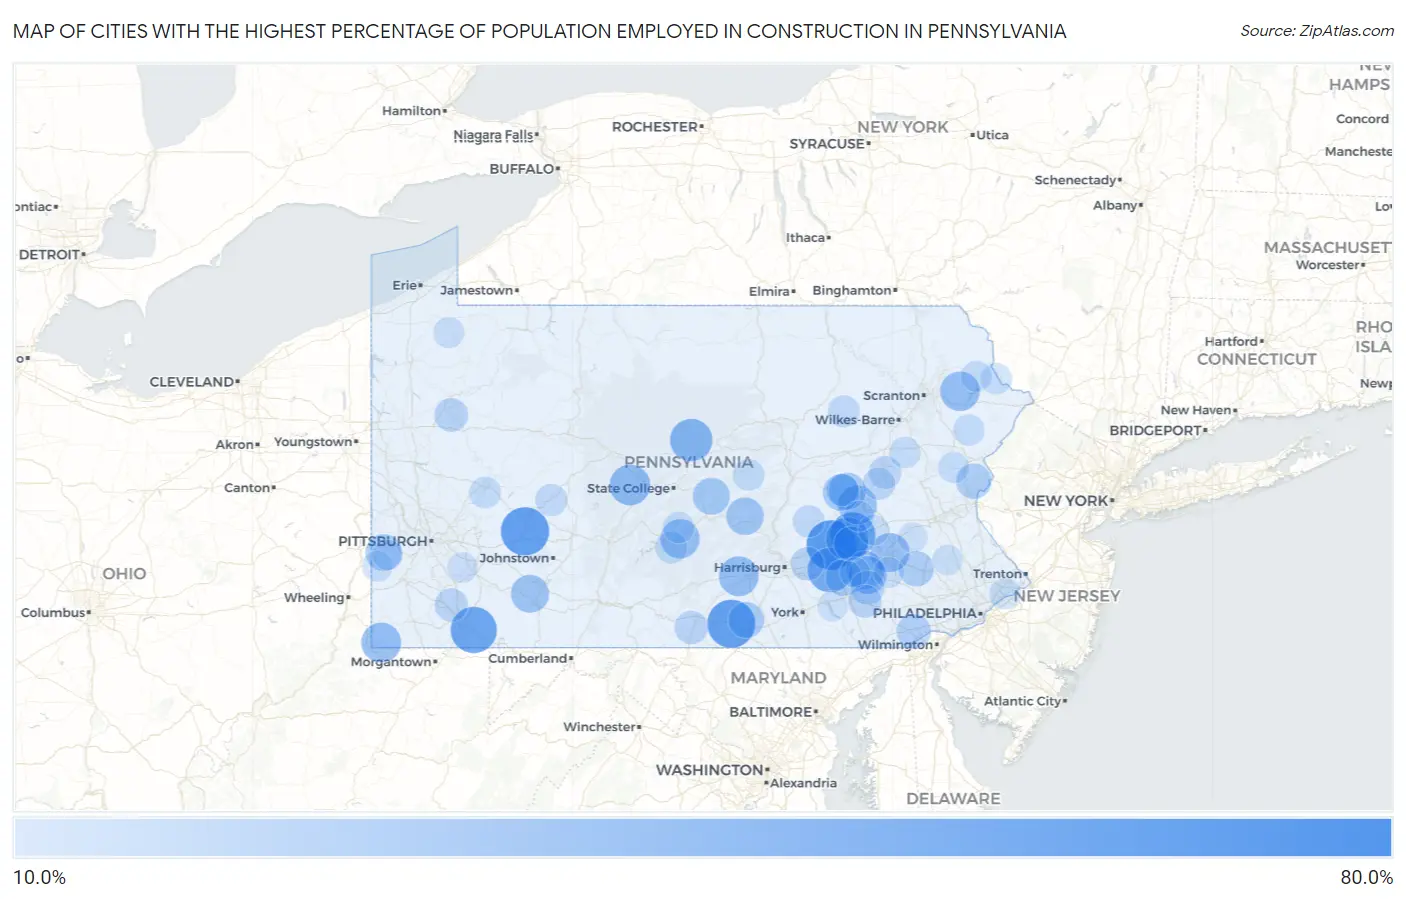
Map of Cities with the Highest Percentage of Population Employed in Construction in Pennsylvania
0.0%
80.0%
Cities with the Highest Percentage of Population Employed in Construction in Pennsylvania
| City | % Employed | vs State | vs National | |
| 1. | Canoe Creek | 67.9% | 6.0%(+61.9)#1 | 6.9%(+61.0)#94 |
| 2. | Jonestown | 61.9% | 6.0%(+55.9)#2 | 6.9%(+55.0)#121 |
| 3. | Graceton | 58.9% | 6.0%(+52.9)#3 | 6.9%(+52.0)#139 |
| 4. | Cashtown | 58.3% | 6.0%(+52.3)#4 | 6.9%(+51.4)#143 |
| 5. | Charlottsville | 54.5% | 6.0%(+48.5)#5 | 6.9%(+47.7)#177 |
| 6. | Chalkhill | 54.3% | 6.0%(+48.3)#6 | 6.9%(+47.4)#182 |
| 7. | Bethel | 52.6% | 6.0%(+46.6)#7 | 6.9%(+45.7)#193 |
| 8. | Timber Hills | 50.5% | 6.0%(+44.5)#8 | 6.9%(+43.7)#206 |
| 9. | Frystown | 46.7% | 6.0%(+40.7)#9 | 6.9%(+39.8)#252 |
| 10. | Monument | 45.5% | 6.0%(+39.5)#10 | 6.9%(+38.6)#267 |
| 11. | Sandy Ridge | 41.5% | 6.0%(+35.5)#11 | 6.9%(+34.6)#330 |
| 12. | Cove Forge | 39.7% | 6.0%(+33.7)#12 | 6.9%(+32.8)#368 |
| 13. | Farwell | 39.3% | 6.0%(+33.3)#13 | 6.9%(+32.4)#380 |
| 14. | New Freeport | 39.1% | 6.0%(+33.1)#14 | 6.9%(+32.3)#381 |
| 15. | Plainfield | 39.1% | 6.0%(+33.1)#15 | 6.9%(+32.2)#383 |
| 16. | The Hideout | 38.9% | 6.0%(+32.9)#16 | 6.9%(+32.0)#386 |
| 17. | Oreminea | 38.3% | 6.0%(+32.3)#17 | 6.9%(+31.4)#402 |
| 18. | Atkinson Mills | 38.0% | 6.0%(+32.0)#18 | 6.9%(+31.2)#408 |
| 19. | Greenfields | 37.7% | 6.0%(+31.7)#19 | 6.9%(+30.8)#420 |
| 20. | Marlin | 37.4% | 6.0%(+31.4)#20 | 6.9%(+30.5)#434 |
| 21. | Callimont Borough | 36.4% | 6.0%(+30.4)#21 | 6.9%(+29.5)#471 |
| 22. | Royer | 36.4% | 6.0%(+30.4)#22 | 6.9%(+29.5)#472 |
| 23. | Hazen | 35.9% | 6.0%(+29.9)#23 | 6.9%(+29.1)#481 |
| 24. | Schoeneck | 35.3% | 6.0%(+29.3)#24 | 6.9%(+28.4)#501 |
| 25. | Stevens | 35.3% | 6.0%(+29.3)#25 | 6.9%(+28.4)#504 |
| 26. | Edie | 35.1% | 6.0%(+29.1)#26 | 6.9%(+28.3)#508 |
| 27. | East Salem | 34.1% | 6.0%(+28.1)#27 | 6.9%(+27.2)#545 |
| 28. | Point View | 33.3% | 6.0%(+27.3)#28 | 6.9%(+26.5)#592 |
| 29. | Fountain Springs | 33.0% | 6.0%(+27.0)#29 | 6.9%(+26.2)#602 |
| 30. | Siglerville | 33.0% | 6.0%(+27.0)#30 | 6.9%(+26.1)#609 |
| 31. | Lavelle | 32.5% | 6.0%(+26.5)#31 | 6.9%(+25.7)#623 |
| 32. | Langeloth | 32.2% | 6.0%(+26.2)#32 | 6.9%(+25.3)#630 |
| 33. | Penryn | 32.0% | 6.0%(+26.0)#33 | 6.9%(+25.1)#639 |
| 34. | Brooks Mill | 31.3% | 6.0%(+25.3)#34 | 6.9%(+24.4)#674 |
| 35. | Table Rock | 30.6% | 6.0%(+24.6)#35 | 6.9%(+23.7)#708 |
| 36. | Ackermanville | 29.4% | 6.0%(+23.4)#36 | 6.9%(+22.5)#779 |
| 37. | Bear Lake Borough | 29.3% | 6.0%(+23.3)#37 | 6.9%(+22.5)#785 |
| 38. | Douglassville | 29.2% | 6.0%(+23.2)#38 | 6.9%(+22.4)#788 |
| 39. | Dumb Hundred | 28.4% | 6.0%(+22.4)#39 | 6.9%(+21.5)#855 |
| 40. | North Bend | 27.9% | 6.0%(+21.9)#40 | 6.9%(+21.1)#890 |
| 41. | Mount Aetna | 27.5% | 6.0%(+21.5)#41 | 6.9%(+20.6)#924 |
| 42. | Toughkenamon | 27.4% | 6.0%(+21.4)#42 | 6.9%(+20.5)#928 |
| 43. | Shelltown | 27.3% | 6.0%(+21.3)#43 | 6.9%(+20.4)#942 |
| 44. | Roots | 26.2% | 6.0%(+20.2)#44 | 6.9%(+19.3)#1,034 |
| 45. | Broad Top City Borough | 25.8% | 6.0%(+19.8)#45 | 6.9%(+19.0)#1,054 |
| 46. | Farmersville | 25.6% | 6.0%(+19.6)#46 | 6.9%(+18.7)#1,077 |
| 47. | Kennerdell | 25.5% | 6.0%(+19.5)#47 | 6.9%(+18.7)#1,081 |
| 48. | Union Deposit | 25.1% | 6.0%(+19.1)#48 | 6.9%(+18.2)#1,117 |
| 49. | Marion | 24.8% | 6.0%(+18.8)#49 | 6.9%(+17.9)#1,157 |
| 50. | Rowes Run | 24.5% | 6.0%(+18.5)#50 | 6.9%(+17.6)#1,179 |
| 51. | Bird In Hand | 24.3% | 6.0%(+18.3)#51 | 6.9%(+17.5)#1,192 |
| 52. | Moose Run | 24.0% | 6.0%(+18.0)#52 | 6.9%(+17.1)#1,248 |
| 53. | Juniata Gap | 23.5% | 6.0%(+17.5)#53 | 6.9%(+16.7)#1,301 |
| 54. | Cassville Borough | 23.4% | 6.0%(+17.4)#54 | 6.9%(+16.6)#1,323 |
| 55. | Kelayres | 23.4% | 6.0%(+17.4)#55 | 6.9%(+16.5)#1,328 |
| 56. | Locustdale | 22.8% | 6.0%(+16.8)#56 | 6.9%(+15.9)#1,418 |
| 57. | Park Crest | 22.4% | 6.0%(+16.4)#57 | 6.9%(+15.5)#1,479 |
| 58. | Commodore | 22.3% | 6.0%(+16.3)#58 | 6.9%(+15.5)#1,498 |
| 59. | Laporte Borough | 22.2% | 6.0%(+16.2)#59 | 6.9%(+15.3)#1,508 |
| 60. | Cedar Crest | 22.2% | 6.0%(+16.2)#60 | 6.9%(+15.3)#1,517 |
| 61. | New Lebanon Borough | 22.0% | 6.0%(+16.0)#61 | 6.9%(+15.1)#1,542 |
| 62. | Ellsworth Borough | 21.9% | 6.0%(+15.9)#62 | 6.9%(+15.0)#1,557 |
| 63. | Wiconsico | 21.9% | 6.0%(+15.9)#63 | 6.9%(+15.0)#1,558 |
| 64. | Jamison City | 21.7% | 6.0%(+15.7)#64 | 6.9%(+14.8)#1,593 |
| 65. | Twilight Borough | 21.6% | 6.0%(+15.6)#65 | 6.9%(+14.7)#1,606 |
| 66. | Newton Hamilton Borough | 21.4% | 6.0%(+15.4)#66 | 6.9%(+14.6)#1,634 |
| 67. | Saltsburg Borough | 21.1% | 6.0%(+15.1)#67 | 6.9%(+14.2)#1,686 |
| 68. | Lenape Heights | 21.1% | 6.0%(+15.1)#68 | 6.9%(+14.2)#1,691 |
| 69. | Laurelton | 20.9% | 6.0%(+14.9)#69 | 6.9%(+14.1)#1,709 |
| 70. | Callensburg Borough | 20.9% | 6.0%(+14.9)#70 | 6.9%(+14.0)#1,721 |
| 71. | Cherry Valley Borough | 20.8% | 6.0%(+14.8)#71 | 6.9%(+14.0)#1,739 |
| 72. | Allensville | 20.7% | 6.0%(+14.7)#72 | 6.9%(+13.9)#1,757 |
| 73. | Hickory Hills | 20.6% | 6.0%(+14.6)#73 | 6.9%(+13.7)#1,773 |
| 74. | Mountainhome | 20.6% | 6.0%(+14.6)#74 | 6.9%(+13.7)#1,781 |
| 75. | St Clairsville Borough | 20.5% | 6.0%(+14.5)#75 | 6.9%(+13.6)#1,794 |
| 76. | Masthope | 20.2% | 6.0%(+14.2)#76 | 6.9%(+13.3)#1,857 |
| 77. | Eddington | 20.0% | 6.0%(+14.0)#77 | 6.9%(+13.1)#1,877 |
| 78. | Volant Borough | 20.0% | 6.0%(+14.0)#78 | 6.9%(+13.1)#1,898 |
| 79. | Brodheadsville | 20.0% | 6.0%(+14.0)#79 | 6.9%(+13.1)#1,916 |
| 80. | White Mills | 19.9% | 6.0%(+13.9)#80 | 6.9%(+13.0)#1,923 |
| 81. | Canadohta Lake | 19.6% | 6.0%(+13.6)#81 | 6.9%(+12.7)#1,994 |
| 82. | Barkeyville Borough | 19.4% | 6.0%(+13.4)#82 | 6.9%(+12.5)#2,051 |
| 83. | Shartlesville | 19.3% | 6.0%(+13.3)#83 | 6.9%(+12.4)#2,069 |
| 84. | Avella | 19.2% | 6.0%(+13.2)#84 | 6.9%(+12.3)#2,097 |
| 85. | Thompson Borough | 18.9% | 6.0%(+12.9)#85 | 6.9%(+12.0)#2,167 |
| 86. | Woxall | 18.8% | 6.0%(+12.8)#86 | 6.9%(+11.9)#2,204 |
| 87. | Friedensburg | 18.8% | 6.0%(+12.8)#87 | 6.9%(+11.9)#2,211 |
| 88. | Herminie | 18.7% | 6.0%(+12.7)#88 | 6.9%(+11.8)#2,233 |
| 89. | Alleghenyville | 18.6% | 6.0%(+12.6)#89 | 6.9%(+11.7)#2,246 |
| 90. | Chalfant Borough | 18.5% | 6.0%(+12.5)#90 | 6.9%(+11.6)#2,269 |
| 91. | Callery Borough | 18.5% | 6.0%(+12.5)#91 | 6.9%(+11.6)#2,280 |
| 92. | Atlasburg | 18.5% | 6.0%(+12.5)#92 | 6.9%(+11.6)#2,283 |
| 93. | West Middletown Borough | 18.4% | 6.0%(+12.4)#93 | 6.9%(+11.5)#2,294 |
| 94. | Washington Boro | 18.2% | 6.0%(+12.2)#94 | 6.9%(+11.3)#2,354 |
| 95. | Dryville | 18.1% | 6.0%(+12.1)#95 | 6.9%(+11.2)#2,411 |
| 96. | Picture Rocks Borough | 18.0% | 6.0%(+12.0)#96 | 6.9%(+11.2)#2,421 |
| 97. | Pillow Borough | 17.9% | 6.0%(+11.9)#97 | 6.9%(+11.1)#2,452 |
| 98. | Woolrich | 17.8% | 6.0%(+11.8)#98 | 6.9%(+11.0)#2,474 |
| 99. | Wall Borough | 17.8% | 6.0%(+11.8)#99 | 6.9%(+11.0)#2,475 |
| 100. | Hopeland | 17.8% | 6.0%(+11.8)#100 | 6.9%(+10.9)#2,485 |
Common Questions
What are the Top 10 Cities with the Highest Percentage of Population Employed in Construction in Pennsylvania?
Top 10 Cities with the Highest Percentage of Population Employed in Construction in Pennsylvania are:
#1
61.9%
#2
58.9%
#3
58.3%
#4
54.3%
#5
52.6%
#6
50.5%
#7
46.7%
#8
45.5%
#9
41.5%
#10
39.1%
What city has the Highest Percentage of Population Employed in Construction in Pennsylvania?
Jonestown has the Highest Percentage of Population Employed in Construction in Pennsylvania with 61.9%.
What is the Percentage of Population Employed in Construction in the State of Pennsylvania?
Percentage of Population Employed in Construction in Pennsylvania is 6.0%.
What is the Percentage of Population Employed in Construction in the United States?
Percentage of Population Employed in Construction in the United States is 6.9%.