Cities with the Highest Percentage of Immigrants from Western Asia in Pennsylvania
RELATED REPORTS & OPTIONS
Western Asia
Pennsylvania
Compare Cities
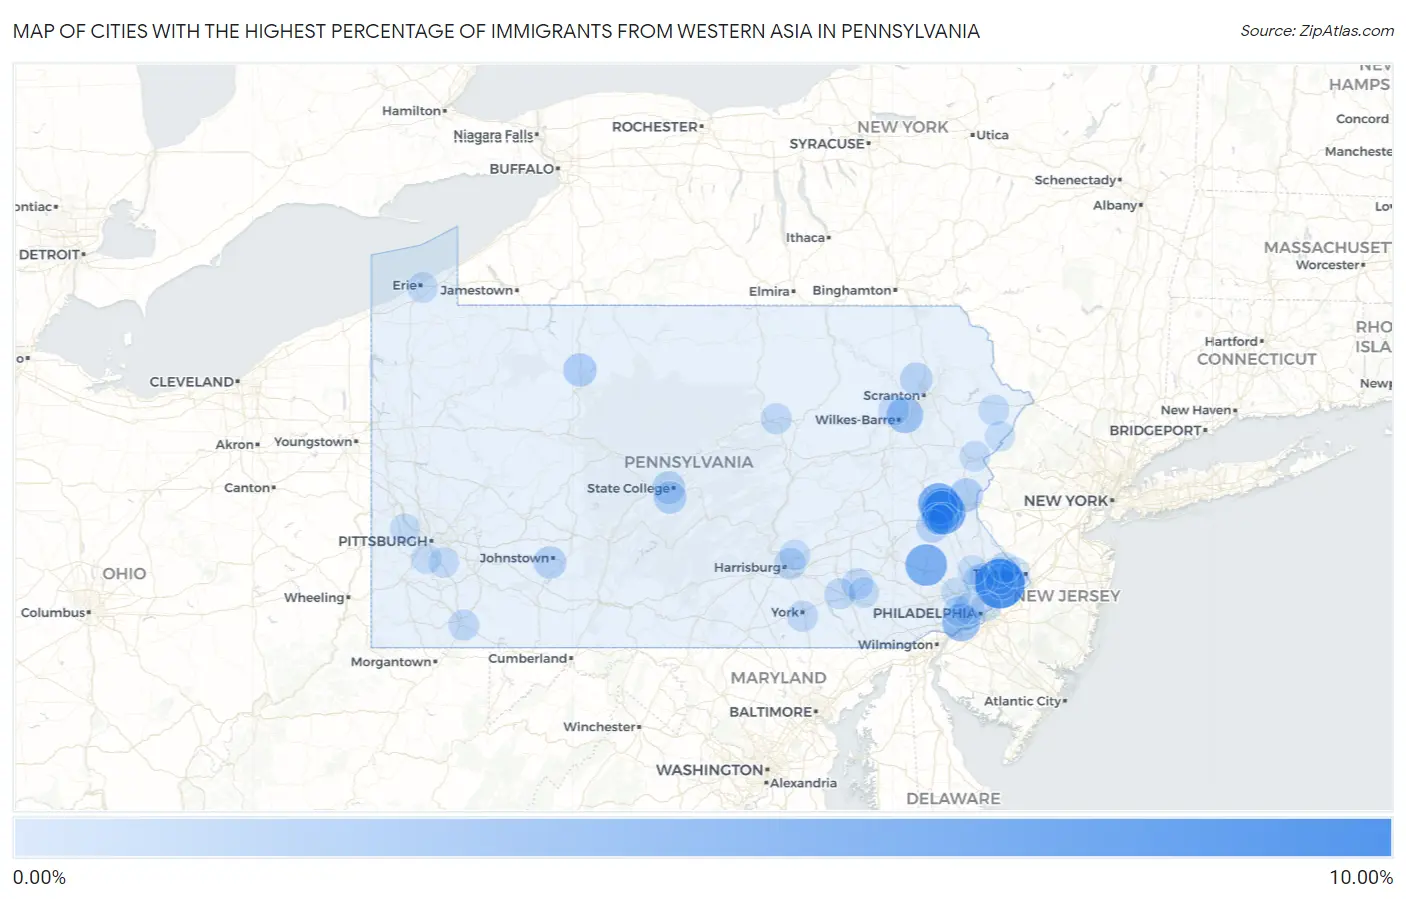
Map of Cities with the Highest Percentage of Immigrants from Western Asia in Pennsylvania
0.00%
10.00%
Cities with the Highest Percentage of Immigrants from Western Asia in Pennsylvania
| City | Western Asia | vs State | vs National | |
| 1. | Feasterville | 9.92% | 0.21%(+9.71)#-1 | 0.36%(+9.56)#0 |
| 2. | Fullerton | 6.92% | 0.21%(+6.71)#0 | 0.36%(+6.56)#1 |
| 3. | Halfway House | 5.94% | 0.21%(+5.73)#1 | 0.36%(+5.58)#2 |
| 4. | Hokendauqua | 5.81% | 0.21%(+5.60)#2 | 0.36%(+5.45)#3 |
| 5. | Egypt | 5.80% | 0.21%(+5.59)#3 | 0.36%(+5.44)#4 |
| 6. | Folsom | 4.09% | 0.21%(+3.88)#4 | 0.36%(+3.73)#5 |
| 7. | Towanda Borough | 3.45% | 0.21%(+3.24)#5 | 0.36%(+3.09)#6 |
| 8. | Hudson | 3.35% | 0.21%(+3.14)#6 | 0.36%(+2.99)#7 |
| 9. | West Pittston Borough | 2.62% | 0.21%(+2.40)#7 | 0.36%(+2.25)#8 |
| 10. | Hamburg Borough | 2.51% | 0.21%(+2.30)#8 | 0.36%(+2.15)#9 |
| 11. | Eastlawn Gardens | 2.04% | 0.21%(+1.82)#9 | 0.36%(+1.67)#10 |
| 12. | Stiles | 2.01% | 0.21%(+1.79)#10 | 0.36%(+1.64)#11 |
| 13. | Wilcox | 1.98% | 0.21%(+1.77)#11 | 0.36%(+1.62)#12 |
| 14. | Wind Gap Borough | 1.68% | 0.21%(+1.46)#12 | 0.36%(+1.31)#13 |
| 15. | Ancient Oaks | 1.64% | 0.21%(+1.43)#13 | 0.36%(+1.28)#14 |
| 16. | Park Forest Village | 1.61% | 0.21%(+1.39)#14 | 0.36%(+1.24)#15 |
| 17. | Pine Grove Mills | 1.59% | 0.21%(+1.38)#15 | 0.36%(+1.23)#16 |
| 18. | Elim | 1.56% | 0.21%(+1.35)#16 | 0.36%(+1.20)#17 |
| 19. | North East Borough | 1.54% | 0.21%(+1.33)#17 | 0.36%(+1.18)#18 |
| 20. | Glenburn | 1.53% | 0.21%(+1.32)#18 | 0.36%(+1.17)#19 |
| 21. | Bala Cynwyd | 1.50% | 0.21%(+1.28)#19 | 0.36%(+1.13)#20 |
| 22. | Frazer | 1.43% | 0.21%(+1.22)#20 | 0.36%(+1.07)#21 |
| 23. | Merion Station | 1.43% | 0.21%(+1.21)#21 | 0.36%(+1.06)#22 |
| 24. | Deer Lake Borough | 1.38% | 0.21%(+1.17)#22 | 0.36%(+1.02)#23 |
| 25. | Jenkintown Borough | 1.30% | 0.21%(+1.08)#23 | 0.36%(+0.933)#24 |
| 26. | Stroudsburg Borough | 1.14% | 0.21%(+0.923)#24 | 0.36%(+0.772)#25 |
| 27. | Harveys Lake Borough | 1.11% | 0.21%(+0.897)#25 | 0.36%(+0.746)#26 |
| 28. | Cetronia | 1.09% | 0.21%(+0.881)#26 | 0.36%(+0.730)#27 |
| 29. | Chestnut Hill | 1.08% | 0.21%(+0.865)#27 | 0.36%(+0.714)#28 |
| 30. | Allentown | 1.07% | 0.21%(+0.853)#28 | 0.36%(+0.703)#29 |
| 31. | Trevose | 1.06% | 0.21%(+0.848)#29 | 0.36%(+0.698)#30 |
| 32. | Penn Wynne | 1.04% | 0.21%(+0.832)#30 | 0.36%(+0.681)#31 |
| 33. | Progress | 1.04% | 0.21%(+0.825)#31 | 0.36%(+0.675)#32 |
| 34. | Downingtown Borough | 0.98% | 0.21%(+0.764)#32 | 0.36%(+0.613)#33 |
| 35. | Indiana Borough | 0.97% | 0.21%(+0.753)#33 | 0.36%(+0.602)#34 |
| 36. | State College Borough | 0.96% | 0.21%(+0.748)#34 | 0.36%(+0.597)#35 |
| 37. | Danville Borough | 0.91% | 0.21%(+0.701)#35 | 0.36%(+0.551)#36 |
| 38. | Rothsville | 0.90% | 0.21%(+0.691)#36 | 0.36%(+0.540)#37 |
| 39. | Kenmar | 0.87% | 0.21%(+0.658)#37 | 0.36%(+0.508)#38 |
| 40. | Montoursville Borough | 0.87% | 0.21%(+0.655)#38 | 0.36%(+0.504)#39 |
| 41. | Grantley | 0.86% | 0.21%(+0.644)#39 | 0.36%(+0.494)#40 |
| 42. | Sewickley Borough | 0.83% | 0.21%(+0.613)#40 | 0.36%(+0.463)#41 |
| 43. | Richlandtown Borough | 0.81% | 0.21%(+0.595)#41 | 0.36%(+0.445)#42 |
| 44. | Whitehall Borough | 0.80% | 0.21%(+0.592)#42 | 0.36%(+0.441)#43 |
| 45. | Landisville | 0.80% | 0.21%(+0.591)#43 | 0.36%(+0.440)#44 |
| 46. | Rosemont | 0.80% | 0.21%(+0.590)#44 | 0.36%(+0.439)#45 |
| 47. | Trucksville | 0.80% | 0.21%(+0.583)#45 | 0.36%(+0.432)#46 |
| 48. | Sharpsburg Borough | 0.78% | 0.21%(+0.571)#46 | 0.36%(+0.420)#47 |
| 49. | Millbourne Borough | 0.77% | 0.21%(+0.559)#47 | 0.36%(+0.408)#48 |
| 50. | Jamestown Borough | 0.77% | 0.21%(+0.556)#48 | 0.36%(+0.406)#49 |
| 51. | White Haven Borough | 0.75% | 0.21%(+0.536)#49 | 0.36%(+0.385)#50 |
| 52. | Phoenixville Borough | 0.75% | 0.21%(+0.535)#50 | 0.36%(+0.384)#51 |
| 53. | Hopwood | 0.74% | 0.21%(+0.532)#51 | 0.36%(+0.381)#52 |
| 54. | Heidelberg Borough | 0.72% | 0.21%(+0.505)#52 | 0.36%(+0.354)#53 |
| 55. | Richboro | 0.72% | 0.21%(+0.503)#53 | 0.36%(+0.352)#54 |
| 56. | Horsham | 0.71% | 0.21%(+0.501)#54 | 0.36%(+0.350)#55 |
| 57. | Hemlock Farms | 0.71% | 0.21%(+0.500)#55 | 0.36%(+0.349)#56 |
| 58. | Churchville | 0.70% | 0.21%(+0.482)#56 | 0.36%(+0.332)#57 |
| 59. | Mechanicsburg Borough | 0.69% | 0.21%(+0.478)#57 | 0.36%(+0.328)#58 |
| 60. | Burgettstown Borough | 0.68% | 0.21%(+0.472)#58 | 0.36%(+0.321)#59 |
| 61. | Erie | 0.68% | 0.21%(+0.469)#59 | 0.36%(+0.319)#60 |
| 62. | Arlington Heights | 0.67% | 0.21%(+0.454)#60 | 0.36%(+0.304)#61 |
| 63. | Leola | 0.67% | 0.21%(+0.454)#61 | 0.36%(+0.303)#62 |
| 64. | Linglestown | 0.66% | 0.21%(+0.450)#62 | 0.36%(+0.299)#63 |
| 65. | Blawnox Borough | 0.65% | 0.21%(+0.440)#63 | 0.36%(+0.289)#64 |
| 66. | East Stroudsburg Borough | 0.64% | 0.21%(+0.429)#64 | 0.36%(+0.278)#65 |
| 67. | Maple Glen | 0.63% | 0.21%(+0.420)#65 | 0.36%(+0.269)#66 |
| 68. | Dallas Borough | 0.63% | 0.21%(+0.418)#66 | 0.36%(+0.267)#67 |
| 69. | Aspinwall Borough | 0.62% | 0.21%(+0.410)#67 | 0.36%(+0.259)#68 |
| 70. | Bridgeport Borough | 0.62% | 0.21%(+0.407)#68 | 0.36%(+0.256)#69 |
| 71. | Mercer Borough | 0.62% | 0.21%(+0.402)#69 | 0.36%(+0.252)#70 |
| 72. | Cheswick Borough | 0.61% | 0.21%(+0.398)#70 | 0.36%(+0.247)#71 |
| 73. | Starrucca Borough | 0.61% | 0.21%(+0.397)#71 | 0.36%(+0.246)#72 |
| 74. | Woodside | 0.60% | 0.21%(+0.390)#72 | 0.36%(+0.239)#73 |
| 75. | Newtown Grant | 0.60% | 0.21%(+0.385)#73 | 0.36%(+0.235)#74 |
| 76. | Catasauqua Borough | 0.58% | 0.21%(+0.371)#74 | 0.36%(+0.220)#75 |
| 77. | Wayne | 0.56% | 0.21%(+0.351)#75 | 0.36%(+0.201)#76 |
| 78. | Macungie Borough | 0.55% | 0.21%(+0.341)#76 | 0.36%(+0.190)#77 |
| 79. | Bethel Park | 0.52% | 0.21%(+0.310)#77 | 0.36%(+0.159)#78 |
| 80. | Clairton | 0.52% | 0.21%(+0.305)#78 | 0.36%(+0.154)#79 |
| 81. | Media Borough | 0.51% | 0.21%(+0.299)#79 | 0.36%(+0.148)#80 |
| 82. | Kutztown Borough | 0.50% | 0.21%(+0.285)#80 | 0.36%(+0.135)#81 |
| 83. | Fountain Hill Borough | 0.50% | 0.21%(+0.285)#81 | 0.36%(+0.134)#82 |
| 84. | Carnot Moon | 0.49% | 0.21%(+0.282)#82 | 0.36%(+0.131)#83 |
| 85. | Hatboro Borough | 0.49% | 0.21%(+0.276)#83 | 0.36%(+0.126)#84 |
| 86. | Penn State Berks | 0.48% | 0.21%(+0.267)#84 | 0.36%(+0.116)#85 |
| 87. | King Of Prussia | 0.48% | 0.21%(+0.266)#85 | 0.36%(+0.115)#86 |
| 88. | Broomall | 0.48% | 0.21%(+0.265)#86 | 0.36%(+0.115)#87 |
| 89. | Emsworth Borough | 0.48% | 0.21%(+0.262)#87 | 0.36%(+0.112)#88 |
| 90. | Pine Ridge | 0.47% | 0.21%(+0.254)#88 | 0.36%(+0.104)#89 |
| 91. | Dorneyville | 0.45% | 0.21%(+0.239)#89 | 0.36%(+0.088)#90 |
| 92. | Vintondale Borough | 0.44% | 0.21%(+0.227)#90 | 0.36%(+0.076)#91 |
| 93. | Roslyn | 0.43% | 0.21%(+0.217)#91 | 0.36%(+0.066)#92 |
| 94. | Philadelphia | 0.42% | 0.21%(+0.203)#92 | 0.36%(+0.052)#93 |
| 95. | Malvern Borough | 0.41% | 0.21%(+0.200)#93 | 0.36%(+0.049)#94 |
| 96. | Montgomeryville | 0.40% | 0.21%(+0.187)#94 | 0.36%(+0.036)#95 |
| 97. | Brookhaven Borough | 0.40% | 0.21%(+0.186)#95 | 0.36%(+0.035)#96 |
| 98. | Silverdale Borough | 0.39% | 0.21%(+0.178)#96 | 0.36%(+0.027)#97 |
| 99. | Unionville Borough | 0.39% | 0.21%(+0.178)#97 | 0.36%(+0.027)#98 |
| 100. | Elizabethtown Borough | 0.39% | 0.21%(+0.177)#98 | 0.36%(+0.026)#99 |
Common Questions
What are the Top 10 Cities with the Highest Percentage of Immigrants from Western Asia in Pennsylvania?
Top 10 Cities with the Highest Percentage of Immigrants from Western Asia in Pennsylvania are:
#1
9.92%
#2
6.92%
#3
5.94%
#4
5.81%
#5
5.80%
#6
4.09%
#7
3.35%
#8
2.04%
#9
2.01%
#10
1.98%
What city has the Highest Percentage of Immigrants from Western Asia in Pennsylvania?
Feasterville has the Highest Percentage of Immigrants from Western Asia in Pennsylvania with 9.92%.
What is the Percentage of Immigrants from Western Asia in the State of Pennsylvania?
Percentage of Immigrants from Western Asia in Pennsylvania is 0.21%.
What is the Percentage of Immigrants from Western Asia in the United States?
Percentage of Immigrants from Western Asia in the United States is 0.36%.