Cities with the Highest Percentage of Population Employed in Material Moving in Pennsylvania
RELATED REPORTS & OPTIONS
Material Moving
Pennsylvania
Compare Cities
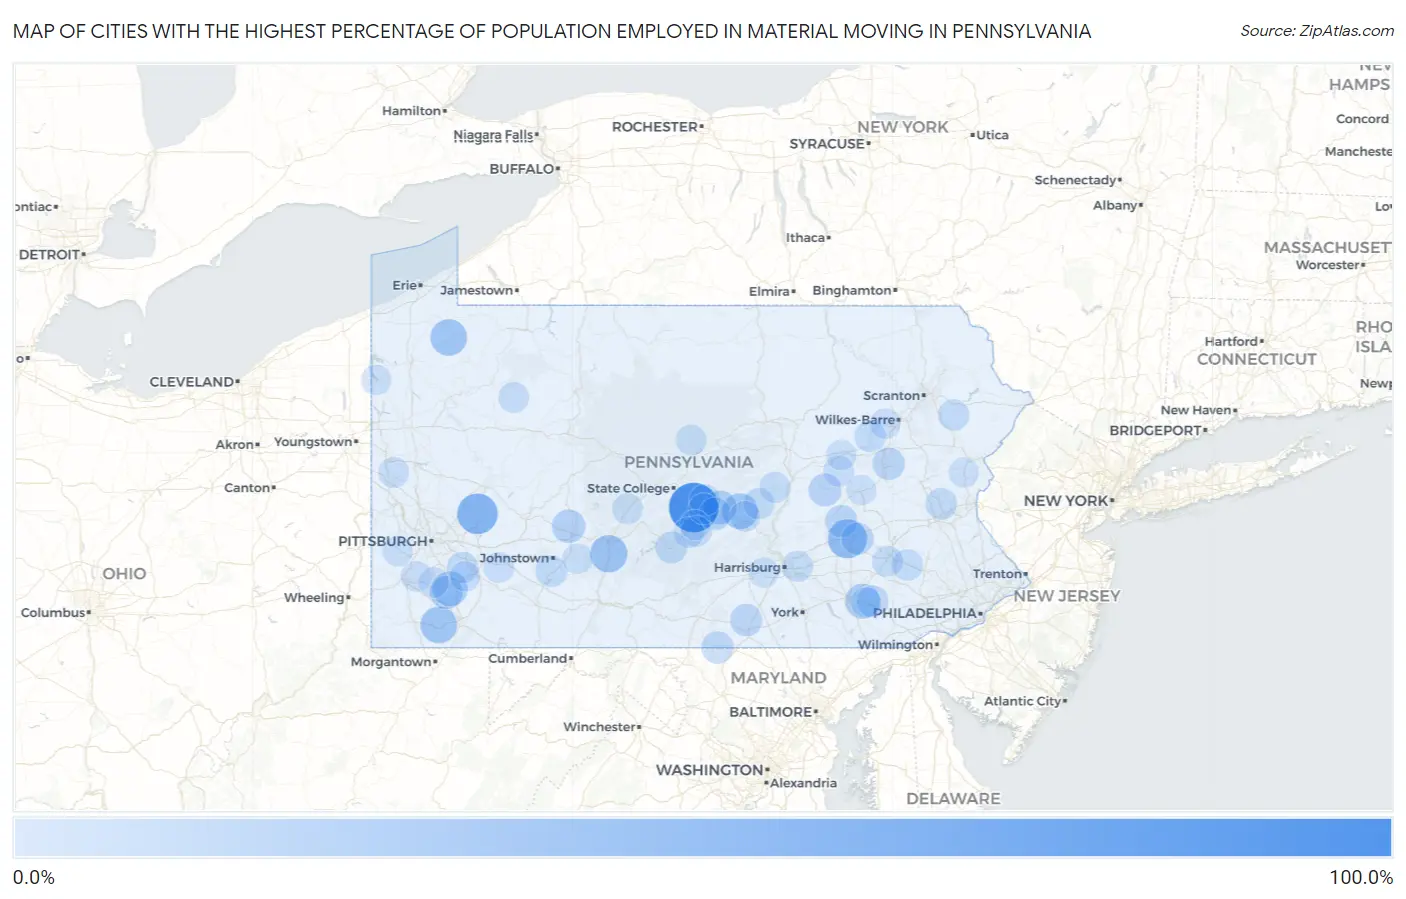
Map of Cities with the Highest Percentage of Population Employed in Material Moving in Pennsylvania
0.0%
100.0%
Cities with the Highest Percentage of Population Employed in Material Moving in Pennsylvania
| City | % Employed | vs State | vs National | |
| 1. | Barrville | 100.0% | 4.6%(+95.4)#1 | 3.8%(+96.2)#15 |
| 2. | Kiskimere | 60.0% | 4.6%(+55.4)#2 | 3.8%(+56.2)#67 |
| 3. | East Sharpsburg | 55.7% | 4.6%(+51.1)#3 | 3.8%(+51.9)#80 |
| 4. | Frystown | 53.3% | 4.6%(+48.8)#4 | 3.8%(+49.5)#89 |
| 5. | East Freedom | 45.5% | 4.6%(+41.0)#5 | 3.8%(+41.7)#118 |
| 6. | Nemacolin | 42.8% | 4.6%(+38.2)#6 | 3.8%(+38.9)#138 |
| 7. | Lincolnville | 42.3% | 4.6%(+37.7)#7 | 3.8%(+38.5)#142 |
| 8. | Mcalisterville | 40.0% | 4.6%(+35.4)#8 | 3.8%(+36.2)#162 |
| 9. | Smoketown | 35.9% | 4.6%(+31.3)#9 | 3.8%(+32.0)#208 |
| 10. | Arnold City | 35.8% | 4.6%(+31.3)#10 | 3.8%(+32.0)#209 |
| 11. | Dixonville | 33.5% | 4.6%(+29.0)#11 | 3.8%(+29.7)#238 |
| 12. | Benson Borough | 32.8% | 4.6%(+28.3)#12 | 3.8%(+29.0)#257 |
| 13. | Alfarata | 31.1% | 4.6%(+26.6)#13 | 3.8%(+27.3)#286 |
| 14. | Newville Borough | 30.9% | 4.6%(+26.4)#14 | 3.8%(+27.1)#289 |
| 15. | Elgin Borough | 29.4% | 4.6%(+24.9)#15 | 3.8%(+25.6)#320 |
| 16. | Colver | 29.3% | 4.6%(+24.8)#16 | 3.8%(+25.5)#321 |
| 17. | Allenport | 28.5% | 4.6%(+24.0)#17 | 3.8%(+24.7)#341 |
| 18. | Larke | 27.8% | 4.6%(+23.2)#18 | 3.8%(+23.9)#361 |
| 19. | Forksville Borough | 27.1% | 4.6%(+22.5)#19 | 3.8%(+23.3)#379 |
| 20. | Marshallton | 26.6% | 4.6%(+22.0)#20 | 3.8%(+22.7)#391 |
| 21. | Maitland | 25.1% | 4.6%(+20.6)#21 | 3.8%(+21.3)#435 |
| 22. | Ravine | 25.0% | 4.6%(+20.4)#22 | 3.8%(+21.2)#436 |
| 23. | Maxatawny | 25.0% | 4.6%(+20.4)#23 | 3.8%(+21.2)#447 |
| 24. | Mckee | 24.9% | 4.6%(+20.3)#24 | 3.8%(+21.0)#457 |
| 25. | Hazleton | 24.7% | 4.6%(+20.1)#25 | 3.8%(+20.9)#461 |
| 26. | Table Rock | 24.5% | 4.6%(+19.9)#26 | 3.8%(+20.7)#465 |
| 27. | Rehrersburg | 24.4% | 4.6%(+19.9)#27 | 3.8%(+20.6)#469 |
| 28. | Blue Ridge Summit | 24.1% | 4.6%(+19.5)#28 | 3.8%(+20.3)#486 |
| 29. | Hopewell Borough | 22.4% | 4.6%(+17.9)#29 | 3.8%(+18.6)#570 |
| 30. | South Heights Borough | 22.4% | 4.6%(+17.9)#30 | 3.8%(+18.6)#571 |
| 31. | Cedar Crest | 22.2% | 4.6%(+17.7)#31 | 3.8%(+18.4)#581 |
| 32. | Intercourse | 22.0% | 4.6%(+17.4)#32 | 3.8%(+18.2)#592 |
| 33. | Davidsville | 21.8% | 4.6%(+17.2)#33 | 3.8%(+17.9)#608 |
| 34. | Utica Borough | 21.7% | 4.6%(+17.1)#34 | 3.8%(+17.8)#616 |
| 35. | Cementon | 21.2% | 4.6%(+16.6)#35 | 3.8%(+17.3)#644 |
| 36. | Parryville Borough | 21.1% | 4.6%(+16.5)#36 | 3.8%(+17.2)#651 |
| 37. | Mocanaqua | 21.1% | 4.6%(+16.5)#37 | 3.8%(+17.2)#653 |
| 38. | Herminie | 20.6% | 4.6%(+16.0)#38 | 3.8%(+16.7)#688 |
| 39. | Pocono Springs | 20.5% | 4.6%(+16.0)#39 | 3.8%(+16.7)#691 |
| 40. | Baumstown | 20.3% | 4.6%(+15.8)#40 | 3.8%(+16.5)#704 |
| 41. | Landisburg Borough | 20.3% | 4.6%(+15.8)#41 | 3.8%(+16.5)#706 |
| 42. | Milroy | 20.3% | 4.6%(+15.7)#42 | 3.8%(+16.5)#707 |
| 43. | Richfield | 20.0% | 4.6%(+15.4)#43 | 3.8%(+16.2)#721 |
| 44. | York Springs Borough | 20.0% | 4.6%(+15.4)#44 | 3.8%(+16.1)#734 |
| 45. | Shickshinny Borough | 19.9% | 4.6%(+15.3)#45 | 3.8%(+16.0)#737 |
| 46. | New Paris Borough | 19.8% | 4.6%(+15.3)#46 | 3.8%(+16.0)#739 |
| 47. | Rutherford | 19.8% | 4.6%(+15.3)#47 | 3.8%(+16.0)#740 |
| 48. | Kreamer | 19.7% | 4.6%(+15.1)#48 | 3.8%(+15.9)#748 |
| 49. | Shenandoah Borough | 19.2% | 4.6%(+14.6)#49 | 3.8%(+15.3)#784 |
| 50. | Montrose Manor | 19.2% | 4.6%(+14.6)#50 | 3.8%(+15.3)#786 |
| 51. | Auburn Borough | 19.1% | 4.6%(+14.5)#51 | 3.8%(+15.2)#794 |
| 52. | Coalport Borough | 18.9% | 4.6%(+14.4)#52 | 3.8%(+15.1)#806 |
| 53. | Longfellow | 18.9% | 4.6%(+14.4)#53 | 3.8%(+15.1)#807 |
| 54. | Mill Village Borough | 18.8% | 4.6%(+14.3)#54 | 3.8%(+15.0)#817 |
| 55. | Mattawana | 18.7% | 4.6%(+14.2)#55 | 3.8%(+14.9)#828 |
| 56. | Slabtown | 18.6% | 4.6%(+14.0)#56 | 3.8%(+14.7)#849 |
| 57. | Mifflin Borough | 18.5% | 4.6%(+13.9)#57 | 3.8%(+14.6)#856 |
| 58. | Crown | 18.4% | 4.6%(+13.9)#58 | 3.8%(+14.6)#860 |
| 59. | Tioga Borough | 18.4% | 4.6%(+13.8)#59 | 3.8%(+14.5)#868 |
| 60. | Chewton | 18.2% | 4.6%(+13.7)#60 | 3.8%(+14.4)#877 |
| 61. | Watsontown Borough | 18.2% | 4.6%(+13.6)#61 | 3.8%(+14.4)#881 |
| 62. | Lumber City | 18.2% | 4.6%(+13.6)#62 | 3.8%(+14.4)#885 |
| 63. | Moose Run | 18.2% | 4.6%(+13.6)#63 | 3.8%(+14.4)#886 |
| 64. | Monument | 18.2% | 4.6%(+13.6)#64 | 3.8%(+14.4)#891 |
| 65. | Coalmont Borough | 18.2% | 4.6%(+13.6)#65 | 3.8%(+14.4)#892 |
| 66. | Grazierville | 18.0% | 4.6%(+13.4)#66 | 3.8%(+14.2)#911 |
| 67. | East Salem | 17.6% | 4.6%(+13.1)#67 | 3.8%(+13.8)#945 |
| 68. | Sproul | 17.6% | 4.6%(+13.0)#68 | 3.8%(+13.8)#953 |
| 69. | West Sunbury Borough | 17.5% | 4.6%(+13.0)#69 | 3.8%(+13.7)#966 |
| 70. | Wylandville | 17.5% | 4.6%(+13.0)#70 | 3.8%(+13.7)#969 |
| 71. | Hostetter | 17.3% | 4.6%(+12.8)#71 | 3.8%(+13.5)#997 |
| 72. | Mill Creek Borough | 17.3% | 4.6%(+12.8)#72 | 3.8%(+13.5)#998 |
| 73. | Van Voorhis | 17.3% | 4.6%(+12.7)#73 | 3.8%(+13.5)#1,000 |
| 74. | Hamorton | 17.2% | 4.6%(+12.7)#74 | 3.8%(+13.4)#1,003 |
| 75. | Cassville Borough | 17.2% | 4.6%(+12.6)#75 | 3.8%(+13.4)#1,014 |
| 76. | Chapman Borough | 17.1% | 4.6%(+12.6)#76 | 3.8%(+13.3)#1,018 |
| 77. | Womelsdorf Borough | 17.1% | 4.6%(+12.5)#77 | 3.8%(+13.2)#1,033 |
| 78. | West Nanticoke | 16.7% | 4.6%(+12.1)#78 | 3.8%(+12.8)#1,072 |
| 79. | New Washington Borough | 16.7% | 4.6%(+12.1)#79 | 3.8%(+12.8)#1,094 |
| 80. | Midway | 16.6% | 4.6%(+12.0)#80 | 3.8%(+12.7)#1,107 |
| 81. | Pymatuning South | 16.5% | 4.6%(+11.9)#81 | 3.8%(+12.7)#1,114 |
| 82. | Beaverdale | 16.5% | 4.6%(+11.9)#82 | 3.8%(+12.6)#1,117 |
| 83. | Wyano | 16.4% | 4.6%(+11.8)#83 | 3.8%(+12.6)#1,126 |
| 84. | Almedia | 16.3% | 4.6%(+11.8)#84 | 3.8%(+12.5)#1,135 |
| 85. | Goldsboro Borough | 16.3% | 4.6%(+11.8)#85 | 3.8%(+12.5)#1,138 |
| 86. | Mount Wolf Borough | 16.1% | 4.6%(+11.5)#86 | 3.8%(+12.2)#1,184 |
| 87. | Laureldale Borough | 16.0% | 4.6%(+11.5)#87 | 3.8%(+12.2)#1,186 |
| 88. | Newburg Borough Clearfield County | 16.0% | 4.6%(+11.4)#88 | 3.8%(+12.2)#1,192 |
| 89. | Strodes Mills | 16.0% | 4.6%(+11.4)#89 | 3.8%(+12.1)#1,197 |
| 90. | Avis Borough | 15.9% | 4.6%(+11.4)#90 | 3.8%(+12.1)#1,200 |
| 91. | Altamont | 15.9% | 4.6%(+11.4)#91 | 3.8%(+12.1)#1,204 |
| 92. | Ronks | 15.9% | 4.6%(+11.3)#92 | 3.8%(+12.1)#1,211 |
| 93. | Saylorsburg | 15.9% | 4.6%(+11.3)#93 | 3.8%(+12.0)#1,214 |
| 94. | Belle Vernon Borough | 15.8% | 4.6%(+11.2)#94 | 3.8%(+12.0)#1,222 |
| 95. | Thompson Borough | 15.7% | 4.6%(+11.2)#95 | 3.8%(+11.9)#1,237 |
| 96. | West York Borough | 15.7% | 4.6%(+11.1)#96 | 3.8%(+11.8)#1,249 |
| 97. | Mifflintown Borough | 15.6% | 4.6%(+11.0)#97 | 3.8%(+11.7)#1,265 |
| 98. | Marianna Borough | 15.6% | 4.6%(+11.0)#98 | 3.8%(+11.7)#1,267 |
| 99. | New Kingstown | 15.5% | 4.6%(+11.0)#99 | 3.8%(+11.7)#1,272 |
| 100. | Portland Borough | 15.5% | 4.6%(+10.9)#100 | 3.8%(+11.7)#1,283 |
Common Questions
What are the Top 10 Cities with the Highest Percentage of Population Employed in Material Moving in Pennsylvania?
Top 10 Cities with the Highest Percentage of Population Employed in Material Moving in Pennsylvania are:
#1
100.0%
#2
60.0%
#3
53.3%
#4
45.5%
#5
42.8%
#6
42.3%
#7
40.0%
#8
35.9%
#9
35.8%
#10
31.1%
What city has the Highest Percentage of Population Employed in Material Moving in Pennsylvania?
Barrville has the Highest Percentage of Population Employed in Material Moving in Pennsylvania with 100.0%.
What is the Percentage of Population Employed in Material Moving in the State of Pennsylvania?
Percentage of Population Employed in Material Moving in Pennsylvania is 4.6%.
What is the Percentage of Population Employed in Material Moving in the United States?
Percentage of Population Employed in Material Moving in the United States is 3.8%.