Cities with the Most Immigrants from Eastern Asia in Pennsylvania
RELATED REPORTS & OPTIONS
Eastern Asia
Pennsylvania
Compare Cities
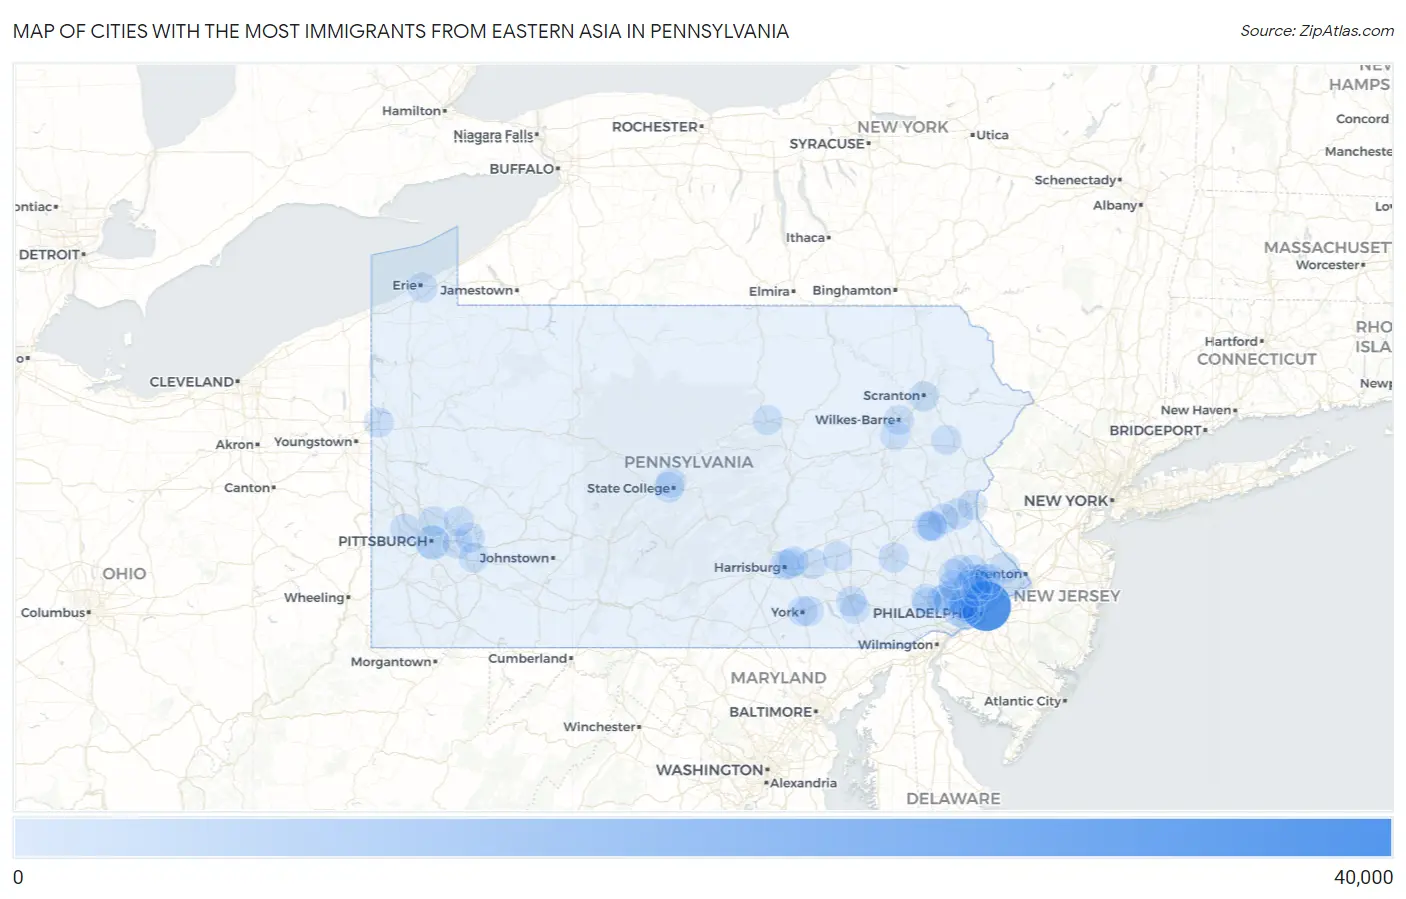
Map of Cities with the Most Immigrants from Eastern Asia in Pennsylvania
0
40,000
Cities with the Most Immigrants from Eastern Asia in Pennsylvania
| City | Eastern Asia | vs State | vs National | |
| 1. | Philadelphia | 31,342 | 109,418(28.64%)#1 | 4,223,726(0.74%)#11 |
| 2. | Pittsburgh | 5,937 | 109,418(5.43%)#2 | 4,223,726(0.14%)#92 |
| 3. | State College Borough | 2,165 | 109,418(1.98%)#3 | 4,223,726(0.05%)#265 |
| 4. | Bethlehem | 1,143 | 109,418(1.04%)#4 | 4,223,726(0.03%)#487 |
| 5. | Allentown | 711 | 109,418(0.65%)#5 | 4,223,726(0.02%)#703 |
| 6. | King Of Prussia | 663 | 109,418(0.61%)#6 | 4,223,726(0.02%)#745 |
| 7. | Park Forest Village | 586 | 109,418(0.54%)#7 | 4,223,726(0.01%)#839 |
| 8. | Lancaster | 572 | 109,418(0.52%)#8 | 4,223,726(0.01%)#856 |
| 9. | Franklin Park Borough | 552 | 109,418(0.50%)#9 | 4,223,726(0.01%)#885 |
| 10. | Montgomeryville | 514 | 109,418(0.47%)#10 | 4,223,726(0.01%)#929 |
| 11. | Kulpsville | 398 | 109,418(0.36%)#11 | 4,223,726(0.01%)#1,119 |
| 12. | Chesterbrook | 386 | 109,418(0.35%)#12 | 4,223,726(0.01%)#1,147 |
| 13. | Morgan Hill | 385 | 109,418(0.35%)#13 | 4,223,726(0.01%)#1,148 |
| 14. | Broomall | 370 | 109,418(0.34%)#14 | 4,223,726(0.01%)#1,189 |
| 15. | Maple Glen | 368 | 109,418(0.34%)#15 | 4,223,726(0.01%)#1,196 |
| 16. | Horsham | 367 | 109,418(0.34%)#16 | 4,223,726(0.01%)#1,200 |
| 17. | Phoenixville Borough | 364 | 109,418(0.33%)#17 | 4,223,726(0.01%)#1,205 |
| 18. | Penn Wynne | 346 | 109,418(0.32%)#18 | 4,223,726(0.01%)#1,262 |
| 19. | Aspinwall Borough | 343 | 109,418(0.31%)#19 | 4,223,726(0.01%)#1,271 |
| 20. | Swarthmore Borough | 331 | 109,418(0.30%)#20 | 4,223,726(0.01%)#1,307 |
| 21. | Spring House | 331 | 109,418(0.30%)#21 | 4,223,726(0.01%)#1,308 |
| 22. | Ardmore | 310 | 109,418(0.28%)#22 | 4,223,726(0.01%)#1,368 |
| 23. | Scranton | 303 | 109,418(0.28%)#23 | 4,223,726(0.01%)#1,382 |
| 24. | Paoli | 287 | 109,418(0.26%)#24 | 4,223,726(0.01%)#1,438 |
| 25. | Willow Grove | 272 | 109,418(0.25%)#25 | 4,223,726(0.01%)#1,490 |
| 26. | Reading | 266 | 109,418(0.24%)#26 | 4,223,726(0.01%)#1,505 |
| 27. | Blue Bell | 245 | 109,418(0.22%)#27 | 4,223,726(0.01%)#1,600 |
| 28. | Lansdale Borough | 244 | 109,418(0.22%)#28 | 4,223,726(0.01%)#1,605 |
| 29. | Allison Park | 242 | 109,418(0.22%)#29 | 4,223,726(0.01%)#1,610 |
| 30. | Fort Washington | 241 | 109,418(0.22%)#30 | 4,223,726(0.01%)#1,616 |
| 31. | Drexel Hill | 238 | 109,418(0.22%)#31 | 4,223,726(0.01%)#1,629 |
| 32. | Willow Street | 232 | 109,418(0.21%)#32 | 4,223,726(0.01%)#1,657 |
| 33. | Rosemont | 230 | 109,418(0.21%)#33 | 4,223,726(0.01%)#1,670 |
| 34. | Lionville | 224 | 109,418(0.20%)#34 | 4,223,726(0.01%)#1,702 |
| 35. | Toftrees | 219 | 109,418(0.20%)#35 | 4,223,726(0.01%)#1,727 |
| 36. | Hershey | 218 | 109,418(0.20%)#36 | 4,223,726(0.01%)#1,732 |
| 37. | Narberth Borough | 211 | 109,418(0.19%)#37 | 4,223,726(0.00%)#1,774 |
| 38. | Easton | 210 | 109,418(0.19%)#38 | 4,223,726(0.00%)#1,777 |
| 39. | Bala Cynwyd | 199 | 109,418(0.18%)#39 | 4,223,726(0.00%)#1,837 |
| 40. | Eagleville Cdp Montgomery County | 199 | 109,418(0.18%)#40 | 4,223,726(0.00%)#1,839 |
| 41. | Carlisle Borough | 198 | 109,418(0.18%)#41 | 4,223,726(0.00%)#1,842 |
| 42. | Berwyn | 193 | 109,418(0.18%)#42 | 4,223,726(0.00%)#1,876 |
| 43. | St. Davids | 190 | 109,418(0.17%)#43 | 4,223,726(0.00%)#1,895 |
| 44. | Wilkinsburg Borough | 189 | 109,418(0.17%)#44 | 4,223,726(0.00%)#1,898 |
| 45. | Hatboro Borough | 185 | 109,418(0.17%)#45 | 4,223,726(0.00%)#1,920 |
| 46. | Erie | 184 | 109,418(0.17%)#46 | 4,223,726(0.00%)#1,921 |
| 47. | Fox Chapel Borough | 181 | 109,418(0.17%)#47 | 4,223,726(0.00%)#1,943 |
| 48. | Carnot Moon | 177 | 109,418(0.16%)#48 | 4,223,726(0.00%)#1,975 |
| 49. | Stroudsburg Borough | 175 | 109,418(0.16%)#49 | 4,223,726(0.00%)#1,989 |
| 50. | Breinigsville | 173 | 109,418(0.16%)#50 | 4,223,726(0.00%)#2,005 |
| 51. | Norristown Borough | 171 | 109,418(0.16%)#51 | 4,223,726(0.00%)#2,022 |
| 52. | Bryn Mawr | 169 | 109,418(0.15%)#52 | 4,223,726(0.00%)#2,036 |
| 53. | Malvern Borough | 166 | 109,418(0.15%)#53 | 4,223,726(0.00%)#2,064 |
| 54. | Newtown Grant | 161 | 109,418(0.15%)#54 | 4,223,726(0.00%)#2,100 |
| 55. | Elkins Park | 159 | 109,418(0.15%)#55 | 4,223,726(0.00%)#2,113 |
| 56. | Exton | 159 | 109,418(0.15%)#56 | 4,223,726(0.00%)#2,115 |
| 57. | Monroeville | 157 | 109,418(0.14%)#57 | 4,223,726(0.00%)#2,131 |
| 58. | Jefferson Hills Borough | 156 | 109,418(0.14%)#58 | 4,223,726(0.00%)#2,146 |
| 59. | Millersville Borough | 151 | 109,418(0.14%)#59 | 4,223,726(0.00%)#2,201 |
| 60. | Castle Shannon Borough | 150 | 109,418(0.14%)#60 | 4,223,726(0.00%)#2,210 |
| 61. | Trooper | 149 | 109,418(0.14%)#61 | 4,223,726(0.00%)#2,219 |
| 62. | Emmaus Borough | 148 | 109,418(0.14%)#62 | 4,223,726(0.00%)#2,225 |
| 63. | Skippack | 138 | 109,418(0.13%)#63 | 4,223,726(0.00%)#2,317 |
| 64. | Villanova | 136 | 109,418(0.12%)#64 | 4,223,726(0.00%)#2,339 |
| 65. | Media Borough | 135 | 109,418(0.12%)#65 | 4,223,726(0.00%)#2,347 |
| 66. | Wayne | 134 | 109,418(0.12%)#66 | 4,223,726(0.00%)#2,356 |
| 67. | Flourtown | 134 | 109,418(0.12%)#67 | 4,223,726(0.00%)#2,360 |
| 68. | Progress | 132 | 109,418(0.12%)#68 | 4,223,726(0.00%)#2,374 |
| 69. | Murrysville | 124 | 109,418(0.11%)#69 | 4,223,726(0.00%)#2,449 |
| 70. | Harrisburg | 118 | 109,418(0.11%)#70 | 4,223,726(0.00%)#2,505 |
| 71. | Trexlertown | 118 | 109,418(0.11%)#71 | 4,223,726(0.00%)#2,510 |
| 72. | Wilkes Barre | 113 | 109,418(0.10%)#72 | 4,223,726(0.00%)#2,559 |
| 73. | New Kensington | 113 | 109,418(0.10%)#73 | 4,223,726(0.00%)#2,570 |
| 74. | Warminster Heights | 112 | 109,418(0.10%)#74 | 4,223,726(0.00%)#2,594 |
| 75. | Lansdowne Borough | 109 | 109,418(0.10%)#75 | 4,223,726(0.00%)#2,628 |
| 76. | Merion Station | 109 | 109,418(0.10%)#76 | 4,223,726(0.00%)#2,630 |
| 77. | Ambler Borough | 108 | 109,418(0.10%)#77 | 4,223,726(0.00%)#2,645 |
| 78. | Penn Farms | 108 | 109,418(0.10%)#78 | 4,223,726(0.00%)#2,648 |
| 79. | Wesleyville Borough | 105 | 109,418(0.10%)#79 | 4,223,726(0.00%)#2,687 |
| 80. | West Chester Borough | 104 | 109,418(0.10%)#80 | 4,223,726(0.00%)#2,698 |
| 81. | Middletown Borough | 103 | 109,418(0.09%)#81 | 4,223,726(0.00%)#2,715 |
| 82. | Mountain Top | 101 | 109,418(0.09%)#82 | 4,223,726(0.00%)#2,746 |
| 83. | Colonial Park | 96 | 109,418(0.09%)#83 | 4,223,726(0.00%)#2,813 |
| 84. | Chambersburg Borough | 95 | 109,418(0.09%)#84 | 4,223,726(0.00%)#2,826 |
| 85. | Ancient Oaks | 94 | 109,418(0.09%)#85 | 4,223,726(0.00%)#2,855 |
| 86. | East York | 91 | 109,418(0.08%)#86 | 4,223,726(0.00%)#2,906 |
| 87. | Williamsport | 90 | 109,418(0.08%)#87 | 4,223,726(0.00%)#2,914 |
| 88. | West Mifflin Borough | 90 | 109,418(0.08%)#88 | 4,223,726(0.00%)#2,919 |
| 89. | Levittown | 89 | 109,418(0.08%)#89 | 4,223,726(0.00%)#2,926 |
| 90. | Munhall Borough | 89 | 109,418(0.08%)#90 | 4,223,726(0.00%)#2,940 |
| 91. | York | 88 | 109,418(0.08%)#91 | 4,223,726(0.00%)#2,950 |
| 92. | Hermitage | 88 | 109,418(0.08%)#92 | 4,223,726(0.00%)#2,959 |
| 93. | Lebanon | 86 | 109,418(0.08%)#93 | 4,223,726(0.00%)#2,994 |
| 94. | Elizabethtown Borough | 83 | 109,418(0.08%)#94 | 4,223,726(0.00%)#3,043 |
| 95. | Northampton Borough | 83 | 109,418(0.08%)#95 | 4,223,726(0.00%)#3,045 |
| 96. | Pocono Pines | 83 | 109,418(0.08%)#96 | 4,223,726(0.00%)#3,052 |
| 97. | Wyomissing Borough | 81 | 109,418(0.07%)#97 | 4,223,726(0.00%)#3,085 |
| 98. | Jeannette | 80 | 109,418(0.07%)#98 | 4,223,726(0.00%)#3,108 |
| 99. | West Reading Borough | 80 | 109,418(0.07%)#99 | 4,223,726(0.00%)#3,114 |
| 100. | Palmyra Borough | 79 | 109,418(0.07%)#100 | 4,223,726(0.00%)#3,133 |
Common Questions
What are the Top 10 Cities with the Most Immigrants from Eastern Asia in Pennsylvania?
Top 10 Cities with the Most Immigrants from Eastern Asia in Pennsylvania are:
#1
31,342
#2
5,937
#3
1,143
#4
711
#5
663
#6
586
#7
572
#8
514
#9
398
#10
386
What city has the Most Immigrants from Eastern Asia in Pennsylvania?
Philadelphia has the Most Immigrants from Eastern Asia in Pennsylvania with 31,342.
What is the Total Immigrants from Eastern Asia in the State of Pennsylvania?
Total Immigrants from Eastern Asia in Pennsylvania is 109,418.
What is the Total Immigrants from Eastern Asia in the United States?
Total Immigrants from Eastern Asia in the United States is 4,223,726.