Cities with the Highest Percentage of Scottish Population in Pennsylvania
RELATED REPORTS & OPTIONS
Scottish
Pennsylvania
Compare Cities
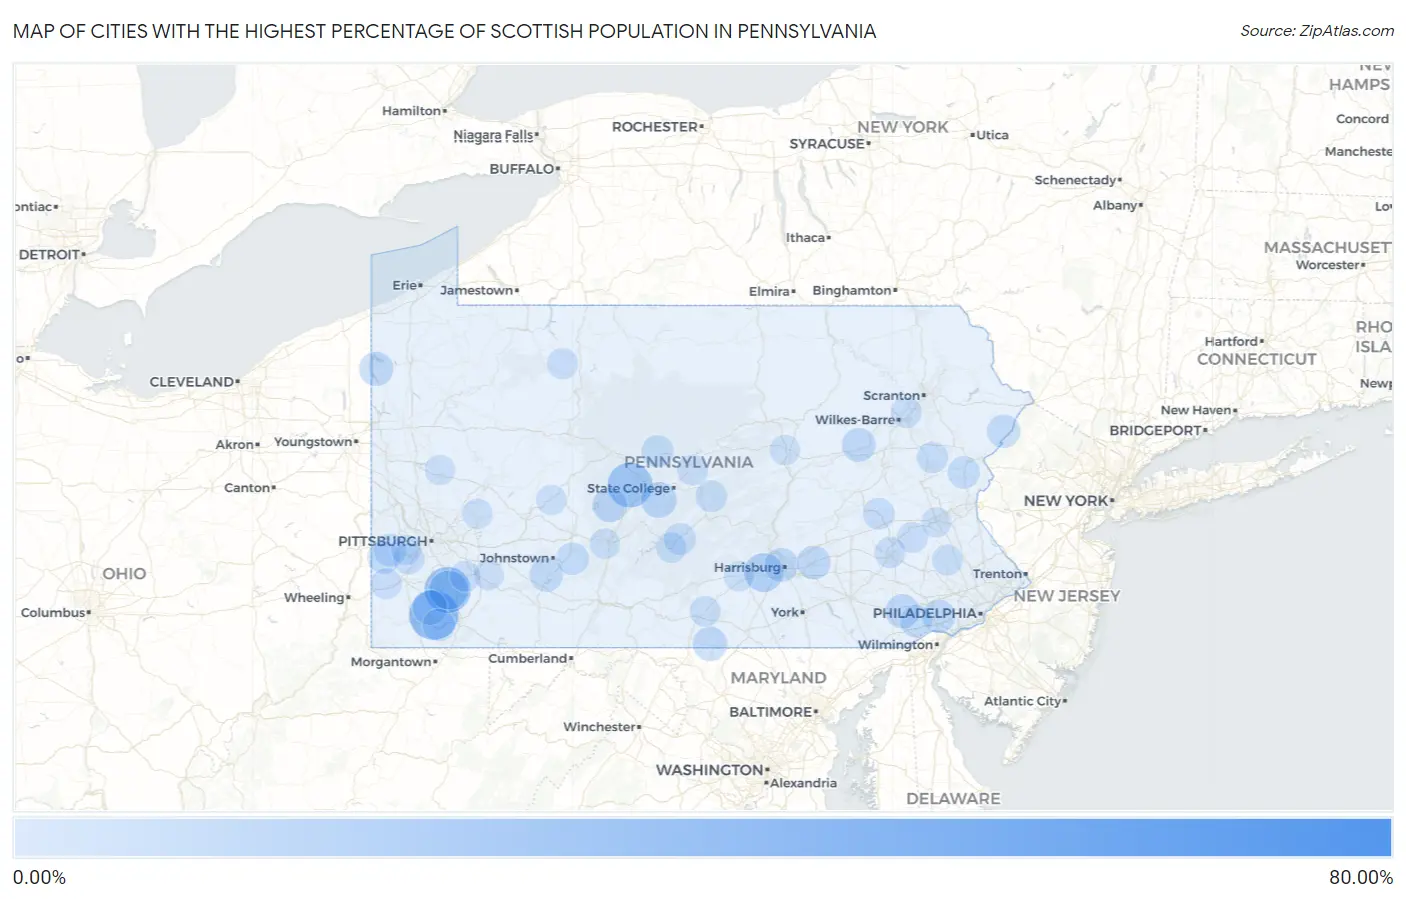
Map of Cities with the Highest Percentage of Scottish Population in Pennsylvania
0.00%
80.00%
Cities with the Highest Percentage of Scottish Population in Pennsylvania
| City | Scottish | vs State | vs National | |
| 1. | Roots | 74.02% | 1.42%(+72.6)#1 | 1.58%(+72.4)#5 |
| 2. | Crucible | 34.06% | 1.42%(+32.6)#2 | 1.58%(+32.5)#52 |
| 3. | Naomi | 29.07% | 1.42%(+27.7)#3 | 1.58%(+27.5)#74 |
| 4. | Sandy Ridge | 27.13% | 1.42%(+25.7)#4 | 1.58%(+25.6)#83 |
| 5. | Canoe Creek | 26.42% | 1.42%(+25.0)#5 | 1.58%(+24.8)#88 |
| 6. | Driftwood Borough | 20.00% | 1.42%(+18.6)#6 | 1.58%(+18.4)#150 |
| 7. | Friesville | 18.65% | 1.42%(+17.2)#7 | 1.58%(+17.1)#176 |
| 8. | Fairhope | 18.03% | 1.42%(+16.6)#8 | 1.58%(+16.5)#193 |
| 9. | New Kingstown | 17.90% | 1.42%(+16.5)#9 | 1.58%(+16.3)#196 |
| 10. | Elgin Borough | 13.36% | 1.42%(+11.9)#10 | 1.58%(+11.8)#329 |
| 11. | Baileyville | 12.93% | 1.42%(+11.5)#11 | 1.58%(+11.4)#356 |
| 12. | Woolrich | 11.86% | 1.42%(+10.4)#12 | 1.58%(+10.3)#438 |
| 13. | Millsboro | 11.61% | 1.42%(+10.2)#13 | 1.58%(+10.0)#453 |
| 14. | Blandburg | 11.43% | 1.42%(+10.0)#14 | 1.58%(+9.85)#468 |
| 15. | Westwood | 11.03% | 1.42%(+9.62)#15 | 1.58%(+9.46)#496 |
| 16. | Wayne Heights | 10.90% | 1.42%(+9.48)#16 | 1.58%(+9.32)#506 |
| 17. | West Fairview | 10.80% | 1.42%(+9.38)#17 | 1.58%(+9.22)#512 |
| 18. | Pymatuning Central | 10.80% | 1.42%(+9.38)#18 | 1.58%(+9.22)#516 |
| 19. | Factoryville Borough | 10.54% | 1.42%(+9.12)#19 | 1.58%(+8.96)#540 |
| 20. | Foundryville | 10.42% | 1.42%(+9.00)#20 | 1.58%(+8.84)#555 |
| 21. | Elizabeth Borough | 10.19% | 1.42%(+8.77)#21 | 1.58%(+8.61)#583 |
| 22. | Newburg Borough Clearfield County | 10.17% | 1.42%(+8.75)#22 | 1.58%(+8.59)#585 |
| 23. | Palmdale | 10.14% | 1.42%(+8.72)#23 | 1.58%(+8.56)#592 |
| 24. | Jerome | 9.89% | 1.42%(+8.47)#24 | 1.58%(+8.31)#615 |
| 25. | Pocono Ranch Lands | 9.52% | 1.42%(+8.11)#25 | 1.58%(+7.95)#654 |
| 26. | West Liberty Borough | 9.43% | 1.42%(+8.01)#26 | 1.58%(+7.85)#667 |
| 27. | Cheyney University | 9.21% | 1.42%(+7.79)#27 | 1.58%(+7.63)#697 |
| 28. | Royer | 8.57% | 1.42%(+7.15)#28 | 1.58%(+7.00)#803 |
| 29. | Nemacolin | 8.48% | 1.42%(+7.07)#29 | 1.58%(+6.91)#811 |
| 30. | Sidman | 8.33% | 1.42%(+6.92)#30 | 1.58%(+6.76)#840 |
| 31. | Joffre | 8.31% | 1.42%(+6.90)#31 | 1.58%(+6.74)#848 |
| 32. | Unionville | 8.31% | 1.42%(+6.89)#32 | 1.58%(+6.73)#849 |
| 33. | Milton Borough | 8.18% | 1.42%(+6.77)#33 | 1.58%(+6.61)#876 |
| 34. | Cross Creek | 8.16% | 1.42%(+6.75)#34 | 1.58%(+6.59)#881 |
| 35. | Saylorsburg | 7.89% | 1.42%(+6.48)#35 | 1.58%(+6.32)#935 |
| 36. | Lenhartsville Borough | 7.83% | 1.42%(+6.41)#36 | 1.58%(+6.26)#951 |
| 37. | South Heights Borough | 7.81% | 1.42%(+6.39)#37 | 1.58%(+6.23)#961 |
| 38. | Moshannon | 7.80% | 1.42%(+6.39)#38 | 1.58%(+6.23)#963 |
| 39. | Athens Borough | 7.71% | 1.42%(+6.29)#39 | 1.58%(+6.13)#991 |
| 40. | Zelienople Borough | 7.47% | 1.42%(+6.05)#40 | 1.58%(+5.89)#1,037 |
| 41. | Carmichaels Borough | 7.31% | 1.42%(+5.90)#41 | 1.58%(+5.74)#1,083 |
| 42. | Knoxville Borough | 7.28% | 1.42%(+5.87)#42 | 1.58%(+5.71)#1,089 |
| 43. | Fairview Borough | 7.22% | 1.42%(+5.80)#43 | 1.58%(+5.64)#1,105 |
| 44. | Benson Borough | 7.19% | 1.42%(+5.78)#44 | 1.58%(+5.62)#1,112 |
| 45. | Atkinson Mills | 7.14% | 1.42%(+5.73)#45 | 1.58%(+5.57)#1,125 |
| 46. | Siglerville | 7.11% | 1.42%(+5.69)#46 | 1.58%(+5.53)#1,138 |
| 47. | Bryn Athyn Borough | 6.91% | 1.42%(+5.49)#47 | 1.58%(+5.33)#1,191 |
| 48. | New Salem Borough | 6.86% | 1.42%(+5.45)#48 | 1.58%(+5.29)#1,200 |
| 49. | Cherry Valley Borough | 6.67% | 1.42%(+5.25)#49 | 1.58%(+5.09)#1,263 |
| 50. | Deer Lake | 6.65% | 1.42%(+5.23)#50 | 1.58%(+5.07)#1,266 |
| 51. | Cecil Bishop | 6.56% | 1.42%(+5.14)#51 | 1.58%(+4.98)#1,298 |
| 52. | Towamensing Trails | 6.54% | 1.42%(+5.13)#52 | 1.58%(+4.97)#1,305 |
| 53. | Yellow Springs | 6.45% | 1.42%(+5.04)#53 | 1.58%(+4.88)#1,345 |
| 54. | Freeport Borough | 6.43% | 1.42%(+5.02)#54 | 1.58%(+4.86)#1,353 |
| 55. | Forksville Borough | 6.30% | 1.42%(+4.88)#55 | 1.58%(+4.72)#1,409 |
| 56. | Elberta | 6.21% | 1.42%(+4.79)#56 | 1.58%(+4.63)#1,453 |
| 57. | James City | 6.19% | 1.42%(+4.77)#57 | 1.58%(+4.61)#1,465 |
| 58. | Holters Crossing | 6.14% | 1.42%(+4.72)#58 | 1.58%(+4.56)#1,489 |
| 59. | Taylorstown | 6.11% | 1.42%(+4.69)#59 | 1.58%(+4.53)#1,500 |
| 60. | Zion | 6.07% | 1.42%(+4.65)#60 | 1.58%(+4.50)#1,518 |
| 61. | Red Lion Borough | 6.06% | 1.42%(+4.65)#61 | 1.58%(+4.49)#1,522 |
| 62. | Greenfields | 6.06% | 1.42%(+4.64)#62 | 1.58%(+4.48)#1,524 |
| 63. | Eagles Mere Borough | 6.00% | 1.42%(+4.58)#63 | 1.58%(+4.42)#1,565 |
| 64. | Churchill Borough | 5.98% | 1.42%(+4.56)#64 | 1.58%(+4.40)#1,574 |
| 65. | Townville Borough | 5.96% | 1.42%(+4.54)#65 | 1.58%(+4.38)#1,585 |
| 66. | Dryville | 5.95% | 1.42%(+4.53)#66 | 1.58%(+4.37)#1,591 |
| 67. | Robeson Extension | 5.88% | 1.42%(+4.47)#67 | 1.58%(+4.31)#1,626 |
| 68. | Inkerman | 5.83% | 1.42%(+4.41)#68 | 1.58%(+4.25)#1,652 |
| 69. | Woxall | 5.75% | 1.42%(+4.33)#69 | 1.58%(+4.17)#1,686 |
| 70. | St. Clair | 5.66% | 1.42%(+4.24)#70 | 1.58%(+4.08)#1,739 |
| 71. | Wyano | 5.66% | 1.42%(+4.24)#71 | 1.58%(+4.08)#1,740 |
| 72. | Fayette City Borough | 5.62% | 1.42%(+4.20)#72 | 1.58%(+4.04)#1,768 |
| 73. | Blooming Valley Borough | 5.61% | 1.42%(+4.20)#73 | 1.58%(+4.04)#1,769 |
| 74. | Dauphin Borough | 5.61% | 1.42%(+4.19)#74 | 1.58%(+4.03)#1,777 |
| 75. | Shippensburg Borough | 5.57% | 1.42%(+4.16)#75 | 1.58%(+4.00)#1,798 |
| 76. | Cedar Crest | 5.56% | 1.42%(+4.14)#76 | 1.58%(+3.98)#1,812 |
| 77. | Scotland | 5.51% | 1.42%(+4.10)#77 | 1.58%(+3.94)#1,839 |
| 78. | Montrose Borough | 5.44% | 1.42%(+4.03)#78 | 1.58%(+3.87)#1,881 |
| 79. | New Galilee Borough | 5.39% | 1.42%(+3.97)#79 | 1.58%(+3.81)#1,918 |
| 80. | Sturgeon | 5.33% | 1.42%(+3.91)#80 | 1.58%(+3.75)#1,955 |
| 81. | West Newton Borough | 5.32% | 1.42%(+3.90)#81 | 1.58%(+3.74)#1,967 |
| 82. | Beaver Borough | 5.29% | 1.42%(+3.87)#82 | 1.58%(+3.71)#1,986 |
| 83. | Eldorado | 5.27% | 1.42%(+3.86)#83 | 1.58%(+3.70)#1,992 |
| 84. | Foot Of Ten | 5.27% | 1.42%(+3.86)#84 | 1.58%(+3.70)#1,994 |
| 85. | Port Matilda Borough | 5.19% | 1.42%(+3.77)#85 | 1.58%(+3.61)#2,064 |
| 86. | Commodore | 5.18% | 1.42%(+3.76)#86 | 1.58%(+3.61)#2,068 |
| 87. | Fredonia Borough | 5.16% | 1.42%(+3.75)#87 | 1.58%(+3.59)#2,080 |
| 88. | New Columbia | 5.15% | 1.42%(+3.73)#88 | 1.58%(+3.57)#2,094 |
| 89. | Aspinwall Borough | 5.09% | 1.42%(+3.67)#89 | 1.58%(+3.51)#2,142 |
| 90. | Calumet | 5.09% | 1.42%(+3.67)#90 | 1.58%(+3.51)#2,143 |
| 91. | Kiskimere | 5.07% | 1.42%(+3.66)#91 | 1.58%(+3.50)#2,153 |
| 92. | New Eagle Borough | 5.04% | 1.42%(+3.62)#92 | 1.58%(+3.46)#2,182 |
| 93. | Shanor Northvue | 4.97% | 1.42%(+3.56)#93 | 1.58%(+3.40)#2,228 |
| 94. | Pughtown | 4.96% | 1.42%(+3.55)#94 | 1.58%(+3.39)#2,234 |
| 95. | Plainfield | 4.96% | 1.42%(+3.54)#95 | 1.58%(+3.38)#2,241 |
| 96. | Sutersville Borough | 4.95% | 1.42%(+3.54)#96 | 1.58%(+3.38)#2,247 |
| 97. | Thornburg Borough | 4.85% | 1.42%(+3.43)#97 | 1.58%(+3.27)#2,347 |
| 98. | Bridgeport Borough | 4.82% | 1.42%(+3.40)#98 | 1.58%(+3.24)#2,367 |
| 99. | Wescosville | 4.78% | 1.42%(+3.36)#99 | 1.58%(+3.20)#2,405 |
| 100. | Barkeyville Borough | 4.76% | 1.42%(+3.35)#100 | 1.58%(+3.19)#2,420 |
Common Questions
What are the Top 10 Cities with the Highest Percentage of Scottish Population in Pennsylvania?
Top 10 Cities with the Highest Percentage of Scottish Population in Pennsylvania are:
#1
34.06%
#2
29.07%
#3
27.13%
#4
18.03%
#5
17.90%
#6
12.93%
#7
11.61%
#8
11.43%
#9
11.03%
#10
10.90%
What city has the Highest Percentage of Scottish Population in Pennsylvania?
Crucible has the Highest Percentage of Scottish Population in Pennsylvania with 34.06%.
What is the Percentage of Scottish Population in the State of Pennsylvania?
Percentage of Scottish Population in Pennsylvania is 1.42%.
What is the Percentage of Scottish Population in the United States?
Percentage of Scottish Population in the United States is 1.58%.