Newtown Grant, PA
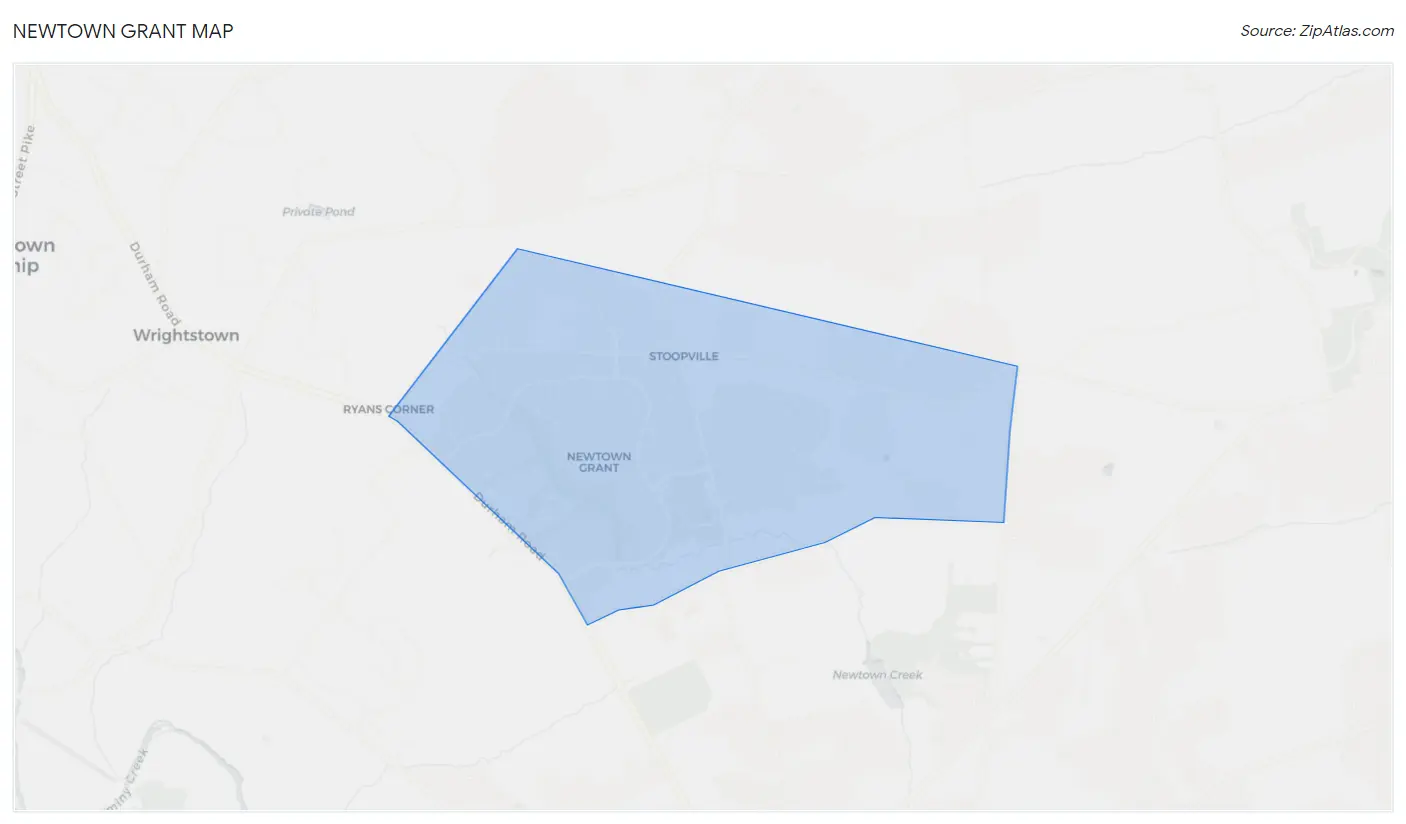
Newtown Grant Map
Newtown Grant Overview
5,850
TOTAL POPULATION
2,953
MALE POPULATION
2,897
FEMALE POPULATION
101.93
MALES / 100 FEMALES
98.10
FEMALES / 100 MALES
44.9
MEDIAN AGE
3.0
AVG FAMILY SIZE
2.5
AVG HOUSEHOLD SIZE
$76,028
PER CAPITA INCOME
$181,700
AVG FAMILY INCOME
$166,346
AVG HOUSEHOLD INCOME
40.9%
WAGE / INCOME GAP [ % ]
59.1¢/ $1
WAGE / INCOME GAP [ $ ]
0.37
INEQUALITY / GINI INDEX
3,275
LABOR FORCE [ PEOPLE ]
72.1%
PERCENT IN LABOR FORCE
6.7%
UNEMPLOYMENT RATE
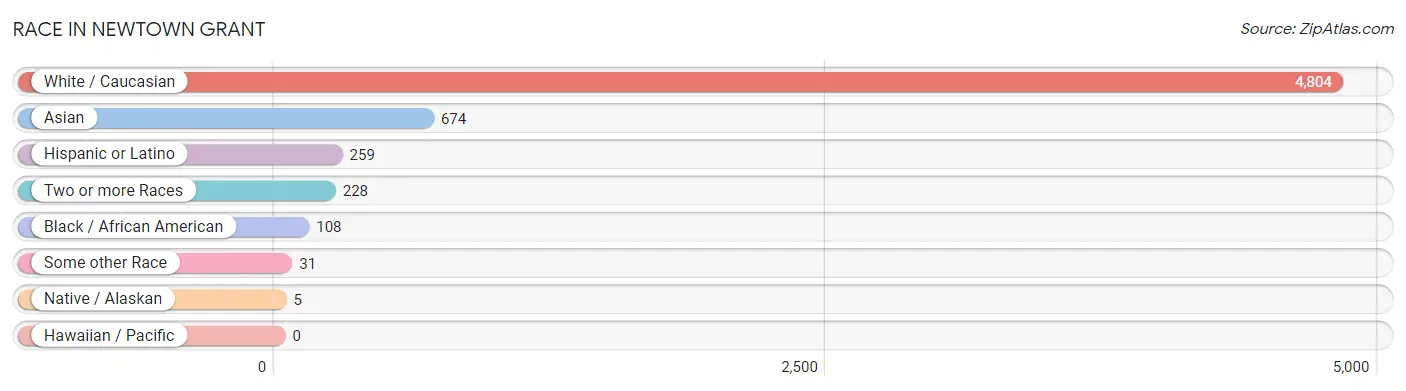
Race in Newtown Grant
The most populous races in Newtown Grant are White / Caucasian (4,804 | 82.1%), Asian (674 | 11.5%), and Hispanic or Latino (259 | 4.4%).
| Race | # Population | % Population |
| Asian | 674 | 11.5% |
| Black / African American | 108 | 1.8% |
| Hawaiian / Pacific | 0 | 0.0% |
| Hispanic or Latino | 259 | 4.4% |
| Native / Alaskan | 5 | 0.1% |
| White / Caucasian | 4,804 | 82.1% |
| Two or more Races | 228 | 3.9% |
| Some other Race | 31 | 0.5% |
| Total | 5,850 | 100.0% |
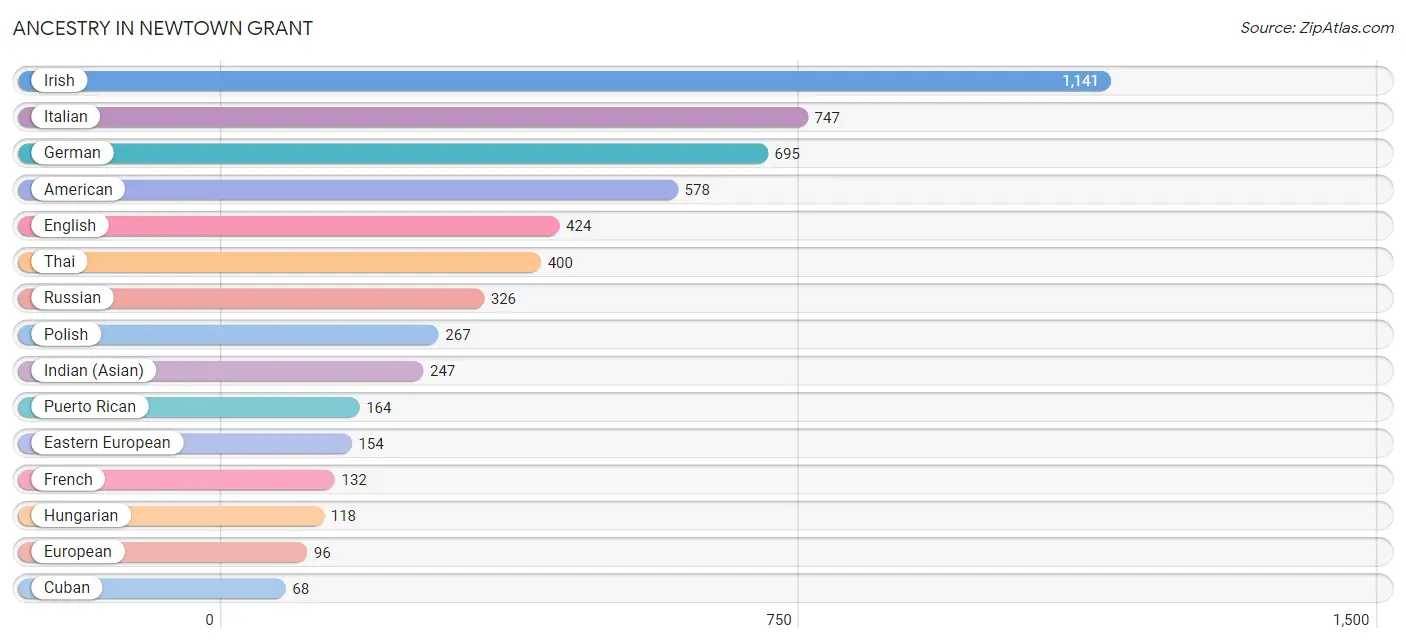
Ancestry in Newtown Grant
The most populous ancestries reported in Newtown Grant are Irish (1,141 | 19.5%), Italian (747 | 12.8%), German (695 | 11.9%), American (578 | 9.9%), and English (424 | 7.2%), together accounting for 61.3% of all Newtown Grant residents.
| Ancestry | # Population | % Population |
| African | 33 | 0.6% |
| American | 578 | 9.9% |
| Arab | 28 | 0.5% |
| Armenian | 20 | 0.3% |
| Australian | 5 | 0.1% |
| Austrian | 14 | 0.2% |
| Bhutanese | 6 | 0.1% |
| Brazilian | 49 | 0.8% |
| Burmese | 26 | 0.4% |
| Canadian | 11 | 0.2% |
| Cherokee | 28 | 0.5% |
| Chilean | 9 | 0.2% |
| Cuban | 68 | 1.2% |
| Czechoslovakian | 9 | 0.2% |
| Dutch | 21 | 0.4% |
| Eastern European | 154 | 2.6% |
| Egyptian | 14 | 0.2% |
| English | 424 | 7.2% |
| European | 96 | 1.6% |
| French | 132 | 2.3% |
| French Canadian | 18 | 0.3% |
| German | 695 | 11.9% |
| Greek | 17 | 0.3% |
| Hungarian | 118 | 2.0% |
| Indian (Asian) | 247 | 4.2% |
| Iranian | 19 | 0.3% |
| Irish | 1,141 | 19.5% |
| Italian | 747 | 12.8% |
| Jamaican | 41 | 0.7% |
| Korean | 14 | 0.2% |
| Latvian | 10 | 0.2% |
| Lebanese | 8 | 0.1% |
| Lithuanian | 44 | 0.7% |
| Northern European | 47 | 0.8% |
| Polish | 267 | 4.6% |
| Portuguese | 5 | 0.1% |
| Puerto Rican | 164 | 2.8% |
| Romanian | 49 | 0.8% |
| Russian | 326 | 5.6% |
| Scandinavian | 27 | 0.5% |
| Scotch-Irish | 13 | 0.2% |
| Scottish | 45 | 0.8% |
| Serbian | 12 | 0.2% |
| Slovak | 24 | 0.4% |
| South American | 9 | 0.2% |
| Spaniard | 18 | 0.3% |
| Subsaharan African | 33 | 0.6% |
| Swiss | 15 | 0.3% |
| Syrian | 6 | 0.1% |
| Thai | 400 | 6.8% |
| Tlingit-Haida | 5 | 0.1% |
| Ukrainian | 39 | 0.7% |
| Welsh | 46 | 0.8% | View All 53 Rows |
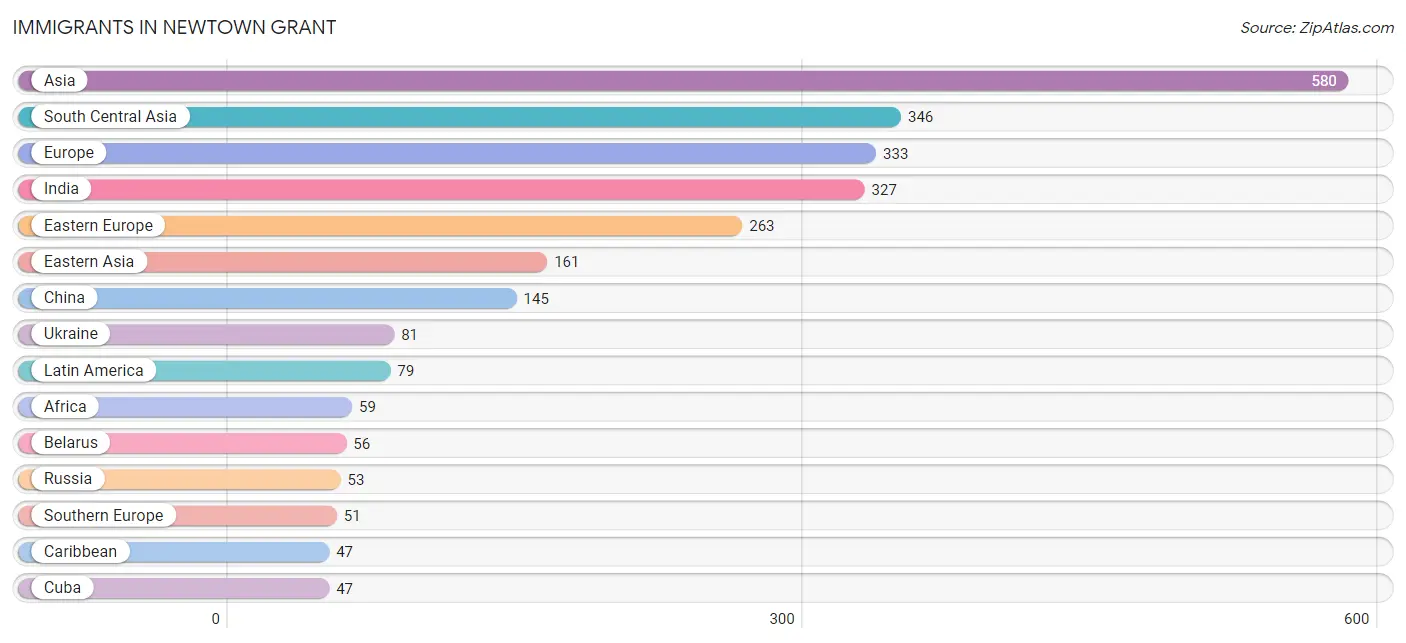
Immigrants in Newtown Grant
The most numerous immigrant groups reported in Newtown Grant came from Asia (580 | 9.9%), South Central Asia (346 | 5.9%), Europe (333 | 5.7%), India (327 | 5.6%), and Eastern Europe (263 | 4.5%), together accounting for 31.6% of all Newtown Grant residents.
| Immigration Origin | # Population | % Population |
| Africa | 59 | 1.0% |
| Asia | 580 | 9.9% |
| Australia | 5 | 0.1% |
| Belarus | 56 | 1.0% |
| Brazil | 17 | 0.3% |
| Cambodia | 19 | 0.3% |
| Caribbean | 47 | 0.8% |
| Chile | 4 | 0.1% |
| China | 145 | 2.5% |
| Colombia | 11 | 0.2% |
| Cuba | 47 | 0.8% |
| Eastern Asia | 161 | 2.8% |
| Eastern Europe | 263 | 4.5% |
| Egypt | 14 | 0.2% |
| Europe | 333 | 5.7% |
| Germany | 5 | 0.1% |
| Greece | 8 | 0.1% |
| Hong Kong | 14 | 0.2% |
| Hungary | 20 | 0.3% |
| India | 327 | 5.6% |
| Indonesia | 5 | 0.1% |
| Iran | 19 | 0.3% |
| Italy | 43 | 0.7% |
| Korea | 16 | 0.3% |
| Latin America | 79 | 1.3% |
| Latvia | 10 | 0.2% |
| Lithuania | 4 | 0.1% |
| Moldova | 6 | 0.1% |
| Northern Africa | 14 | 0.2% |
| Northern Europe | 14 | 0.2% |
| Oceania | 5 | 0.1% |
| Philippines | 14 | 0.2% |
| Poland | 33 | 0.6% |
| Russia | 53 | 0.9% |
| South Africa | 12 | 0.2% |
| South America | 32 | 0.5% |
| South Central Asia | 346 | 5.9% |
| South Eastern Asia | 38 | 0.6% |
| Southern Europe | 51 | 0.9% |
| Taiwan | 9 | 0.2% |
| Ukraine | 81 | 1.4% |
| Western Asia | 35 | 0.6% |
| Western Europe | 5 | 0.1% | View All 43 Rows |
Sex and Age in Newtown Grant
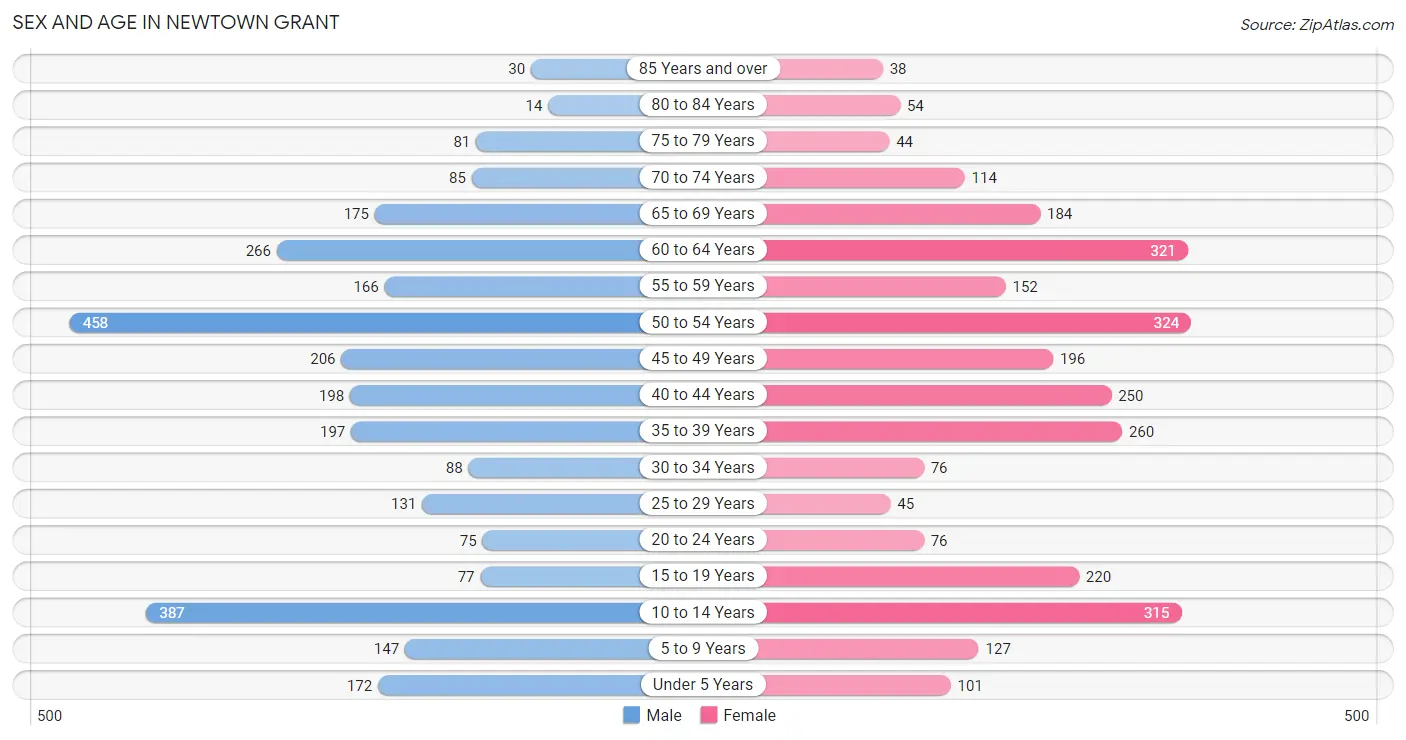
Sex and Age in Newtown Grant
The most populous age groups in Newtown Grant are 50 to 54 Years (458 | 15.5%) for men and 50 to 54 Years (324 | 11.2%) for women.
| Age Bracket | Male | Female |
| Under 5 Years | 172 (5.8%) | 101 (3.5%) |
| 5 to 9 Years | 147 (5.0%) | 127 (4.4%) |
| 10 to 14 Years | 387 (13.1%) | 315 (10.9%) |
| 15 to 19 Years | 77 (2.6%) | 220 (7.6%) |
| 20 to 24 Years | 75 (2.5%) | 76 (2.6%) |
| 25 to 29 Years | 131 (4.4%) | 45 (1.5%) |
| 30 to 34 Years | 88 (3.0%) | 76 (2.6%) |
| 35 to 39 Years | 197 (6.7%) | 260 (9.0%) |
| 40 to 44 Years | 198 (6.7%) | 250 (8.6%) |
| 45 to 49 Years | 206 (7.0%) | 196 (6.8%) |
| 50 to 54 Years | 458 (15.5%) | 324 (11.2%) |
| 55 to 59 Years | 166 (5.6%) | 152 (5.2%) |
| 60 to 64 Years | 266 (9.0%) | 321 (11.1%) |
| 65 to 69 Years | 175 (5.9%) | 184 (6.4%) |
| 70 to 74 Years | 85 (2.9%) | 114 (3.9%) |
| 75 to 79 Years | 81 (2.7%) | 44 (1.5%) |
| 80 to 84 Years | 14 (0.5%) | 54 (1.9%) |
| 85 Years and over | 30 (1.0%) | 38 (1.3%) |
| Total | 2,953 (100.0%) | 2,897 (100.0%) |
Families and Households in Newtown Grant
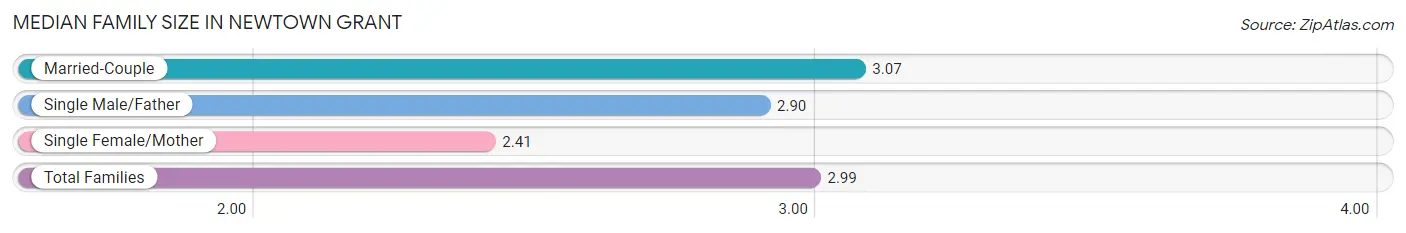
Median Family Size in Newtown Grant
The median family size in Newtown Grant is 2.99 persons per family, with married-couple families (1,481 | 86.4%) accounting for the largest median family size of 3.07 persons per family. On the other hand, single female/mother families (193 | 11.3%) represent the smallest median family size with 2.41 persons per family.
| Family Type | # Families | Family Size |
| Married-Couple | 1,481 (86.4%) | 3.07 |
| Single Male/Father | 40 (2.3%) | 2.90 |
| Single Female/Mother | 193 (11.3%) | 2.41 |
| Total Families | 1,714 (100.0%) | 2.99 |
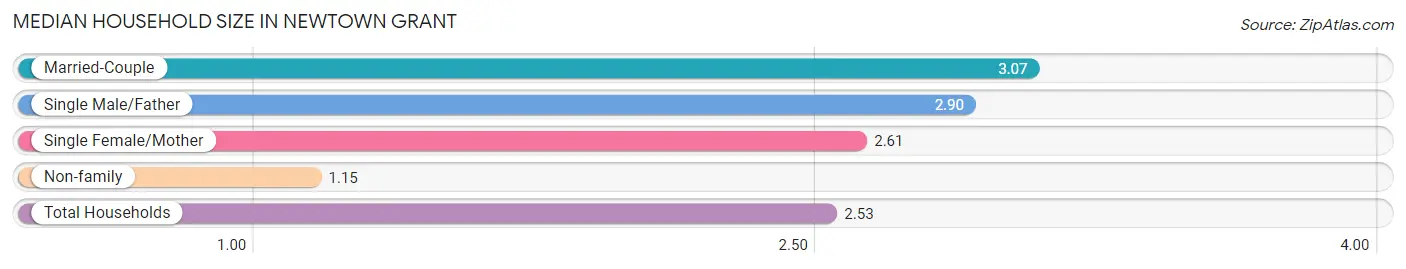
Median Household Size in Newtown Grant
The median household size in Newtown Grant is 2.53 persons per household, with married-couple households (1,481 | 64.2%) accounting for the largest median household size of 3.07 persons per household. non-family households (594 | 25.7%) represent the smallest median household size with 1.15 persons per household.
| Household Type | # Households | Household Size |
| Married-Couple | 1,481 (64.2%) | 3.07 |
| Single Male/Father | 40 (1.7%) | 2.90 |
| Single Female/Mother | 193 (8.4%) | 2.61 |
| Non-family | 594 (25.7%) | 1.15 |
| Total Households | 2,308 (100.0%) | 2.53 |
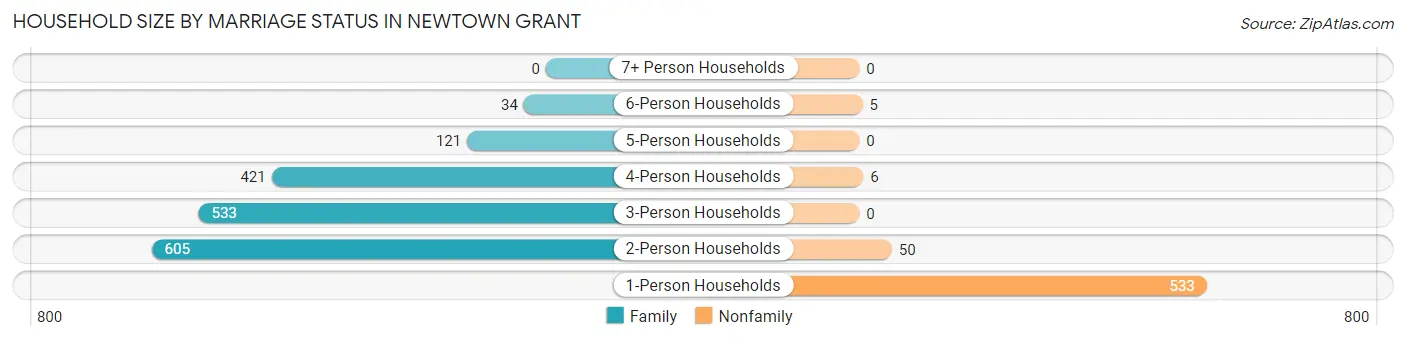
Household Size by Marriage Status in Newtown Grant
Out of a total of 2,308 households in Newtown Grant, 1,714 (74.3%) are family households, while 594 (25.7%) are nonfamily households. The most numerous type of family households are 2-person households, comprising 605, and the most common type of nonfamily households are 1-person households, comprising 533.
| Household Size | Family Households | Nonfamily Households |
| 1-Person Households | - | 533 (23.1%) |
| 2-Person Households | 605 (26.2%) | 50 (2.2%) |
| 3-Person Households | 533 (23.1%) | 0 (0.0%) |
| 4-Person Households | 421 (18.2%) | 6 (0.3%) |
| 5-Person Households | 121 (5.2%) | 0 (0.0%) |
| 6-Person Households | 34 (1.5%) | 5 (0.2%) |
| 7+ Person Households | 0 (0.0%) | 0 (0.0%) |
| Total | 1,714 (74.3%) | 594 (25.7%) |
Female Fertility in Newtown Grant
Fertility by Age in Newtown Grant
Average fertility rate in Newtown Grant is 28.0 births per 1,000 women. Women in the age bracket of 20 to 34 years have the highest fertility rate with 162.0 births per 1,000 women. Women in the age bracket of 20 to 34 years acount for 94.1% of all women with births.
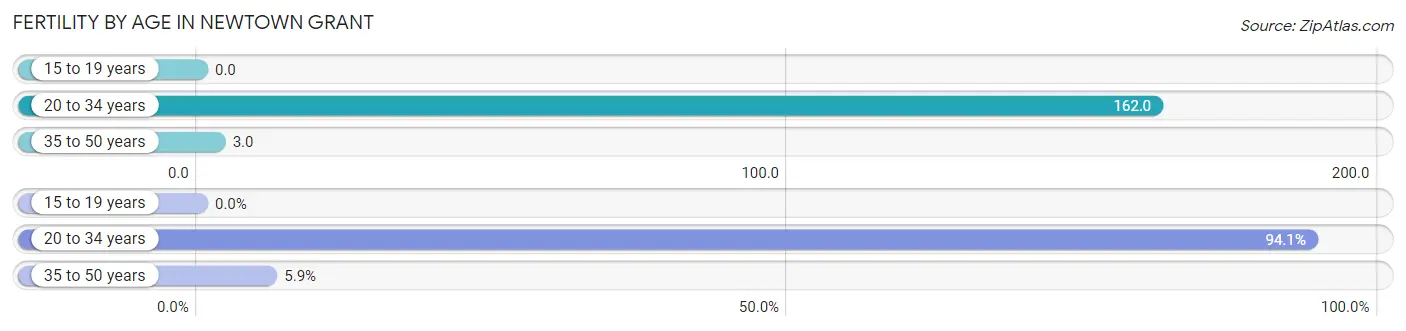
| Age Bracket | Women with Births | Births / 1,000 Women |
| 15 to 19 years | 0 (0.0%) | 0.0 |
| 20 to 34 years | 32 (94.1%) | 162.0 |
| 35 to 50 years | 2 (5.9%) | 3.0 |
| Total | 34 (100.0%) | 28.0 |
Fertility by Age by Marriage Status in Newtown Grant
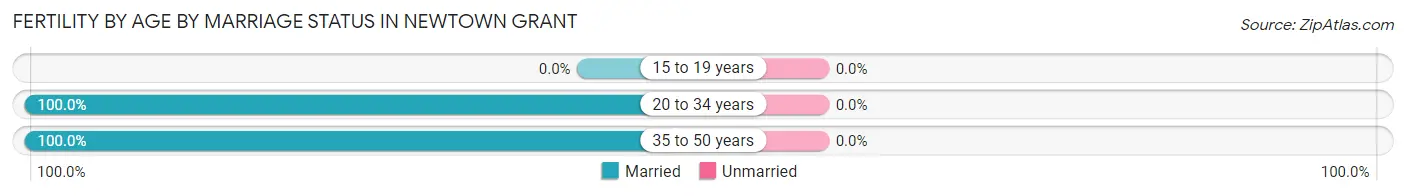
| Age Bracket | Married | Unmarried |
| 15 to 19 years | 0 (0.0%) | 0 (0.0%) |
| 20 to 34 years | 32 (100.0%) | 0 (0.0%) |
| 35 to 50 years | 2 (100.0%) | 0 (0.0%) |
| Total | 34 (100.0%) | 0 (0.0%) |
Fertility by Education in Newtown Grant
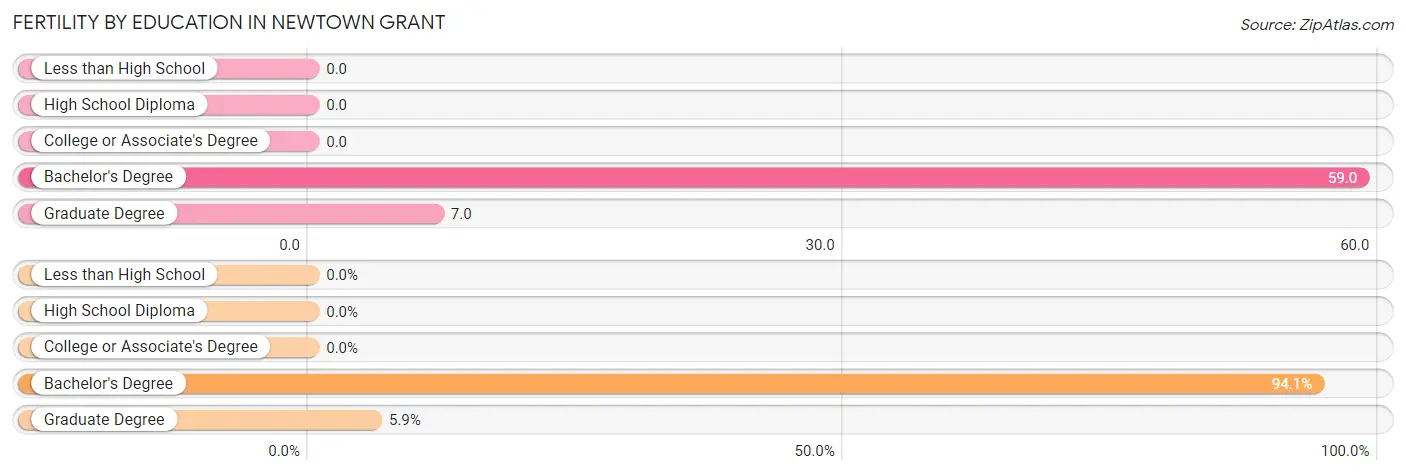
| Educational Attainment | Women with Births | Births / 1,000 Women |
| Less than High School | 0 (0.0%) | 0.0 |
| High School Diploma | 0 (0.0%) | 0.0 |
| College or Associate's Degree | 0 (0.0%) | 0.0 |
| Bachelor's Degree | 32 (94.1%) | 59.0 |
| Graduate Degree | 2 (5.9%) | 7.0 |
| Total | 34 (100.0%) | 28.0 |
Fertility by Education by Marriage Status in Newtown Grant
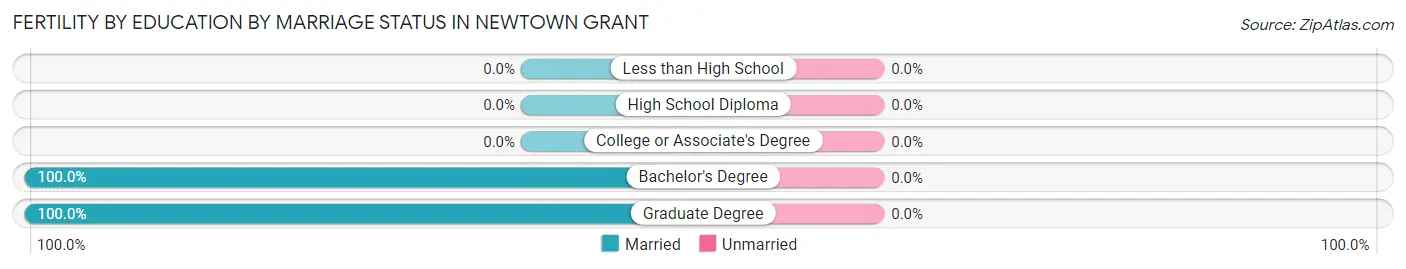
| Educational Attainment | Married | Unmarried |
| Less than High School | 0 (0.0%) | 0 (0.0%) |
| High School Diploma | 0 (0.0%) | 0 (0.0%) |
| College or Associate's Degree | 0 (0.0%) | 0 (0.0%) |
| Bachelor's Degree | 32 (100.0%) | 0 (0.0%) |
| Graduate Degree | 2 (100.0%) | 0 (0.0%) |
| Total | 34 (100.0%) | 0 (0.0%) |
Income in Newtown Grant
Income Overview in Newtown Grant
Per Capita Income in Newtown Grant is $76,028, while median incomes of families and households are $181,700 and $166,346 respectively.
| Characteristic | Number | Measure |
| Per Capita Income | 5,850 | $76,028 |
| Median Family Income | 1,714 | $181,700 |
| Mean Family Income | 1,714 | $217,530 |
| Median Household Income | 2,308 | $166,346 |
| Mean Household Income | 2,308 | $190,648 |
| Income Deficit | 1,714 | $0 |
| Wage / Income Gap (%) | 5,850 | 40.94% |
| Wage / Income Gap ($) | 5,850 | 59.06¢ per $1 |
| Gini / Inequality Index | 5,850 | 0.37 |
Earnings by Sex in Newtown Grant
Average Earnings in Newtown Grant are $86,067, $114,821 for men and $67,810 for women, a difference of 40.9%.
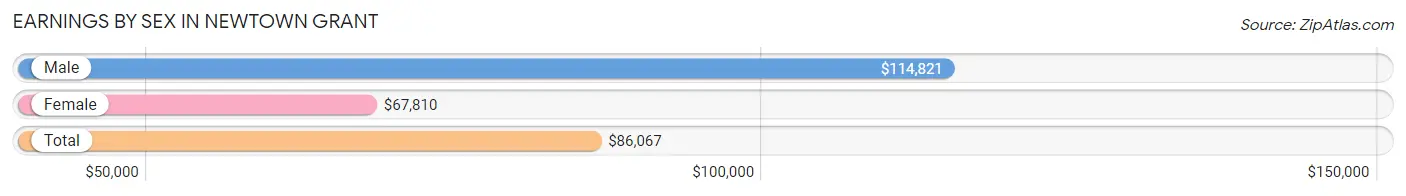
| Sex | Number | Average Earnings |
| Male | 1,877 (55.2%) | $114,821 |
| Female | 1,526 (44.8%) | $67,810 |
| Total | 3,403 (100.0%) | $86,067 |
Earnings by Sex by Income Bracket in Newtown Grant
The most common earnings brackets in Newtown Grant are $100,000+ for men (1,089 | 58.0%) and $100,000+ for women (367 | 24.0%).
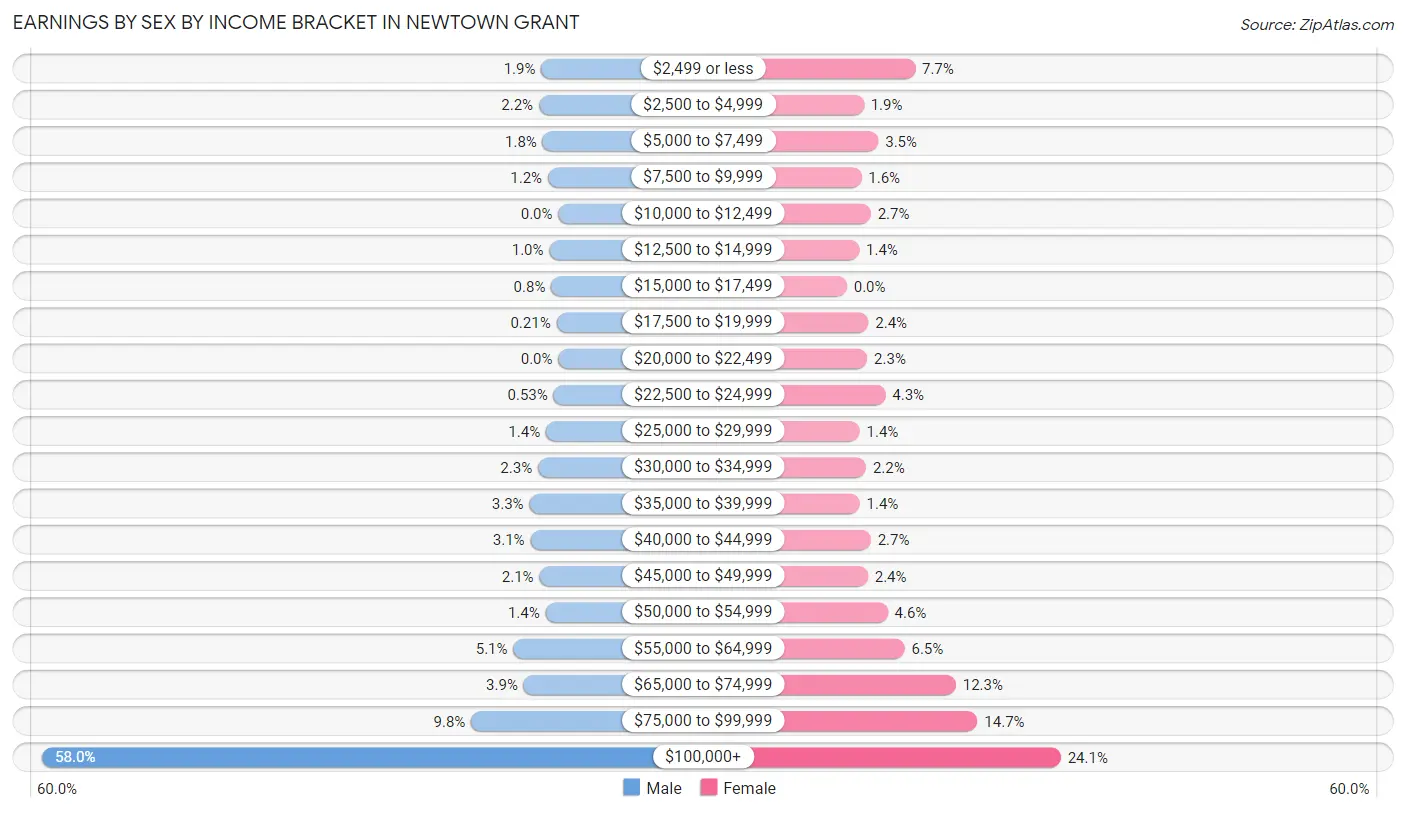
| Income | Male | Female |
| $2,499 or less | 36 (1.9%) | 117 (7.7%) |
| $2,500 to $4,999 | 41 (2.2%) | 29 (1.9%) |
| $5,000 to $7,499 | 33 (1.8%) | 54 (3.5%) |
| $7,500 to $9,999 | 22 (1.2%) | 25 (1.6%) |
| $10,000 to $12,499 | 0 (0.0%) | 41 (2.7%) |
| $12,500 to $14,999 | 19 (1.0%) | 21 (1.4%) |
| $15,000 to $17,499 | 15 (0.8%) | 0 (0.0%) |
| $17,500 to $19,999 | 4 (0.2%) | 37 (2.4%) |
| $20,000 to $22,499 | 0 (0.0%) | 35 (2.3%) |
| $22,500 to $24,999 | 10 (0.5%) | 66 (4.3%) |
| $25,000 to $29,999 | 26 (1.4%) | 22 (1.4%) |
| $30,000 to $34,999 | 43 (2.3%) | 33 (2.2%) |
| $35,000 to $39,999 | 61 (3.3%) | 22 (1.4%) |
| $40,000 to $44,999 | 59 (3.1%) | 41 (2.7%) |
| $45,000 to $49,999 | 40 (2.1%) | 36 (2.4%) |
| $50,000 to $54,999 | 27 (1.4%) | 70 (4.6%) |
| $55,000 to $64,999 | 95 (5.1%) | 99 (6.5%) |
| $65,000 to $74,999 | 73 (3.9%) | 187 (12.2%) |
| $75,000 to $99,999 | 184 (9.8%) | 224 (14.7%) |
| $100,000+ | 1,089 (58.0%) | 367 (24.0%) |
| Total | 1,877 (100.0%) | 1,526 (100.0%) |
Earnings by Sex by Educational Attainment in Newtown Grant
Average earnings in Newtown Grant are $120,265 for men and $69,277 for women, a difference of 42.4%. Men with an educational attainment of bachelor's degree enjoy the highest average annual earnings of $146,389, while those with college or associate's degree education earn the least with $53,704. Women with an educational attainment of graduate degree earn the most with the average annual earnings of $96,326, while those with bachelor's degree education have the smallest earnings of $63,676.
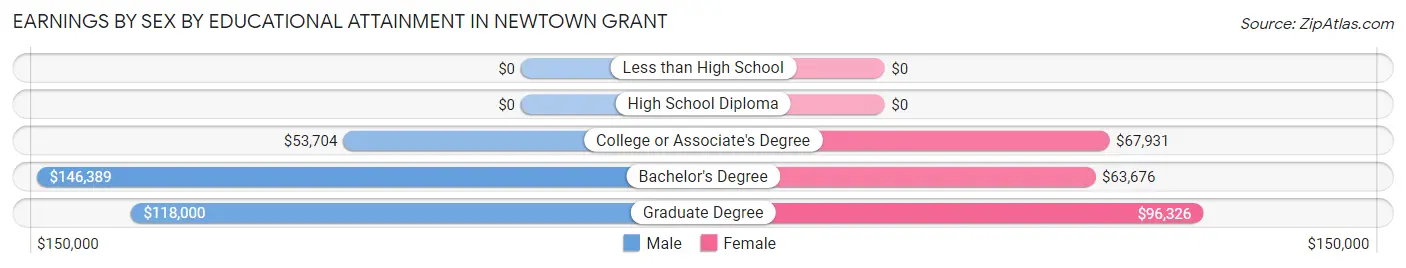
| Educational Attainment | Male Income | Female Income |
| Less than High School | - | - |
| High School Diploma | - | - |
| College or Associate's Degree | $53,704 | $67,931 |
| Bachelor's Degree | $146,389 | $63,676 |
| Graduate Degree | $118,000 | $96,326 |
| Total | $120,265 | $69,277 |
Family Income in Newtown Grant
Family Income Brackets in Newtown Grant
According to the Newtown Grant family income data, there are 704 families falling into the $200,000+ income range, which is the most common income bracket and makes up 41.1% of all families.
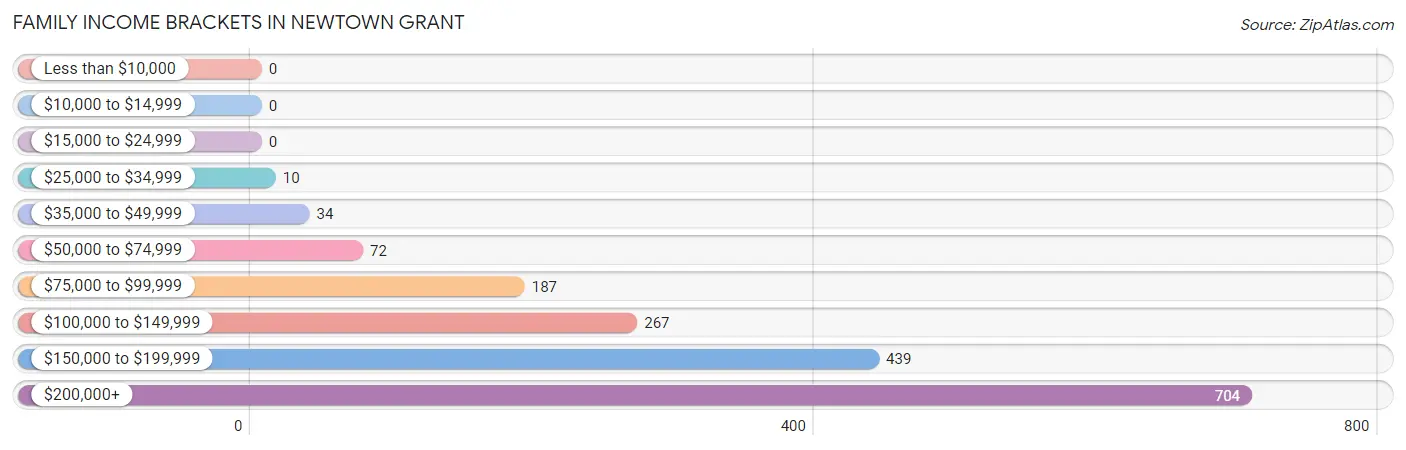
| Income Bracket | # Families | % Families |
| Less than $10,000 | 0 | 0.0% |
| $10,000 to $14,999 | 0 | 0.0% |
| $15,000 to $24,999 | 0 | 0.0% |
| $25,000 to $34,999 | 10 | 0.6% |
| $35,000 to $49,999 | 34 | 2.0% |
| $50,000 to $74,999 | 72 | 4.2% |
| $75,000 to $99,999 | 187 | 10.9% |
| $100,000 to $149,999 | 267 | 15.6% |
| $150,000 to $199,999 | 439 | 25.6% |
| $200,000+ | 704 | 41.1% |
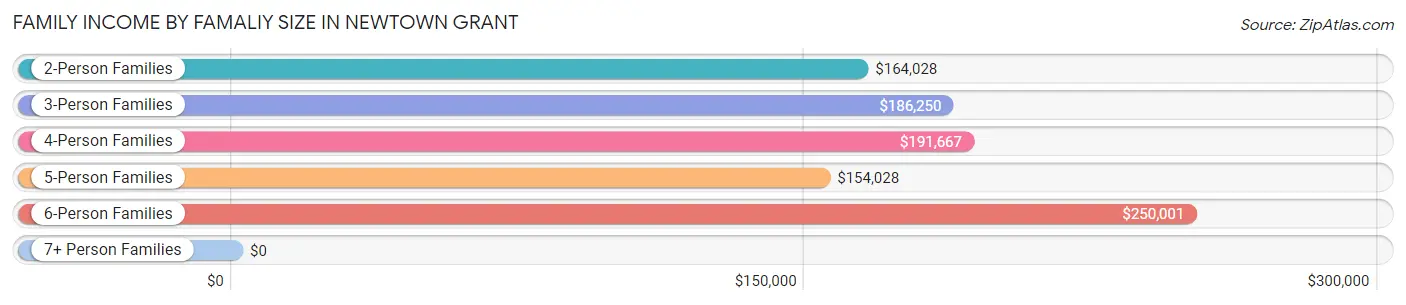
Family Income by Famaliy Size in Newtown Grant
6-person families (34 | 2.0%) account for the highest median family income in Newtown Grant with $250,001 per family, while 2-person families (631 | 36.8%) have the highest median income of $82,014 per family member.
| Income Bracket | # Families | Median Income |
| 2-Person Families | 631 (36.8%) | $164,028 |
| 3-Person Families | 510 (29.7%) | $186,250 |
| 4-Person Families | 418 (24.4%) | $191,667 |
| 5-Person Families | 121 (7.1%) | $154,028 |
| 6-Person Families | 34 (2.0%) | $250,001 |
| 7+ Person Families | 0 (0.0%) | $0 |
| Total | 1,714 (100.0%) | $181,700 |
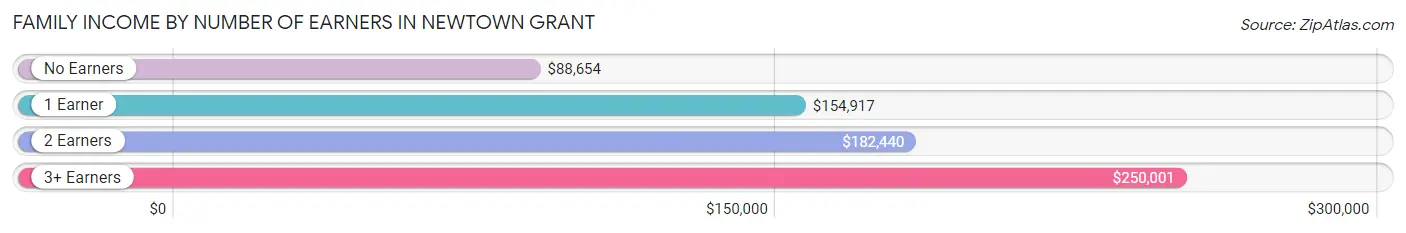
Family Income by Number of Earners in Newtown Grant
The median family income in Newtown Grant is $181,700, with families comprising 3+ earners (199) having the highest median family income of $250,001, while families with no earners (162) have the lowest median family income of $88,654, accounting for 11.6% and 9.5% of families, respectively.
| Number of Earners | # Families | Median Income |
| No Earners | 162 (9.5%) | $88,654 |
| 1 Earner | 459 (26.8%) | $154,917 |
| 2 Earners | 894 (52.2%) | $182,440 |
| 3+ Earners | 199 (11.6%) | $250,001 |
| Total | 1,714 (100.0%) | $181,700 |
Household Income in Newtown Grant
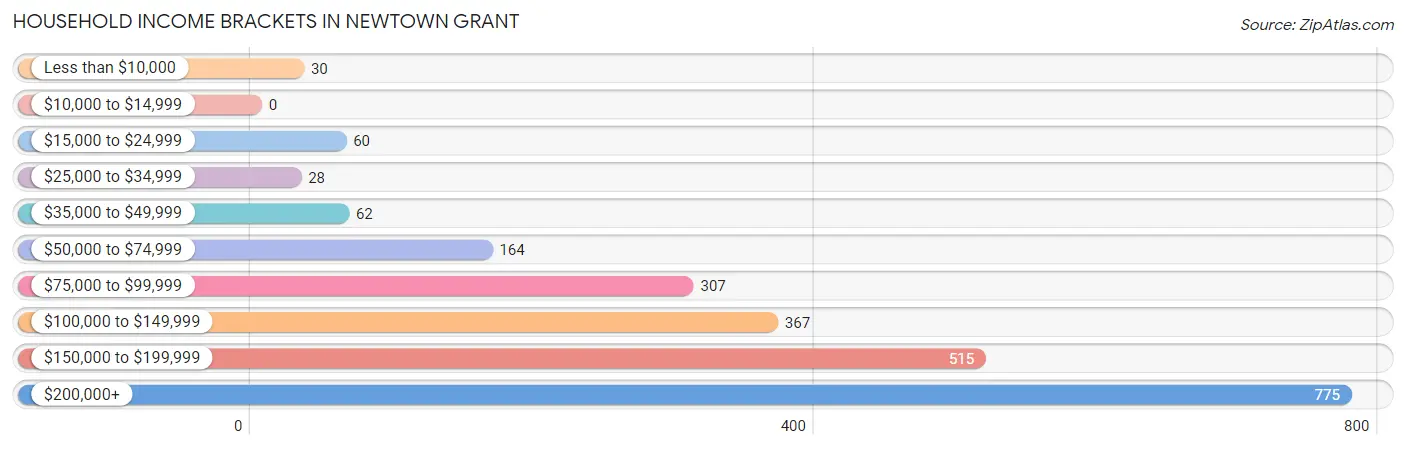
Household Income Brackets in Newtown Grant
With 775 households falling in the category, the $200,000+ income range is the most frequent in Newtown Grant, accounting for 33.6% of all households.
| Income Bracket | # Households | % Households |
| Less than $10,000 | 30 | 1.3% |
| $10,000 to $14,999 | 0 | 0.0% |
| $15,000 to $24,999 | 60 | 2.6% |
| $25,000 to $34,999 | 28 | 1.2% |
| $35,000 to $49,999 | 62 | 2.7% |
| $50,000 to $74,999 | 164 | 7.1% |
| $75,000 to $99,999 | 307 | 13.3% |
| $100,000 to $149,999 | 367 | 15.9% |
| $150,000 to $199,999 | 515 | 22.3% |
| $200,000+ | 775 | 33.6% |
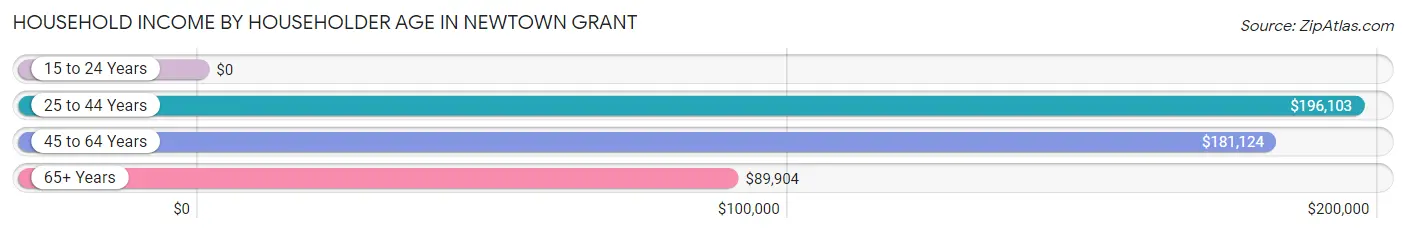
Household Income by Householder Age in Newtown Grant
The median household income in Newtown Grant is $166,346, with the highest median household income of $196,103 found in the 25 to 44 years age bracket for the primary householder. A total of 569 households (24.6%) fall into this category.
| Income Bracket | # Households | Median Income |
| 15 to 24 Years | 0 (0.0%) | $0 |
| 25 to 44 Years | 569 (24.6%) | $196,103 |
| 45 to 64 Years | 1,217 (52.7%) | $181,124 |
| 65+ Years | 522 (22.6%) | $89,904 |
| Total | 2,308 (100.0%) | $166,346 |
Poverty in Newtown Grant
Income Below Poverty by Sex and Age in Newtown Grant
With 1.1% poverty level for males and 1.3% for females among the residents of Newtown Grant, 25 to 34 year old males and 18 to 24 year old females are the most vulnerable to poverty, with 25 males (11.4%) and 22 females (20.9%) in their respective age groups living below the poverty level.
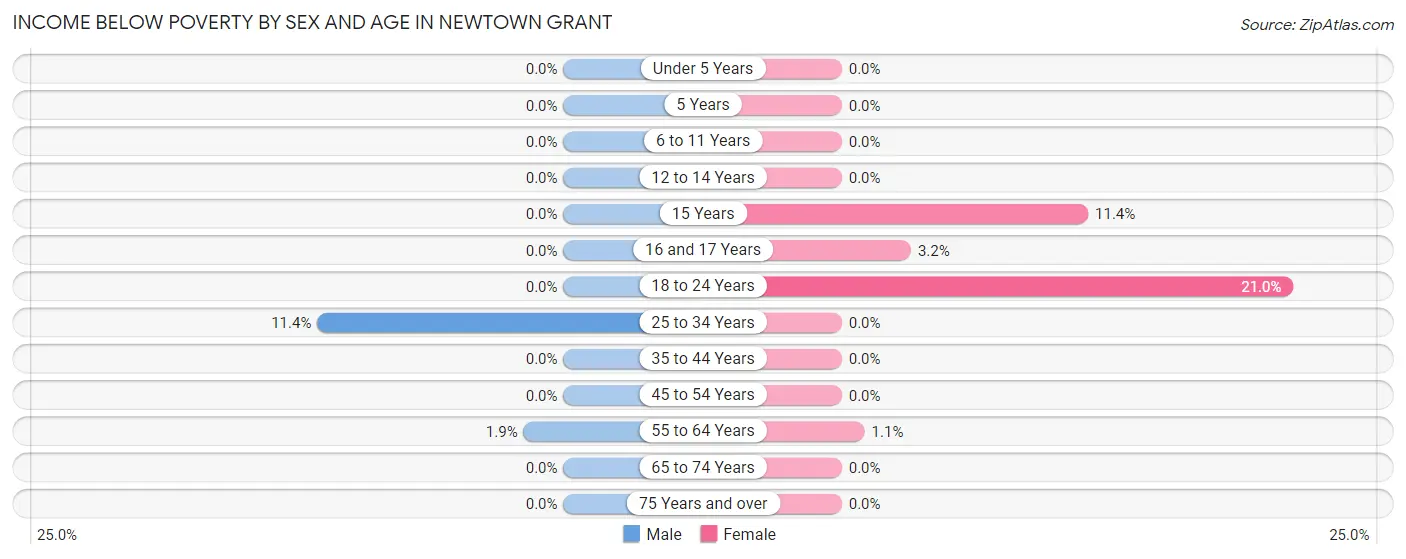
| Age Bracket | Male | Female |
| Under 5 Years | 0 (0.0%) | 0 (0.0%) |
| 5 Years | 0 (0.0%) | 0 (0.0%) |
| 6 to 11 Years | 0 (0.0%) | 0 (0.0%) |
| 12 to 14 Years | 0 (0.0%) | 0 (0.0%) |
| 15 Years | 0 (0.0%) | 4 (11.4%) |
| 16 and 17 Years | 0 (0.0%) | 5 (3.2%) |
| 18 to 24 Years | 0 (0.0%) | 22 (20.9%) |
| 25 to 34 Years | 25 (11.4%) | 0 (0.0%) |
| 35 to 44 Years | 0 (0.0%) | 0 (0.0%) |
| 45 to 54 Years | 0 (0.0%) | 0 (0.0%) |
| 55 to 64 Years | 8 (1.8%) | 5 (1.1%) |
| 65 to 74 Years | 0 (0.0%) | 0 (0.0%) |
| 75 Years and over | 0 (0.0%) | 0 (0.0%) |
| Total | 33 (1.1%) | 36 (1.3%) |
Income Above Poverty by Sex and Age in Newtown Grant
According to the poverty statistics in Newtown Grant, males aged under 5 years and females aged under 5 years are the age groups that are most secure financially, with 100.0% of males and 100.0% of females in these age groups living above the poverty line.
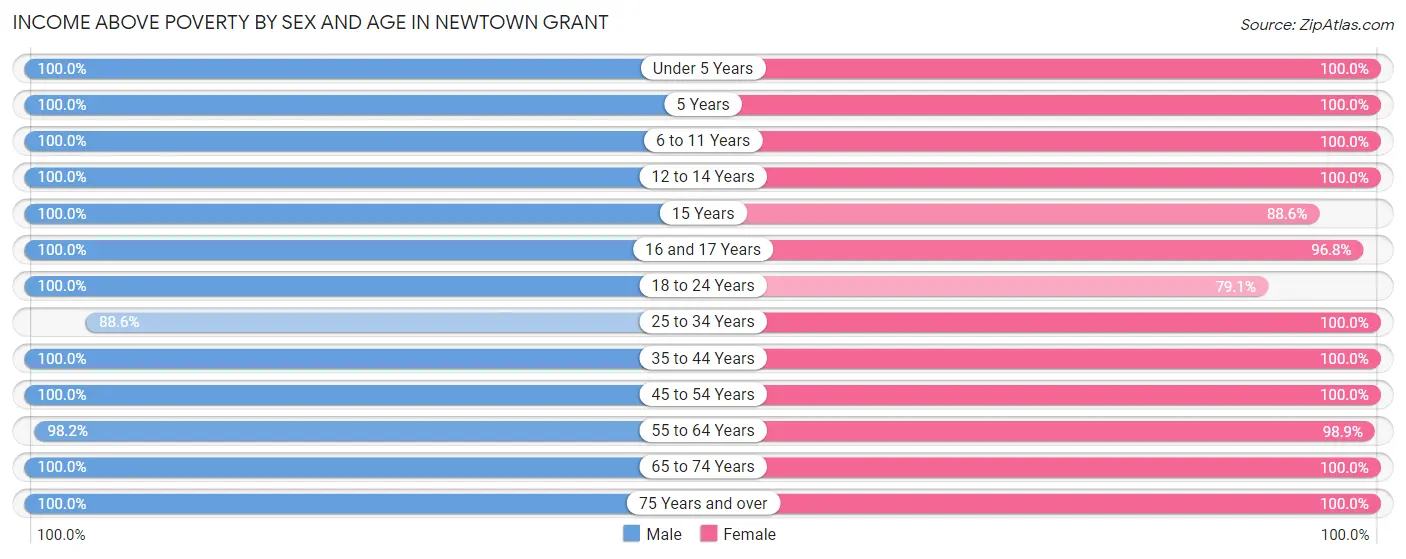
| Age Bracket | Male | Female |
| Under 5 Years | 172 (100.0%) | 101 (100.0%) |
| 5 Years | 6 (100.0%) | 31 (100.0%) |
| 6 to 11 Years | 364 (100.0%) | 193 (100.0%) |
| 12 to 14 Years | 154 (100.0%) | 208 (100.0%) |
| 15 Years | 24 (100.0%) | 31 (88.6%) |
| 16 and 17 Years | 50 (100.0%) | 151 (96.8%) |
| 18 to 24 Years | 78 (100.0%) | 83 (79.0%) |
| 25 to 34 Years | 194 (88.6%) | 121 (100.0%) |
| 35 to 44 Years | 395 (100.0%) | 510 (100.0%) |
| 45 to 54 Years | 664 (100.0%) | 520 (100.0%) |
| 55 to 64 Years | 424 (98.2%) | 468 (98.9%) |
| 65 to 74 Years | 260 (100.0%) | 298 (100.0%) |
| 75 Years and over | 125 (100.0%) | 136 (100.0%) |
| Total | 2,910 (98.9%) | 2,851 (98.8%) |
Income Below Poverty Among Married-Couple Families in Newtown Grant
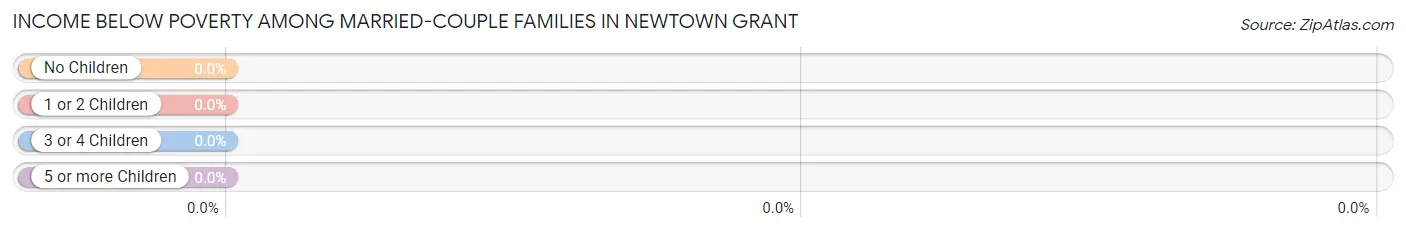
| Children | Above Poverty | Below Poverty |
| No Children | 569 (100.0%) | 0 (0.0%) |
| 1 or 2 Children | 814 (100.0%) | 0 (0.0%) |
| 3 or 4 Children | 98 (100.0%) | 0 (0.0%) |
| 5 or more Children | 0 (0.0%) | 0 (0.0%) |
| Total | 1,481 (100.0%) | 0 (0.0%) |
Income Below Poverty Among Single-Parent Households in Newtown Grant
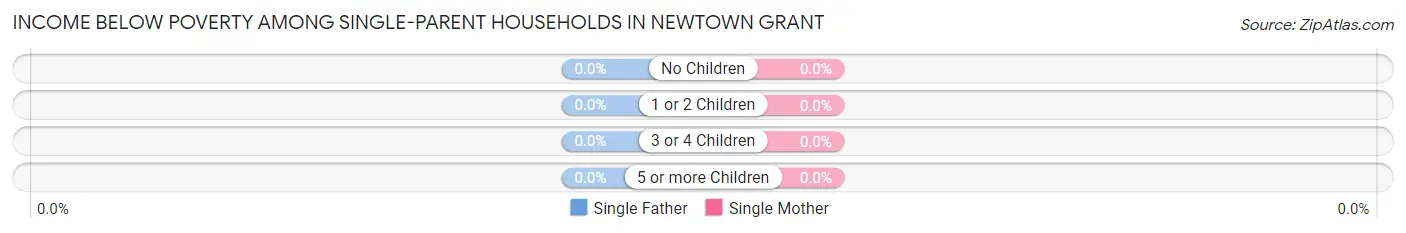
| Children | Single Father | Single Mother |
| No Children | 0 (0.0%) | 0 (0.0%) |
| 1 or 2 Children | 0 (0.0%) | 0 (0.0%) |
| 3 or 4 Children | 0 (0.0%) | 0 (0.0%) |
| 5 or more Children | 0 (0.0%) | 0 (0.0%) |
| Total | 0 (0.0%) | 0 (0.0%) |
Income Below Poverty Among Married-Couple vs Single-Parent Households in Newtown Grant
| Children | Married-Couple Families | Single-Parent Households |
| No Children | 0 (0.0%) | 0 (0.0%) |
| 1 or 2 Children | 0 (0.0%) | 0 (0.0%) |
| 3 or 4 Children | 0 (0.0%) | 0 (0.0%) |
| 5 or more Children | 0 (0.0%) | 0 (0.0%) |
| Total | 0 (0.0%) | 0 (0.0%) |
Employment Characteristics in Newtown Grant
Employment by Class of Employer in Newtown Grant
Among the 3,004 employed individuals in Newtown Grant, private company employees (1,789 | 59.6%), not-for-profit organizations (423 | 14.1%), and self-employed (not incorporated) (334 | 11.1%) make up the most common classes of employment.
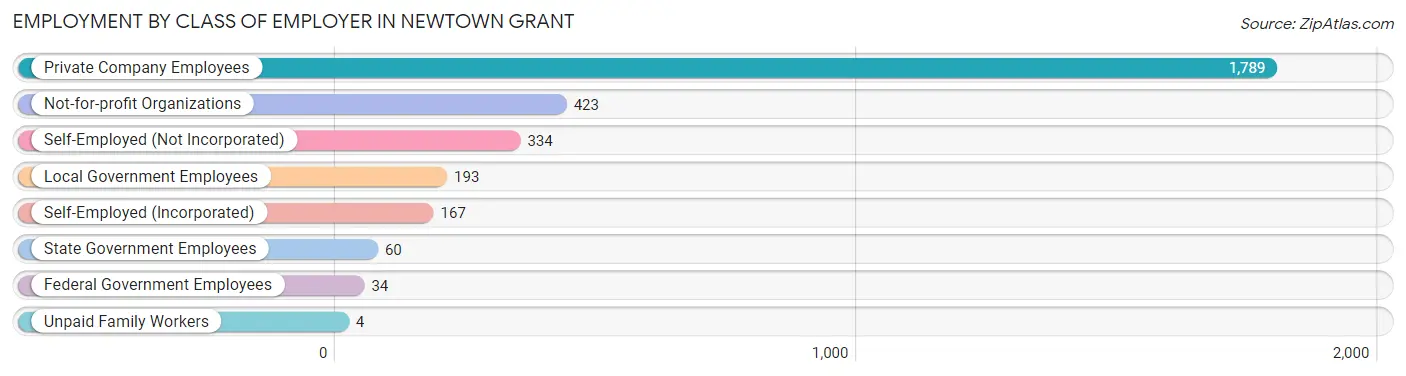
| Employer Class | # Employees | % Employees |
| Private Company Employees | 1,789 | 59.6% |
| Self-Employed (Incorporated) | 167 | 5.6% |
| Self-Employed (Not Incorporated) | 334 | 11.1% |
| Not-for-profit Organizations | 423 | 14.1% |
| Local Government Employees | 193 | 6.4% |
| State Government Employees | 60 | 2.0% |
| Federal Government Employees | 34 | 1.1% |
| Unpaid Family Workers | 4 | 0.1% |
| Total | 3,004 | 100.0% |
Employment Status by Age in Newtown Grant
According to the labor force statistics for Newtown Grant, out of the total population over 16 years of age (4,542), 72.1% or 3,275 individuals are in the labor force, with 6.7% or 219 of them unemployed. The age group with the highest labor force participation rate is 25 to 29 years, with 93.2% or 164 individuals in the labor force. Within the labor force, the 16 to 19 years age range has the highest percentage of unemployed individuals, with 19.4% or 18 of them being unemployed.
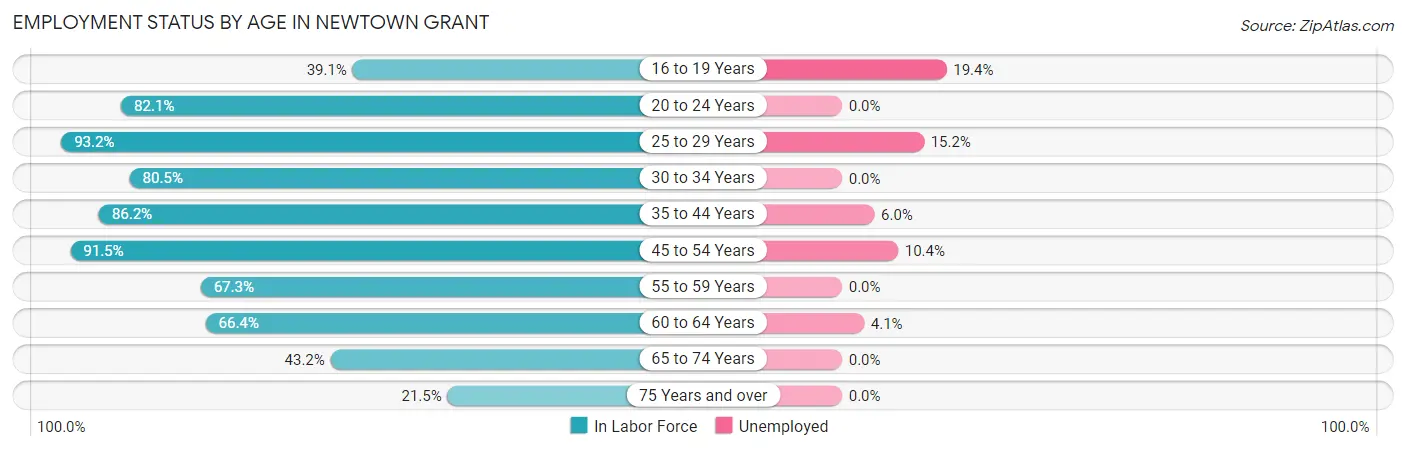
| Age Bracket | In Labor Force | Unemployed |
| 16 to 19 Years | 93 (39.1%) | 18 (19.4%) |
| 20 to 24 Years | 124 (82.1%) | 0 (0.0%) |
| 25 to 29 Years | 164 (93.2%) | 25 (15.2%) |
| 30 to 34 Years | 132 (80.5%) | 0 (0.0%) |
| 35 to 44 Years | 780 (86.2%) | 47 (6.0%) |
| 45 to 54 Years | 1,083 (91.5%) | 113 (10.4%) |
| 55 to 59 Years | 214 (67.3%) | 0 (0.0%) |
| 60 to 64 Years | 390 (66.4%) | 16 (4.1%) |
| 65 to 74 Years | 241 (43.2%) | 0 (0.0%) |
| 75 Years and over | 56 (21.5%) | 0 (0.0%) |
| Total | 3,275 (72.1%) | 219 (6.7%) |
Employment Status by Educational Attainment in Newtown Grant
According to labor force statistics for Newtown Grant, 82.9% of individuals (2,764) out of the total population between 25 and 64 years of age (3,334) are in the labor force, with 7.3% or 202 of them being unemployed. The group with the highest labor force participation rate are those with the educational attainment of less than high school, with 100.0% or 26 individuals in the labor force. Within the labor force, individuals with college / associate degree education have the highest percentage of unemployment, with 22.2% or 98 of them being unemployed.
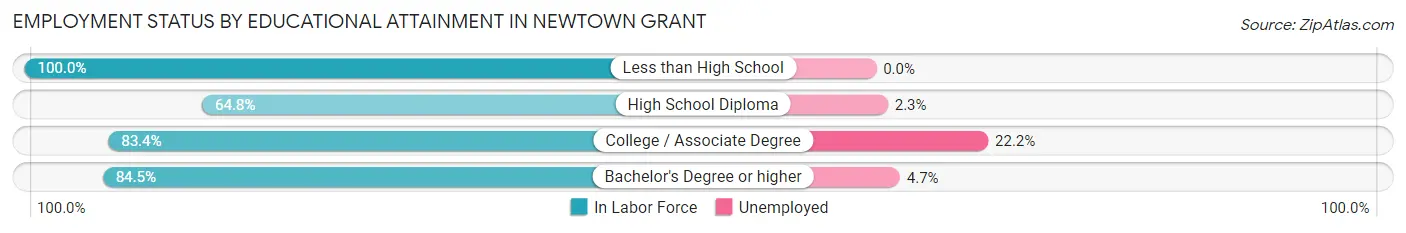
| Educational Attainment | In Labor Force | Unemployed |
| Less than High School | 26 (100.0%) | 0 (0.0%) |
| High School Diploma | 171 (64.8%) | 6 (2.3%) |
| College / Associate Degree | 441 (83.4%) | 117 (22.2%) |
| Bachelor's Degree or higher | 2,125 (84.5%) | 118 (4.7%) |
| Total | 2,764 (82.9%) | 243 (7.3%) |
Employment Occupations by Sex in Newtown Grant
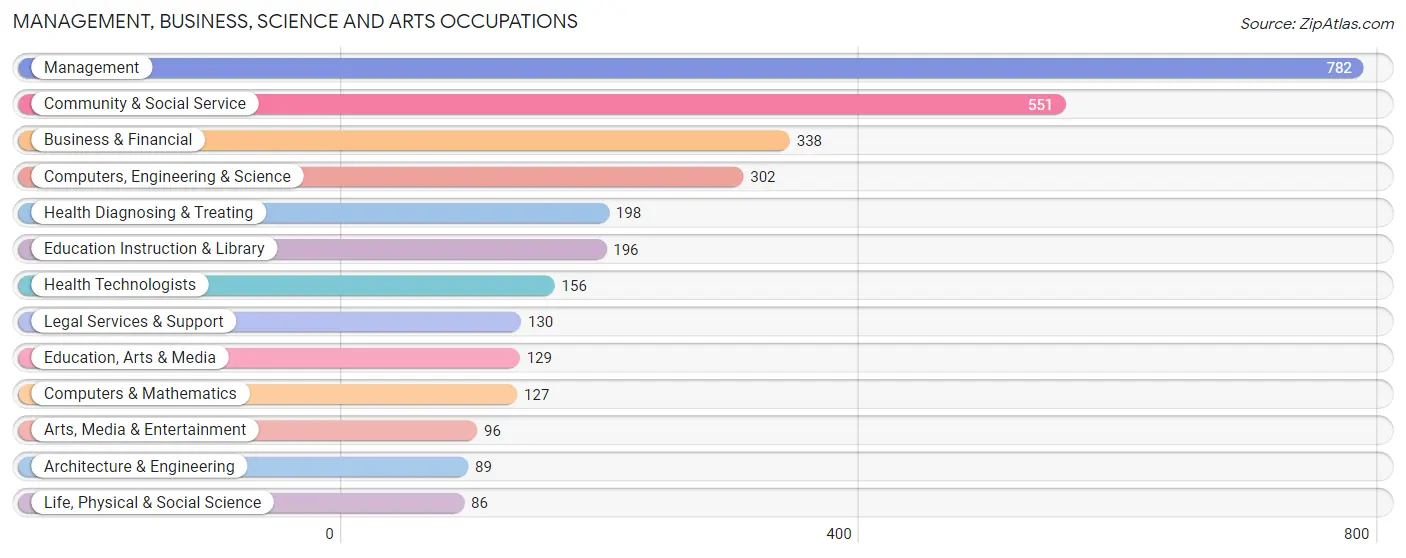
Management, Business, Science and Arts Occupations
The most common Management, Business, Science and Arts occupations in Newtown Grant are Management (782 | 25.6%), Community & Social Service (551 | 18.0%), Business & Financial (338 | 11.1%), Computers, Engineering & Science (302 | 9.9%), and Health Diagnosing & Treating (198 | 6.5%).
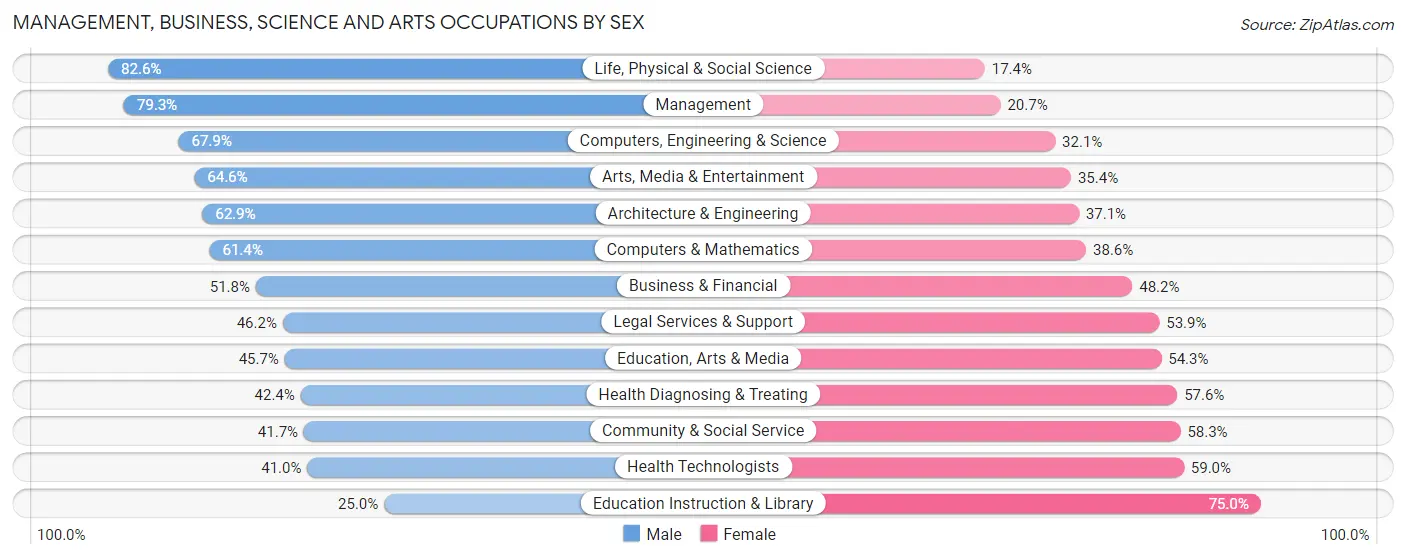
Management, Business, Science and Arts Occupations by Sex
Within the Management, Business, Science and Arts occupations in Newtown Grant, the most male-oriented occupations are Life, Physical & Social Science (82.6%), Management (79.3%), and Computers, Engineering & Science (67.9%), while the most female-oriented occupations are Education Instruction & Library (75.0%), Health Technologists (59.0%), and Community & Social Service (58.3%).
| Occupation | Male | Female |
| Management | 620 (79.3%) | 162 (20.7%) |
| Business & Financial | 175 (51.8%) | 163 (48.2%) |
| Computers, Engineering & Science | 205 (67.9%) | 97 (32.1%) |
| Computers & Mathematics | 78 (61.4%) | 49 (38.6%) |
| Architecture & Engineering | 56 (62.9%) | 33 (37.1%) |
| Life, Physical & Social Science | 71 (82.6%) | 15 (17.4%) |
| Community & Social Service | 230 (41.7%) | 321 (58.3%) |
| Education, Arts & Media | 59 (45.7%) | 70 (54.3%) |
| Legal Services & Support | 60 (46.2%) | 70 (53.8%) |
| Education Instruction & Library | 49 (25.0%) | 147 (75.0%) |
| Arts, Media & Entertainment | 62 (64.6%) | 34 (35.4%) |
| Health Diagnosing & Treating | 84 (42.4%) | 114 (57.6%) |
| Health Technologists | 64 (41.0%) | 92 (59.0%) |
| Total (Category) | 1,314 (60.5%) | 857 (39.5%) |
| Total (Overall) | 1,746 (57.1%) | 1,312 (42.9%) |
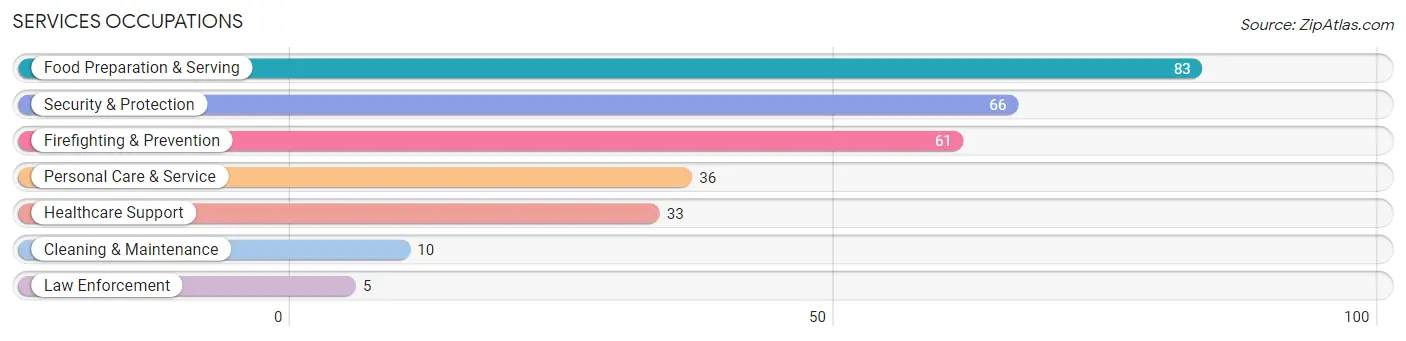
Services Occupations
The most common Services occupations in Newtown Grant are Food Preparation & Serving (83 | 2.7%), Security & Protection (66 | 2.2%), Firefighting & Prevention (61 | 2.0%), Personal Care & Service (36 | 1.2%), and Healthcare Support (33 | 1.1%).
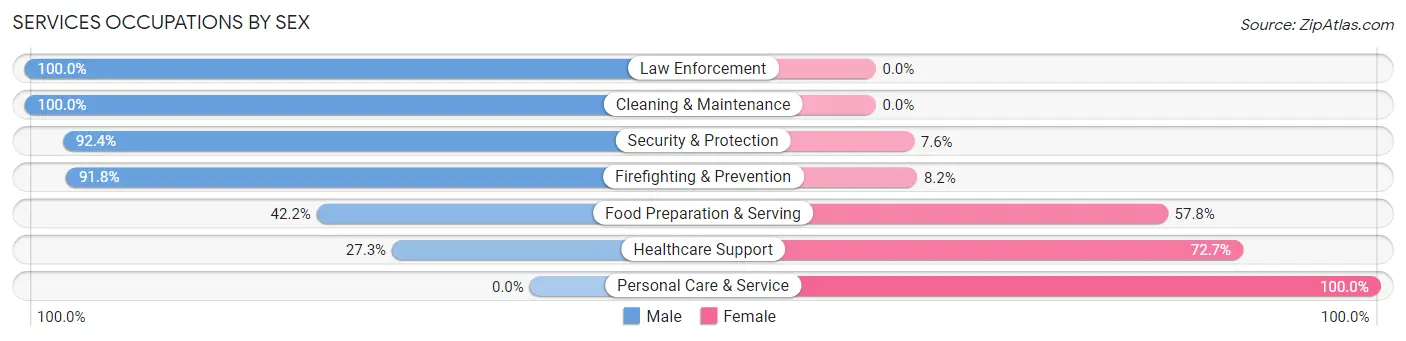
Services Occupations by Sex
Within the Services occupations in Newtown Grant, the most male-oriented occupations are Law Enforcement (100.0%), Cleaning & Maintenance (100.0%), and Security & Protection (92.4%), while the most female-oriented occupations are Personal Care & Service (100.0%), Healthcare Support (72.7%), and Food Preparation & Serving (57.8%).
| Occupation | Male | Female |
| Healthcare Support | 9 (27.3%) | 24 (72.7%) |
| Security & Protection | 61 (92.4%) | 5 (7.6%) |
| Firefighting & Prevention | 56 (91.8%) | 5 (8.2%) |
| Law Enforcement | 5 (100.0%) | 0 (0.0%) |
| Food Preparation & Serving | 35 (42.2%) | 48 (57.8%) |
| Cleaning & Maintenance | 10 (100.0%) | 0 (0.0%) |
| Personal Care & Service | 0 (0.0%) | 36 (100.0%) |
| Total (Category) | 115 (50.4%) | 113 (49.6%) |
| Total (Overall) | 1,746 (57.1%) | 1,312 (42.9%) |
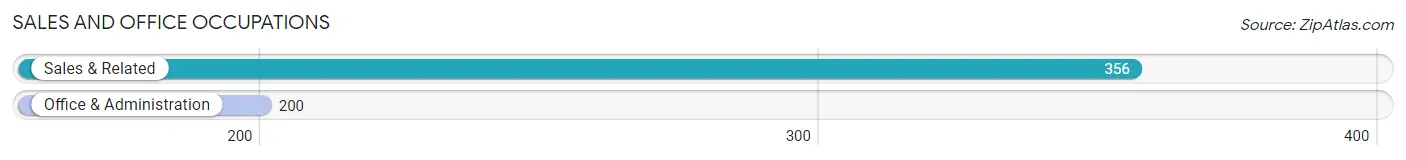
Sales and Office Occupations
The most common Sales and Office occupations in Newtown Grant are Sales & Related (356 | 11.6%), and Office & Administration (200 | 6.5%).
Sales and Office Occupations by Sex
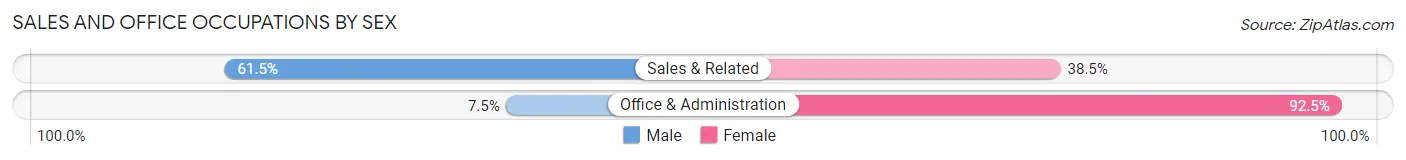
| Occupation | Male | Female |
| Sales & Related | 219 (61.5%) | 137 (38.5%) |
| Office & Administration | 15 (7.5%) | 185 (92.5%) |
| Total (Category) | 234 (42.1%) | 322 (57.9%) |
| Total (Overall) | 1,746 (57.1%) | 1,312 (42.9%) |
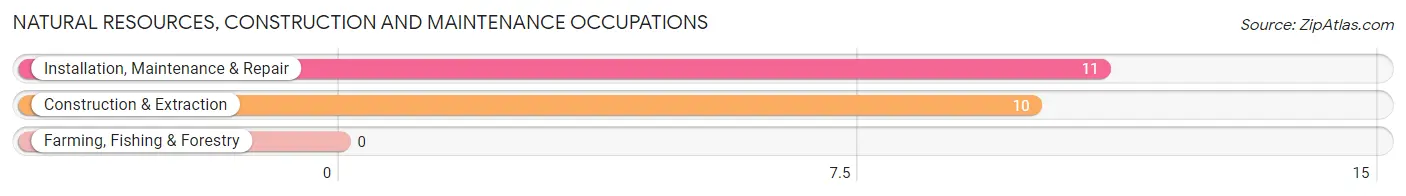
Natural Resources, Construction and Maintenance Occupations
The most common Natural Resources, Construction and Maintenance occupations in Newtown Grant are Installation, Maintenance & Repair (11 | 0.4%), and Construction & Extraction (10 | 0.3%).
Natural Resources, Construction and Maintenance Occupations by Sex
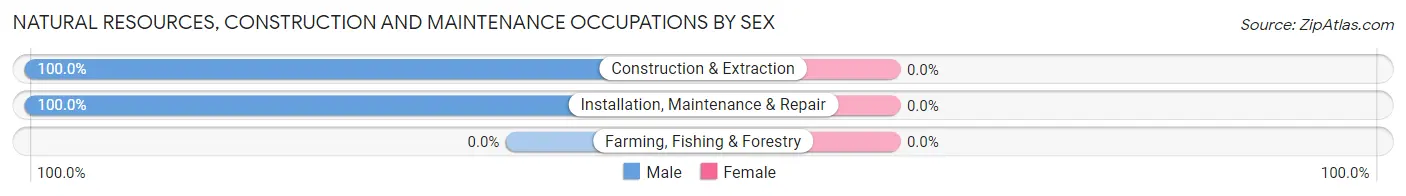
| Occupation | Male | Female |
| Farming, Fishing & Forestry | 0 (0.0%) | 0 (0.0%) |
| Construction & Extraction | 10 (100.0%) | 0 (0.0%) |
| Installation, Maintenance & Repair | 11 (100.0%) | 0 (0.0%) |
| Total (Category) | 21 (100.0%) | 0 (0.0%) |
| Total (Overall) | 1,746 (57.1%) | 1,312 (42.9%) |
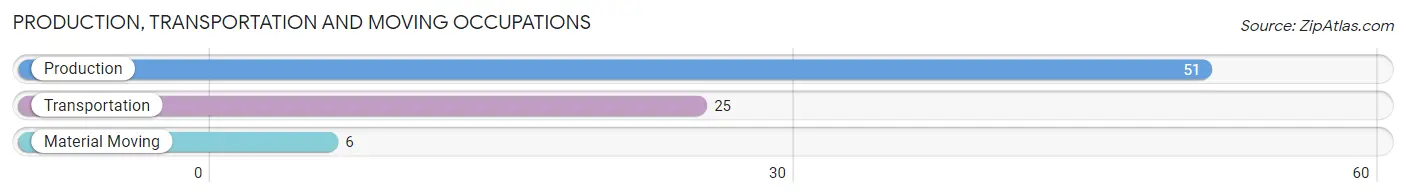
Production, Transportation and Moving Occupations
The most common Production, Transportation and Moving occupations in Newtown Grant are Production (51 | 1.7%), Transportation (25 | 0.8%), and Material Moving (6 | 0.2%).
Production, Transportation and Moving Occupations by Sex
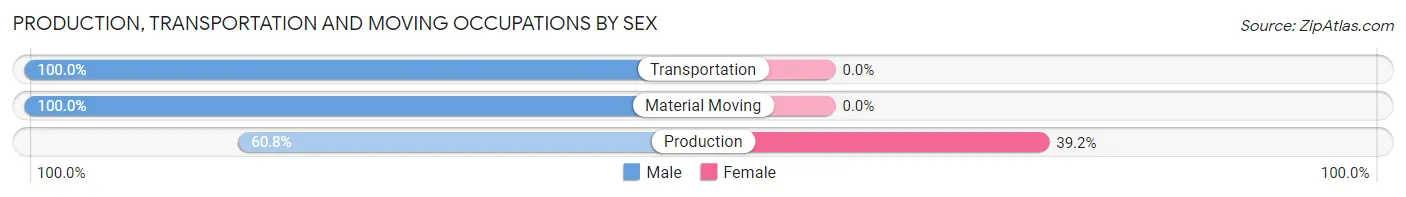
| Occupation | Male | Female |
| Production | 31 (60.8%) | 20 (39.2%) |
| Transportation | 25 (100.0%) | 0 (0.0%) |
| Material Moving | 6 (100.0%) | 0 (0.0%) |
| Total (Category) | 62 (75.6%) | 20 (24.4%) |
| Total (Overall) | 1,746 (57.1%) | 1,312 (42.9%) |
Employment Industries by Sex in Newtown Grant
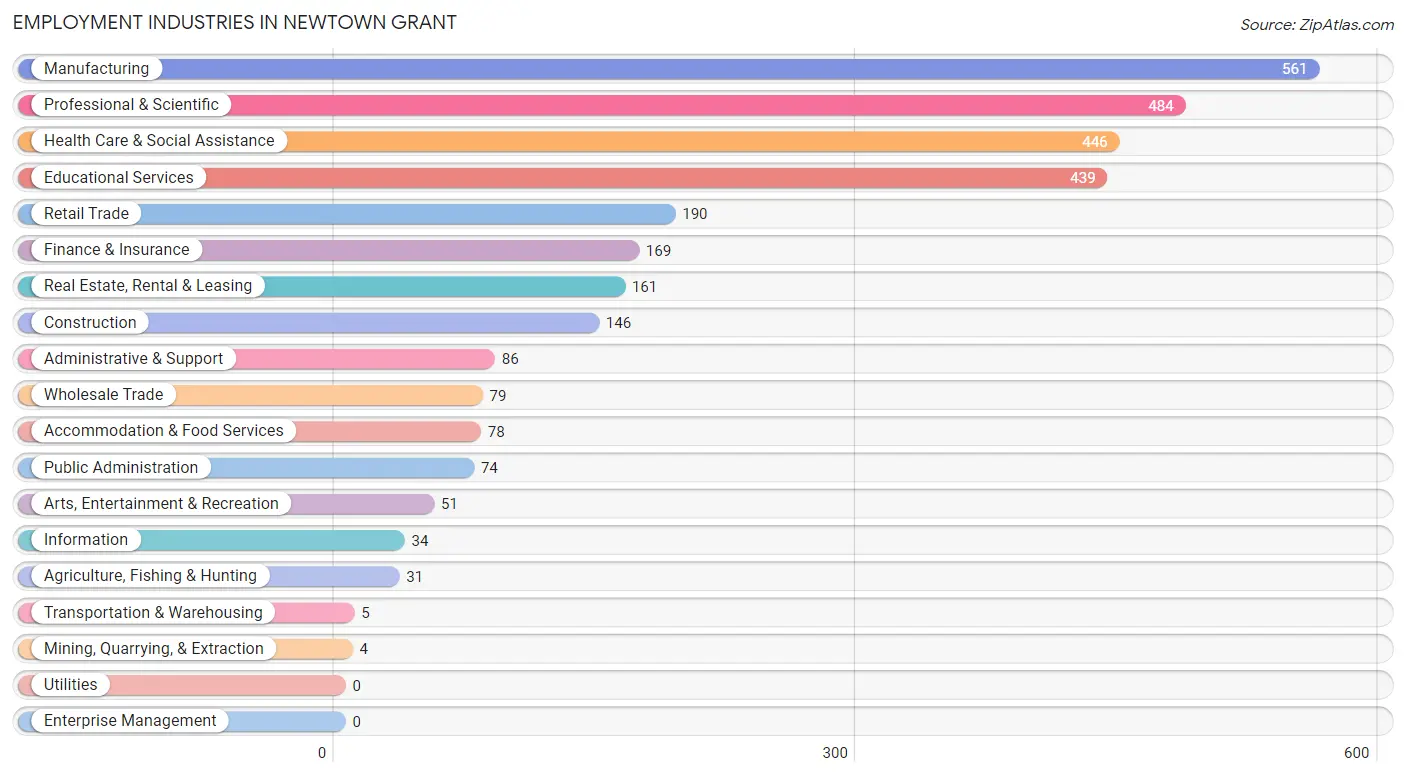
Employment Industries in Newtown Grant
The major employment industries in Newtown Grant include Manufacturing (561 | 18.3%), Professional & Scientific (484 | 15.8%), Health Care & Social Assistance (446 | 14.6%), Educational Services (439 | 14.4%), and Retail Trade (190 | 6.2%).
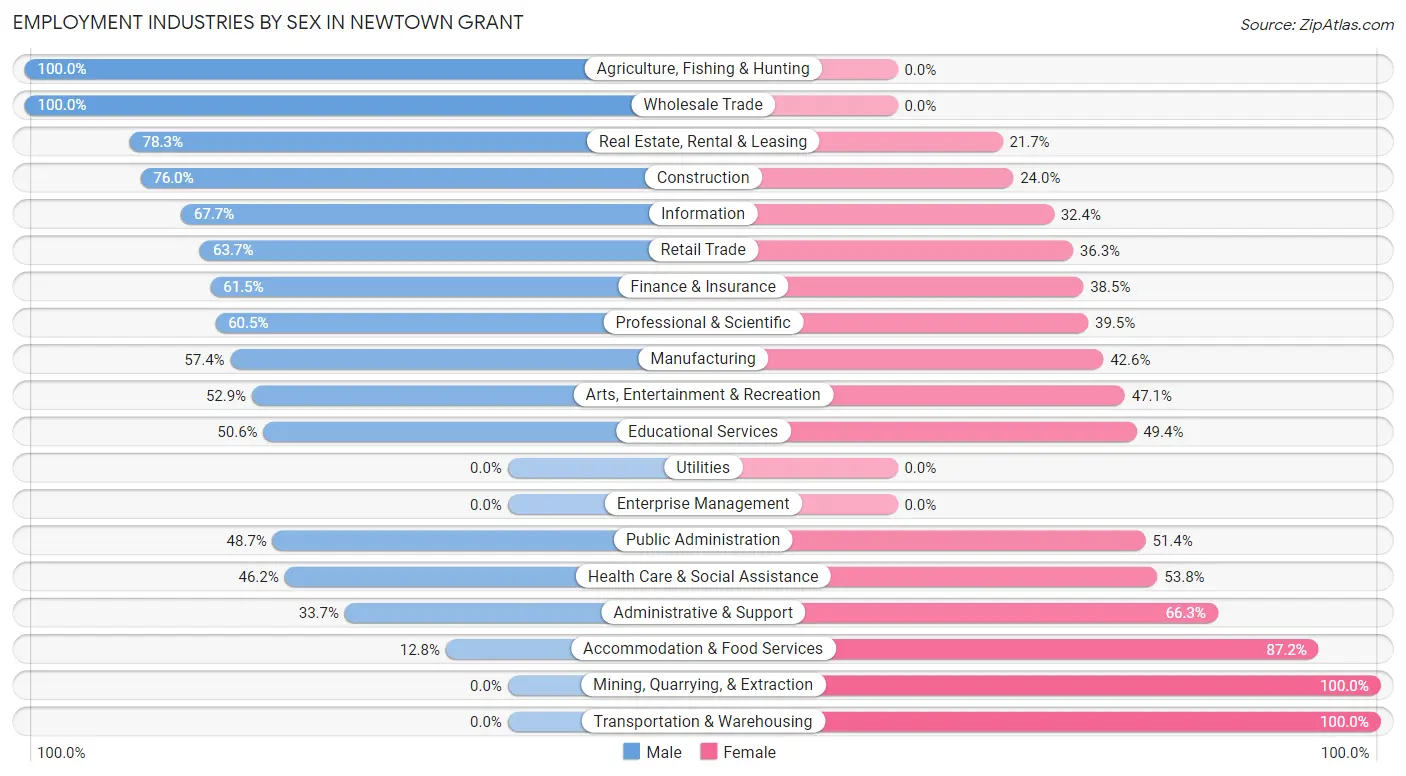
Employment Industries by Sex in Newtown Grant
The Newtown Grant industries that see more men than women are Agriculture, Fishing & Hunting (100.0%), Wholesale Trade (100.0%), and Real Estate, Rental & Leasing (78.3%), whereas the industries that tend to have a higher number of women are Mining, Quarrying, & Extraction (100.0%), Transportation & Warehousing (100.0%), and Accommodation & Food Services (87.2%).
| Industry | Male | Female |
| Agriculture, Fishing & Hunting | 31 (100.0%) | 0 (0.0%) |
| Mining, Quarrying, & Extraction | 0 (0.0%) | 4 (100.0%) |
| Construction | 111 (76.0%) | 35 (24.0%) |
| Manufacturing | 322 (57.4%) | 239 (42.6%) |
| Wholesale Trade | 79 (100.0%) | 0 (0.0%) |
| Retail Trade | 121 (63.7%) | 69 (36.3%) |
| Transportation & Warehousing | 0 (0.0%) | 5 (100.0%) |
| Utilities | 0 (0.0%) | 0 (0.0%) |
| Information | 23 (67.6%) | 11 (32.4%) |
| Finance & Insurance | 104 (61.5%) | 65 (38.5%) |
| Real Estate, Rental & Leasing | 126 (78.3%) | 35 (21.7%) |
| Professional & Scientific | 293 (60.5%) | 191 (39.5%) |
| Enterprise Management | 0 (0.0%) | 0 (0.0%) |
| Administrative & Support | 29 (33.7%) | 57 (66.3%) |
| Educational Services | 222 (50.6%) | 217 (49.4%) |
| Health Care & Social Assistance | 206 (46.2%) | 240 (53.8%) |
| Arts, Entertainment & Recreation | 27 (52.9%) | 24 (47.1%) |
| Accommodation & Food Services | 10 (12.8%) | 68 (87.2%) |
| Public Administration | 36 (48.6%) | 38 (51.3%) |
| Total | 1,746 (57.1%) | 1,312 (42.9%) |
Education in Newtown Grant
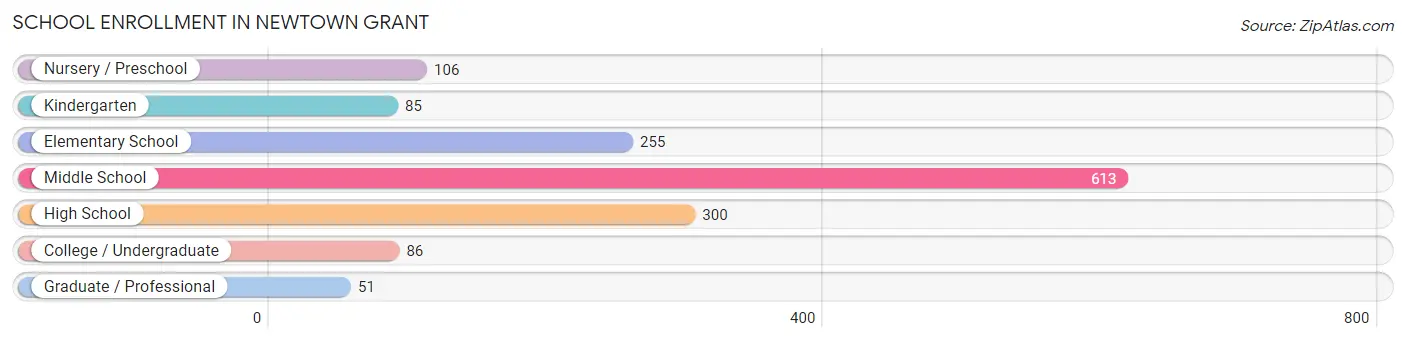
School Enrollment in Newtown Grant
The most common levels of schooling among the 1,496 students in Newtown Grant are middle school (613 | 41.0%), high school (300 | 20.1%), and elementary school (255 | 17.1%).
| School Level | # Students | % Students |
| Nursery / Preschool | 106 | 7.1% |
| Kindergarten | 85 | 5.7% |
| Elementary School | 255 | 17.1% |
| Middle School | 613 | 41.0% |
| High School | 300 | 20.1% |
| College / Undergraduate | 86 | 5.8% |
| Graduate / Professional | 51 | 3.4% |
| Total | 1,496 | 100.0% |
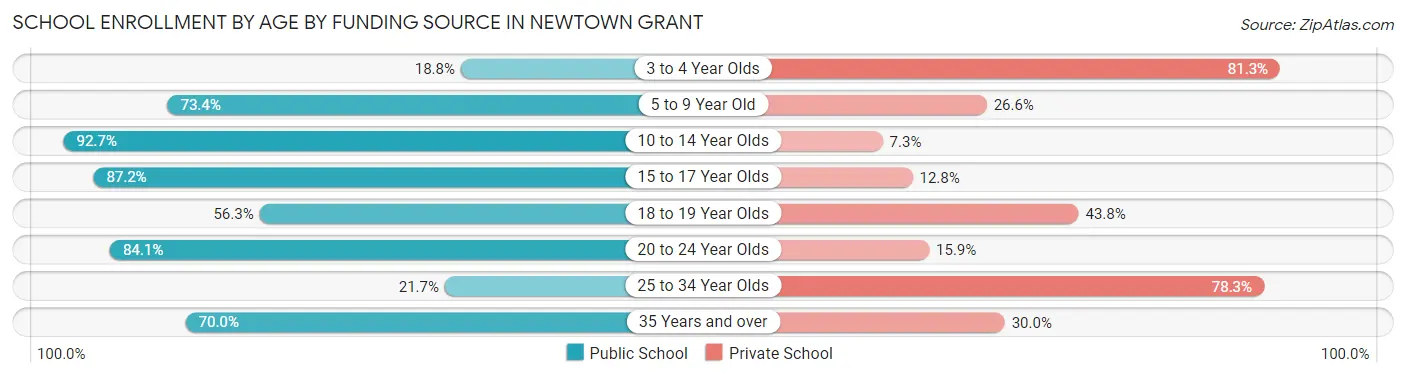
School Enrollment by Age by Funding Source in Newtown Grant
Out of a total of 1,496 students who are enrolled in schools in Newtown Grant, 293 (19.6%) attend a private institution, while the remaining 1,203 (80.4%) are enrolled in public schools. The age group of 3 to 4 year olds has the highest likelihood of being enrolled in private schools, with 78 (81.2% in the age bracket) enrolled. Conversely, the age group of 10 to 14 year olds has the lowest likelihood of being enrolled in a private school, with 651 (92.7% in the age bracket) attending a public institution.
| Age Bracket | Public School | Private School |
| 3 to 4 Year Olds | 18 (18.8%) | 78 (81.2%) |
| 5 to 9 Year Old | 201 (73.4%) | 73 (26.6%) |
| 10 to 14 Year Olds | 651 (92.7%) | 51 (7.3%) |
| 15 to 17 Year Olds | 231 (87.2%) | 34 (12.8%) |
| 18 to 19 Year Olds | 18 (56.2%) | 14 (43.8%) |
| 20 to 24 Year Olds | 37 (84.1%) | 7 (15.9%) |
| 25 to 34 Year Olds | 5 (21.7%) | 18 (78.3%) |
| 35 Years and over | 42 (70.0%) | 18 (30.0%) |
| Total | 1,203 (80.4%) | 293 (19.6%) |
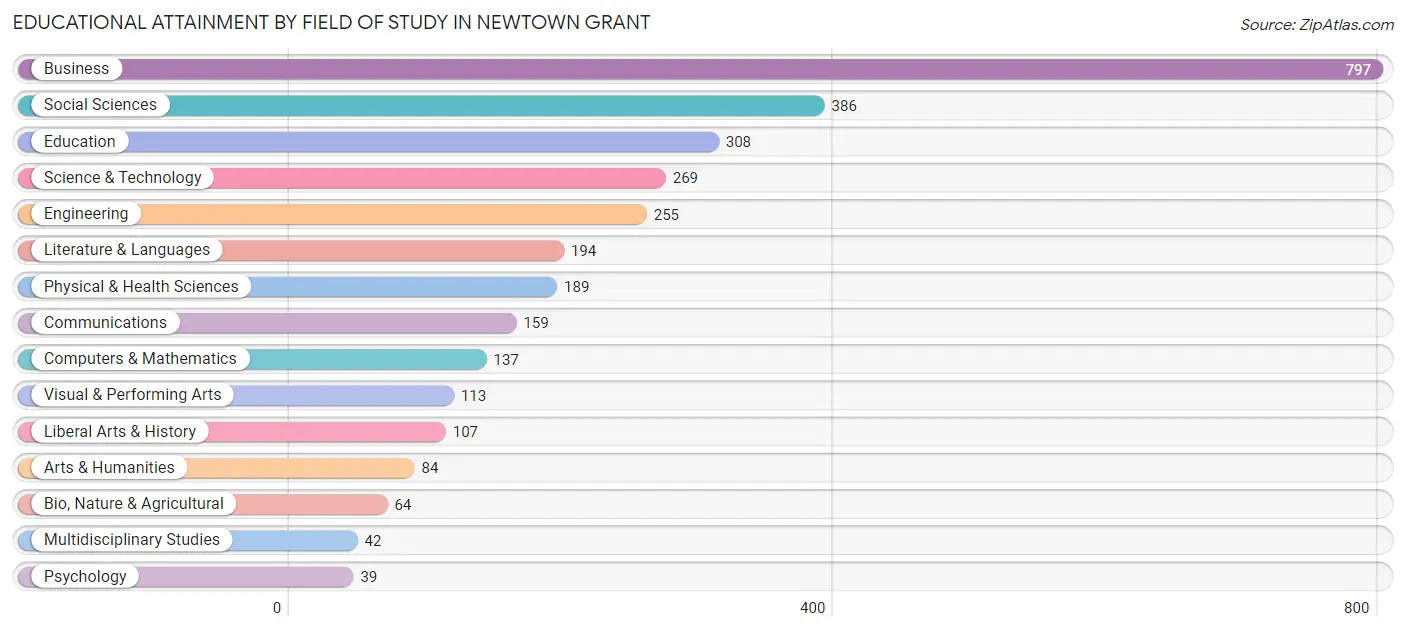
Educational Attainment by Field of Study in Newtown Grant
Business (797 | 25.4%), social sciences (386 | 12.3%), education (308 | 9.8%), science & technology (269 | 8.6%), and engineering (255 | 8.1%) are the most common fields of study among 3,143 individuals in Newtown Grant who have obtained a bachelor's degree or higher.
| Field of Study | # Graduates | % Graduates |
| Computers & Mathematics | 137 | 4.4% |
| Bio, Nature & Agricultural | 64 | 2.0% |
| Physical & Health Sciences | 189 | 6.0% |
| Psychology | 39 | 1.2% |
| Social Sciences | 386 | 12.3% |
| Engineering | 255 | 8.1% |
| Multidisciplinary Studies | 42 | 1.3% |
| Science & Technology | 269 | 8.6% |
| Business | 797 | 25.4% |
| Education | 308 | 9.8% |
| Literature & Languages | 194 | 6.2% |
| Liberal Arts & History | 107 | 3.4% |
| Visual & Performing Arts | 113 | 3.6% |
| Communications | 159 | 5.1% |
| Arts & Humanities | 84 | 2.7% |
| Total | 3,143 | 100.0% |
Transportation & Commute in Newtown Grant
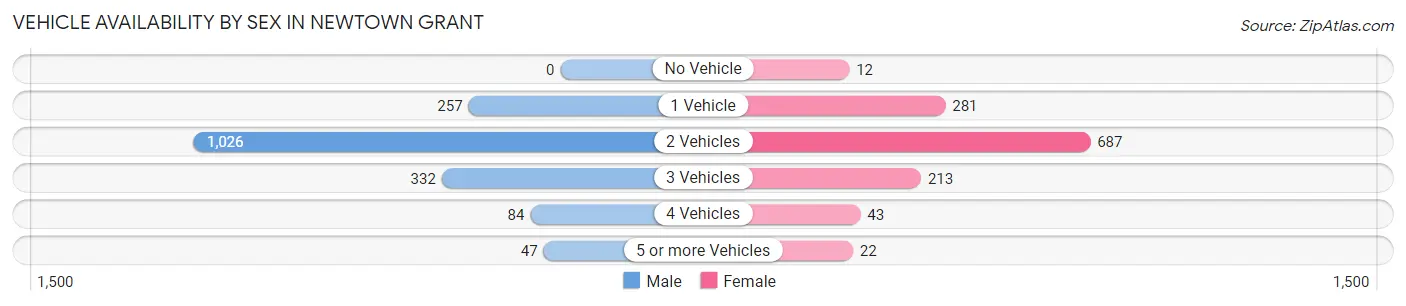
Vehicle Availability by Sex in Newtown Grant
The most prevalent vehicle ownership categories in Newtown Grant are males with 2 vehicles (1,026, accounting for 58.8%) and females with 2 vehicles (687, making up 81.6%).
| Vehicles Available | Male | Female |
| No Vehicle | 0 (0.0%) | 12 (0.9%) |
| 1 Vehicle | 257 (14.7%) | 281 (22.3%) |
| 2 Vehicles | 1,026 (58.8%) | 687 (54.6%) |
| 3 Vehicles | 332 (19.0%) | 213 (16.9%) |
| 4 Vehicles | 84 (4.8%) | 43 (3.4%) |
| 5 or more Vehicles | 47 (2.7%) | 22 (1.8%) |
| Total | 1,746 (100.0%) | 1,258 (100.0%) |
Commute Time in Newtown Grant
The most frequently occuring commute durations in Newtown Grant are 60 to 89 minutes (360 commuters, 16.0%), 20 to 24 minutes (355 commuters, 15.8%), and 30 to 34 minutes (352 commuters, 15.6%).
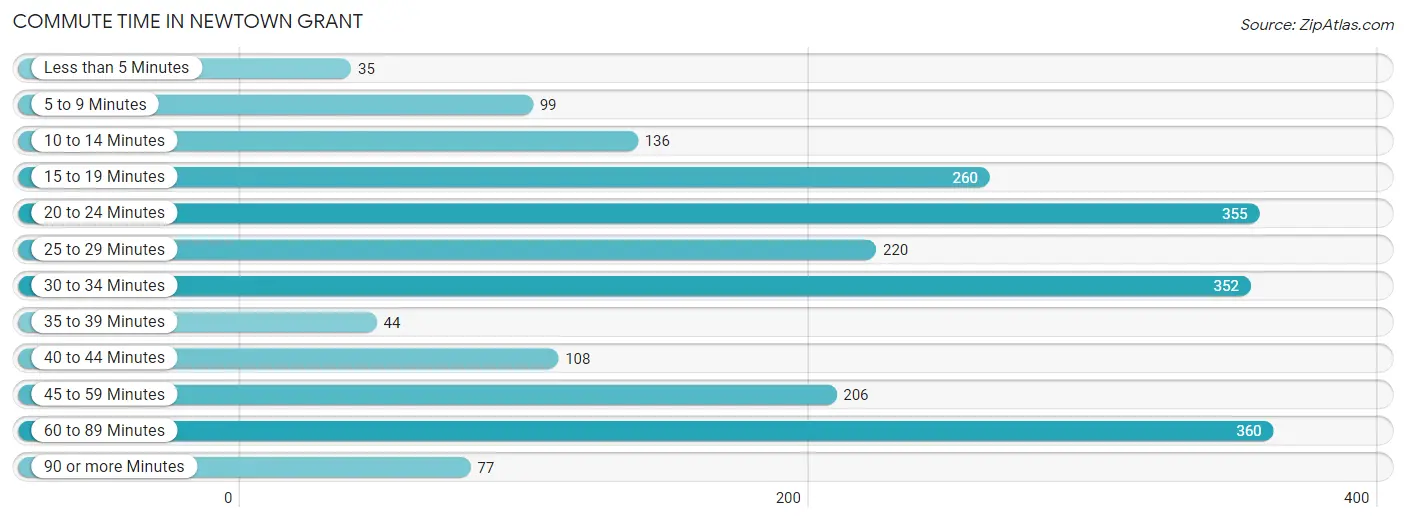
| Commute Time | # Commuters | % Commuters |
| Less than 5 Minutes | 35 | 1.5% |
| 5 to 9 Minutes | 99 | 4.4% |
| 10 to 14 Minutes | 136 | 6.0% |
| 15 to 19 Minutes | 260 | 11.6% |
| 20 to 24 Minutes | 355 | 15.8% |
| 25 to 29 Minutes | 220 | 9.8% |
| 30 to 34 Minutes | 352 | 15.6% |
| 35 to 39 Minutes | 44 | 1.9% |
| 40 to 44 Minutes | 108 | 4.8% |
| 45 to 59 Minutes | 206 | 9.1% |
| 60 to 89 Minutes | 360 | 16.0% |
| 90 or more Minutes | 77 | 3.4% |
Commute Time by Sex in Newtown Grant
The most common commute times in Newtown Grant are 60 to 89 minutes (296 commuters, 22.8%) for males and 20 to 24 minutes (170 commuters, 17.8%) for females.
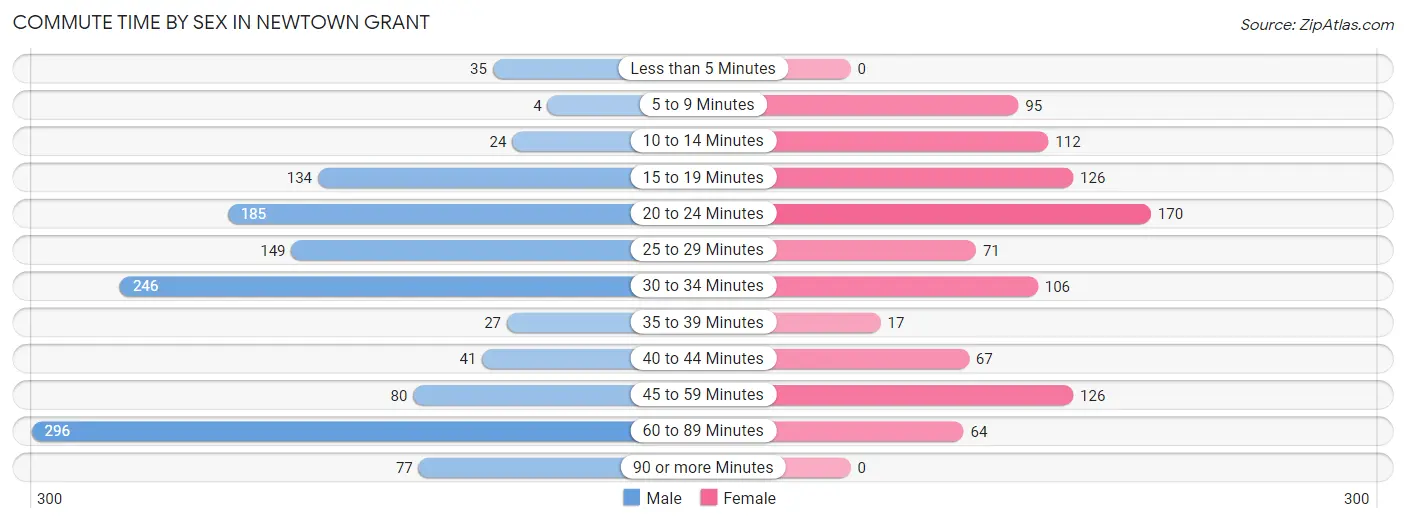
| Commute Time | Male | Female |
| Less than 5 Minutes | 35 (2.7%) | 0 (0.0%) |
| 5 to 9 Minutes | 4 (0.3%) | 95 (10.0%) |
| 10 to 14 Minutes | 24 (1.8%) | 112 (11.7%) |
| 15 to 19 Minutes | 134 (10.3%) | 126 (13.2%) |
| 20 to 24 Minutes | 185 (14.2%) | 170 (17.8%) |
| 25 to 29 Minutes | 149 (11.5%) | 71 (7.4%) |
| 30 to 34 Minutes | 246 (19.0%) | 106 (11.1%) |
| 35 to 39 Minutes | 27 (2.1%) | 17 (1.8%) |
| 40 to 44 Minutes | 41 (3.2%) | 67 (7.0%) |
| 45 to 59 Minutes | 80 (6.2%) | 126 (13.2%) |
| 60 to 89 Minutes | 296 (22.8%) | 64 (6.7%) |
| 90 or more Minutes | 77 (5.9%) | 0 (0.0%) |
Time of Departure to Work by Sex in Newtown Grant
The most frequent times of departure to work in Newtown Grant are 7:00 AM to 7:29 AM (290, 22.3%) for males and 7:00 AM to 7:29 AM (221, 23.2%) for females.
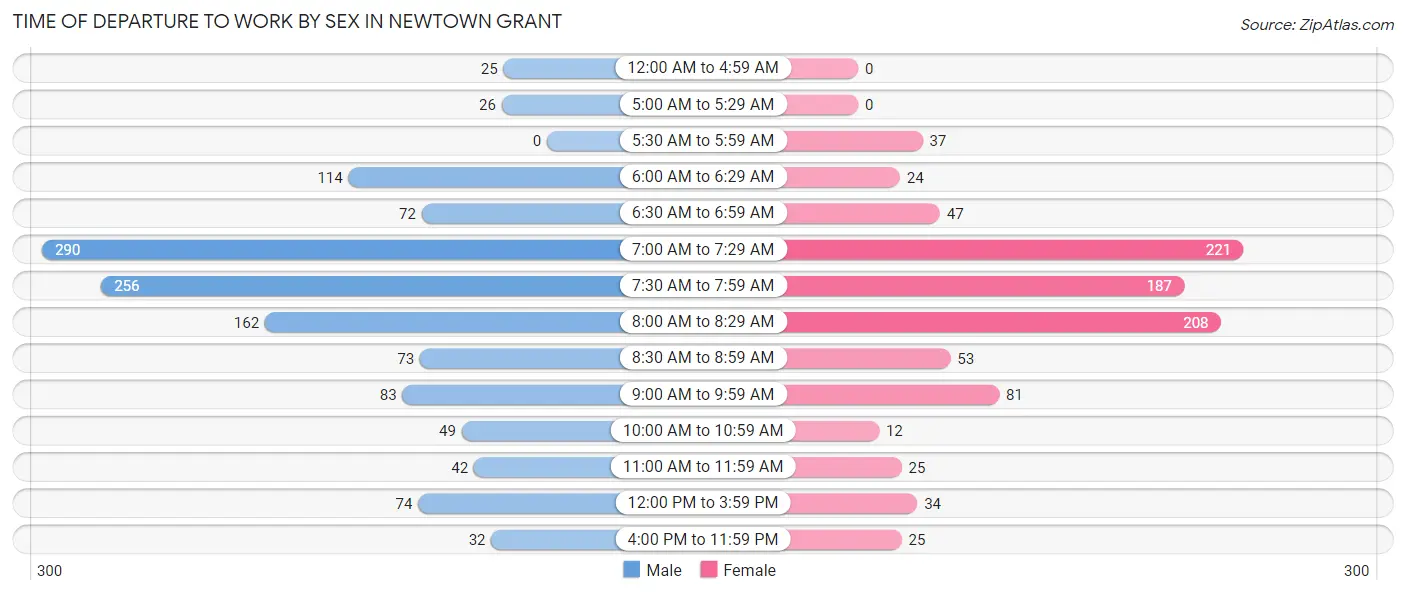
| Time of Departure | Male | Female |
| 12:00 AM to 4:59 AM | 25 (1.9%) | 0 (0.0%) |
| 5:00 AM to 5:29 AM | 26 (2.0%) | 0 (0.0%) |
| 5:30 AM to 5:59 AM | 0 (0.0%) | 37 (3.9%) |
| 6:00 AM to 6:29 AM | 114 (8.8%) | 24 (2.5%) |
| 6:30 AM to 6:59 AM | 72 (5.6%) | 47 (4.9%) |
| 7:00 AM to 7:29 AM | 290 (22.3%) | 221 (23.2%) |
| 7:30 AM to 7:59 AM | 256 (19.7%) | 187 (19.6%) |
| 8:00 AM to 8:29 AM | 162 (12.5%) | 208 (21.8%) |
| 8:30 AM to 8:59 AM | 73 (5.6%) | 53 (5.6%) |
| 9:00 AM to 9:59 AM | 83 (6.4%) | 81 (8.5%) |
| 10:00 AM to 10:59 AM | 49 (3.8%) | 12 (1.3%) |
| 11:00 AM to 11:59 AM | 42 (3.2%) | 25 (2.6%) |
| 12:00 PM to 3:59 PM | 74 (5.7%) | 34 (3.6%) |
| 4:00 PM to 11:59 PM | 32 (2.5%) | 25 (2.6%) |
| Total | 1,298 (100.0%) | 954 (100.0%) |
Housing Occupancy in Newtown Grant
Occupancy by Ownership in Newtown Grant
Of the total 2,308 dwellings in Newtown Grant, owner-occupied units account for 2,026 (87.8%), while renter-occupied units make up 282 (12.2%).
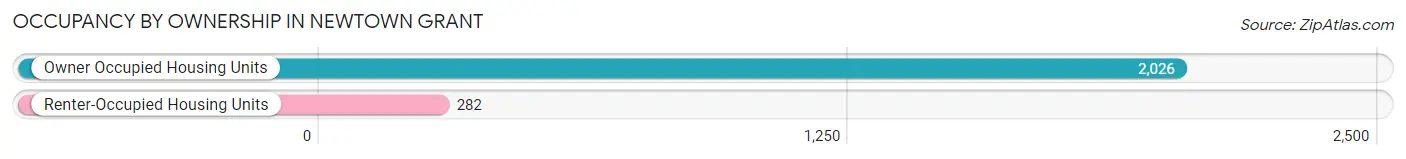
| Occupancy | # Housing Units | % Housing Units |
| Owner Occupied Housing Units | 2,026 | 87.8% |
| Renter-Occupied Housing Units | 282 | 12.2% |
| Total Occupied Housing Units | 2,308 | 100.0% |
Occupancy by Household Size in Newtown Grant
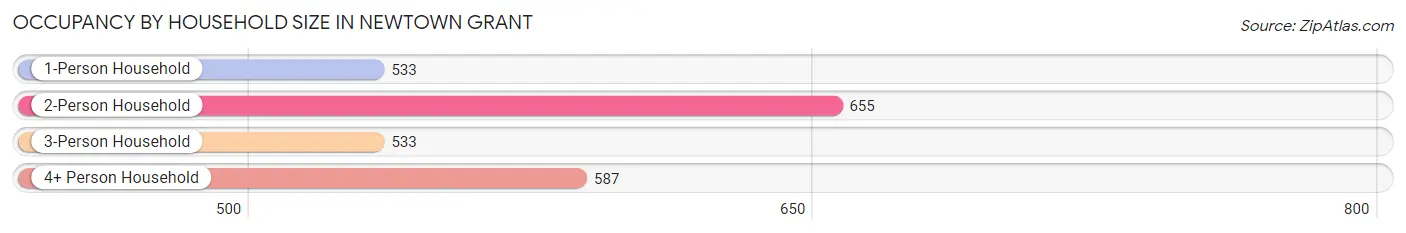
| Household Size | # Housing Units | % Housing Units |
| 1-Person Household | 533 | 23.1% |
| 2-Person Household | 655 | 28.4% |
| 3-Person Household | 533 | 23.1% |
| 4+ Person Household | 587 | 25.4% |
| Total Housing Units | 2,308 | 100.0% |
Occupancy by Ownership by Household Size in Newtown Grant
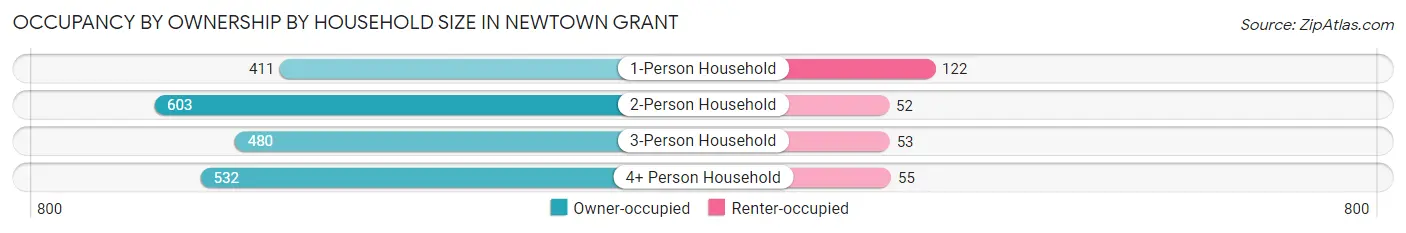
| Household Size | Owner-occupied | Renter-occupied |
| 1-Person Household | 411 (77.1%) | 122 (22.9%) |
| 2-Person Household | 603 (92.1%) | 52 (7.9%) |
| 3-Person Household | 480 (90.1%) | 53 (9.9%) |
| 4+ Person Household | 532 (90.6%) | 55 (9.4%) |
| Total Housing Units | 2,026 (87.8%) | 282 (12.2%) |
Occupancy by Educational Attainment in Newtown Grant
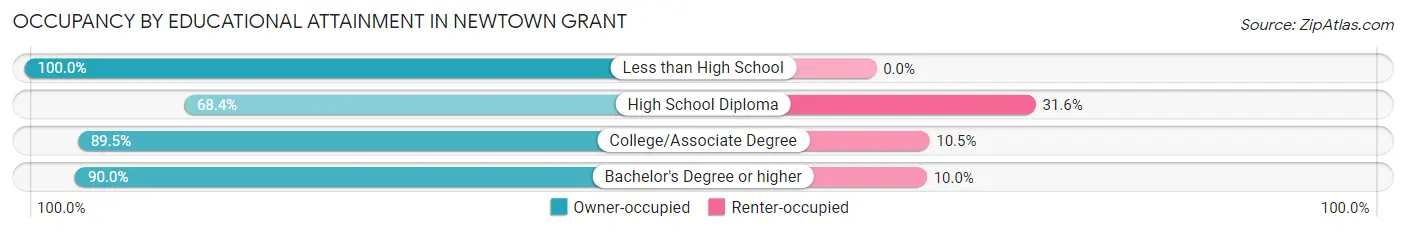
| Household Size | Owner-occupied | Renter-occupied |
| Less than High School | 7 (100.0%) | 0 (0.0%) |
| High School Diploma | 158 (68.4%) | 73 (31.6%) |
| College/Associate Degree | 263 (89.5%) | 31 (10.5%) |
| Bachelor's Degree or higher | 1,598 (90.0%) | 178 (10.0%) |
Occupancy by Age of Householder in Newtown Grant
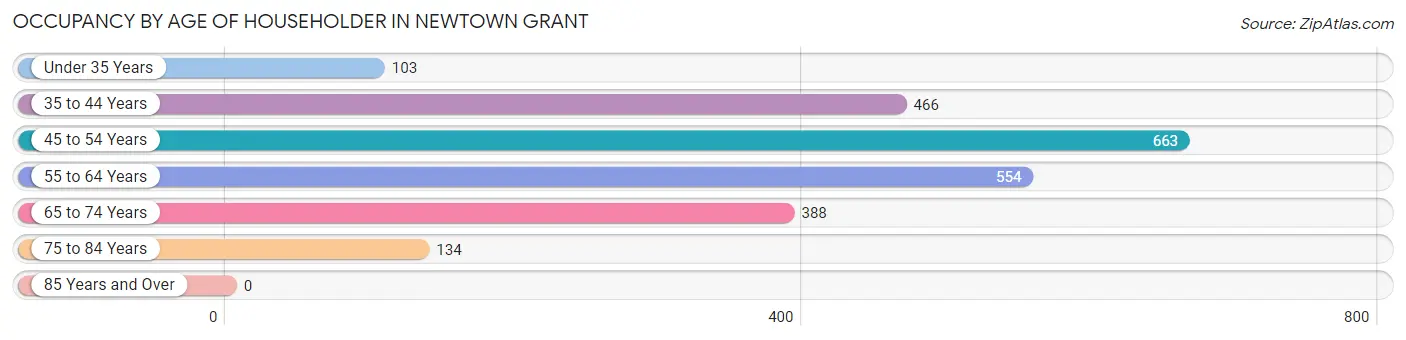
| Age Bracket | # Households | % Households |
| Under 35 Years | 103 | 4.5% |
| 35 to 44 Years | 466 | 20.2% |
| 45 to 54 Years | 663 | 28.7% |
| 55 to 64 Years | 554 | 24.0% |
| 65 to 74 Years | 388 | 16.8% |
| 75 to 84 Years | 134 | 5.8% |
| 85 Years and Over | 0 | 0.0% |
| Total | 2,308 | 100.0% |
Housing Finances in Newtown Grant
Median Income by Occupancy in Newtown Grant
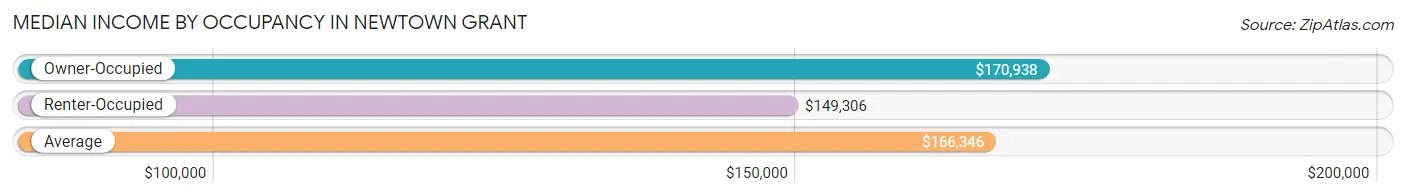
| Occupancy Type | # Households | Median Income |
| Owner-Occupied | 2,026 (87.8%) | $170,938 |
| Renter-Occupied | 282 (12.2%) | $149,306 |
| Average | 2,308 (100.0%) | $166,346 |
Occupancy by Householder Income Bracket in Newtown Grant

| Income Bracket | Owner-occupied | Renter-occupied |
| Less than $5,000 | 25 (1.2%) | 0 (0.0%) |
| $5,000 to $9,999 | 5 (0.3%) | 0 (0.0%) |
| $10,000 to $14,999 | 0 (0.0%) | 0 (0.0%) |
| $15,000 to $19,999 | 8 (0.4%) | 0 (0.0%) |
| $20,000 to $24,999 | 52 (2.6%) | 0 (0.0%) |
| $25,000 to $34,999 | 24 (1.2%) | 4 (1.4%) |
| $35,000 to $49,999 | 52 (2.6%) | 10 (3.5%) |
| $50,000 to $74,999 | 121 (6.0%) | 42 (14.9%) |
| $75,000 to $99,999 | 269 (13.3%) | 38 (13.5%) |
| $100,000 to $149,999 | 315 (15.5%) | 52 (18.4%) |
| $150,000 or more | 1,155 (57.0%) | 136 (48.2%) |
| Total | 2,026 (100.0%) | 282 (100.0%) |
Monthly Housing Cost Tiers in Newtown Grant
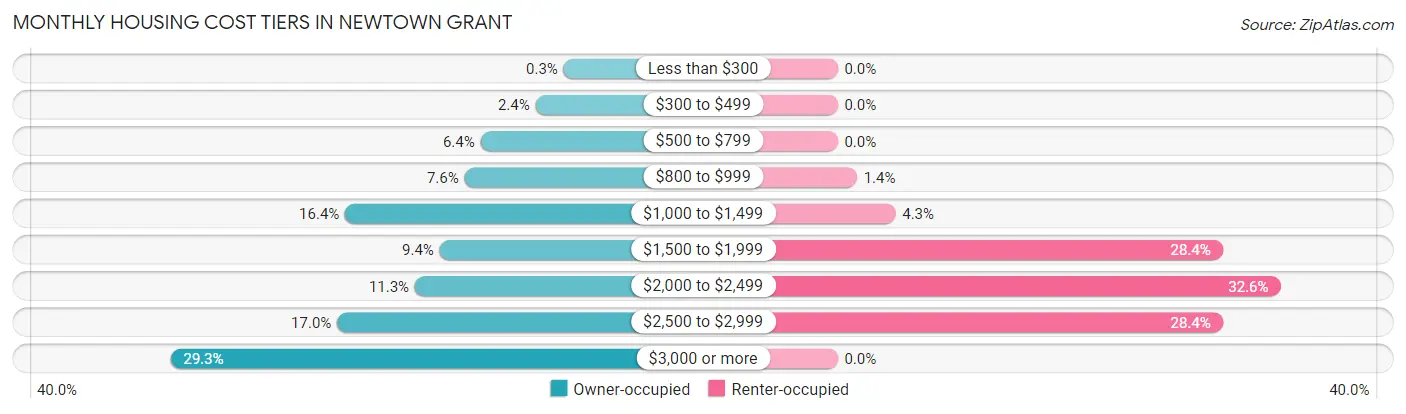
| Monthly Cost | Owner-occupied | Renter-occupied |
| Less than $300 | 6 (0.3%) | 0 (0.0%) |
| $300 to $499 | 48 (2.4%) | 0 (0.0%) |
| $500 to $799 | 130 (6.4%) | 0 (0.0%) |
| $800 to $999 | 154 (7.6%) | 4 (1.4%) |
| $1,000 to $1,499 | 332 (16.4%) | 12 (4.3%) |
| $1,500 to $1,999 | 191 (9.4%) | 80 (28.4%) |
| $2,000 to $2,499 | 228 (11.3%) | 92 (32.6%) |
| $2,500 to $2,999 | 344 (17.0%) | 80 (28.4%) |
| $3,000 or more | 593 (29.3%) | 0 (0.0%) |
| Total | 2,026 (100.0%) | 282 (100.0%) |
Physical Housing Characteristics in Newtown Grant
Housing Structures in Newtown Grant
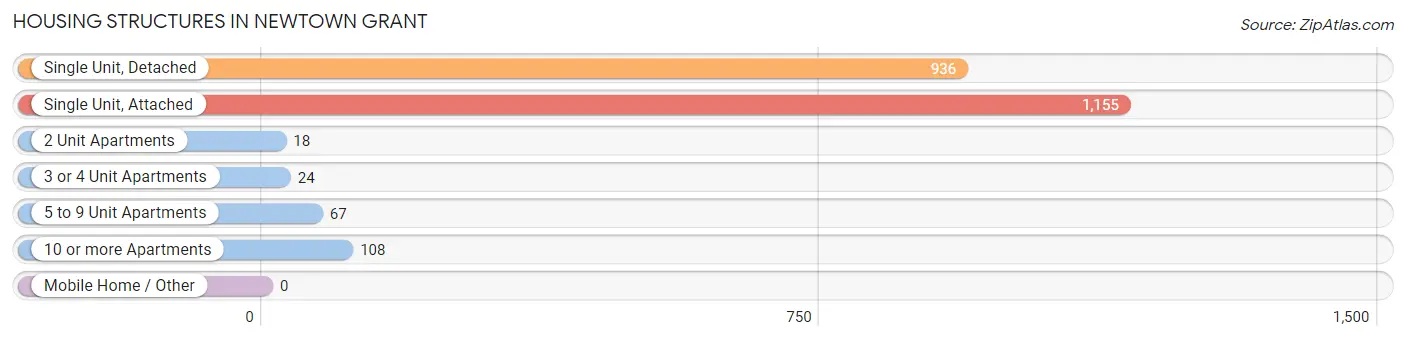
| Structure Type | # Housing Units | % Housing Units |
| Single Unit, Detached | 936 | 40.6% |
| Single Unit, Attached | 1,155 | 50.0% |
| 2 Unit Apartments | 18 | 0.8% |
| 3 or 4 Unit Apartments | 24 | 1.0% |
| 5 to 9 Unit Apartments | 67 | 2.9% |
| 10 or more Apartments | 108 | 4.7% |
| Mobile Home / Other | 0 | 0.0% |
| Total | 2,308 | 100.0% |
Housing Structures by Occupancy in Newtown Grant
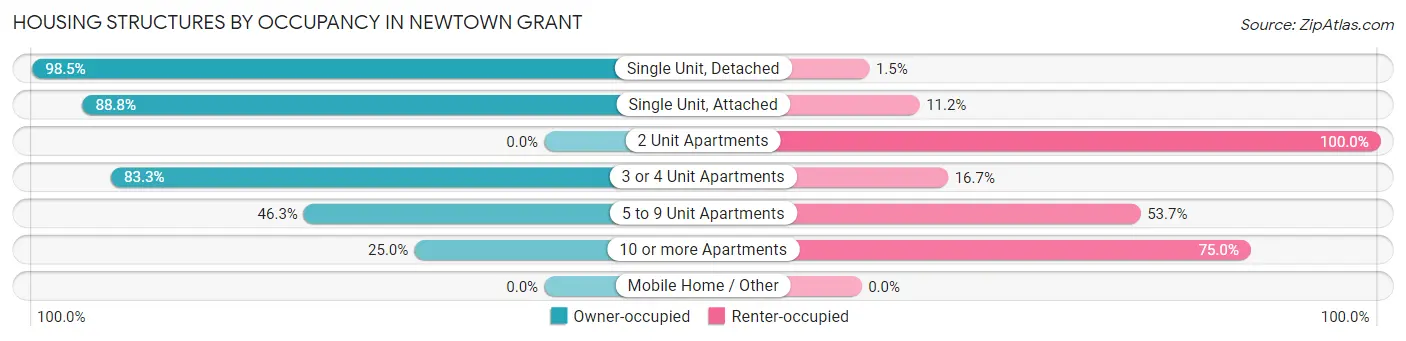
| Structure Type | Owner-occupied | Renter-occupied |
| Single Unit, Detached | 922 (98.5%) | 14 (1.5%) |
| Single Unit, Attached | 1,026 (88.8%) | 129 (11.2%) |
| 2 Unit Apartments | 0 (0.0%) | 18 (100.0%) |
| 3 or 4 Unit Apartments | 20 (83.3%) | 4 (16.7%) |
| 5 to 9 Unit Apartments | 31 (46.3%) | 36 (53.7%) |
| 10 or more Apartments | 27 (25.0%) | 81 (75.0%) |
| Mobile Home / Other | 0 (0.0%) | 0 (0.0%) |
| Total | 2,026 (87.8%) | 282 (12.2%) |
Housing Structures by Number of Rooms in Newtown Grant
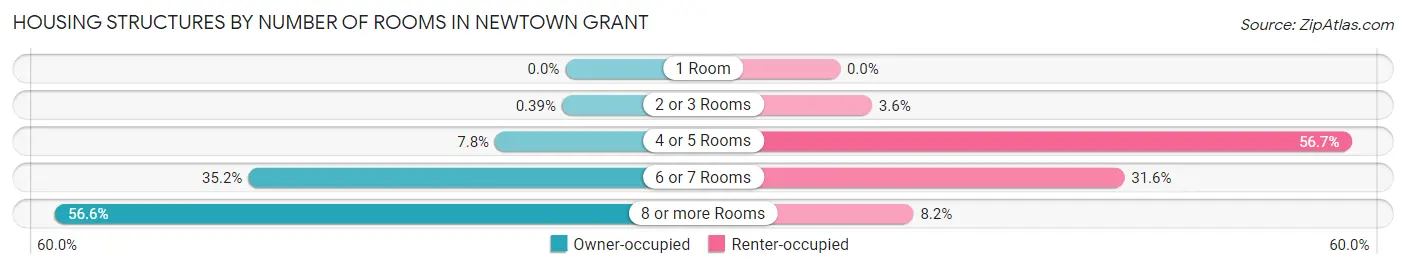
| Number of Rooms | Owner-occupied | Renter-occupied |
| 1 Room | 0 (0.0%) | 0 (0.0%) |
| 2 or 3 Rooms | 8 (0.4%) | 10 (3.5%) |
| 4 or 5 Rooms | 158 (7.8%) | 160 (56.7%) |
| 6 or 7 Rooms | 713 (35.2%) | 89 (31.6%) |
| 8 or more Rooms | 1,147 (56.6%) | 23 (8.2%) |
| Total | 2,026 (100.0%) | 282 (100.0%) |
Housing Structure by Heating Type in Newtown Grant
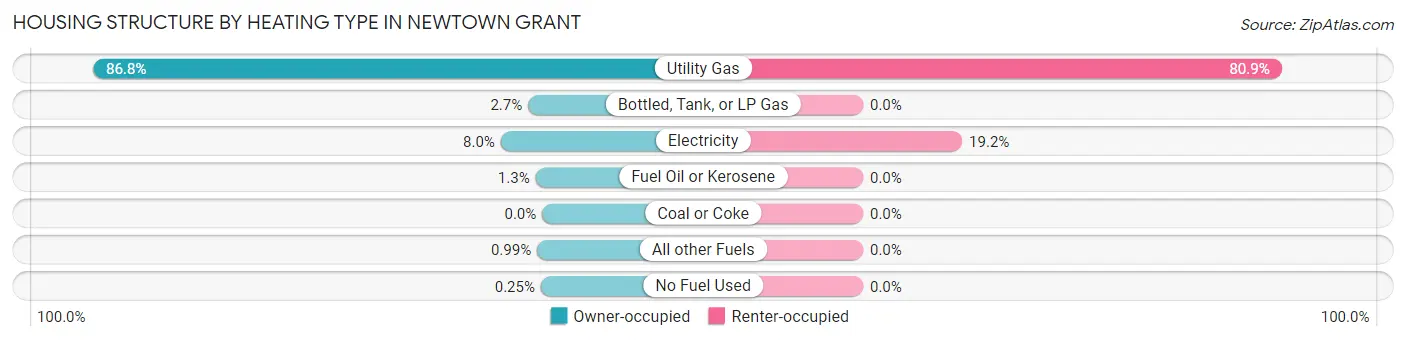
| Heating Type | Owner-occupied | Renter-occupied |
| Utility Gas | 1,758 (86.8%) | 228 (80.8%) |
| Bottled, Tank, or LP Gas | 55 (2.7%) | 0 (0.0%) |
| Electricity | 162 (8.0%) | 54 (19.2%) |
| Fuel Oil or Kerosene | 26 (1.3%) | 0 (0.0%) |
| Coal or Coke | 0 (0.0%) | 0 (0.0%) |
| All other Fuels | 20 (1.0%) | 0 (0.0%) |
| No Fuel Used | 5 (0.3%) | 0 (0.0%) |
| Total | 2,026 (100.0%) | 282 (100.0%) |
Household Vehicle Usage in Newtown Grant
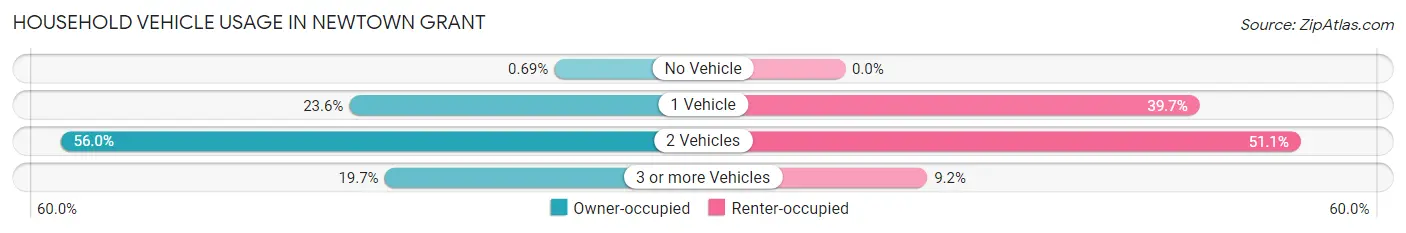
| Vehicles per Household | Owner-occupied | Renter-occupied |
| No Vehicle | 14 (0.7%) | 0 (0.0%) |
| 1 Vehicle | 479 (23.6%) | 112 (39.7%) |
| 2 Vehicles | 1,134 (56.0%) | 144 (51.1%) |
| 3 or more Vehicles | 399 (19.7%) | 26 (9.2%) |
| Total | 2,026 (100.0%) | 282 (100.0%) |
Real Estate & Mortgages in Newtown Grant
Real Estate and Mortgage Overview in Newtown Grant
| Characteristic | Without Mortgage | With Mortgage |
| Housing Units | 592 | 1,434 |
| Median Property Value | $540,900 | $506,200 |
| Median Household Income | $144,500 | $861 |
| Monthly Housing Costs | $1,008 | $593 |
| Real Estate Taxes | $6,478 | $22 |
Property Value by Mortgage Status in Newtown Grant
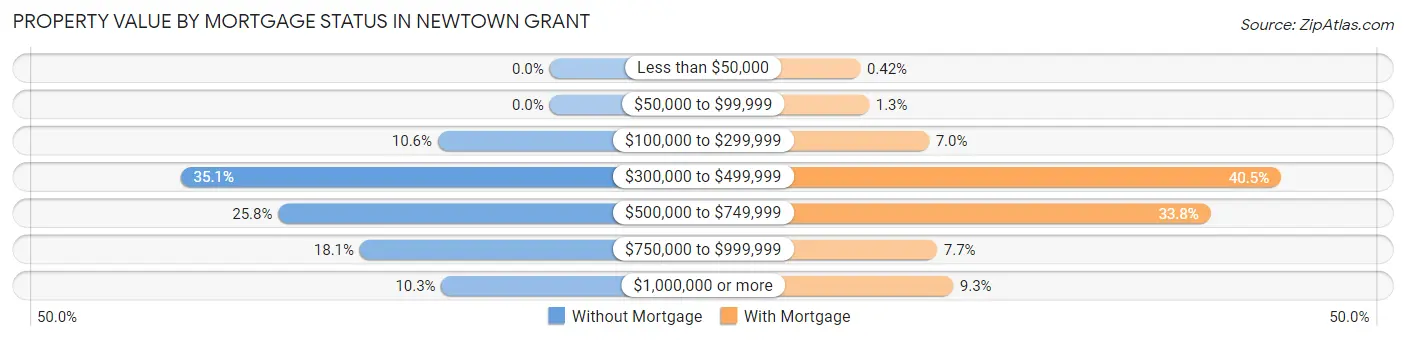
| Property Value | Without Mortgage | With Mortgage |
| Less than $50,000 | 0 (0.0%) | 6 (0.4%) |
| $50,000 to $99,999 | 0 (0.0%) | 18 (1.3%) |
| $100,000 to $299,999 | 63 (10.6%) | 100 (7.0%) |
| $300,000 to $499,999 | 208 (35.1%) | 581 (40.5%) |
| $500,000 to $749,999 | 153 (25.8%) | 485 (33.8%) |
| $750,000 to $999,999 | 107 (18.1%) | 111 (7.7%) |
| $1,000,000 or more | 61 (10.3%) | 133 (9.3%) |
| Total | 592 (100.0%) | 1,434 (100.0%) |
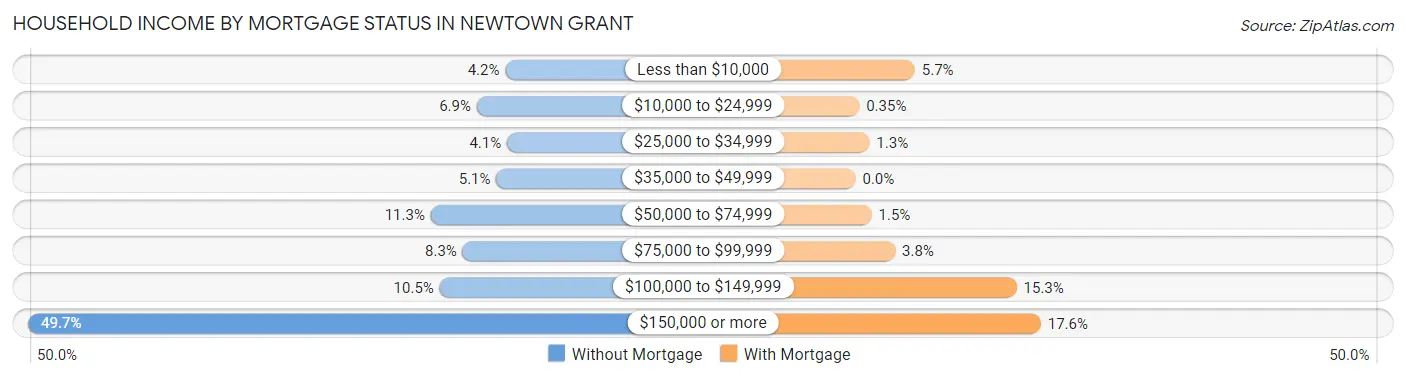
Household Income by Mortgage Status in Newtown Grant
| Household Income | Without Mortgage | With Mortgage |
| Less than $10,000 | 25 (4.2%) | 81 (5.7%) |
| $10,000 to $24,999 | 41 (6.9%) | 5 (0.4%) |
| $25,000 to $34,999 | 24 (4.1%) | 19 (1.3%) |
| $35,000 to $49,999 | 30 (5.1%) | 0 (0.0%) |
| $50,000 to $74,999 | 67 (11.3%) | 22 (1.5%) |
| $75,000 to $99,999 | 49 (8.3%) | 54 (3.8%) |
| $100,000 to $149,999 | 62 (10.5%) | 220 (15.3%) |
| $150,000 or more | 294 (49.7%) | 253 (17.6%) |
| Total | 592 (100.0%) | 1,434 (100.0%) |
Property Value to Household Income Ratio in Newtown Grant
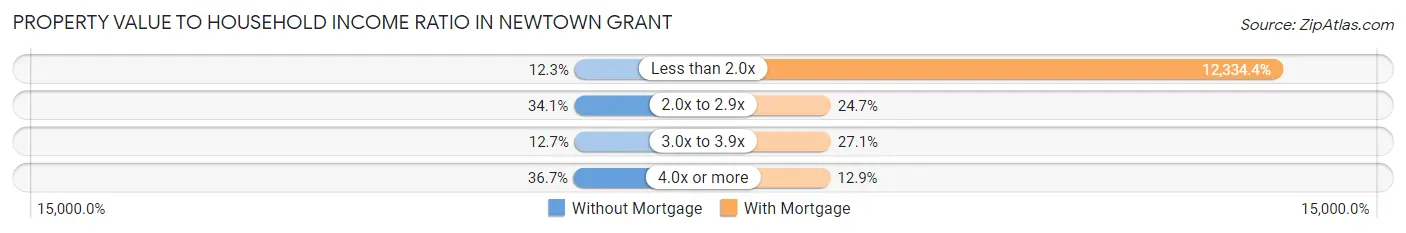
| Value-to-Income Ratio | Without Mortgage | With Mortgage |
| Less than 2.0x | 73 (12.3%) | 176,875 (12,334.4%) |
| 2.0x to 2.9x | 202 (34.1%) | 354 (24.7%) |
| 3.0x to 3.9x | 75 (12.7%) | 388 (27.1%) |
| 4.0x or more | 217 (36.7%) | 185 (12.9%) |
| Total | 592 (100.0%) | 1,434 (100.0%) |
Real Estate Taxes by Mortgage Status in Newtown Grant
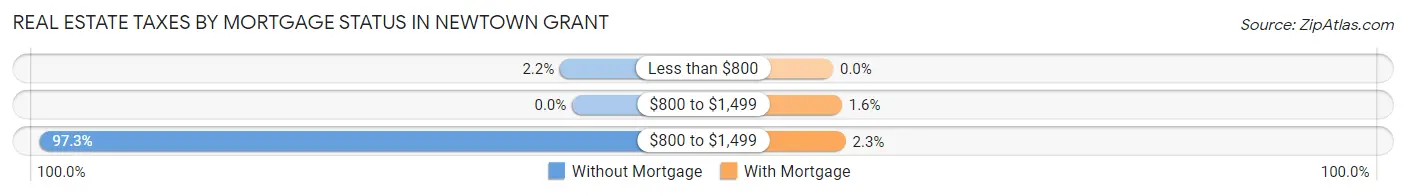
| Property Taxes | Without Mortgage | With Mortgage |
| Less than $800 | 13 (2.2%) | 0 (0.0%) |
| $800 to $1,499 | 0 (0.0%) | 23 (1.6%) |
| $800 to $1,499 | 576 (97.3%) | 33 (2.3%) |
| Total | 592 (100.0%) | 1,434 (100.0%) |
Health & Disability in Newtown Grant
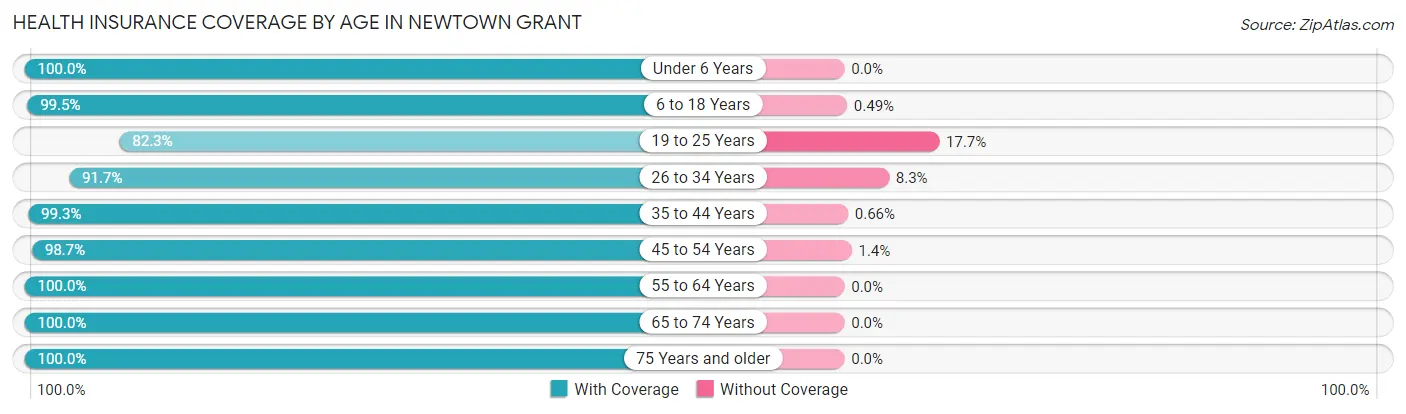
Health Insurance Coverage by Age in Newtown Grant
| Age Bracket | With Coverage | Without Coverage |
| Under 6 Years | 316 (100.0%) | 0 (0.0%) |
| 6 to 18 Years | 1,221 (99.5%) | 6 (0.5%) |
| 19 to 25 Years | 149 (82.3%) | 32 (17.7%) |
| 26 to 34 Years | 287 (91.7%) | 26 (8.3%) |
| 35 to 44 Years | 899 (99.3%) | 6 (0.7%) |
| 45 to 54 Years | 1,168 (98.7%) | 16 (1.3%) |
| 55 to 64 Years | 905 (100.0%) | 0 (0.0%) |
| 65 to 74 Years | 558 (100.0%) | 0 (0.0%) |
| 75 Years and older | 261 (100.0%) | 0 (0.0%) |
| Total | 5,764 (98.5%) | 86 (1.5%) |
Health Insurance Coverage by Citizenship Status in Newtown Grant
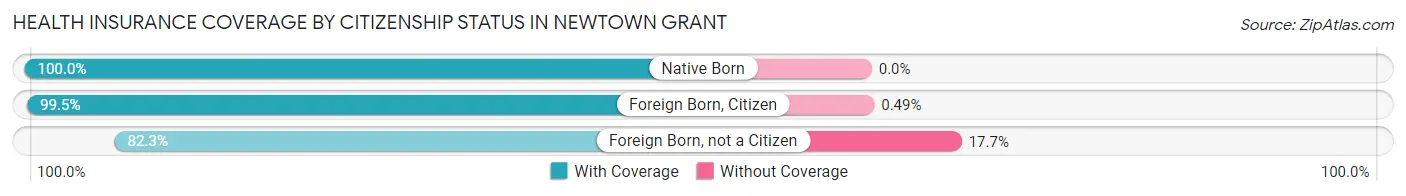
| Citizenship Status | With Coverage | Without Coverage |
| Native Born | 316 (100.0%) | 0 (0.0%) |
| Foreign Born, Citizen | 1,221 (99.5%) | 6 (0.5%) |
| Foreign Born, not a Citizen | 149 (82.3%) | 32 (17.7%) |
Health Insurance Coverage by Household Income in Newtown Grant
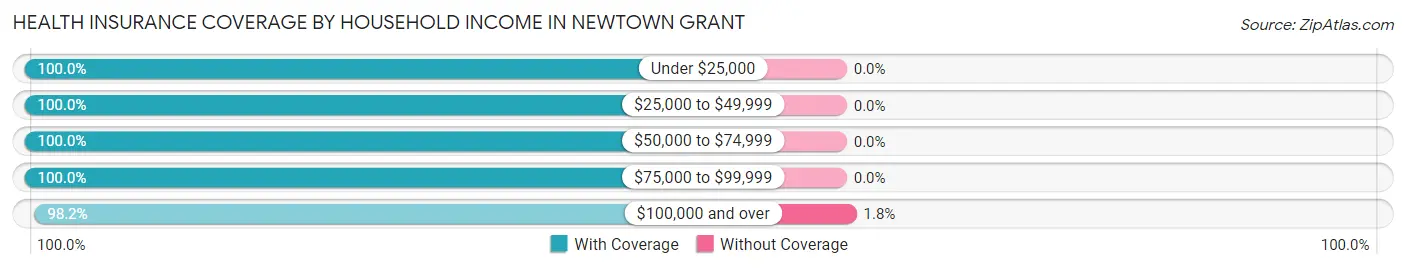
| Household Income | With Coverage | Without Coverage |
| Under $25,000 | 90 (100.0%) | 0 (0.0%) |
| $25,000 to $49,999 | 149 (100.0%) | 0 (0.0%) |
| $50,000 to $74,999 | 318 (100.0%) | 0 (0.0%) |
| $75,000 to $99,999 | 611 (100.0%) | 0 (0.0%) |
| $100,000 and over | 4,596 (98.2%) | 86 (1.8%) |
Public vs Private Health Insurance Coverage by Age in Newtown Grant
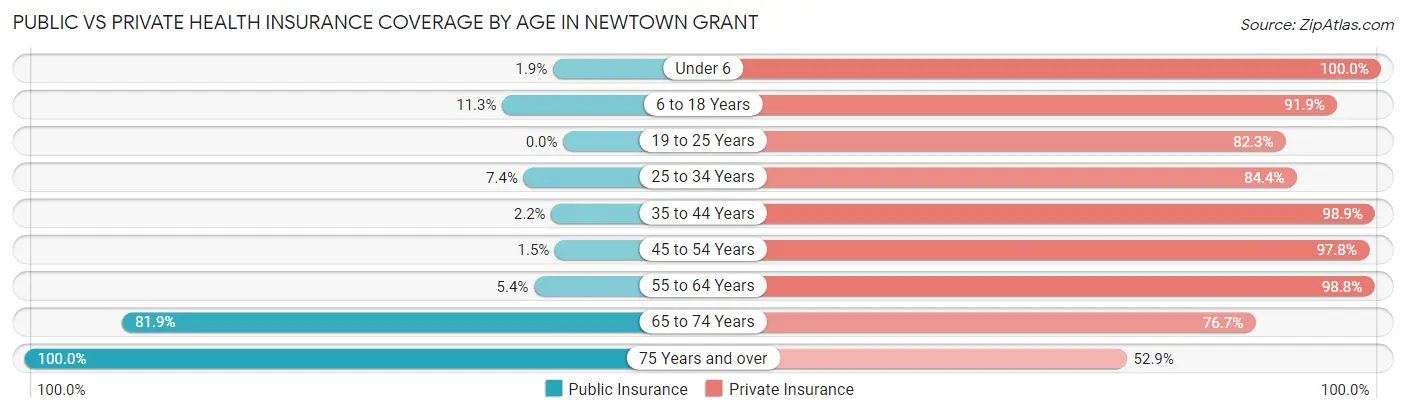
| Age Bracket | Public Insurance | Private Insurance |
| Under 6 | 6 (1.9%) | 316 (100.0%) |
| 6 to 18 Years | 139 (11.3%) | 1,127 (91.8%) |
| 19 to 25 Years | 0 (0.0%) | 149 (82.3%) |
| 25 to 34 Years | 23 (7.3%) | 264 (84.4%) |
| 35 to 44 Years | 20 (2.2%) | 895 (98.9%) |
| 45 to 54 Years | 18 (1.5%) | 1,158 (97.8%) |
| 55 to 64 Years | 49 (5.4%) | 894 (98.8%) |
| 65 to 74 Years | 457 (81.9%) | 428 (76.7%) |
| 75 Years and over | 261 (100.0%) | 138 (52.9%) |
| Total | 973 (16.6%) | 5,369 (91.8%) |
Disability Status by Sex by Age in Newtown Grant
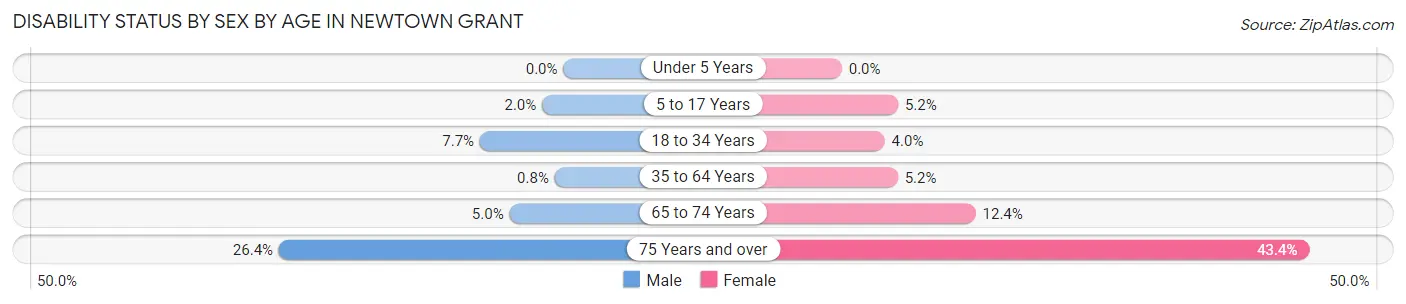
| Age Bracket | Male | Female |
| Under 5 Years | 0 (0.0%) | 0 (0.0%) |
| 5 to 17 Years | 12 (2.0%) | 33 (5.2%) |
| 18 to 34 Years | 23 (7.7%) | 9 (4.0%) |
| 35 to 64 Years | 12 (0.8%) | 78 (5.2%) |
| 65 to 74 Years | 13 (5.0%) | 37 (12.4%) |
| 75 Years and over | 33 (26.4%) | 59 (43.4%) |
Disability Class by Sex by Age in Newtown Grant
Disability Class: Hearing Difficulty
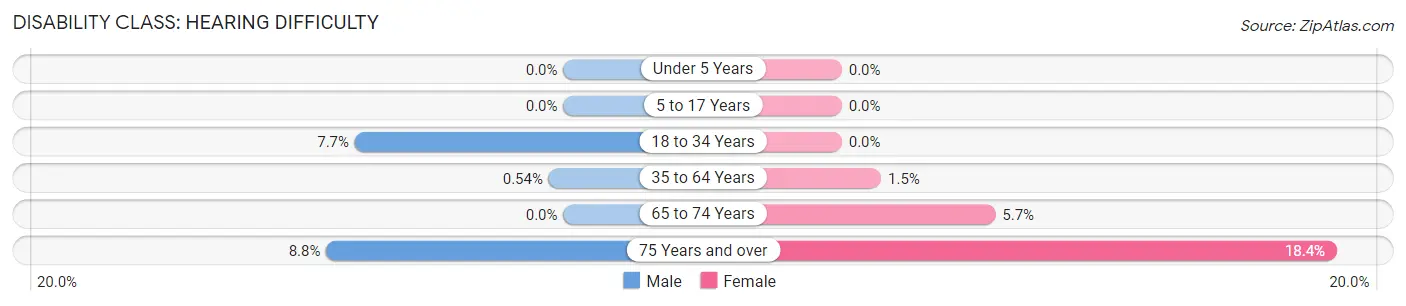
| Age Bracket | Male | Female |
| Under 5 Years | 0 (0.0%) | 0 (0.0%) |
| 5 to 17 Years | 0 (0.0%) | 0 (0.0%) |
| 18 to 34 Years | 23 (7.7%) | 0 (0.0%) |
| 35 to 64 Years | 8 (0.5%) | 22 (1.5%) |
| 65 to 74 Years | 0 (0.0%) | 17 (5.7%) |
| 75 Years and over | 11 (8.8%) | 25 (18.4%) |
Disability Class: Vision Difficulty
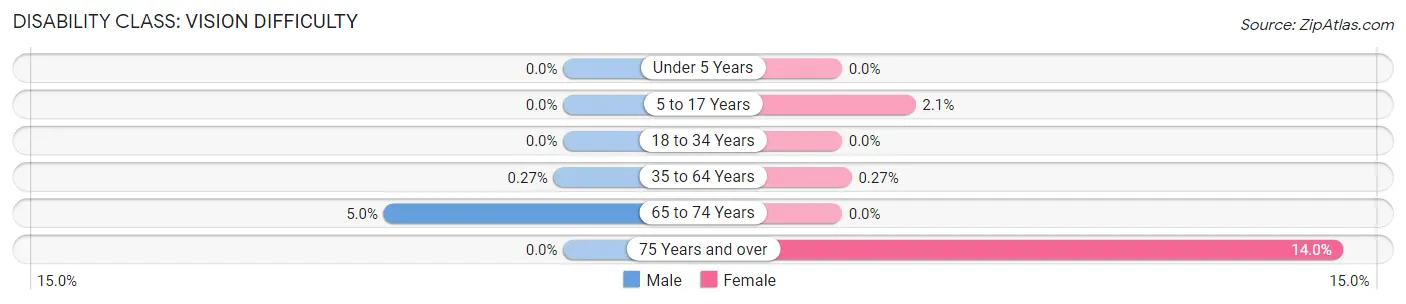
| Age Bracket | Male | Female |
| Under 5 Years | 0 (0.0%) | 0 (0.0%) |
| 5 to 17 Years | 0 (0.0%) | 13 (2.1%) |
| 18 to 34 Years | 0 (0.0%) | 0 (0.0%) |
| 35 to 64 Years | 4 (0.3%) | 4 (0.3%) |
| 65 to 74 Years | 13 (5.0%) | 0 (0.0%) |
| 75 Years and over | 0 (0.0%) | 19 (14.0%) |
Disability Class: Cognitive Difficulty
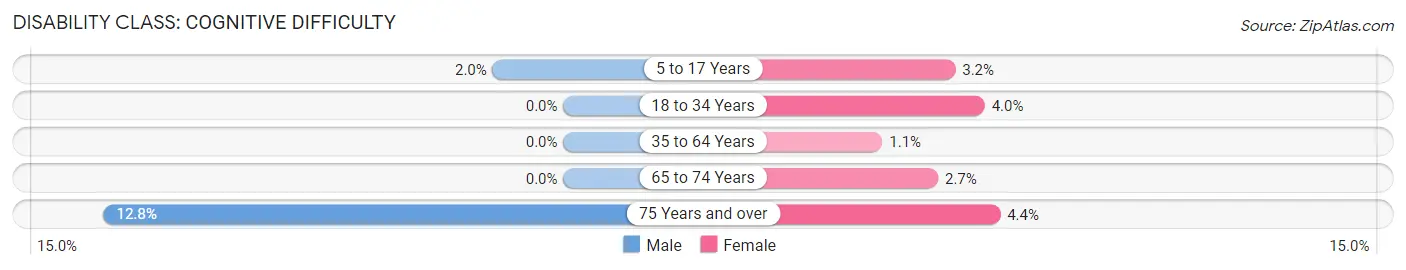
| Age Bracket | Male | Female |
| 5 to 17 Years | 12 (2.0%) | 20 (3.2%) |
| 18 to 34 Years | 0 (0.0%) | 9 (4.0%) |
| 35 to 64 Years | 0 (0.0%) | 17 (1.1%) |
| 65 to 74 Years | 0 (0.0%) | 8 (2.7%) |
| 75 Years and over | 16 (12.8%) | 6 (4.4%) |
Disability Class: Ambulatory Difficulty
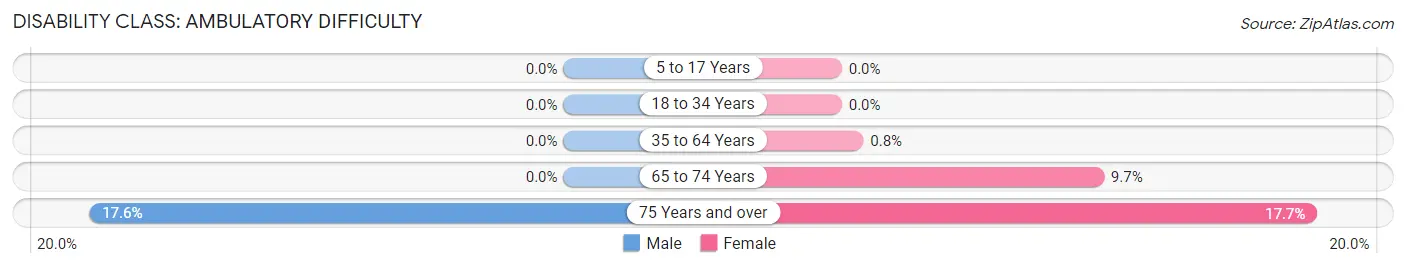
| Age Bracket | Male | Female |
| 5 to 17 Years | 0 (0.0%) | 0 (0.0%) |
| 18 to 34 Years | 0 (0.0%) | 0 (0.0%) |
| 35 to 64 Years | 0 (0.0%) | 12 (0.8%) |
| 65 to 74 Years | 0 (0.0%) | 29 (9.7%) |
| 75 Years and over | 22 (17.6%) | 24 (17.6%) |
Disability Class: Self-Care Difficulty
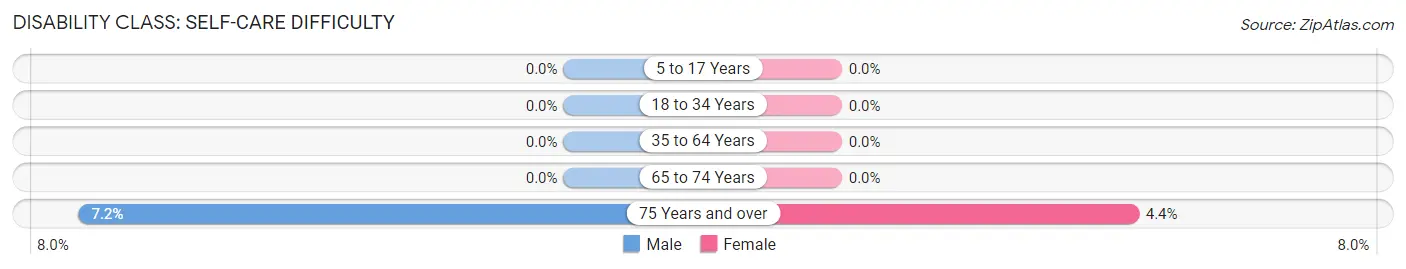
| Age Bracket | Male | Female |
| 5 to 17 Years | 0 (0.0%) | 0 (0.0%) |
| 18 to 34 Years | 0 (0.0%) | 0 (0.0%) |
| 35 to 64 Years | 0 (0.0%) | 0 (0.0%) |
| 65 to 74 Years | 0 (0.0%) | 0 (0.0%) |
| 75 Years and over | 9 (7.2%) | 6 (4.4%) |
Technology Access in Newtown Grant
Computing Device Access in Newtown Grant
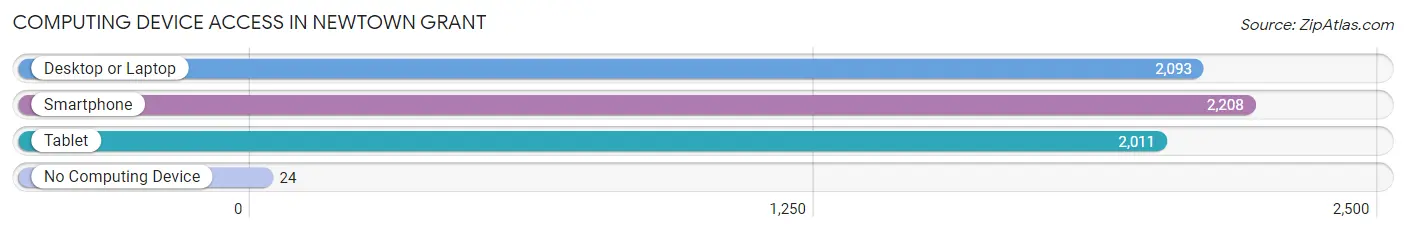
| Device Type | # Households | % Households |
| Desktop or Laptop | 2,093 | 90.7% |
| Smartphone | 2,208 | 95.7% |
| Tablet | 2,011 | 87.1% |
| No Computing Device | 24 | 1.0% |
| Total | 2,308 | 100.0% |
Internet Access in Newtown Grant
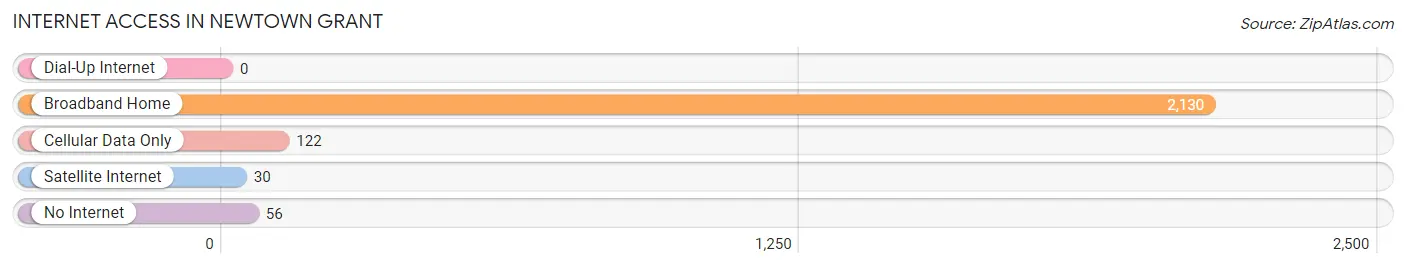
| Internet Type | # Households | % Households |
| Dial-Up Internet | 0 | 0.0% |
| Broadband Home | 2,130 | 92.3% |
| Cellular Data Only | 122 | 5.3% |
| Satellite Internet | 30 | 1.3% |
| No Internet | 56 | 2.4% |
| Total | 2,308 | 100.0% |
Newtown Grant Summary
Newtown Grant is a census-designated place (CDP) located in Bucks County, Pennsylvania. It is situated in the northern part of the county, approximately 20 miles north of Philadelphia. The CDP has a total area of 2.3 square miles, all of which is land. As of the 2010 census, the population of Newtown Grant was 4,845.
History
Newtown Grant was originally part of the township of Newtown, which was established in 1702. The area was first settled in the late 17th century by English and Welsh Quakers. In 1737, the township was divided into two parts, Newtown and Wrightstown. In 1838, the two townships were reunited as Newtown Township.
In the late 19th century, Newtown Township began to experience rapid growth due to the development of the railroad and the growth of the local economy. In 1876, the Newtown Grant Land Company was formed to develop the area. The company purchased land from the original settlers and began to develop the area into a residential community.
In the early 20th century, Newtown Grant continued to grow and develop. In the 1920s, the area was annexed by the Borough of Newtown. In the 1950s, the area was rezoned for residential development and the population began to grow rapidly.
Geography
Newtown Grant is located in the northern part of Bucks County, approximately 20 miles north of Philadelphia. The CDP has a total area of 2.3 square miles, all of which is land. The terrain is mostly flat, with some rolling hills. The area is drained by the Neshaminy Creek, which flows through the center of the CDP.
The climate in Newtown Grant is classified as humid continental, with hot, humid summers and cold, snowy winters. The average annual temperature is around 50°F, with an average high of around 75°F in the summer and an average low of around 25°F in the winter.
Economy
The economy of Newtown Grant is largely based on the service industry. The area is home to a variety of retail stores, restaurants, and other businesses. The largest employers in the area are the local school district, the Newtown Township government, and the Newtown Grant Land Company.
The area is also home to a number of small businesses, including a variety of professional services, such as accounting, legal, and medical services. The area is also home to a number of manufacturing companies, including a number of food processing plants.
Demographics
As of the 2010 census, the population of Newtown Grant was 4,845. The racial makeup of the CDP was 87.3% White, 5.2% African American, 0.3% Native American, 3.2% Asian, and 3.9% from other races. Hispanic or Latino of any race were 6.2% of the population.
The median household income in Newtown Grant was $76,944, and the median family income was $90,944. The per capita income was $35,944. About 4.2% of families and 5.3% of the population were below the poverty line.
Common Questions
What is the Total Population of Newtown Grant?
Total Population of Newtown Grant is 5,850.
What is the Total Male Population of Newtown Grant?
Total Male Population of Newtown Grant is 2,953.
What is the Total Female Population of Newtown Grant?
Total Female Population of Newtown Grant is 2,897.
What is the Ratio of Males per 100 Females in Newtown Grant?
There are 101.93 Males per 100 Females in Newtown Grant.
What is the Ratio of Females per 100 Males in Newtown Grant?
There are 98.10 Females per 100 Males in Newtown Grant.
What is the Median Population Age in Newtown Grant?
Median Population Age in Newtown Grant is 44.9 Years.
What is the Average Family Size in Newtown Grant
Average Family Size in Newtown Grant is 3.0 People.
What is the Average Household Size in Newtown Grant
Average Household Size in Newtown Grant is 2.5 People.
What is Per Capita Income in Newtown Grant?
Per Capita income in Newtown Grant is $76,028.
What is the Median Family Income in Newtown Grant?
Median Family Income in Newtown Grant is $181,700.
What is the Median Household income in Newtown Grant?
Median Household Income in Newtown Grant is $166,346.
What is Income or Wage Gap in Newtown Grant?
Income or Wage Gap in Newtown Grant is 40.9%.
Women in Newtown Grant earn 59.1 cents for every dollar earned by a man.
What is Inequality or Gini Index in Newtown Grant?
Inequality or Gini Index in Newtown Grant is 0.37.
How Large is the Labor Force in Newtown Grant?
There are 3,275 People in the Labor Forcein in Newtown Grant.
What is the Percentage of People in the Labor Force in Newtown Grant?
72.1% of People are in the Labor Force in Newtown Grant.
What is the Unemployment Rate in Newtown Grant?
Unemployment Rate in Newtown Grant is 6.7%.