Houston borough, PA
Houston borough Overview
1,204
TOTAL POPULATION
581
MALE POPULATION
623
FEMALE POPULATION
93.26
MALES / 100 FEMALES
107.23
FEMALES / 100 MALES
43.9
MEDIAN AGE
2.9
AVG FAMILY SIZE
2.1
AVG HOUSEHOLD SIZE
$33,738
PER CAPITA INCOME
$72,159
AVG FAMILY INCOME
$64,028
AVG HOUSEHOLD INCOME
49.5%
WAGE / INCOME GAP [ % ]
50.5¢/ $1
WAGE / INCOME GAP [ $ ]
0.41
INEQUALITY / GINI INDEX
613
LABOR FORCE [ PEOPLE ]
61.9%
PERCENT IN LABOR FORCE
3.8%
UNEMPLOYMENT RATE
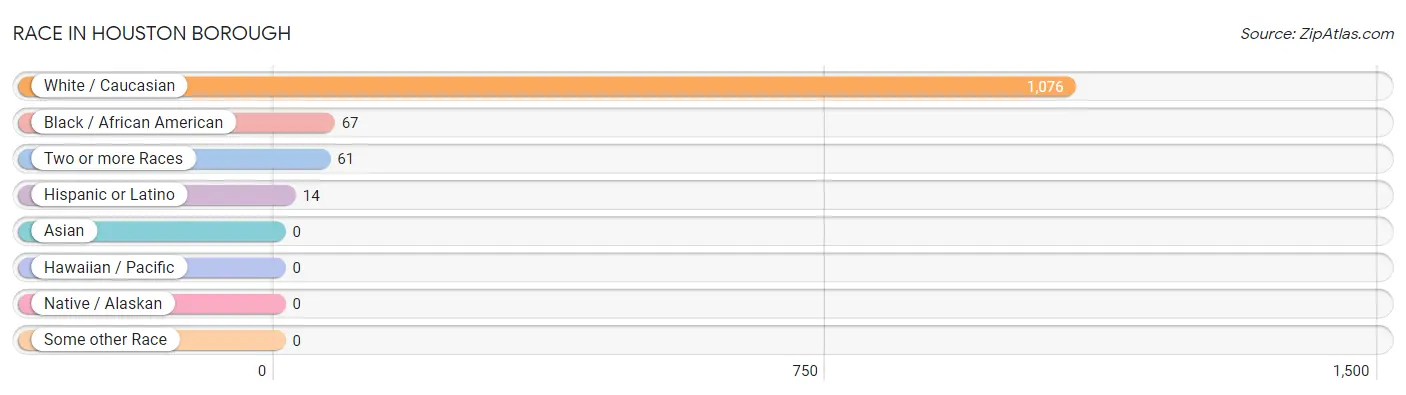
Race in Houston borough
The most populous races in Houston borough are White / Caucasian (1,076 | 89.4%), Black / African American (67 | 5.6%), and Two or more Races (61 | 5.1%).
| Race | # Population | % Population |
| Asian | 0 | 0.0% |
| Black / African American | 67 | 5.6% |
| Hawaiian / Pacific | 0 | 0.0% |
| Hispanic or Latino | 14 | 1.2% |
| Native / Alaskan | 0 | 0.0% |
| White / Caucasian | 1,076 | 89.4% |
| Two or more Races | 61 | 5.1% |
| Some other Race | 0 | 0.0% |
| Total | 1,204 | 100.0% |
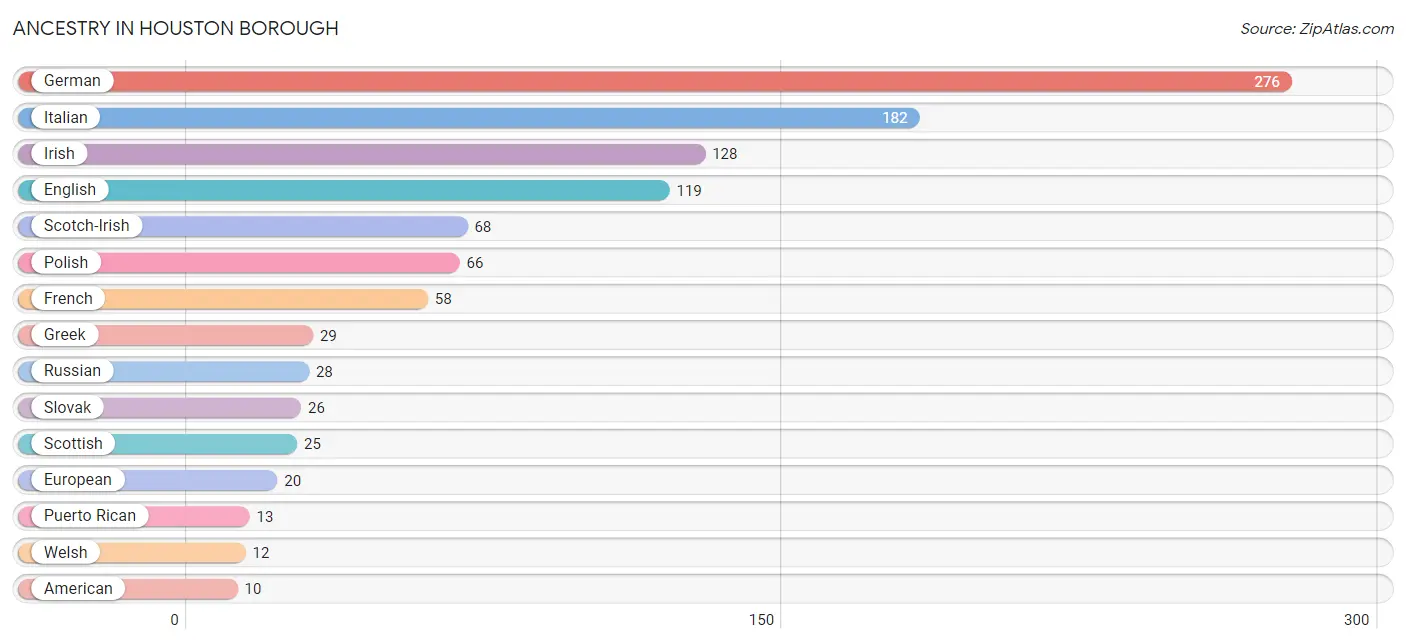
Ancestry in Houston borough
The most populous ancestries reported in Houston borough are German (276 | 22.9%), Italian (182 | 15.1%), Irish (128 | 10.6%), English (119 | 9.9%), and Scotch-Irish (68 | 5.7%), together accounting for 64.2% of all Houston borough residents.
| Ancestry | # Population | % Population |
| American | 10 | 0.8% |
| Austrian | 4 | 0.3% |
| Central American | 1 | 0.1% |
| Cherokee | 5 | 0.4% |
| Croatian | 3 | 0.3% |
| Czech | 8 | 0.7% |
| Czechoslovakian | 6 | 0.5% |
| Dutch | 10 | 0.8% |
| English | 119 | 9.9% |
| European | 20 | 1.7% |
| French | 58 | 4.8% |
| German | 276 | 22.9% |
| Greek | 29 | 2.4% |
| Guatemalan | 1 | 0.1% |
| Hungarian | 6 | 0.5% |
| Irish | 128 | 10.6% |
| Italian | 182 | 15.1% |
| Lithuanian | 8 | 0.7% |
| Pennsylvania German | 7 | 0.6% |
| Polish | 66 | 5.5% |
| Puerto Rican | 13 | 1.1% |
| Russian | 28 | 2.3% |
| Scotch-Irish | 68 | 5.7% |
| Scottish | 25 | 2.1% |
| Slavic | 1 | 0.1% |
| Slovak | 26 | 2.2% |
| Slovene | 6 | 0.5% |
| Swedish | 6 | 0.5% |
| Welsh | 12 | 1.0% |
| Yugoslavian | 3 | 0.3% | View All 30 Rows |
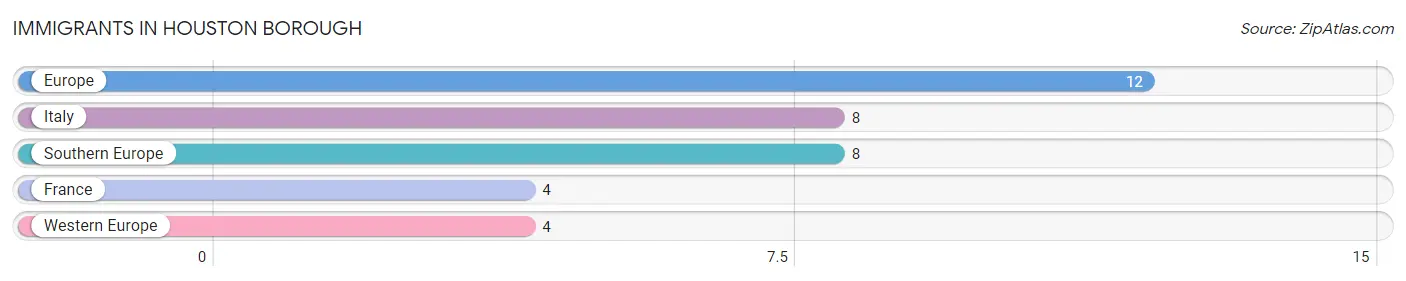
Immigrants in Houston borough
The most numerous immigrant groups reported in Houston borough came from Europe (12 | 1.0%), Italy (8 | 0.7%), Southern Europe (8 | 0.7%), France (4 | 0.3%), and Western Europe (4 | 0.3%), together accounting for 3.0% of all Houston borough residents.
| Immigration Origin | # Population | % Population |
| Europe | 12 | 1.0% |
| France | 4 | 0.3% |
| Italy | 8 | 0.7% |
| Southern Europe | 8 | 0.7% |
| Western Europe | 4 | 0.3% | View All 5 Rows |
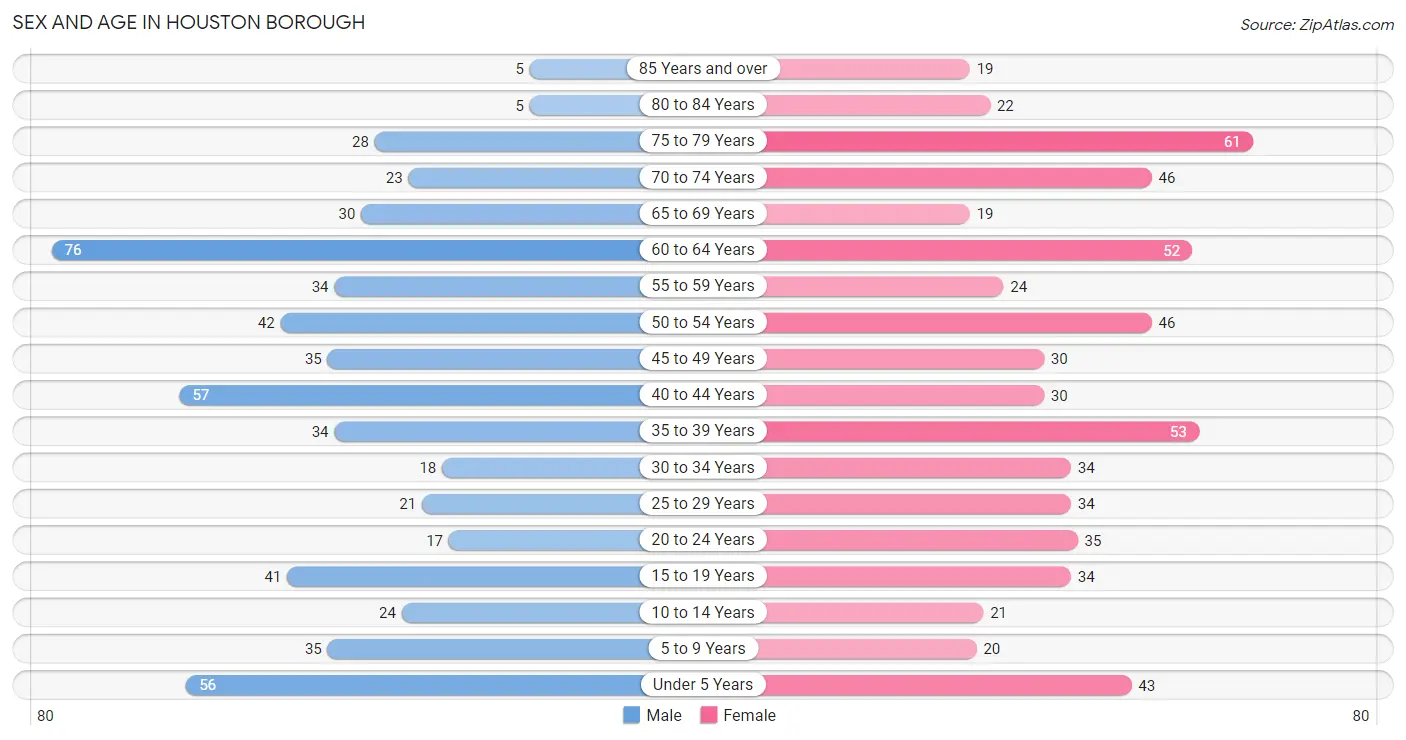
Sex and Age in Houston borough
Sex and Age in Houston borough
The most populous age groups in Houston borough are 60 to 64 Years (76 | 13.1%) for men and 75 to 79 Years (61 | 9.8%) for women.
| Age Bracket | Male | Female |
| Under 5 Years | 56 (9.6%) | 43 (6.9%) |
| 5 to 9 Years | 35 (6.0%) | 20 (3.2%) |
| 10 to 14 Years | 24 (4.1%) | 21 (3.4%) |
| 15 to 19 Years | 41 (7.1%) | 34 (5.5%) |
| 20 to 24 Years | 17 (2.9%) | 35 (5.6%) |
| 25 to 29 Years | 21 (3.6%) | 34 (5.5%) |
| 30 to 34 Years | 18 (3.1%) | 34 (5.5%) |
| 35 to 39 Years | 34 (5.9%) | 53 (8.5%) |
| 40 to 44 Years | 57 (9.8%) | 30 (4.8%) |
| 45 to 49 Years | 35 (6.0%) | 30 (4.8%) |
| 50 to 54 Years | 42 (7.2%) | 46 (7.4%) |
| 55 to 59 Years | 34 (5.9%) | 24 (3.8%) |
| 60 to 64 Years | 76 (13.1%) | 52 (8.4%) |
| 65 to 69 Years | 30 (5.2%) | 19 (3.0%) |
| 70 to 74 Years | 23 (4.0%) | 46 (7.4%) |
| 75 to 79 Years | 28 (4.8%) | 61 (9.8%) |
| 80 to 84 Years | 5 (0.9%) | 22 (3.5%) |
| 85 Years and over | 5 (0.9%) | 19 (3.0%) |
| Total | 581 (100.0%) | 623 (100.0%) |
Families and Households in Houston borough
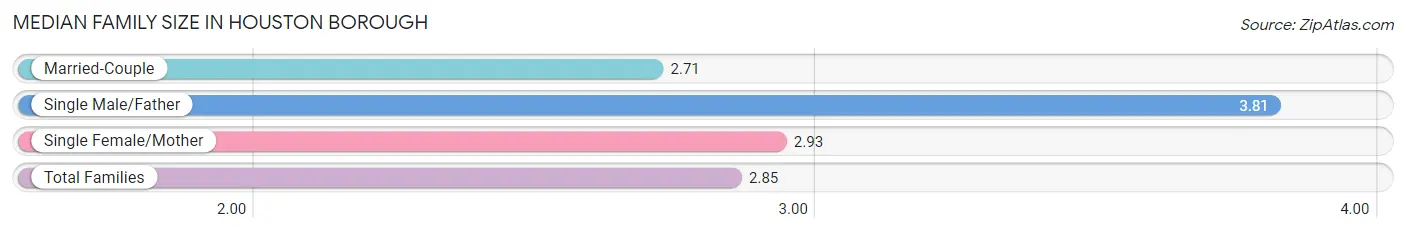
Median Family Size in Houston borough
The median family size in Houston borough is 2.85 persons per family, with single male/father families (26 | 8.3%) accounting for the largest median family size of 3.81 persons per family. On the other hand, married-couple families (216 | 69.0%) represent the smallest median family size with 2.71 persons per family.
| Family Type | # Families | Family Size |
| Married-Couple | 216 (69.0%) | 2.71 |
| Single Male/Father | 26 (8.3%) | 3.81 |
| Single Female/Mother | 71 (22.7%) | 2.93 |
| Total Families | 313 (100.0%) | 2.85 |
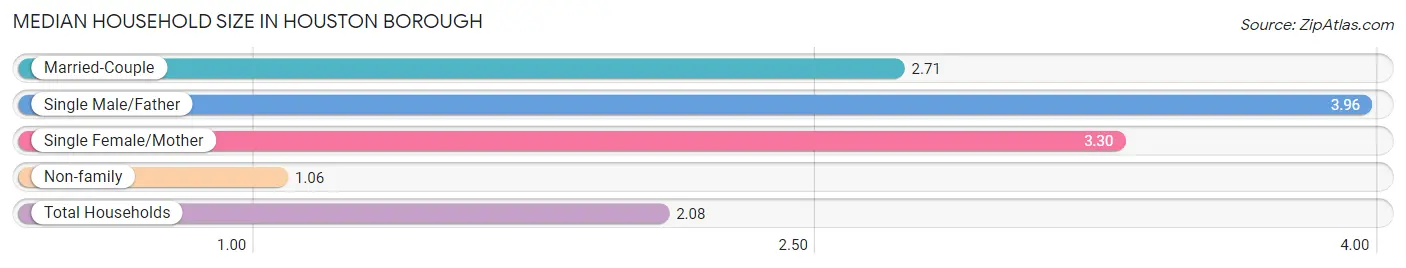
Median Household Size in Houston borough
The median household size in Houston borough is 2.08 persons per household, with single male/father households (26 | 4.5%) accounting for the largest median household size of 3.96 persons per household. non-family households (264 | 45.8%) represent the smallest median household size with 1.06 persons per household.
| Household Type | # Households | Household Size |
| Married-Couple | 216 (37.4%) | 2.71 |
| Single Male/Father | 26 (4.5%) | 3.96 |
| Single Female/Mother | 71 (12.3%) | 3.30 |
| Non-family | 264 (45.8%) | 1.06 |
| Total Households | 577 (100.0%) | 2.08 |
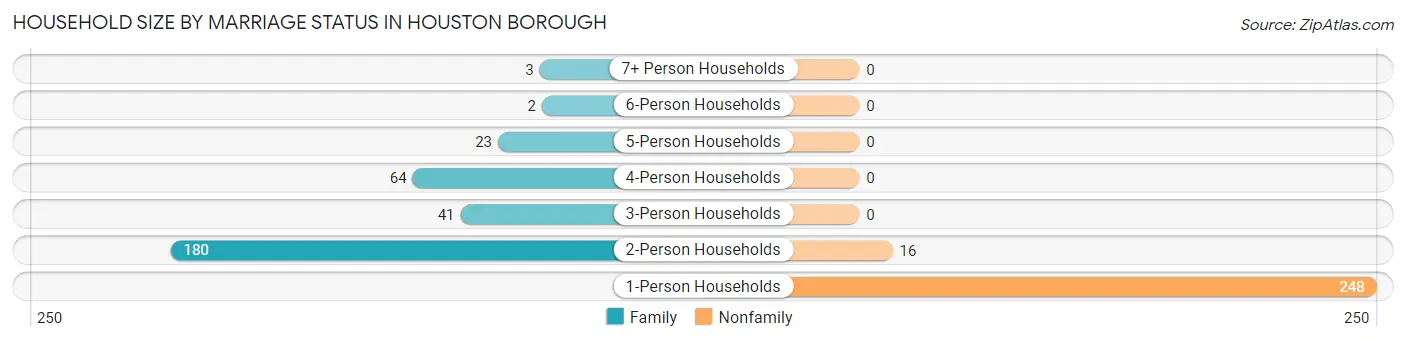
Household Size by Marriage Status in Houston borough
Out of a total of 577 households in Houston borough, 313 (54.2%) are family households, while 264 (45.8%) are nonfamily households. The most numerous type of family households are 2-person households, comprising 180, and the most common type of nonfamily households are 1-person households, comprising 248.
| Household Size | Family Households | Nonfamily Households |
| 1-Person Households | - | 248 (43.0%) |
| 2-Person Households | 180 (31.2%) | 16 (2.8%) |
| 3-Person Households | 41 (7.1%) | 0 (0.0%) |
| 4-Person Households | 64 (11.1%) | 0 (0.0%) |
| 5-Person Households | 23 (4.0%) | 0 (0.0%) |
| 6-Person Households | 2 (0.4%) | 0 (0.0%) |
| 7+ Person Households | 3 (0.5%) | 0 (0.0%) |
| Total | 313 (54.2%) | 264 (45.8%) |
Female Fertility in Houston borough
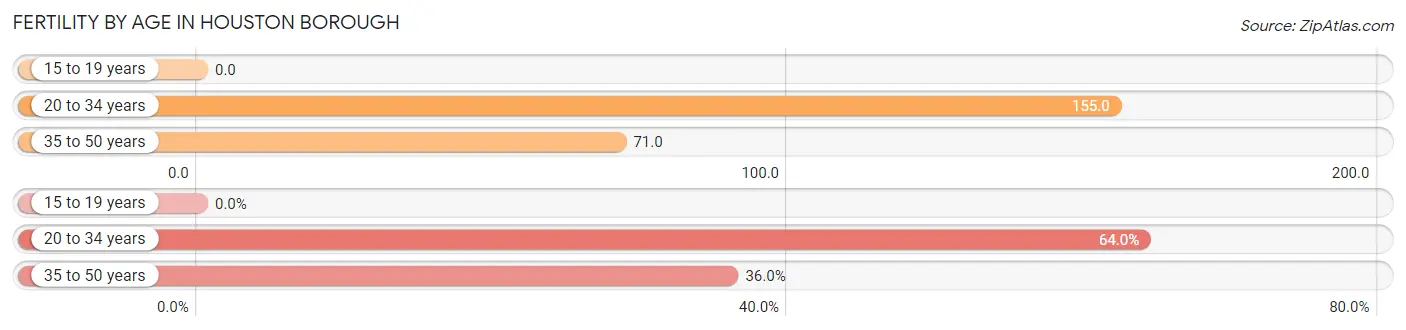
Fertility by Age in Houston borough
Average fertility rate in Houston borough is 95.0 births per 1,000 women. Women in the age bracket of 20 to 34 years have the highest fertility rate with 155.0 births per 1,000 women. Women in the age bracket of 20 to 34 years acount for 64.0% of all women with births.
| Age Bracket | Women with Births | Births / 1,000 Women |
| 15 to 19 years | 0 (0.0%) | 0.0 |
| 20 to 34 years | 16 (64.0%) | 155.0 |
| 35 to 50 years | 9 (36.0%) | 71.0 |
| Total | 25 (100.0%) | 95.0 |
Fertility by Age by Marriage Status in Houston borough
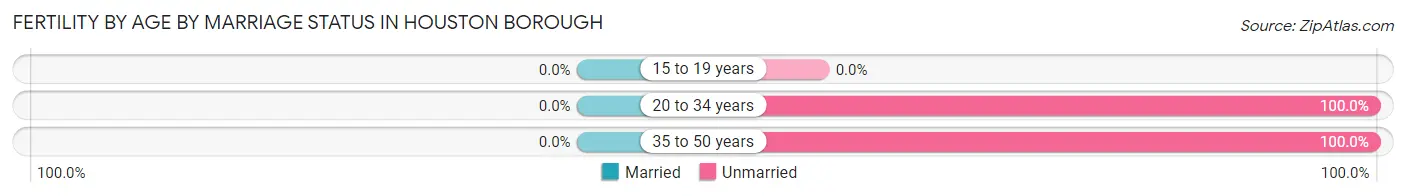
| Age Bracket | Married | Unmarried |
| 15 to 19 years | 0 (0.0%) | 0 (0.0%) |
| 20 to 34 years | 0 (0.0%) | 16 (100.0%) |
| 35 to 50 years | 0 (0.0%) | 9 (100.0%) |
| Total | 0 (0.0%) | 25 (100.0%) |
Fertility by Education in Houston borough
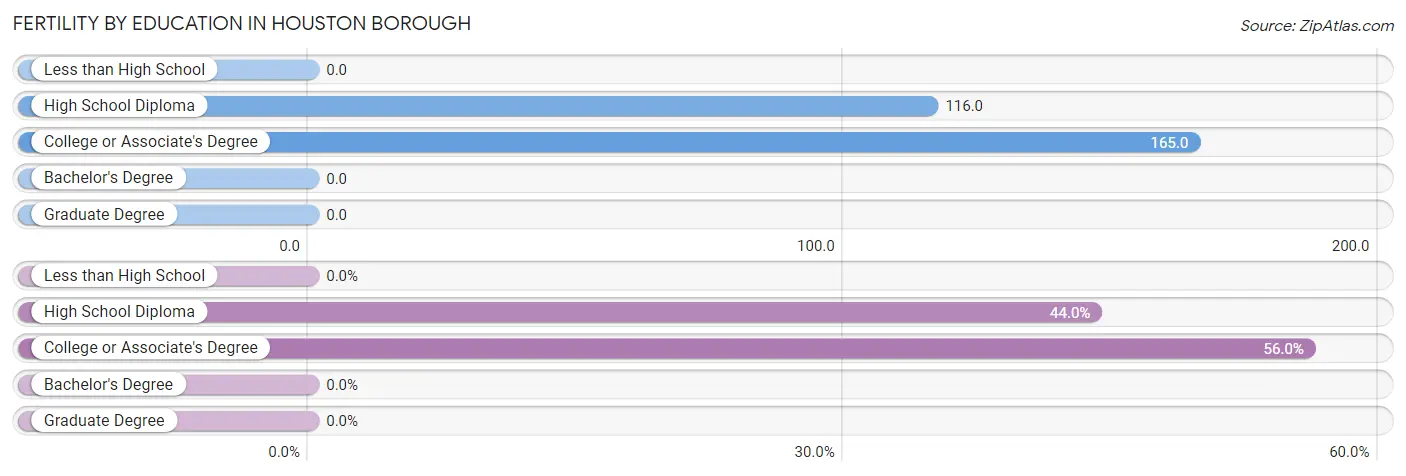
| Educational Attainment | Women with Births | Births / 1,000 Women |
| Less than High School | 0 (0.0%) | 0.0 |
| High School Diploma | 11 (44.0%) | 116.0 |
| College or Associate's Degree | 14 (56.0%) | 165.0 |
| Bachelor's Degree | 0 (0.0%) | 0.0 |
| Graduate Degree | 0 (0.0%) | 0.0 |
| Total | 25 (100.0%) | 95.0 |
Fertility by Education by Marriage Status in Houston borough
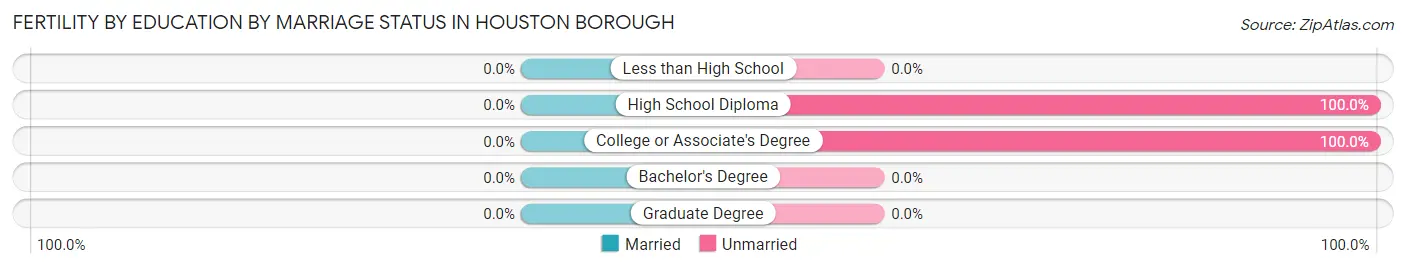
| Educational Attainment | Married | Unmarried |
| Less than High School | 0 (0.0%) | 0 (0.0%) |
| High School Diploma | 0 (0.0%) | 11 (100.0%) |
| College or Associate's Degree | 0 (0.0%) | 14 (100.0%) |
| Bachelor's Degree | 0 (0.0%) | 0 (0.0%) |
| Graduate Degree | 0 (0.0%) | 0 (0.0%) |
| Total | 0 (0.0%) | 25 (100.0%) |
Income in Houston borough
Income Overview in Houston borough
Per Capita Income in Houston borough is $33,738, while median incomes of families and households are $72,159 and $64,028 respectively.
| Characteristic | Number | Measure |
| Per Capita Income | 1,204 | $33,738 |
| Median Family Income | 313 | $72,159 |
| Mean Family Income | 313 | $85,941 |
| Median Household Income | 577 | $64,028 |
| Mean Household Income | 577 | $67,476 |
| Income Deficit | 313 | $0 |
| Wage / Income Gap (%) | 1,204 | 49.51% |
| Wage / Income Gap ($) | 1,204 | 50.49¢ per $1 |
| Gini / Inequality Index | 1,204 | 0.41 |
Earnings by Sex in Houston borough
Average Earnings in Houston borough are $41,932, $59,063 for men and $29,821 for women, a difference of 49.5%.
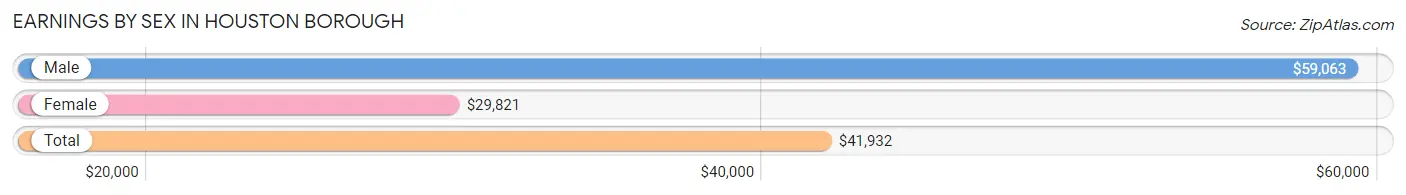
| Sex | Number | Average Earnings |
| Male | 352 (55.3%) | $59,063 |
| Female | 285 (44.7%) | $29,821 |
| Total | 637 (100.0%) | $41,932 |
Earnings by Sex by Income Bracket in Houston borough
The most common earnings brackets in Houston borough are $55,000 to $64,999 for men (56 | 15.9%) and $25,000 to $29,999 for women (37 | 13.0%).
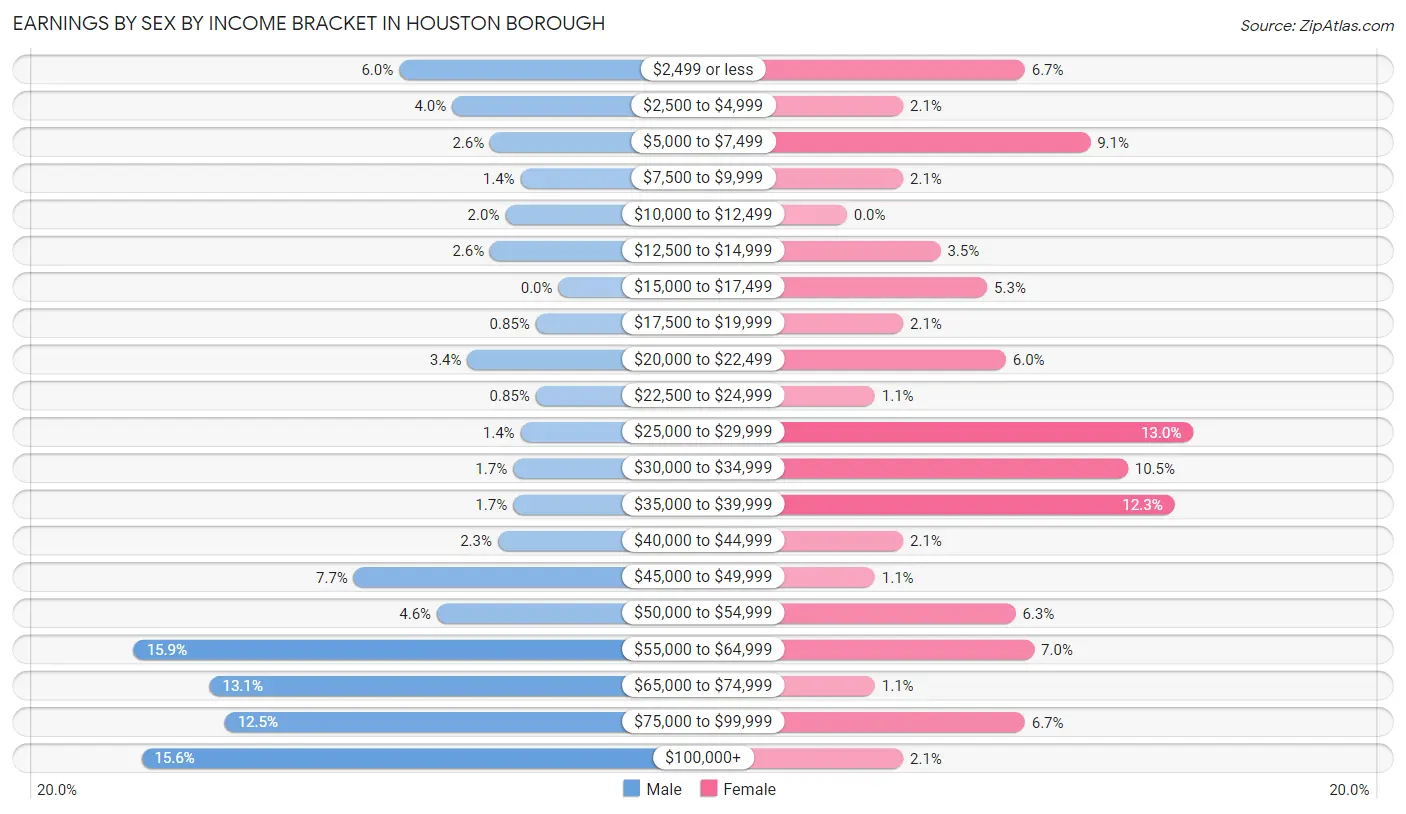
| Income | Male | Female |
| $2,499 or less | 21 (6.0%) | 19 (6.7%) |
| $2,500 to $4,999 | 14 (4.0%) | 6 (2.1%) |
| $5,000 to $7,499 | 9 (2.6%) | 26 (9.1%) |
| $7,500 to $9,999 | 5 (1.4%) | 6 (2.1%) |
| $10,000 to $12,499 | 7 (2.0%) | 0 (0.0%) |
| $12,500 to $14,999 | 9 (2.6%) | 10 (3.5%) |
| $15,000 to $17,499 | 0 (0.0%) | 15 (5.3%) |
| $17,500 to $19,999 | 3 (0.9%) | 6 (2.1%) |
| $20,000 to $22,499 | 12 (3.4%) | 17 (6.0%) |
| $22,500 to $24,999 | 3 (0.9%) | 3 (1.1%) |
| $25,000 to $29,999 | 5 (1.4%) | 37 (13.0%) |
| $30,000 to $34,999 | 6 (1.7%) | 30 (10.5%) |
| $35,000 to $39,999 | 6 (1.7%) | 35 (12.3%) |
| $40,000 to $44,999 | 8 (2.3%) | 6 (2.1%) |
| $45,000 to $49,999 | 27 (7.7%) | 3 (1.1%) |
| $50,000 to $54,999 | 16 (4.5%) | 18 (6.3%) |
| $55,000 to $64,999 | 56 (15.9%) | 20 (7.0%) |
| $65,000 to $74,999 | 46 (13.1%) | 3 (1.1%) |
| $75,000 to $99,999 | 44 (12.5%) | 19 (6.7%) |
| $100,000+ | 55 (15.6%) | 6 (2.1%) |
| Total | 352 (100.0%) | 285 (100.0%) |
Earnings by Sex by Educational Attainment in Houston borough
Average earnings in Houston borough are $63,333 for men and $32,560 for women, a difference of 48.6%. Men with an educational attainment of bachelor's degree enjoy the highest average annual earnings of $112,750, while those with college or associate's degree education earn the least with $51,667. Women with an educational attainment of graduate degree earn the most with the average annual earnings of $60,417, while those with high school diploma education have the smallest earnings of $28,882.
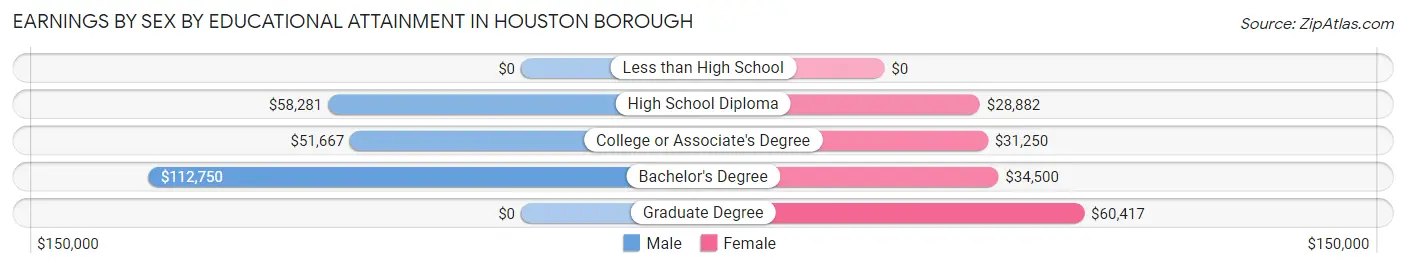
| Educational Attainment | Male Income | Female Income |
| Less than High School | - | - |
| High School Diploma | $58,281 | $28,882 |
| College or Associate's Degree | $51,667 | $31,250 |
| Bachelor's Degree | $112,750 | $34,500 |
| Graduate Degree | - | - |
| Total | $63,333 | $32,560 |
Family Income in Houston borough
Family Income Brackets in Houston borough
According to the Houston borough family income data, there are 106 families falling into the $50,000 to $74,999 income range, which is the most common income bracket and makes up 33.9% of all families.
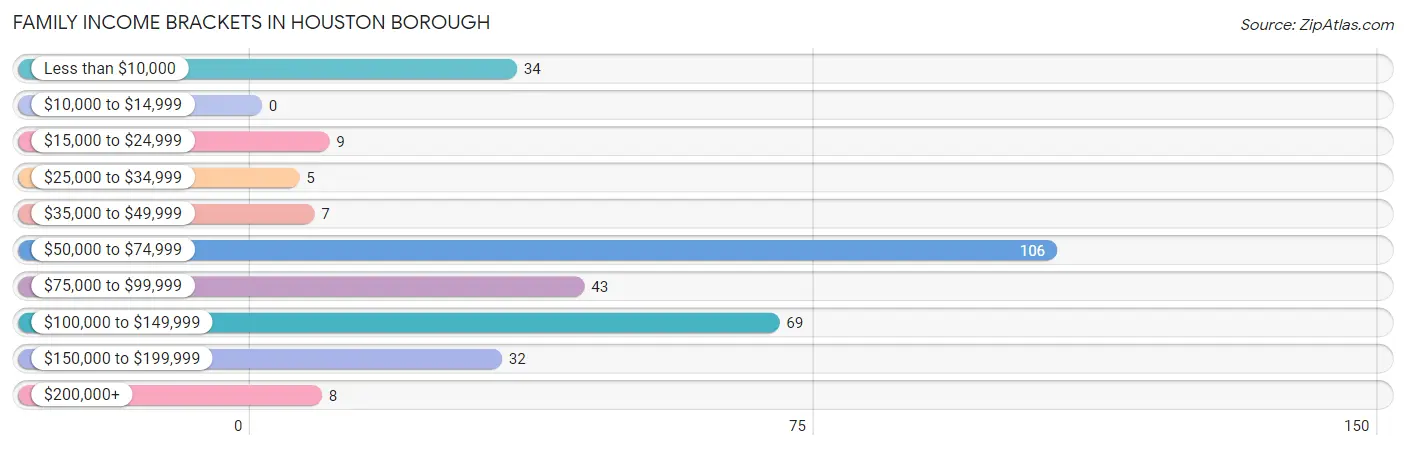
| Income Bracket | # Families | % Families |
| Less than $10,000 | 34 | 10.9% |
| $10,000 to $14,999 | 0 | 0.0% |
| $15,000 to $24,999 | 9 | 2.9% |
| $25,000 to $34,999 | 5 | 1.6% |
| $35,000 to $49,999 | 7 | 2.2% |
| $50,000 to $74,999 | 106 | 33.9% |
| $75,000 to $99,999 | 43 | 13.7% |
| $100,000 to $149,999 | 69 | 22.0% |
| $150,000 to $199,999 | 32 | 10.2% |
| $200,000+ | 8 | 2.6% |
Family Income by Famaliy Size in Houston borough
5-person families (10 | 3.2%) account for the highest median family income in Houston borough with $165,833 per family, while 2-person families (183 | 58.5%) have the highest median income of $43,012 per family member.
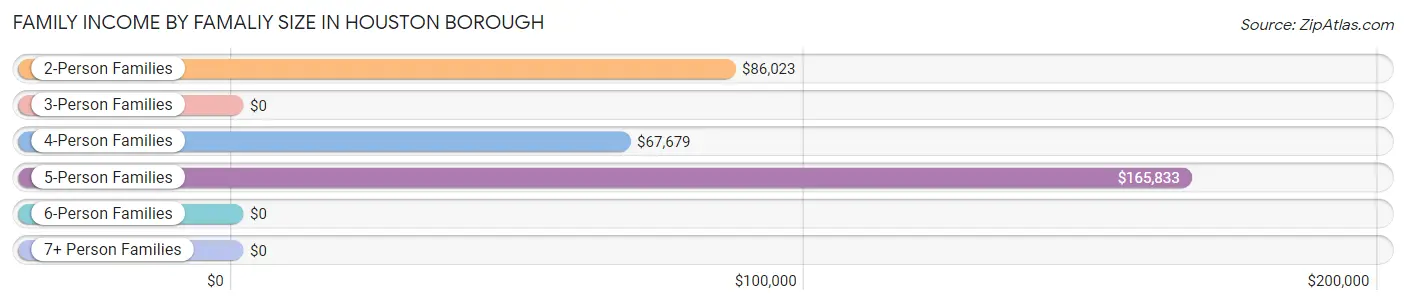
| Income Bracket | # Families | Median Income |
| 2-Person Families | 183 (58.5%) | $86,023 |
| 3-Person Families | 51 (16.3%) | $0 |
| 4-Person Families | 64 (20.4%) | $67,679 |
| 5-Person Families | 10 (3.2%) | $165,833 |
| 6-Person Families | 2 (0.6%) | $0 |
| 7+ Person Families | 3 (1.0%) | $0 |
| Total | 313 (100.0%) | $72,159 |
Family Income by Number of Earners in Houston borough
The median family income in Houston borough is $72,159, with families comprising 3+ earners (28) having the highest median family income of $151,250, while families with 1 earner (99) have the lowest median family income of $59,219, accounting for 8.9% and 31.6% of families, respectively.
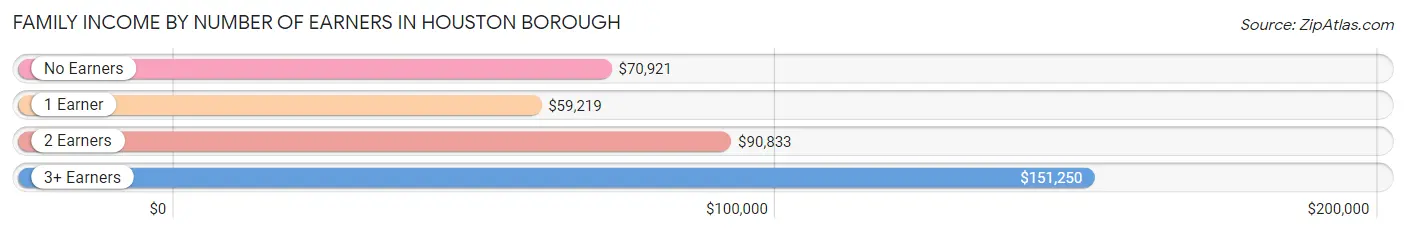
| Number of Earners | # Families | Median Income |
| No Earners | 60 (19.2%) | $70,921 |
| 1 Earner | 99 (31.6%) | $59,219 |
| 2 Earners | 126 (40.3%) | $90,833 |
| 3+ Earners | 28 (8.9%) | $151,250 |
| Total | 313 (100.0%) | $72,159 |
Household Income in Houston borough
Household Income Brackets in Houston borough
With 170 households falling in the category, the $50,000 to $74,999 income range is the most frequent in Houston borough, accounting for 29.5% of all households. In contrast, only 8 households (1.4%) fall into the $200,000+ income bracket, making it the least populous group.
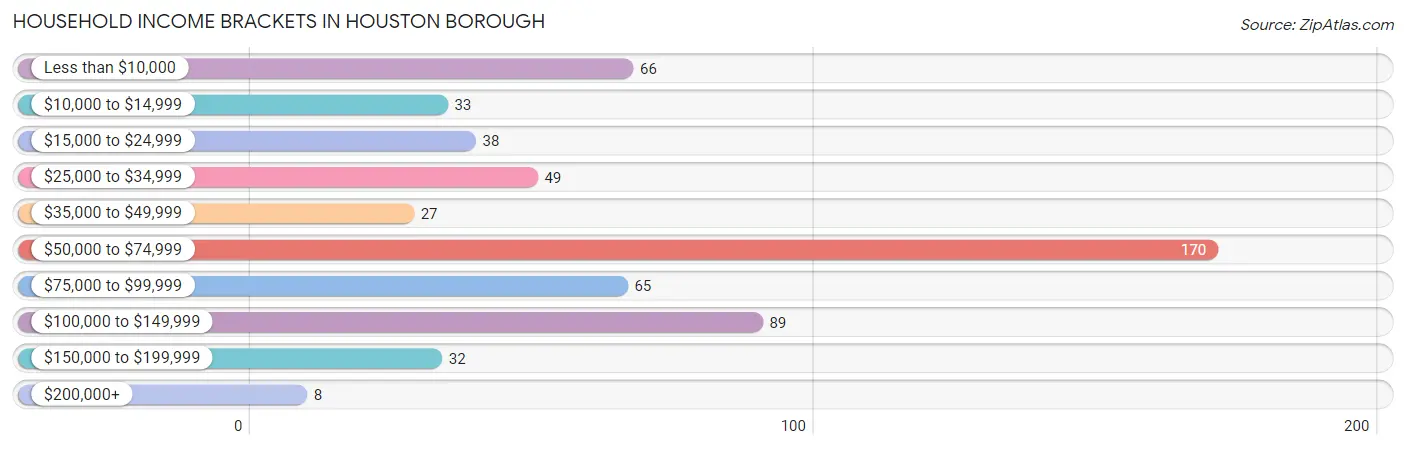
| Income Bracket | # Households | % Households |
| Less than $10,000 | 66 | 11.4% |
| $10,000 to $14,999 | 33 | 5.7% |
| $15,000 to $24,999 | 38 | 6.6% |
| $25,000 to $34,999 | 49 | 8.5% |
| $35,000 to $49,999 | 27 | 4.7% |
| $50,000 to $74,999 | 170 | 29.5% |
| $75,000 to $99,999 | 65 | 11.3% |
| $100,000 to $149,999 | 89 | 15.4% |
| $150,000 to $199,999 | 32 | 5.5% |
| $200,000+ | 8 | 1.4% |
Household Income by Householder Age in Houston borough
The median household income in Houston borough is $64,028, with the highest median household income of $74,875 found in the 45 to 64 years age bracket for the primary householder. A total of 201 households (34.8%) fall into this category. Meanwhile, the 15 to 24 years age bracket for the primary householder has the lowest median household income of $2,499, with 20 households (3.5%) in this group.
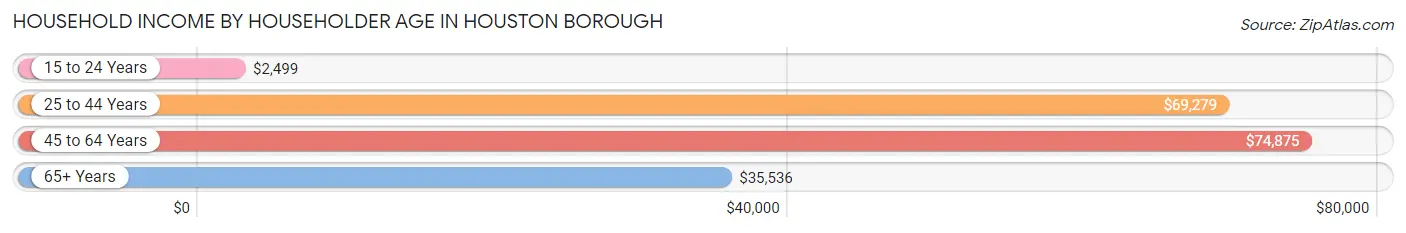
| Income Bracket | # Households | Median Income |
| 15 to 24 Years | 20 (3.5%) | $2,499 |
| 25 to 44 Years | 169 (29.3%) | $69,279 |
| 45 to 64 Years | 201 (34.8%) | $74,875 |
| 65+ Years | 187 (32.4%) | $35,536 |
| Total | 577 (100.0%) | $64,028 |
Poverty in Houston borough
Income Below Poverty by Sex and Age in Houston borough
With 17.7% poverty level for males and 21.0% for females among the residents of Houston borough, under 5 year old males and 5 year old females are the most vulnerable to poverty, with 34 males (60.7%) and 8 females (100.0%) in their respective age groups living below the poverty level.
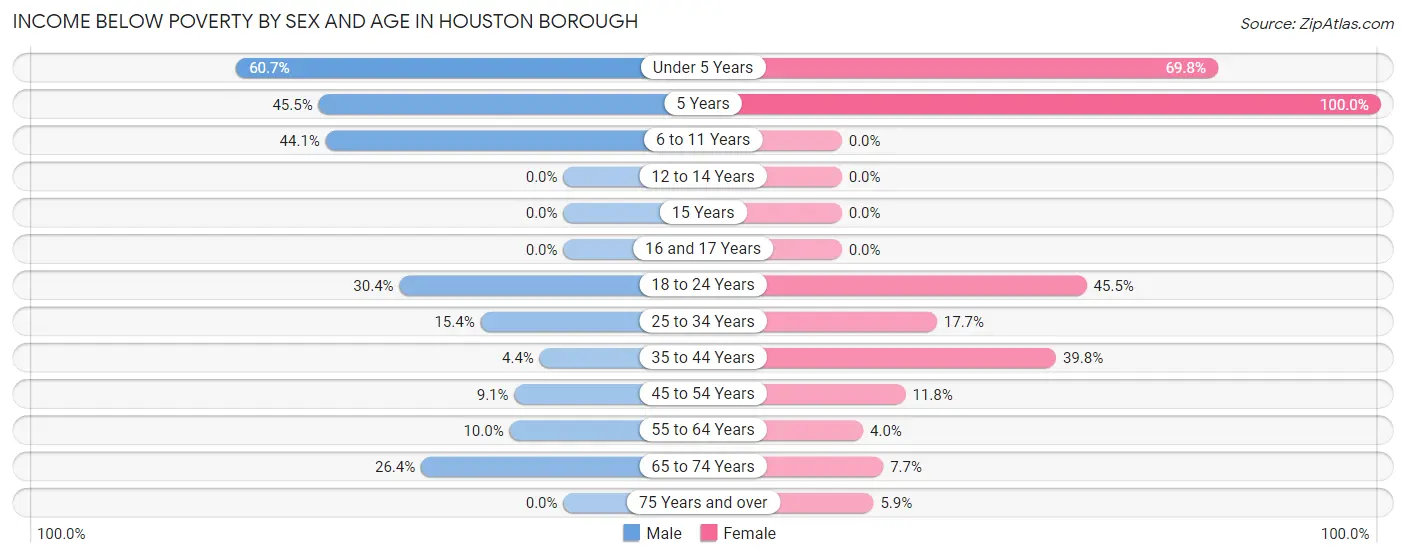
| Age Bracket | Male | Female |
| Under 5 Years | 34 (60.7%) | 30 (69.8%) |
| 5 Years | 5 (45.5%) | 8 (100.0%) |
| 6 to 11 Years | 15 (44.1%) | 0 (0.0%) |
| 12 to 14 Years | 0 (0.0%) | 0 (0.0%) |
| 15 Years | 0 (0.0%) | 0 (0.0%) |
| 16 and 17 Years | 0 (0.0%) | 0 (0.0%) |
| 18 to 24 Years | 7 (30.4%) | 25 (45.5%) |
| 25 to 34 Years | 6 (15.4%) | 12 (17.6%) |
| 35 to 44 Years | 4 (4.4%) | 33 (39.8%) |
| 45 to 54 Years | 7 (9.1%) | 9 (11.8%) |
| 55 to 64 Years | 11 (10.0%) | 3 (4.0%) |
| 65 to 74 Years | 14 (26.4%) | 5 (7.7%) |
| 75 Years and over | 0 (0.0%) | 6 (5.9%) |
| Total | 103 (17.7%) | 131 (21.0%) |
Income Above Poverty by Sex and Age in Houston borough
According to the poverty statistics in Houston borough, males aged 12 to 14 years and females aged 6 to 11 years are the age groups that are most secure financially, with 100.0% of males and 100.0% of females in these age groups living above the poverty line.
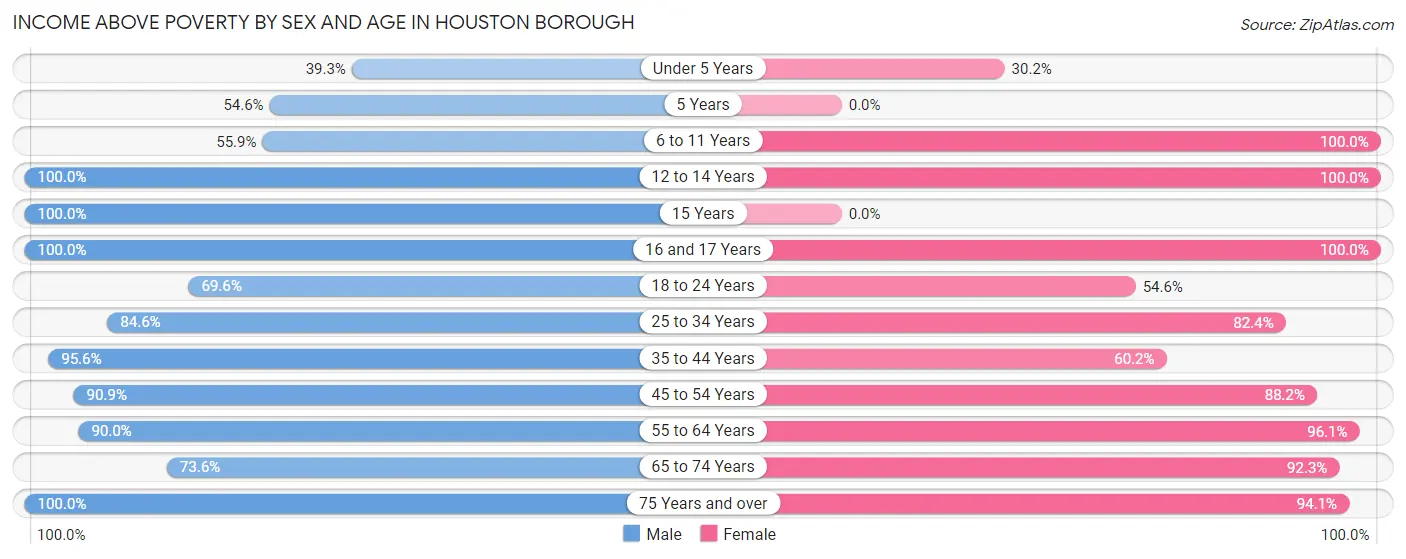
| Age Bracket | Male | Female |
| Under 5 Years | 22 (39.3%) | 13 (30.2%) |
| 5 Years | 6 (54.5%) | 0 (0.0%) |
| 6 to 11 Years | 19 (55.9%) | 16 (100.0%) |
| 12 to 14 Years | 14 (100.0%) | 17 (100.0%) |
| 15 Years | 14 (100.0%) | 0 (0.0%) |
| 16 and 17 Years | 21 (100.0%) | 14 (100.0%) |
| 18 to 24 Years | 16 (69.6%) | 30 (54.5%) |
| 25 to 34 Years | 33 (84.6%) | 56 (82.4%) |
| 35 to 44 Years | 87 (95.6%) | 50 (60.2%) |
| 45 to 54 Years | 70 (90.9%) | 67 (88.2%) |
| 55 to 64 Years | 99 (90.0%) | 73 (96.1%) |
| 65 to 74 Years | 39 (73.6%) | 60 (92.3%) |
| 75 Years and over | 38 (100.0%) | 96 (94.1%) |
| Total | 478 (82.3%) | 492 (79.0%) |
Income Below Poverty Among Married-Couple Families in Houston borough
The poverty statistics for married-couple families in Houston borough show that 1.8% or 4 of the total 216 families live below the poverty line. Families with 1 or 2 children have the highest poverty rate of 3.5%, comprising of 2 families. On the other hand, families with 3 or 4 children have the lowest poverty rate of 0.0%, which includes 0 families.
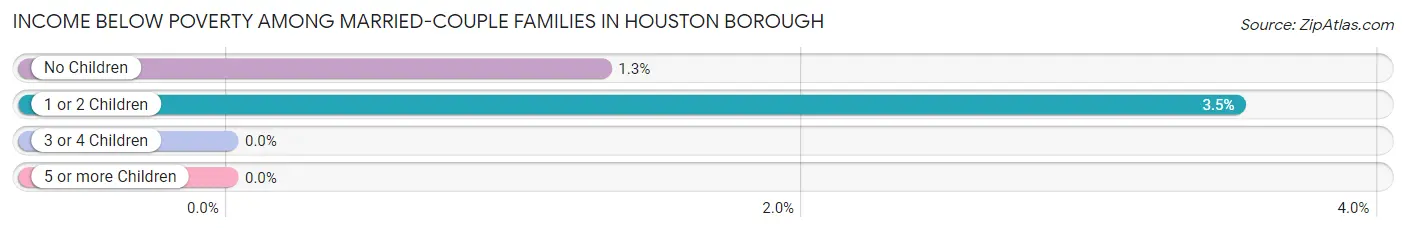
| Children | Above Poverty | Below Poverty |
| No Children | 152 (98.7%) | 2 (1.3%) |
| 1 or 2 Children | 55 (96.5%) | 2 (3.5%) |
| 3 or 4 Children | 5 (100.0%) | 0 (0.0%) |
| 5 or more Children | 0 (0.0%) | 0 (0.0%) |
| Total | 212 (98.2%) | 4 (1.8%) |
Income Below Poverty Among Single-Parent Households in Houston borough
According to the poverty data in Houston borough, 15.4% or 4 single-father households and 49.3% or 35 single-mother households are living below the poverty line. Among single-father households, those with 1 or 2 children have the highest poverty rate, with 4 households (22.2%) experiencing poverty. Likewise, among single-mother households, those with 1 or 2 children have the highest poverty rate, with 22 households (73.3%) falling below the poverty line.
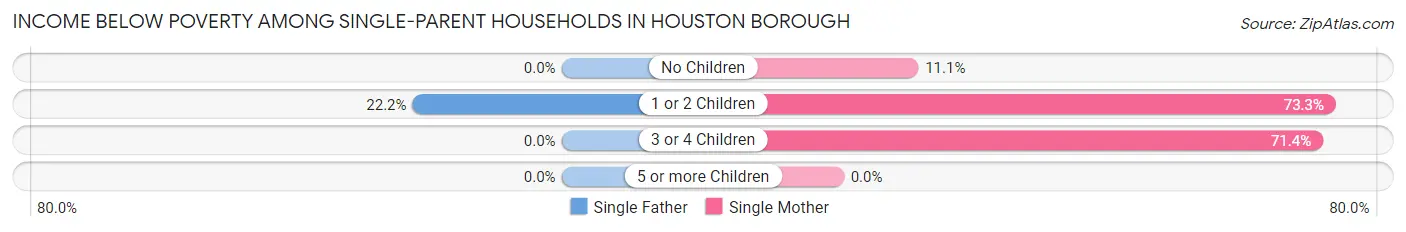
| Children | Single Father | Single Mother |
| No Children | 0 (0.0%) | 3 (11.1%) |
| 1 or 2 Children | 4 (22.2%) | 22 (73.3%) |
| 3 or 4 Children | 0 (0.0%) | 10 (71.4%) |
| 5 or more Children | 0 (0.0%) | 0 (0.0%) |
| Total | 4 (15.4%) | 35 (49.3%) |
Income Below Poverty Among Married-Couple vs Single-Parent Households in Houston borough
The poverty data for Houston borough shows that 4 of the married-couple family households (1.8%) and 39 of the single-parent households (40.2%) are living below the poverty level. Within the married-couple family households, those with 1 or 2 children have the highest poverty rate, with 2 households (3.5%) falling below the poverty line. Among the single-parent households, those with 3 or 4 children have the highest poverty rate, with 10 household (58.8%) living below poverty.
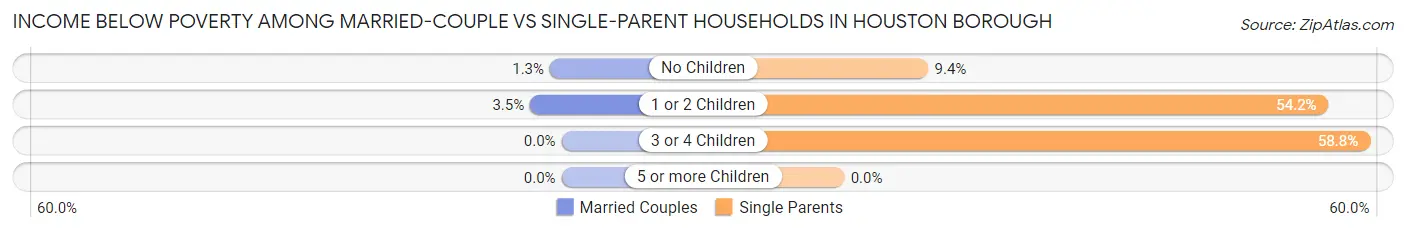
| Children | Married-Couple Families | Single-Parent Households |
| No Children | 2 (1.3%) | 3 (9.4%) |
| 1 or 2 Children | 2 (3.5%) | 26 (54.2%) |
| 3 or 4 Children | 0 (0.0%) | 10 (58.8%) |
| 5 or more Children | 0 (0.0%) | 0 (0.0%) |
| Total | 4 (1.8%) | 39 (40.2%) |
Employment Characteristics in Houston borough
Employment by Class of Employer in Houston borough
Among the 581 employed individuals in Houston borough, private company employees (429 | 73.8%), not-for-profit organizations (60 | 10.3%), and local government employees (41 | 7.1%) make up the most common classes of employment.
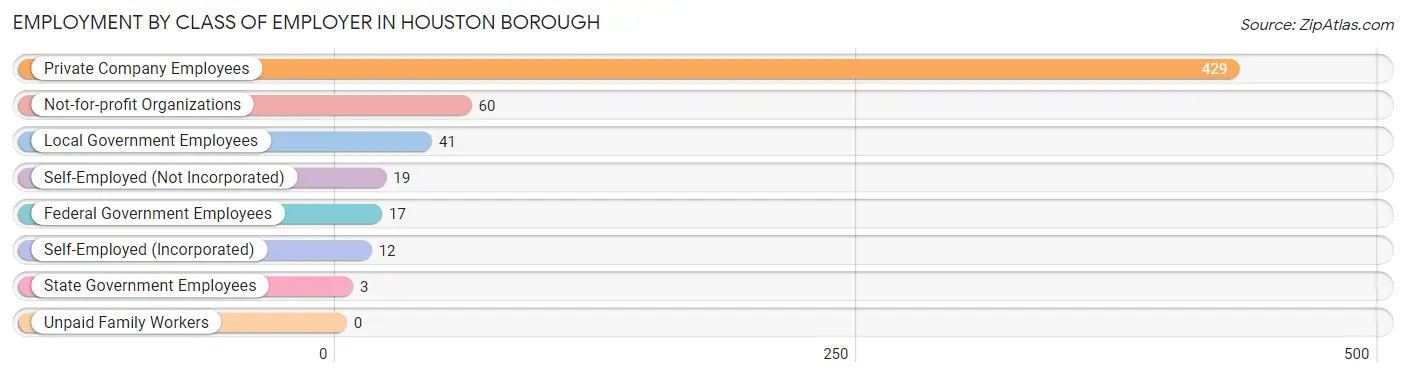
| Employer Class | # Employees | % Employees |
| Private Company Employees | 429 | 73.8% |
| Self-Employed (Incorporated) | 12 | 2.1% |
| Self-Employed (Not Incorporated) | 19 | 3.3% |
| Not-for-profit Organizations | 60 | 10.3% |
| Local Government Employees | 41 | 7.1% |
| State Government Employees | 3 | 0.5% |
| Federal Government Employees | 17 | 2.9% |
| Unpaid Family Workers | 0 | 0.0% |
| Total | 581 | 100.0% |
Employment Status by Age in Houston borough
According to the labor force statistics for Houston borough, out of the total population over 16 years of age (991), 61.9% or 613 individuals are in the labor force, with 3.8% or 23 of them unemployed. The age group with the highest labor force participation rate is 45 to 54 years, with 98.7% or 151 individuals in the labor force. Within the labor force, the 20 to 24 years age range has the highest percentage of unemployed individuals, with 26.8% or 11 of them being unemployed.
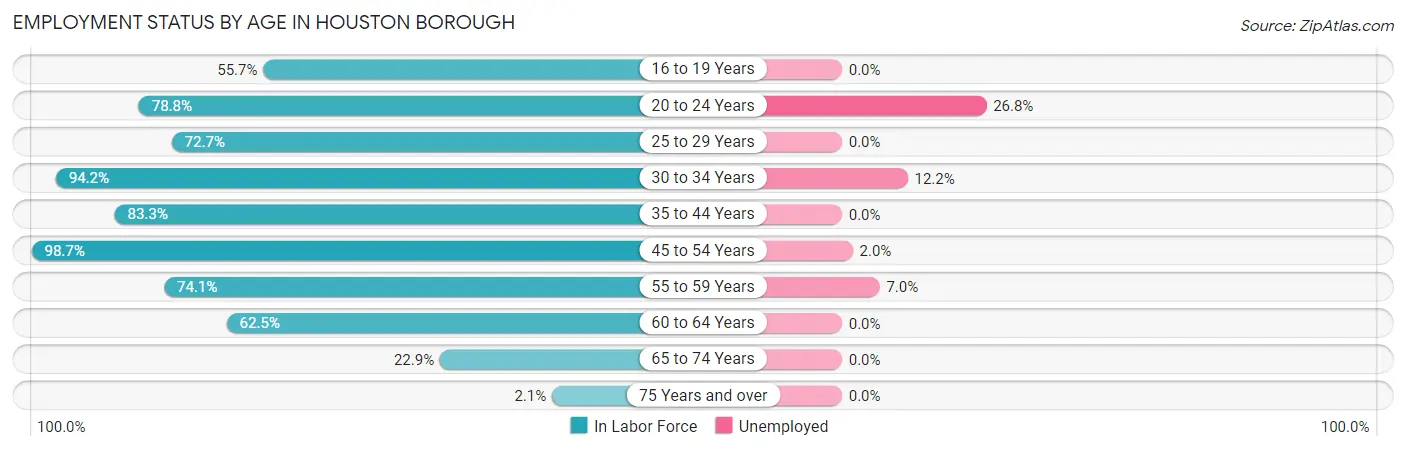
| Age Bracket | In Labor Force | Unemployed |
| 16 to 19 Years | 34 (55.7%) | 0 (0.0%) |
| 20 to 24 Years | 41 (78.8%) | 11 (26.8%) |
| 25 to 29 Years | 40 (72.7%) | 0 (0.0%) |
| 30 to 34 Years | 49 (94.2%) | 6 (12.2%) |
| 35 to 44 Years | 145 (83.3%) | 0 (0.0%) |
| 45 to 54 Years | 151 (98.7%) | 3 (2.0%) |
| 55 to 59 Years | 43 (74.1%) | 3 (7.0%) |
| 60 to 64 Years | 80 (62.5%) | 0 (0.0%) |
| 65 to 74 Years | 27 (22.9%) | 0 (0.0%) |
| 75 Years and over | 3 (2.1%) | 0 (0.0%) |
| Total | 613 (61.9%) | 23 (3.8%) |
Employment Status by Educational Attainment in Houston borough
According to labor force statistics for Houston borough, 81.9% of individuals (508) out of the total population between 25 and 64 years of age (620) are in the labor force, with 2.4% or 12 of them being unemployed. The group with the highest labor force participation rate are those with the educational attainment of bachelor's degree or higher, with 89.9% or 142 individuals in the labor force. Within the labor force, individuals with college / associate degree education have the highest percentage of unemployment, with 4.4% or 6 of them being unemployed.
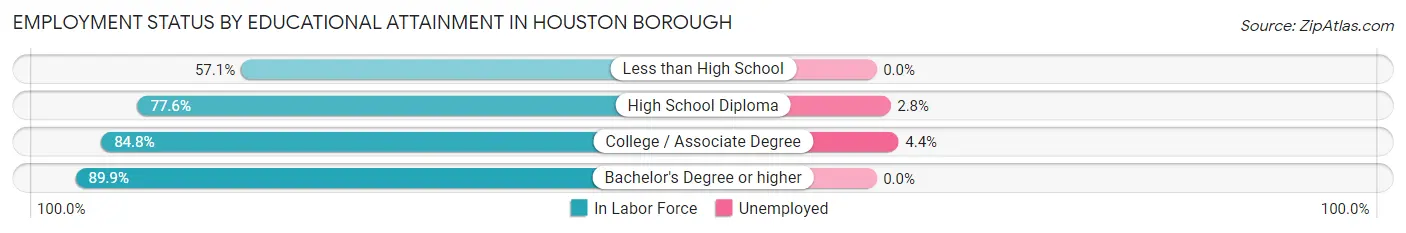
| Educational Attainment | In Labor Force | Unemployed |
| Less than High School | 12 (57.1%) | 0 (0.0%) |
| High School Diploma | 215 (77.6%) | 8 (2.8%) |
| College / Associate Degree | 139 (84.8%) | 7 (4.4%) |
| Bachelor's Degree or higher | 142 (89.9%) | 0 (0.0%) |
| Total | 508 (81.9%) | 15 (2.4%) |
Employment Occupations by Sex in Houston borough
Management, Business, Science and Arts Occupations
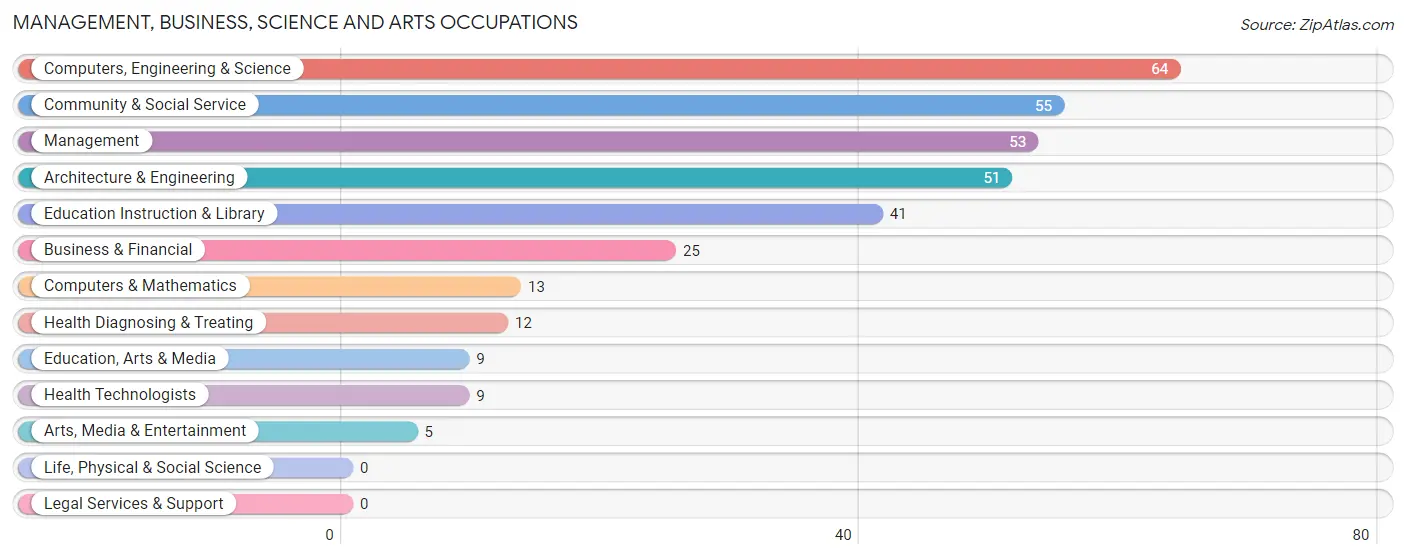
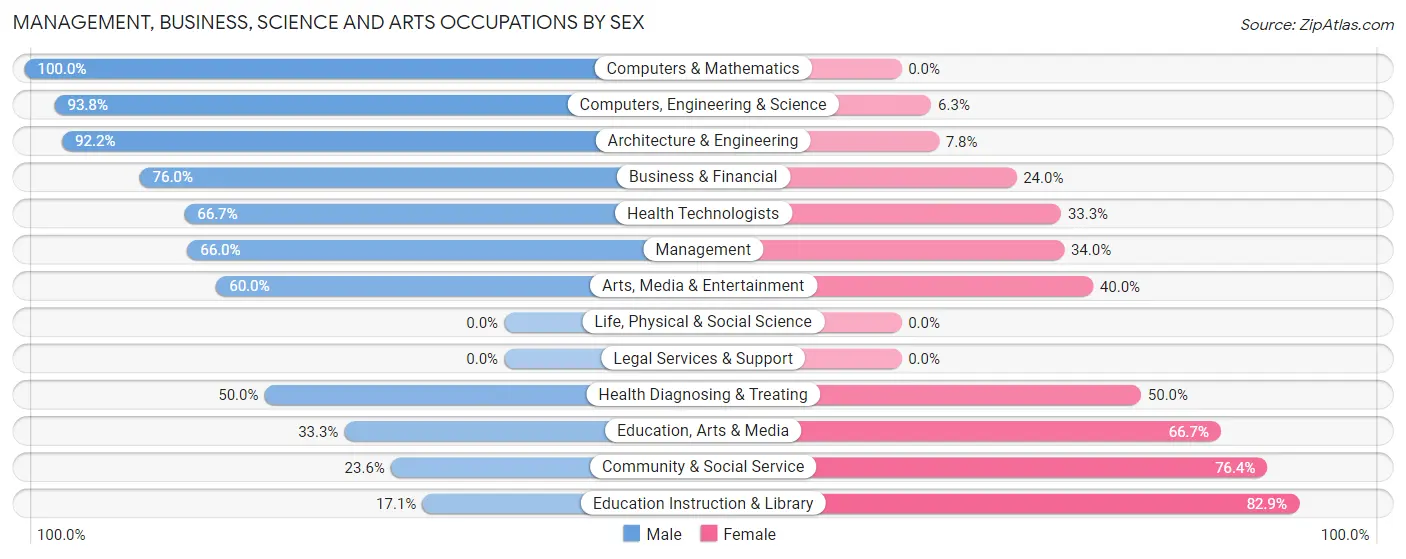
The most common Management, Business, Science and Arts occupations in Houston borough are Computers, Engineering & Science (64 | 10.9%), Community & Social Service (55 | 9.4%), Management (53 | 9.0%), Architecture & Engineering (51 | 8.7%), and Education Instruction & Library (41 | 7.0%).
Management, Business, Science and Arts Occupations by Sex
Within the Management, Business, Science and Arts occupations in Houston borough, the most male-oriented occupations are Computers & Mathematics (100.0%), Computers, Engineering & Science (93.8%), and Architecture & Engineering (92.2%), while the most female-oriented occupations are Education Instruction & Library (82.9%), Community & Social Service (76.4%), and Education, Arts & Media (66.7%).
| Occupation | Male | Female |
| Management | 35 (66.0%) | 18 (34.0%) |
| Business & Financial | 19 (76.0%) | 6 (24.0%) |
| Computers, Engineering & Science | 60 (93.8%) | 4 (6.2%) |
| Computers & Mathematics | 13 (100.0%) | 0 (0.0%) |
| Architecture & Engineering | 47 (92.2%) | 4 (7.8%) |
| Life, Physical & Social Science | 0 (0.0%) | 0 (0.0%) |
| Community & Social Service | 13 (23.6%) | 42 (76.4%) |
| Education, Arts & Media | 3 (33.3%) | 6 (66.7%) |
| Legal Services & Support | 0 (0.0%) | 0 (0.0%) |
| Education Instruction & Library | 7 (17.1%) | 34 (82.9%) |
| Arts, Media & Entertainment | 3 (60.0%) | 2 (40.0%) |
| Health Diagnosing & Treating | 6 (50.0%) | 6 (50.0%) |
| Health Technologists | 6 (66.7%) | 3 (33.3%) |
| Total (Category) | 133 (63.6%) | 76 (36.4%) |
| Total (Overall) | 319 (54.4%) | 267 (45.6%) |
Services Occupations
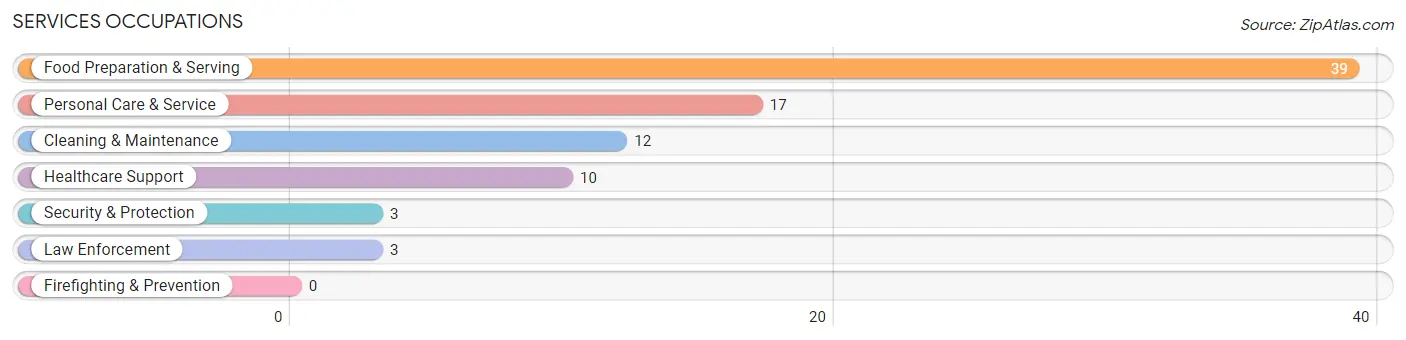
The most common Services occupations in Houston borough are Food Preparation & Serving (39 | 6.7%), Personal Care & Service (17 | 2.9%), Cleaning & Maintenance (12 | 2.1%), Healthcare Support (10 | 1.7%), and Security & Protection (3 | 0.5%).
Services Occupations by Sex
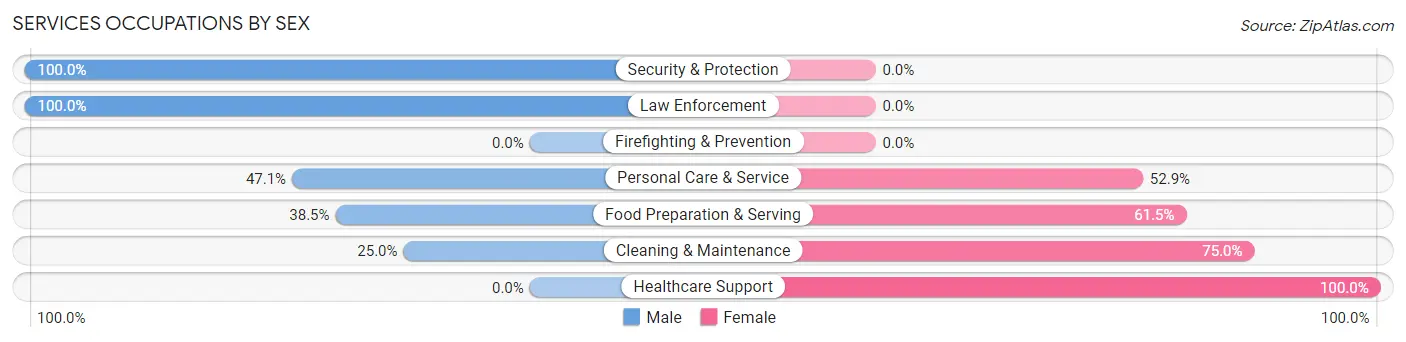
Within the Services occupations in Houston borough, the most male-oriented occupations are Security & Protection (100.0%), Law Enforcement (100.0%), and Personal Care & Service (47.1%), while the most female-oriented occupations are Healthcare Support (100.0%), Cleaning & Maintenance (75.0%), and Food Preparation & Serving (61.5%).
| Occupation | Male | Female |
| Healthcare Support | 0 (0.0%) | 10 (100.0%) |
| Security & Protection | 3 (100.0%) | 0 (0.0%) |
| Firefighting & Prevention | 0 (0.0%) | 0 (0.0%) |
| Law Enforcement | 3 (100.0%) | 0 (0.0%) |
| Food Preparation & Serving | 15 (38.5%) | 24 (61.5%) |
| Cleaning & Maintenance | 3 (25.0%) | 9 (75.0%) |
| Personal Care & Service | 8 (47.1%) | 9 (52.9%) |
| Total (Category) | 29 (35.8%) | 52 (64.2%) |
| Total (Overall) | 319 (54.4%) | 267 (45.6%) |
Sales and Office Occupations
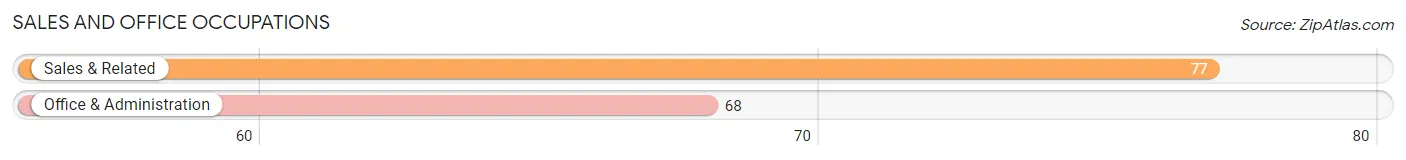
The most common Sales and Office occupations in Houston borough are Sales & Related (77 | 13.1%), and Office & Administration (68 | 11.6%).
Sales and Office Occupations by Sex
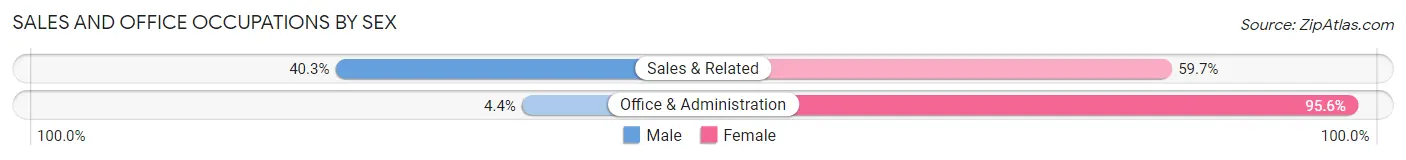
| Occupation | Male | Female |
| Sales & Related | 31 (40.3%) | 46 (59.7%) |
| Office & Administration | 3 (4.4%) | 65 (95.6%) |
| Total (Category) | 34 (23.4%) | 111 (76.5%) |
| Total (Overall) | 319 (54.4%) | 267 (45.6%) |
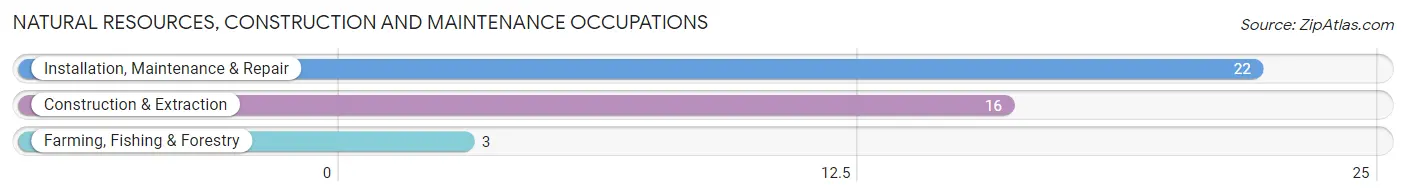
Natural Resources, Construction and Maintenance Occupations
The most common Natural Resources, Construction and Maintenance occupations in Houston borough are Installation, Maintenance & Repair (22 | 3.7%), Construction & Extraction (16 | 2.7%), and Farming, Fishing & Forestry (3 | 0.5%).
Natural Resources, Construction and Maintenance Occupations by Sex
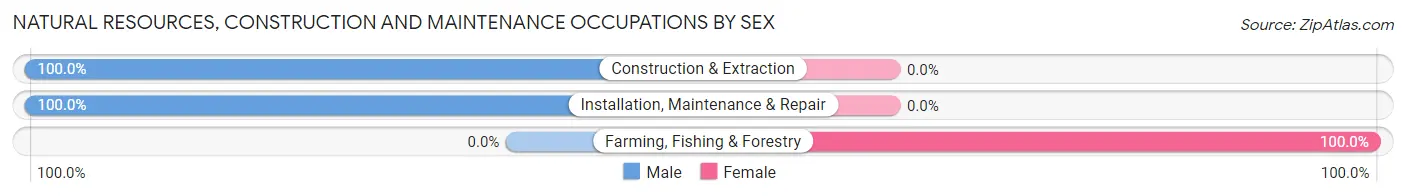
| Occupation | Male | Female |
| Farming, Fishing & Forestry | 0 (0.0%) | 3 (100.0%) |
| Construction & Extraction | 16 (100.0%) | 0 (0.0%) |
| Installation, Maintenance & Repair | 22 (100.0%) | 0 (0.0%) |
| Total (Category) | 38 (92.7%) | 3 (7.3%) |
| Total (Overall) | 319 (54.4%) | 267 (45.6%) |
Production, Transportation and Moving Occupations
The most common Production, Transportation and Moving occupations in Houston borough are Transportation (51 | 8.7%), Production (35 | 6.0%), and Material Moving (24 | 4.1%).
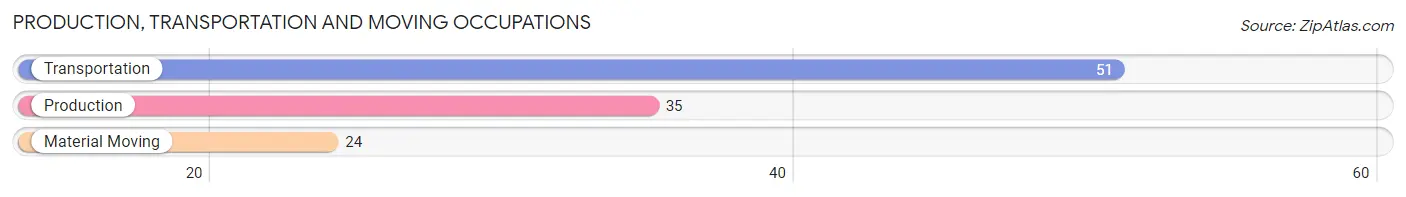
Production, Transportation and Moving Occupations by Sex
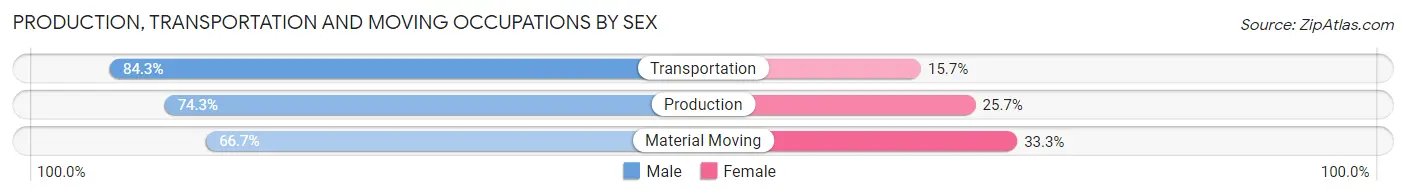
| Occupation | Male | Female |
| Production | 26 (74.3%) | 9 (25.7%) |
| Transportation | 43 (84.3%) | 8 (15.7%) |
| Material Moving | 16 (66.7%) | 8 (33.3%) |
| Total (Category) | 85 (77.3%) | 25 (22.7%) |
| Total (Overall) | 319 (54.4%) | 267 (45.6%) |
Employment Industries by Sex in Houston borough
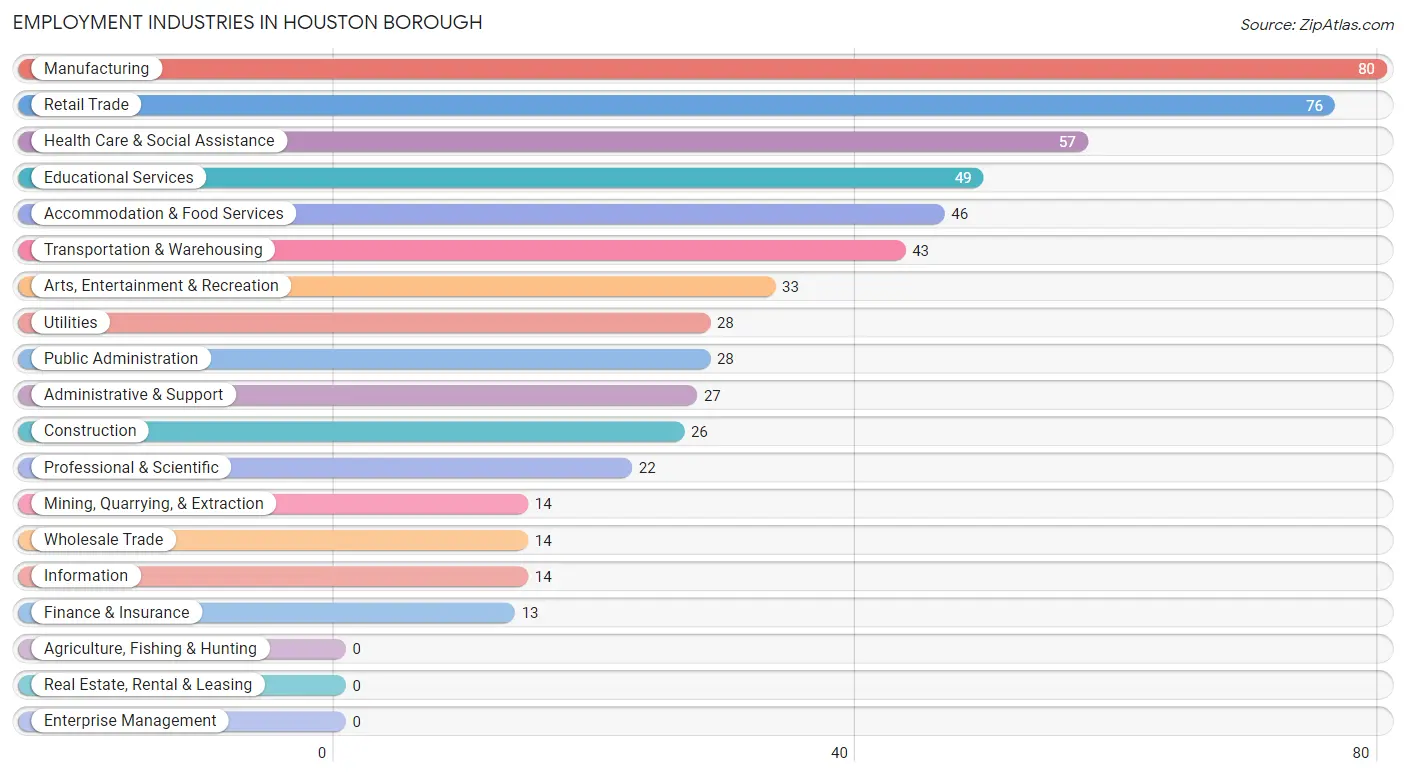
Employment Industries in Houston borough
The major employment industries in Houston borough include Manufacturing (80 | 13.7%), Retail Trade (76 | 13.0%), Health Care & Social Assistance (57 | 9.7%), Educational Services (49 | 8.4%), and Accommodation & Food Services (46 | 7.9%).
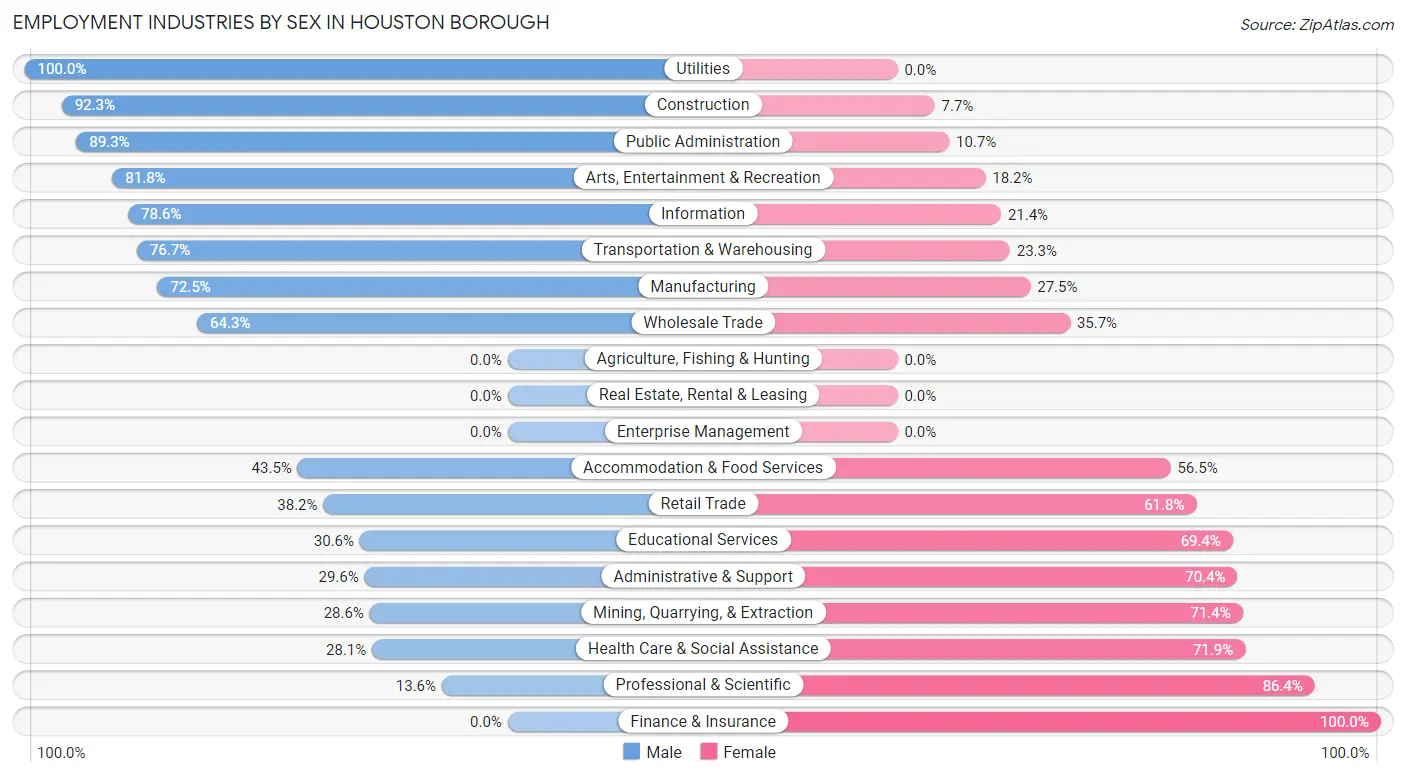
Employment Industries by Sex in Houston borough
The Houston borough industries that see more men than women are Utilities (100.0%), Construction (92.3%), and Public Administration (89.3%), whereas the industries that tend to have a higher number of women are Finance & Insurance (100.0%), Professional & Scientific (86.4%), and Health Care & Social Assistance (71.9%).
| Industry | Male | Female |
| Agriculture, Fishing & Hunting | 0 (0.0%) | 0 (0.0%) |
| Mining, Quarrying, & Extraction | 4 (28.6%) | 10 (71.4%) |
| Construction | 24 (92.3%) | 2 (7.7%) |
| Manufacturing | 58 (72.5%) | 22 (27.5%) |
| Wholesale Trade | 9 (64.3%) | 5 (35.7%) |
| Retail Trade | 29 (38.2%) | 47 (61.8%) |
| Transportation & Warehousing | 33 (76.7%) | 10 (23.3%) |
| Utilities | 28 (100.0%) | 0 (0.0%) |
| Information | 11 (78.6%) | 3 (21.4%) |
| Finance & Insurance | 0 (0.0%) | 13 (100.0%) |
| Real Estate, Rental & Leasing | 0 (0.0%) | 0 (0.0%) |
| Professional & Scientific | 3 (13.6%) | 19 (86.4%) |
| Enterprise Management | 0 (0.0%) | 0 (0.0%) |
| Administrative & Support | 8 (29.6%) | 19 (70.4%) |
| Educational Services | 15 (30.6%) | 34 (69.4%) |
| Health Care & Social Assistance | 16 (28.1%) | 41 (71.9%) |
| Arts, Entertainment & Recreation | 27 (81.8%) | 6 (18.2%) |
| Accommodation & Food Services | 20 (43.5%) | 26 (56.5%) |
| Public Administration | 25 (89.3%) | 3 (10.7%) |
| Total | 319 (54.4%) | 267 (45.6%) |
Education in Houston borough
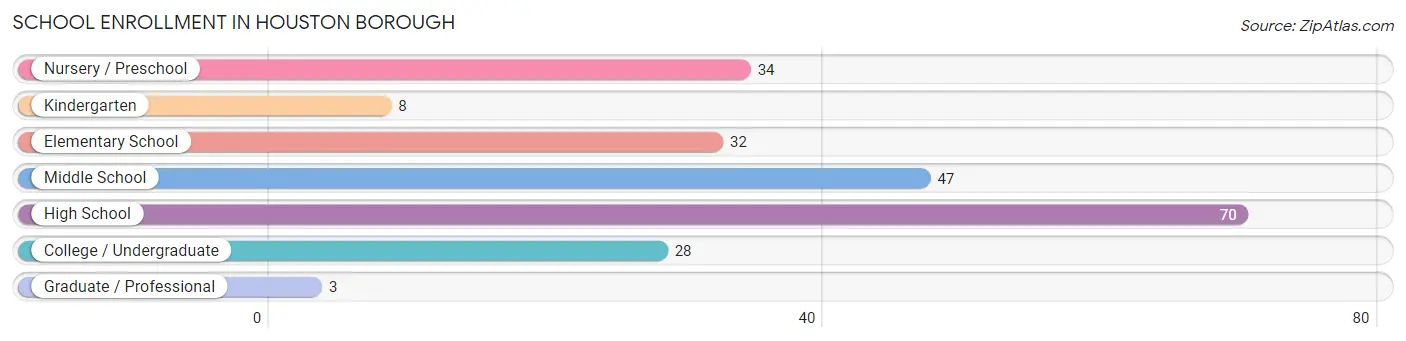
School Enrollment in Houston borough
The most common levels of schooling among the 222 students in Houston borough are high school (70 | 31.5%), middle school (47 | 21.2%), and nursery / preschool (34 | 15.3%).
| School Level | # Students | % Students |
| Nursery / Preschool | 34 | 15.3% |
| Kindergarten | 8 | 3.6% |
| Elementary School | 32 | 14.4% |
| Middle School | 47 | 21.2% |
| High School | 70 | 31.5% |
| College / Undergraduate | 28 | 12.6% |
| Graduate / Professional | 3 | 1.3% |
| Total | 222 | 100.0% |
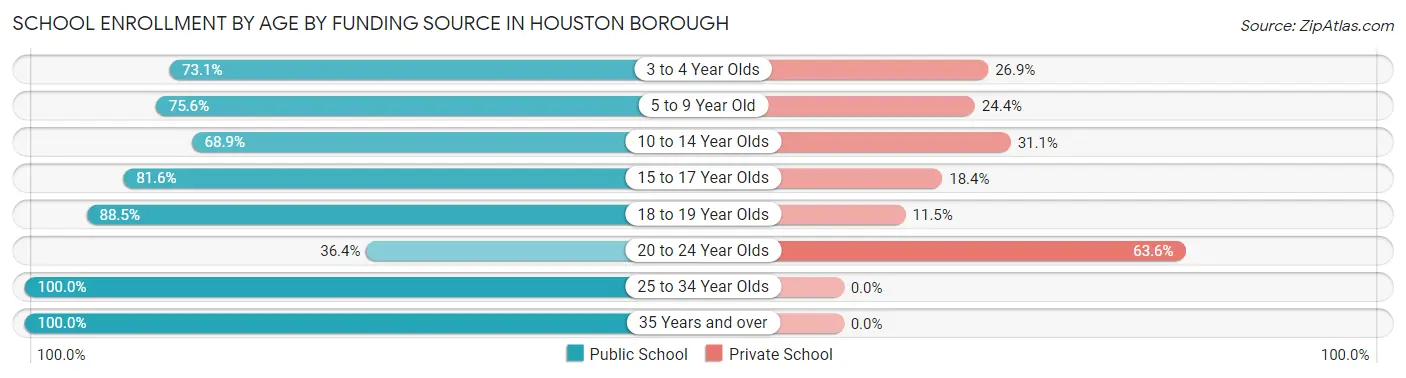
School Enrollment by Age by Funding Source in Houston borough
Out of a total of 222 students who are enrolled in schools in Houston borough, 51 (23.0%) attend a private institution, while the remaining 171 (77.0%) are enrolled in public schools. The age group of 20 to 24 year olds has the highest likelihood of being enrolled in private schools, with 7 (63.6% in the age bracket) enrolled. Conversely, the age group of 25 to 34 year olds has the lowest likelihood of being enrolled in a private school, with 14 (100.0% in the age bracket) attending a public institution.
| Age Bracket | Public School | Private School |
| 3 to 4 Year Olds | 19 (73.1%) | 7 (26.9%) |
| 5 to 9 Year Old | 34 (75.6%) | 11 (24.4%) |
| 10 to 14 Year Olds | 31 (68.9%) | 14 (31.1%) |
| 15 to 17 Year Olds | 40 (81.6%) | 9 (18.4%) |
| 18 to 19 Year Olds | 23 (88.5%) | 3 (11.5%) |
| 20 to 24 Year Olds | 4 (36.4%) | 7 (63.6%) |
| 25 to 34 Year Olds | 14 (100.0%) | 0 (0.0%) |
| 35 Years and over | 6 (100.0%) | 0 (0.0%) |
| Total | 171 (77.0%) | 51 (23.0%) |
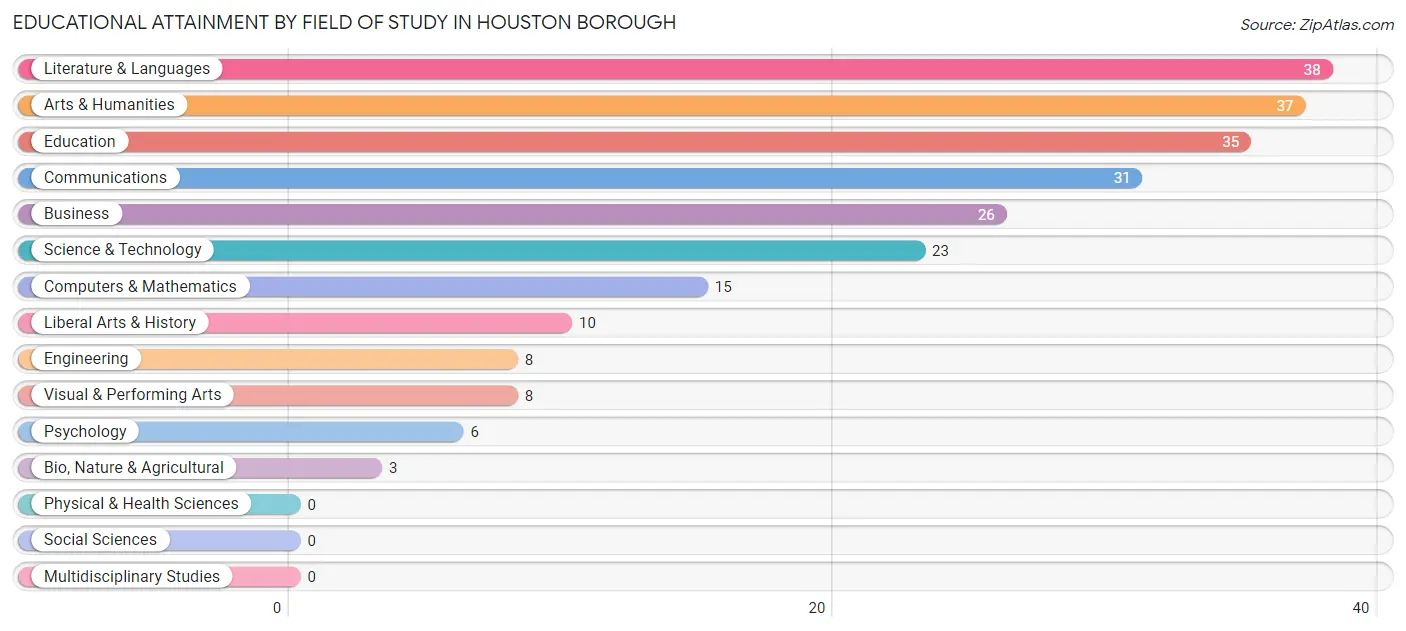
Educational Attainment by Field of Study in Houston borough
Literature & languages (38 | 15.8%), arts & humanities (37 | 15.4%), education (35 | 14.6%), communications (31 | 12.9%), and business (26 | 10.8%) are the most common fields of study among 240 individuals in Houston borough who have obtained a bachelor's degree or higher.
| Field of Study | # Graduates | % Graduates |
| Computers & Mathematics | 15 | 6.2% |
| Bio, Nature & Agricultural | 3 | 1.3% |
| Physical & Health Sciences | 0 | 0.0% |
| Psychology | 6 | 2.5% |
| Social Sciences | 0 | 0.0% |
| Engineering | 8 | 3.3% |
| Multidisciplinary Studies | 0 | 0.0% |
| Science & Technology | 23 | 9.6% |
| Business | 26 | 10.8% |
| Education | 35 | 14.6% |
| Literature & Languages | 38 | 15.8% |
| Liberal Arts & History | 10 | 4.2% |
| Visual & Performing Arts | 8 | 3.3% |
| Communications | 31 | 12.9% |
| Arts & Humanities | 37 | 15.4% |
| Total | 240 | 100.0% |
Transportation & Commute in Houston borough
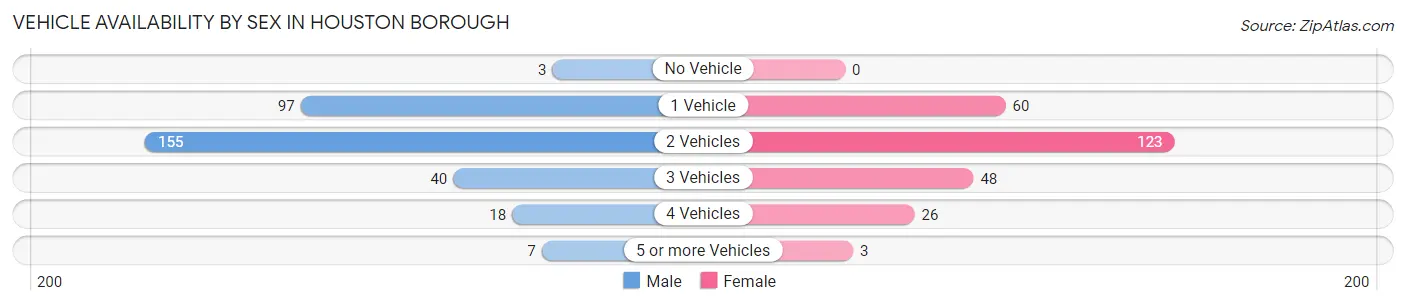
Vehicle Availability by Sex in Houston borough
The most prevalent vehicle ownership categories in Houston borough are males with 2 vehicles (155, accounting for 48.4%) and females with 2 vehicles (123, making up 59.6%).
| Vehicles Available | Male | Female |
| No Vehicle | 3 (0.9%) | 0 (0.0%) |
| 1 Vehicle | 97 (30.3%) | 60 (23.1%) |
| 2 Vehicles | 155 (48.4%) | 123 (47.3%) |
| 3 Vehicles | 40 (12.5%) | 48 (18.5%) |
| 4 Vehicles | 18 (5.6%) | 26 (10.0%) |
| 5 or more Vehicles | 7 (2.2%) | 3 (1.1%) |
| Total | 320 (100.0%) | 260 (100.0%) |
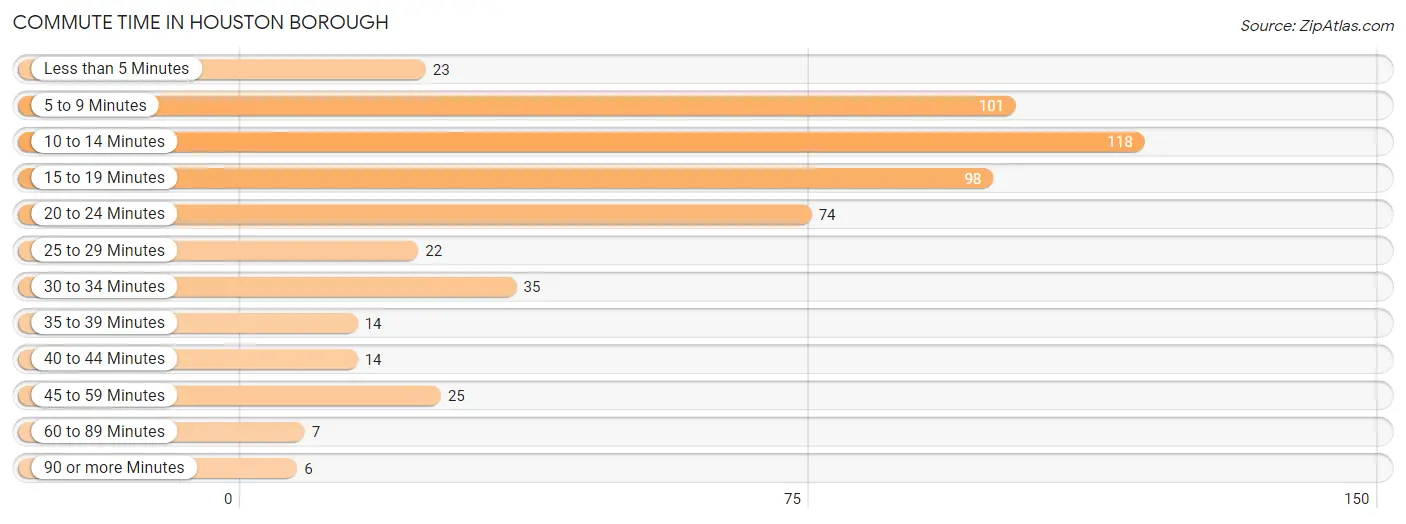
Commute Time in Houston borough
The most frequently occuring commute durations in Houston borough are 10 to 14 minutes (118 commuters, 22.0%), 5 to 9 minutes (101 commuters, 18.8%), and 15 to 19 minutes (98 commuters, 18.2%).
| Commute Time | # Commuters | % Commuters |
| Less than 5 Minutes | 23 | 4.3% |
| 5 to 9 Minutes | 101 | 18.8% |
| 10 to 14 Minutes | 118 | 22.0% |
| 15 to 19 Minutes | 98 | 18.2% |
| 20 to 24 Minutes | 74 | 13.8% |
| 25 to 29 Minutes | 22 | 4.1% |
| 30 to 34 Minutes | 35 | 6.5% |
| 35 to 39 Minutes | 14 | 2.6% |
| 40 to 44 Minutes | 14 | 2.6% |
| 45 to 59 Minutes | 25 | 4.7% |
| 60 to 89 Minutes | 7 | 1.3% |
| 90 or more Minutes | 6 | 1.1% |
Commute Time by Sex in Houston borough
The most common commute times in Houston borough are 5 to 9 minutes (68 commuters, 23.0%) for males and 10 to 14 minutes (67 commuters, 27.8%) for females.
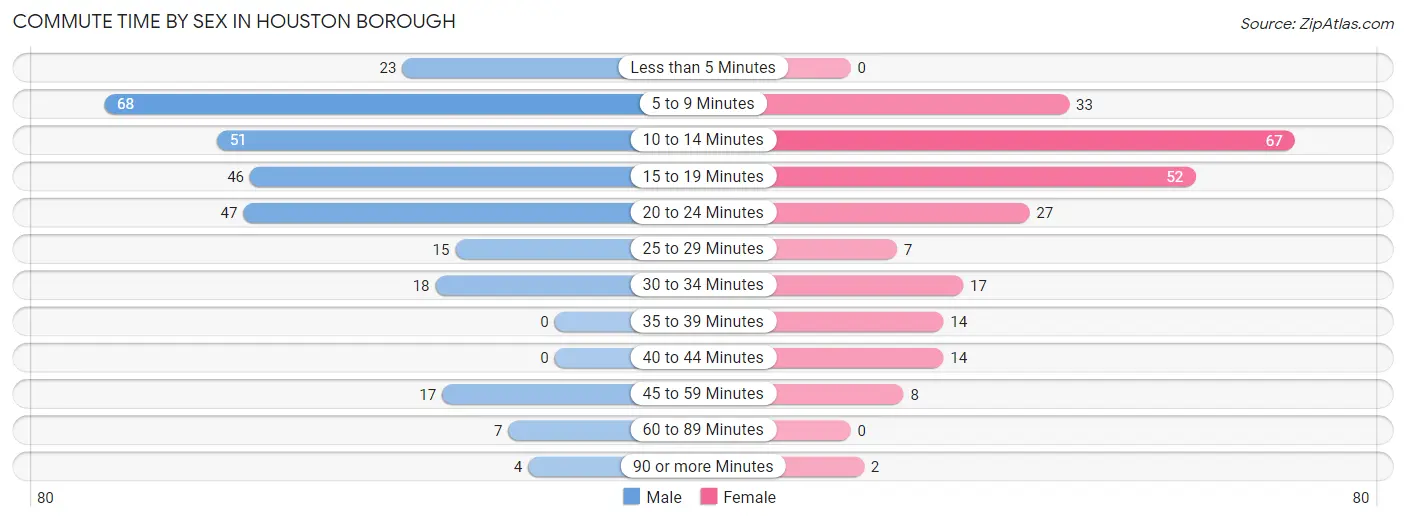
| Commute Time | Male | Female |
| Less than 5 Minutes | 23 (7.8%) | 0 (0.0%) |
| 5 to 9 Minutes | 68 (23.0%) | 33 (13.7%) |
| 10 to 14 Minutes | 51 (17.2%) | 67 (27.8%) |
| 15 to 19 Minutes | 46 (15.5%) | 52 (21.6%) |
| 20 to 24 Minutes | 47 (15.9%) | 27 (11.2%) |
| 25 to 29 Minutes | 15 (5.1%) | 7 (2.9%) |
| 30 to 34 Minutes | 18 (6.1%) | 17 (7.0%) |
| 35 to 39 Minutes | 0 (0.0%) | 14 (5.8%) |
| 40 to 44 Minutes | 0 (0.0%) | 14 (5.8%) |
| 45 to 59 Minutes | 17 (5.7%) | 8 (3.3%) |
| 60 to 89 Minutes | 7 (2.4%) | 0 (0.0%) |
| 90 or more Minutes | 4 (1.3%) | 2 (0.8%) |
Time of Departure to Work by Sex in Houston borough
The most frequent times of departure to work in Houston borough are 6:00 AM to 6:29 AM (63, 21.3%) for males and 7:30 AM to 7:59 AM (69, 28.6%) for females.
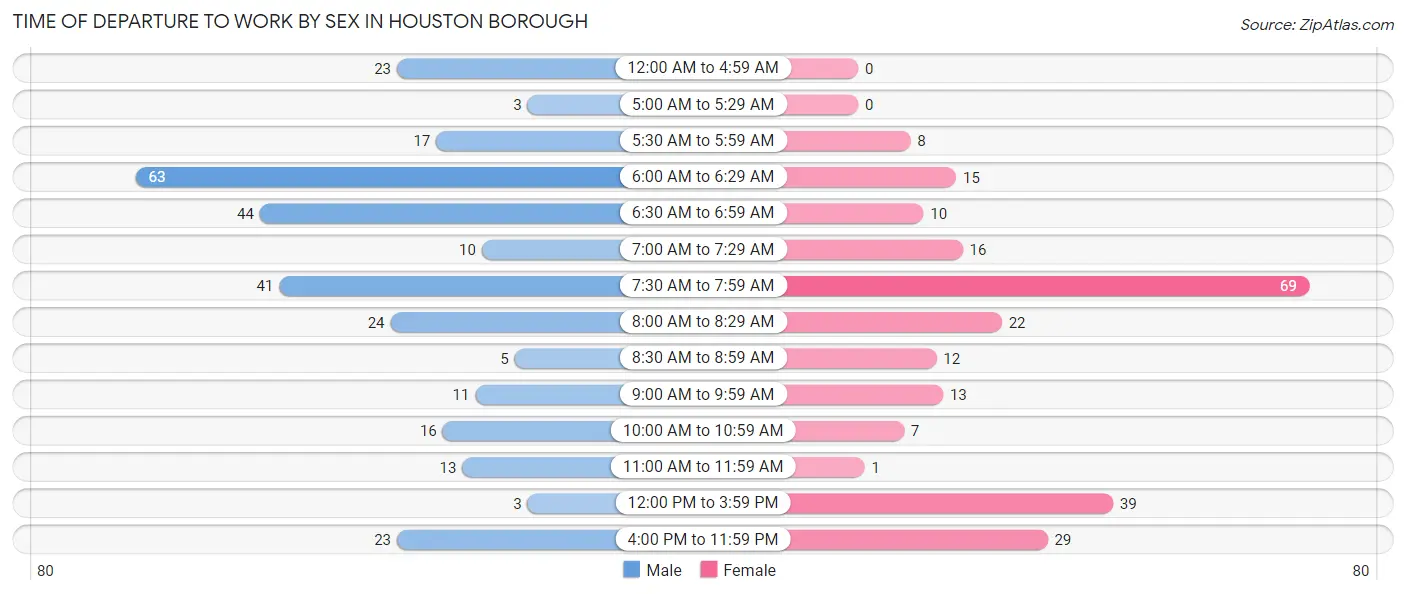
| Time of Departure | Male | Female |
| 12:00 AM to 4:59 AM | 23 (7.8%) | 0 (0.0%) |
| 5:00 AM to 5:29 AM | 3 (1.0%) | 0 (0.0%) |
| 5:30 AM to 5:59 AM | 17 (5.7%) | 8 (3.3%) |
| 6:00 AM to 6:29 AM | 63 (21.3%) | 15 (6.2%) |
| 6:30 AM to 6:59 AM | 44 (14.9%) | 10 (4.2%) |
| 7:00 AM to 7:29 AM | 10 (3.4%) | 16 (6.6%) |
| 7:30 AM to 7:59 AM | 41 (13.9%) | 69 (28.6%) |
| 8:00 AM to 8:29 AM | 24 (8.1%) | 22 (9.1%) |
| 8:30 AM to 8:59 AM | 5 (1.7%) | 12 (5.0%) |
| 9:00 AM to 9:59 AM | 11 (3.7%) | 13 (5.4%) |
| 10:00 AM to 10:59 AM | 16 (5.4%) | 7 (2.9%) |
| 11:00 AM to 11:59 AM | 13 (4.4%) | 1 (0.4%) |
| 12:00 PM to 3:59 PM | 3 (1.0%) | 39 (16.2%) |
| 4:00 PM to 11:59 PM | 23 (7.8%) | 29 (12.0%) |
| Total | 296 (100.0%) | 241 (100.0%) |
Housing Occupancy in Houston borough
Occupancy by Ownership in Houston borough
Of the total 577 dwellings in Houston borough, owner-occupied units account for 352 (61.0%), while renter-occupied units make up 225 (39.0%).
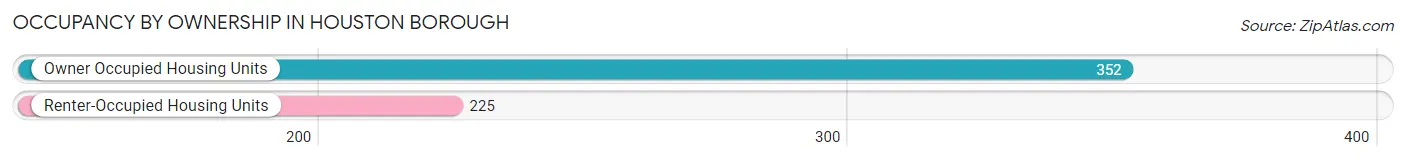
| Occupancy | # Housing Units | % Housing Units |
| Owner Occupied Housing Units | 352 | 61.0% |
| Renter-Occupied Housing Units | 225 | 39.0% |
| Total Occupied Housing Units | 577 | 100.0% |
Occupancy by Household Size in Houston borough
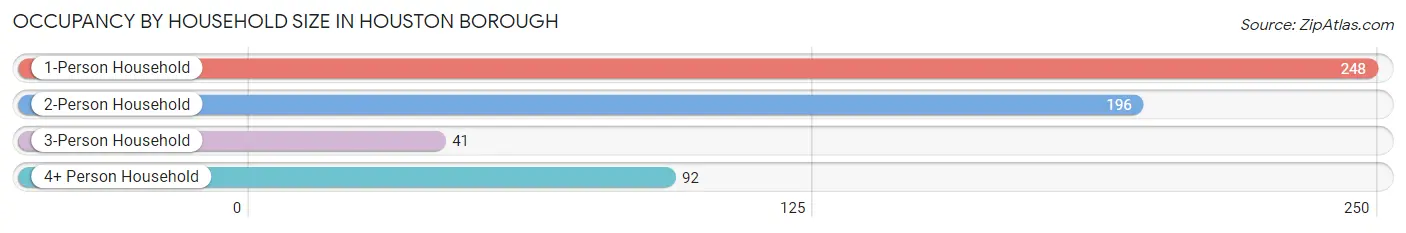
| Household Size | # Housing Units | % Housing Units |
| 1-Person Household | 248 | 43.0% |
| 2-Person Household | 196 | 34.0% |
| 3-Person Household | 41 | 7.1% |
| 4+ Person Household | 92 | 15.9% |
| Total Housing Units | 577 | 100.0% |
Occupancy by Ownership by Household Size in Houston borough
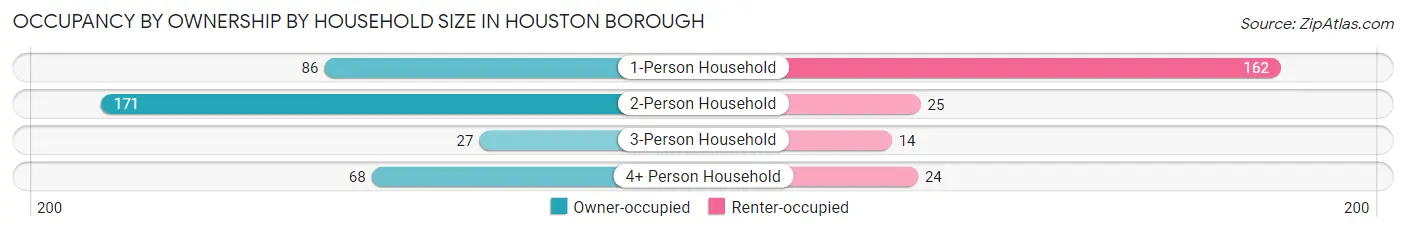
| Household Size | Owner-occupied | Renter-occupied |
| 1-Person Household | 86 (34.7%) | 162 (65.3%) |
| 2-Person Household | 171 (87.2%) | 25 (12.8%) |
| 3-Person Household | 27 (65.8%) | 14 (34.2%) |
| 4+ Person Household | 68 (73.9%) | 24 (26.1%) |
| Total Housing Units | 352 (61.0%) | 225 (39.0%) |
Occupancy by Educational Attainment in Houston borough
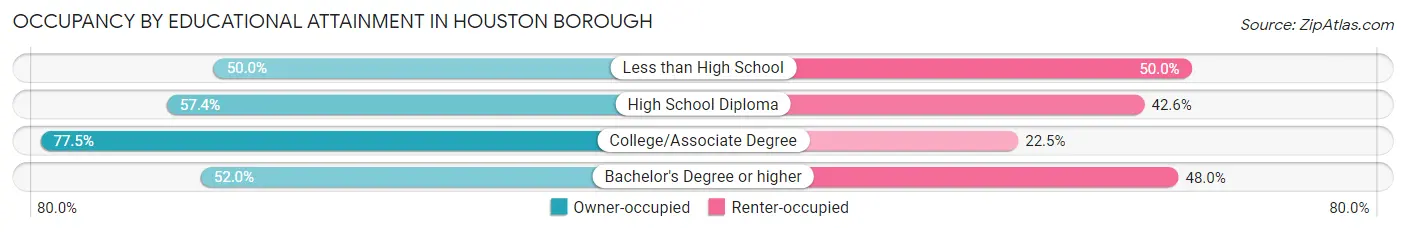
| Household Size | Owner-occupied | Renter-occupied |
| Less than High School | 17 (50.0%) | 17 (50.0%) |
| High School Diploma | 174 (57.4%) | 129 (42.6%) |
| College/Associate Degree | 110 (77.5%) | 32 (22.5%) |
| Bachelor's Degree or higher | 51 (52.0%) | 47 (48.0%) |
Occupancy by Age of Householder in Houston borough
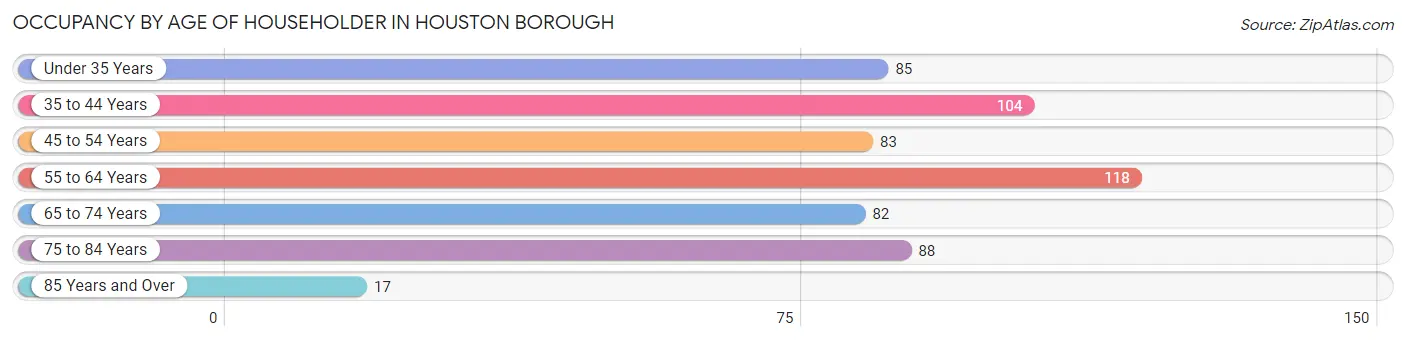
| Age Bracket | # Households | % Households |
| Under 35 Years | 85 | 14.7% |
| 35 to 44 Years | 104 | 18.0% |
| 45 to 54 Years | 83 | 14.4% |
| 55 to 64 Years | 118 | 20.4% |
| 65 to 74 Years | 82 | 14.2% |
| 75 to 84 Years | 88 | 15.2% |
| 85 Years and Over | 17 | 2.9% |
| Total | 577 | 100.0% |
Housing Finances in Houston borough
Median Income by Occupancy in Houston borough
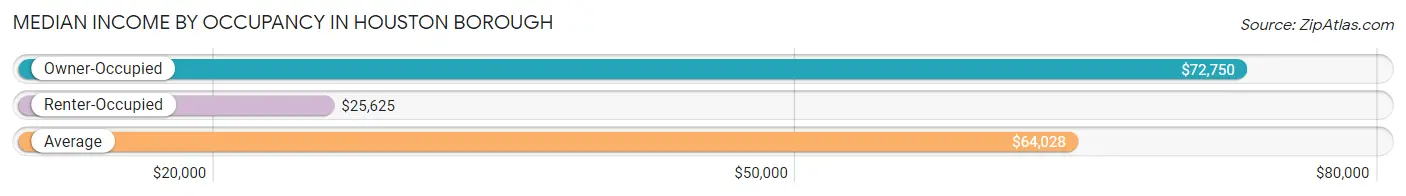
| Occupancy Type | # Households | Median Income |
| Owner-Occupied | 352 (61.0%) | $72,750 |
| Renter-Occupied | 225 (39.0%) | $25,625 |
| Average | 577 (100.0%) | $64,028 |
Occupancy by Householder Income Bracket in Houston borough
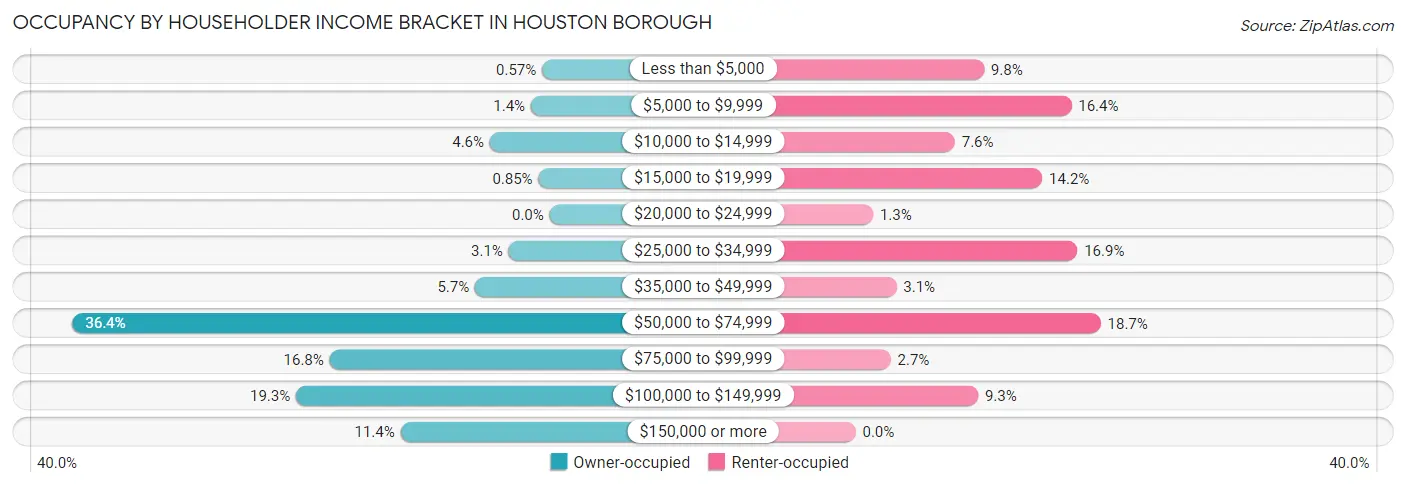
| Income Bracket | Owner-occupied | Renter-occupied |
| Less than $5,000 | 2 (0.6%) | 22 (9.8%) |
| $5,000 to $9,999 | 5 (1.4%) | 37 (16.4%) |
| $10,000 to $14,999 | 16 (4.5%) | 17 (7.6%) |
| $15,000 to $19,999 | 3 (0.9%) | 32 (14.2%) |
| $20,000 to $24,999 | 0 (0.0%) | 3 (1.3%) |
| $25,000 to $34,999 | 11 (3.1%) | 38 (16.9%) |
| $35,000 to $49,999 | 20 (5.7%) | 7 (3.1%) |
| $50,000 to $74,999 | 128 (36.4%) | 42 (18.7%) |
| $75,000 to $99,999 | 59 (16.8%) | 6 (2.7%) |
| $100,000 to $149,999 | 68 (19.3%) | 21 (9.3%) |
| $150,000 or more | 40 (11.4%) | 0 (0.0%) |
| Total | 352 (100.0%) | 225 (100.0%) |
Monthly Housing Cost Tiers in Houston borough
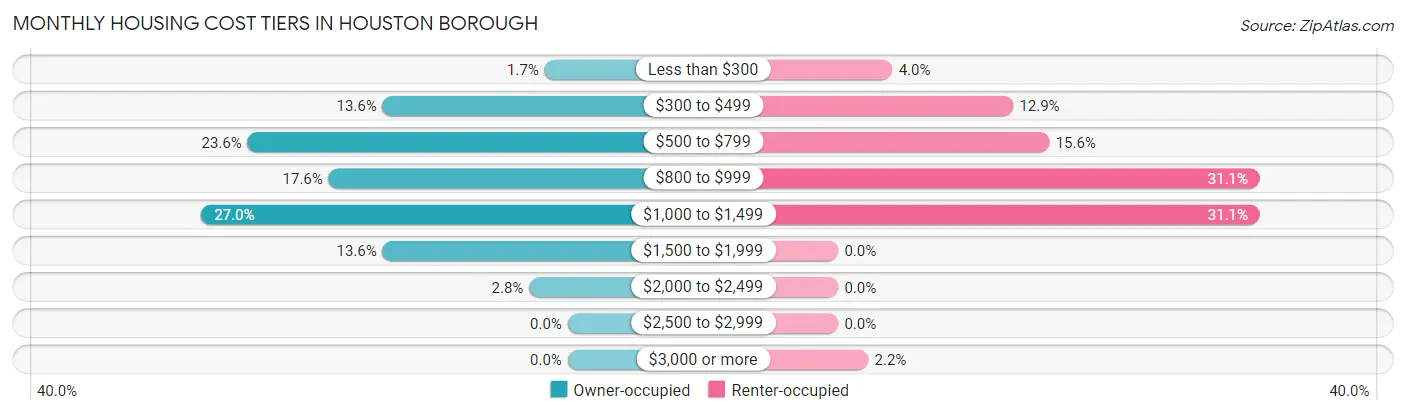
| Monthly Cost | Owner-occupied | Renter-occupied |
| Less than $300 | 6 (1.7%) | 9 (4.0%) |
| $300 to $499 | 48 (13.6%) | 29 (12.9%) |
| $500 to $799 | 83 (23.6%) | 35 (15.6%) |
| $800 to $999 | 62 (17.6%) | 70 (31.1%) |
| $1,000 to $1,499 | 95 (27.0%) | 70 (31.1%) |
| $1,500 to $1,999 | 48 (13.6%) | 0 (0.0%) |
| $2,000 to $2,499 | 10 (2.8%) | 0 (0.0%) |
| $2,500 to $2,999 | 0 (0.0%) | 0 (0.0%) |
| $3,000 or more | 0 (0.0%) | 5 (2.2%) |
| Total | 352 (100.0%) | 225 (100.0%) |
Physical Housing Characteristics in Houston borough
Housing Structures in Houston borough
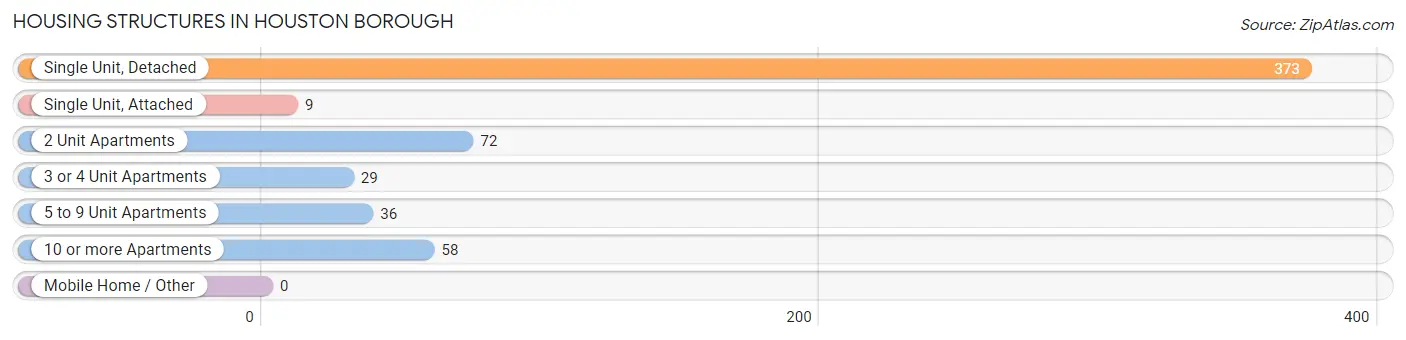
| Structure Type | # Housing Units | % Housing Units |
| Single Unit, Detached | 373 | 64.6% |
| Single Unit, Attached | 9 | 1.6% |
| 2 Unit Apartments | 72 | 12.5% |
| 3 or 4 Unit Apartments | 29 | 5.0% |
| 5 to 9 Unit Apartments | 36 | 6.2% |
| 10 or more Apartments | 58 | 10.1% |
| Mobile Home / Other | 0 | 0.0% |
| Total | 577 | 100.0% |
Housing Structures by Occupancy in Houston borough
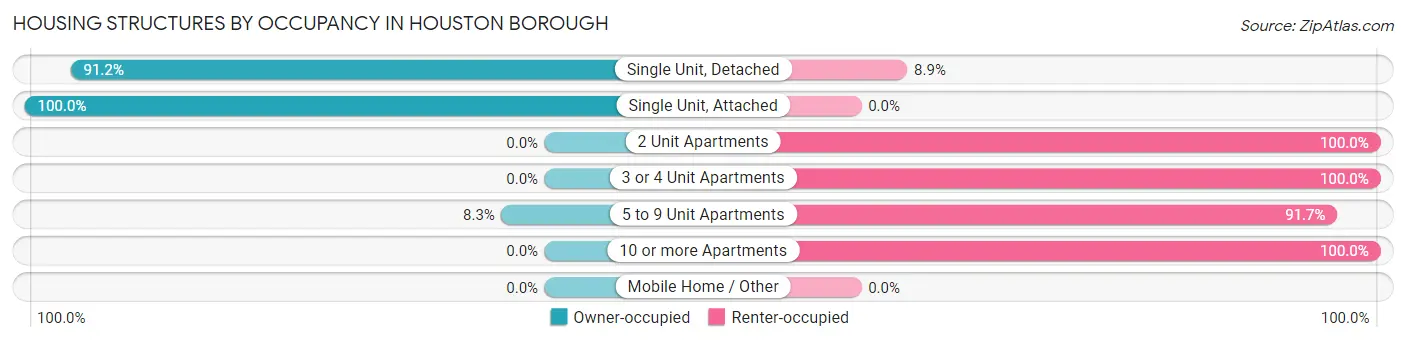
| Structure Type | Owner-occupied | Renter-occupied |
| Single Unit, Detached | 340 (91.1%) | 33 (8.8%) |
| Single Unit, Attached | 9 (100.0%) | 0 (0.0%) |
| 2 Unit Apartments | 0 (0.0%) | 72 (100.0%) |
| 3 or 4 Unit Apartments | 0 (0.0%) | 29 (100.0%) |
| 5 to 9 Unit Apartments | 3 (8.3%) | 33 (91.7%) |
| 10 or more Apartments | 0 (0.0%) | 58 (100.0%) |
| Mobile Home / Other | 0 (0.0%) | 0 (0.0%) |
| Total | 352 (61.0%) | 225 (39.0%) |
Housing Structures by Number of Rooms in Houston borough
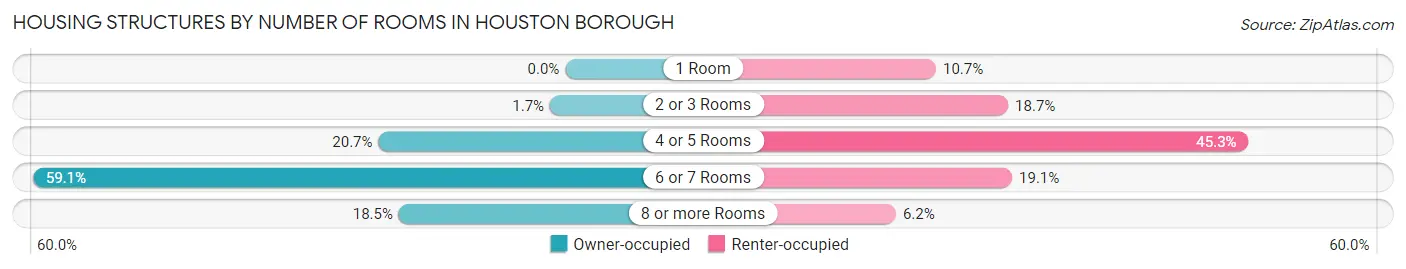
| Number of Rooms | Owner-occupied | Renter-occupied |
| 1 Room | 0 (0.0%) | 24 (10.7%) |
| 2 or 3 Rooms | 6 (1.7%) | 42 (18.7%) |
| 4 or 5 Rooms | 73 (20.7%) | 102 (45.3%) |
| 6 or 7 Rooms | 208 (59.1%) | 43 (19.1%) |
| 8 or more Rooms | 65 (18.5%) | 14 (6.2%) |
| Total | 352 (100.0%) | 225 (100.0%) |
Housing Structure by Heating Type in Houston borough
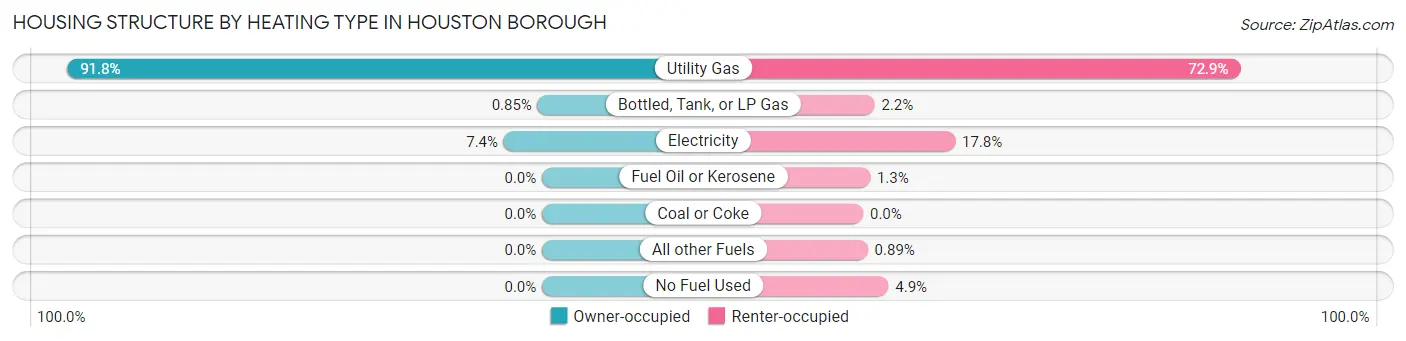
| Heating Type | Owner-occupied | Renter-occupied |
| Utility Gas | 323 (91.8%) | 164 (72.9%) |
| Bottled, Tank, or LP Gas | 3 (0.9%) | 5 (2.2%) |
| Electricity | 26 (7.4%) | 40 (17.8%) |
| Fuel Oil or Kerosene | 0 (0.0%) | 3 (1.3%) |
| Coal or Coke | 0 (0.0%) | 0 (0.0%) |
| All other Fuels | 0 (0.0%) | 2 (0.9%) |
| No Fuel Used | 0 (0.0%) | 11 (4.9%) |
| Total | 352 (100.0%) | 225 (100.0%) |
Household Vehicle Usage in Houston borough
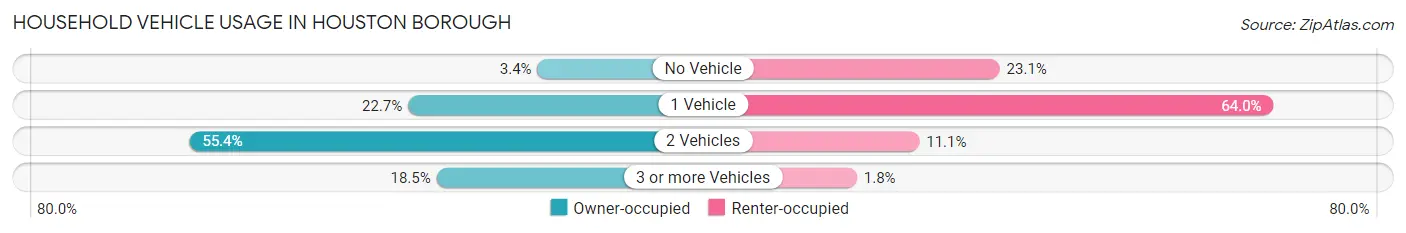
| Vehicles per Household | Owner-occupied | Renter-occupied |
| No Vehicle | 12 (3.4%) | 52 (23.1%) |
| 1 Vehicle | 80 (22.7%) | 144 (64.0%) |
| 2 Vehicles | 195 (55.4%) | 25 (11.1%) |
| 3 or more Vehicles | 65 (18.5%) | 4 (1.8%) |
| Total | 352 (100.0%) | 225 (100.0%) |
Real Estate & Mortgages in Houston borough
Real Estate and Mortgage Overview in Houston borough
| Characteristic | Without Mortgage | With Mortgage |
| Housing Units | 115 | 237 |
| Median Property Value | $160,200 | $172,800 |
| Median Household Income | $53,750 | $31 |
| Monthly Housing Costs | $546 | $0 |
| Real Estate Taxes | $1,857 | $2 |
Property Value by Mortgage Status in Houston borough
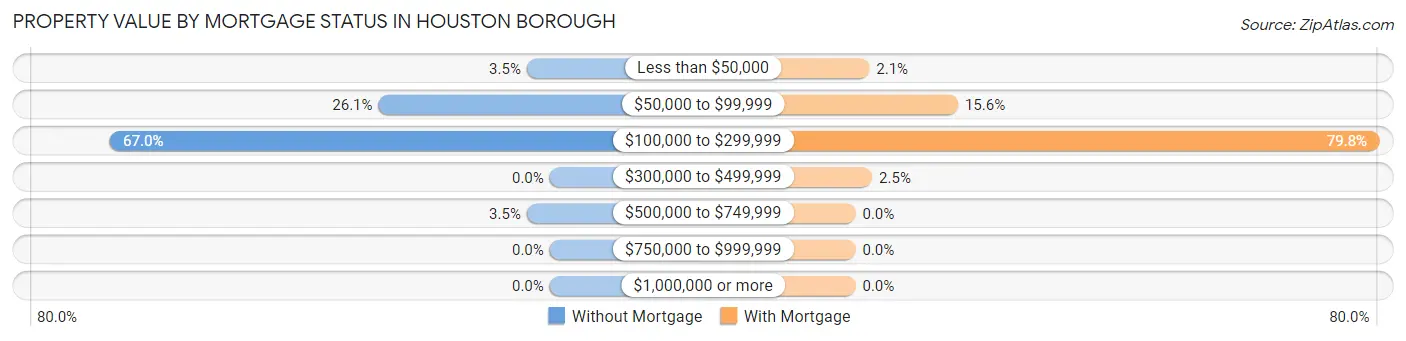
| Property Value | Without Mortgage | With Mortgage |
| Less than $50,000 | 4 (3.5%) | 5 (2.1%) |
| $50,000 to $99,999 | 30 (26.1%) | 37 (15.6%) |
| $100,000 to $299,999 | 77 (67.0%) | 189 (79.7%) |
| $300,000 to $499,999 | 0 (0.0%) | 6 (2.5%) |
| $500,000 to $749,999 | 4 (3.5%) | 0 (0.0%) |
| $750,000 to $999,999 | 0 (0.0%) | 0 (0.0%) |
| $1,000,000 or more | 0 (0.0%) | 0 (0.0%) |
| Total | 115 (100.0%) | 237 (100.0%) |
Household Income by Mortgage Status in Houston borough
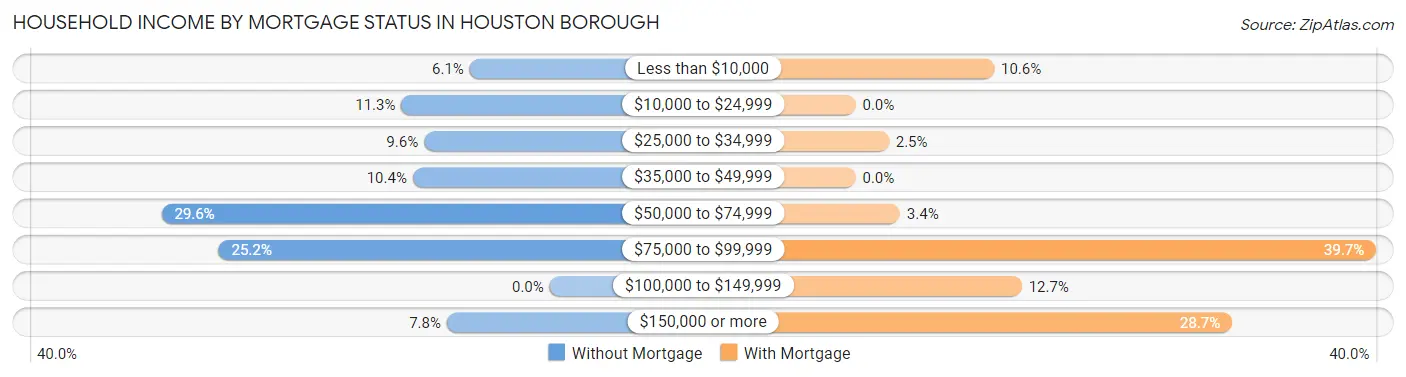
| Household Income | Without Mortgage | With Mortgage |
| Less than $10,000 | 7 (6.1%) | 25 (10.5%) |
| $10,000 to $24,999 | 13 (11.3%) | 0 (0.0%) |
| $25,000 to $34,999 | 11 (9.6%) | 6 (2.5%) |
| $35,000 to $49,999 | 12 (10.4%) | 0 (0.0%) |
| $50,000 to $74,999 | 34 (29.6%) | 8 (3.4%) |
| $75,000 to $99,999 | 29 (25.2%) | 94 (39.7%) |
| $100,000 to $149,999 | 0 (0.0%) | 30 (12.7%) |
| $150,000 or more | 9 (7.8%) | 68 (28.7%) |
| Total | 115 (100.0%) | 237 (100.0%) |
Property Value to Household Income Ratio in Houston borough
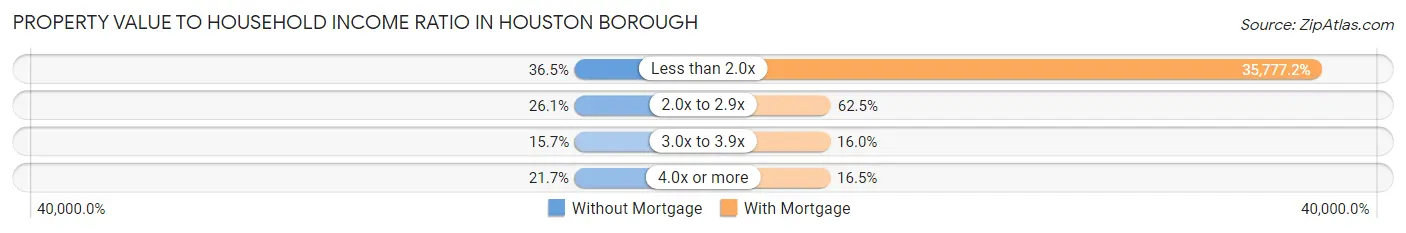
| Value-to-Income Ratio | Without Mortgage | With Mortgage |
| Less than 2.0x | 42 (36.5%) | 84,792 (35,777.2%) |
| 2.0x to 2.9x | 30 (26.1%) | 148 (62.5%) |
| 3.0x to 3.9x | 18 (15.7%) | 38 (16.0%) |
| 4.0x or more | 25 (21.7%) | 39 (16.5%) |
| Total | 115 (100.0%) | 237 (100.0%) |
Real Estate Taxes by Mortgage Status in Houston borough
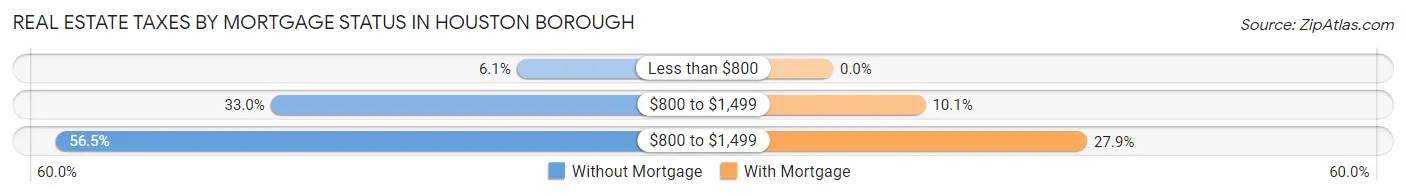
| Property Taxes | Without Mortgage | With Mortgage |
| Less than $800 | 7 (6.1%) | 0 (0.0%) |
| $800 to $1,499 | 38 (33.0%) | 24 (10.1%) |
| $800 to $1,499 | 65 (56.5%) | 66 (27.9%) |
| Total | 115 (100.0%) | 237 (100.0%) |
Health & Disability in Houston borough
Health Insurance Coverage by Age in Houston borough
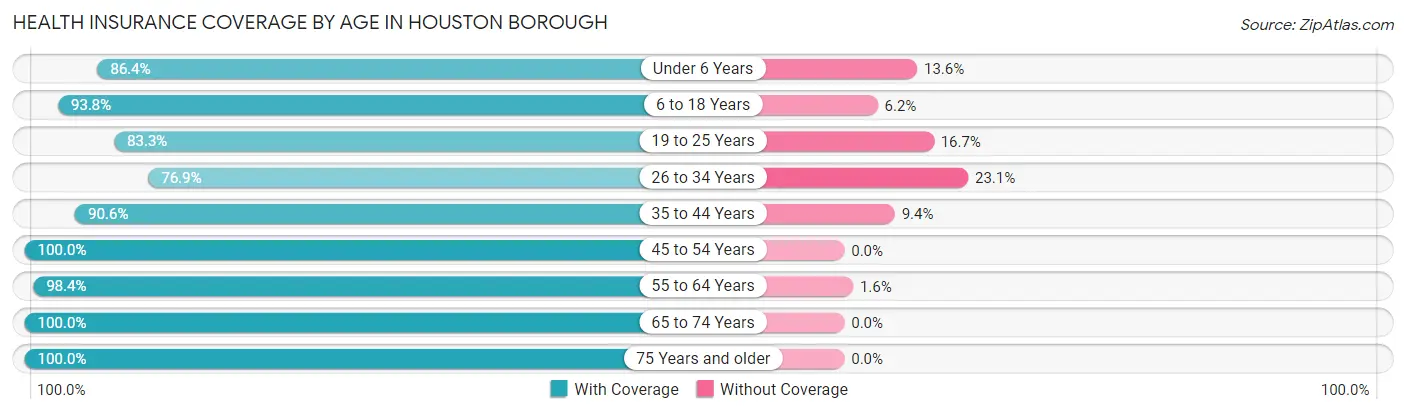
| Age Bracket | With Coverage | Without Coverage |
| Under 6 Years | 102 (86.4%) | 16 (13.6%) |
| 6 to 18 Years | 136 (93.8%) | 9 (6.2%) |
| 19 to 25 Years | 55 (83.3%) | 11 (16.7%) |
| 26 to 34 Years | 80 (76.9%) | 24 (23.1%) |
| 35 to 44 Years | 154 (90.6%) | 16 (9.4%) |
| 45 to 54 Years | 153 (100.0%) | 0 (0.0%) |
| 55 to 64 Years | 183 (98.4%) | 3 (1.6%) |
| 65 to 74 Years | 118 (100.0%) | 0 (0.0%) |
| 75 Years and older | 140 (100.0%) | 0 (0.0%) |
| Total | 1,121 (93.4%) | 79 (6.6%) |
Health Insurance Coverage by Citizenship Status in Houston borough
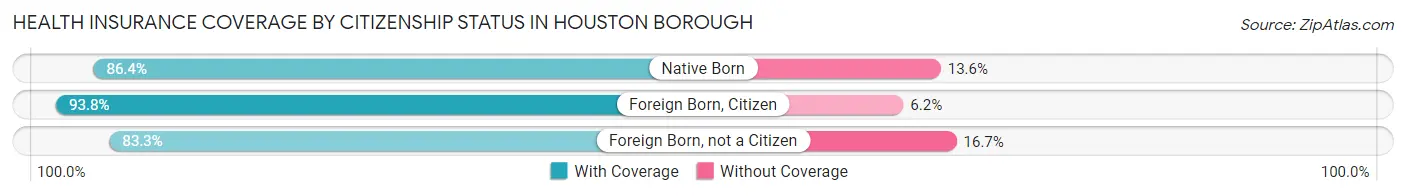
| Citizenship Status | With Coverage | Without Coverage |
| Native Born | 102 (86.4%) | 16 (13.6%) |
| Foreign Born, Citizen | 136 (93.8%) | 9 (6.2%) |
| Foreign Born, not a Citizen | 55 (83.3%) | 11 (16.7%) |
Health Insurance Coverage by Household Income in Houston borough
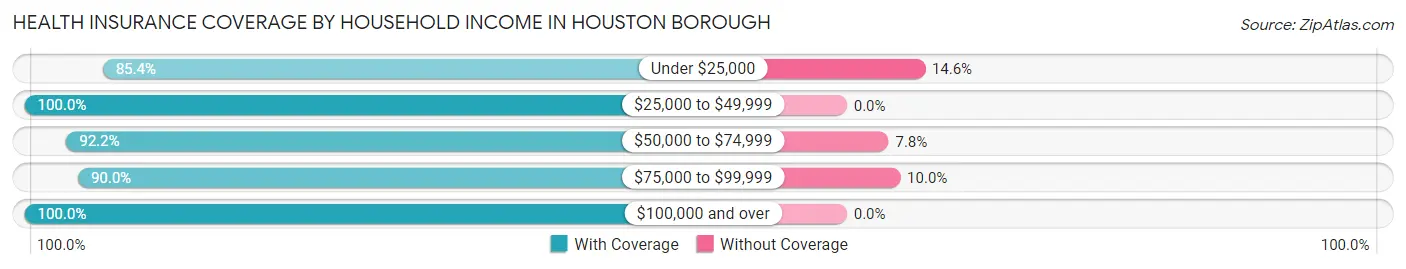
| Household Income | With Coverage | Without Coverage |
| Under $25,000 | 204 (85.4%) | 35 (14.6%) |
| $25,000 to $49,999 | 88 (100.0%) | 0 (0.0%) |
| $50,000 to $74,999 | 377 (92.2%) | 32 (7.8%) |
| $75,000 to $99,999 | 108 (90.0%) | 12 (10.0%) |
| $100,000 and over | 343 (100.0%) | 0 (0.0%) |
Public vs Private Health Insurance Coverage by Age in Houston borough
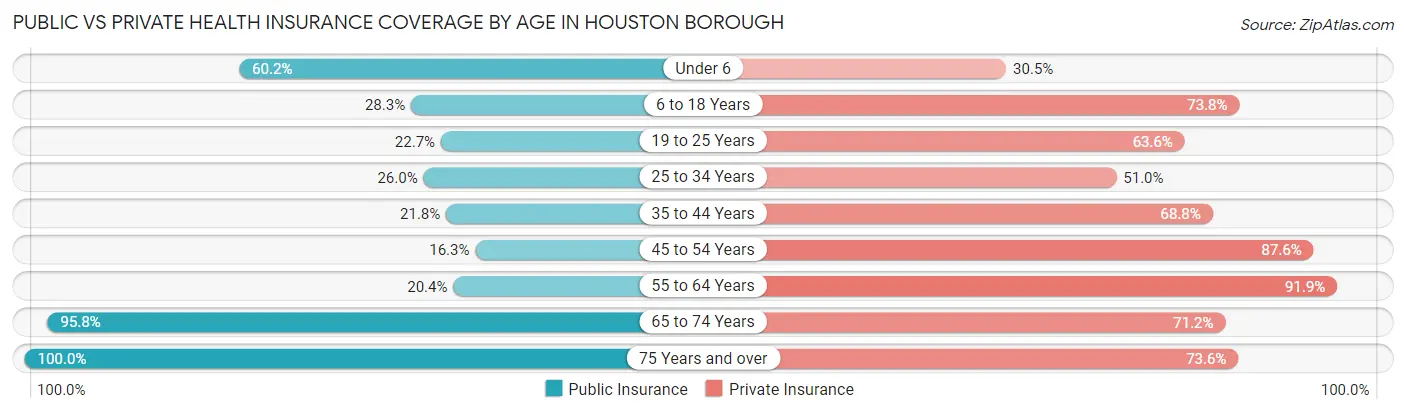
| Age Bracket | Public Insurance | Private Insurance |
| Under 6 | 71 (60.2%) | 36 (30.5%) |
| 6 to 18 Years | 41 (28.3%) | 107 (73.8%) |
| 19 to 25 Years | 15 (22.7%) | 42 (63.6%) |
| 25 to 34 Years | 27 (26.0%) | 53 (51.0%) |
| 35 to 44 Years | 37 (21.8%) | 117 (68.8%) |
| 45 to 54 Years | 25 (16.3%) | 134 (87.6%) |
| 55 to 64 Years | 38 (20.4%) | 171 (91.9%) |
| 65 to 74 Years | 113 (95.8%) | 84 (71.2%) |
| 75 Years and over | 140 (100.0%) | 103 (73.6%) |
| Total | 507 (42.2%) | 847 (70.6%) |
Disability Status by Sex by Age in Houston borough
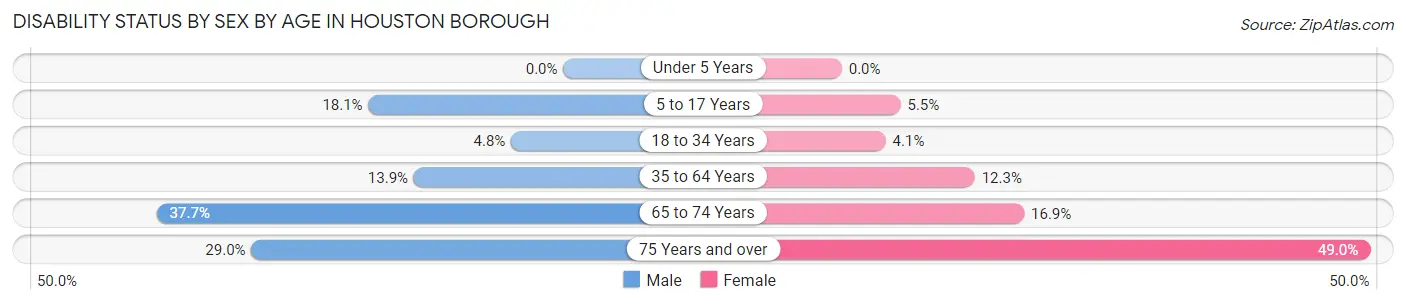
| Age Bracket | Male | Female |
| Under 5 Years | 0 (0.0%) | 0 (0.0%) |
| 5 to 17 Years | 17 (18.1%) | 3 (5.4%) |
| 18 to 34 Years | 3 (4.8%) | 5 (4.1%) |
| 35 to 64 Years | 38 (13.9%) | 29 (12.3%) |
| 65 to 74 Years | 20 (37.7%) | 11 (16.9%) |
| 75 Years and over | 11 (28.9%) | 50 (49.0%) |
Disability Class by Sex by Age in Houston borough
Disability Class: Hearing Difficulty
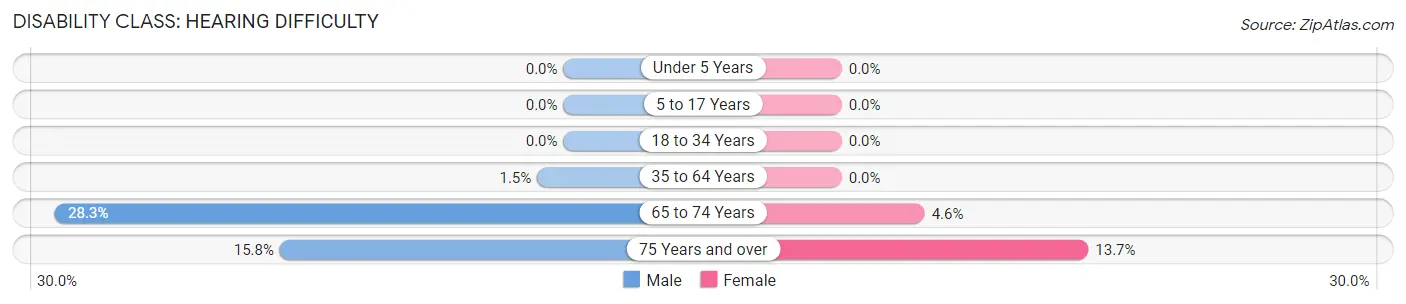
| Age Bracket | Male | Female |
| Under 5 Years | 0 (0.0%) | 0 (0.0%) |
| 5 to 17 Years | 0 (0.0%) | 0 (0.0%) |
| 18 to 34 Years | 0 (0.0%) | 0 (0.0%) |
| 35 to 64 Years | 4 (1.5%) | 0 (0.0%) |
| 65 to 74 Years | 15 (28.3%) | 3 (4.6%) |
| 75 Years and over | 6 (15.8%) | 14 (13.7%) |
Disability Class: Vision Difficulty
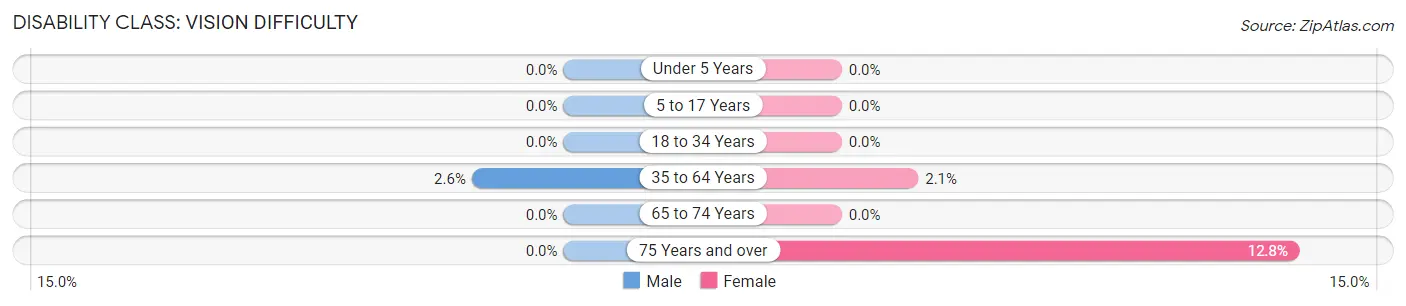
| Age Bracket | Male | Female |
| Under 5 Years | 0 (0.0%) | 0 (0.0%) |
| 5 to 17 Years | 0 (0.0%) | 0 (0.0%) |
| 18 to 34 Years | 0 (0.0%) | 0 (0.0%) |
| 35 to 64 Years | 7 (2.5%) | 5 (2.1%) |
| 65 to 74 Years | 0 (0.0%) | 0 (0.0%) |
| 75 Years and over | 0 (0.0%) | 13 (12.8%) |
Disability Class: Cognitive Difficulty
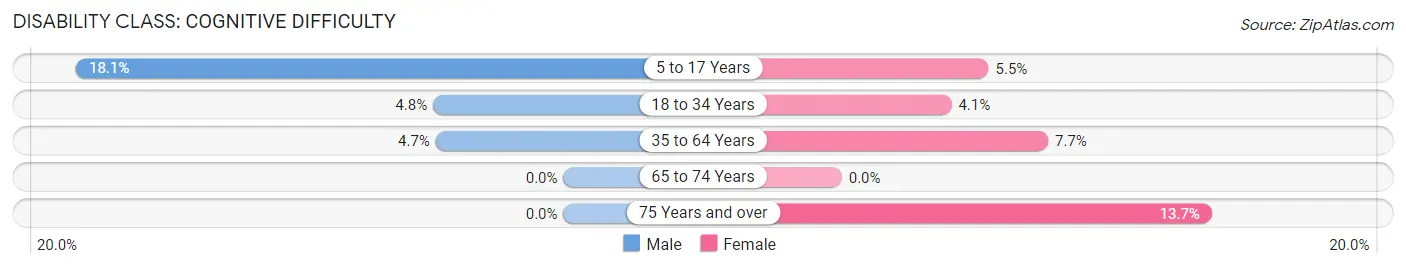
| Age Bracket | Male | Female |
| 5 to 17 Years | 17 (18.1%) | 3 (5.4%) |
| 18 to 34 Years | 3 (4.8%) | 5 (4.1%) |
| 35 to 64 Years | 13 (4.7%) | 18 (7.7%) |
| 65 to 74 Years | 0 (0.0%) | 0 (0.0%) |
| 75 Years and over | 0 (0.0%) | 14 (13.7%) |
Disability Class: Ambulatory Difficulty
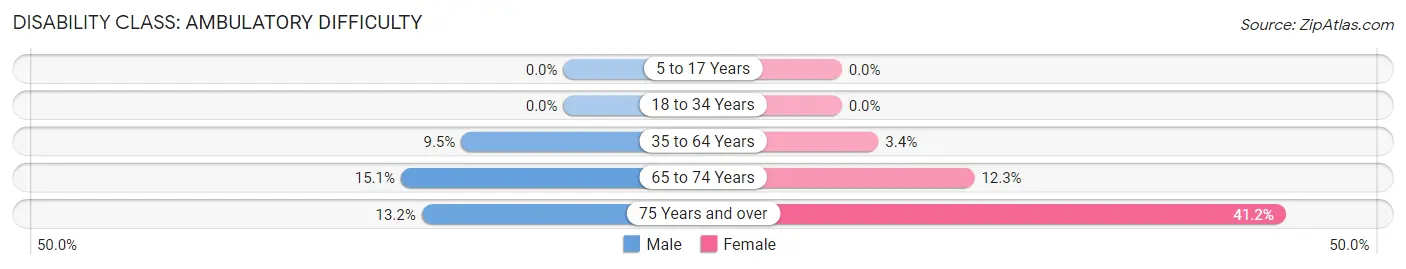
| Age Bracket | Male | Female |
| 5 to 17 Years | 0 (0.0%) | 0 (0.0%) |
| 18 to 34 Years | 0 (0.0%) | 0 (0.0%) |
| 35 to 64 Years | 26 (9.5%) | 8 (3.4%) |
| 65 to 74 Years | 8 (15.1%) | 8 (12.3%) |
| 75 Years and over | 5 (13.2%) | 42 (41.2%) |
Disability Class: Self-Care Difficulty
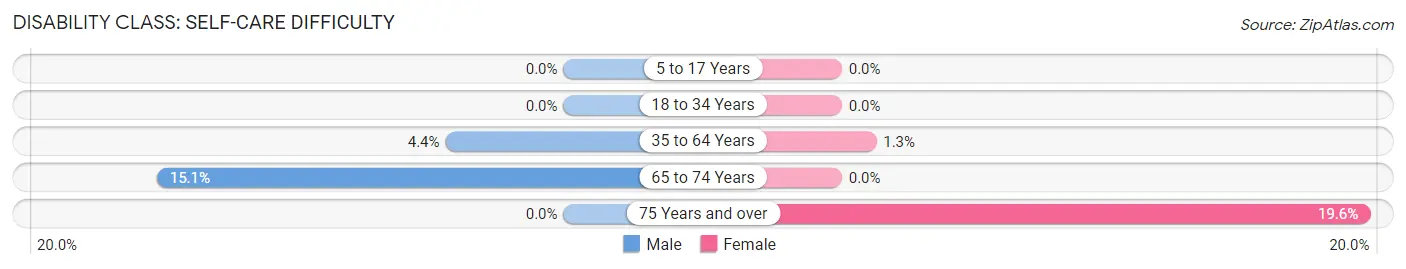
| Age Bracket | Male | Female |
| 5 to 17 Years | 0 (0.0%) | 0 (0.0%) |
| 18 to 34 Years | 0 (0.0%) | 0 (0.0%) |
| 35 to 64 Years | 12 (4.4%) | 3 (1.3%) |
| 65 to 74 Years | 8 (15.1%) | 0 (0.0%) |
| 75 Years and over | 0 (0.0%) | 20 (19.6%) |
Technology Access in Houston borough
Computing Device Access in Houston borough
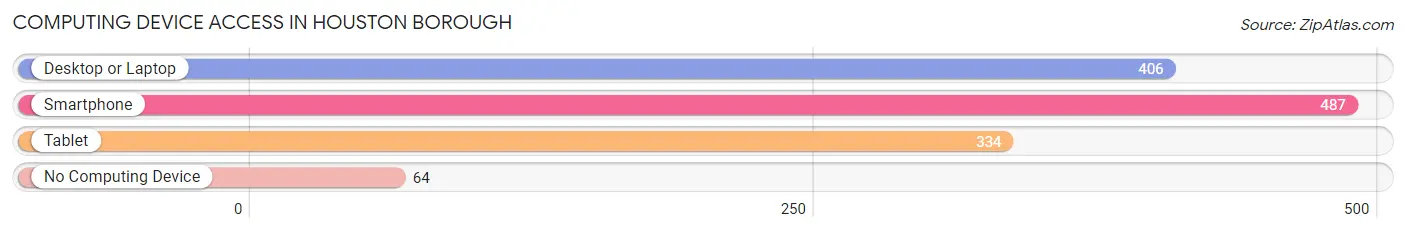
| Device Type | # Households | % Households |
| Desktop or Laptop | 406 | 70.4% |
| Smartphone | 487 | 84.4% |
| Tablet | 334 | 57.9% |
| No Computing Device | 64 | 11.1% |
| Total | 577 | 100.0% |
Internet Access in Houston borough

| Internet Type | # Households | % Households |
| Dial-Up Internet | 0 | 0.0% |
| Broadband Home | 401 | 69.5% |
| Cellular Data Only | 93 | 16.1% |
| Satellite Internet | 17 | 2.9% |
| No Internet | 75 | 13.0% |
| Total | 577 | 100.0% |
Houston borough Summary
Introduction
Houston Borough is a small borough located in Washington County, Pennsylvania. It is situated in the southwestern corner of the state, approximately 25 miles south of Pittsburgh. The borough is home to a population of approximately 1,500 people and is part of the Greater Pittsburgh Metropolitan Area. The borough is known for its small-town charm and its proximity to the city of Pittsburgh.
History
Houston Borough was founded in 1832 by a group of settlers from the nearby town of Washington. The town was named after the first settler, John Houston, who had purchased the land from the local Native American tribes. The town quickly grew and by the mid-1800s, it had become a thriving community with a variety of businesses and industries.
In the late 1800s, the town began to decline as the local coal industry began to decline. The town was further impacted by the Great Depression and World War II. By the 1950s, the town had become a small, rural community with a population of just over 1,000 people.
Geography
Houston Borough is located in the southwestern corner of Washington County, Pennsylvania. It is situated approximately 25 miles south of Pittsburgh and is part of the Greater Pittsburgh Metropolitan Area. The borough is bordered by the towns of Washington, Canonsburg, and Houston.
The borough is situated in a valley surrounded by hills and mountains. The terrain is mostly flat with some rolling hills. The borough is located in the Allegheny Plateau region of Pennsylvania and is part of the Appalachian Mountains.
Economy
Houston Borough is a small, rural community with a population of just over 1,500 people. The borough is home to a variety of small businesses and industries, including retail stores, restaurants, and professional services. The borough is also home to a number of small manufacturing companies.
The borough is home to a number of small farms and agricultural businesses. The local economy is largely dependent on the agricultural industry, which provides employment for many of the borough’s residents.
Demographics
As of the 2010 census, the population of Houston Borough was 1,521. The racial makeup of the borough was 97.3% White, 0.7% African American, 0.2% Native American, 0.3% Asian, 0.1% Pacific Islander, 0.4% from other races, and 1.0% from two or more races. Hispanic or Latino of any race were 1.2% of the population.
The median household income in the borough was $41,250, and the median family income was $50,000. The per capita income for the borough was $20,945. About 8.3% of families and 10.2% of the population were below the poverty line, including 14.3% of those under age 18 and 6.2% of those age 65 or over.
Conclusion
Houston Borough is a small borough located in Washington County, Pennsylvania. It is situated in the southwestern corner of the state, approximately 25 miles south of Pittsburgh. The borough is home to a population of approximately 1,500 people and is part of the Greater Pittsburgh Metropolitan Area. The borough is known for its small-town charm and its proximity to the city of Pittsburgh. The local economy is largely dependent on the agricultural industry, which provides employment for many of the borough’s residents. The borough is also home to a variety of small businesses and industries, including retail stores, restaurants, and professional services.
Common Questions
What is the Total Population of Houston borough?
Total Population of Houston borough is 1,204.
What is the Total Male Population of Houston borough?
Total Male Population of Houston borough is 581.
What is the Total Female Population of Houston borough?
Total Female Population of Houston borough is 623.
What is the Ratio of Males per 100 Females in Houston borough?
There are 93.26 Males per 100 Females in Houston borough.
What is the Ratio of Females per 100 Males in Houston borough?
There are 107.23 Females per 100 Males in Houston borough.
What is the Median Population Age in Houston borough?
Median Population Age in Houston borough is 43.9 Years.
What is the Average Family Size in Houston borough
Average Family Size in Houston borough is 2.9 People.
What is the Average Household Size in Houston borough
Average Household Size in Houston borough is 2.1 People.
What is Per Capita Income in Houston borough?
Per Capita income in Houston borough is $33,738.
What is the Median Family Income in Houston borough?
Median Family Income in Houston borough is $72,159.
What is the Median Household income in Houston borough?
Median Household Income in Houston borough is $64,028.
What is Income or Wage Gap in Houston borough?
Income or Wage Gap in Houston borough is 49.5%.
Women in Houston borough earn 50.5 cents for every dollar earned by a man.
What is Inequality or Gini Index in Houston borough?
Inequality or Gini Index in Houston borough is 0.41.
How Large is the Labor Force in Houston borough?
There are 613 People in the Labor Forcein in Houston borough.
What is the Percentage of People in the Labor Force in Houston borough?
61.9% of People are in the Labor Force in Houston borough.
What is the Unemployment Rate in Houston borough?
Unemployment Rate in Houston borough is 3.8%.