Sutersville borough, PA
Sutersville borough Overview
444
TOTAL POPULATION
197
MALE POPULATION
247
FEMALE POPULATION
79.76
MALES / 100 FEMALES
125.38
FEMALES / 100 MALES
56.3
MEDIAN AGE
2.4
AVG FAMILY SIZE
1.9
AVG HOUSEHOLD SIZE
$59,476
PER CAPITA INCOME
$70,357
AVG FAMILY INCOME
$62,727
AVG HOUSEHOLD INCOME
41.0%
WAGE / INCOME GAP [ % ]
59.0¢/ $1
WAGE / INCOME GAP [ $ ]
0.62
INEQUALITY / GINI INDEX
226
LABOR FORCE [ PEOPLE ]
57.4%
PERCENT IN LABOR FORCE
3.5%
UNEMPLOYMENT RATE
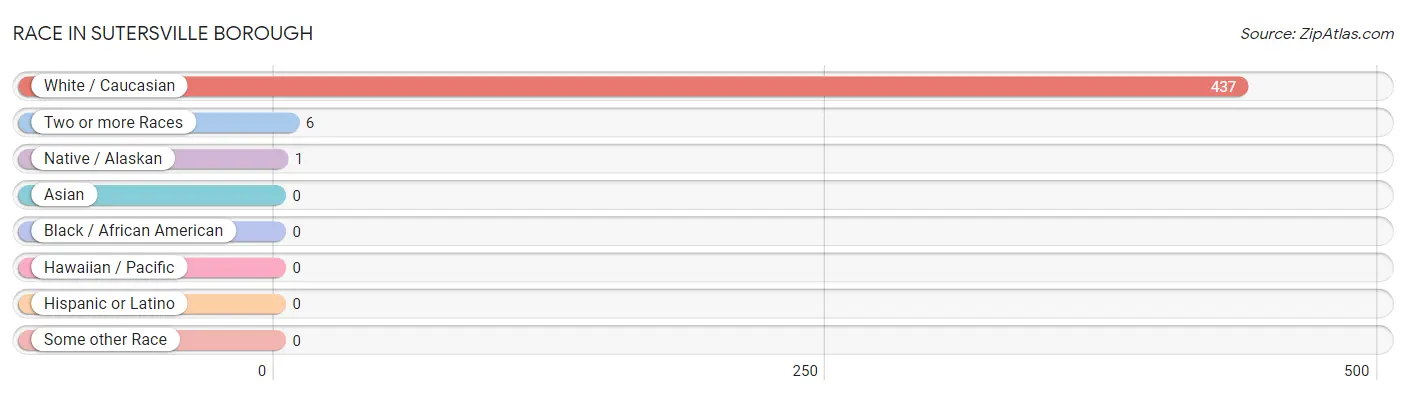
Race in Sutersville borough
The most populous races in Sutersville borough are White / Caucasian (437 | 98.4%), Two or more Races (6 | 1.3%), and Native / Alaskan (1 | 0.2%).
| Race | # Population | % Population |
| Asian | 0 | 0.0% |
| Black / African American | 0 | 0.0% |
| Hawaiian / Pacific | 0 | 0.0% |
| Hispanic or Latino | 0 | 0.0% |
| Native / Alaskan | 1 | 0.2% |
| White / Caucasian | 437 | 98.4% |
| Two or more Races | 6 | 1.3% |
| Some other Race | 0 | 0.0% |
| Total | 444 | 100.0% |
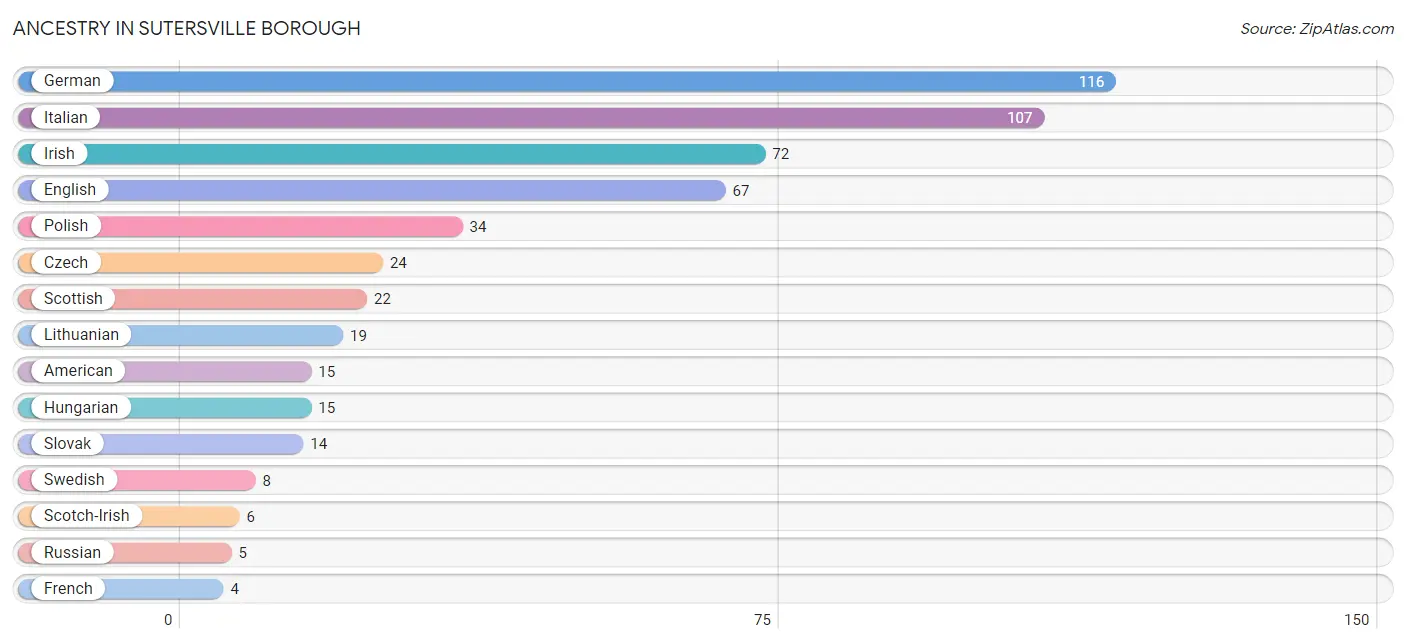
Ancestry in Sutersville borough
The most populous ancestries reported in Sutersville borough are German (116 | 26.1%), Italian (107 | 24.1%), Irish (72 | 16.2%), English (67 | 15.1%), and Polish (34 | 7.7%), together accounting for 89.2% of all Sutersville borough residents.
| Ancestry | # Population | % Population |
| American | 15 | 3.4% |
| Croatian | 3 | 0.7% |
| Czech | 24 | 5.4% |
| Dutch | 2 | 0.4% |
| English | 67 | 15.1% |
| French | 4 | 0.9% |
| German | 116 | 26.1% |
| Hungarian | 15 | 3.4% |
| Irish | 72 | 16.2% |
| Italian | 107 | 24.1% |
| Lithuanian | 19 | 4.3% |
| Pennsylvania German | 2 | 0.4% |
| Polish | 34 | 7.7% |
| Russian | 5 | 1.1% |
| Scotch-Irish | 6 | 1.3% |
| Scottish | 22 | 5.0% |
| Serbian | 2 | 0.4% |
| Slovak | 14 | 3.2% |
| Swedish | 8 | 1.8% |
| Ukrainian | 3 | 0.7% |
| Welsh | 4 | 0.9% | View All 21 Rows |
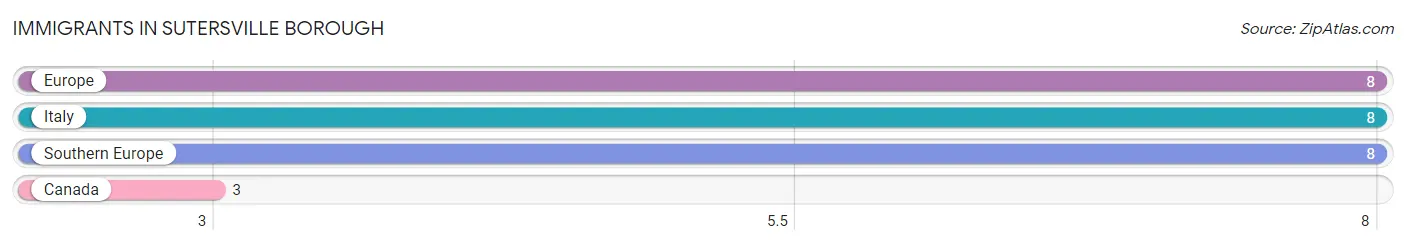
Immigrants in Sutersville borough
The most numerous immigrant groups reported in Sutersville borough came from Europe (8 | 1.8%), Italy (8 | 1.8%), Southern Europe (8 | 1.8%), and Canada (3 | 0.7%), together accounting for 6.1% of all Sutersville borough residents.
| Immigration Origin | # Population | % Population |
| Canada | 3 | 0.7% |
| Europe | 8 | 1.8% |
| Italy | 8 | 1.8% |
| Southern Europe | 8 | 1.8% | View All 4 Rows |
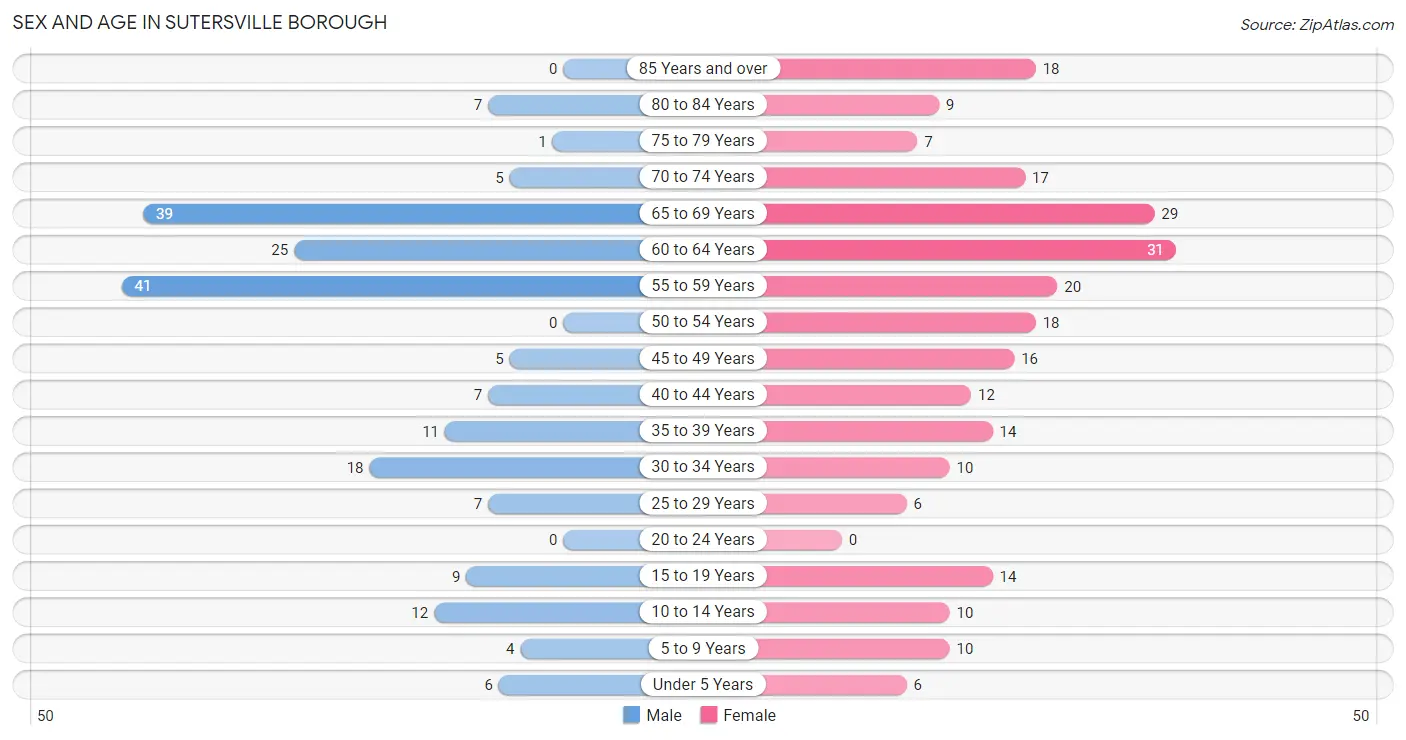
Sex and Age in Sutersville borough
Sex and Age in Sutersville borough
The most populous age groups in Sutersville borough are 55 to 59 Years (41 | 20.8%) for men and 60 to 64 Years (31 | 12.6%) for women.
| Age Bracket | Male | Female |
| Under 5 Years | 6 (3.0%) | 6 (2.4%) |
| 5 to 9 Years | 4 (2.0%) | 10 (4.1%) |
| 10 to 14 Years | 12 (6.1%) | 10 (4.1%) |
| 15 to 19 Years | 9 (4.6%) | 14 (5.7%) |
| 20 to 24 Years | 0 (0.0%) | 0 (0.0%) |
| 25 to 29 Years | 7 (3.5%) | 6 (2.4%) |
| 30 to 34 Years | 18 (9.1%) | 10 (4.1%) |
| 35 to 39 Years | 11 (5.6%) | 14 (5.7%) |
| 40 to 44 Years | 7 (3.5%) | 12 (4.9%) |
| 45 to 49 Years | 5 (2.5%) | 16 (6.5%) |
| 50 to 54 Years | 0 (0.0%) | 18 (7.3%) |
| 55 to 59 Years | 41 (20.8%) | 20 (8.1%) |
| 60 to 64 Years | 25 (12.7%) | 31 (12.6%) |
| 65 to 69 Years | 39 (19.8%) | 29 (11.7%) |
| 70 to 74 Years | 5 (2.5%) | 17 (6.9%) |
| 75 to 79 Years | 1 (0.5%) | 7 (2.8%) |
| 80 to 84 Years | 7 (3.5%) | 9 (3.6%) |
| 85 Years and over | 0 (0.0%) | 18 (7.3%) |
| Total | 197 (100.0%) | 247 (100.0%) |
Families and Households in Sutersville borough
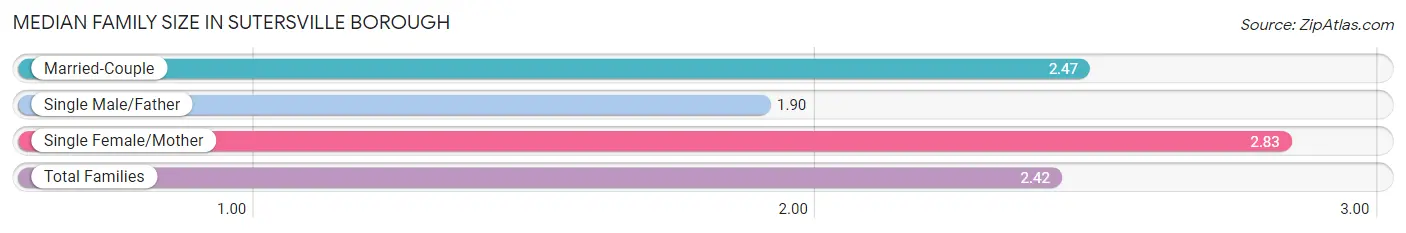
Median Family Size in Sutersville borough
The median family size in Sutersville borough is 2.42 persons per family, with single female/mother families (12 | 9.1%) accounting for the largest median family size of 2.83 persons per family. On the other hand, single male/father families (20 | 15.1%) represent the smallest median family size with 1.90 persons per family.
| Family Type | # Families | Family Size |
| Married-Couple | 100 (75.8%) | 2.47 |
| Single Male/Father | 20 (15.1%) | 1.90 |
| Single Female/Mother | 12 (9.1%) | 2.83 |
| Total Families | 132 (100.0%) | 2.42 |
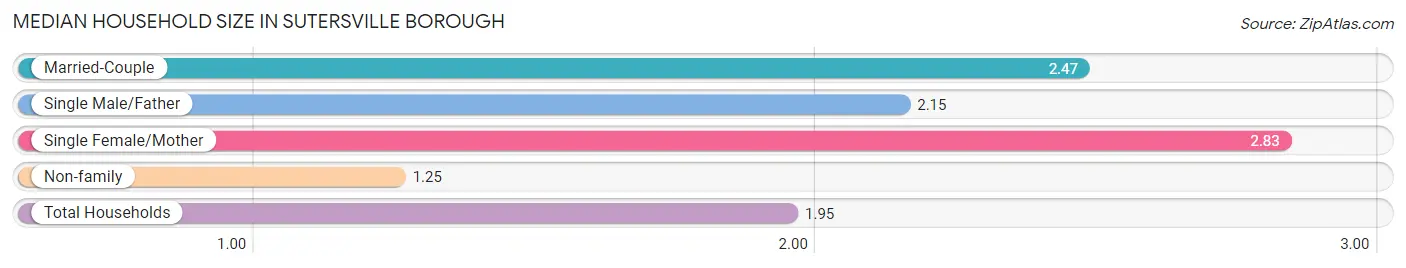
Median Household Size in Sutersville borough
The median household size in Sutersville borough is 1.95 persons per household, with single female/mother households (12 | 5.3%) accounting for the largest median household size of 2.83 persons per household. non-family households (96 | 42.1%) represent the smallest median household size with 1.25 persons per household.
| Household Type | # Households | Household Size |
| Married-Couple | 100 (43.9%) | 2.47 |
| Single Male/Father | 20 (8.8%) | 2.15 |
| Single Female/Mother | 12 (5.3%) | 2.83 |
| Non-family | 96 (42.1%) | 1.25 |
| Total Households | 228 (100.0%) | 1.95 |
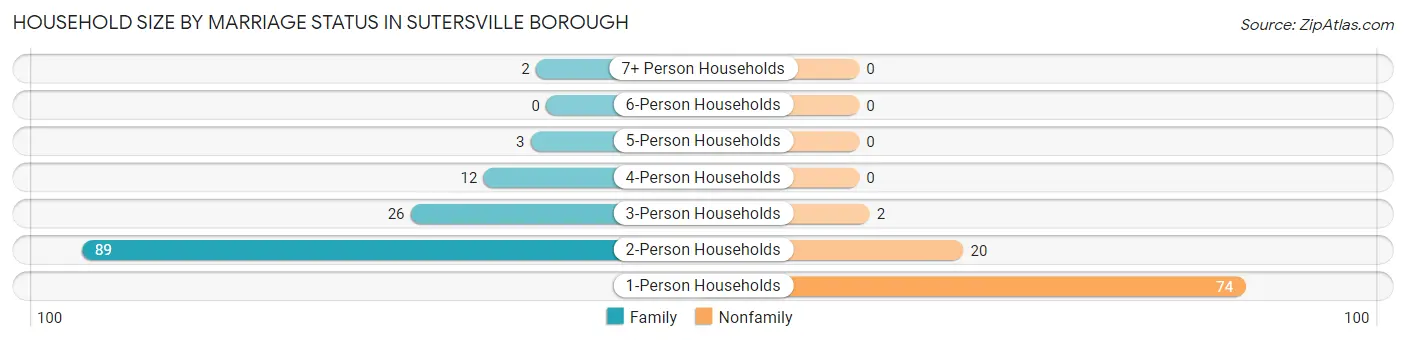
Household Size by Marriage Status in Sutersville borough
Out of a total of 228 households in Sutersville borough, 132 (57.9%) are family households, while 96 (42.1%) are nonfamily households. The most numerous type of family households are 2-person households, comprising 89, and the most common type of nonfamily households are 1-person households, comprising 74.
| Household Size | Family Households | Nonfamily Households |
| 1-Person Households | - | 74 (32.5%) |
| 2-Person Households | 89 (39.0%) | 20 (8.8%) |
| 3-Person Households | 26 (11.4%) | 2 (0.9%) |
| 4-Person Households | 12 (5.3%) | 0 (0.0%) |
| 5-Person Households | 3 (1.3%) | 0 (0.0%) |
| 6-Person Households | 0 (0.0%) | 0 (0.0%) |
| 7+ Person Households | 2 (0.9%) | 0 (0.0%) |
| Total | 132 (57.9%) | 96 (42.1%) |
Female Fertility in Sutersville borough
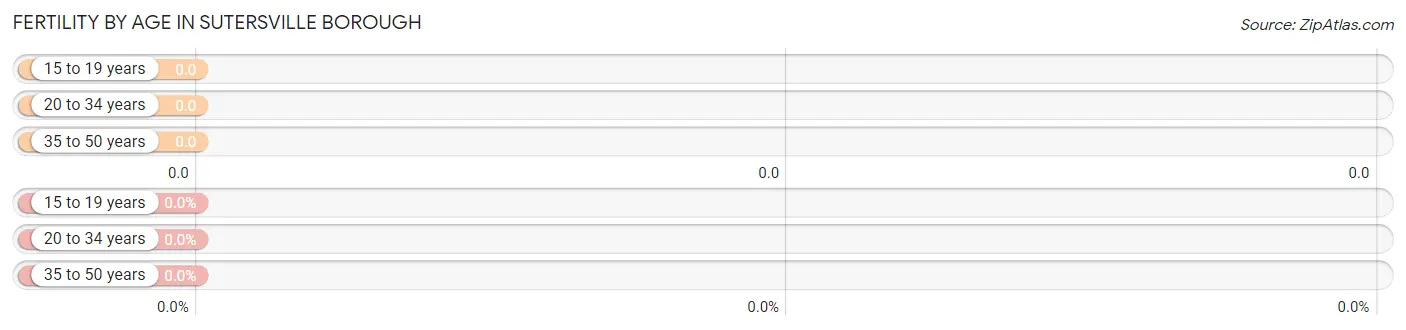
Fertility by Age in Sutersville borough
| Age Bracket | Women with Births | Births / 1,000 Women |
| 15 to 19 years | 0 (0.0%) | 0.0 |
| 20 to 34 years | 0 (0.0%) | 0.0 |
| 35 to 50 years | 0 (0.0%) | 0.0 |
| Total | 0 (0.0%) | 0.0 |
Fertility by Age by Marriage Status in Sutersville borough
| Age Bracket | Married | Unmarried |
| 15 to 19 years | 0 (0.0%) | 0 (0.0%) |
| 20 to 34 years | 0 (0.0%) | 0 (0.0%) |
| 35 to 50 years | 0 (0.0%) | 0 (0.0%) |
| Total | 0 (0.0%) | 0 (0.0%) |
Fertility by Education in Sutersville borough
| Educational Attainment | Women with Births | Births / 1,000 Women |
| Less than High School | 0 (0.0%) | 0.0 |
| High School Diploma | 0 (0.0%) | 0.0 |
| College or Associate's Degree | 0 (0.0%) | 0.0 |
| Bachelor's Degree | 0 (0.0%) | 0.0 |
| Graduate Degree | 0 (0.0%) | 0.0 |
| Total | 0 (0.0%) | 0.0 |
Fertility by Education by Marriage Status in Sutersville borough
| Educational Attainment | Married | Unmarried |
| Less than High School | 0 (0.0%) | 0 (0.0%) |
| High School Diploma | 0 (0.0%) | 0 (0.0%) |
| College or Associate's Degree | 0 (0.0%) | 0 (0.0%) |
| Bachelor's Degree | 0 (0.0%) | 0 (0.0%) |
| Graduate Degree | 0 (0.0%) | 0 (0.0%) |
| Total | 0 (0.0%) | 0 (0.0%) |
Income in Sutersville borough
Income Overview in Sutersville borough
Per Capita Income in Sutersville borough is $59,476, while median incomes of families and households are $70,357 and $62,727 respectively.
| Characteristic | Number | Measure |
| Per Capita Income | 444 | $59,476 |
| Median Family Income | 132 | $70,357 |
| Mean Family Income | 132 | $173,563 |
| Median Household Income | 228 | $62,727 |
| Mean Household Income | 228 | $117,194 |
| Income Deficit | 132 | $0 |
| Wage / Income Gap (%) | 444 | 40.96% |
| Wage / Income Gap ($) | 444 | 59.04¢ per $1 |
| Gini / Inequality Index | 444 | 0.62 |
Earnings by Sex in Sutersville borough
Average Earnings in Sutersville borough are $42,946, $59,286 for men and $35,000 for women, a difference of 41.0%.
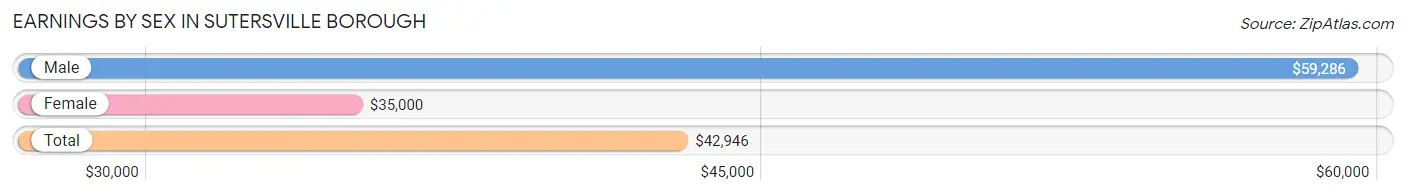
| Sex | Number | Average Earnings |
| Male | 106 (44.5%) | $59,286 |
| Female | 132 (55.5%) | $35,000 |
| Total | 238 (100.0%) | $42,946 |
Earnings by Sex by Income Bracket in Sutersville borough
The most common earnings brackets in Sutersville borough are $100,000+ for men (29 | 27.4%) and $40,000 to $44,999 for women (35 | 26.5%).
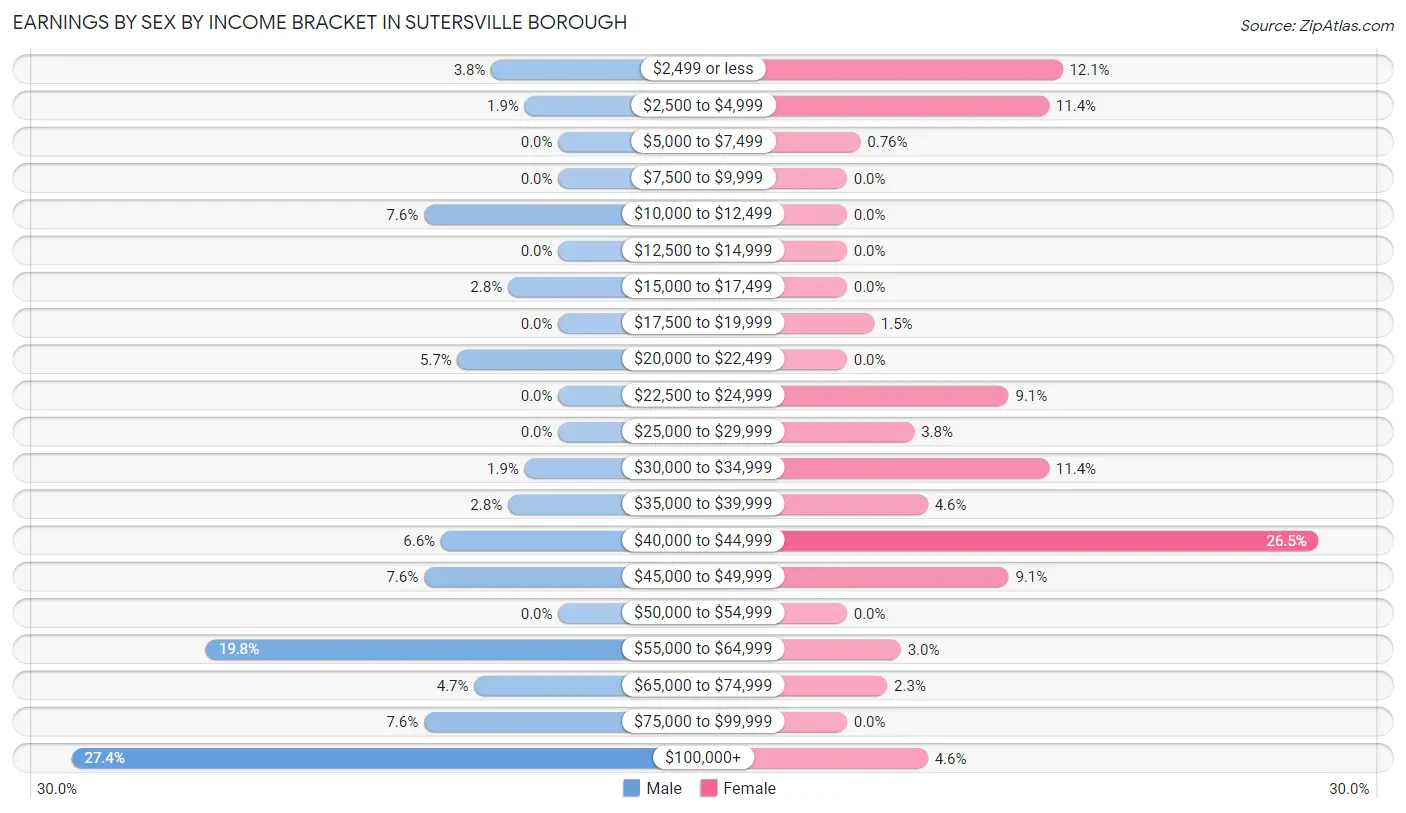
| Income | Male | Female |
| $2,499 or less | 4 (3.8%) | 16 (12.1%) |
| $2,500 to $4,999 | 2 (1.9%) | 15 (11.4%) |
| $5,000 to $7,499 | 0 (0.0%) | 1 (0.8%) |
| $7,500 to $9,999 | 0 (0.0%) | 0 (0.0%) |
| $10,000 to $12,499 | 8 (7.5%) | 0 (0.0%) |
| $12,500 to $14,999 | 0 (0.0%) | 0 (0.0%) |
| $15,000 to $17,499 | 3 (2.8%) | 0 (0.0%) |
| $17,500 to $19,999 | 0 (0.0%) | 2 (1.5%) |
| $20,000 to $22,499 | 6 (5.7%) | 0 (0.0%) |
| $22,500 to $24,999 | 0 (0.0%) | 12 (9.1%) |
| $25,000 to $29,999 | 0 (0.0%) | 5 (3.8%) |
| $30,000 to $34,999 | 2 (1.9%) | 15 (11.4%) |
| $35,000 to $39,999 | 3 (2.8%) | 6 (4.5%) |
| $40,000 to $44,999 | 7 (6.6%) | 35 (26.5%) |
| $45,000 to $49,999 | 8 (7.5%) | 12 (9.1%) |
| $50,000 to $54,999 | 0 (0.0%) | 0 (0.0%) |
| $55,000 to $64,999 | 21 (19.8%) | 4 (3.0%) |
| $65,000 to $74,999 | 5 (4.7%) | 3 (2.3%) |
| $75,000 to $99,999 | 8 (7.5%) | 0 (0.0%) |
| $100,000+ | 29 (27.4%) | 6 (4.5%) |
| Total | 106 (100.0%) | 132 (100.0%) |
Earnings by Sex by Educational Attainment in Sutersville borough
Average earnings in Sutersville borough are $59,821 for men and $37,500 for women, a difference of 37.3%. Men with an educational attainment of less than high school enjoy the highest average annual earnings of $250,001, while those with high school diploma education earn the least with $46,667. Women with an educational attainment of college or associate's degree earn the most with the average annual earnings of $43,155, while those with bachelor's degree education have the smallest earnings of $40,833.
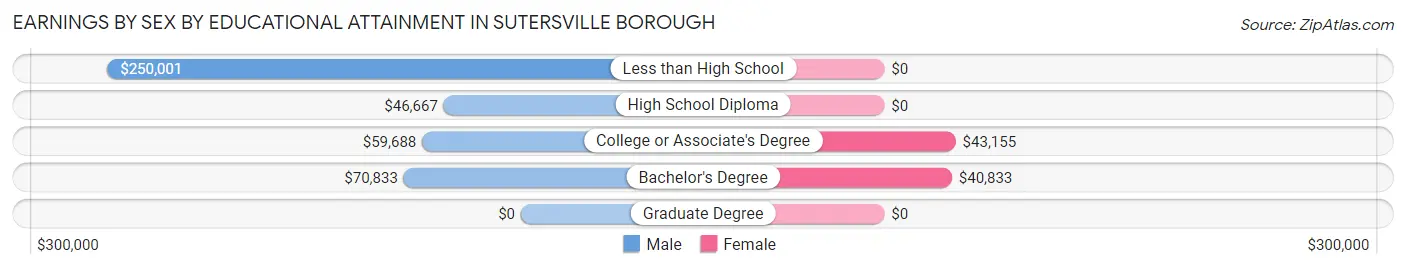
| Educational Attainment | Male Income | Female Income |
| Less than High School | $250,001 | $0 |
| High School Diploma | $46,667 | $0 |
| College or Associate's Degree | $59,688 | $43,155 |
| Bachelor's Degree | $70,833 | $40,833 |
| Graduate Degree | - | - |
| Total | $59,821 | $37,500 |
Family Income in Sutersville borough
Family Income Brackets in Sutersville borough
According to the Sutersville borough family income data, there are 47 families falling into the $50,000 to $74,999 income range, which is the most common income bracket and makes up 35.6% of all families. Conversely, the less than $10,000 income bracket is the least frequent group with only 2 families (1.5%) belonging to this category.
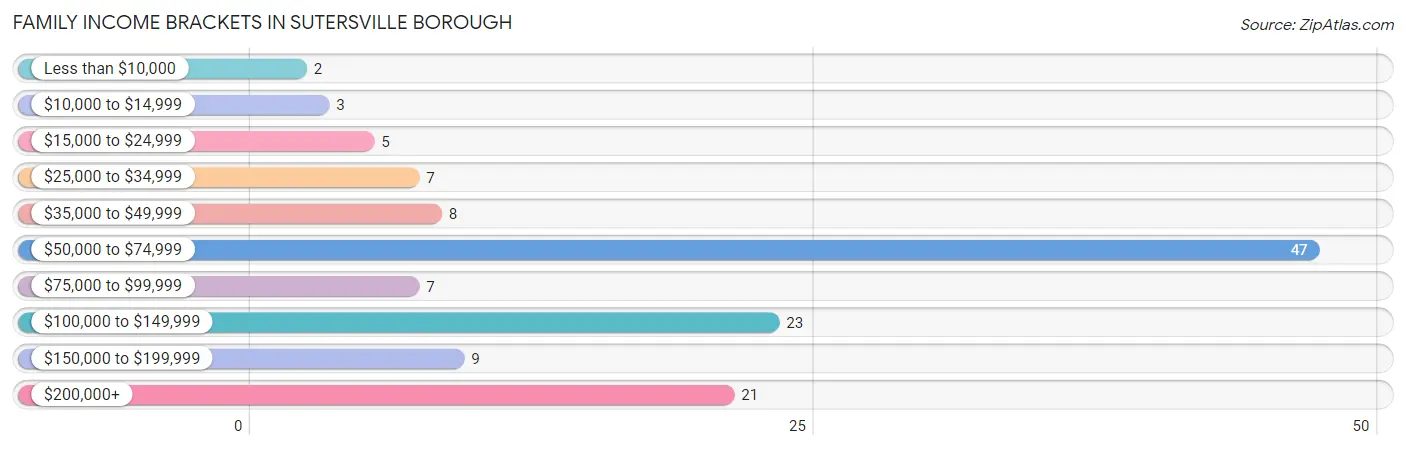
| Income Bracket | # Families | % Families |
| Less than $10,000 | 2 | 1.5% |
| $10,000 to $14,999 | 3 | 2.3% |
| $15,000 to $24,999 | 5 | 3.8% |
| $25,000 to $34,999 | 7 | 5.3% |
| $35,000 to $49,999 | 8 | 6.1% |
| $50,000 to $74,999 | 47 | 35.6% |
| $75,000 to $99,999 | 7 | 5.3% |
| $100,000 to $149,999 | 23 | 17.4% |
| $150,000 to $199,999 | 9 | 6.8% |
| $200,000+ | 21 | 15.9% |
Family Income by Famaliy Size in Sutersville borough
3-person families (30 | 22.7%) account for the highest median family income in Sutersville borough with $100,000 per family, while 3-person families (30 | 22.7%) have the highest median income of $33,333 per family member.
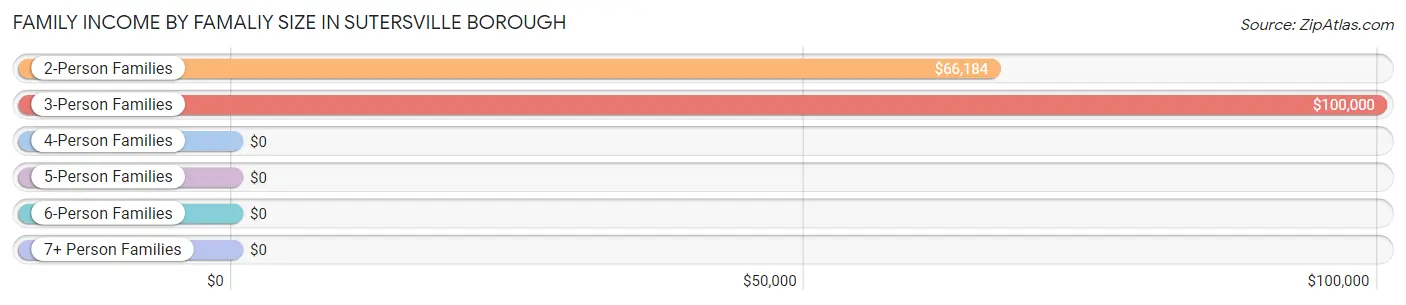
| Income Bracket | # Families | Median Income |
| 2-Person Families | 90 (68.2%) | $66,184 |
| 3-Person Families | 30 (22.7%) | $100,000 |
| 4-Person Families | 7 (5.3%) | $0 |
| 5-Person Families | 3 (2.3%) | $0 |
| 6-Person Families | 0 (0.0%) | $0 |
| 7+ Person Families | 2 (1.5%) | $0 |
| Total | 132 (100.0%) | $70,357 |
Family Income by Number of Earners in Sutersville borough
The median family income in Sutersville borough is $70,357, with families comprising 3+ earners (10) having the highest median family income of $158,333, while families with no earners (12) have the lowest median family income of $21,250, accounting for 7.6% and 9.1% of families, respectively.
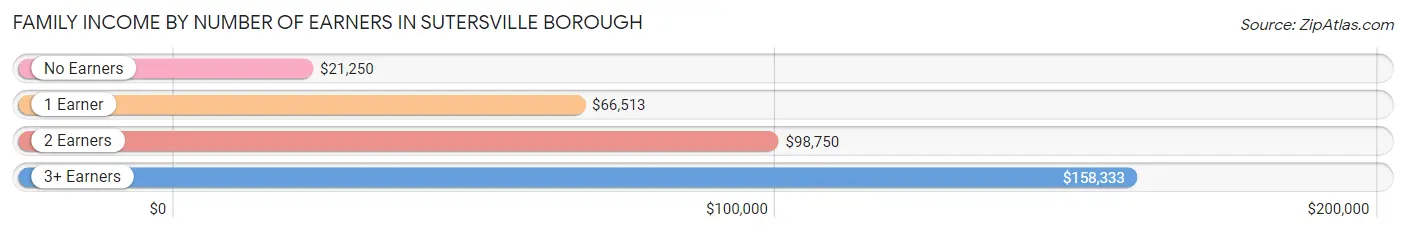
| Number of Earners | # Families | Median Income |
| No Earners | 12 (9.1%) | $21,250 |
| 1 Earner | 67 (50.8%) | $66,513 |
| 2 Earners | 43 (32.6%) | $98,750 |
| 3+ Earners | 10 (7.6%) | $158,333 |
| Total | 132 (100.0%) | $70,357 |
Household Income in Sutersville borough
Household Income Brackets in Sutersville borough
With 68 households falling in the category, the $50,000 to $74,999 income range is the most frequent in Sutersville borough, accounting for 29.8% of all households. In contrast, only 7 households (3.1%) fall into the $25,000 to $34,999 income bracket, making it the least populous group.
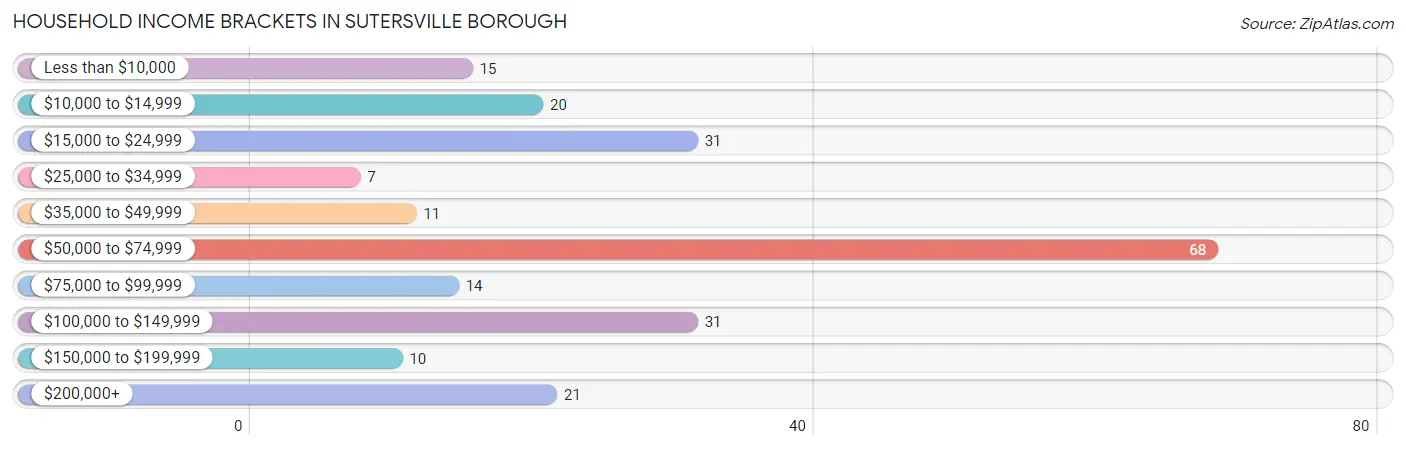
| Income Bracket | # Households | % Households |
| Less than $10,000 | 15 | 6.6% |
| $10,000 to $14,999 | 20 | 8.8% |
| $15,000 to $24,999 | 31 | 13.6% |
| $25,000 to $34,999 | 7 | 3.1% |
| $35,000 to $49,999 | 11 | 4.8% |
| $50,000 to $74,999 | 68 | 29.8% |
| $75,000 to $99,999 | 14 | 6.1% |
| $100,000 to $149,999 | 31 | 13.6% |
| $150,000 to $199,999 | 10 | 4.4% |
| $200,000+ | 21 | 9.2% |
Household Income by Householder Age in Sutersville borough
The median household income in Sutersville borough is $62,727, with the highest median household income of $86,563 found in the 25 to 44 years age bracket for the primary householder. A total of 39 households (17.1%) fall into this category.
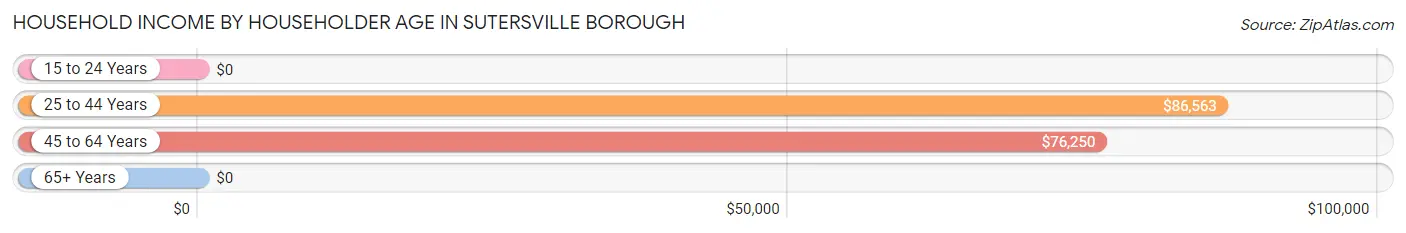
| Income Bracket | # Households | Median Income |
| 15 to 24 Years | 0 (0.0%) | $0 |
| 25 to 44 Years | 39 (17.1%) | $86,563 |
| 45 to 64 Years | 88 (38.6%) | $76,250 |
| 65+ Years | 101 (44.3%) | $0 |
| Total | 228 (100.0%) | $62,727 |
Poverty in Sutersville borough
Income Below Poverty by Sex and Age in Sutersville borough
With 9.3% poverty level for males and 15.0% for females among the residents of Sutersville borough, 75 year old and over males and 75 year old and over females are the most vulnerable to poverty, with 2 males (25.0%) and 10 females (29.4%) in their respective age groups living below the poverty level.
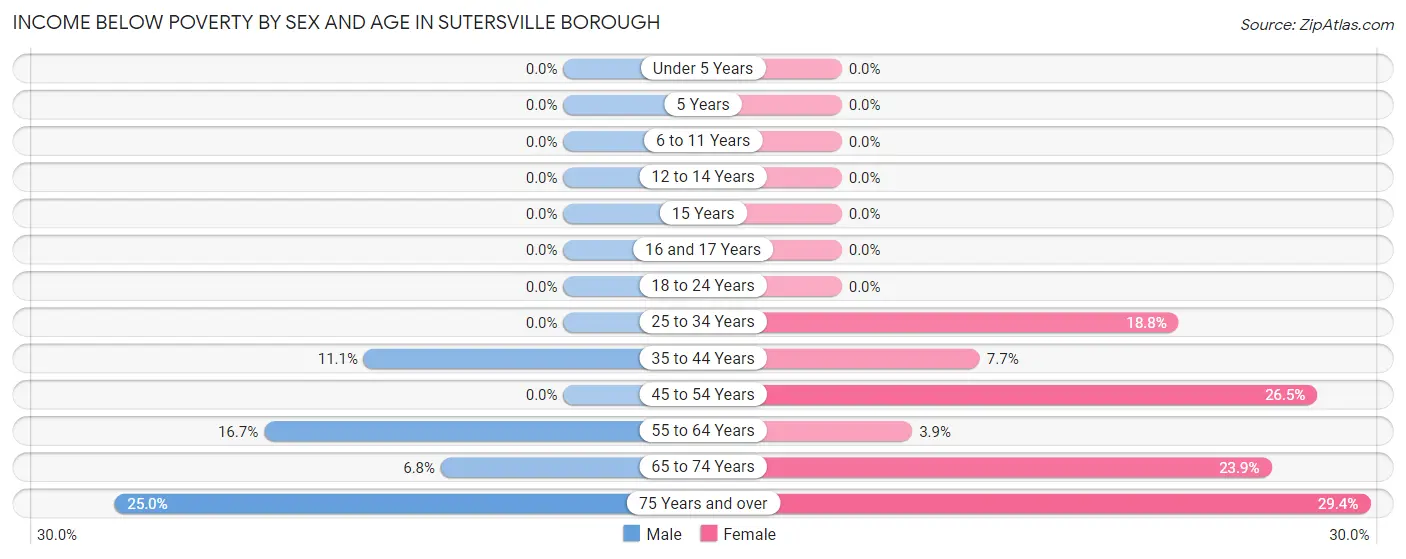
| Age Bracket | Male | Female |
| Under 5 Years | 0 (0.0%) | 0 (0.0%) |
| 5 Years | 0 (0.0%) | 0 (0.0%) |
| 6 to 11 Years | 0 (0.0%) | 0 (0.0%) |
| 12 to 14 Years | 0 (0.0%) | 0 (0.0%) |
| 15 Years | 0 (0.0%) | 0 (0.0%) |
| 16 and 17 Years | 0 (0.0%) | 0 (0.0%) |
| 18 to 24 Years | 0 (0.0%) | 0 (0.0%) |
| 25 to 34 Years | 0 (0.0%) | 3 (18.8%) |
| 35 to 44 Years | 2 (11.1%) | 2 (7.7%) |
| 45 to 54 Years | 0 (0.0%) | 9 (26.5%) |
| 55 to 64 Years | 11 (16.7%) | 2 (3.9%) |
| 65 to 74 Years | 3 (6.8%) | 11 (23.9%) |
| 75 Years and over | 2 (25.0%) | 10 (29.4%) |
| Total | 18 (9.3%) | 37 (15.0%) |
Income Above Poverty by Sex and Age in Sutersville borough
According to the poverty statistics in Sutersville borough, males aged under 5 years and females aged under 5 years are the age groups that are most secure financially, with 100.0% of males and 100.0% of females in these age groups living above the poverty line.
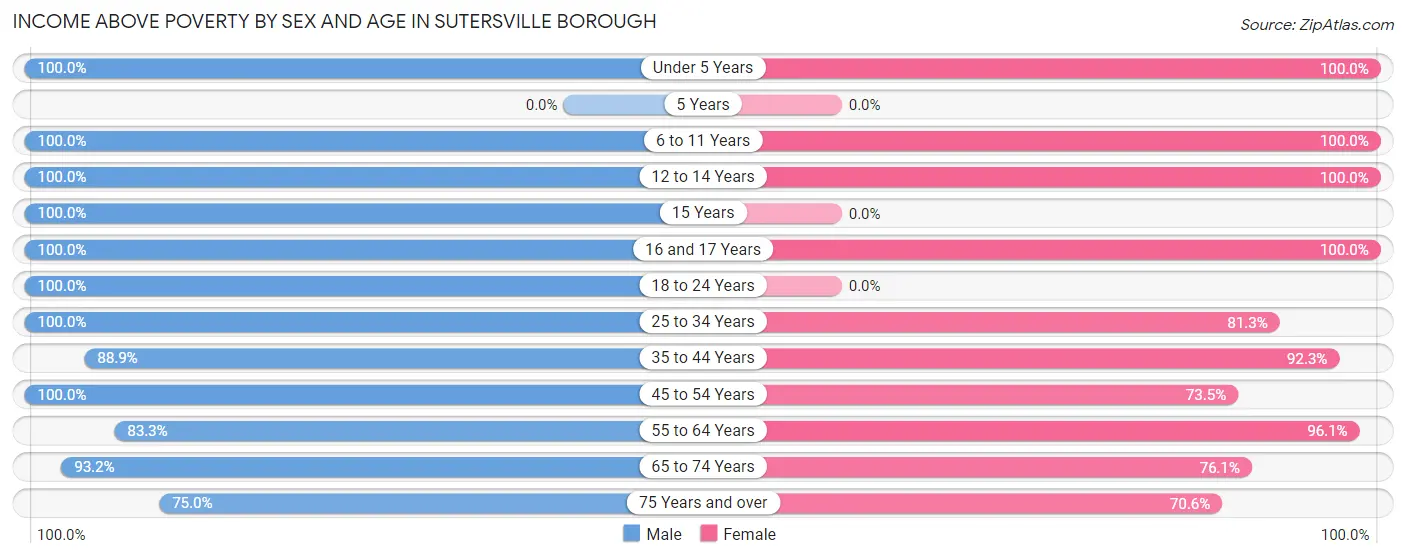
| Age Bracket | Male | Female |
| Under 5 Years | 6 (100.0%) | 6 (100.0%) |
| 5 Years | 0 (0.0%) | 0 (0.0%) |
| 6 to 11 Years | 8 (100.0%) | 12 (100.0%) |
| 12 to 14 Years | 5 (100.0%) | 8 (100.0%) |
| 15 Years | 2 (100.0%) | 0 (0.0%) |
| 16 and 17 Years | 3 (100.0%) | 14 (100.0%) |
| 18 to 24 Years | 4 (100.0%) | 0 (0.0%) |
| 25 to 34 Years | 25 (100.0%) | 13 (81.2%) |
| 35 to 44 Years | 16 (88.9%) | 24 (92.3%) |
| 45 to 54 Years | 5 (100.0%) | 25 (73.5%) |
| 55 to 64 Years | 55 (83.3%) | 49 (96.1%) |
| 65 to 74 Years | 41 (93.2%) | 35 (76.1%) |
| 75 Years and over | 6 (75.0%) | 24 (70.6%) |
| Total | 176 (90.7%) | 210 (85.0%) |
Income Below Poverty Among Married-Couple Families in Sutersville borough
The poverty statistics for married-couple families in Sutersville borough show that 5.0% or 5 of the total 100 families live below the poverty line. Families with no children have the highest poverty rate of 6.2%, comprising of 5 families. On the other hand, families with 1 or 2 children have the lowest poverty rate of 0.0%, which includes 0 families.
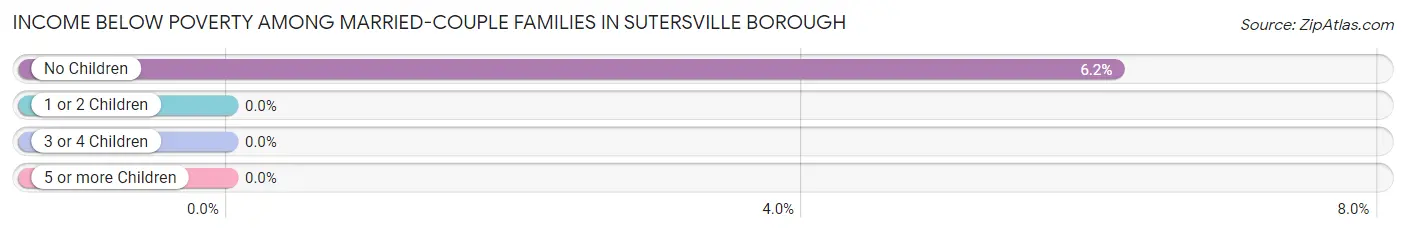
| Children | Above Poverty | Below Poverty |
| No Children | 76 (93.8%) | 5 (6.2%) |
| 1 or 2 Children | 14 (100.0%) | 0 (0.0%) |
| 3 or 4 Children | 3 (100.0%) | 0 (0.0%) |
| 5 or more Children | 2 (100.0%) | 0 (0.0%) |
| Total | 95 (95.0%) | 5 (5.0%) |
Income Below Poverty Among Single-Parent Households in Sutersville borough
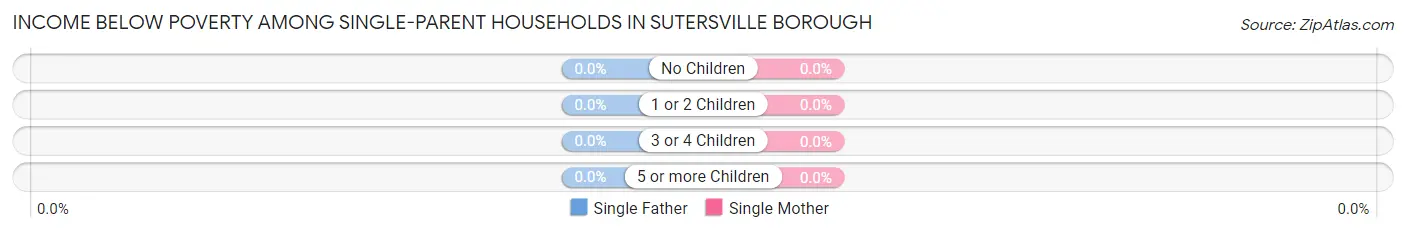
| Children | Single Father | Single Mother |
| No Children | 0 (0.0%) | 0 (0.0%) |
| 1 or 2 Children | 0 (0.0%) | 0 (0.0%) |
| 3 or 4 Children | 0 (0.0%) | 0 (0.0%) |
| 5 or more Children | 0 (0.0%) | 0 (0.0%) |
| Total | 0 (0.0%) | 0 (0.0%) |
Income Below Poverty Among Married-Couple vs Single-Parent Households in Sutersville borough
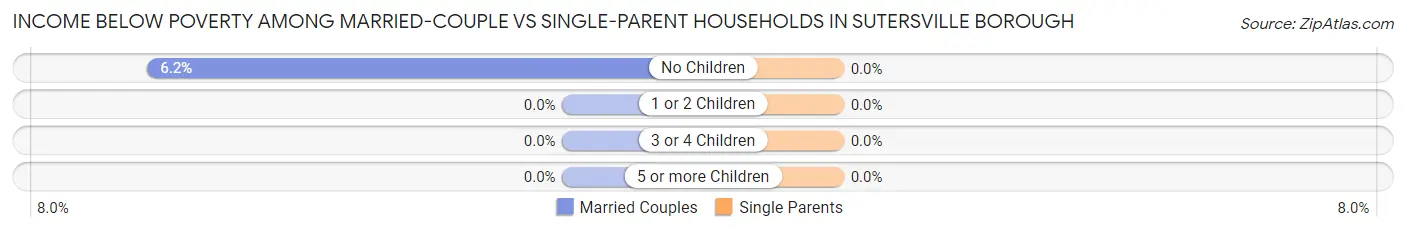
| Children | Married-Couple Families | Single-Parent Households |
| No Children | 5 (6.2%) | 0 (0.0%) |
| 1 or 2 Children | 0 (0.0%) | 0 (0.0%) |
| 3 or 4 Children | 0 (0.0%) | 0 (0.0%) |
| 5 or more Children | 0 (0.0%) | 0 (0.0%) |
| Total | 5 (5.0%) | 0 (0.0%) |
Employment Characteristics in Sutersville borough
Employment by Class of Employer in Sutersville borough
Among the 217 employed individuals in Sutersville borough, private company employees (143 | 65.9%), self-employed (not incorporated) (30 | 13.8%), and not-for-profit organizations (29 | 13.4%) make up the most common classes of employment.
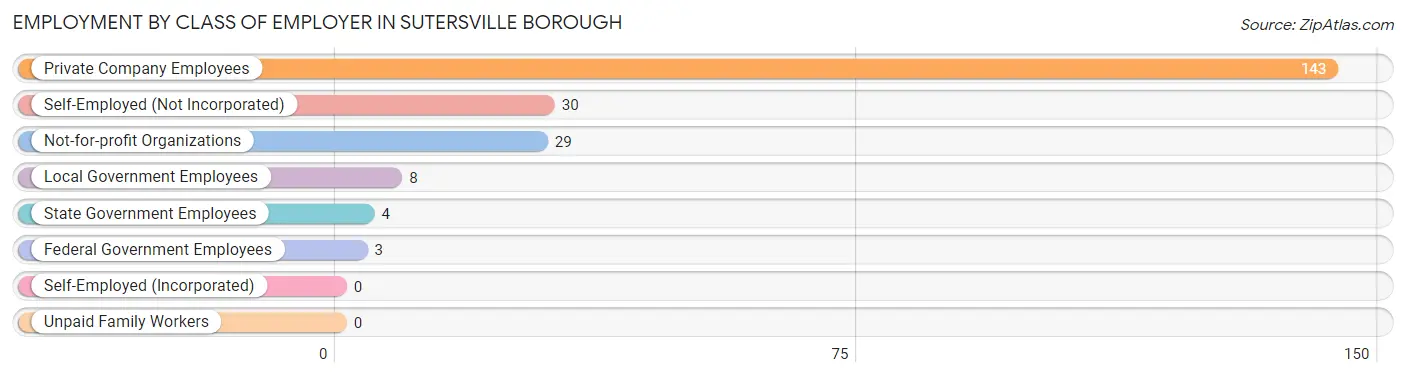
| Employer Class | # Employees | % Employees |
| Private Company Employees | 143 | 65.9% |
| Self-Employed (Incorporated) | 0 | 0.0% |
| Self-Employed (Not Incorporated) | 30 | 13.8% |
| Not-for-profit Organizations | 29 | 13.4% |
| Local Government Employees | 8 | 3.7% |
| State Government Employees | 4 | 1.8% |
| Federal Government Employees | 3 | 1.4% |
| Unpaid Family Workers | 0 | 0.0% |
| Total | 217 | 100.0% |
Employment Status by Age in Sutersville borough
According to the labor force statistics for Sutersville borough, out of the total population over 16 years of age (394), 57.4% or 226 individuals are in the labor force, with 3.5% or 8 of them unemployed. The age group with the highest labor force participation rate is 25 to 29 years, with 100.0% or 13 individuals in the labor force. Within the labor force, the 25 to 29 years age range has the highest percentage of unemployed individuals, with 23.1% or 3 of them being unemployed.
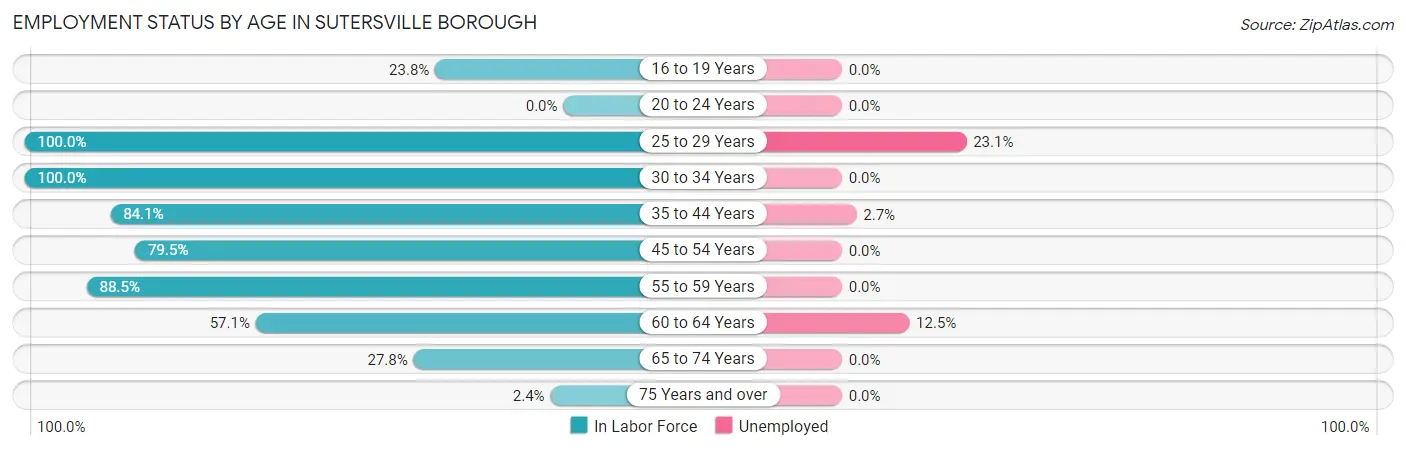
| Age Bracket | In Labor Force | Unemployed |
| 16 to 19 Years | 5 (23.8%) | 0 (0.0%) |
| 20 to 24 Years | 0 (0.0%) | 0 (0.0%) |
| 25 to 29 Years | 13 (100.0%) | 3 (23.1%) |
| 30 to 34 Years | 28 (100.0%) | 0 (0.0%) |
| 35 to 44 Years | 37 (84.1%) | 1 (2.7%) |
| 45 to 54 Years | 31 (79.5%) | 0 (0.0%) |
| 55 to 59 Years | 54 (88.5%) | 0 (0.0%) |
| 60 to 64 Years | 32 (57.1%) | 4 (12.5%) |
| 65 to 74 Years | 25 (27.8%) | 0 (0.0%) |
| 75 Years and over | 1 (2.4%) | 0 (0.0%) |
| Total | 226 (57.4%) | 8 (3.5%) |
Employment Status by Educational Attainment in Sutersville borough
According to labor force statistics for Sutersville borough, 80.9% of individuals (195) out of the total population between 25 and 64 years of age (241) are in the labor force, with 4.1% or 8 of them being unemployed. The group with the highest labor force participation rate are those with the educational attainment of bachelor's degree or higher, with 91.1% or 41 individuals in the labor force. Within the labor force, individuals with less than high school education have the highest percentage of unemployment, with 21.1% or 4 of them being unemployed.
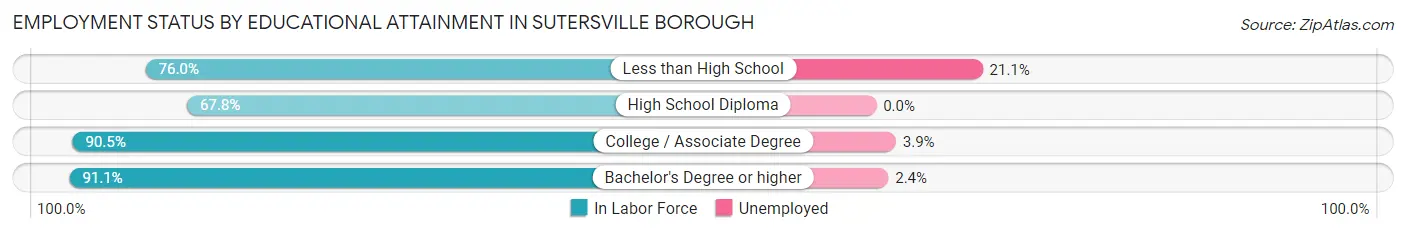
| Educational Attainment | In Labor Force | Unemployed |
| Less than High School | 19 (76.0%) | 5 (21.1%) |
| High School Diploma | 59 (67.8%) | 0 (0.0%) |
| College / Associate Degree | 76 (90.5%) | 3 (3.9%) |
| Bachelor's Degree or higher | 41 (91.1%) | 1 (2.4%) |
| Total | 195 (80.9%) | 10 (4.1%) |
Employment Occupations by Sex in Sutersville borough
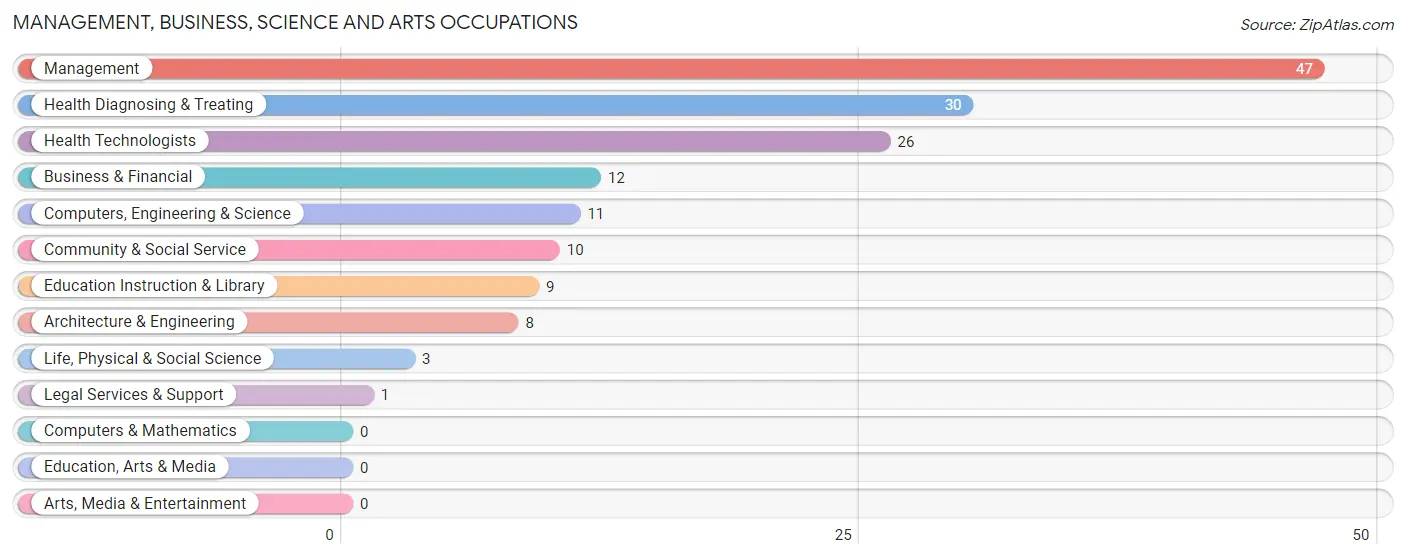
Management, Business, Science and Arts Occupations
The most common Management, Business, Science and Arts occupations in Sutersville borough are Management (47 | 21.6%), Health Diagnosing & Treating (30 | 13.8%), Health Technologists (26 | 11.9%), Business & Financial (12 | 5.5%), and Computers, Engineering & Science (11 | 5.1%).
Management, Business, Science and Arts Occupations by Sex
Within the Management, Business, Science and Arts occupations in Sutersville borough, the most male-oriented occupations are Life, Physical & Social Science (100.0%), Legal Services & Support (100.0%), and Computers, Engineering & Science (81.8%), while the most female-oriented occupations are Education Instruction & Library (100.0%), Health Diagnosing & Treating (100.0%), and Health Technologists (100.0%).
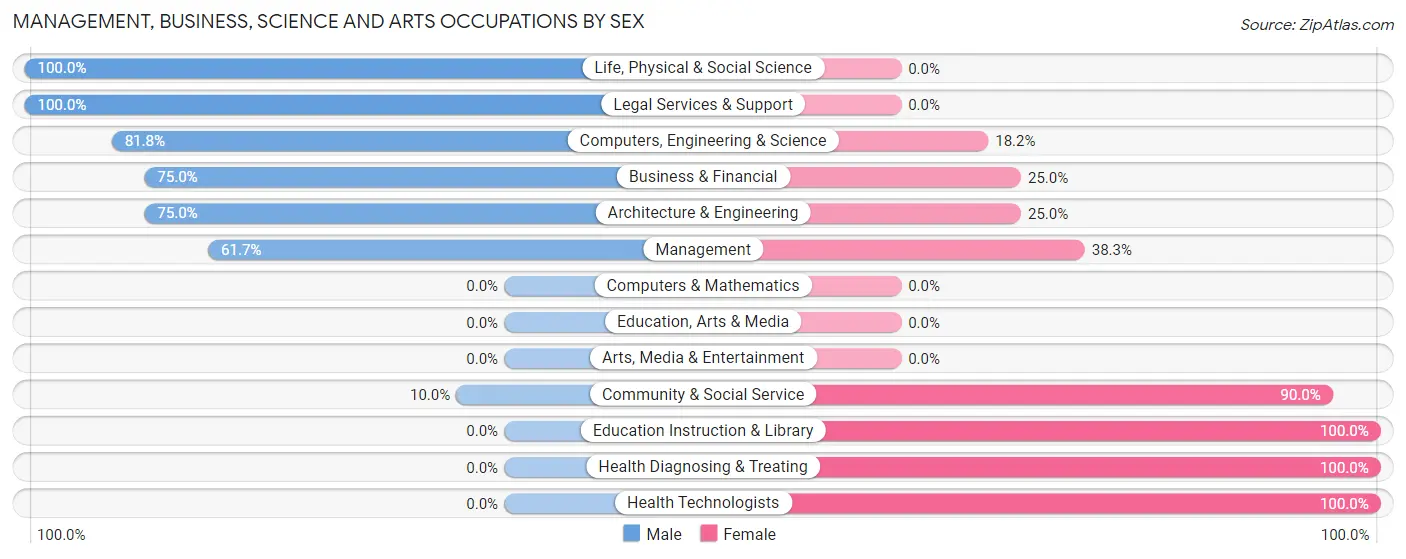
| Occupation | Male | Female |
| Management | 29 (61.7%) | 18 (38.3%) |
| Business & Financial | 9 (75.0%) | 3 (25.0%) |
| Computers, Engineering & Science | 9 (81.8%) | 2 (18.2%) |
| Computers & Mathematics | 0 (0.0%) | 0 (0.0%) |
| Architecture & Engineering | 6 (75.0%) | 2 (25.0%) |
| Life, Physical & Social Science | 3 (100.0%) | 0 (0.0%) |
| Community & Social Service | 1 (10.0%) | 9 (90.0%) |
| Education, Arts & Media | 0 (0.0%) | 0 (0.0%) |
| Legal Services & Support | 1 (100.0%) | 0 (0.0%) |
| Education Instruction & Library | 0 (0.0%) | 9 (100.0%) |
| Arts, Media & Entertainment | 0 (0.0%) | 0 (0.0%) |
| Health Diagnosing & Treating | 0 (0.0%) | 30 (100.0%) |
| Health Technologists | 0 (0.0%) | 26 (100.0%) |
| Total (Category) | 48 (43.6%) | 62 (56.4%) |
| Total (Overall) | 97 (44.5%) | 121 (55.5%) |
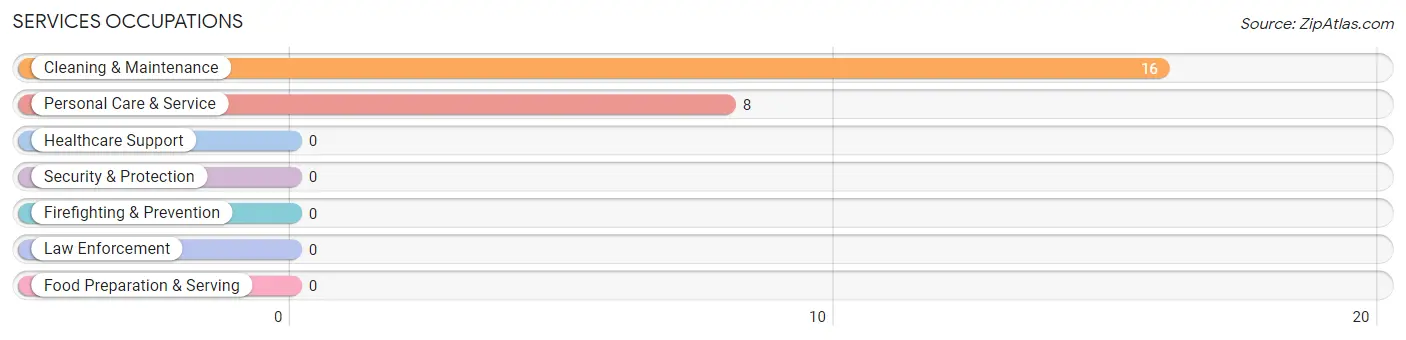
Services Occupations
The most common Services occupations in Sutersville borough are Cleaning & Maintenance (16 | 7.3%), and Personal Care & Service (8 | 3.7%).
Services Occupations by Sex
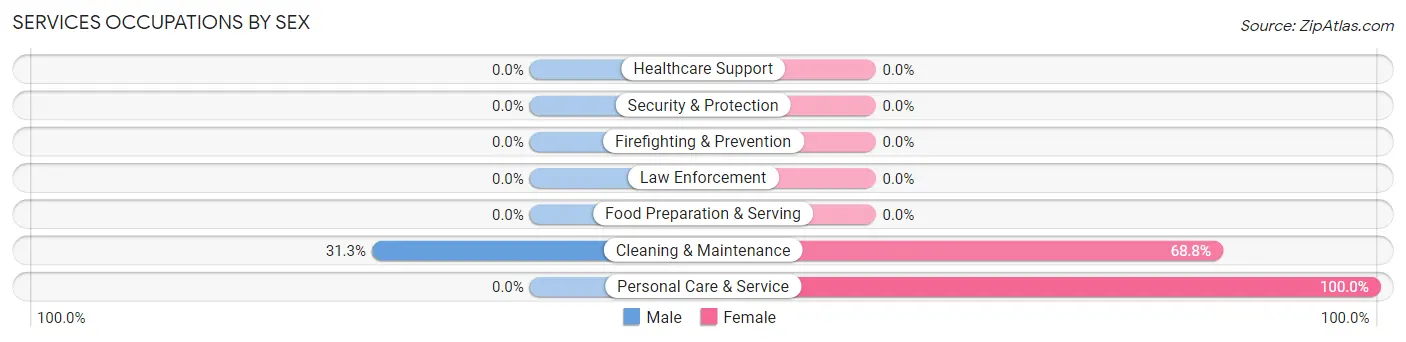
| Occupation | Male | Female |
| Healthcare Support | 0 (0.0%) | 0 (0.0%) |
| Security & Protection | 0 (0.0%) | 0 (0.0%) |
| Firefighting & Prevention | 0 (0.0%) | 0 (0.0%) |
| Law Enforcement | 0 (0.0%) | 0 (0.0%) |
| Food Preparation & Serving | 0 (0.0%) | 0 (0.0%) |
| Cleaning & Maintenance | 5 (31.2%) | 11 (68.8%) |
| Personal Care & Service | 0 (0.0%) | 8 (100.0%) |
| Total (Category) | 5 (20.8%) | 19 (79.2%) |
| Total (Overall) | 97 (44.5%) | 121 (55.5%) |
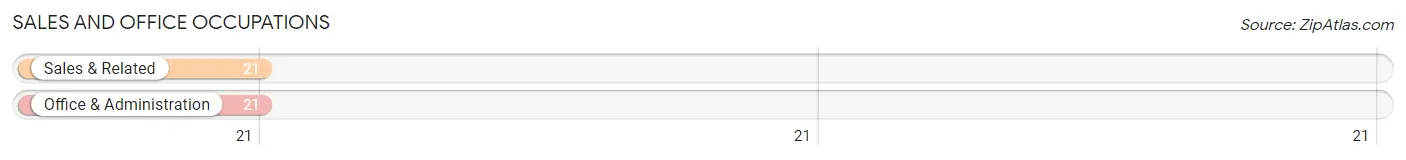
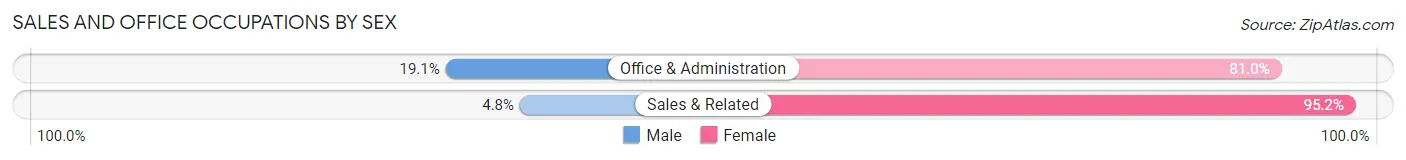
Sales and Office Occupations
The most common Sales and Office occupations in Sutersville borough are Sales & Related (21 | 9.6%), and Office & Administration (21 | 9.6%).
Sales and Office Occupations by Sex
| Occupation | Male | Female |
| Sales & Related | 1 (4.8%) | 20 (95.2%) |
| Office & Administration | 4 (19.1%) | 17 (80.9%) |
| Total (Category) | 5 (11.9%) | 37 (88.1%) |
| Total (Overall) | 97 (44.5%) | 121 (55.5%) |
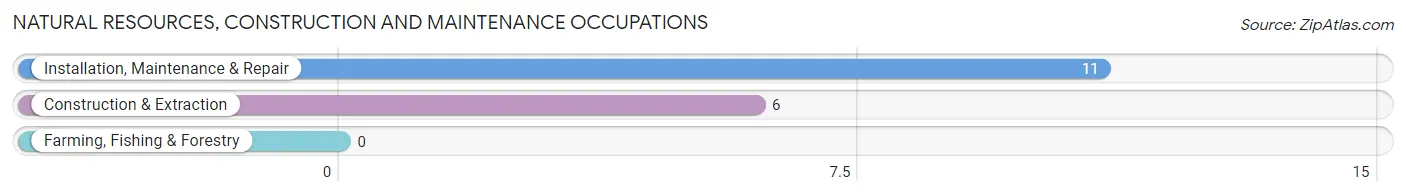
Natural Resources, Construction and Maintenance Occupations
The most common Natural Resources, Construction and Maintenance occupations in Sutersville borough are Installation, Maintenance & Repair (11 | 5.1%), and Construction & Extraction (6 | 2.8%).
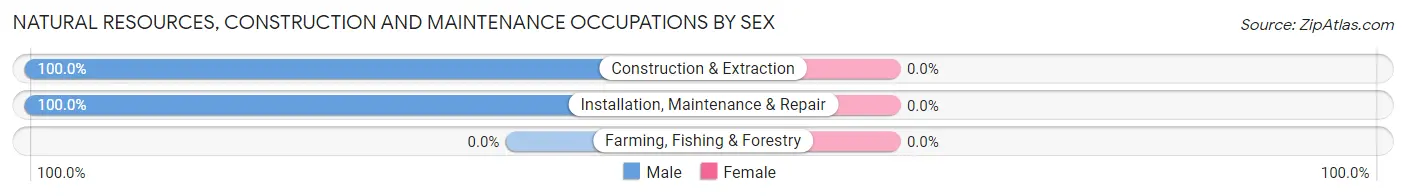
Natural Resources, Construction and Maintenance Occupations by Sex
| Occupation | Male | Female |
| Farming, Fishing & Forestry | 0 (0.0%) | 0 (0.0%) |
| Construction & Extraction | 6 (100.0%) | 0 (0.0%) |
| Installation, Maintenance & Repair | 11 (100.0%) | 0 (0.0%) |
| Total (Category) | 17 (100.0%) | 0 (0.0%) |
| Total (Overall) | 97 (44.5%) | 121 (55.5%) |
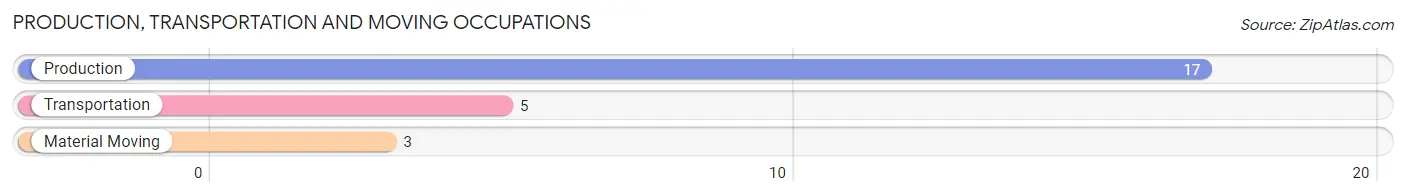
Production, Transportation and Moving Occupations
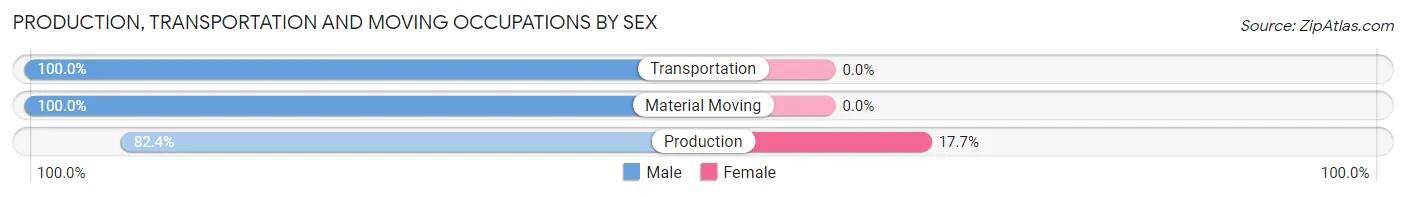
The most common Production, Transportation and Moving occupations in Sutersville borough are Production (17 | 7.8%), Transportation (5 | 2.3%), and Material Moving (3 | 1.4%).
Production, Transportation and Moving Occupations by Sex
| Occupation | Male | Female |
| Production | 14 (82.4%) | 3 (17.6%) |
| Transportation | 5 (100.0%) | 0 (0.0%) |
| Material Moving | 3 (100.0%) | 0 (0.0%) |
| Total (Category) | 22 (88.0%) | 3 (12.0%) |
| Total (Overall) | 97 (44.5%) | 121 (55.5%) |
Employment Industries by Sex in Sutersville borough
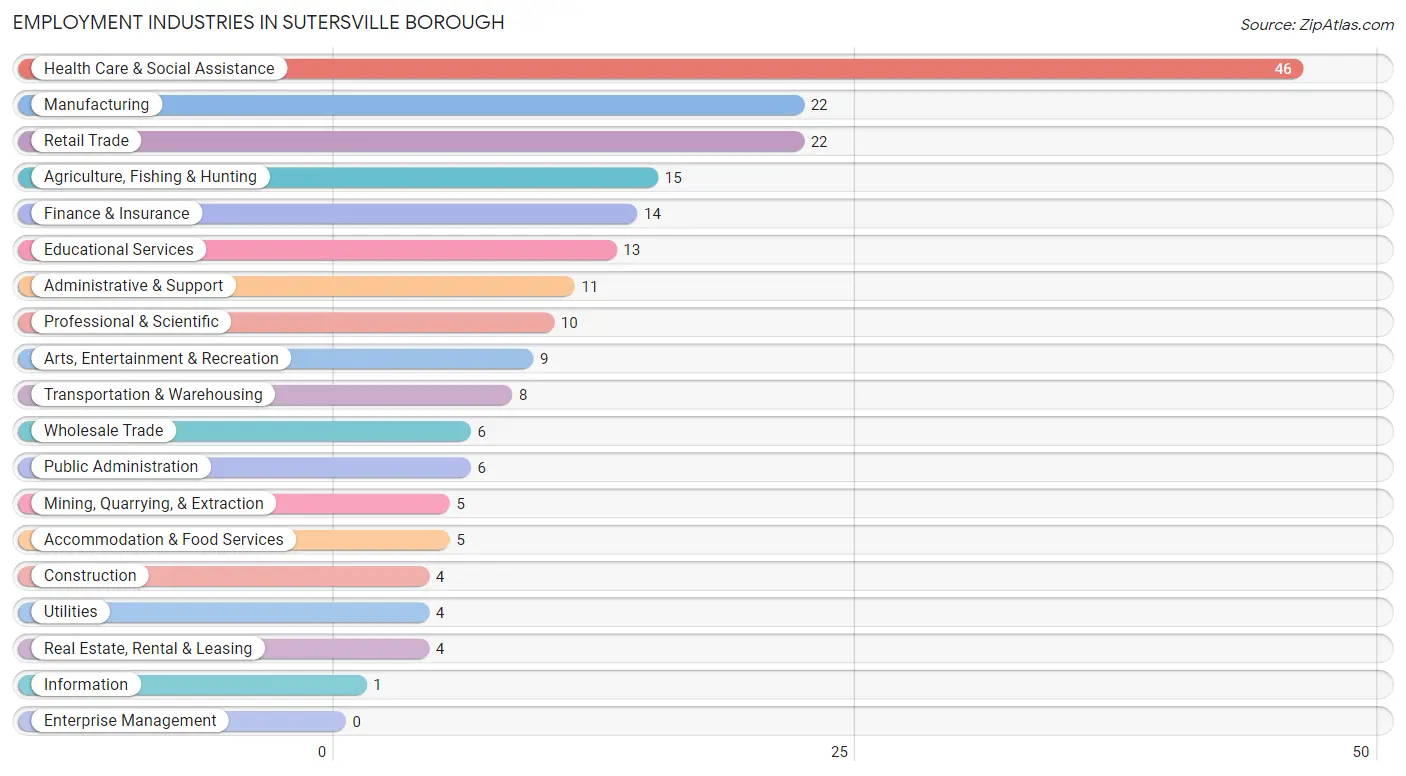
Employment Industries in Sutersville borough
The major employment industries in Sutersville borough include Health Care & Social Assistance (46 | 21.1%), Manufacturing (22 | 10.1%), Retail Trade (22 | 10.1%), Agriculture, Fishing & Hunting (15 | 6.9%), and Finance & Insurance (14 | 6.4%).
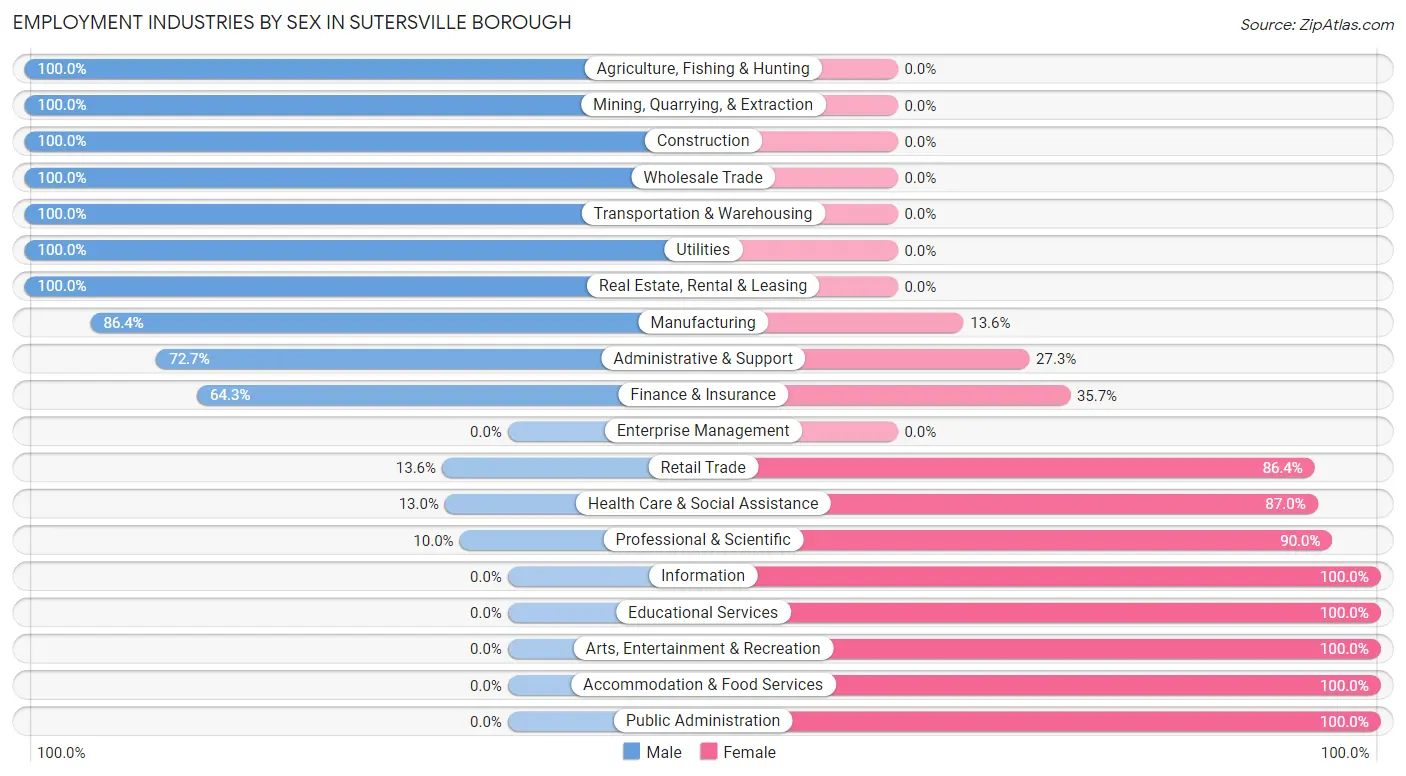
Employment Industries by Sex in Sutersville borough
The Sutersville borough industries that see more men than women are Agriculture, Fishing & Hunting (100.0%), Mining, Quarrying, & Extraction (100.0%), and Construction (100.0%), whereas the industries that tend to have a higher number of women are Information (100.0%), Educational Services (100.0%), and Arts, Entertainment & Recreation (100.0%).
| Industry | Male | Female |
| Agriculture, Fishing & Hunting | 15 (100.0%) | 0 (0.0%) |
| Mining, Quarrying, & Extraction | 5 (100.0%) | 0 (0.0%) |
| Construction | 4 (100.0%) | 0 (0.0%) |
| Manufacturing | 19 (86.4%) | 3 (13.6%) |
| Wholesale Trade | 6 (100.0%) | 0 (0.0%) |
| Retail Trade | 3 (13.6%) | 19 (86.4%) |
| Transportation & Warehousing | 8 (100.0%) | 0 (0.0%) |
| Utilities | 4 (100.0%) | 0 (0.0%) |
| Information | 0 (0.0%) | 1 (100.0%) |
| Finance & Insurance | 9 (64.3%) | 5 (35.7%) |
| Real Estate, Rental & Leasing | 4 (100.0%) | 0 (0.0%) |
| Professional & Scientific | 1 (10.0%) | 9 (90.0%) |
| Enterprise Management | 0 (0.0%) | 0 (0.0%) |
| Administrative & Support | 8 (72.7%) | 3 (27.3%) |
| Educational Services | 0 (0.0%) | 13 (100.0%) |
| Health Care & Social Assistance | 6 (13.0%) | 40 (87.0%) |
| Arts, Entertainment & Recreation | 0 (0.0%) | 9 (100.0%) |
| Accommodation & Food Services | 0 (0.0%) | 5 (100.0%) |
| Public Administration | 0 (0.0%) | 6 (100.0%) |
| Total | 97 (44.5%) | 121 (55.5%) |
Education in Sutersville borough
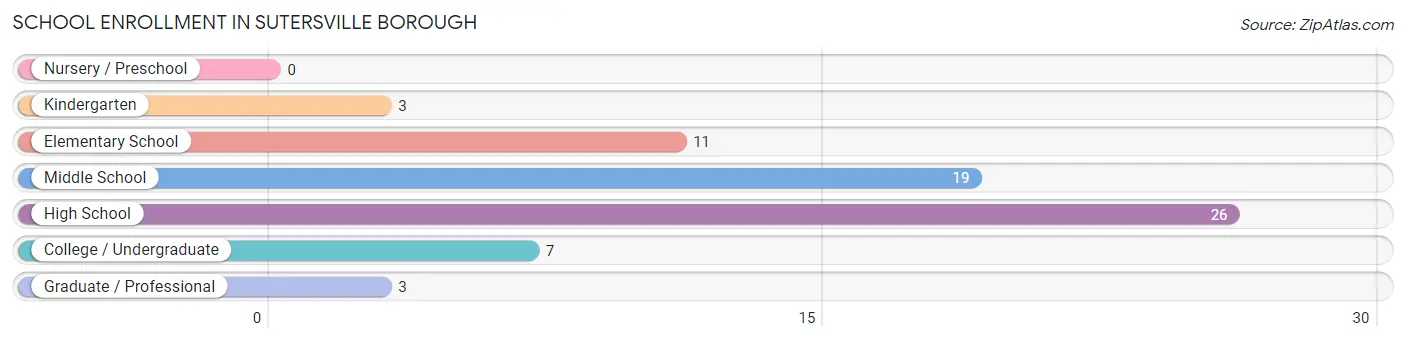
School Enrollment in Sutersville borough
The most common levels of schooling among the 69 students in Sutersville borough are high school (26 | 37.7%), middle school (19 | 27.5%), and elementary school (11 | 15.9%).
| School Level | # Students | % Students |
| Nursery / Preschool | 0 | 0.0% |
| Kindergarten | 3 | 4.3% |
| Elementary School | 11 | 15.9% |
| Middle School | 19 | 27.5% |
| High School | 26 | 37.7% |
| College / Undergraduate | 7 | 10.1% |
| Graduate / Professional | 3 | 4.3% |
| Total | 69 | 100.0% |
School Enrollment by Age by Funding Source in Sutersville borough
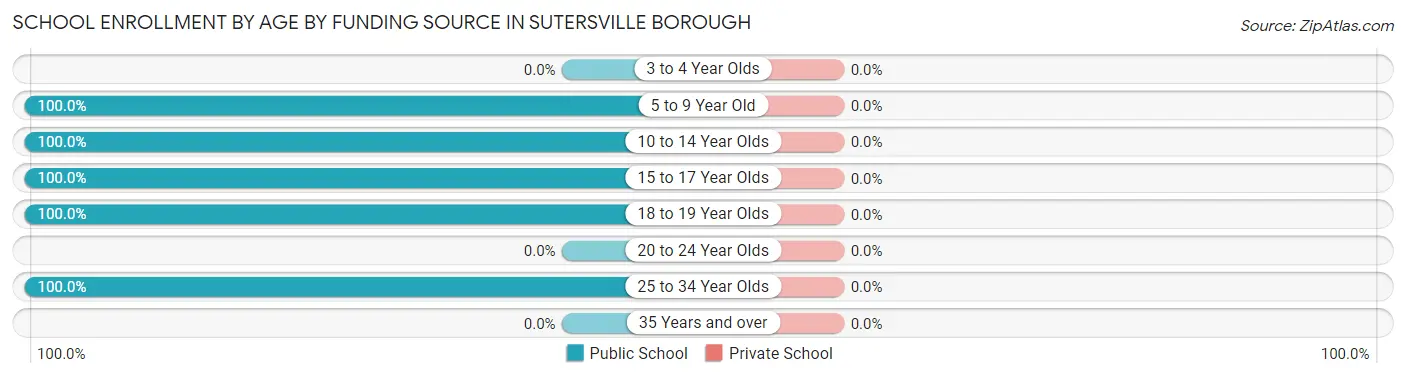
| Age Bracket | Public School | Private School |
| 3 to 4 Year Olds | 0 (0.0%) | 0 (0.0%) |
| 5 to 9 Year Old | 14 (100.0%) | 0 (0.0%) |
| 10 to 14 Year Olds | 22 (100.0%) | 0 (0.0%) |
| 15 to 17 Year Olds | 19 (100.0%) | 0 (0.0%) |
| 18 to 19 Year Olds | 4 (100.0%) | 0 (0.0%) |
| 20 to 24 Year Olds | 0 (0.0%) | 0 (0.0%) |
| 25 to 34 Year Olds | 10 (100.0%) | 0 (0.0%) |
| 35 Years and over | 0 (0.0%) | 0 (0.0%) |
| Total | 69 (100.0%) | 0 (0.0%) |
Educational Attainment by Field of Study in Sutersville borough
Education (21 | 30.4%), business (14 | 20.3%), bio, nature & agricultural (10 | 14.5%), literature & languages (5 | 7.2%), and engineering (4 | 5.8%) are the most common fields of study among 69 individuals in Sutersville borough who have obtained a bachelor's degree or higher.
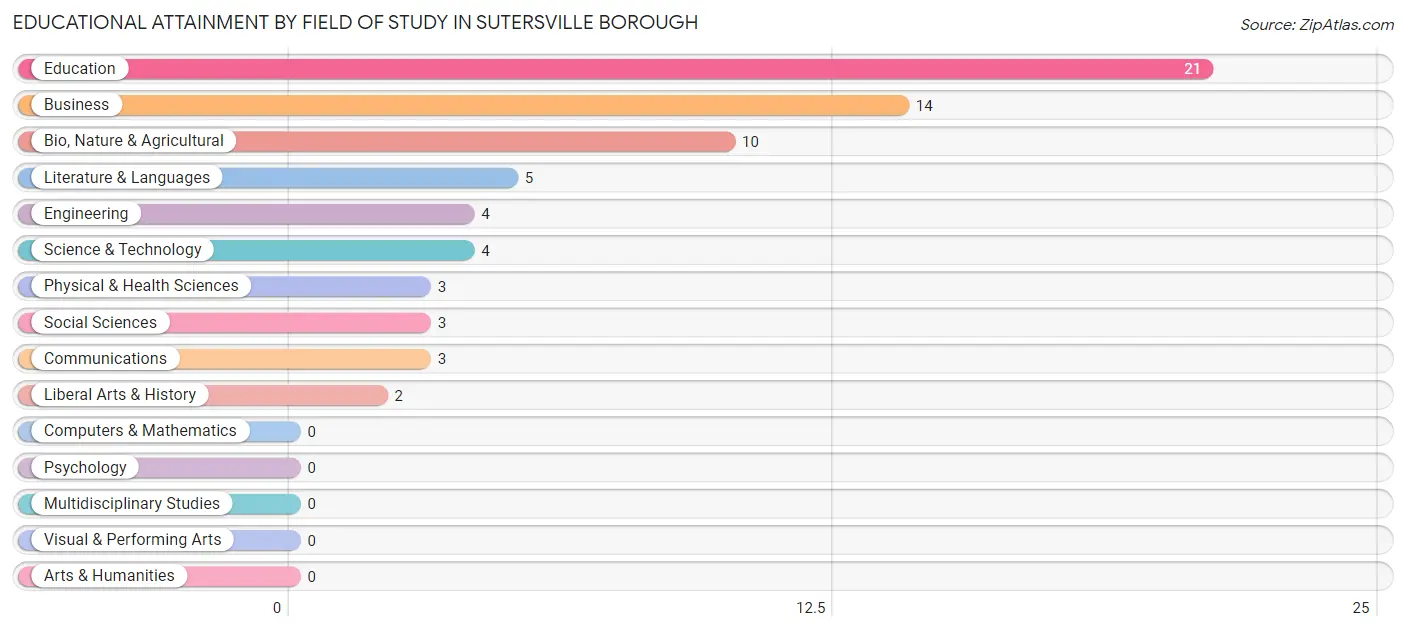
| Field of Study | # Graduates | % Graduates |
| Computers & Mathematics | 0 | 0.0% |
| Bio, Nature & Agricultural | 10 | 14.5% |
| Physical & Health Sciences | 3 | 4.3% |
| Psychology | 0 | 0.0% |
| Social Sciences | 3 | 4.3% |
| Engineering | 4 | 5.8% |
| Multidisciplinary Studies | 0 | 0.0% |
| Science & Technology | 4 | 5.8% |
| Business | 14 | 20.3% |
| Education | 21 | 30.4% |
| Literature & Languages | 5 | 7.2% |
| Liberal Arts & History | 2 | 2.9% |
| Visual & Performing Arts | 0 | 0.0% |
| Communications | 3 | 4.3% |
| Arts & Humanities | 0 | 0.0% |
| Total | 69 | 100.0% |
Transportation & Commute in Sutersville borough
Vehicle Availability by Sex in Sutersville borough
The most prevalent vehicle ownership categories in Sutersville borough are males with 2 vehicles (50, accounting for 51.5%) and females with 2 vehicles (69, making up 41.7%).
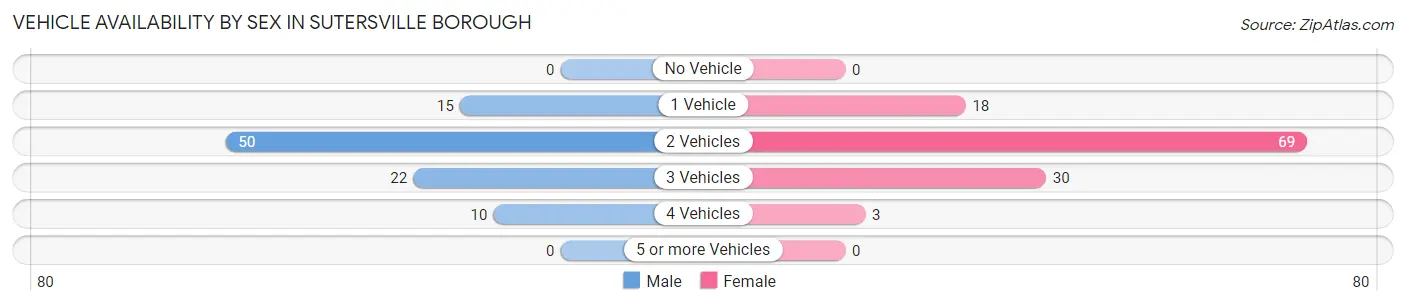
| Vehicles Available | Male | Female |
| No Vehicle | 0 (0.0%) | 0 (0.0%) |
| 1 Vehicle | 15 (15.5%) | 18 (15.0%) |
| 2 Vehicles | 50 (51.5%) | 69 (57.5%) |
| 3 Vehicles | 22 (22.7%) | 30 (25.0%) |
| 4 Vehicles | 10 (10.3%) | 3 (2.5%) |
| 5 or more Vehicles | 0 (0.0%) | 0 (0.0%) |
| Total | 97 (100.0%) | 120 (100.0%) |
Commute Time in Sutersville borough
The most frequently occuring commute durations in Sutersville borough are 20 to 24 minutes (72 commuters, 35.6%), 25 to 29 minutes (22 commuters, 10.9%), and 45 to 59 minutes (21 commuters, 10.4%).
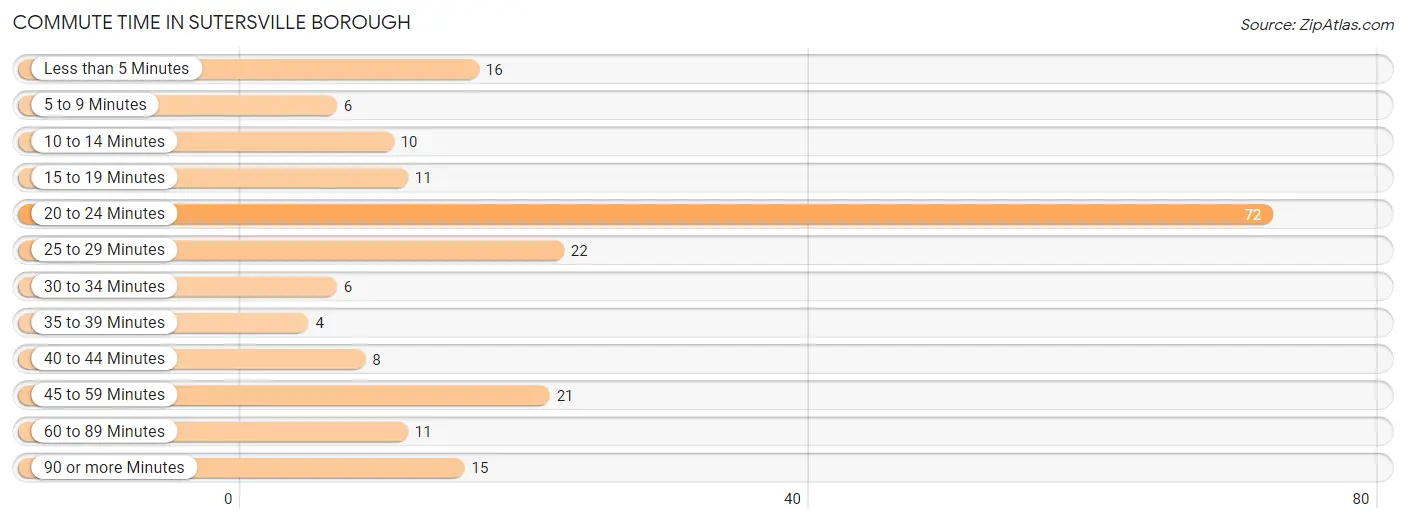
| Commute Time | # Commuters | % Commuters |
| Less than 5 Minutes | 16 | 7.9% |
| 5 to 9 Minutes | 6 | 3.0% |
| 10 to 14 Minutes | 10 | 5.0% |
| 15 to 19 Minutes | 11 | 5.4% |
| 20 to 24 Minutes | 72 | 35.6% |
| 25 to 29 Minutes | 22 | 10.9% |
| 30 to 34 Minutes | 6 | 3.0% |
| 35 to 39 Minutes | 4 | 2.0% |
| 40 to 44 Minutes | 8 | 4.0% |
| 45 to 59 Minutes | 21 | 10.4% |
| 60 to 89 Minutes | 11 | 5.4% |
| 90 or more Minutes | 15 | 7.4% |
Commute Time by Sex in Sutersville borough
The most common commute times in Sutersville borough are 20 to 24 minutes (37 commuters, 39.8%) for males and 20 to 24 minutes (35 commuters, 32.1%) for females.
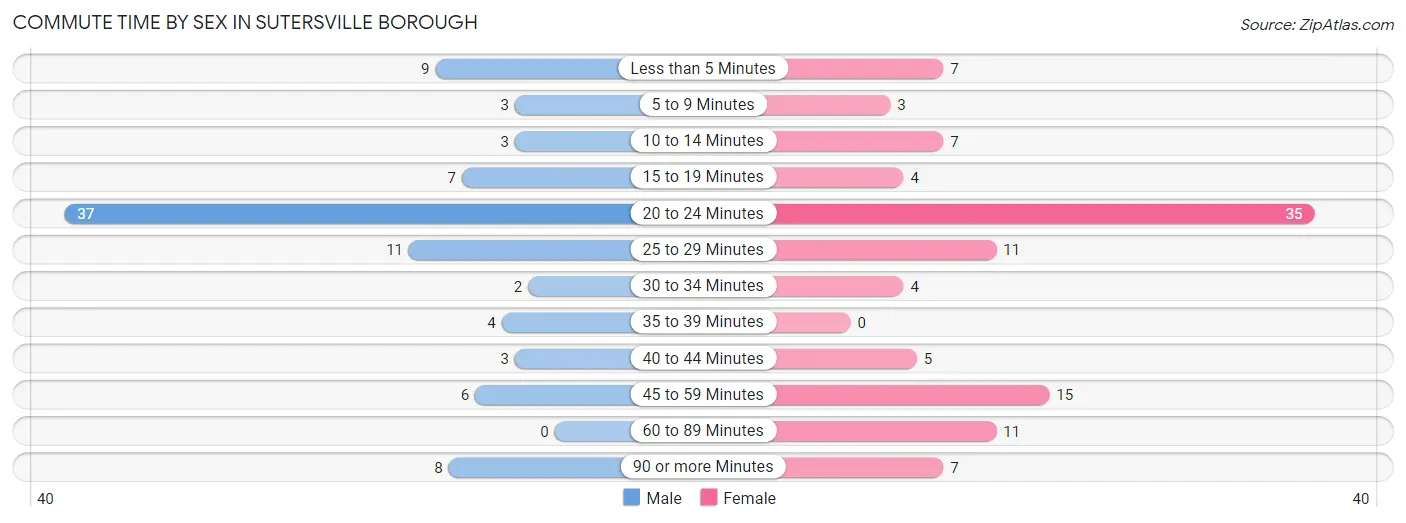
| Commute Time | Male | Female |
| Less than 5 Minutes | 9 (9.7%) | 7 (6.4%) |
| 5 to 9 Minutes | 3 (3.2%) | 3 (2.8%) |
| 10 to 14 Minutes | 3 (3.2%) | 7 (6.4%) |
| 15 to 19 Minutes | 7 (7.5%) | 4 (3.7%) |
| 20 to 24 Minutes | 37 (39.8%) | 35 (32.1%) |
| 25 to 29 Minutes | 11 (11.8%) | 11 (10.1%) |
| 30 to 34 Minutes | 2 (2.1%) | 4 (3.7%) |
| 35 to 39 Minutes | 4 (4.3%) | 0 (0.0%) |
| 40 to 44 Minutes | 3 (3.2%) | 5 (4.6%) |
| 45 to 59 Minutes | 6 (6.5%) | 15 (13.8%) |
| 60 to 89 Minutes | 0 (0.0%) | 11 (10.1%) |
| 90 or more Minutes | 8 (8.6%) | 7 (6.4%) |
Time of Departure to Work by Sex in Sutersville borough
The most frequent times of departure to work in Sutersville borough are 6:00 AM to 6:29 AM (33, 35.5%) for males and 7:30 AM to 7:59 AM (29, 26.6%) for females.
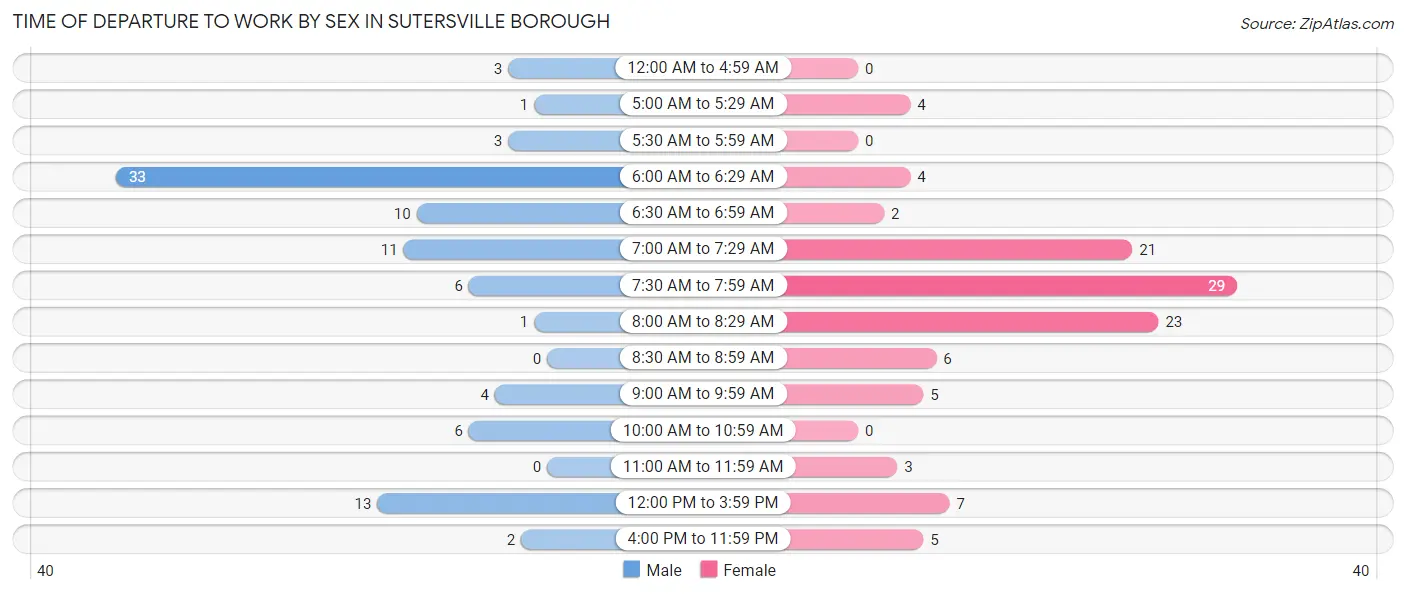
| Time of Departure | Male | Female |
| 12:00 AM to 4:59 AM | 3 (3.2%) | 0 (0.0%) |
| 5:00 AM to 5:29 AM | 1 (1.1%) | 4 (3.7%) |
| 5:30 AM to 5:59 AM | 3 (3.2%) | 0 (0.0%) |
| 6:00 AM to 6:29 AM | 33 (35.5%) | 4 (3.7%) |
| 6:30 AM to 6:59 AM | 10 (10.7%) | 2 (1.8%) |
| 7:00 AM to 7:29 AM | 11 (11.8%) | 21 (19.3%) |
| 7:30 AM to 7:59 AM | 6 (6.5%) | 29 (26.6%) |
| 8:00 AM to 8:29 AM | 1 (1.1%) | 23 (21.1%) |
| 8:30 AM to 8:59 AM | 0 (0.0%) | 6 (5.5%) |
| 9:00 AM to 9:59 AM | 4 (4.3%) | 5 (4.6%) |
| 10:00 AM to 10:59 AM | 6 (6.5%) | 0 (0.0%) |
| 11:00 AM to 11:59 AM | 0 (0.0%) | 3 (2.8%) |
| 12:00 PM to 3:59 PM | 13 (14.0%) | 7 (6.4%) |
| 4:00 PM to 11:59 PM | 2 (2.1%) | 5 (4.6%) |
| Total | 93 (100.0%) | 109 (100.0%) |
Housing Occupancy in Sutersville borough
Occupancy by Ownership in Sutersville borough
Of the total 228 dwellings in Sutersville borough, owner-occupied units account for 201 (88.2%), while renter-occupied units make up 27 (11.8%).
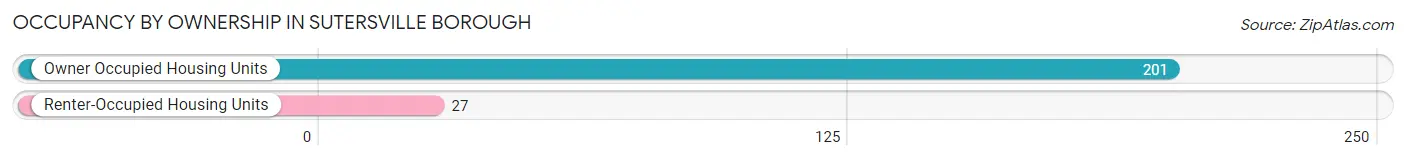
| Occupancy | # Housing Units | % Housing Units |
| Owner Occupied Housing Units | 201 | 88.2% |
| Renter-Occupied Housing Units | 27 | 11.8% |
| Total Occupied Housing Units | 228 | 100.0% |
Occupancy by Household Size in Sutersville borough
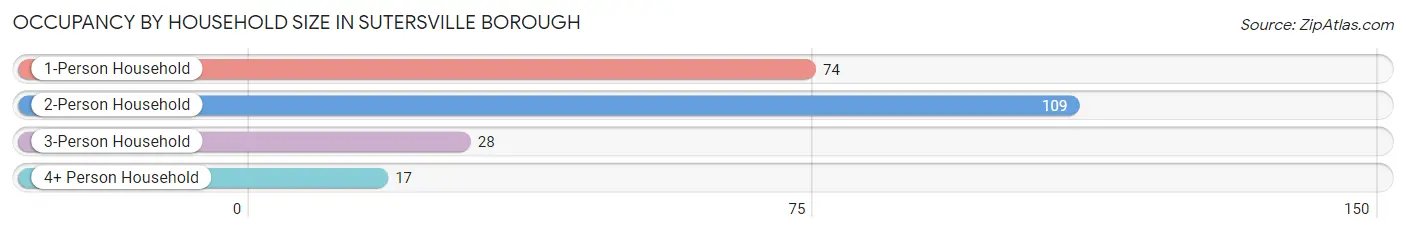
| Household Size | # Housing Units | % Housing Units |
| 1-Person Household | 74 | 32.5% |
| 2-Person Household | 109 | 47.8% |
| 3-Person Household | 28 | 12.3% |
| 4+ Person Household | 17 | 7.5% |
| Total Housing Units | 228 | 100.0% |
Occupancy by Ownership by Household Size in Sutersville borough
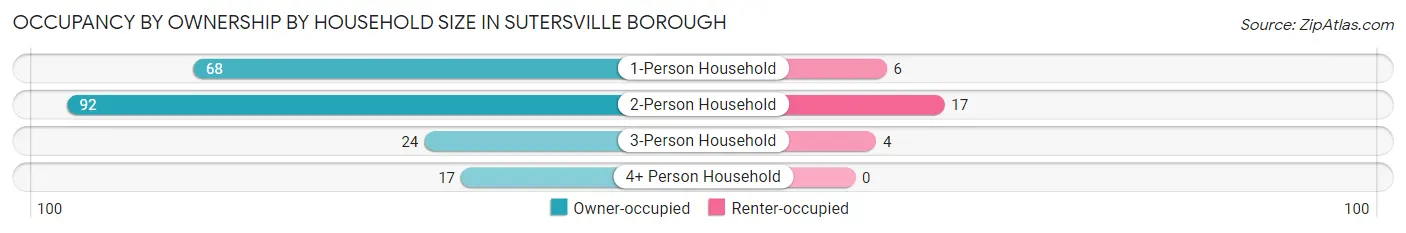
| Household Size | Owner-occupied | Renter-occupied |
| 1-Person Household | 68 (91.9%) | 6 (8.1%) |
| 2-Person Household | 92 (84.4%) | 17 (15.6%) |
| 3-Person Household | 24 (85.7%) | 4 (14.3%) |
| 4+ Person Household | 17 (100.0%) | 0 (0.0%) |
| Total Housing Units | 201 (88.2%) | 27 (11.8%) |
Occupancy by Educational Attainment in Sutersville borough
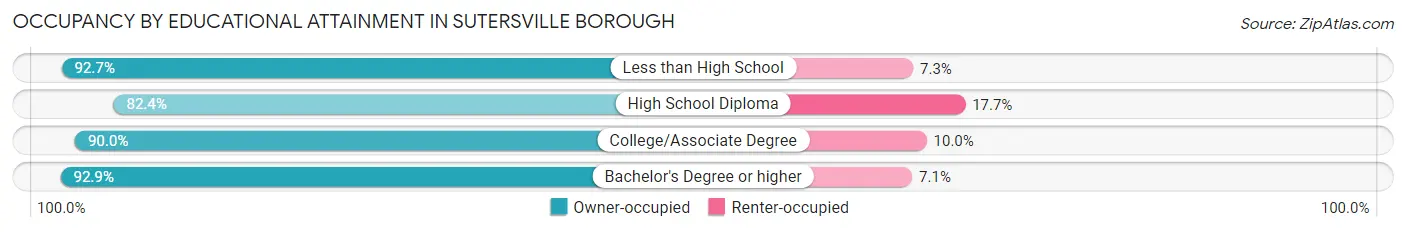
| Household Size | Owner-occupied | Renter-occupied |
| Less than High School | 38 (92.7%) | 3 (7.3%) |
| High School Diploma | 70 (82.4%) | 15 (17.6%) |
| College/Associate Degree | 54 (90.0%) | 6 (10.0%) |
| Bachelor's Degree or higher | 39 (92.9%) | 3 (7.1%) |
Occupancy by Age of Householder in Sutersville borough
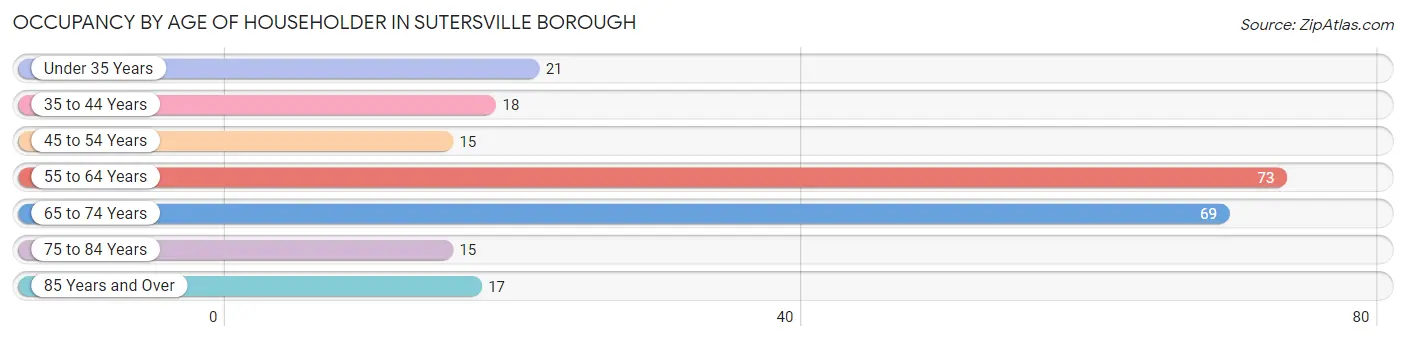
| Age Bracket | # Households | % Households |
| Under 35 Years | 21 | 9.2% |
| 35 to 44 Years | 18 | 7.9% |
| 45 to 54 Years | 15 | 6.6% |
| 55 to 64 Years | 73 | 32.0% |
| 65 to 74 Years | 69 | 30.3% |
| 75 to 84 Years | 15 | 6.6% |
| 85 Years and Over | 17 | 7.5% |
| Total | 228 | 100.0% |
Housing Finances in Sutersville borough
Median Income by Occupancy in Sutersville borough
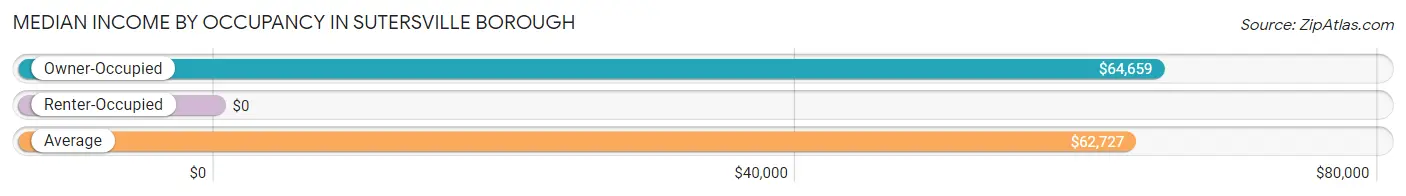
| Occupancy Type | # Households | Median Income |
| Owner-Occupied | 201 (88.2%) | $64,659 |
| Renter-Occupied | 27 (11.8%) | $0 |
| Average | 228 (100.0%) | $62,727 |
Occupancy by Householder Income Bracket in Sutersville borough
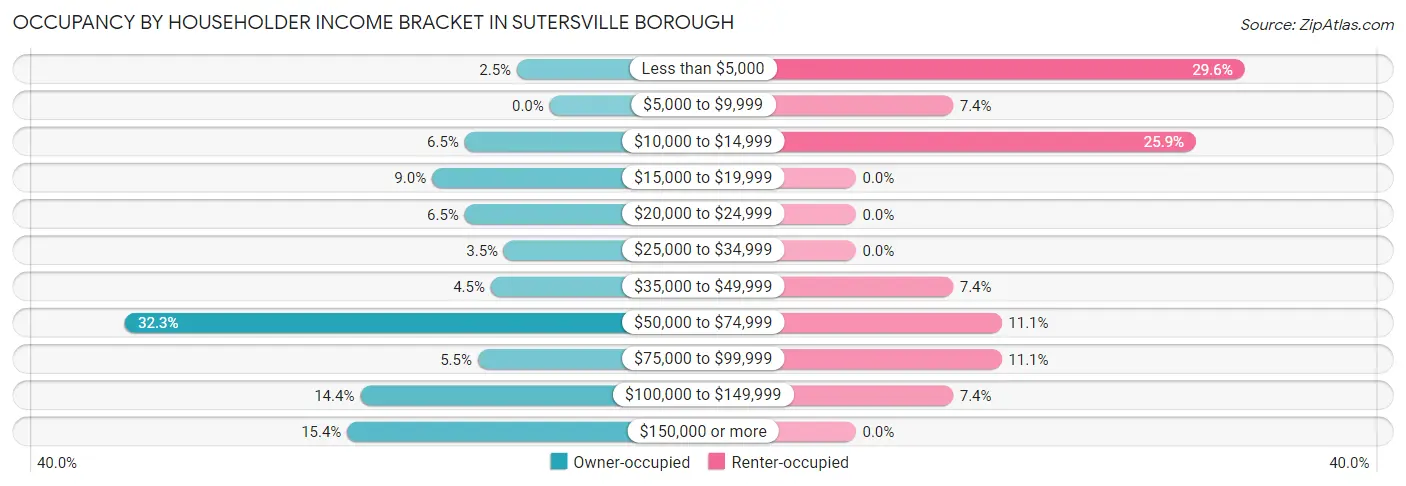
| Income Bracket | Owner-occupied | Renter-occupied |
| Less than $5,000 | 5 (2.5%) | 8 (29.6%) |
| $5,000 to $9,999 | 0 (0.0%) | 2 (7.4%) |
| $10,000 to $14,999 | 13 (6.5%) | 7 (25.9%) |
| $15,000 to $19,999 | 18 (9.0%) | 0 (0.0%) |
| $20,000 to $24,999 | 13 (6.5%) | 0 (0.0%) |
| $25,000 to $34,999 | 7 (3.5%) | 0 (0.0%) |
| $35,000 to $49,999 | 9 (4.5%) | 2 (7.4%) |
| $50,000 to $74,999 | 65 (32.3%) | 3 (11.1%) |
| $75,000 to $99,999 | 11 (5.5%) | 3 (11.1%) |
| $100,000 to $149,999 | 29 (14.4%) | 2 (7.4%) |
| $150,000 or more | 31 (15.4%) | 0 (0.0%) |
| Total | 201 (100.0%) | 27 (100.0%) |
Monthly Housing Cost Tiers in Sutersville borough
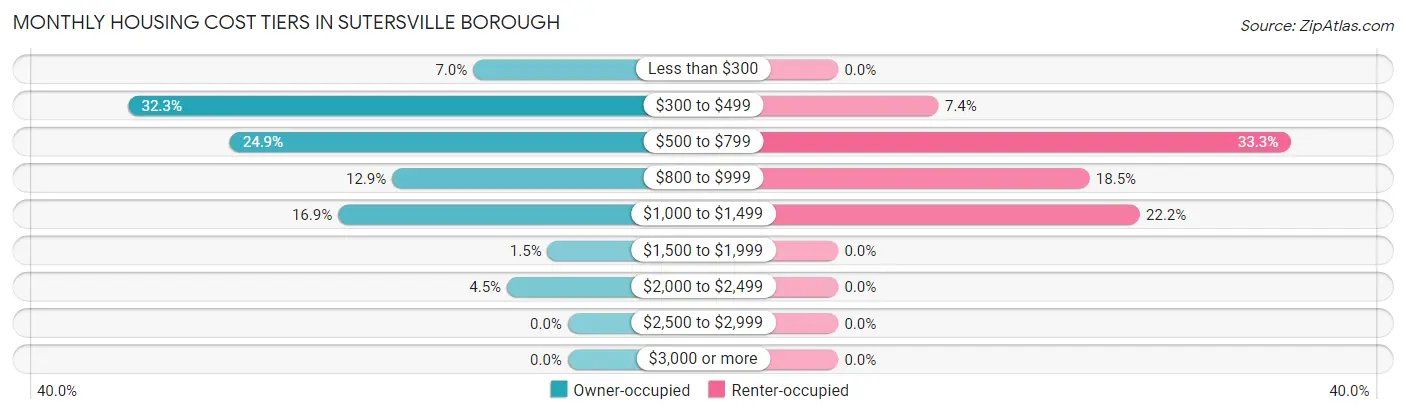
| Monthly Cost | Owner-occupied | Renter-occupied |
| Less than $300 | 14 (7.0%) | 0 (0.0%) |
| $300 to $499 | 65 (32.3%) | 2 (7.4%) |
| $500 to $799 | 50 (24.9%) | 9 (33.3%) |
| $800 to $999 | 26 (12.9%) | 5 (18.5%) |
| $1,000 to $1,499 | 34 (16.9%) | 6 (22.2%) |
| $1,500 to $1,999 | 3 (1.5%) | 0 (0.0%) |
| $2,000 to $2,499 | 9 (4.5%) | 0 (0.0%) |
| $2,500 to $2,999 | 0 (0.0%) | 0 (0.0%) |
| $3,000 or more | 0 (0.0%) | 0 (0.0%) |
| Total | 201 (100.0%) | 27 (100.0%) |
Physical Housing Characteristics in Sutersville borough
Housing Structures in Sutersville borough
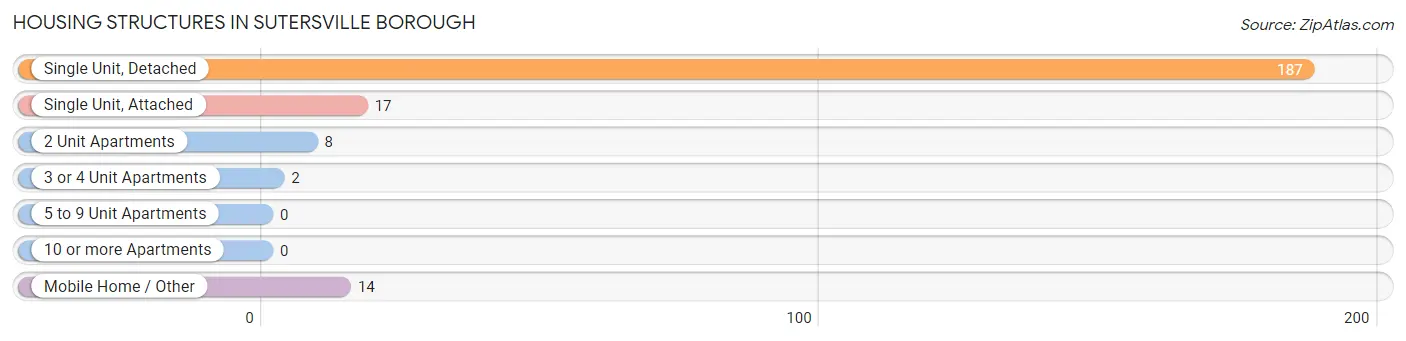
| Structure Type | # Housing Units | % Housing Units |
| Single Unit, Detached | 187 | 82.0% |
| Single Unit, Attached | 17 | 7.5% |
| 2 Unit Apartments | 8 | 3.5% |
| 3 or 4 Unit Apartments | 2 | 0.9% |
| 5 to 9 Unit Apartments | 0 | 0.0% |
| 10 or more Apartments | 0 | 0.0% |
| Mobile Home / Other | 14 | 6.1% |
| Total | 228 | 100.0% |
Housing Structures by Occupancy in Sutersville borough
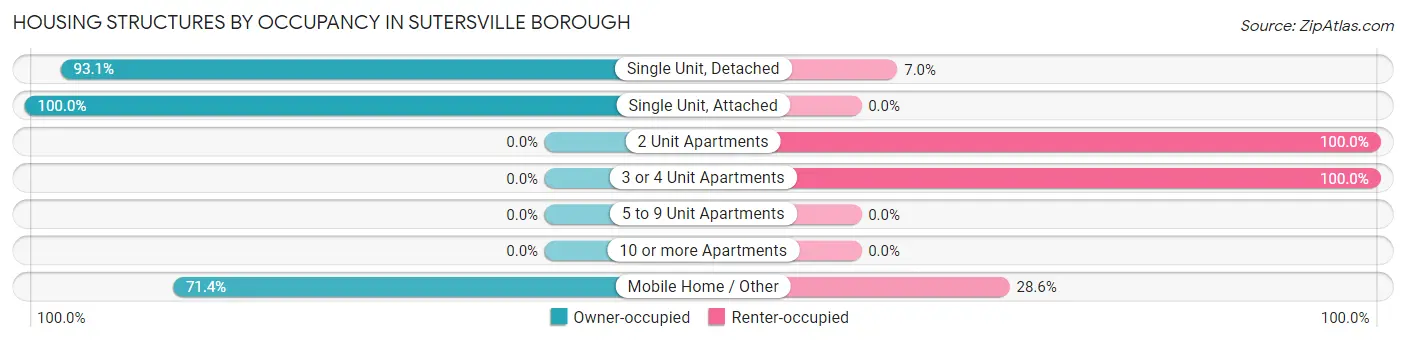
| Structure Type | Owner-occupied | Renter-occupied |
| Single Unit, Detached | 174 (93.0%) | 13 (7.0%) |
| Single Unit, Attached | 17 (100.0%) | 0 (0.0%) |
| 2 Unit Apartments | 0 (0.0%) | 8 (100.0%) |
| 3 or 4 Unit Apartments | 0 (0.0%) | 2 (100.0%) |
| 5 to 9 Unit Apartments | 0 (0.0%) | 0 (0.0%) |
| 10 or more Apartments | 0 (0.0%) | 0 (0.0%) |
| Mobile Home / Other | 10 (71.4%) | 4 (28.6%) |
| Total | 201 (88.2%) | 27 (11.8%) |
Housing Structures by Number of Rooms in Sutersville borough

| Number of Rooms | Owner-occupied | Renter-occupied |
| 1 Room | 0 (0.0%) | 0 (0.0%) |
| 2 or 3 Rooms | 2 (1.0%) | 3 (11.1%) |
| 4 or 5 Rooms | 82 (40.8%) | 10 (37.0%) |
| 6 or 7 Rooms | 81 (40.3%) | 11 (40.7%) |
| 8 or more Rooms | 36 (17.9%) | 3 (11.1%) |
| Total | 201 (100.0%) | 27 (100.0%) |
Housing Structure by Heating Type in Sutersville borough
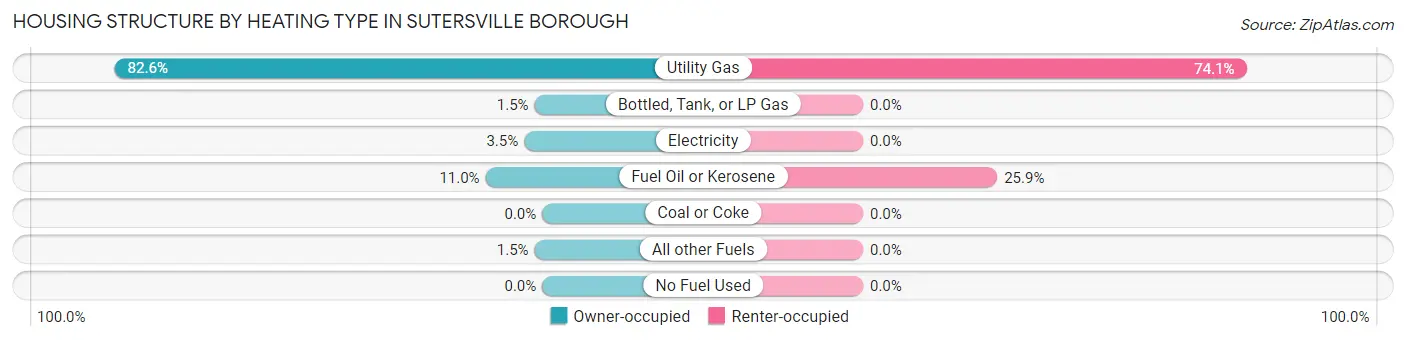
| Heating Type | Owner-occupied | Renter-occupied |
| Utility Gas | 166 (82.6%) | 20 (74.1%) |
| Bottled, Tank, or LP Gas | 3 (1.5%) | 0 (0.0%) |
| Electricity | 7 (3.5%) | 0 (0.0%) |
| Fuel Oil or Kerosene | 22 (11.0%) | 7 (25.9%) |
| Coal or Coke | 0 (0.0%) | 0 (0.0%) |
| All other Fuels | 3 (1.5%) | 0 (0.0%) |
| No Fuel Used | 0 (0.0%) | 0 (0.0%) |
| Total | 201 (100.0%) | 27 (100.0%) |
Household Vehicle Usage in Sutersville borough
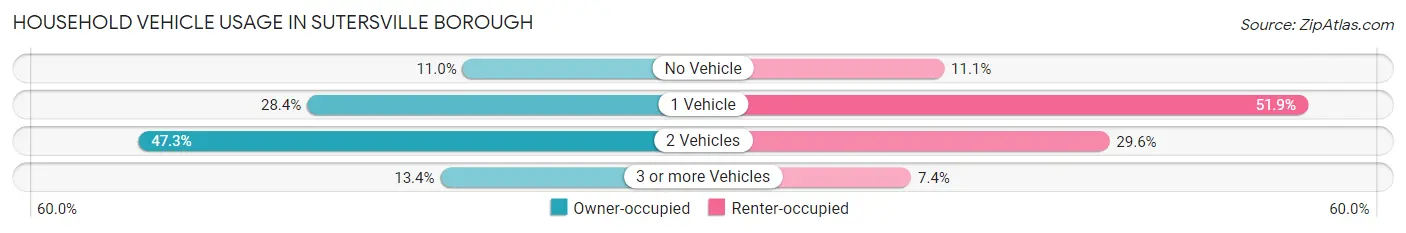
| Vehicles per Household | Owner-occupied | Renter-occupied |
| No Vehicle | 22 (11.0%) | 3 (11.1%) |
| 1 Vehicle | 57 (28.4%) | 14 (51.8%) |
| 2 Vehicles | 95 (47.3%) | 8 (29.6%) |
| 3 or more Vehicles | 27 (13.4%) | 2 (7.4%) |
| Total | 201 (100.0%) | 27 (100.0%) |
Real Estate & Mortgages in Sutersville borough
Real Estate and Mortgage Overview in Sutersville borough
| Characteristic | Without Mortgage | With Mortgage |
| Housing Units | 132 | 69 |
| Median Property Value | $107,100 | $126,600 |
| Median Household Income | $64,091 | $7 |
| Monthly Housing Costs | $475 | $0 |
| Real Estate Taxes | $1,578 | $0 |
Property Value by Mortgage Status in Sutersville borough
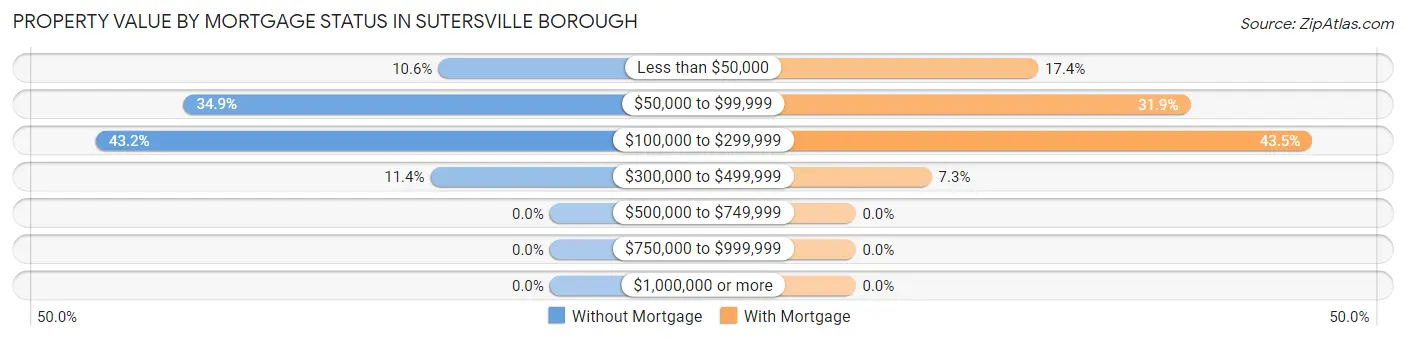
| Property Value | Without Mortgage | With Mortgage |
| Less than $50,000 | 14 (10.6%) | 12 (17.4%) |
| $50,000 to $99,999 | 46 (34.8%) | 22 (31.9%) |
| $100,000 to $299,999 | 57 (43.2%) | 30 (43.5%) |
| $300,000 to $499,999 | 15 (11.4%) | 5 (7.2%) |
| $500,000 to $749,999 | 0 (0.0%) | 0 (0.0%) |
| $750,000 to $999,999 | 0 (0.0%) | 0 (0.0%) |
| $1,000,000 or more | 0 (0.0%) | 0 (0.0%) |
| Total | 132 (100.0%) | 69 (100.0%) |
Household Income by Mortgage Status in Sutersville borough
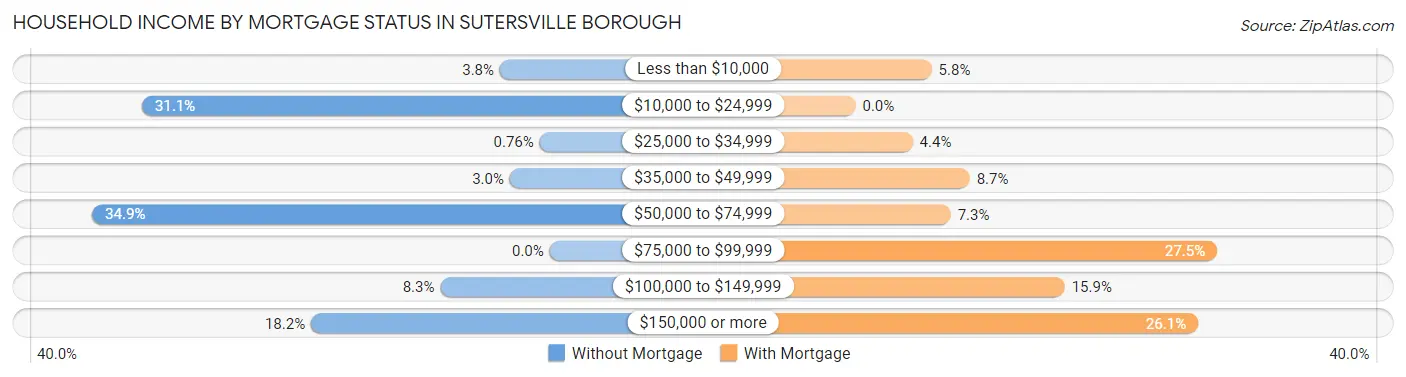
| Household Income | Without Mortgage | With Mortgage |
| Less than $10,000 | 5 (3.8%) | 4 (5.8%) |
| $10,000 to $24,999 | 41 (31.1%) | 0 (0.0%) |
| $25,000 to $34,999 | 1 (0.8%) | 3 (4.3%) |
| $35,000 to $49,999 | 4 (3.0%) | 6 (8.7%) |
| $50,000 to $74,999 | 46 (34.8%) | 5 (7.2%) |
| $75,000 to $99,999 | 0 (0.0%) | 19 (27.5%) |
| $100,000 to $149,999 | 11 (8.3%) | 11 (15.9%) |
| $150,000 or more | 24 (18.2%) | 18 (26.1%) |
| Total | 132 (100.0%) | 69 (100.0%) |
Property Value to Household Income Ratio in Sutersville borough
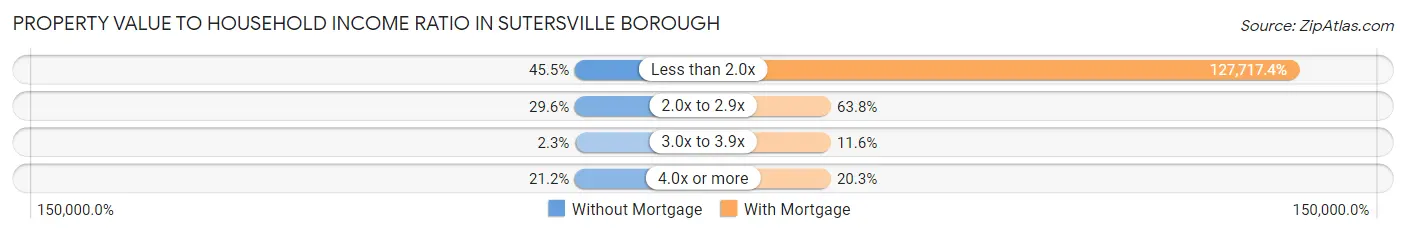
| Value-to-Income Ratio | Without Mortgage | With Mortgage |
| Less than 2.0x | 60 (45.5%) | 88,125 (127,717.4%) |
| 2.0x to 2.9x | 39 (29.5%) | 44 (63.8%) |
| 3.0x to 3.9x | 3 (2.3%) | 8 (11.6%) |
| 4.0x or more | 28 (21.2%) | 14 (20.3%) |
| Total | 132 (100.0%) | 69 (100.0%) |
Real Estate Taxes by Mortgage Status in Sutersville borough
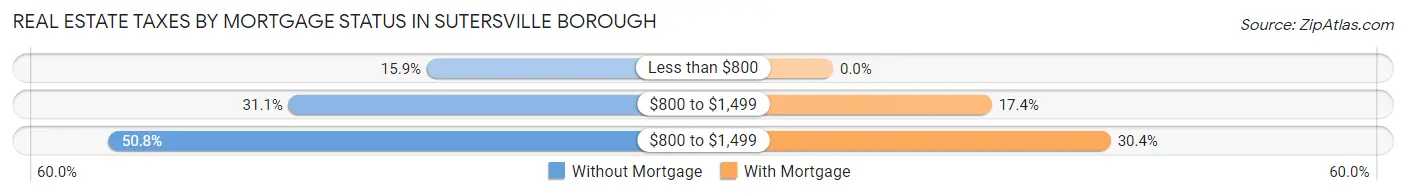
| Property Taxes | Without Mortgage | With Mortgage |
| Less than $800 | 21 (15.9%) | 0 (0.0%) |
| $800 to $1,499 | 41 (31.1%) | 12 (17.4%) |
| $800 to $1,499 | 67 (50.8%) | 21 (30.4%) |
| Total | 132 (100.0%) | 69 (100.0%) |
Health & Disability in Sutersville borough
Health Insurance Coverage by Age in Sutersville borough
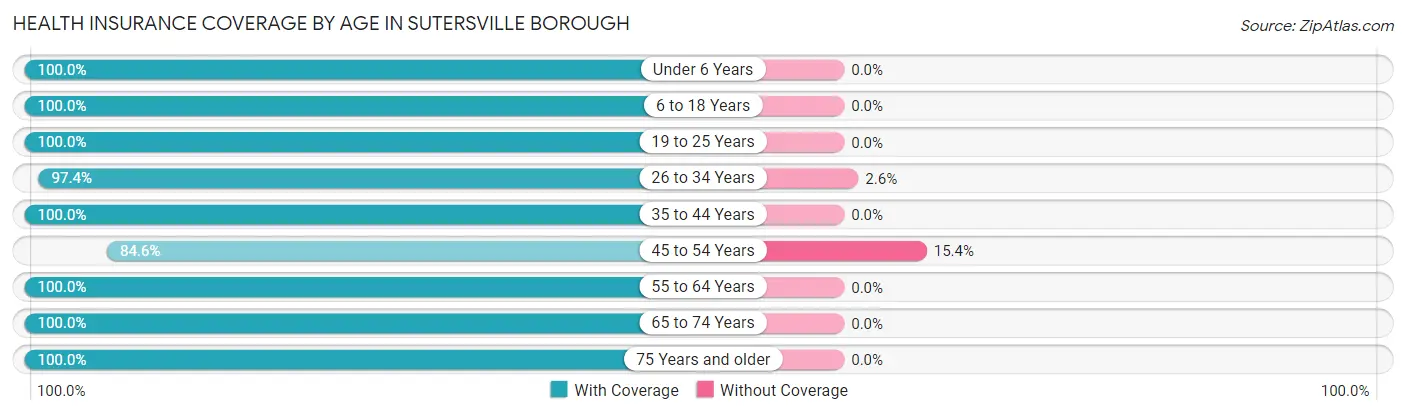
| Age Bracket | With Coverage | Without Coverage |
| Under 6 Years | 12 (100.0%) | 0 (0.0%) |
| 6 to 18 Years | 59 (100.0%) | 0 (0.0%) |
| 19 to 25 Years | 3 (100.0%) | 0 (0.0%) |
| 26 to 34 Years | 37 (97.4%) | 1 (2.6%) |
| 35 to 44 Years | 44 (100.0%) | 0 (0.0%) |
| 45 to 54 Years | 33 (84.6%) | 6 (15.4%) |
| 55 to 64 Years | 117 (100.0%) | 0 (0.0%) |
| 65 to 74 Years | 90 (100.0%) | 0 (0.0%) |
| 75 Years and older | 42 (100.0%) | 0 (0.0%) |
| Total | 437 (98.4%) | 7 (1.6%) |
Health Insurance Coverage by Citizenship Status in Sutersville borough
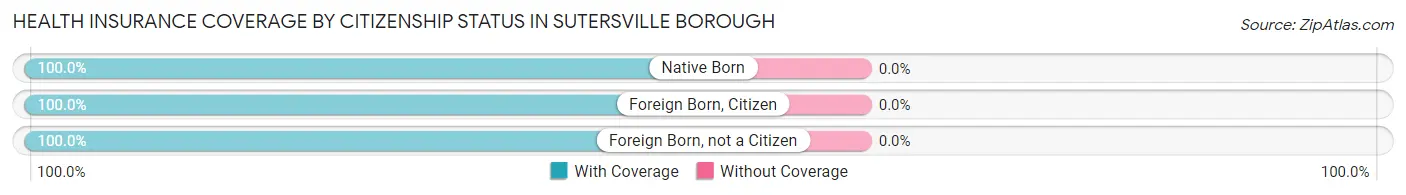
| Citizenship Status | With Coverage | Without Coverage |
| Native Born | 12 (100.0%) | 0 (0.0%) |
| Foreign Born, Citizen | 59 (100.0%) | 0 (0.0%) |
| Foreign Born, not a Citizen | 3 (100.0%) | 0 (0.0%) |
Health Insurance Coverage by Household Income in Sutersville borough
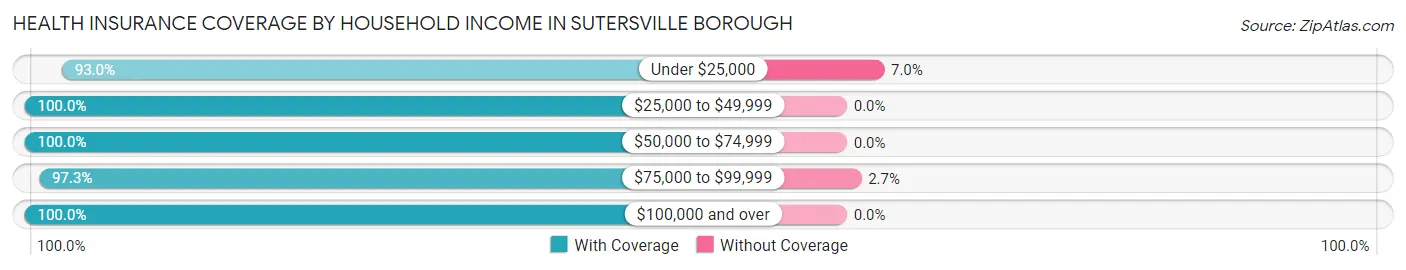
| Household Income | With Coverage | Without Coverage |
| Under $25,000 | 80 (93.0%) | 6 (7.0%) |
| $25,000 to $49,999 | 31 (100.0%) | 0 (0.0%) |
| $50,000 to $74,999 | 143 (100.0%) | 0 (0.0%) |
| $75,000 to $99,999 | 36 (97.3%) | 1 (2.7%) |
| $100,000 and over | 147 (100.0%) | 0 (0.0%) |
Public vs Private Health Insurance Coverage by Age in Sutersville borough
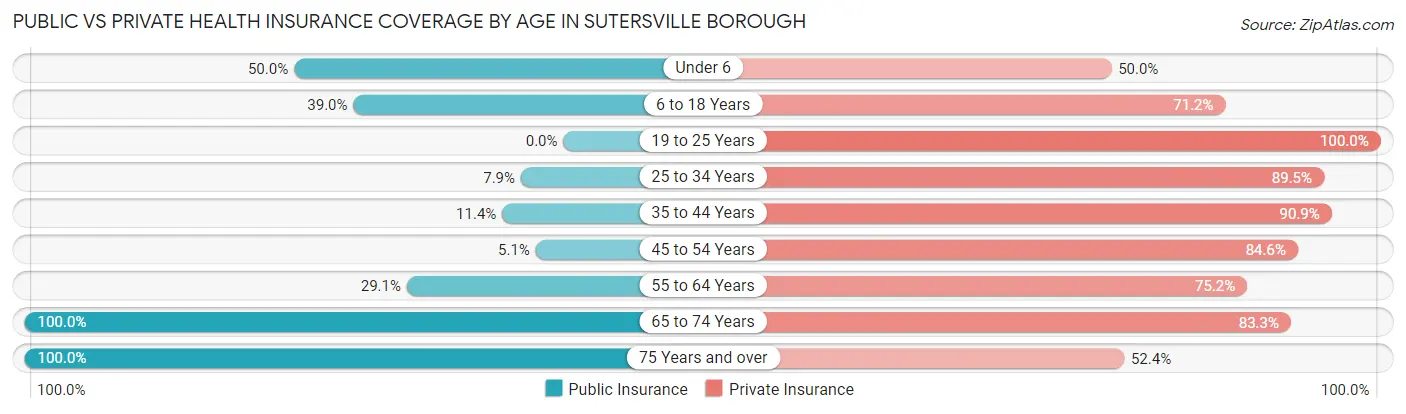
| Age Bracket | Public Insurance | Private Insurance |
| Under 6 | 6 (50.0%) | 6 (50.0%) |
| 6 to 18 Years | 23 (39.0%) | 42 (71.2%) |
| 19 to 25 Years | 0 (0.0%) | 3 (100.0%) |
| 25 to 34 Years | 3 (7.9%) | 34 (89.5%) |
| 35 to 44 Years | 5 (11.4%) | 40 (90.9%) |
| 45 to 54 Years | 2 (5.1%) | 33 (84.6%) |
| 55 to 64 Years | 34 (29.1%) | 88 (75.2%) |
| 65 to 74 Years | 90 (100.0%) | 75 (83.3%) |
| 75 Years and over | 42 (100.0%) | 22 (52.4%) |
| Total | 205 (46.2%) | 343 (77.2%) |
Disability Status by Sex by Age in Sutersville borough
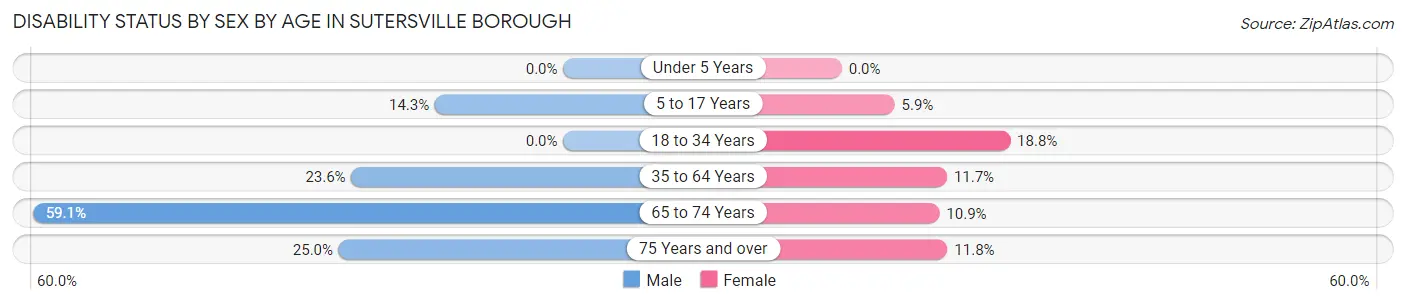
| Age Bracket | Male | Female |
| Under 5 Years | 0 (0.0%) | 0 (0.0%) |
| 5 to 17 Years | 3 (14.3%) | 2 (5.9%) |
| 18 to 34 Years | 0 (0.0%) | 3 (18.8%) |
| 35 to 64 Years | 21 (23.6%) | 13 (11.7%) |
| 65 to 74 Years | 26 (59.1%) | 5 (10.9%) |
| 75 Years and over | 2 (25.0%) | 4 (11.8%) |
Disability Class by Sex by Age in Sutersville borough
Disability Class: Hearing Difficulty
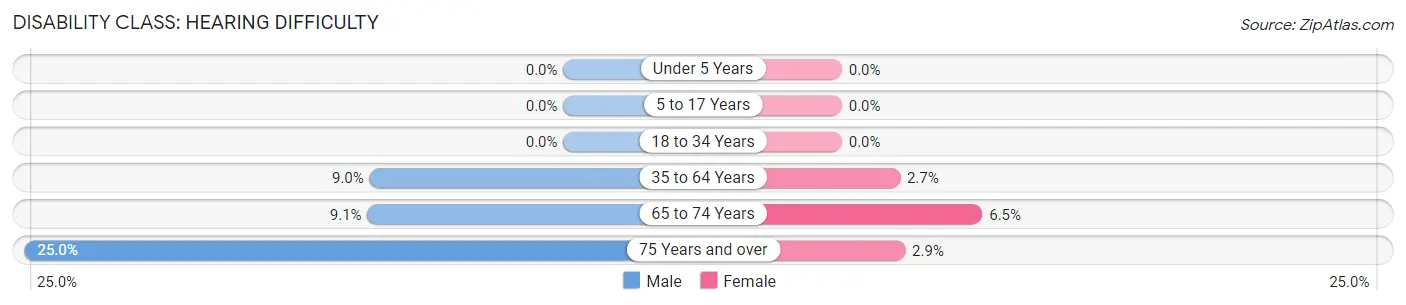
| Age Bracket | Male | Female |
| Under 5 Years | 0 (0.0%) | 0 (0.0%) |
| 5 to 17 Years | 0 (0.0%) | 0 (0.0%) |
| 18 to 34 Years | 0 (0.0%) | 0 (0.0%) |
| 35 to 64 Years | 8 (9.0%) | 3 (2.7%) |
| 65 to 74 Years | 4 (9.1%) | 3 (6.5%) |
| 75 Years and over | 2 (25.0%) | 1 (2.9%) |
Disability Class: Vision Difficulty
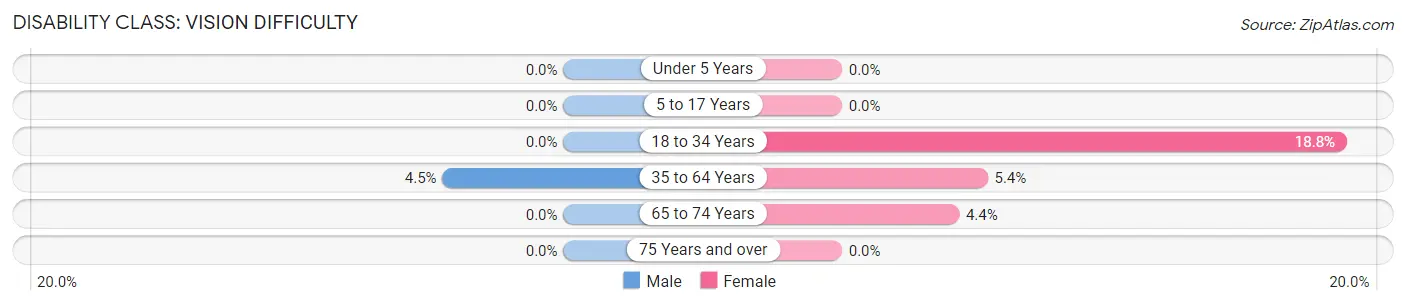
| Age Bracket | Male | Female |
| Under 5 Years | 0 (0.0%) | 0 (0.0%) |
| 5 to 17 Years | 0 (0.0%) | 0 (0.0%) |
| 18 to 34 Years | 0 (0.0%) | 3 (18.8%) |
| 35 to 64 Years | 4 (4.5%) | 6 (5.4%) |
| 65 to 74 Years | 0 (0.0%) | 2 (4.3%) |
| 75 Years and over | 0 (0.0%) | 0 (0.0%) |
Disability Class: Cognitive Difficulty
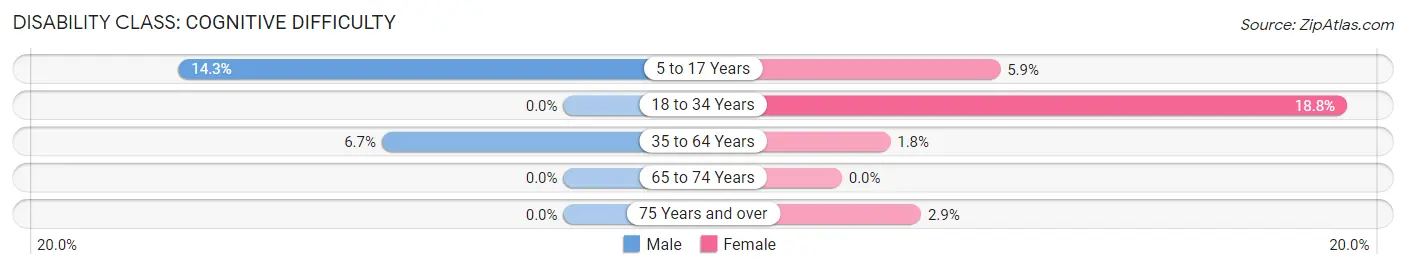
| Age Bracket | Male | Female |
| 5 to 17 Years | 3 (14.3%) | 2 (5.9%) |
| 18 to 34 Years | 0 (0.0%) | 3 (18.8%) |
| 35 to 64 Years | 6 (6.7%) | 2 (1.8%) |
| 65 to 74 Years | 0 (0.0%) | 0 (0.0%) |
| 75 Years and over | 0 (0.0%) | 1 (2.9%) |
Disability Class: Ambulatory Difficulty
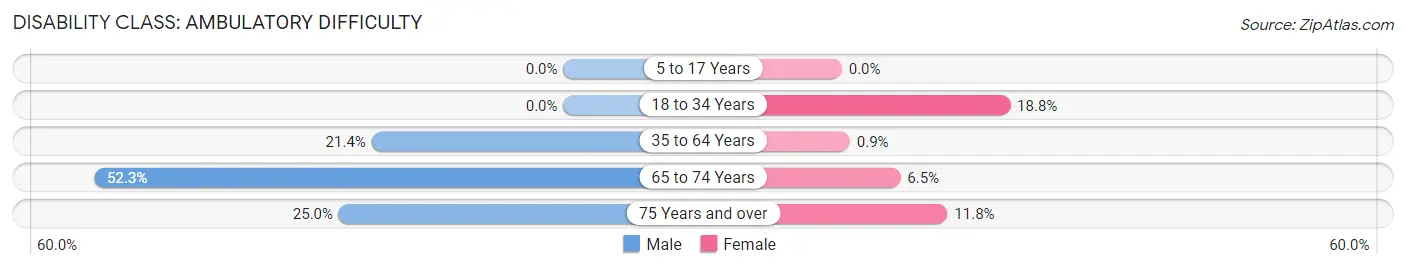
| Age Bracket | Male | Female |
| 5 to 17 Years | 0 (0.0%) | 0 (0.0%) |
| 18 to 34 Years | 0 (0.0%) | 3 (18.8%) |
| 35 to 64 Years | 19 (21.3%) | 1 (0.9%) |
| 65 to 74 Years | 23 (52.3%) | 3 (6.5%) |
| 75 Years and over | 2 (25.0%) | 4 (11.8%) |
Disability Class: Self-Care Difficulty
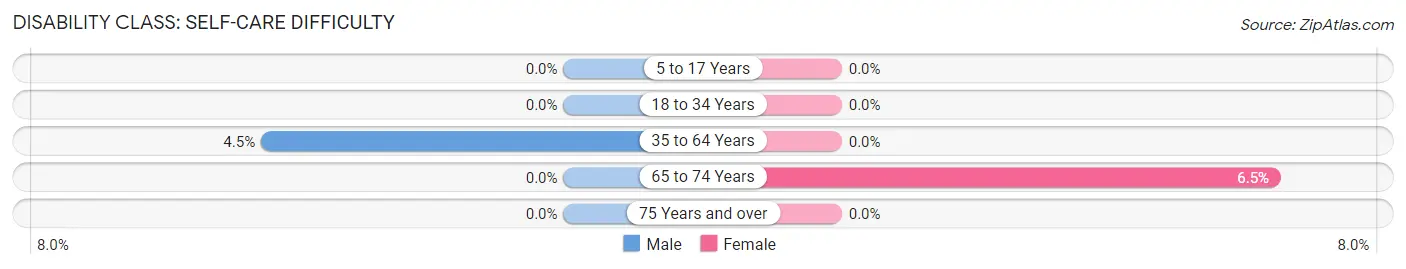
| Age Bracket | Male | Female |
| 5 to 17 Years | 0 (0.0%) | 0 (0.0%) |
| 18 to 34 Years | 0 (0.0%) | 0 (0.0%) |
| 35 to 64 Years | 4 (4.5%) | 0 (0.0%) |
| 65 to 74 Years | 0 (0.0%) | 3 (6.5%) |
| 75 Years and over | 0 (0.0%) | 0 (0.0%) |
Technology Access in Sutersville borough
Computing Device Access in Sutersville borough
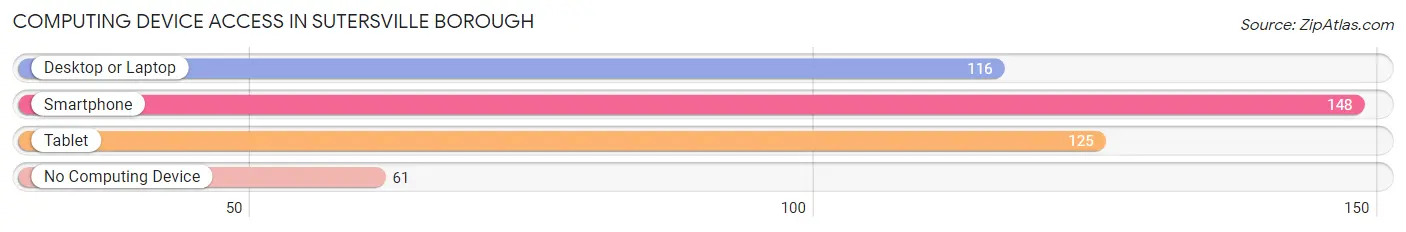
| Device Type | # Households | % Households |
| Desktop or Laptop | 116 | 50.9% |
| Smartphone | 148 | 64.9% |
| Tablet | 125 | 54.8% |
| No Computing Device | 61 | 26.8% |
| Total | 228 | 100.0% |
Internet Access in Sutersville borough
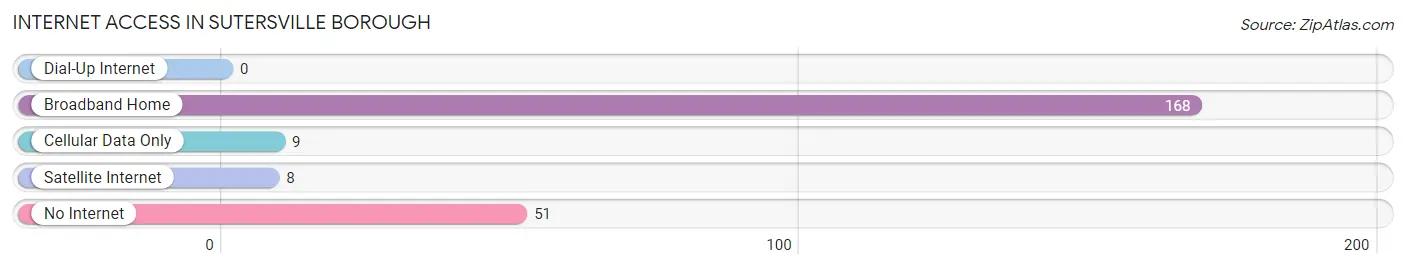
| Internet Type | # Households | % Households |
| Dial-Up Internet | 0 | 0.0% |
| Broadband Home | 168 | 73.7% |
| Cellular Data Only | 9 | 4.0% |
| Satellite Internet | 8 | 3.5% |
| No Internet | 51 | 22.4% |
| Total | 228 | 100.0% |
Sutersville borough Summary
Sutersville Borough is a small borough located in Westmoreland County, Pennsylvania. It is situated along the Youghiogheny River, approximately 25 miles southeast of Pittsburgh. The borough was founded in 1876 and is home to a population of approximately 1,000 people.
History
Sutersville Borough was founded in 1876 by John Suter, a local businessman. He purchased the land from the local Native American tribes and named the area after himself. The area was originally a farming community, but as the railroad was built in the late 1800s, the area began to develop into a small industrial town. The first industry to move into the area was the Sutersville Iron Works, which was established in 1881. The iron works provided jobs for many of the local residents and helped to spur the growth of the borough.
In the early 1900s, the borough began to experience a period of growth and development. The population increased from just over 500 in 1900 to nearly 1,000 by 1920. During this time, several new businesses were established, including a brickyard, a sawmill, and a coal mine. The borough also saw the construction of several new homes and buildings, including a school, a post office, and a library.
Geography
Sutersville Borough is located in Westmoreland County, Pennsylvania. It is situated along the Youghiogheny River, approximately 25 miles southeast of Pittsburgh. The borough covers an area of 0.6 square miles and is bordered by the boroughs of West Newton, North Huntingdon, and Irwin. The terrain of the borough is mostly flat, with some rolling hills in the northern part of the borough.
Economy
The economy of Sutersville Borough is largely based on the service industry. The borough is home to several small businesses, including restaurants, retail stores, and professional services. The borough also has a few manufacturing companies, including a steel mill and a brickyard. The borough is also home to a small airport, which serves the local area.
Demographics
As of the 2010 census, the population of Sutersville Borough was 1,039. The racial makeup of the borough was 97.3% White, 0.9% African American, 0.3% Native American, 0.3% Asian, and 0.9% from other races. The median household income was $41,250, and the median family income was $50,000. The per capita income was $20,845.
Conclusion
Sutersville Borough is a small borough located in Westmoreland County, Pennsylvania. It was founded in 1876 and is home to a population of approximately 1,000 people. The economy of the borough is largely based on the service industry, and the borough is home to several small businesses, manufacturing companies, and a small airport. The population of the borough is mostly White, with a small percentage of African American, Native American, and Asian residents. The median household income is $41,250, and the median family income is $50,000.
Common Questions
What is the Total Population of Sutersville borough?
Total Population of Sutersville borough is 444.
What is the Total Male Population of Sutersville borough?
Total Male Population of Sutersville borough is 197.
What is the Total Female Population of Sutersville borough?
Total Female Population of Sutersville borough is 247.
What is the Ratio of Males per 100 Females in Sutersville borough?
There are 79.76 Males per 100 Females in Sutersville borough.
What is the Ratio of Females per 100 Males in Sutersville borough?
There are 125.38 Females per 100 Males in Sutersville borough.
What is the Median Population Age in Sutersville borough?
Median Population Age in Sutersville borough is 56.3 Years.
What is the Average Family Size in Sutersville borough
Average Family Size in Sutersville borough is 2.4 People.
What is the Average Household Size in Sutersville borough
Average Household Size in Sutersville borough is 1.9 People.
What is Per Capita Income in Sutersville borough?
Per Capita income in Sutersville borough is $59,476.
What is the Median Family Income in Sutersville borough?
Median Family Income in Sutersville borough is $70,357.
What is the Median Household income in Sutersville borough?
Median Household Income in Sutersville borough is $62,727.
What is Income or Wage Gap in Sutersville borough?
Income or Wage Gap in Sutersville borough is 41.0%.
Women in Sutersville borough earn 59.0 cents for every dollar earned by a man.
What is Inequality or Gini Index in Sutersville borough?
Inequality or Gini Index in Sutersville borough is 0.62.
How Large is the Labor Force in Sutersville borough?
There are 226 People in the Labor Forcein in Sutersville borough.
What is the Percentage of People in the Labor Force in Sutersville borough?
57.4% of People are in the Labor Force in Sutersville borough.
What is the Unemployment Rate in Sutersville borough?
Unemployment Rate in Sutersville borough is 3.5%.