Cities with the Highest Percentage of State Government Employees in Pennsylvania
RELATED REPORTS & OPTIONS
State Government Employees
Pennsylvania
Compare Cities
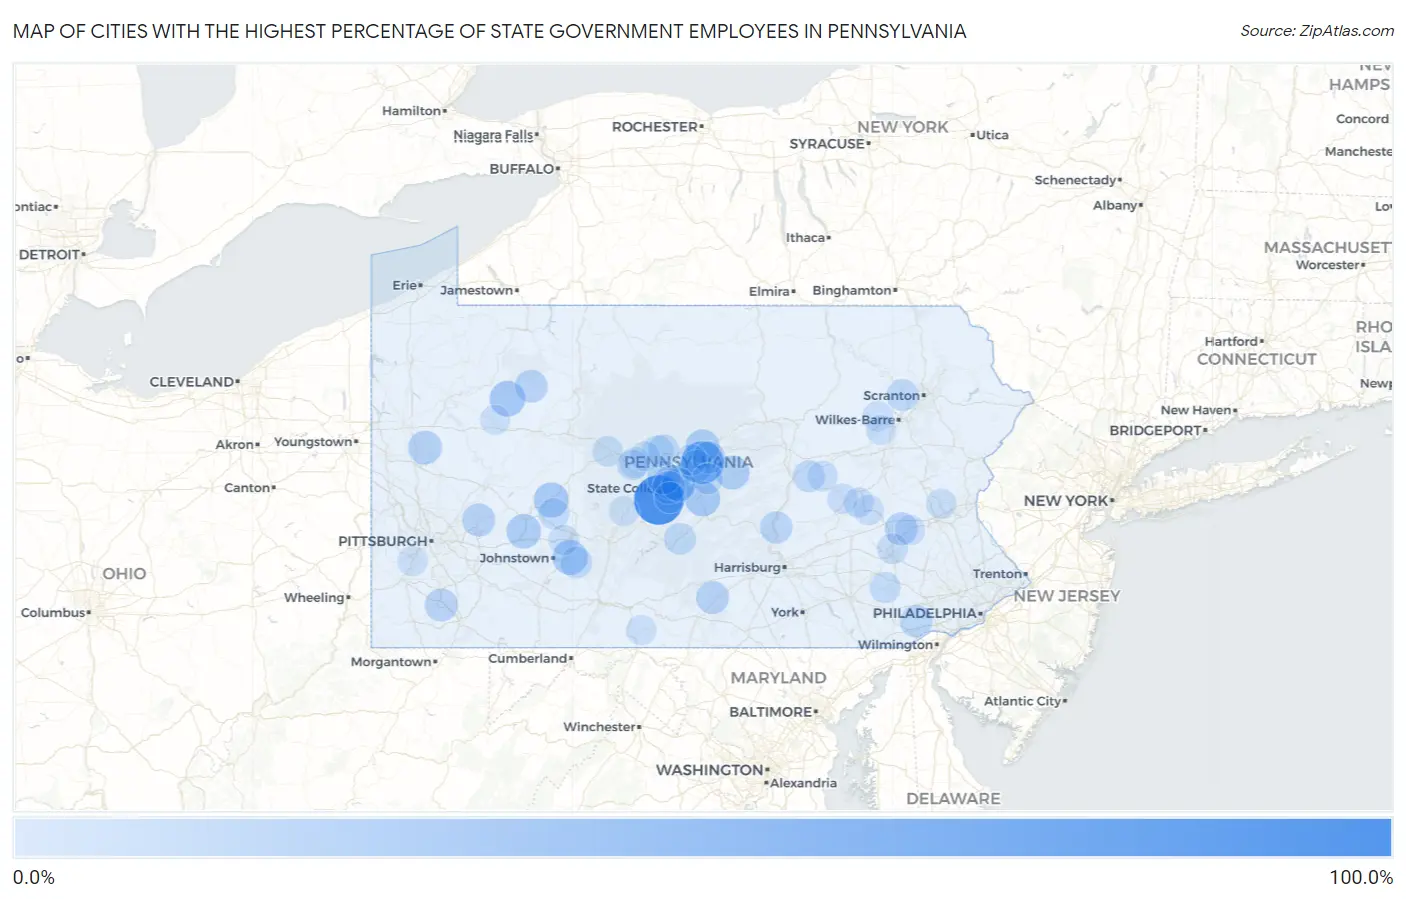
Map of Cities with the Highest Percentage of State Government Employees in Pennsylvania
0.0%
100.0%
Cities with the Highest Percentage of State Government Employees in Pennsylvania
| City | % State Government Employees | vs State | vs National | |
| 1. | Baileyville | 100.0% | 3.1%(+96.9)#1 | 4.2%(+95.8)#6 |
| 2. | Roots | 73.8% | 3.1%(+70.7)#2 | 4.2%(+69.6)#48 |
| 3. | Hublersburg | 67.6% | 3.1%(+64.6)#3 | 4.2%(+63.4)#54 |
| 4. | Eagle Creek | 44.9% | 3.1%(+41.8)#4 | 4.2%(+40.7)#169 |
| 5. | Potters Mills | 38.5% | 3.1%(+35.4)#5 | 4.2%(+34.2)#235 |
| 6. | Tylersburg | 36.7% | 3.1%(+33.6)#6 | 4.2%(+32.5)#258 |
| 7. | Yarnell | 36.1% | 3.1%(+33.0)#7 | 4.2%(+31.8)#271 |
| 8. | Shellytown | 35.3% | 3.1%(+32.2)#8 | 4.2%(+31.1)#285 |
| 9. | Potlicker Flats | 34.6% | 3.1%(+31.5)#9 | 4.2%(+30.3)#301 |
| 10. | Commodore | 34.0% | 3.1%(+30.9)#10 | 4.2%(+29.7)#315 |
| 11. | St Michael | 33.9% | 3.1%(+30.8)#11 | 4.2%(+29.7)#318 |
| 12. | Juniata Gap | 33.7% | 3.1%(+30.7)#12 | 4.2%(+29.5)#322 |
| 13. | New Baltimore Borough | 33.7% | 3.1%(+30.6)#13 | 4.2%(+29.5)#323 |
| 14. | Toftrees | 33.4% | 3.1%(+30.3)#14 | 4.2%(+29.1)#331 |
| 15. | Coral | 32.1% | 3.1%(+29.0)#15 | 4.2%(+27.8)#379 |
| 16. | Woodward | 29.7% | 3.1%(+26.6)#16 | 4.2%(+25.5)#444 |
| 17. | Houserville | 29.5% | 3.1%(+26.4)#17 | 4.2%(+25.2)#453 |
| 18. | Blanchard | 29.0% | 3.1%(+25.9)#18 | 4.2%(+24.8)#468 |
| 19. | Armagh Borough | 28.9% | 3.1%(+25.8)#19 | 4.2%(+24.6)#477 |
| 20. | Slippery Rock University | 27.9% | 3.1%(+24.8)#20 | 4.2%(+23.6)#527 |
| 21. | Lemont | 27.7% | 3.1%(+24.6)#21 | 4.2%(+23.4)#540 |
| 22. | Julian | 27.3% | 3.1%(+24.2)#22 | 4.2%(+23.0)#558 |
| 23. | Farwell | 27.0% | 3.1%(+23.9)#23 | 4.2%(+22.8)#571 |
| 24. | Oklahoma | 26.2% | 3.1%(+23.1)#24 | 4.2%(+22.0)#603 |
| 25. | St Clairsville Borough | 25.6% | 3.1%(+22.6)#25 | 4.2%(+21.4)#630 |
| 26. | Shippensburg University | 25.3% | 3.1%(+22.2)#26 | 4.2%(+21.0)#652 |
| 27. | Hiller | 25.0% | 3.1%(+21.9)#27 | 4.2%(+20.7)#678 |
| 28. | Park Forest Village | 24.8% | 3.1%(+21.7)#28 | 4.2%(+20.5)#687 |
| 29. | Virginville | 24.6% | 3.1%(+21.5)#29 | 4.2%(+20.4)#696 |
| 30. | Marienville | 23.9% | 3.1%(+20.9)#30 | 4.2%(+19.7)#742 |
| 31. | Ramey Borough | 23.5% | 3.1%(+20.4)#31 | 4.2%(+19.3)#766 |
| 32. | Mingoville | 23.2% | 3.1%(+20.1)#32 | 4.2%(+18.9)#784 |
| 33. | Cooperstown Borough | 23.1% | 3.1%(+20.0)#33 | 4.2%(+18.8)#789 |
| 34. | Unionville | 22.9% | 3.1%(+19.8)#34 | 4.2%(+18.6)#801 |
| 35. | Reightown | 22.6% | 3.1%(+19.5)#35 | 4.2%(+18.3)#827 |
| 36. | Lenkerville | 22.4% | 3.1%(+19.3)#36 | 4.2%(+18.1)#842 |
| 37. | Nittany | 22.3% | 3.1%(+19.2)#37 | 4.2%(+18.1)#845 |
| 38. | Clarion Borough | 22.1% | 3.1%(+19.0)#38 | 4.2%(+17.9)#868 |
| 39. | Clintondale | 22.0% | 3.1%(+18.9)#39 | 4.2%(+17.7)#877 |
| 40. | State College Borough | 21.8% | 3.1%(+18.7)#40 | 4.2%(+17.6)#891 |
| 41. | Snydertown | 20.7% | 3.1%(+17.6)#41 | 4.2%(+16.4)#1,002 |
| 42. | Orangeville Borough | 20.6% | 3.1%(+17.5)#42 | 4.2%(+16.4)#1,007 |
| 43. | Upper Exeter | 20.5% | 3.1%(+17.5)#43 | 4.2%(+16.3)#1,019 |
| 44. | Atkinson Mills | 19.7% | 3.1%(+16.6)#44 | 4.2%(+15.5)#1,102 |
| 45. | Linds Crossing | 19.1% | 3.1%(+16.0)#45 | 4.2%(+14.9)#1,169 |
| 46. | Gilberton Borough | 19.0% | 3.1%(+16.0)#46 | 4.2%(+14.8)#1,176 |
| 47. | Moshannon | 19.0% | 3.1%(+16.0)#47 | 4.2%(+14.8)#1,179 |
| 48. | Dunlo | 19.0% | 3.1%(+15.9)#48 | 4.2%(+14.8)#1,185 |
| 49. | Alexandria Borough | 18.9% | 3.1%(+15.8)#49 | 4.2%(+14.7)#1,196 |
| 50. | Foxburg Borough | 18.8% | 3.1%(+15.7)#50 | 4.2%(+14.5)#1,211 |
| 51. | Clarence | 18.5% | 3.1%(+15.4)#51 | 4.2%(+14.2)#1,249 |
| 52. | Continental Courts | 18.4% | 3.1%(+15.3)#52 | 4.2%(+14.1)#1,259 |
| 53. | Milesburg Borough | 18.1% | 3.1%(+15.0)#53 | 4.2%(+13.9)#1,311 |
| 54. | Mount Eagle | 18.0% | 3.1%(+14.9)#54 | 4.2%(+13.8)#1,323 |
| 55. | Waynesburg Borough | 17.8% | 3.1%(+14.7)#55 | 4.2%(+13.5)#1,360 |
| 56. | University Of Pittsburgh Bradford | 17.6% | 3.1%(+14.5)#56 | 4.2%(+13.4)#1,379 |
| 57. | Pine Grove Mills | 17.5% | 3.1%(+14.4)#57 | 4.2%(+13.2)#1,403 |
| 58. | Prompton Borough | 17.4% | 3.1%(+14.3)#58 | 4.2%(+13.1)#1,421 |
| 59. | Goodville | 17.3% | 3.1%(+14.2)#59 | 4.2%(+13.1)#1,422 |
| 60. | Carrolltown Borough | 16.6% | 3.1%(+13.5)#60 | 4.2%(+12.4)#1,569 |
| 61. | Heilwood | 16.5% | 3.1%(+13.4)#61 | 4.2%(+12.3)#1,587 |
| 62. | Spring Mills | 16.4% | 3.1%(+13.3)#62 | 4.2%(+12.2)#1,602 |
| 63. | Allport | 16.3% | 3.1%(+13.2)#63 | 4.2%(+12.0)#1,636 |
| 64. | Muhlenberg Park | 15.6% | 3.1%(+12.5)#64 | 4.2%(+11.4)#1,760 |
| 65. | Volant Borough | 15.6% | 3.1%(+12.5)#65 | 4.2%(+11.3)#1,786 |
| 66. | Dayton Borough | 15.5% | 3.1%(+12.5)#66 | 4.2%(+11.3)#1,788 |
| 67. | North Bend | 15.3% | 3.1%(+12.2)#67 | 4.2%(+11.1)#1,847 |
| 68. | Polk Borough | 15.3% | 3.1%(+12.2)#68 | 4.2%(+11.1)#1,848 |
| 69. | Morrisdale | 15.2% | 3.1%(+12.1)#69 | 4.2%(+11.0)#1,865 |
| 70. | Holters Crossing | 15.2% | 3.1%(+12.1)#70 | 4.2%(+10.9)#1,869 |
| 71. | Plymptonville | 15.1% | 3.1%(+12.0)#71 | 4.2%(+10.9)#1,888 |
| 72. | Dauphin Borough | 15.0% | 3.1%(+11.9)#72 | 4.2%(+10.7)#1,921 |
| 73. | Mundys Corner | 15.0% | 3.1%(+11.9)#73 | 4.2%(+10.7)#1,926 |
| 74. | Renningers | 14.9% | 3.1%(+11.8)#74 | 4.2%(+10.7)#1,934 |
| 75. | Elysburg | 14.8% | 3.1%(+11.7)#75 | 4.2%(+10.6)#1,954 |
| 76. | Tionesta Borough | 14.8% | 3.1%(+11.7)#76 | 4.2%(+10.5)#1,980 |
| 77. | Loop | 14.5% | 3.1%(+11.4)#77 | 4.2%(+10.2)#2,057 |
| 78. | Stockdale Borough | 14.4% | 3.1%(+11.3)#78 | 4.2%(+10.1)#2,088 |
| 79. | Beurys Lake | 14.3% | 3.1%(+11.2)#79 | 4.2%(+10.0)#2,140 |
| 80. | Kutztown University | 14.2% | 3.1%(+11.1)#80 | 4.2%(+9.94)#2,178 |
| 81. | Tunnelhill Borough | 14.2% | 3.1%(+11.1)#81 | 4.2%(+9.92)#2,183 |
| 82. | Seltzer | 14.0% | 3.1%(+10.9)#82 | 4.2%(+9.73)#2,245 |
| 83. | Cementon | 13.7% | 3.1%(+10.6)#83 | 4.2%(+9.42)#2,338 |
| 84. | Hendersonville | 13.4% | 3.1%(+10.3)#84 | 4.2%(+9.19)#2,414 |
| 85. | Paxtang Borough | 13.4% | 3.1%(+10.3)#85 | 4.2%(+9.19)#2,415 |
| 86. | Millerstown Borough | 13.4% | 3.1%(+10.3)#86 | 4.2%(+9.17)#2,418 |
| 87. | Centre Hall Borough | 13.4% | 3.1%(+10.3)#87 | 4.2%(+9.12)#2,436 |
| 88. | Bellefonte Borough | 13.3% | 3.1%(+10.3)#88 | 4.2%(+9.11)#2,441 |
| 89. | Mahaffey Borough | 13.3% | 3.1%(+10.2)#89 | 4.2%(+9.09)#2,449 |
| 90. | Factoryville Borough | 13.3% | 3.1%(+10.2)#90 | 4.2%(+9.07)#2,467 |
| 91. | Grassflat | 13.3% | 3.1%(+10.2)#91 | 4.2%(+9.06)#2,473 |
| 92. | Cranesville Borough | 13.3% | 3.1%(+10.2)#92 | 4.2%(+9.01)#2,484 |
| 93. | Tipton | 13.2% | 3.1%(+10.1)#93 | 4.2%(+8.98)#2,498 |
| 94. | Ehrenfeld Borough | 13.2% | 3.1%(+10.1)#94 | 4.2%(+8.92)#2,514 |
| 95. | Needmore | 13.1% | 3.1%(+10.0)#95 | 4.2%(+8.87)#2,528 |
| 96. | Marianne | 13.1% | 3.1%(+10.0)#96 | 4.2%(+8.86)#2,534 |
| 97. | Shippensburg Borough | 12.9% | 3.1%(+9.82)#97 | 4.2%(+8.67)#2,594 |
| 98. | Silkworth | 12.8% | 3.1%(+9.73)#98 | 4.2%(+8.58)#2,628 |
| 99. | Wanamie | 12.8% | 3.1%(+9.72)#99 | 4.2%(+8.57)#2,637 |
| 100. | Oreminea | 12.8% | 3.1%(+9.68)#100 | 4.2%(+8.52)#2,652 |
Common Questions
What are the Top 10 Cities with the Highest Percentage of State Government Employees in Pennsylvania?
Top 10 Cities with the Highest Percentage of State Government Employees in Pennsylvania are:
#1
100.0%
#2
67.6%
#3
36.7%
#4
34.6%
#5
34.0%
#6
33.9%
#7
33.4%
#8
32.1%
#9
29.7%
#10
29.5%
What city has the Highest Percentage of State Government Employees in Pennsylvania?
Baileyville has the Highest Percentage of State Government Employees in Pennsylvania with 100.0%.
What is the Percentage of State Government Employees in the State of Pennsylvania?
Percentage of State Government Employees in Pennsylvania is 3.1%.
What is the Percentage of State Government Employees in the United States?
Percentage of State Government Employees in the United States is 4.2%.