Broomall, PA
Broomall Map
Broomall Overview
10,663
TOTAL POPULATION
4,956
MALE POPULATION
5,707
FEMALE POPULATION
86.84
MALES / 100 FEMALES
115.15
FEMALES / 100 MALES
44.1
MEDIAN AGE
3.2
AVG FAMILY SIZE
2.7
AVG HOUSEHOLD SIZE
$52,015
PER CAPITA INCOME
$130,833
AVG FAMILY INCOME
$113,242
AVG HOUSEHOLD INCOME
15.9%
WAGE / INCOME GAP [ % ]
84.1¢/ $1
WAGE / INCOME GAP [ $ ]
0.41
INEQUALITY / GINI INDEX
5,905
LABOR FORCE [ PEOPLE ]
67.4%
PERCENT IN LABOR FORCE
2.8%
UNEMPLOYMENT RATE
Broomall Zip Codes
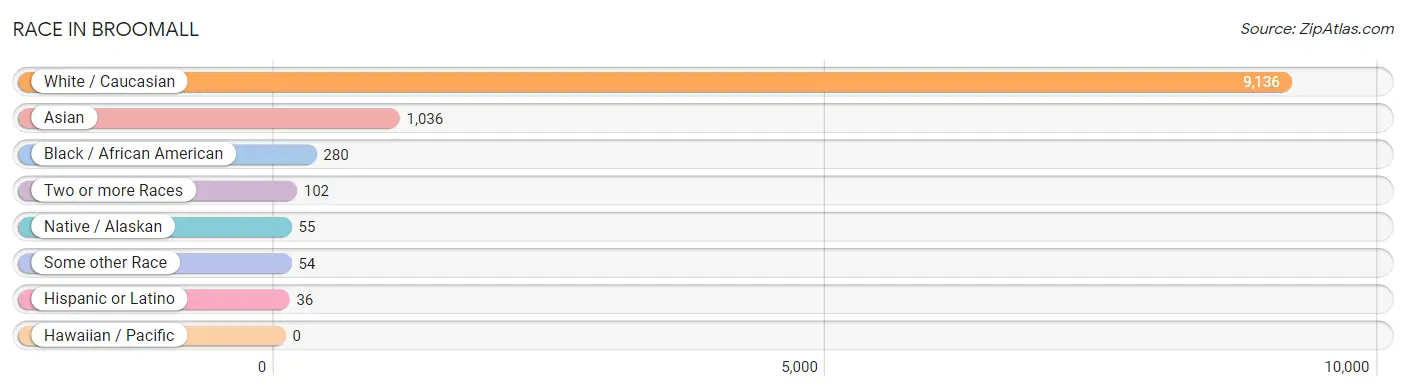
Race in Broomall
The most populous races in Broomall are White / Caucasian (9,136 | 85.7%), Asian (1,036 | 9.7%), and Black / African American (280 | 2.6%).
| Race | # Population | % Population |
| Asian | 1,036 | 9.7% |
| Black / African American | 280 | 2.6% |
| Hawaiian / Pacific | 0 | 0.0% |
| Hispanic or Latino | 36 | 0.3% |
| Native / Alaskan | 55 | 0.5% |
| White / Caucasian | 9,136 | 85.7% |
| Two or more Races | 102 | 1.0% |
| Some other Race | 54 | 0.5% |
| Total | 10,663 | 100.0% |
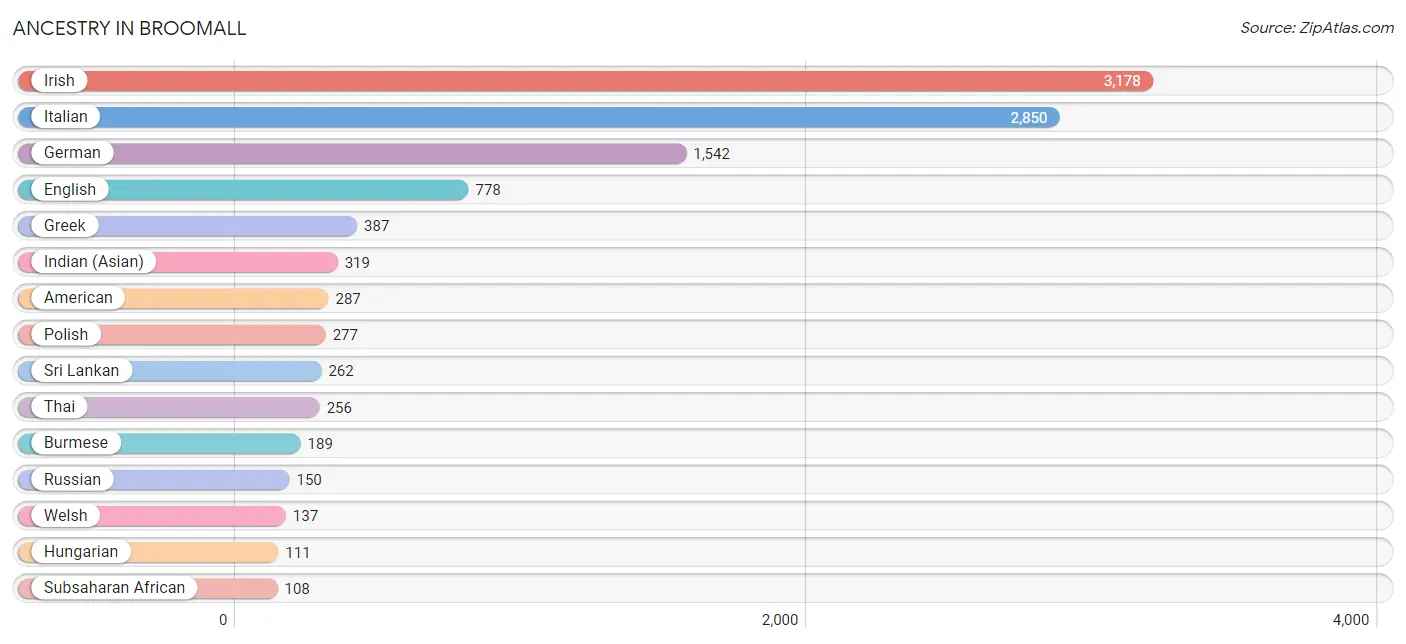
Ancestry in Broomall
The most populous ancestries reported in Broomall are Irish (3,178 | 29.8%), Italian (2,850 | 26.7%), German (1,542 | 14.5%), English (778 | 7.3%), and Greek (387 | 3.6%), together accounting for 81.9% of all Broomall residents.
| Ancestry | # Population | % Population |
| African | 92 | 0.9% |
| Albanian | 13 | 0.1% |
| American | 287 | 2.7% |
| Arab | 24 | 0.2% |
| Armenian | 57 | 0.5% |
| Blackfeet | 36 | 0.3% |
| British West Indian | 11 | 0.1% |
| Burmese | 189 | 1.8% |
| Croatian | 9 | 0.1% |
| Cypriot | 11 | 0.1% |
| Czech | 22 | 0.2% |
| Dutch | 33 | 0.3% |
| English | 778 | 7.3% |
| European | 45 | 0.4% |
| French | 103 | 1.0% |
| French Canadian | 50 | 0.5% |
| German | 1,542 | 14.5% |
| Greek | 387 | 3.6% |
| Guamanian / Chamorro | 14 | 0.1% |
| Hungarian | 111 | 1.0% |
| Indian (Asian) | 319 | 3.0% |
| Iranian | 39 | 0.4% |
| Iraqi | 13 | 0.1% |
| Irish | 3,178 | 29.8% |
| Iroquois | 6 | 0.1% |
| Italian | 2,850 | 26.7% |
| Jamaican | 11 | 0.1% |
| Japanese | 5 | 0.1% |
| Jordanian | 10 | 0.1% |
| Korean | 10 | 0.1% |
| Latvian | 11 | 0.1% |
| Lebanese | 1 | 0.0% |
| Lithuanian | 71 | 0.7% |
| Northern European | 11 | 0.1% |
| Norwegian | 17 | 0.2% |
| Polish | 277 | 2.6% |
| Portuguese | 38 | 0.4% |
| Pueblo | 10 | 0.1% |
| Puerto Rican | 1 | 0.0% |
| Romanian | 37 | 0.4% |
| Russian | 150 | 1.4% |
| Scotch-Irish | 65 | 0.6% |
| Scottish | 82 | 0.8% |
| Sioux | 8 | 0.1% |
| Slovak | 47 | 0.4% |
| Spaniard | 35 | 0.3% |
| Sri Lankan | 262 | 2.5% |
| Subsaharan African | 108 | 1.0% |
| Swedish | 33 | 0.3% |
| Swiss | 23 | 0.2% |
| Thai | 256 | 2.4% |
| Ukrainian | 98 | 0.9% |
| Welsh | 137 | 1.3% | View All 53 Rows |
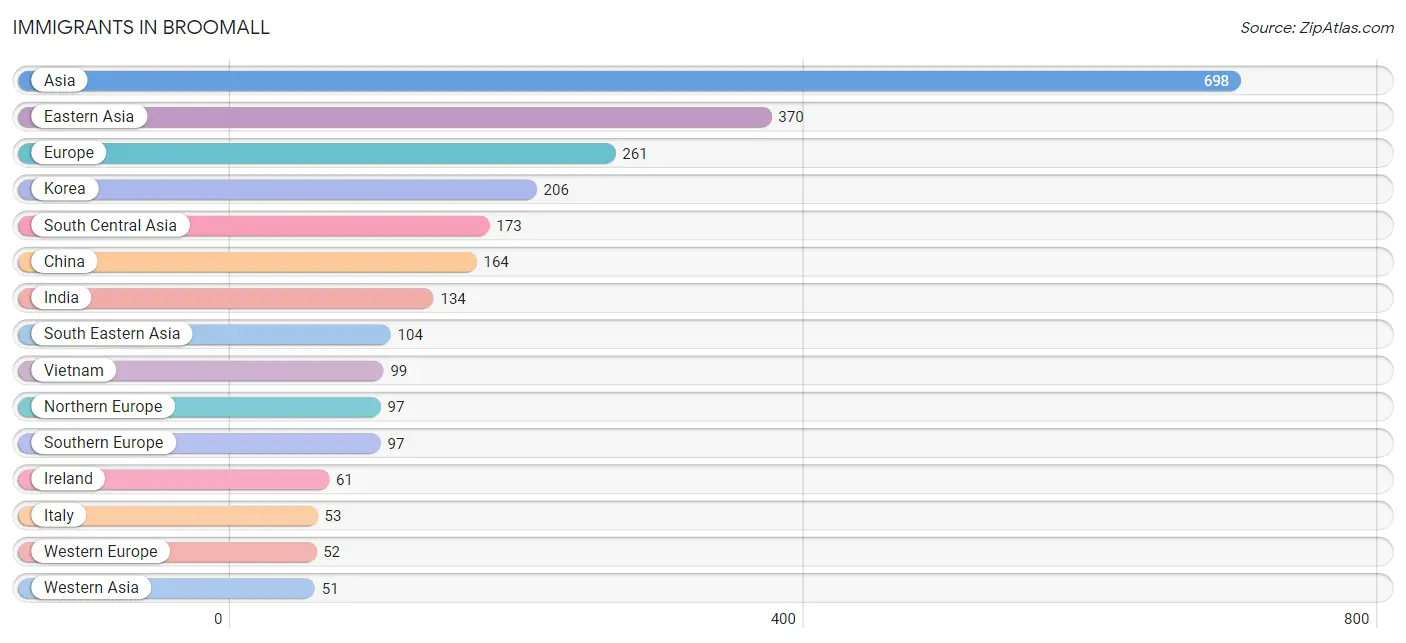
Immigrants in Broomall
The most numerous immigrant groups reported in Broomall came from Asia (698 | 6.6%), Eastern Asia (370 | 3.5%), Europe (261 | 2.5%), Korea (206 | 1.9%), and South Central Asia (173 | 1.6%), together accounting for 16.0% of all Broomall residents.
| Immigration Origin | # Population | % Population |
| Africa | 16 | 0.2% |
| Asia | 698 | 6.6% |
| Brazil | 24 | 0.2% |
| Cameroon | 16 | 0.2% |
| Canada | 7 | 0.1% |
| Caribbean | 7 | 0.1% |
| China | 164 | 1.5% |
| Eastern Asia | 370 | 3.5% |
| Europe | 261 | 2.5% |
| France | 11 | 0.1% |
| Germany | 16 | 0.2% |
| Greece | 44 | 0.4% |
| Hong Kong | 2 | 0.0% |
| India | 134 | 1.3% |
| Iran | 39 | 0.4% |
| Iraq | 25 | 0.2% |
| Ireland | 61 | 0.6% |
| Italy | 53 | 0.5% |
| Jamaica | 7 | 0.1% |
| Korea | 206 | 1.9% |
| Latin America | 31 | 0.3% |
| Middle Africa | 16 | 0.2% |
| Northern Europe | 97 | 0.9% |
| South America | 24 | 0.2% |
| South Central Asia | 173 | 1.6% |
| South Eastern Asia | 104 | 1.0% |
| Southern Europe | 97 | 0.9% |
| Switzerland | 25 | 0.2% |
| Syria | 15 | 0.1% |
| Thailand | 5 | 0.1% |
| Vietnam | 99 | 0.9% |
| Western Asia | 51 | 0.5% |
| Western Europe | 52 | 0.5% | View All 33 Rows |
Sex and Age in Broomall
Sex and Age in Broomall
The most populous age groups in Broomall are 25 to 29 Years (404 | 8.2%) for men and 55 to 59 Years (467 | 8.2%) for women.
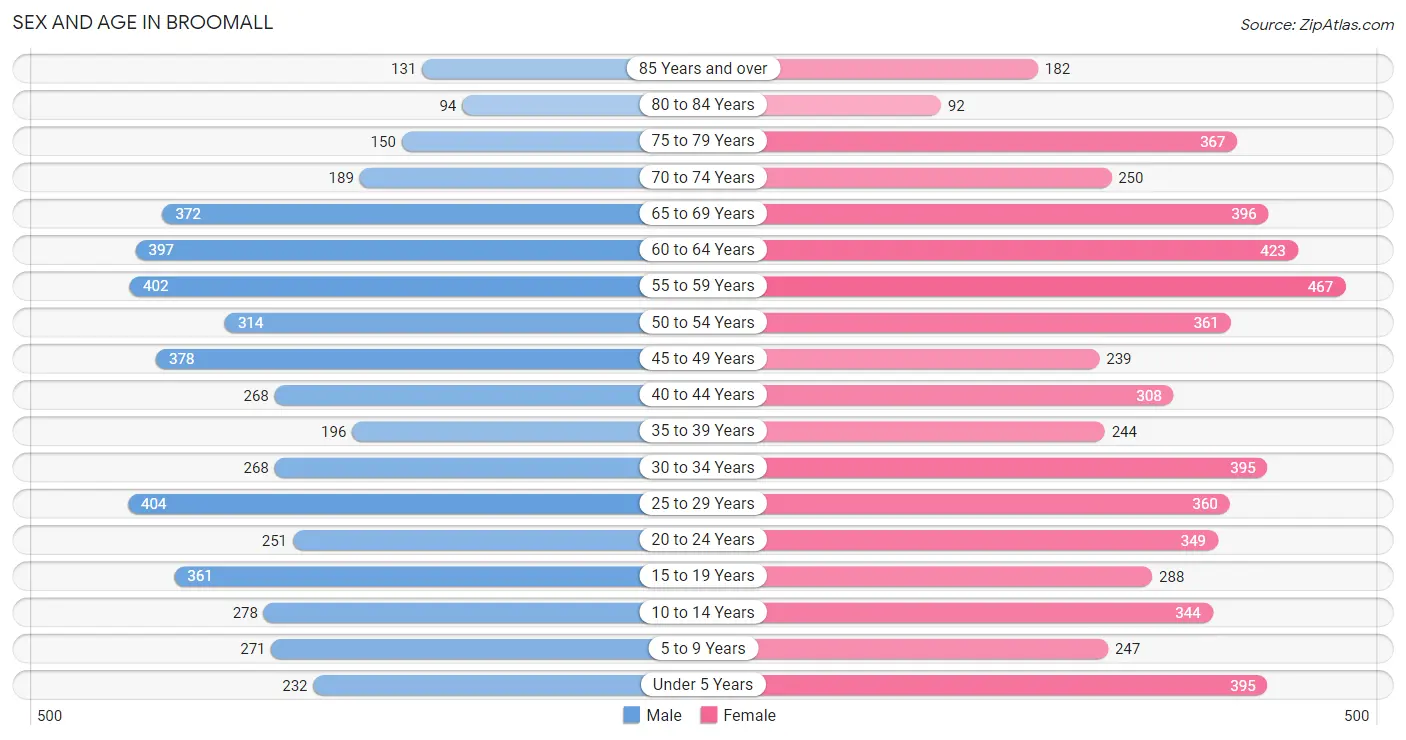
| Age Bracket | Male | Female |
| Under 5 Years | 232 (4.7%) | 395 (6.9%) |
| 5 to 9 Years | 271 (5.5%) | 247 (4.3%) |
| 10 to 14 Years | 278 (5.6%) | 344 (6.0%) |
| 15 to 19 Years | 361 (7.3%) | 288 (5.1%) |
| 20 to 24 Years | 251 (5.1%) | 349 (6.1%) |
| 25 to 29 Years | 404 (8.2%) | 360 (6.3%) |
| 30 to 34 Years | 268 (5.4%) | 395 (6.9%) |
| 35 to 39 Years | 196 (4.0%) | 244 (4.3%) |
| 40 to 44 Years | 268 (5.4%) | 308 (5.4%) |
| 45 to 49 Years | 378 (7.6%) | 239 (4.2%) |
| 50 to 54 Years | 314 (6.3%) | 361 (6.3%) |
| 55 to 59 Years | 402 (8.1%) | 467 (8.2%) |
| 60 to 64 Years | 397 (8.0%) | 423 (7.4%) |
| 65 to 69 Years | 372 (7.5%) | 396 (6.9%) |
| 70 to 74 Years | 189 (3.8%) | 250 (4.4%) |
| 75 to 79 Years | 150 (3.0%) | 367 (6.4%) |
| 80 to 84 Years | 94 (1.9%) | 92 (1.6%) |
| 85 Years and over | 131 (2.6%) | 182 (3.2%) |
| Total | 4,956 (100.0%) | 5,707 (100.0%) |
Families and Households in Broomall
Median Family Size in Broomall
The median family size in Broomall is 3.17 persons per family, with married-couple families (2,455 | 83.3%) accounting for the largest median family size of 3.24 persons per family. On the other hand, single male/father families (107 | 3.6%) represent the smallest median family size with 2.79 persons per family.
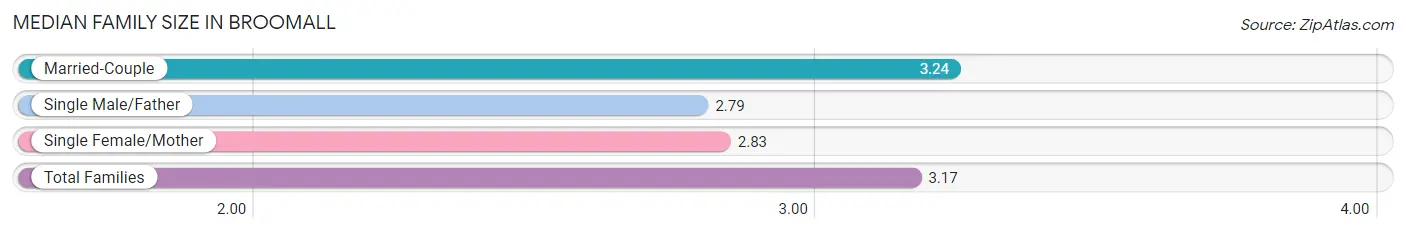
| Family Type | # Families | Family Size |
| Married-Couple | 2,455 (83.3%) | 3.24 |
| Single Male/Father | 107 (3.6%) | 2.79 |
| Single Female/Mother | 386 (13.1%) | 2.83 |
| Total Families | 2,948 (100.0%) | 3.17 |
Median Household Size in Broomall
The median household size in Broomall is 2.72 persons per household, with married-couple households (2,455 | 62.7%) accounting for the largest median household size of 3.28 persons per household. non-family households (965 | 24.7%) represent the smallest median household size with 1.20 persons per household.
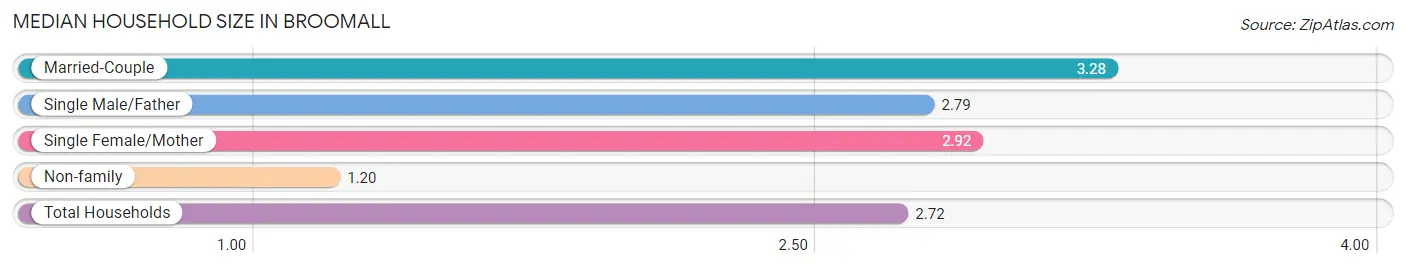
| Household Type | # Households | Household Size |
| Married-Couple | 2,455 (62.7%) | 3.28 |
| Single Male/Father | 107 (2.7%) | 2.79 |
| Single Female/Mother | 386 (9.9%) | 2.92 |
| Non-family | 965 (24.7%) | 1.20 |
| Total Households | 3,913 (100.0%) | 2.72 |
Household Size by Marriage Status in Broomall
Out of a total of 3,913 households in Broomall, 2,948 (75.3%) are family households, while 965 (24.7%) are nonfamily households. The most numerous type of family households are 2-person households, comprising 1,208, and the most common type of nonfamily households are 1-person households, comprising 787.
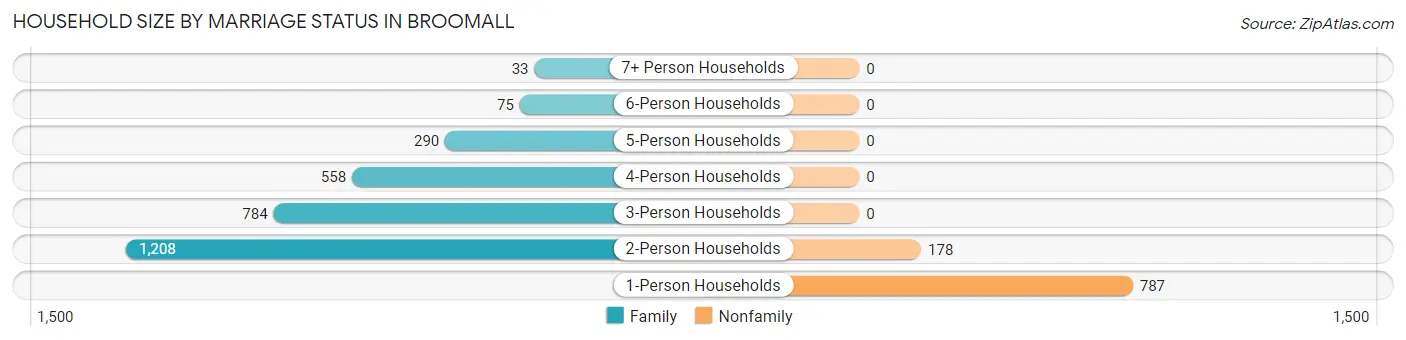
| Household Size | Family Households | Nonfamily Households |
| 1-Person Households | - | 787 (20.1%) |
| 2-Person Households | 1,208 (30.9%) | 178 (4.5%) |
| 3-Person Households | 784 (20.0%) | 0 (0.0%) |
| 4-Person Households | 558 (14.3%) | 0 (0.0%) |
| 5-Person Households | 290 (7.4%) | 0 (0.0%) |
| 6-Person Households | 75 (1.9%) | 0 (0.0%) |
| 7+ Person Households | 33 (0.8%) | 0 (0.0%) |
| Total | 2,948 (75.3%) | 965 (24.7%) |
Female Fertility in Broomall
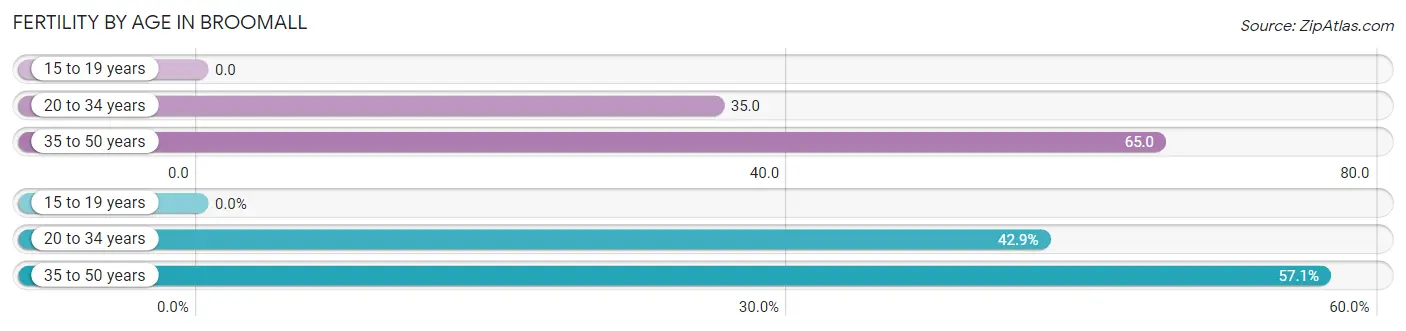
Fertility by Age in Broomall
Average fertility rate in Broomall is 41.0 births per 1,000 women. Women in the age bracket of 35 to 50 years have the highest fertility rate with 65.0 births per 1,000 women. Women in the age bracket of 35 to 50 years acount for 57.1% of all women with births.
| Age Bracket | Women with Births | Births / 1,000 Women |
| 15 to 19 years | 0 (0.0%) | 0.0 |
| 20 to 34 years | 39 (42.9%) | 35.0 |
| 35 to 50 years | 52 (57.1%) | 65.0 |
| Total | 91 (100.0%) | 41.0 |
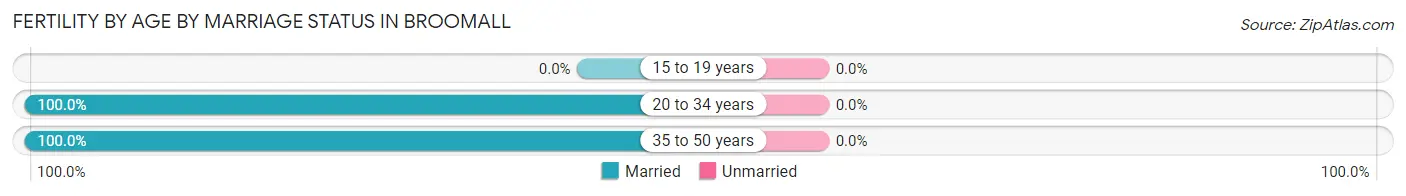
Fertility by Age by Marriage Status in Broomall
| Age Bracket | Married | Unmarried |
| 15 to 19 years | 0 (0.0%) | 0 (0.0%) |
| 20 to 34 years | 39 (100.0%) | 0 (0.0%) |
| 35 to 50 years | 52 (100.0%) | 0 (0.0%) |
| Total | 91 (100.0%) | 0 (0.0%) |
Fertility by Education in Broomall
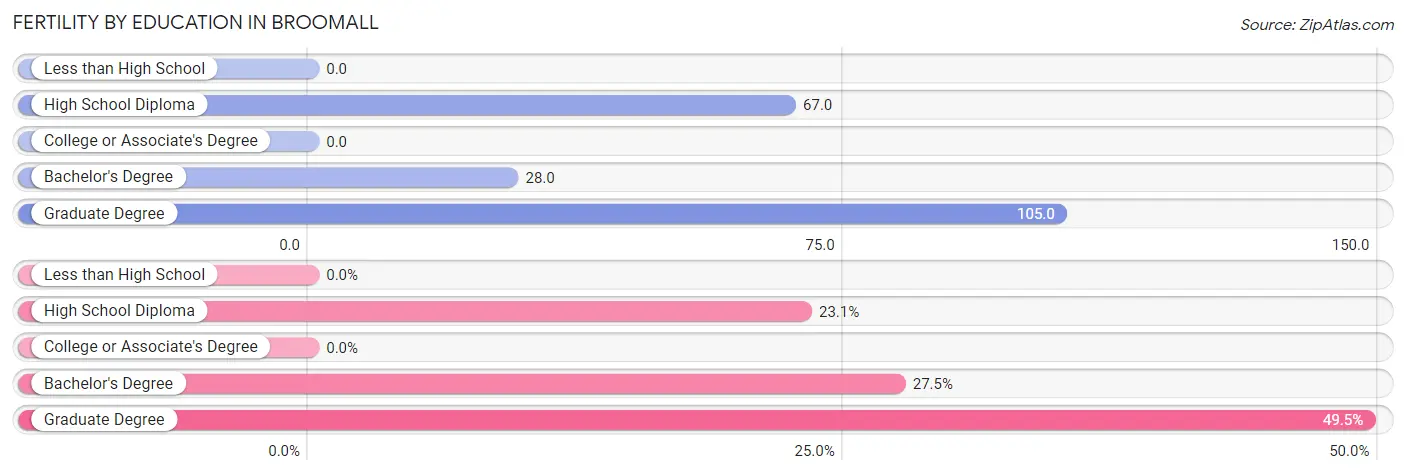
| Educational Attainment | Women with Births | Births / 1,000 Women |
| Less than High School | 0 (0.0%) | 0.0 |
| High School Diploma | 21 (23.1%) | 67.0 |
| College or Associate's Degree | 0 (0.0%) | 0.0 |
| Bachelor's Degree | 25 (27.5%) | 28.0 |
| Graduate Degree | 45 (49.4%) | 105.0 |
| Total | 91 (100.0%) | 41.0 |
Fertility by Education by Marriage Status in Broomall
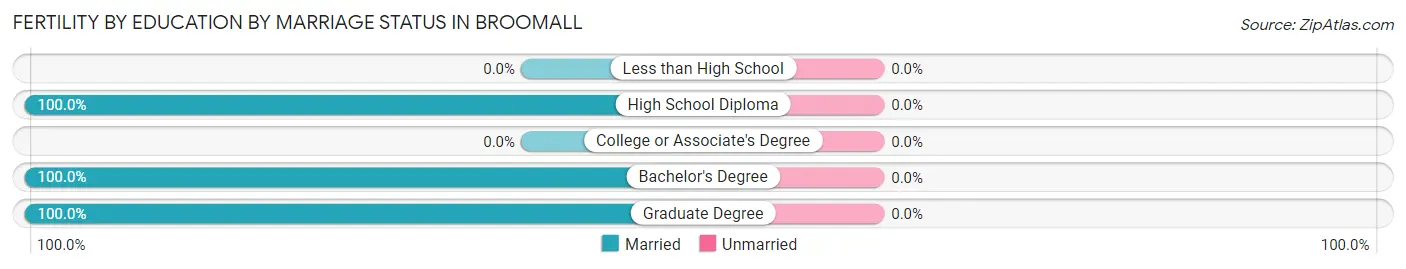
| Educational Attainment | Married | Unmarried |
| Less than High School | 0 (0.0%) | 0 (0.0%) |
| High School Diploma | 21 (100.0%) | 0 (0.0%) |
| College or Associate's Degree | 0 (0.0%) | 0 (0.0%) |
| Bachelor's Degree | 25 (100.0%) | 0 (0.0%) |
| Graduate Degree | 45 (100.0%) | 0 (0.0%) |
| Total | 91 (100.0%) | 0 (0.0%) |
Income in Broomall
Income Overview in Broomall
Per Capita Income in Broomall is $52,015, while median incomes of families and households are $130,833 and $113,242 respectively.
| Characteristic | Number | Measure |
| Per Capita Income | 10,663 | $52,015 |
| Median Family Income | 2,948 | $130,833 |
| Mean Family Income | 2,948 | $157,325 |
| Median Household Income | 3,913 | $113,242 |
| Mean Household Income | 3,913 | $139,719 |
| Income Deficit | 2,948 | $0 |
| Wage / Income Gap (%) | 10,663 | 15.95% |
| Wage / Income Gap ($) | 10,663 | 84.05¢ per $1 |
| Gini / Inequality Index | 10,663 | 0.41 |
Earnings by Sex in Broomall
Average Earnings in Broomall are $55,150, $58,608 for men and $49,261 for women, a difference of 16.0%.
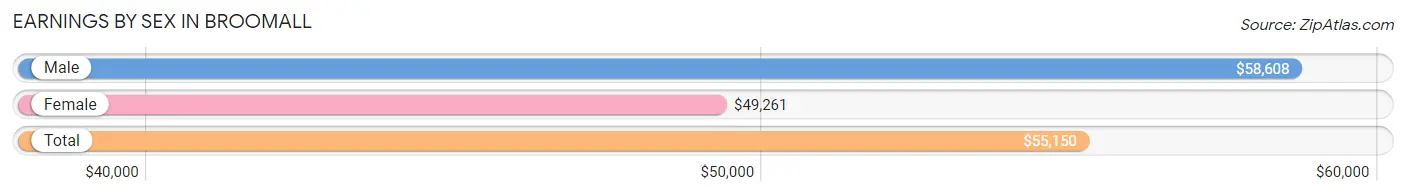
| Sex | Number | Average Earnings |
| Male | 3,209 (51.5%) | $58,608 |
| Female | 3,020 (48.5%) | $49,261 |
| Total | 6,229 (100.0%) | $55,150 |
Earnings by Sex by Income Bracket in Broomall
The most common earnings brackets in Broomall are $100,000+ for men (873 | 27.2%) and $100,000+ for women (523 | 17.3%).
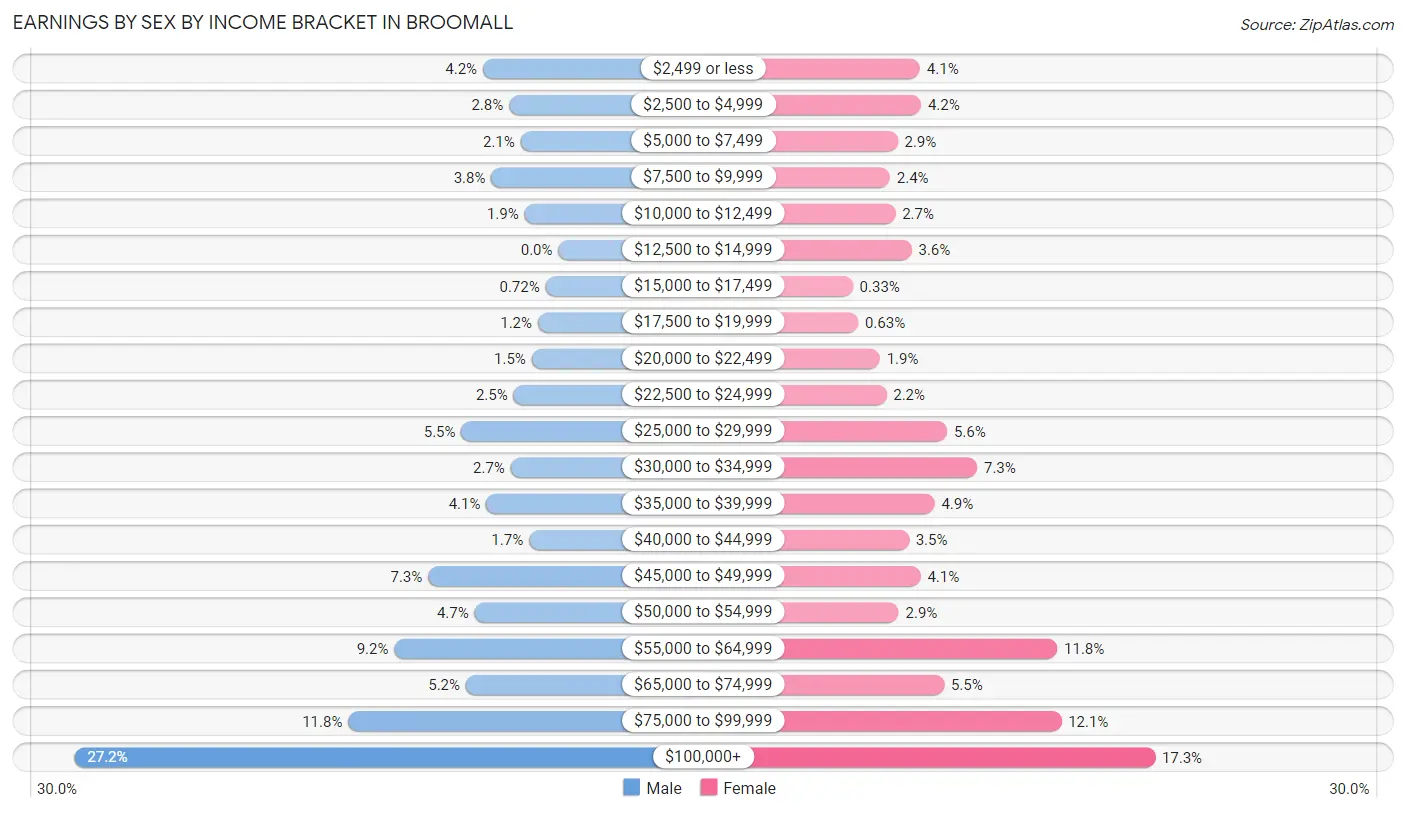
| Income | Male | Female |
| $2,499 or less | 136 (4.2%) | 124 (4.1%) |
| $2,500 to $4,999 | 89 (2.8%) | 126 (4.2%) |
| $5,000 to $7,499 | 68 (2.1%) | 86 (2.9%) |
| $7,500 to $9,999 | 121 (3.8%) | 73 (2.4%) |
| $10,000 to $12,499 | 61 (1.9%) | 82 (2.7%) |
| $12,500 to $14,999 | 0 (0.0%) | 110 (3.6%) |
| $15,000 to $17,499 | 23 (0.7%) | 10 (0.3%) |
| $17,500 to $19,999 | 37 (1.1%) | 19 (0.6%) |
| $20,000 to $22,499 | 48 (1.5%) | 56 (1.8%) |
| $22,500 to $24,999 | 81 (2.5%) | 67 (2.2%) |
| $25,000 to $29,999 | 175 (5.4%) | 170 (5.6%) |
| $30,000 to $34,999 | 86 (2.7%) | 221 (7.3%) |
| $35,000 to $39,999 | 130 (4.1%) | 149 (4.9%) |
| $40,000 to $44,999 | 53 (1.7%) | 105 (3.5%) |
| $45,000 to $49,999 | 235 (7.3%) | 125 (4.1%) |
| $50,000 to $54,999 | 151 (4.7%) | 88 (2.9%) |
| $55,000 to $64,999 | 296 (9.2%) | 357 (11.8%) |
| $65,000 to $74,999 | 167 (5.2%) | 165 (5.5%) |
| $75,000 to $99,999 | 379 (11.8%) | 364 (12.0%) |
| $100,000+ | 873 (27.2%) | 523 (17.3%) |
| Total | 3,209 (100.0%) | 3,020 (100.0%) |
Earnings by Sex by Educational Attainment in Broomall
Average earnings in Broomall are $64,615 for men and $57,784 for women, a difference of 10.6%. Men with an educational attainment of graduate degree enjoy the highest average annual earnings of $103,958, while those with less than high school education earn the least with $45,405. Women with an educational attainment of graduate degree earn the most with the average annual earnings of $78,162, while those with college or associate's degree education have the smallest earnings of $34,063.
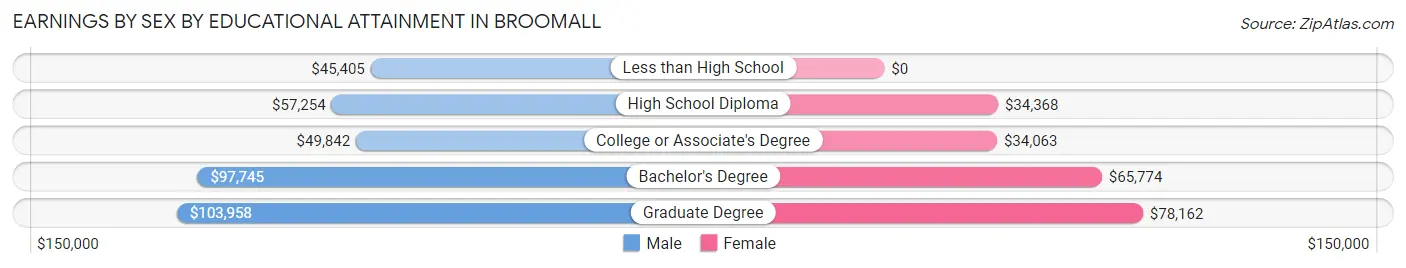
| Educational Attainment | Male Income | Female Income |
| Less than High School | $45,405 | $0 |
| High School Diploma | $57,254 | $34,368 |
| College or Associate's Degree | $49,842 | $34,063 |
| Bachelor's Degree | $97,745 | $65,774 |
| Graduate Degree | $103,958 | $78,162 |
| Total | $64,615 | $57,784 |
Family Income in Broomall
Family Income Brackets in Broomall
According to the Broomall family income data, there are 719 families falling into the $200,000+ income range, which is the most common income bracket and makes up 24.4% of all families. Conversely, the $10,000 to $14,999 income bracket is the least frequent group with only 18 families (0.6%) belonging to this category.
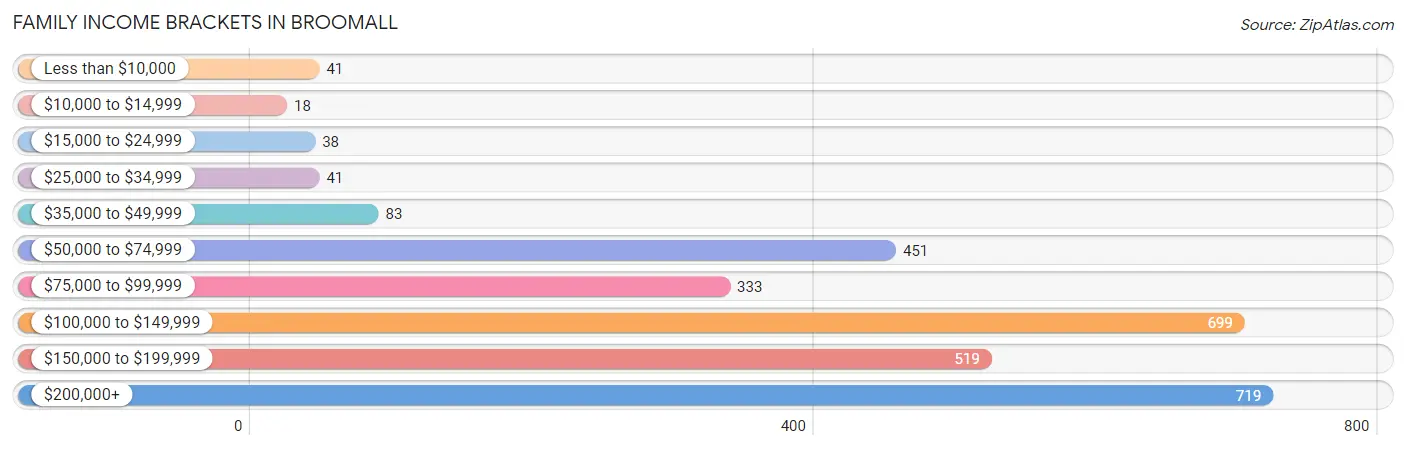
| Income Bracket | # Families | % Families |
| Less than $10,000 | 41 | 1.4% |
| $10,000 to $14,999 | 18 | 0.6% |
| $15,000 to $24,999 | 38 | 1.3% |
| $25,000 to $34,999 | 41 | 1.4% |
| $35,000 to $49,999 | 83 | 2.8% |
| $50,000 to $74,999 | 451 | 15.3% |
| $75,000 to $99,999 | 333 | 11.3% |
| $100,000 to $149,999 | 699 | 23.7% |
| $150,000 to $199,999 | 519 | 17.6% |
| $200,000+ | 719 | 24.4% |
Family Income by Famaliy Size in Broomall
4-person families (568 | 19.3%) account for the highest median family income in Broomall with $161,346 per family, while 2-person families (1,214 | 41.2%) have the highest median income of $54,584 per family member.
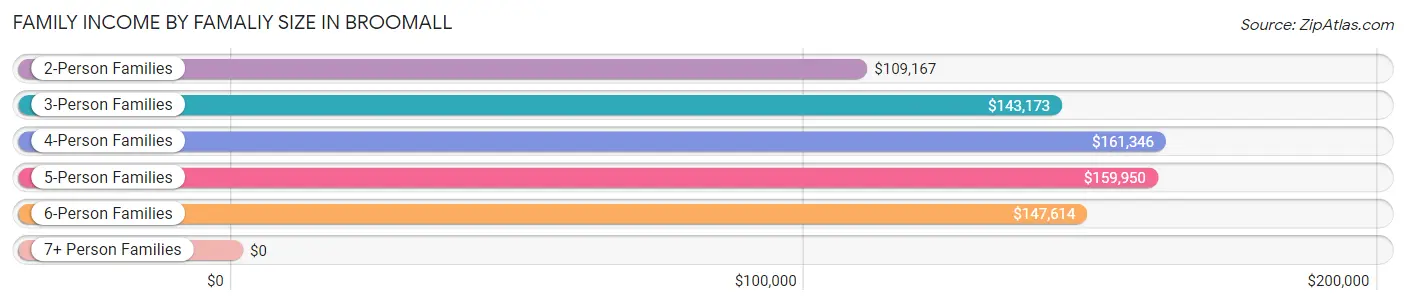
| Income Bracket | # Families | Median Income |
| 2-Person Families | 1,214 (41.2%) | $109,167 |
| 3-Person Families | 796 (27.0%) | $143,173 |
| 4-Person Families | 568 (19.3%) | $161,346 |
| 5-Person Families | 281 (9.5%) | $159,950 |
| 6-Person Families | 75 (2.5%) | $147,614 |
| 7+ Person Families | 14 (0.5%) | $0 |
| Total | 2,948 (100.0%) | $130,833 |
Family Income by Number of Earners in Broomall
The median family income in Broomall is $130,833, with families comprising 3+ earners (529) having the highest median family income of $202,788, while families with no earners (278) have the lowest median family income of $56,786, accounting for 17.9% and 9.4% of families, respectively.
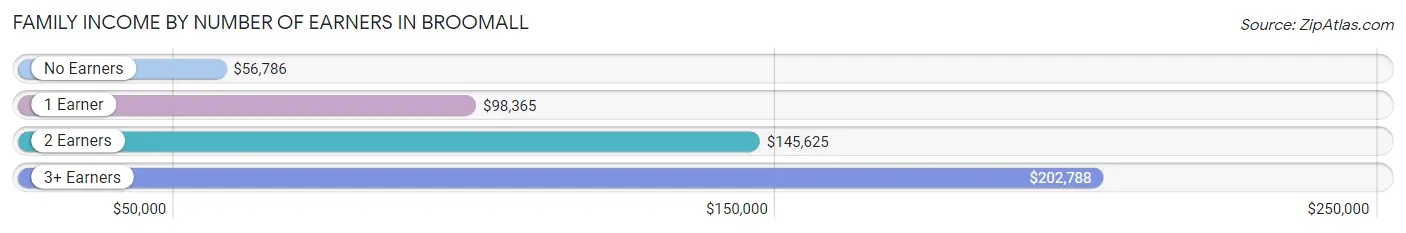
| Number of Earners | # Families | Median Income |
| No Earners | 278 (9.4%) | $56,786 |
| 1 Earner | 769 (26.1%) | $98,365 |
| 2 Earners | 1,372 (46.5%) | $145,625 |
| 3+ Earners | 529 (17.9%) | $202,788 |
| Total | 2,948 (100.0%) | $130,833 |
Household Income in Broomall
Household Income Brackets in Broomall
With 920 households falling in the category, the $100,000 to $149,999 income range is the most frequent in Broomall, accounting for 23.5% of all households. In contrast, only 27 households (0.7%) fall into the $10,000 to $14,999 income bracket, making it the least populous group.
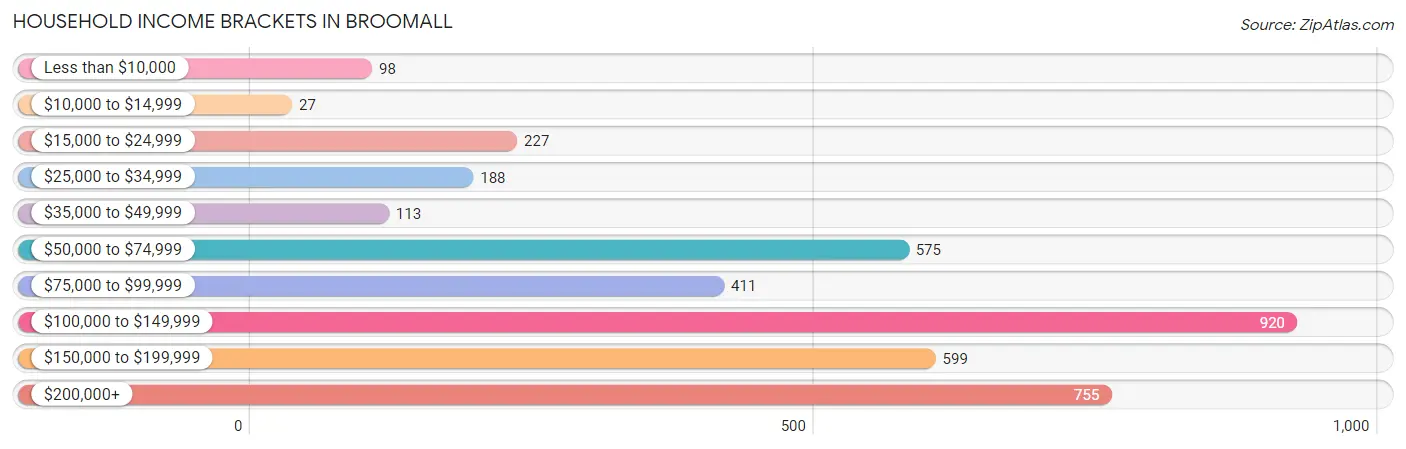
| Income Bracket | # Households | % Households |
| Less than $10,000 | 98 | 2.5% |
| $10,000 to $14,999 | 27 | 0.7% |
| $15,000 to $24,999 | 227 | 5.8% |
| $25,000 to $34,999 | 188 | 4.8% |
| $35,000 to $49,999 | 113 | 2.9% |
| $50,000 to $74,999 | 575 | 14.7% |
| $75,000 to $99,999 | 411 | 10.5% |
| $100,000 to $149,999 | 920 | 23.5% |
| $150,000 to $199,999 | 599 | 15.3% |
| $200,000+ | 755 | 19.3% |
Household Income by Householder Age in Broomall
The median household income in Broomall is $113,242, with the highest median household income of $138,750 found in the 25 to 44 years age bracket for the primary householder. A total of 834 households (21.3%) fall into this category. Meanwhile, the 15 to 24 years age bracket for the primary householder has the lowest median household income of $0, with 28 households (0.7%) in this group.
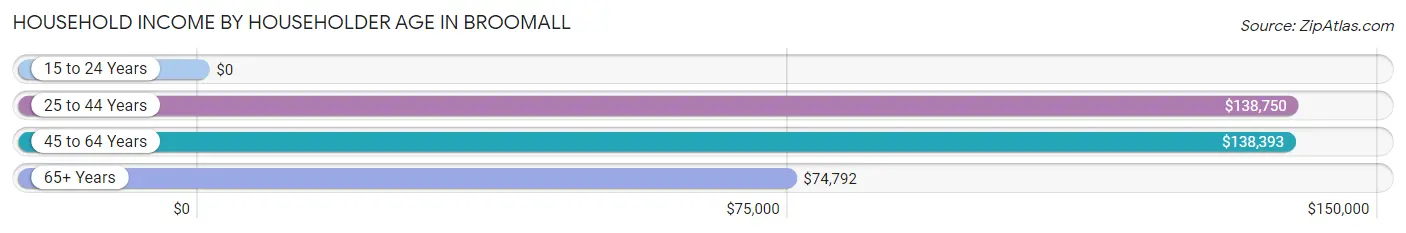
| Income Bracket | # Households | Median Income |
| 15 to 24 Years | 28 (0.7%) | $0 |
| 25 to 44 Years | 834 (21.3%) | $138,750 |
| 45 to 64 Years | 1,631 (41.7%) | $138,393 |
| 65+ Years | 1,420 (36.3%) | $74,792 |
| Total | 3,913 (100.0%) | $113,242 |
Poverty in Broomall
Income Below Poverty by Sex and Age in Broomall
With 3.8% poverty level for males and 3.1% for females among the residents of Broomall, 5 year old males and 75 year old and over females are the most vulnerable to poverty, with 9 males (40.9%) and 61 females (9.5%) in their respective age groups living below the poverty level.
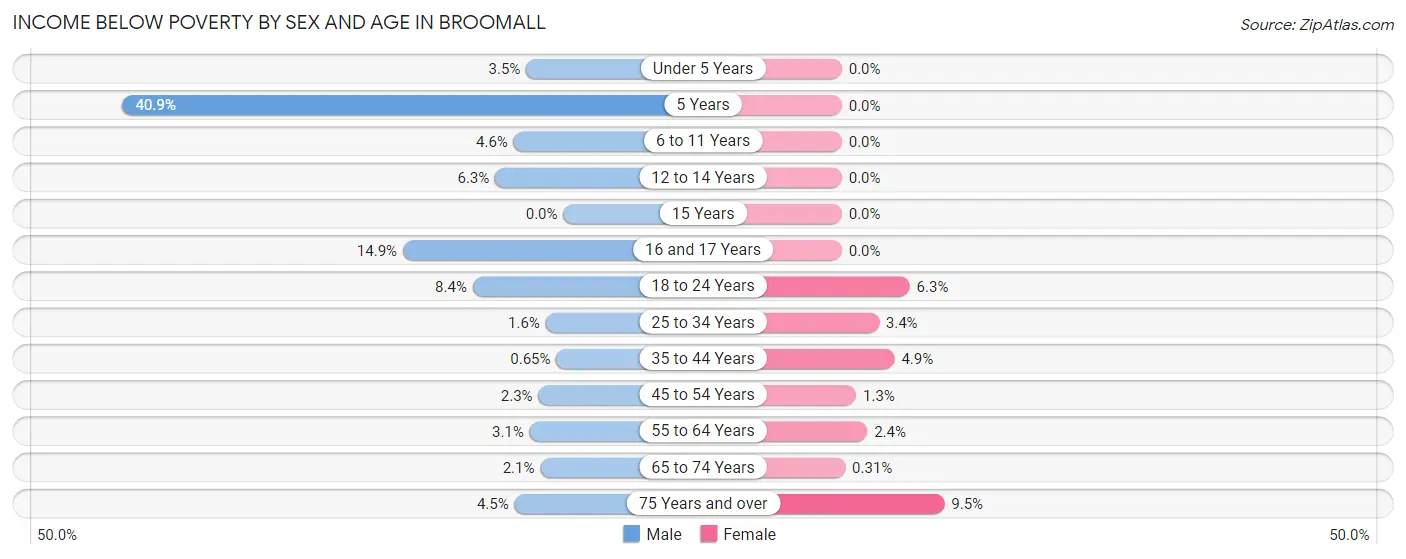
| Age Bracket | Male | Female |
| Under 5 Years | 8 (3.5%) | 0 (0.0%) |
| 5 Years | 9 (40.9%) | 0 (0.0%) |
| 6 to 11 Years | 17 (4.6%) | 0 (0.0%) |
| 12 to 14 Years | 10 (6.3%) | 0 (0.0%) |
| 15 Years | 0 (0.0%) | 0 (0.0%) |
| 16 and 17 Years | 35 (14.9%) | 0 (0.0%) |
| 18 to 24 Years | 28 (8.4%) | 30 (6.3%) |
| 25 to 34 Years | 11 (1.6%) | 26 (3.4%) |
| 35 to 44 Years | 3 (0.6%) | 27 (4.9%) |
| 45 to 54 Years | 16 (2.3%) | 8 (1.3%) |
| 55 to 64 Years | 25 (3.1%) | 21 (2.4%) |
| 65 to 74 Years | 12 (2.1%) | 2 (0.3%) |
| 75 Years and over | 17 (4.5%) | 61 (9.5%) |
| Total | 191 (3.8%) | 175 (3.1%) |
Income Above Poverty by Sex and Age in Broomall
According to the poverty statistics in Broomall, males aged 15 years and females aged under 5 years are the age groups that are most secure financially, with 100.0% of males and 100.0% of females in these age groups living above the poverty line.
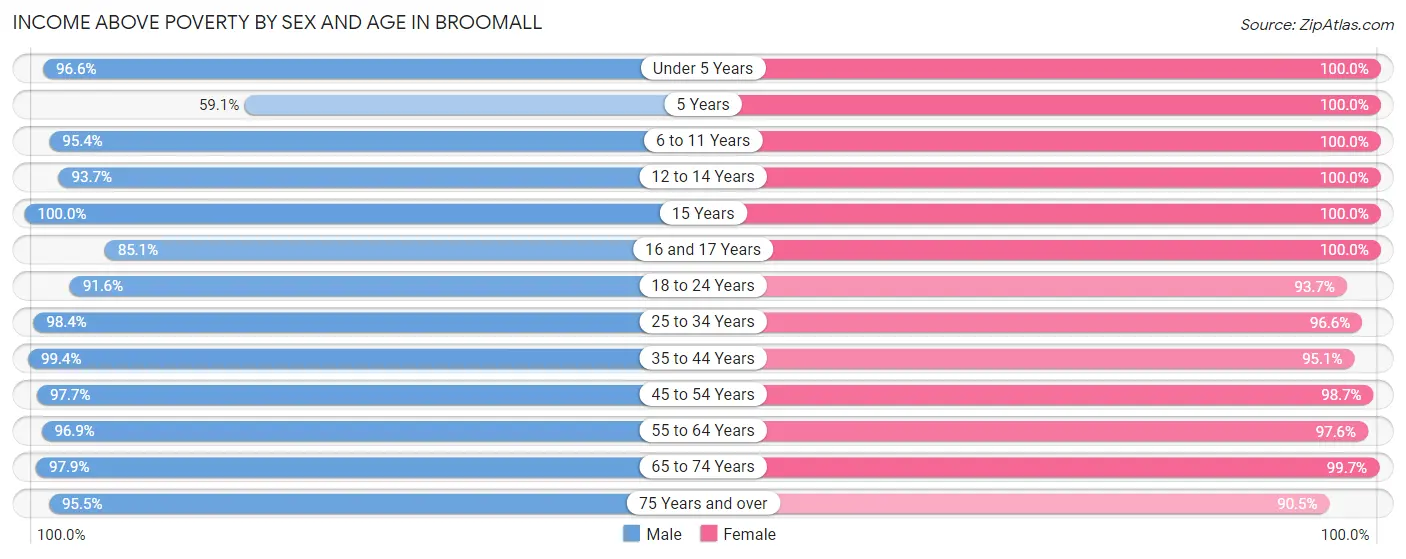
| Age Bracket | Male | Female |
| Under 5 Years | 224 (96.6%) | 316 (100.0%) |
| 5 Years | 13 (59.1%) | 53 (100.0%) |
| 6 to 11 Years | 352 (95.4%) | 311 (100.0%) |
| 12 to 14 Years | 148 (93.7%) | 216 (100.0%) |
| 15 Years | 44 (100.0%) | 91 (100.0%) |
| 16 and 17 Years | 200 (85.1%) | 70 (100.0%) |
| 18 to 24 Years | 305 (91.6%) | 446 (93.7%) |
| 25 to 34 Years | 661 (98.4%) | 729 (96.6%) |
| 35 to 44 Years | 461 (99.4%) | 525 (95.1%) |
| 45 to 54 Years | 676 (97.7%) | 592 (98.7%) |
| 55 to 64 Years | 774 (96.9%) | 869 (97.6%) |
| 65 to 74 Years | 549 (97.9%) | 644 (99.7%) |
| 75 Years and over | 358 (95.5%) | 580 (90.5%) |
| Total | 4,765 (96.2%) | 5,442 (96.9%) |
Income Below Poverty Among Married-Couple Families in Broomall
The poverty statistics for married-couple families in Broomall show that 1.5% or 38 of the total 2,455 families live below the poverty line. Families with 1 or 2 children have the highest poverty rate of 2.0%, comprising of 16 families. On the other hand, families with 3 or 4 children have the lowest poverty rate of 0.0%, which includes 0 families.
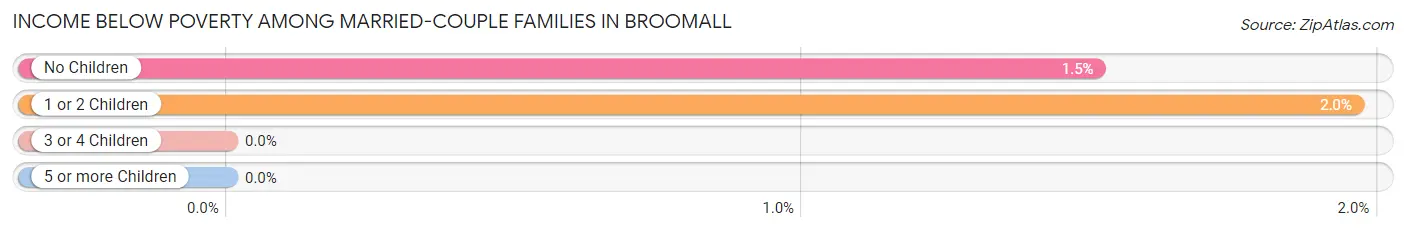
| Children | Above Poverty | Below Poverty |
| No Children | 1,435 (98.5%) | 22 (1.5%) |
| 1 or 2 Children | 800 (98.0%) | 16 (2.0%) |
| 3 or 4 Children | 168 (100.0%) | 0 (0.0%) |
| 5 or more Children | 14 (100.0%) | 0 (0.0%) |
| Total | 2,417 (98.5%) | 38 (1.5%) |
Income Below Poverty Among Single-Parent Households in Broomall
According to the poverty data in Broomall, 8.4% or 9 single-father households and 7.5% or 29 single-mother households are living below the poverty line. Among single-father households, those with 1 or 2 children have the highest poverty rate, with 9 households (13.4%) experiencing poverty. Likewise, among single-mother households, those with 3 or 4 children have the highest poverty rate, with 10 households (50.0%) falling below the poverty line.
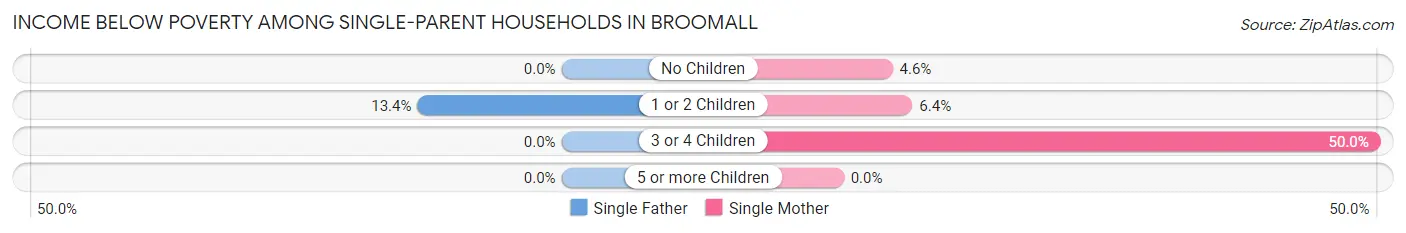
| Children | Single Father | Single Mother |
| No Children | 0 (0.0%) | 11 (4.6%) |
| 1 or 2 Children | 9 (13.4%) | 8 (6.4%) |
| 3 or 4 Children | 0 (0.0%) | 10 (50.0%) |
| 5 or more Children | 0 (0.0%) | 0 (0.0%) |
| Total | 9 (8.4%) | 29 (7.5%) |
Income Below Poverty Among Married-Couple vs Single-Parent Households in Broomall
The poverty data for Broomall shows that 38 of the married-couple family households (1.5%) and 38 of the single-parent households (7.7%) are living below the poverty level. Within the married-couple family households, those with 1 or 2 children have the highest poverty rate, with 16 households (2.0%) falling below the poverty line. Among the single-parent households, those with 3 or 4 children have the highest poverty rate, with 10 household (50.0%) living below poverty.
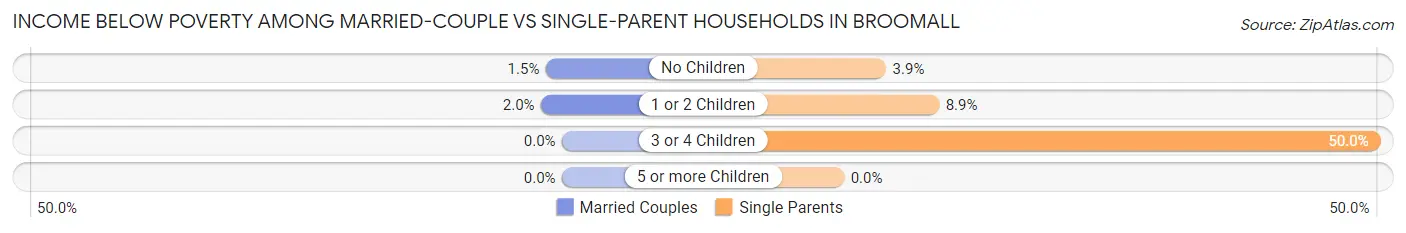
| Children | Married-Couple Families | Single-Parent Households |
| No Children | 22 (1.5%) | 11 (3.9%) |
| 1 or 2 Children | 16 (2.0%) | 17 (8.8%) |
| 3 or 4 Children | 0 (0.0%) | 10 (50.0%) |
| 5 or more Children | 0 (0.0%) | 0 (0.0%) |
| Total | 38 (1.5%) | 38 (7.7%) |
Employment Characteristics in Broomall
Employment by Class of Employer in Broomall
Among the 5,616 employed individuals in Broomall, private company employees (3,486 | 62.1%), not-for-profit organizations (1,138 | 20.3%), and local government employees (369 | 6.6%) make up the most common classes of employment.
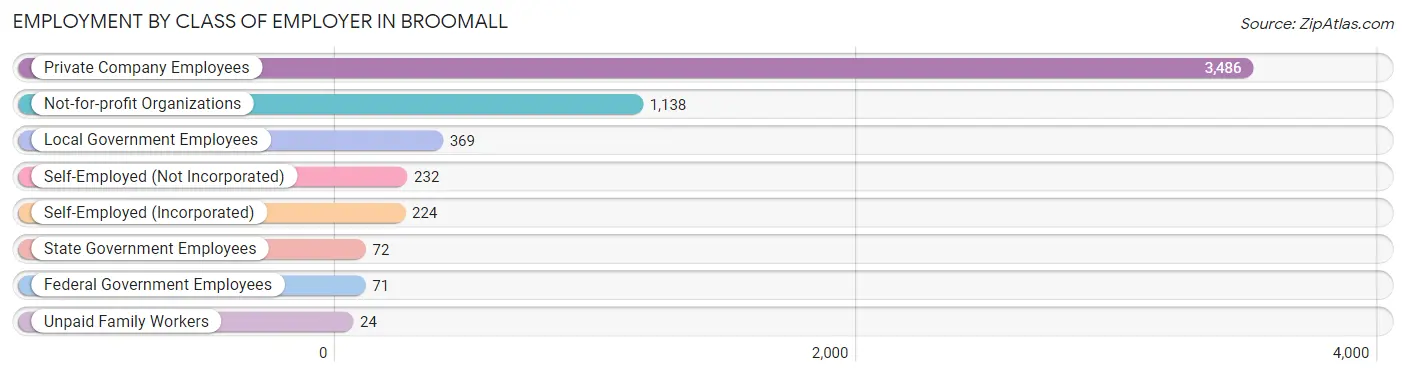
| Employer Class | # Employees | % Employees |
| Private Company Employees | 3,486 | 62.1% |
| Self-Employed (Incorporated) | 224 | 4.0% |
| Self-Employed (Not Incorporated) | 232 | 4.1% |
| Not-for-profit Organizations | 1,138 | 20.3% |
| Local Government Employees | 369 | 6.6% |
| State Government Employees | 72 | 1.3% |
| Federal Government Employees | 71 | 1.3% |
| Unpaid Family Workers | 24 | 0.4% |
| Total | 5,616 | 100.0% |
Employment Status by Age in Broomall
According to the labor force statistics for Broomall, out of the total population over 16 years of age (8,761), 67.4% or 5,905 individuals are in the labor force, with 2.8% or 165 of them unemployed. The age group with the highest labor force participation rate is 25 to 29 years, with 92.1% or 704 individuals in the labor force. Within the labor force, the 16 to 19 years age range has the highest percentage of unemployed individuals, with 39.0% or 78 of them being unemployed.
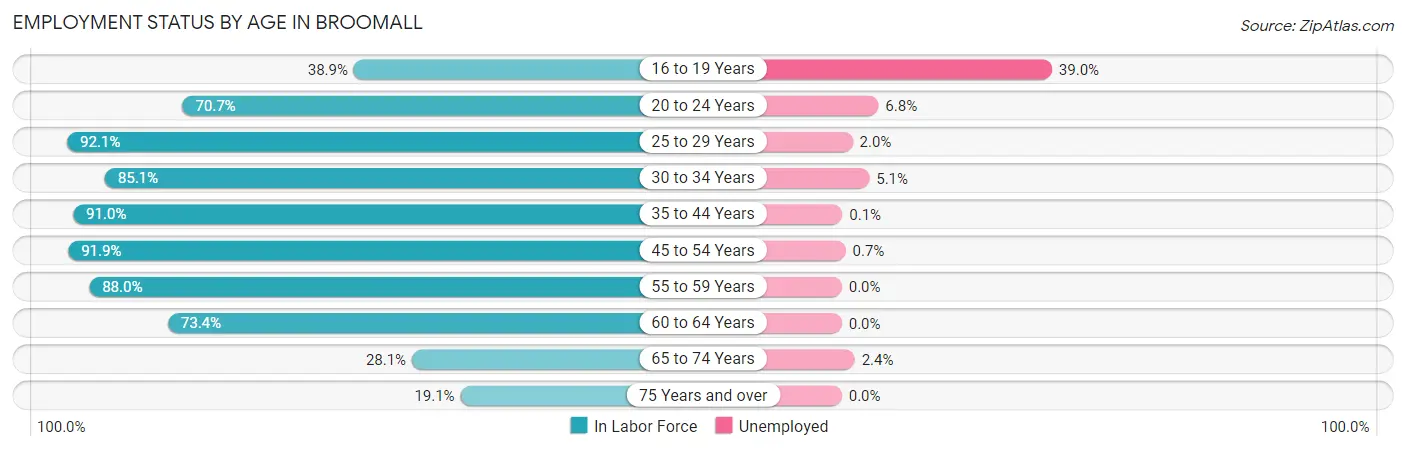
| Age Bracket | In Labor Force | Unemployed |
| 16 to 19 Years | 200 (38.9%) | 78 (39.0%) |
| 20 to 24 Years | 424 (70.7%) | 29 (6.8%) |
| 25 to 29 Years | 704 (92.1%) | 14 (2.0%) |
| 30 to 34 Years | 564 (85.1%) | 29 (5.1%) |
| 35 to 44 Years | 925 (91.0%) | 1 (0.1%) |
| 45 to 54 Years | 1,187 (91.9%) | 8 (0.7%) |
| 55 to 59 Years | 765 (88.0%) | 0 (0.0%) |
| 60 to 64 Years | 602 (73.4%) | 0 (0.0%) |
| 65 to 74 Years | 339 (28.1%) | 8 (2.4%) |
| 75 Years and over | 194 (19.1%) | 0 (0.0%) |
| Total | 5,905 (67.4%) | 165 (2.8%) |
Employment Status by Educational Attainment in Broomall
According to labor force statistics for Broomall, 87.5% of individuals (4,746) out of the total population between 25 and 64 years of age (5,424) are in the labor force, with 1.1% or 52 of them being unemployed. The group with the highest labor force participation rate are those with the educational attainment of less than high school, with 96.1% or 148 individuals in the labor force. Within the labor force, individuals with bachelor's degree or higher education have the highest percentage of unemployment, with 1.5% or 39 of them being unemployed.
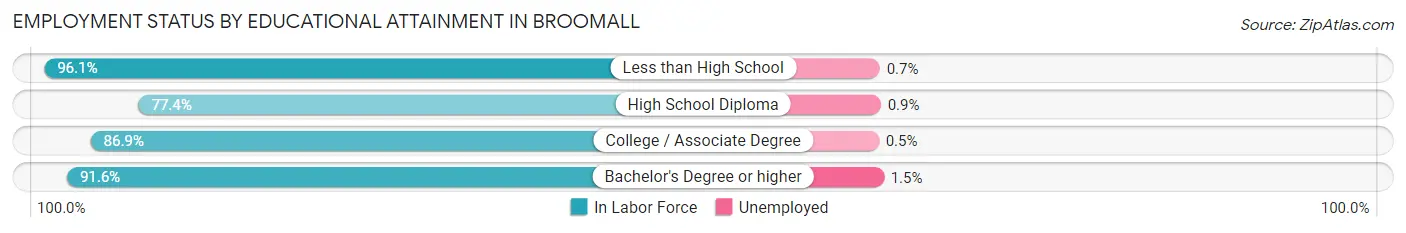
| Educational Attainment | In Labor Force | Unemployed |
| Less than High School | 148 (96.1%) | 1 (0.7%) |
| High School Diploma | 935 (77.4%) | 11 (0.9%) |
| College / Associate Degree | 1,071 (86.9%) | 6 (0.5%) |
| Bachelor's Degree or higher | 2,592 (91.6%) | 42 (1.5%) |
| Total | 4,746 (87.5%) | 60 (1.1%) |
Employment Occupations by Sex in Broomall
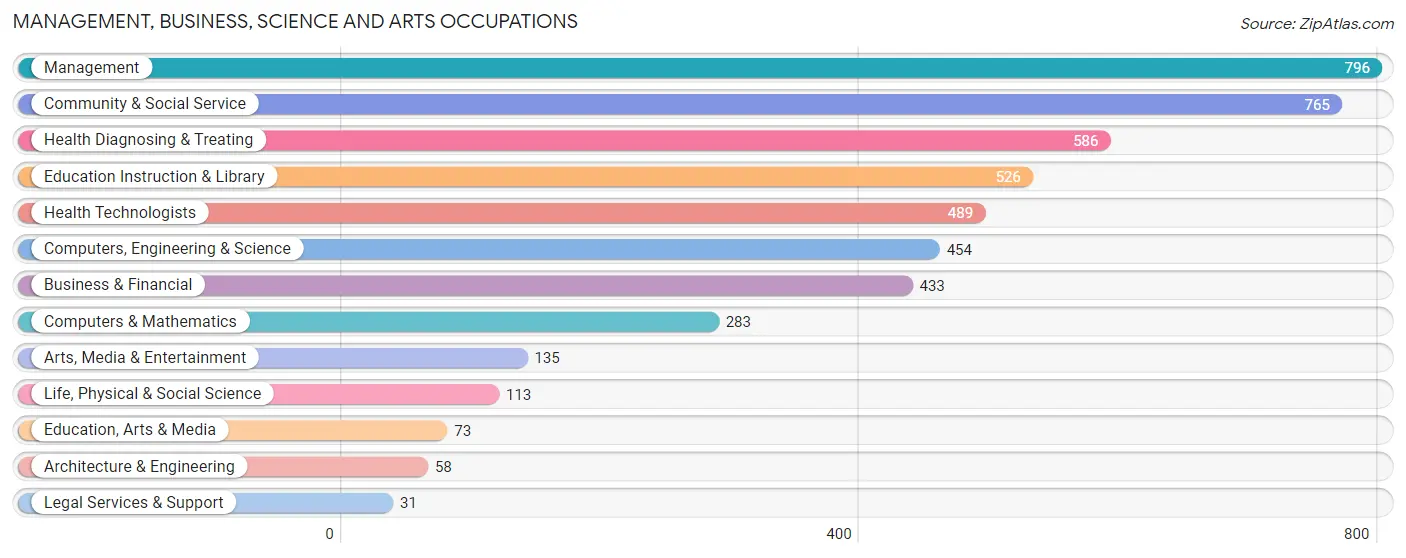
Management, Business, Science and Arts Occupations
The most common Management, Business, Science and Arts occupations in Broomall are Management (796 | 13.9%), Community & Social Service (765 | 13.3%), Health Diagnosing & Treating (586 | 10.2%), Education Instruction & Library (526 | 9.2%), and Health Technologists (489 | 8.5%).
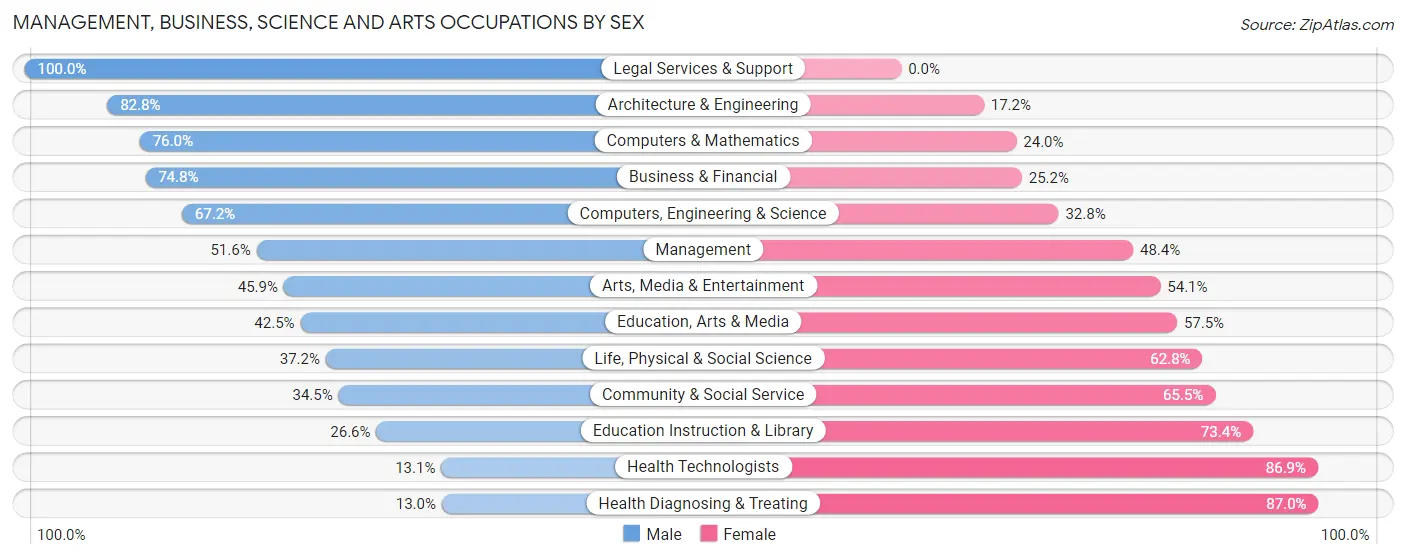
Management, Business, Science and Arts Occupations by Sex
Within the Management, Business, Science and Arts occupations in Broomall, the most male-oriented occupations are Legal Services & Support (100.0%), Architecture & Engineering (82.8%), and Computers & Mathematics (76.0%), while the most female-oriented occupations are Health Diagnosing & Treating (87.0%), Health Technologists (86.9%), and Education Instruction & Library (73.4%).
| Occupation | Male | Female |
| Management | 411 (51.6%) | 385 (48.4%) |
| Business & Financial | 324 (74.8%) | 109 (25.2%) |
| Computers, Engineering & Science | 305 (67.2%) | 149 (32.8%) |
| Computers & Mathematics | 215 (76.0%) | 68 (24.0%) |
| Architecture & Engineering | 48 (82.8%) | 10 (17.2%) |
| Life, Physical & Social Science | 42 (37.2%) | 71 (62.8%) |
| Community & Social Service | 264 (34.5%) | 501 (65.5%) |
| Education, Arts & Media | 31 (42.5%) | 42 (57.5%) |
| Legal Services & Support | 31 (100.0%) | 0 (0.0%) |
| Education Instruction & Library | 140 (26.6%) | 386 (73.4%) |
| Arts, Media & Entertainment | 62 (45.9%) | 73 (54.1%) |
| Health Diagnosing & Treating | 76 (13.0%) | 510 (87.0%) |
| Health Technologists | 64 (13.1%) | 425 (86.9%) |
| Total (Category) | 1,380 (45.5%) | 1,654 (54.5%) |
| Total (Overall) | 2,981 (52.0%) | 2,756 (48.0%) |
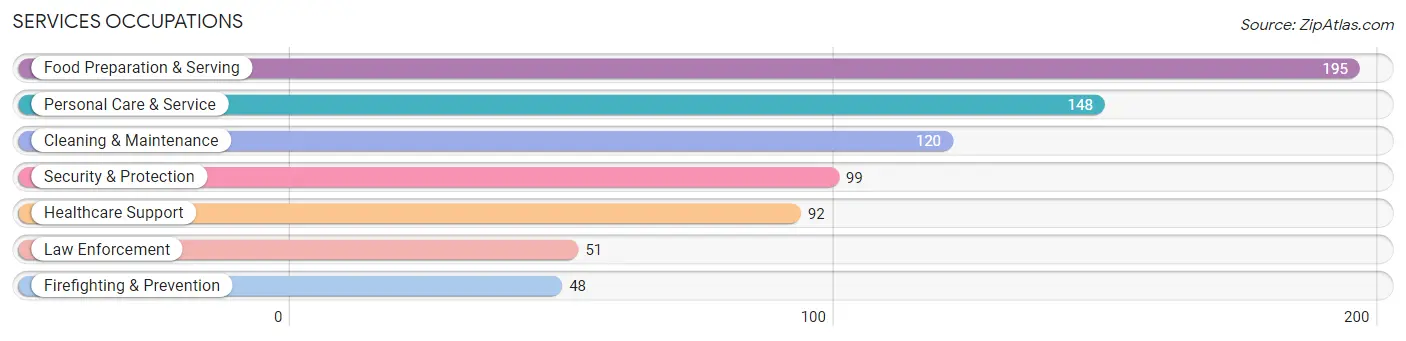
Services Occupations
The most common Services occupations in Broomall are Food Preparation & Serving (195 | 3.4%), Personal Care & Service (148 | 2.6%), Cleaning & Maintenance (120 | 2.1%), Security & Protection (99 | 1.7%), and Healthcare Support (92 | 1.6%).
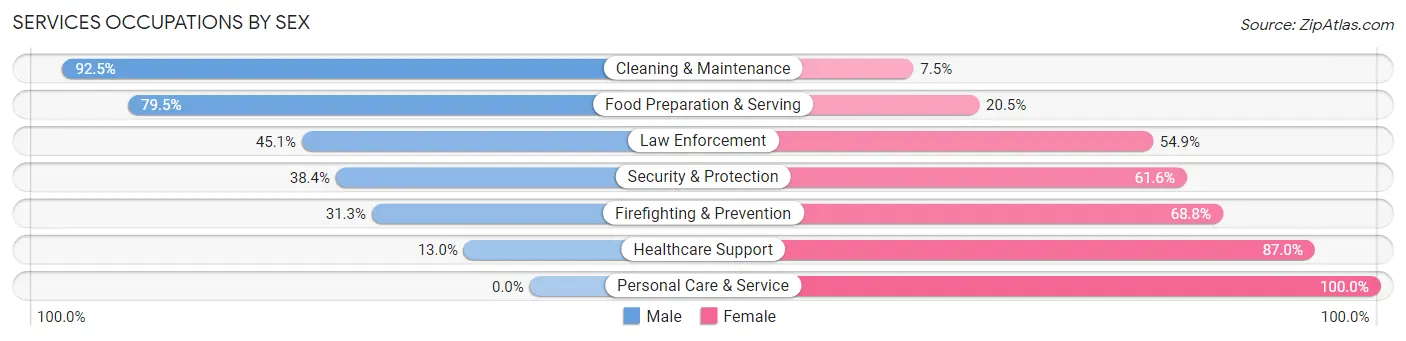
Services Occupations by Sex
Within the Services occupations in Broomall, the most male-oriented occupations are Cleaning & Maintenance (92.5%), Food Preparation & Serving (79.5%), and Law Enforcement (45.1%), while the most female-oriented occupations are Personal Care & Service (100.0%), Healthcare Support (87.0%), and Firefighting & Prevention (68.8%).
| Occupation | Male | Female |
| Healthcare Support | 12 (13.0%) | 80 (87.0%) |
| Security & Protection | 38 (38.4%) | 61 (61.6%) |
| Firefighting & Prevention | 15 (31.2%) | 33 (68.8%) |
| Law Enforcement | 23 (45.1%) | 28 (54.9%) |
| Food Preparation & Serving | 155 (79.5%) | 40 (20.5%) |
| Cleaning & Maintenance | 111 (92.5%) | 9 (7.5%) |
| Personal Care & Service | 0 (0.0%) | 148 (100.0%) |
| Total (Category) | 316 (48.3%) | 338 (51.7%) |
| Total (Overall) | 2,981 (52.0%) | 2,756 (48.0%) |
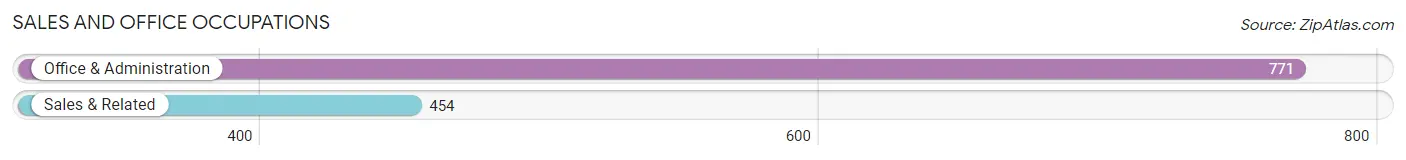
Sales and Office Occupations
The most common Sales and Office occupations in Broomall are Office & Administration (771 | 13.4%), and Sales & Related (454 | 7.9%).
Sales and Office Occupations by Sex
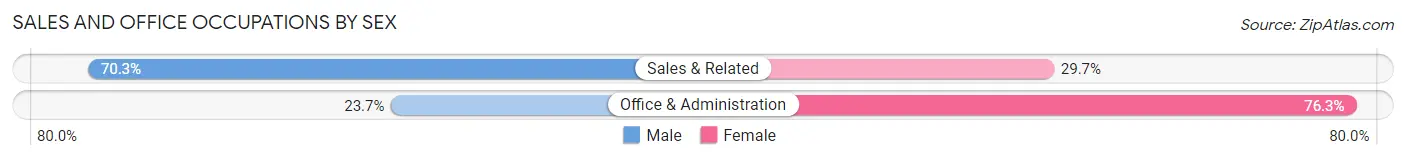
| Occupation | Male | Female |
| Sales & Related | 319 (70.3%) | 135 (29.7%) |
| Office & Administration | 183 (23.7%) | 588 (76.3%) |
| Total (Category) | 502 (41.0%) | 723 (59.0%) |
| Total (Overall) | 2,981 (52.0%) | 2,756 (48.0%) |
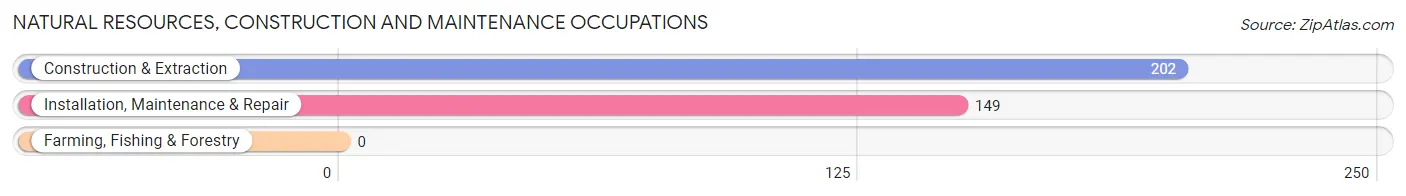
Natural Resources, Construction and Maintenance Occupations
The most common Natural Resources, Construction and Maintenance occupations in Broomall are Construction & Extraction (202 | 3.5%), and Installation, Maintenance & Repair (149 | 2.6%).
Natural Resources, Construction and Maintenance Occupations by Sex
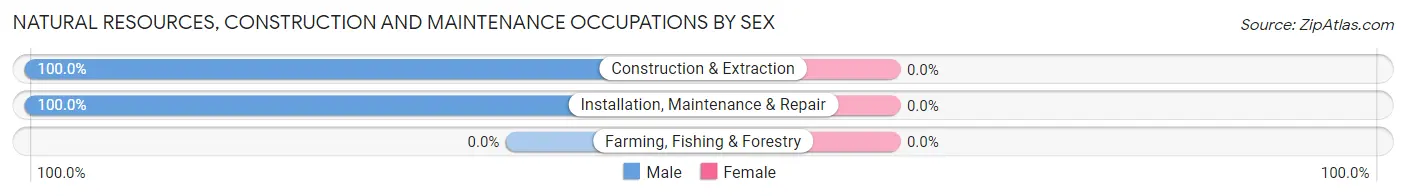
| Occupation | Male | Female |
| Farming, Fishing & Forestry | 0 (0.0%) | 0 (0.0%) |
| Construction & Extraction | 202 (100.0%) | 0 (0.0%) |
| Installation, Maintenance & Repair | 149 (100.0%) | 0 (0.0%) |
| Total (Category) | 351 (100.0%) | 0 (0.0%) |
| Total (Overall) | 2,981 (52.0%) | 2,756 (48.0%) |
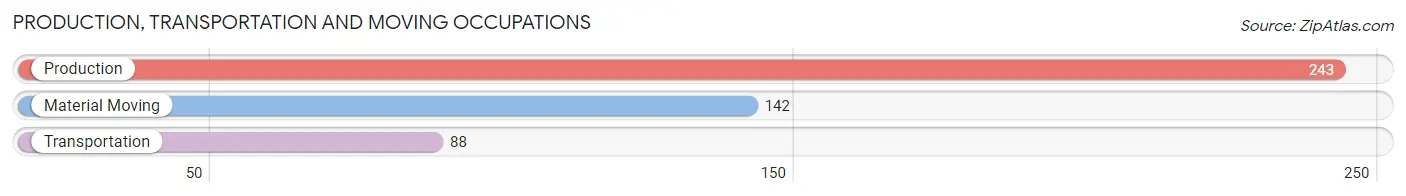
Production, Transportation and Moving Occupations
The most common Production, Transportation and Moving occupations in Broomall are Production (243 | 4.2%), Material Moving (142 | 2.5%), and Transportation (88 | 1.5%).
Production, Transportation and Moving Occupations by Sex
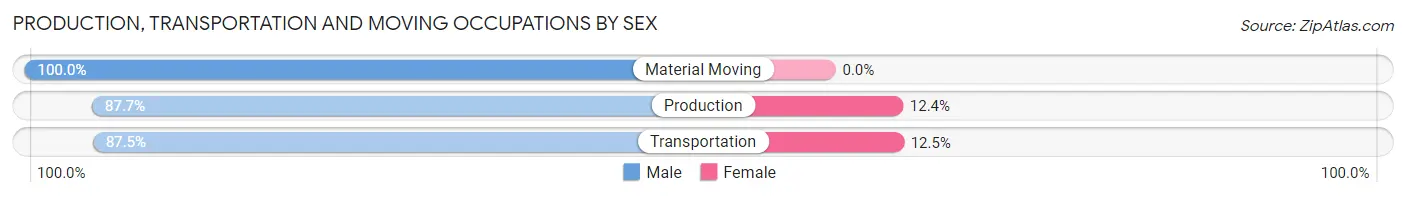
| Occupation | Male | Female |
| Production | 213 (87.6%) | 30 (12.3%) |
| Transportation | 77 (87.5%) | 11 (12.5%) |
| Material Moving | 142 (100.0%) | 0 (0.0%) |
| Total (Category) | 432 (91.3%) | 41 (8.7%) |
| Total (Overall) | 2,981 (52.0%) | 2,756 (48.0%) |
Employment Industries by Sex in Broomall
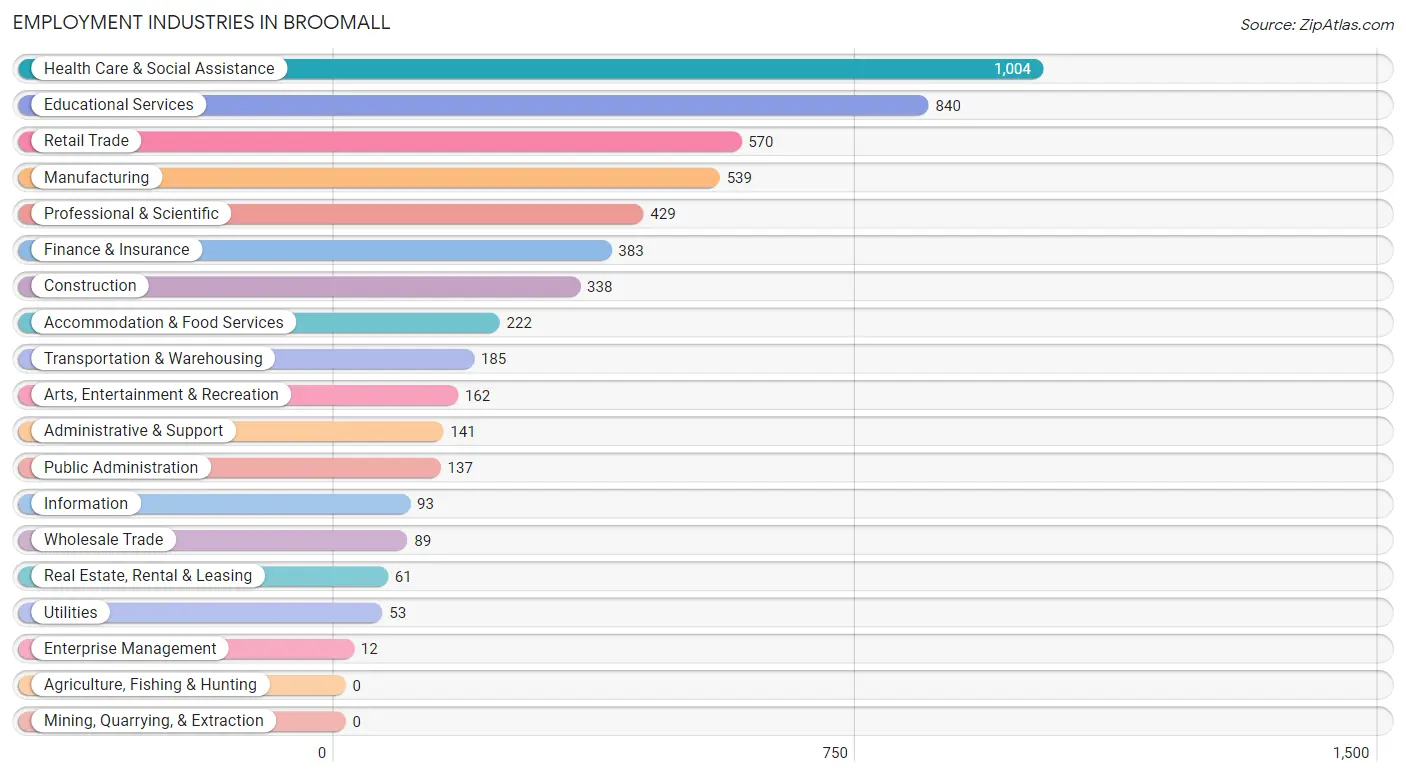
Employment Industries in Broomall
The major employment industries in Broomall include Health Care & Social Assistance (1,004 | 17.5%), Educational Services (840 | 14.6%), Retail Trade (570 | 9.9%), Manufacturing (539 | 9.4%), and Professional & Scientific (429 | 7.5%).
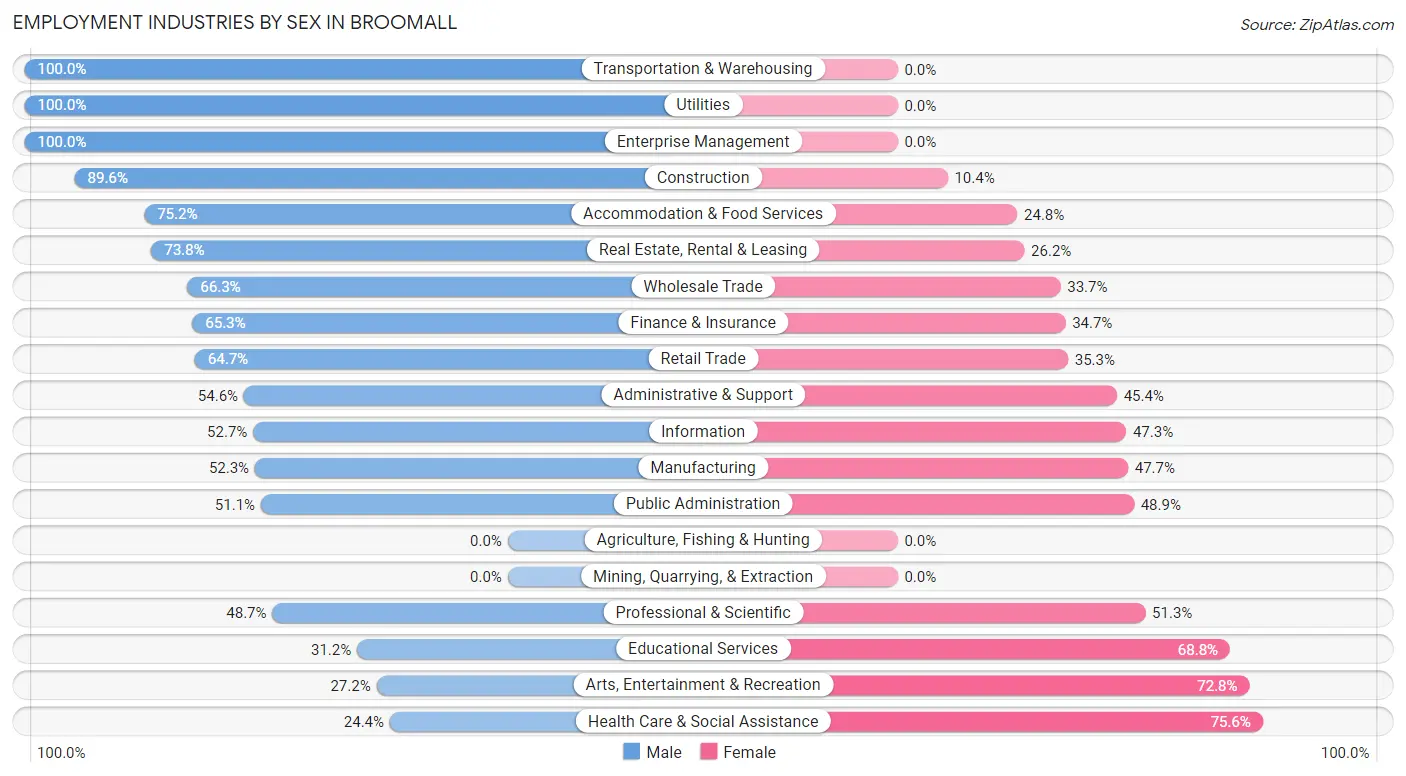
Employment Industries by Sex in Broomall
The Broomall industries that see more men than women are Transportation & Warehousing (100.0%), Utilities (100.0%), and Enterprise Management (100.0%), whereas the industries that tend to have a higher number of women are Health Care & Social Assistance (75.6%), Arts, Entertainment & Recreation (72.8%), and Educational Services (68.8%).
| Industry | Male | Female |
| Agriculture, Fishing & Hunting | 0 (0.0%) | 0 (0.0%) |
| Mining, Quarrying, & Extraction | 0 (0.0%) | 0 (0.0%) |
| Construction | 303 (89.6%) | 35 (10.4%) |
| Manufacturing | 282 (52.3%) | 257 (47.7%) |
| Wholesale Trade | 59 (66.3%) | 30 (33.7%) |
| Retail Trade | 369 (64.7%) | 201 (35.3%) |
| Transportation & Warehousing | 185 (100.0%) | 0 (0.0%) |
| Utilities | 53 (100.0%) | 0 (0.0%) |
| Information | 49 (52.7%) | 44 (47.3%) |
| Finance & Insurance | 250 (65.3%) | 133 (34.7%) |
| Real Estate, Rental & Leasing | 45 (73.8%) | 16 (26.2%) |
| Professional & Scientific | 209 (48.7%) | 220 (51.3%) |
| Enterprise Management | 12 (100.0%) | 0 (0.0%) |
| Administrative & Support | 77 (54.6%) | 64 (45.4%) |
| Educational Services | 262 (31.2%) | 578 (68.8%) |
| Health Care & Social Assistance | 245 (24.4%) | 759 (75.6%) |
| Arts, Entertainment & Recreation | 44 (27.2%) | 118 (72.8%) |
| Accommodation & Food Services | 167 (75.2%) | 55 (24.8%) |
| Public Administration | 70 (51.1%) | 67 (48.9%) |
| Total | 2,981 (52.0%) | 2,756 (48.0%) |
Education in Broomall
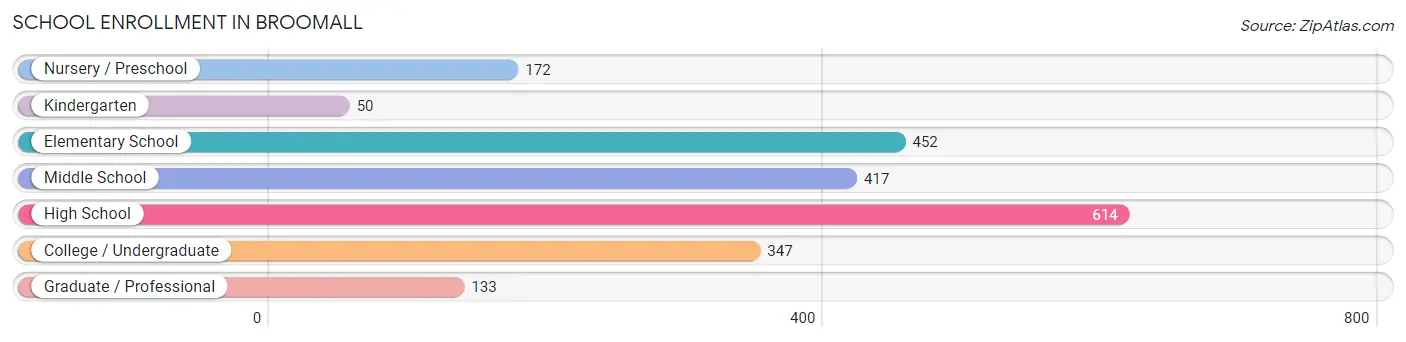
School Enrollment in Broomall
The most common levels of schooling among the 2,185 students in Broomall are high school (614 | 28.1%), elementary school (452 | 20.7%), and middle school (417 | 19.1%).
| School Level | # Students | % Students |
| Nursery / Preschool | 172 | 7.9% |
| Kindergarten | 50 | 2.3% |
| Elementary School | 452 | 20.7% |
| Middle School | 417 | 19.1% |
| High School | 614 | 28.1% |
| College / Undergraduate | 347 | 15.9% |
| Graduate / Professional | 133 | 6.1% |
| Total | 2,185 | 100.0% |
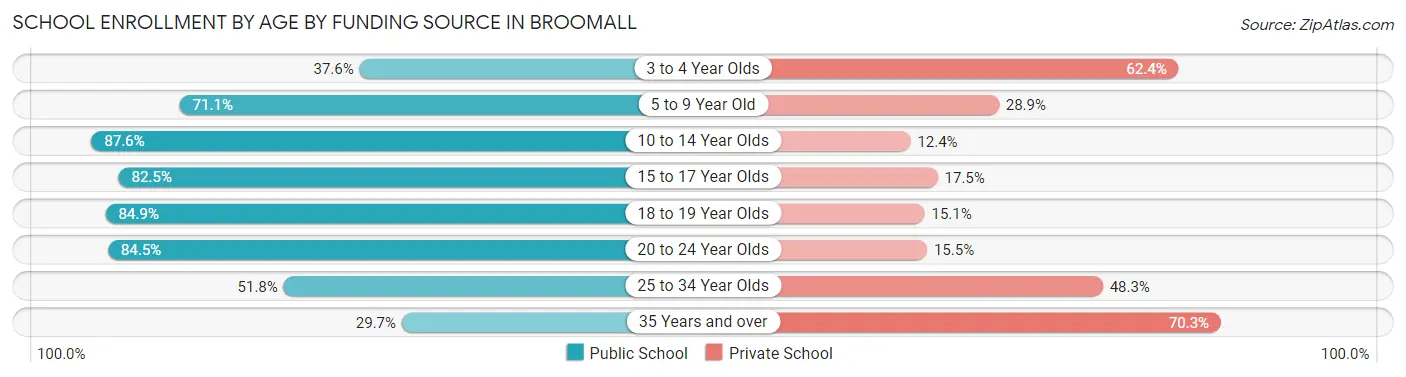
School Enrollment by Age by Funding Source in Broomall
Out of a total of 2,185 students who are enrolled in schools in Broomall, 535 (24.5%) attend a private institution, while the remaining 1,650 (75.5%) are enrolled in public schools. The age group of 35 years and over has the highest likelihood of being enrolled in private schools, with 52 (70.3% in the age bracket) enrolled. Conversely, the age group of 10 to 14 year olds has the lowest likelihood of being enrolled in a private school, with 528 (87.6% in the age bracket) attending a public institution.
| Age Bracket | Public School | Private School |
| 3 to 4 Year Olds | 44 (37.6%) | 73 (62.4%) |
| 5 to 9 Year Old | 347 (71.1%) | 141 (28.9%) |
| 10 to 14 Year Olds | 528 (87.6%) | 75 (12.4%) |
| 15 to 17 Year Olds | 363 (82.5%) | 77 (17.5%) |
| 18 to 19 Year Olds | 124 (84.9%) | 22 (15.1%) |
| 20 to 24 Year Olds | 147 (84.5%) | 27 (15.5%) |
| 25 to 34 Year Olds | 74 (51.7%) | 69 (48.2%) |
| 35 Years and over | 22 (29.7%) | 52 (70.3%) |
| Total | 1,650 (75.5%) | 535 (24.5%) |
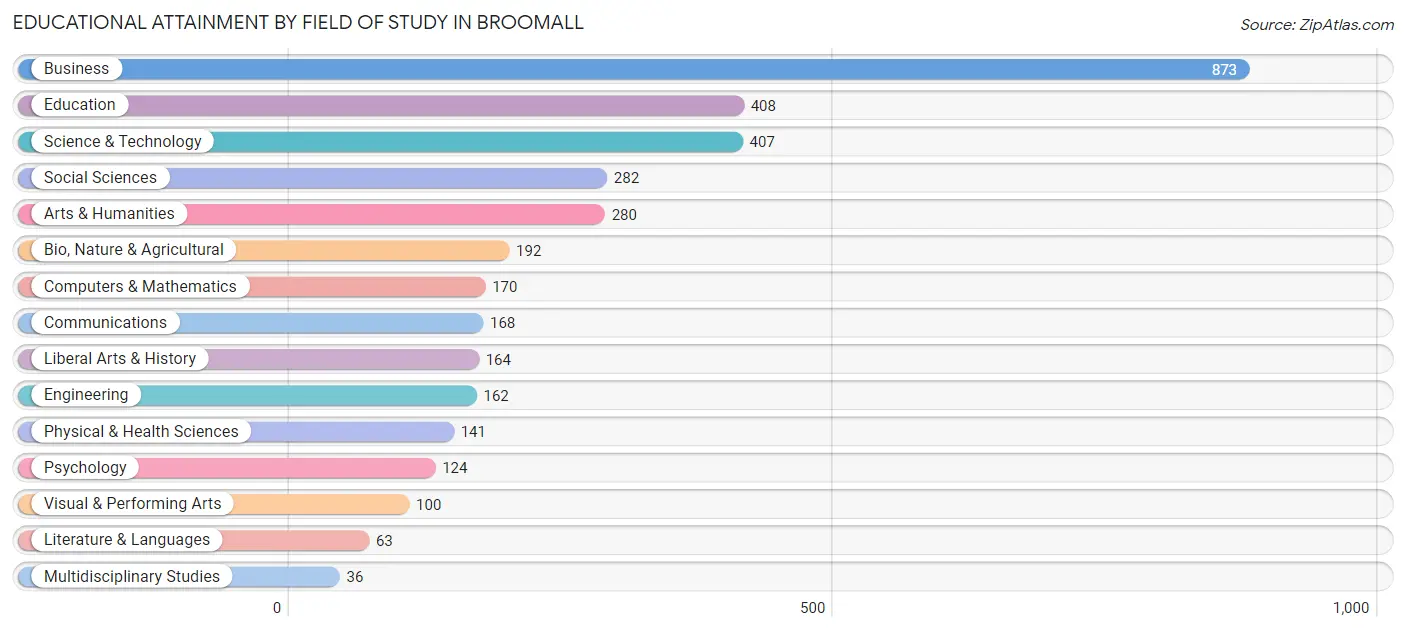
Educational Attainment by Field of Study in Broomall
Business (873 | 24.4%), education (408 | 11.4%), science & technology (407 | 11.4%), social sciences (282 | 7.9%), and arts & humanities (280 | 7.8%) are the most common fields of study among 3,570 individuals in Broomall who have obtained a bachelor's degree or higher.
| Field of Study | # Graduates | % Graduates |
| Computers & Mathematics | 170 | 4.8% |
| Bio, Nature & Agricultural | 192 | 5.4% |
| Physical & Health Sciences | 141 | 4.0% |
| Psychology | 124 | 3.5% |
| Social Sciences | 282 | 7.9% |
| Engineering | 162 | 4.5% |
| Multidisciplinary Studies | 36 | 1.0% |
| Science & Technology | 407 | 11.4% |
| Business | 873 | 24.4% |
| Education | 408 | 11.4% |
| Literature & Languages | 63 | 1.8% |
| Liberal Arts & History | 164 | 4.6% |
| Visual & Performing Arts | 100 | 2.8% |
| Communications | 168 | 4.7% |
| Arts & Humanities | 280 | 7.8% |
| Total | 3,570 | 100.0% |
Transportation & Commute in Broomall
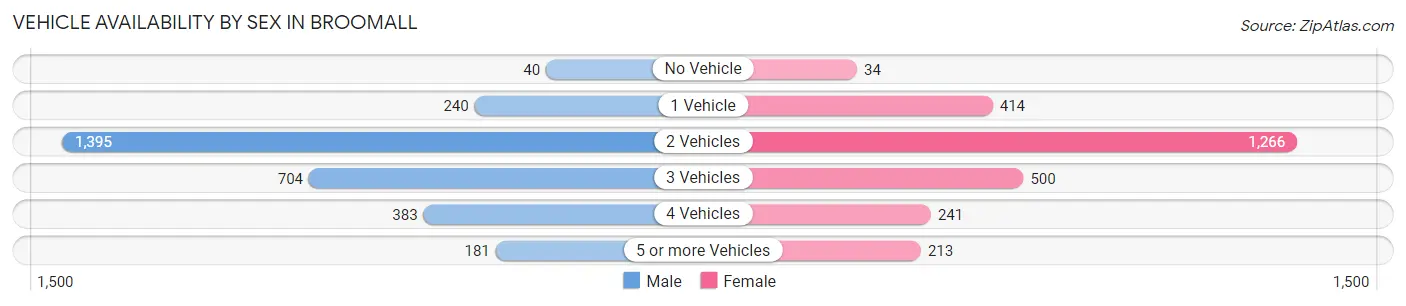
Vehicle Availability by Sex in Broomall
The most prevalent vehicle ownership categories in Broomall are males with 2 vehicles (1,395, accounting for 47.4%) and females with 2 vehicles (1,266, making up 52.3%).
| Vehicles Available | Male | Female |
| No Vehicle | 40 (1.4%) | 34 (1.3%) |
| 1 Vehicle | 240 (8.2%) | 414 (15.5%) |
| 2 Vehicles | 1,395 (47.4%) | 1,266 (47.4%) |
| 3 Vehicles | 704 (23.9%) | 500 (18.7%) |
| 4 Vehicles | 383 (13.0%) | 241 (9.0%) |
| 5 or more Vehicles | 181 (6.1%) | 213 (8.0%) |
| Total | 2,943 (100.0%) | 2,668 (100.0%) |
Commute Time in Broomall
The most frequently occuring commute durations in Broomall are 30 to 34 minutes (848 commuters, 17.1%), 20 to 24 minutes (704 commuters, 14.2%), and 15 to 19 minutes (676 commuters, 13.6%).
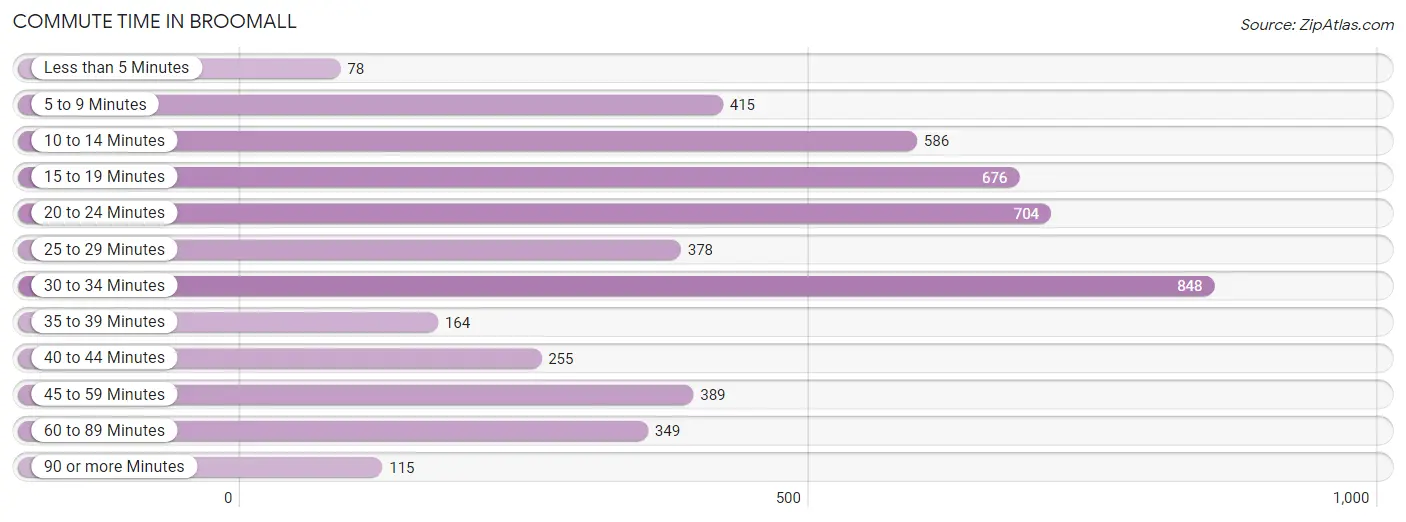
| Commute Time | # Commuters | % Commuters |
| Less than 5 Minutes | 78 | 1.6% |
| 5 to 9 Minutes | 415 | 8.4% |
| 10 to 14 Minutes | 586 | 11.8% |
| 15 to 19 Minutes | 676 | 13.6% |
| 20 to 24 Minutes | 704 | 14.2% |
| 25 to 29 Minutes | 378 | 7.6% |
| 30 to 34 Minutes | 848 | 17.1% |
| 35 to 39 Minutes | 164 | 3.3% |
| 40 to 44 Minutes | 255 | 5.1% |
| 45 to 59 Minutes | 389 | 7.9% |
| 60 to 89 Minutes | 349 | 7.0% |
| 90 or more Minutes | 115 | 2.3% |
Commute Time by Sex in Broomall
The most common commute times in Broomall are 30 to 34 minutes (519 commuters, 19.7%) for males and 15 to 19 minutes (401 commuters, 17.3%) for females.
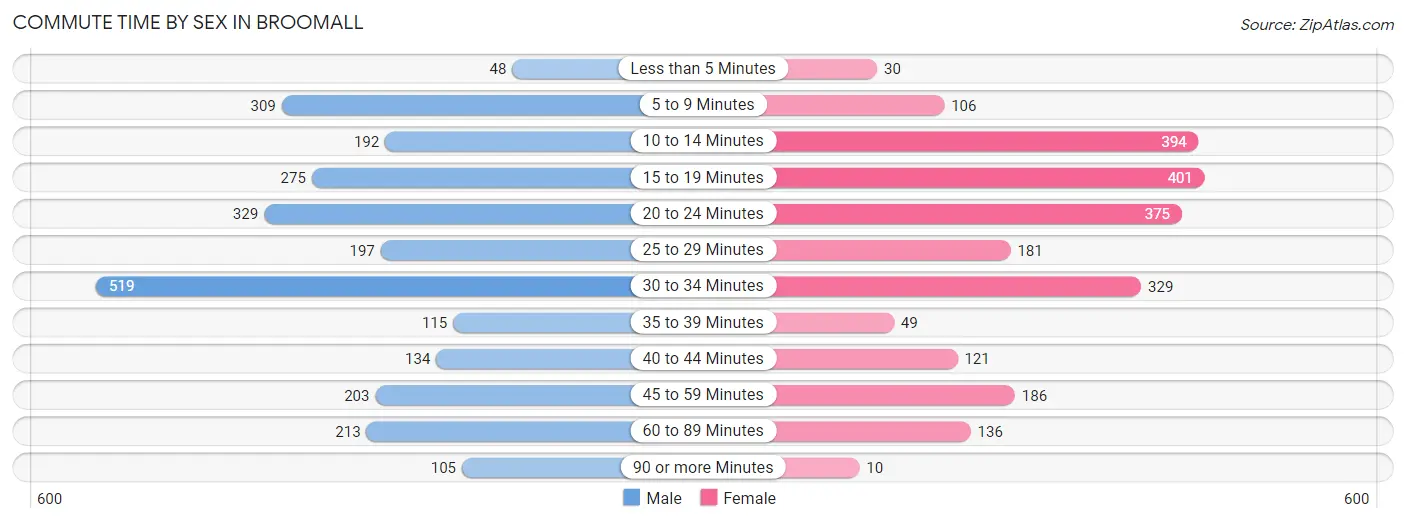
| Commute Time | Male | Female |
| Less than 5 Minutes | 48 (1.8%) | 30 (1.3%) |
| 5 to 9 Minutes | 309 (11.7%) | 106 (4.6%) |
| 10 to 14 Minutes | 192 (7.3%) | 394 (17.0%) |
| 15 to 19 Minutes | 275 (10.4%) | 401 (17.3%) |
| 20 to 24 Minutes | 329 (12.5%) | 375 (16.2%) |
| 25 to 29 Minutes | 197 (7.5%) | 181 (7.8%) |
| 30 to 34 Minutes | 519 (19.7%) | 329 (14.2%) |
| 35 to 39 Minutes | 115 (4.4%) | 49 (2.1%) |
| 40 to 44 Minutes | 134 (5.1%) | 121 (5.2%) |
| 45 to 59 Minutes | 203 (7.7%) | 186 (8.0%) |
| 60 to 89 Minutes | 213 (8.1%) | 136 (5.9%) |
| 90 or more Minutes | 105 (4.0%) | 10 (0.4%) |
Time of Departure to Work by Sex in Broomall
The most frequent times of departure to work in Broomall are 7:30 AM to 7:59 AM (472, 17.9%) for males and 8:00 AM to 8:29 AM (412, 17.8%) for females.
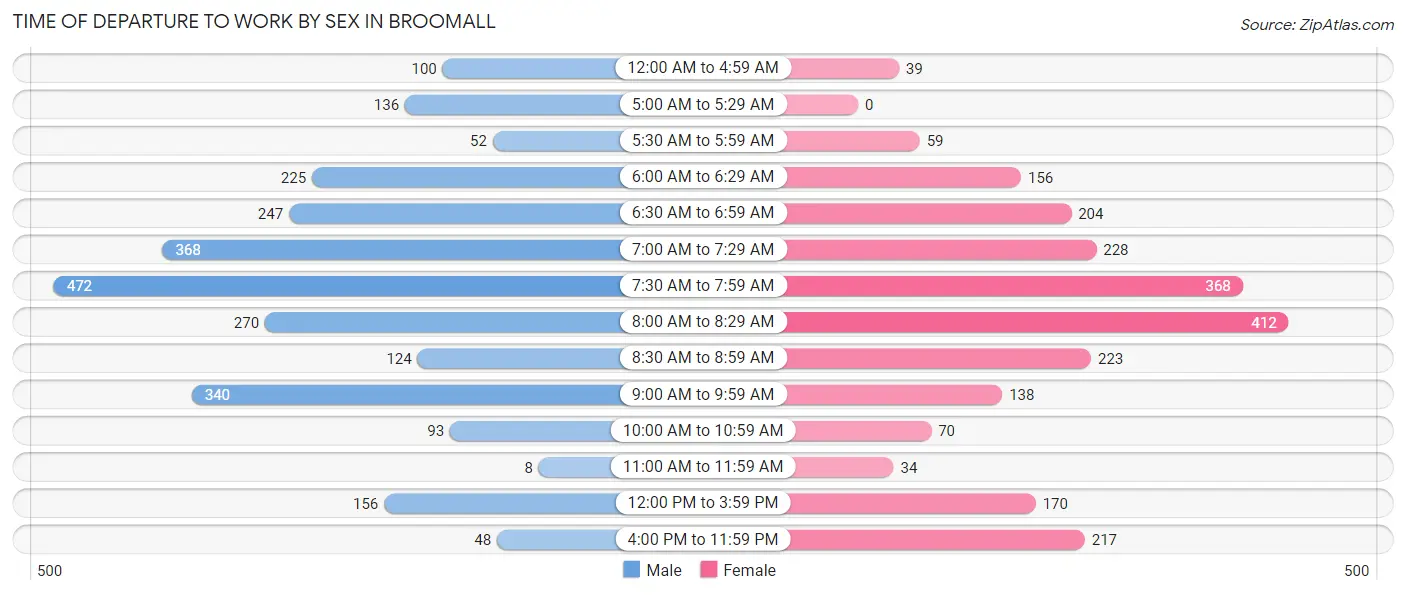
| Time of Departure | Male | Female |
| 12:00 AM to 4:59 AM | 100 (3.8%) | 39 (1.7%) |
| 5:00 AM to 5:29 AM | 136 (5.1%) | 0 (0.0%) |
| 5:30 AM to 5:59 AM | 52 (2.0%) | 59 (2.5%) |
| 6:00 AM to 6:29 AM | 225 (8.5%) | 156 (6.7%) |
| 6:30 AM to 6:59 AM | 247 (9.4%) | 204 (8.8%) |
| 7:00 AM to 7:29 AM | 368 (13.9%) | 228 (9.8%) |
| 7:30 AM to 7:59 AM | 472 (17.9%) | 368 (15.9%) |
| 8:00 AM to 8:29 AM | 270 (10.2%) | 412 (17.8%) |
| 8:30 AM to 8:59 AM | 124 (4.7%) | 223 (9.6%) |
| 9:00 AM to 9:59 AM | 340 (12.9%) | 138 (5.9%) |
| 10:00 AM to 10:59 AM | 93 (3.5%) | 70 (3.0%) |
| 11:00 AM to 11:59 AM | 8 (0.3%) | 34 (1.5%) |
| 12:00 PM to 3:59 PM | 156 (5.9%) | 170 (7.3%) |
| 4:00 PM to 11:59 PM | 48 (1.8%) | 217 (9.4%) |
| Total | 2,639 (100.0%) | 2,318 (100.0%) |
Housing Occupancy in Broomall
Occupancy by Ownership in Broomall
Of the total 3,913 dwellings in Broomall, owner-occupied units account for 3,123 (79.8%), while renter-occupied units make up 790 (20.2%).
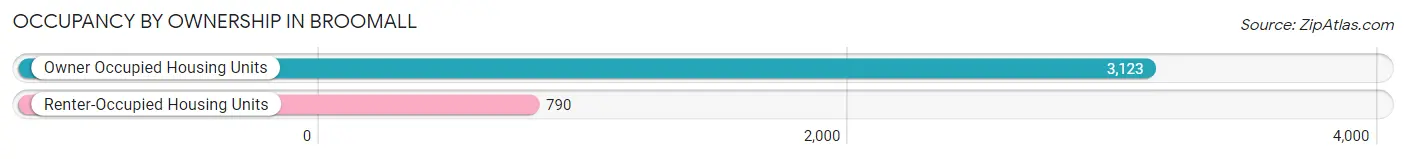
| Occupancy | # Housing Units | % Housing Units |
| Owner Occupied Housing Units | 3,123 | 79.8% |
| Renter-Occupied Housing Units | 790 | 20.2% |
| Total Occupied Housing Units | 3,913 | 100.0% |
Occupancy by Household Size in Broomall
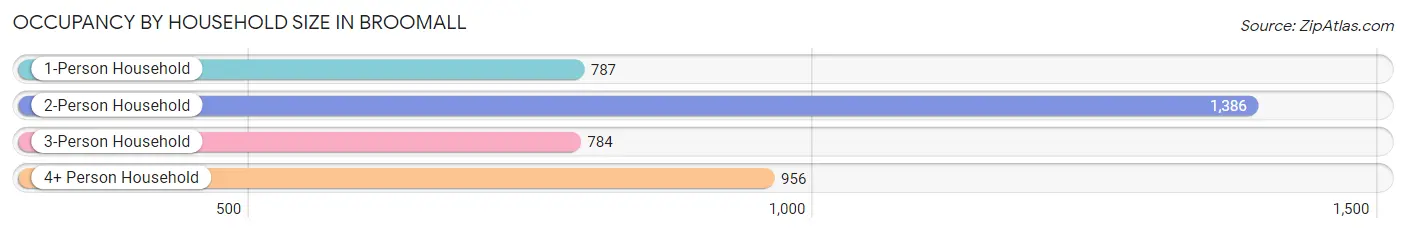
| Household Size | # Housing Units | % Housing Units |
| 1-Person Household | 787 | 20.1% |
| 2-Person Household | 1,386 | 35.4% |
| 3-Person Household | 784 | 20.0% |
| 4+ Person Household | 956 | 24.4% |
| Total Housing Units | 3,913 | 100.0% |
Occupancy by Ownership by Household Size in Broomall
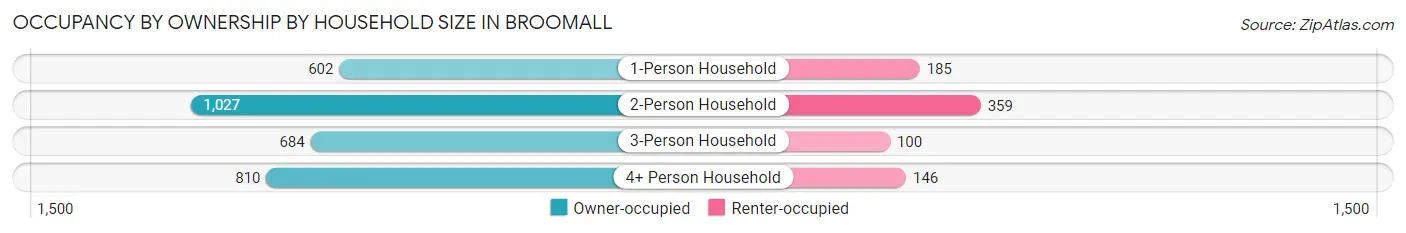
| Household Size | Owner-occupied | Renter-occupied |
| 1-Person Household | 602 (76.5%) | 185 (23.5%) |
| 2-Person Household | 1,027 (74.1%) | 359 (25.9%) |
| 3-Person Household | 684 (87.2%) | 100 (12.8%) |
| 4+ Person Household | 810 (84.7%) | 146 (15.3%) |
| Total Housing Units | 3,123 (79.8%) | 790 (20.2%) |
Occupancy by Educational Attainment in Broomall
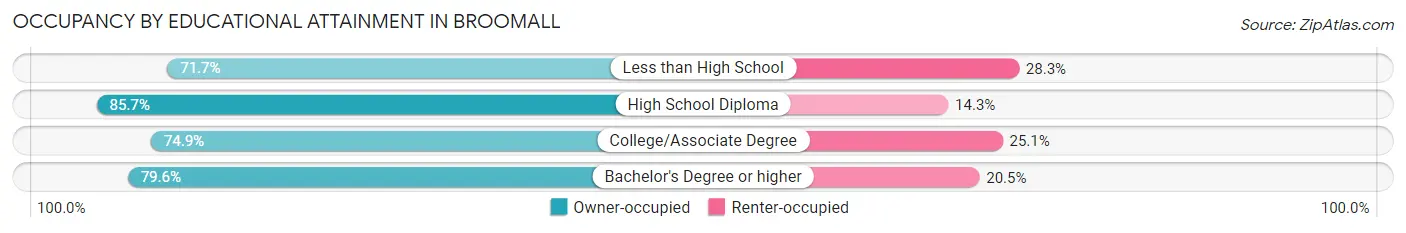
| Household Size | Owner-occupied | Renter-occupied |
| Less than High School | 152 (71.7%) | 60 (28.3%) |
| High School Diploma | 871 (85.7%) | 145 (14.3%) |
| College/Associate Degree | 583 (74.9%) | 195 (25.1%) |
| Bachelor's Degree or higher | 1,517 (79.5%) | 390 (20.4%) |
Occupancy by Age of Householder in Broomall
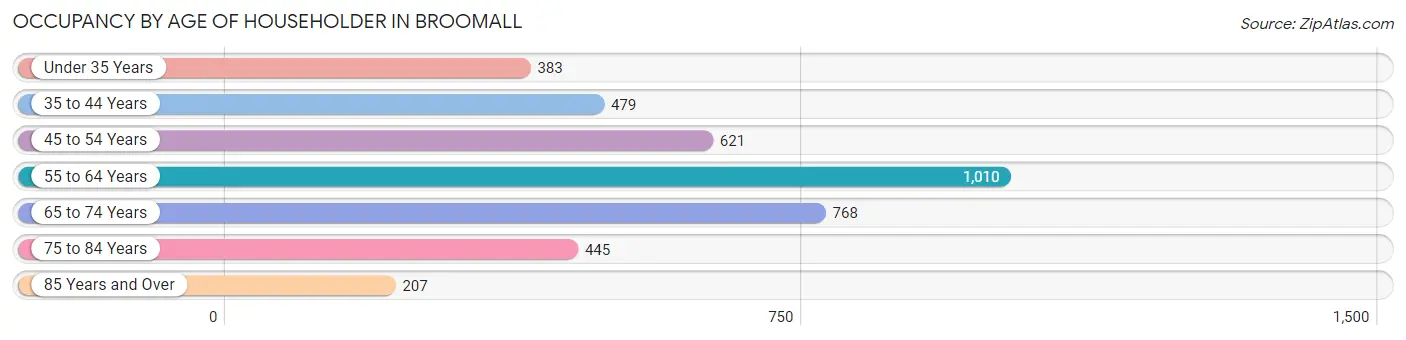
| Age Bracket | # Households | % Households |
| Under 35 Years | 383 | 9.8% |
| 35 to 44 Years | 479 | 12.2% |
| 45 to 54 Years | 621 | 15.9% |
| 55 to 64 Years | 1,010 | 25.8% |
| 65 to 74 Years | 768 | 19.6% |
| 75 to 84 Years | 445 | 11.4% |
| 85 Years and Over | 207 | 5.3% |
| Total | 3,913 | 100.0% |
Housing Finances in Broomall
Median Income by Occupancy in Broomall
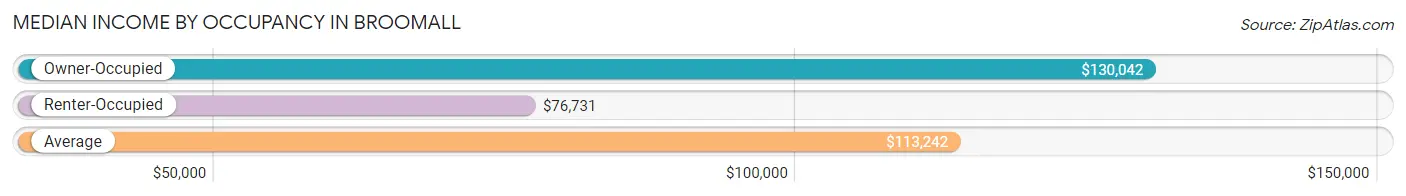
| Occupancy Type | # Households | Median Income |
| Owner-Occupied | 3,123 (79.8%) | $130,042 |
| Renter-Occupied | 790 (20.2%) | $76,731 |
| Average | 3,913 (100.0%) | $113,242 |
Occupancy by Householder Income Bracket in Broomall
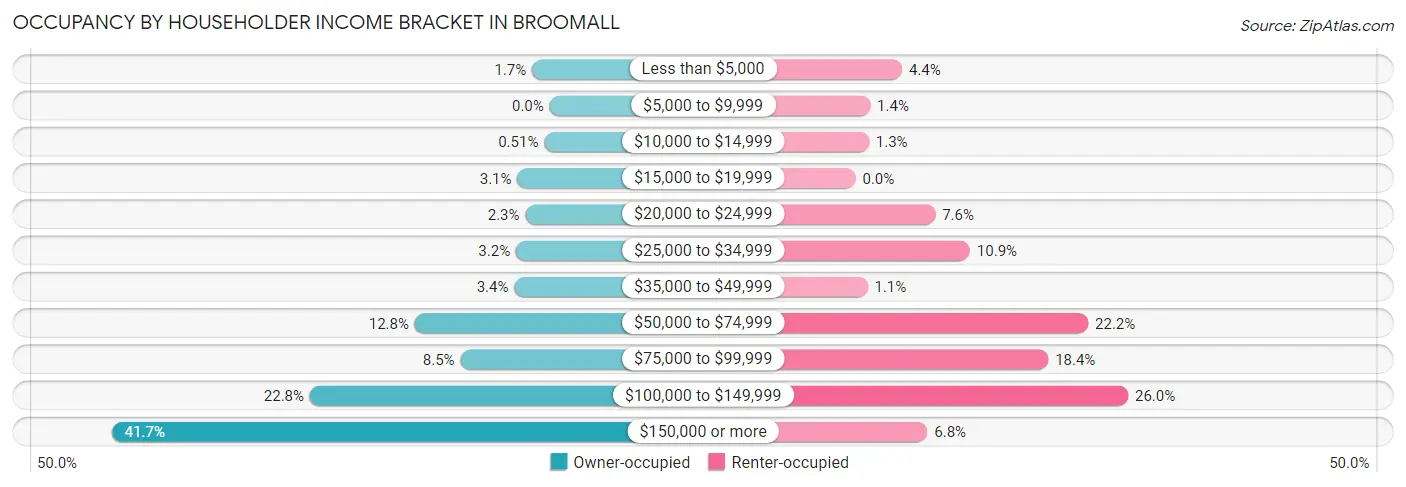
| Income Bracket | Owner-occupied | Renter-occupied |
| Less than $5,000 | 52 (1.7%) | 35 (4.4%) |
| $5,000 to $9,999 | 0 (0.0%) | 11 (1.4%) |
| $10,000 to $14,999 | 16 (0.5%) | 10 (1.3%) |
| $15,000 to $19,999 | 96 (3.1%) | 0 (0.0%) |
| $20,000 to $24,999 | 72 (2.3%) | 60 (7.6%) |
| $25,000 to $34,999 | 100 (3.2%) | 86 (10.9%) |
| $35,000 to $49,999 | 105 (3.4%) | 9 (1.1%) |
| $50,000 to $74,999 | 401 (12.8%) | 175 (22.2%) |
| $75,000 to $99,999 | 265 (8.5%) | 145 (18.3%) |
| $100,000 to $149,999 | 713 (22.8%) | 205 (26.0%) |
| $150,000 or more | 1,303 (41.7%) | 54 (6.8%) |
| Total | 3,123 (100.0%) | 790 (100.0%) |
Monthly Housing Cost Tiers in Broomall
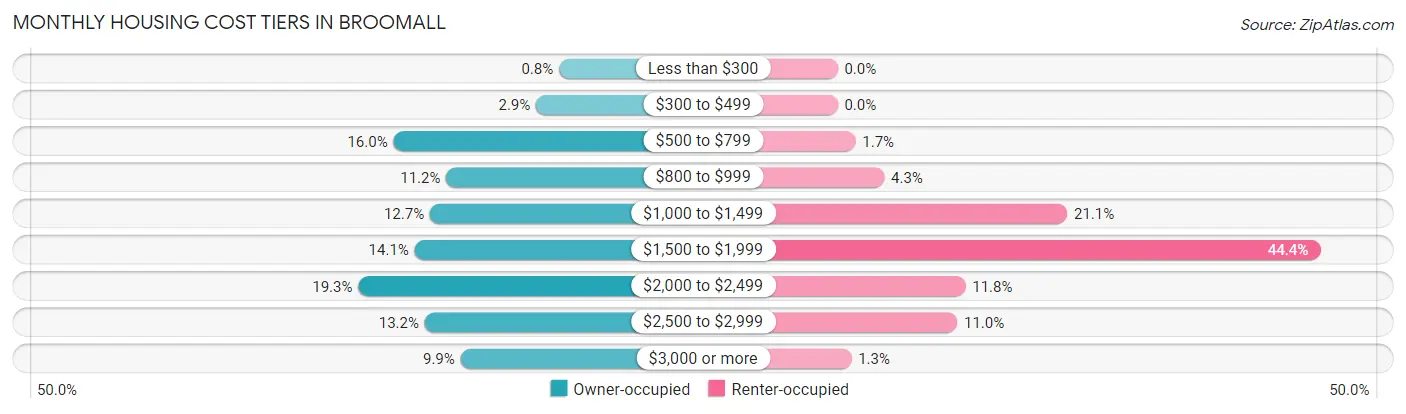
| Monthly Cost | Owner-occupied | Renter-occupied |
| Less than $300 | 25 (0.8%) | 0 (0.0%) |
| $300 to $499 | 91 (2.9%) | 0 (0.0%) |
| $500 to $799 | 501 (16.0%) | 13 (1.7%) |
| $800 to $999 | 349 (11.2%) | 34 (4.3%) |
| $1,000 to $1,499 | 396 (12.7%) | 167 (21.1%) |
| $1,500 to $1,999 | 440 (14.1%) | 351 (44.4%) |
| $2,000 to $2,499 | 602 (19.3%) | 93 (11.8%) |
| $2,500 to $2,999 | 411 (13.2%) | 87 (11.0%) |
| $3,000 or more | 308 (9.9%) | 10 (1.3%) |
| Total | 3,123 (100.0%) | 790 (100.0%) |
Physical Housing Characteristics in Broomall
Housing Structures in Broomall
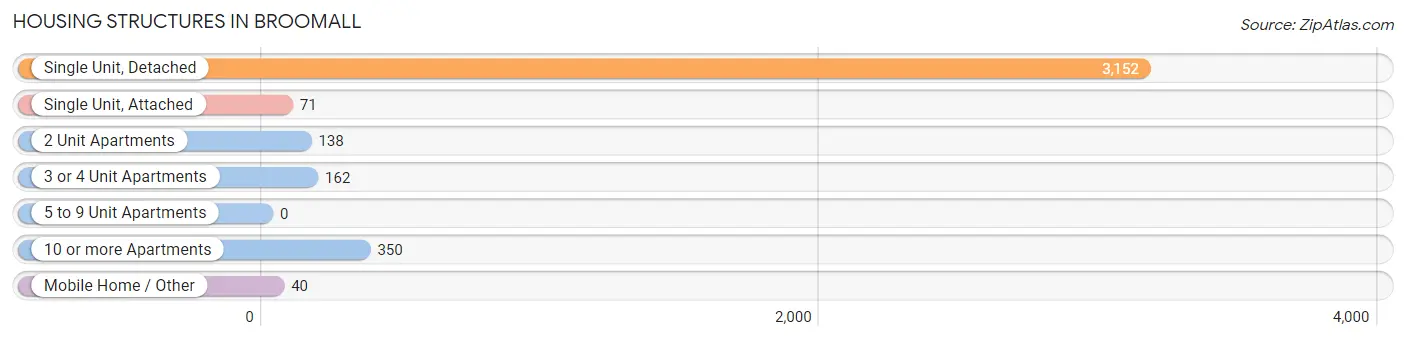
| Structure Type | # Housing Units | % Housing Units |
| Single Unit, Detached | 3,152 | 80.5% |
| Single Unit, Attached | 71 | 1.8% |
| 2 Unit Apartments | 138 | 3.5% |
| 3 or 4 Unit Apartments | 162 | 4.1% |
| 5 to 9 Unit Apartments | 0 | 0.0% |
| 10 or more Apartments | 350 | 8.9% |
| Mobile Home / Other | 40 | 1.0% |
| Total | 3,913 | 100.0% |
Housing Structures by Occupancy in Broomall
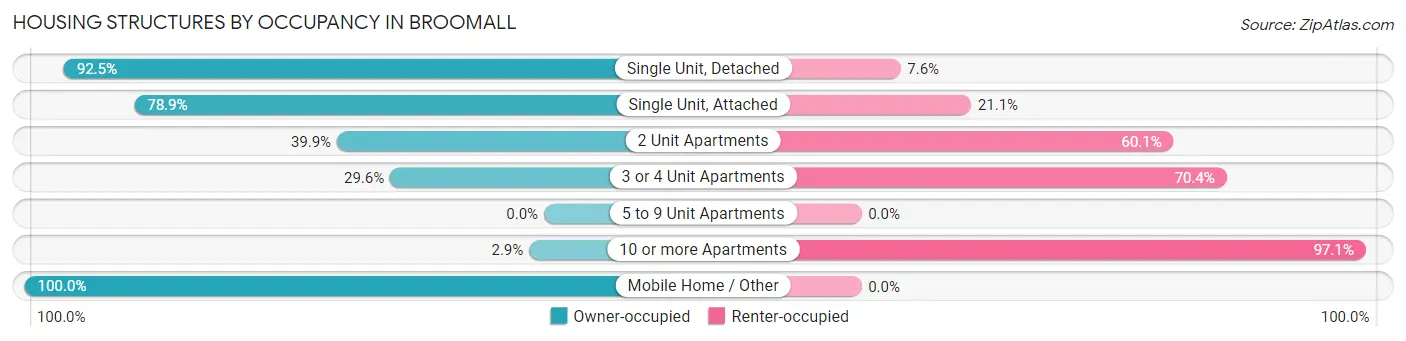
| Structure Type | Owner-occupied | Renter-occupied |
| Single Unit, Detached | 2,914 (92.4%) | 238 (7.5%) |
| Single Unit, Attached | 56 (78.9%) | 15 (21.1%) |
| 2 Unit Apartments | 55 (39.9%) | 83 (60.1%) |
| 3 or 4 Unit Apartments | 48 (29.6%) | 114 (70.4%) |
| 5 to 9 Unit Apartments | 0 (0.0%) | 0 (0.0%) |
| 10 or more Apartments | 10 (2.9%) | 340 (97.1%) |
| Mobile Home / Other | 40 (100.0%) | 0 (0.0%) |
| Total | 3,123 (79.8%) | 790 (20.2%) |
Housing Structures by Number of Rooms in Broomall
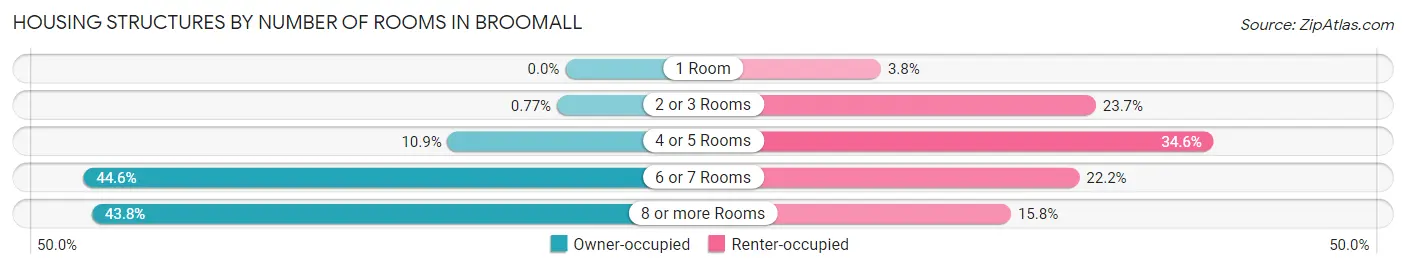
| Number of Rooms | Owner-occupied | Renter-occupied |
| 1 Room | 0 (0.0%) | 30 (3.8%) |
| 2 or 3 Rooms | 24 (0.8%) | 187 (23.7%) |
| 4 or 5 Rooms | 340 (10.9%) | 273 (34.6%) |
| 6 or 7 Rooms | 1,392 (44.6%) | 175 (22.2%) |
| 8 or more Rooms | 1,367 (43.8%) | 125 (15.8%) |
| Total | 3,123 (100.0%) | 790 (100.0%) |
Housing Structure by Heating Type in Broomall
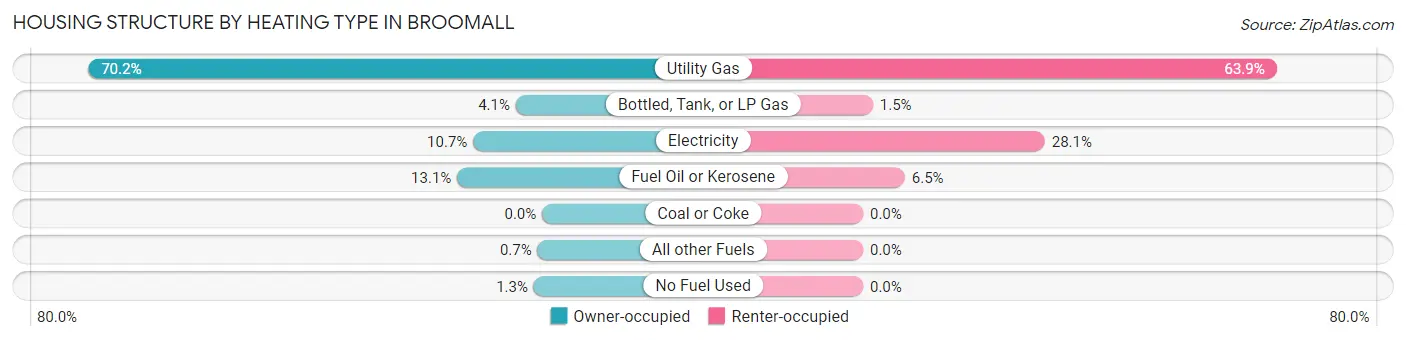
| Heating Type | Owner-occupied | Renter-occupied |
| Utility Gas | 2,191 (70.2%) | 505 (63.9%) |
| Bottled, Tank, or LP Gas | 127 (4.1%) | 12 (1.5%) |
| Electricity | 333 (10.7%) | 222 (28.1%) |
| Fuel Oil or Kerosene | 410 (13.1%) | 51 (6.5%) |
| Coal or Coke | 0 (0.0%) | 0 (0.0%) |
| All other Fuels | 22 (0.7%) | 0 (0.0%) |
| No Fuel Used | 40 (1.3%) | 0 (0.0%) |
| Total | 3,123 (100.0%) | 790 (100.0%) |
Household Vehicle Usage in Broomall
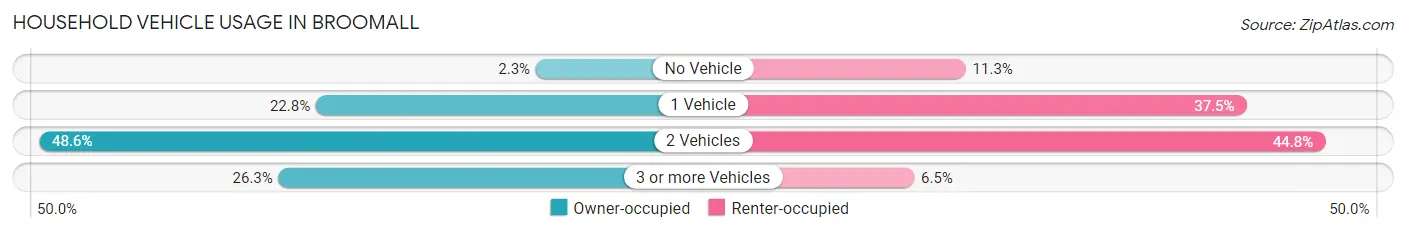
| Vehicles per Household | Owner-occupied | Renter-occupied |
| No Vehicle | 71 (2.3%) | 89 (11.3%) |
| 1 Vehicle | 712 (22.8%) | 296 (37.5%) |
| 2 Vehicles | 1,519 (48.6%) | 354 (44.8%) |
| 3 or more Vehicles | 821 (26.3%) | 51 (6.5%) |
| Total | 3,123 (100.0%) | 790 (100.0%) |
Real Estate & Mortgages in Broomall
Real Estate and Mortgage Overview in Broomall
| Characteristic | Without Mortgage | With Mortgage |
| Housing Units | 1,168 | 1,955 |
| Median Property Value | $403,500 | $432,700 |
| Median Household Income | $90,288 | $1,001 |
| Monthly Housing Costs | $789 | $308 |
| Real Estate Taxes | $4,744 | $0 |
Property Value by Mortgage Status in Broomall
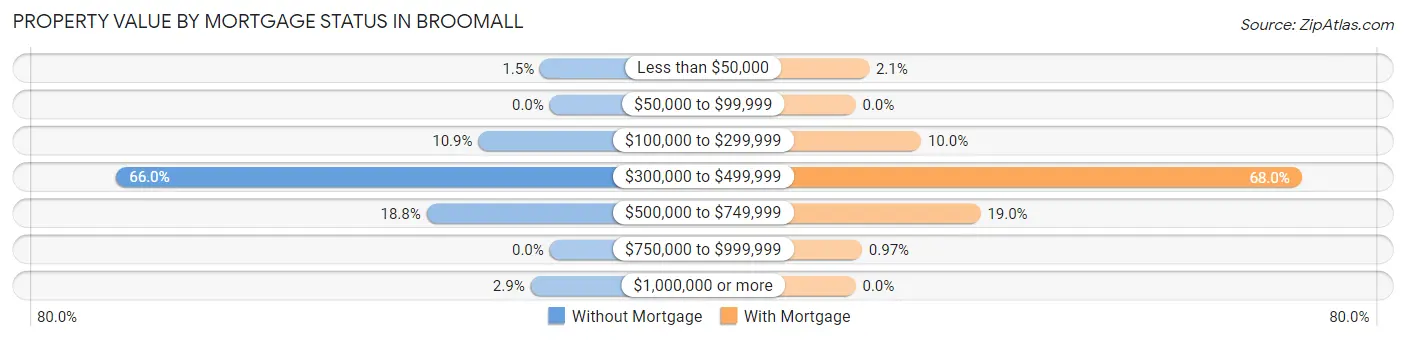
| Property Value | Without Mortgage | With Mortgage |
| Less than $50,000 | 17 (1.5%) | 40 (2.1%) |
| $50,000 to $99,999 | 0 (0.0%) | 0 (0.0%) |
| $100,000 to $299,999 | 127 (10.9%) | 195 (10.0%) |
| $300,000 to $499,999 | 771 (66.0%) | 1,329 (68.0%) |
| $500,000 to $749,999 | 219 (18.8%) | 372 (19.0%) |
| $750,000 to $999,999 | 0 (0.0%) | 19 (1.0%) |
| $1,000,000 or more | 34 (2.9%) | 0 (0.0%) |
| Total | 1,168 (100.0%) | 1,955 (100.0%) |
Household Income by Mortgage Status in Broomall
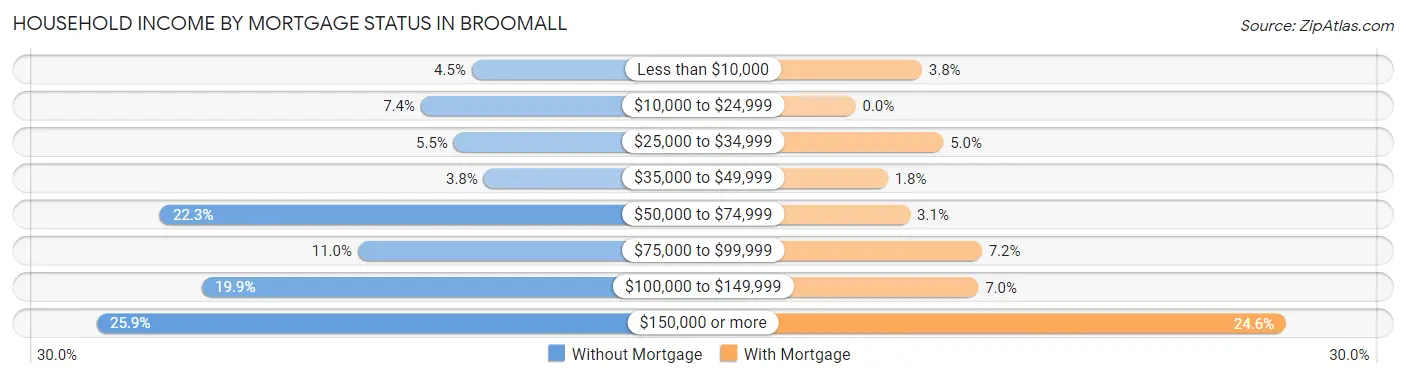
| Household Income | Without Mortgage | With Mortgage |
| Less than $10,000 | 52 (4.4%) | 74 (3.8%) |
| $10,000 to $24,999 | 86 (7.4%) | 0 (0.0%) |
| $25,000 to $34,999 | 64 (5.5%) | 98 (5.0%) |
| $35,000 to $49,999 | 44 (3.8%) | 36 (1.8%) |
| $50,000 to $74,999 | 260 (22.3%) | 61 (3.1%) |
| $75,000 to $99,999 | 128 (11.0%) | 141 (7.2%) |
| $100,000 to $149,999 | 232 (19.9%) | 137 (7.0%) |
| $150,000 or more | 302 (25.9%) | 481 (24.6%) |
| Total | 1,168 (100.0%) | 1,955 (100.0%) |
Property Value to Household Income Ratio in Broomall
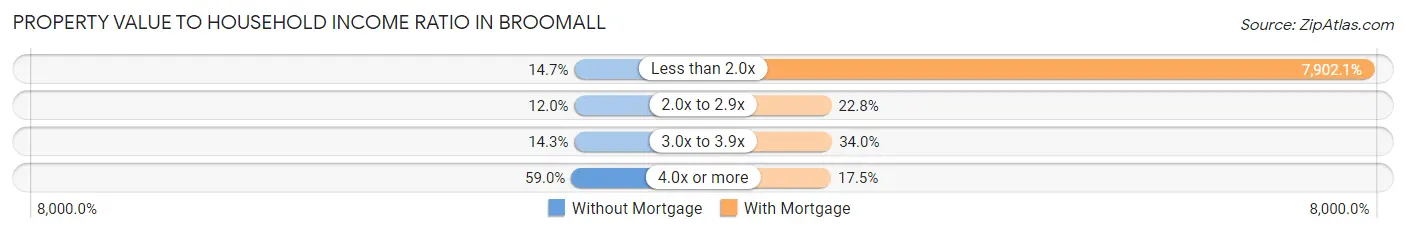
| Value-to-Income Ratio | Without Mortgage | With Mortgage |
| Less than 2.0x | 172 (14.7%) | 154,485 (7,902.0%) |
| 2.0x to 2.9x | 140 (12.0%) | 445 (22.8%) |
| 3.0x to 3.9x | 167 (14.3%) | 664 (34.0%) |
| 4.0x or more | 689 (59.0%) | 342 (17.5%) |
| Total | 1,168 (100.0%) | 1,955 (100.0%) |
Real Estate Taxes by Mortgage Status in Broomall
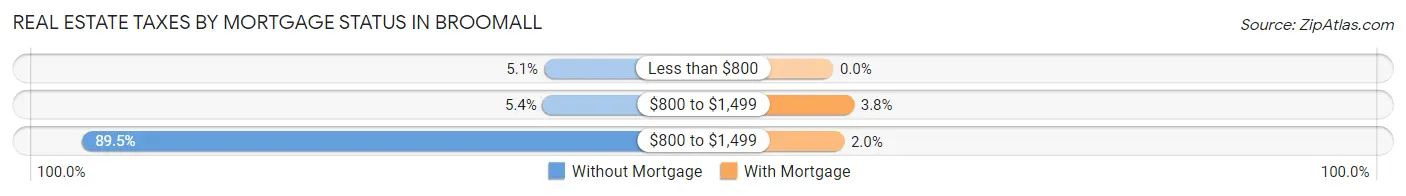
| Property Taxes | Without Mortgage | With Mortgage |
| Less than $800 | 60 (5.1%) | 0 (0.0%) |
| $800 to $1,499 | 63 (5.4%) | 74 (3.8%) |
| $800 to $1,499 | 1,045 (89.5%) | 39 (2.0%) |
| Total | 1,168 (100.0%) | 1,955 (100.0%) |
Health & Disability in Broomall
Health Insurance Coverage by Age in Broomall
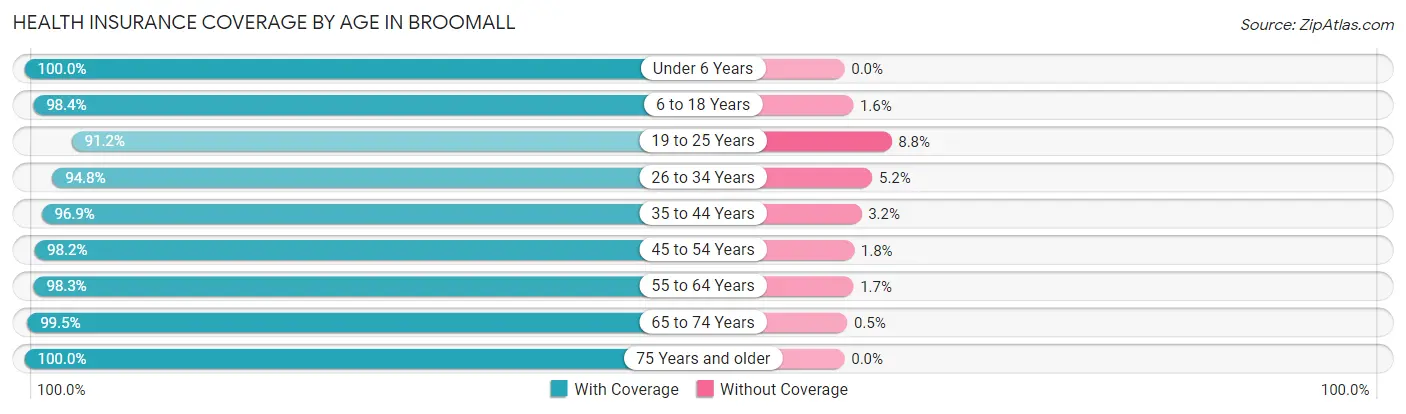
| Age Bracket | With Coverage | Without Coverage |
| Under 6 Years | 702 (100.0%) | 0 (0.0%) |
| 6 to 18 Years | 1,576 (98.4%) | 26 (1.6%) |
| 19 to 25 Years | 823 (91.2%) | 79 (8.8%) |
| 26 to 34 Years | 1,173 (94.8%) | 64 (5.2%) |
| 35 to 44 Years | 984 (96.9%) | 32 (3.2%) |
| 45 to 54 Years | 1,269 (98.2%) | 23 (1.8%) |
| 55 to 64 Years | 1,661 (98.3%) | 28 (1.7%) |
| 65 to 74 Years | 1,201 (99.5%) | 6 (0.5%) |
| 75 Years and older | 1,016 (100.0%) | 0 (0.0%) |
| Total | 10,405 (97.6%) | 258 (2.4%) |
Health Insurance Coverage by Citizenship Status in Broomall
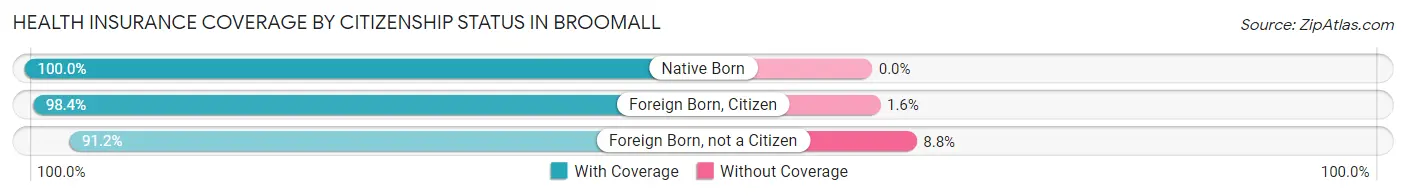
| Citizenship Status | With Coverage | Without Coverage |
| Native Born | 702 (100.0%) | 0 (0.0%) |
| Foreign Born, Citizen | 1,576 (98.4%) | 26 (1.6%) |
| Foreign Born, not a Citizen | 823 (91.2%) | 79 (8.8%) |
Health Insurance Coverage by Household Income in Broomall
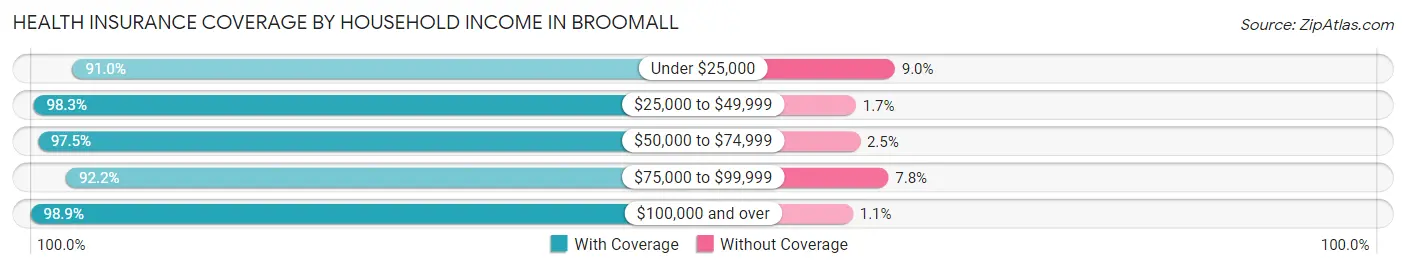
| Household Income | With Coverage | Without Coverage |
| Under $25,000 | 476 (91.0%) | 47 (9.0%) |
| $25,000 to $49,999 | 465 (98.3%) | 8 (1.7%) |
| $50,000 to $74,999 | 1,387 (97.5%) | 35 (2.5%) |
| $75,000 to $99,999 | 1,054 (92.2%) | 89 (7.8%) |
| $100,000 and over | 6,995 (98.9%) | 79 (1.1%) |
Public vs Private Health Insurance Coverage by Age in Broomall
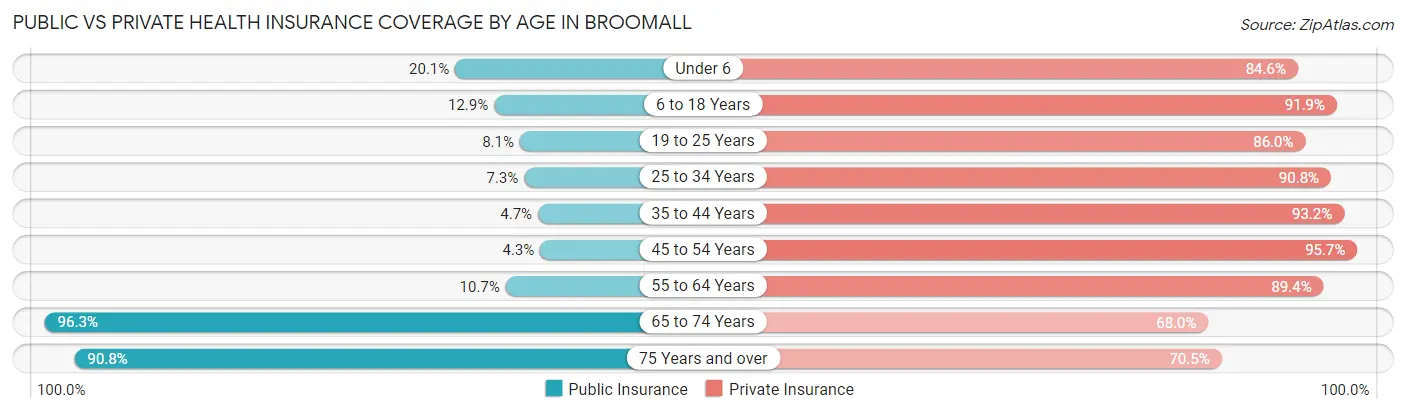
| Age Bracket | Public Insurance | Private Insurance |
| Under 6 | 141 (20.1%) | 594 (84.6%) |
| 6 to 18 Years | 206 (12.9%) | 1,472 (91.9%) |
| 19 to 25 Years | 73 (8.1%) | 776 (86.0%) |
| 25 to 34 Years | 90 (7.3%) | 1,123 (90.8%) |
| 35 to 44 Years | 48 (4.7%) | 947 (93.2%) |
| 45 to 54 Years | 56 (4.3%) | 1,236 (95.7%) |
| 55 to 64 Years | 181 (10.7%) | 1,510 (89.4%) |
| 65 to 74 Years | 1,162 (96.3%) | 821 (68.0%) |
| 75 Years and over | 922 (90.7%) | 716 (70.5%) |
| Total | 2,879 (27.0%) | 9,195 (86.2%) |
Disability Status by Sex by Age in Broomall
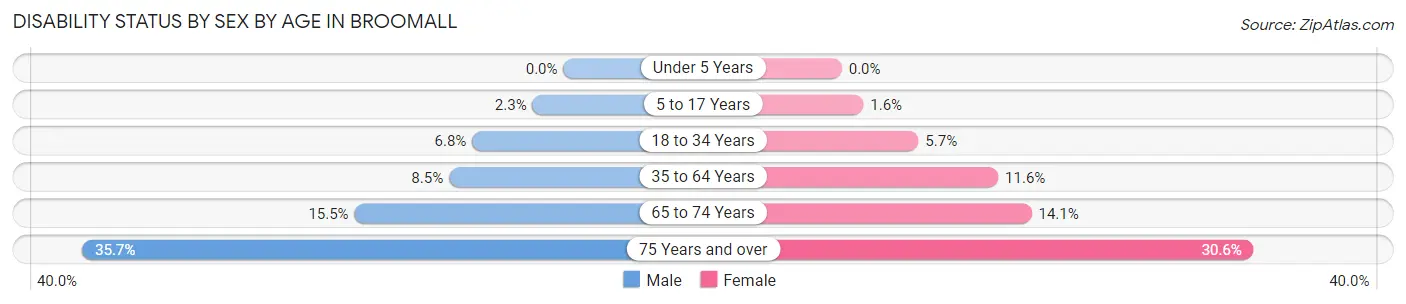
| Age Bracket | Male | Female |
| Under 5 Years | 0 (0.0%) | 0 (0.0%) |
| 5 to 17 Years | 19 (2.3%) | 12 (1.6%) |
| 18 to 34 Years | 68 (6.8%) | 70 (5.7%) |
| 35 to 64 Years | 166 (8.5%) | 237 (11.6%) |
| 65 to 74 Years | 87 (15.5%) | 91 (14.1%) |
| 75 Years and over | 134 (35.7%) | 196 (30.6%) |
Disability Class by Sex by Age in Broomall
Disability Class: Hearing Difficulty
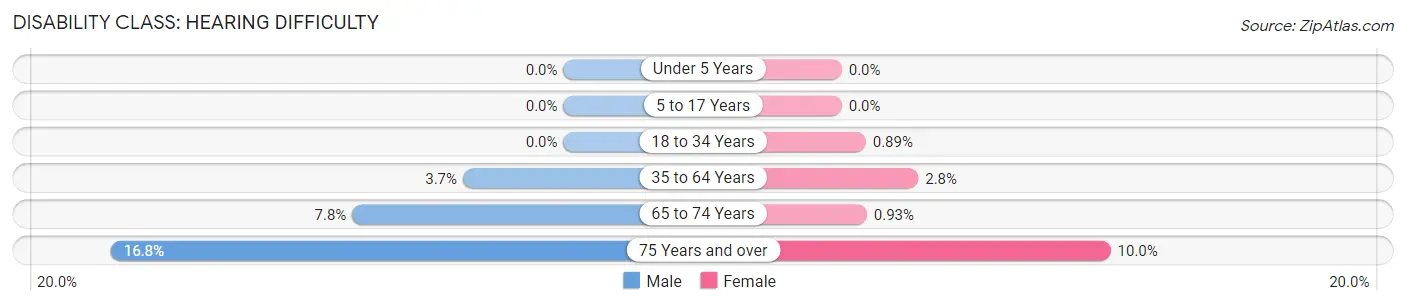
| Age Bracket | Male | Female |
| Under 5 Years | 0 (0.0%) | 0 (0.0%) |
| 5 to 17 Years | 0 (0.0%) | 0 (0.0%) |
| 18 to 34 Years | 0 (0.0%) | 11 (0.9%) |
| 35 to 64 Years | 73 (3.7%) | 58 (2.8%) |
| 65 to 74 Years | 44 (7.8%) | 6 (0.9%) |
| 75 Years and over | 63 (16.8%) | 64 (10.0%) |
Disability Class: Vision Difficulty
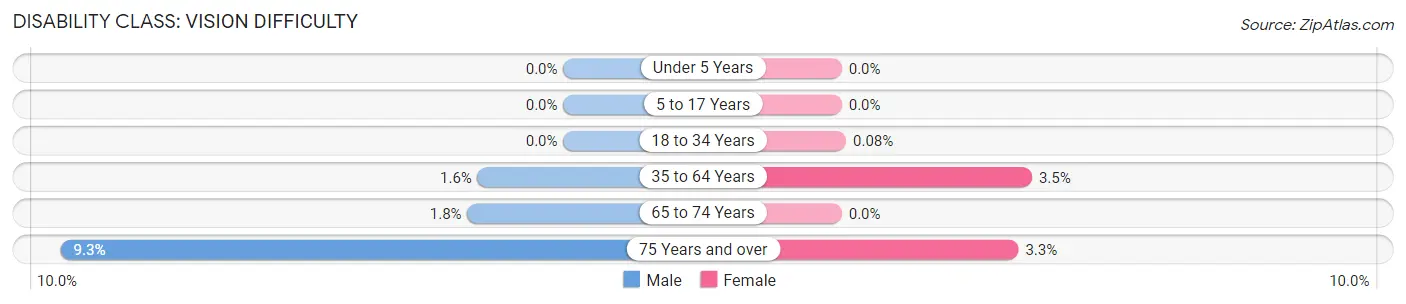
| Age Bracket | Male | Female |
| Under 5 Years | 0 (0.0%) | 0 (0.0%) |
| 5 to 17 Years | 0 (0.0%) | 0 (0.0%) |
| 18 to 34 Years | 0 (0.0%) | 1 (0.1%) |
| 35 to 64 Years | 31 (1.6%) | 72 (3.5%) |
| 65 to 74 Years | 10 (1.8%) | 0 (0.0%) |
| 75 Years and over | 35 (9.3%) | 21 (3.3%) |
Disability Class: Cognitive Difficulty
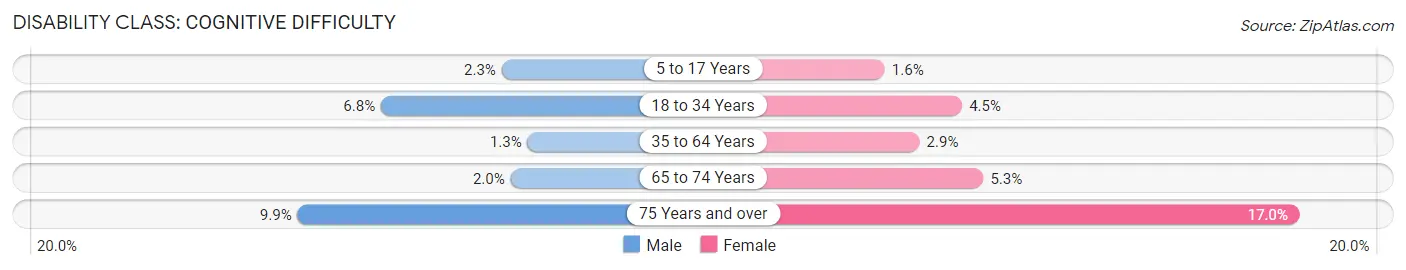
| Age Bracket | Male | Female |
| 5 to 17 Years | 19 (2.3%) | 12 (1.6%) |
| 18 to 34 Years | 68 (6.8%) | 55 (4.5%) |
| 35 to 64 Years | 26 (1.3%) | 59 (2.9%) |
| 65 to 74 Years | 11 (2.0%) | 34 (5.3%) |
| 75 Years and over | 37 (9.9%) | 109 (17.0%) |
Disability Class: Ambulatory Difficulty
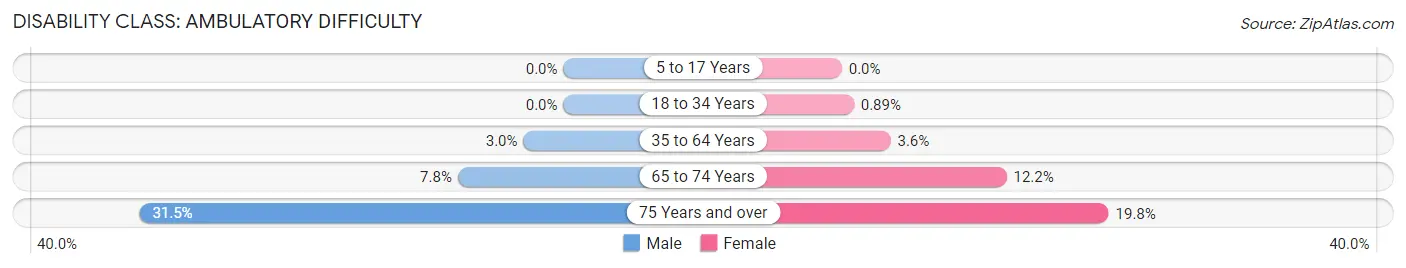
| Age Bracket | Male | Female |
| 5 to 17 Years | 0 (0.0%) | 0 (0.0%) |
| 18 to 34 Years | 0 (0.0%) | 11 (0.9%) |
| 35 to 64 Years | 58 (3.0%) | 74 (3.6%) |
| 65 to 74 Years | 44 (7.8%) | 79 (12.2%) |
| 75 Years and over | 118 (31.5%) | 127 (19.8%) |
Disability Class: Self-Care Difficulty
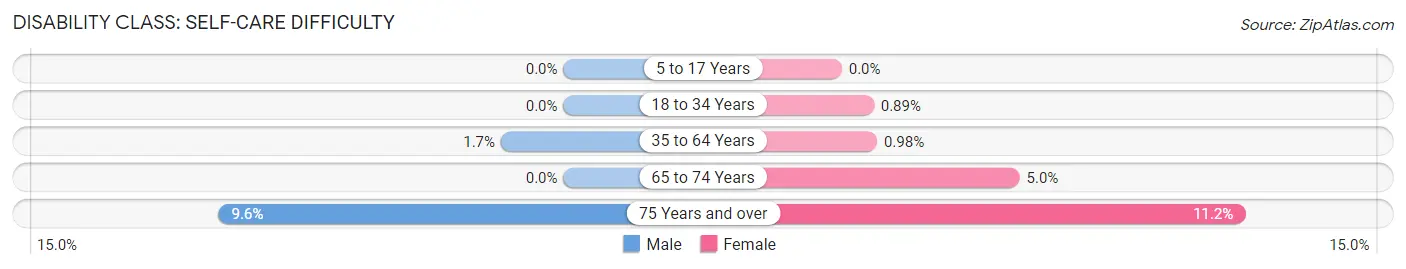
| Age Bracket | Male | Female |
| 5 to 17 Years | 0 (0.0%) | 0 (0.0%) |
| 18 to 34 Years | 0 (0.0%) | 11 (0.9%) |
| 35 to 64 Years | 34 (1.7%) | 20 (1.0%) |
| 65 to 74 Years | 0 (0.0%) | 32 (5.0%) |
| 75 Years and over | 36 (9.6%) | 72 (11.2%) |
Technology Access in Broomall
Computing Device Access in Broomall
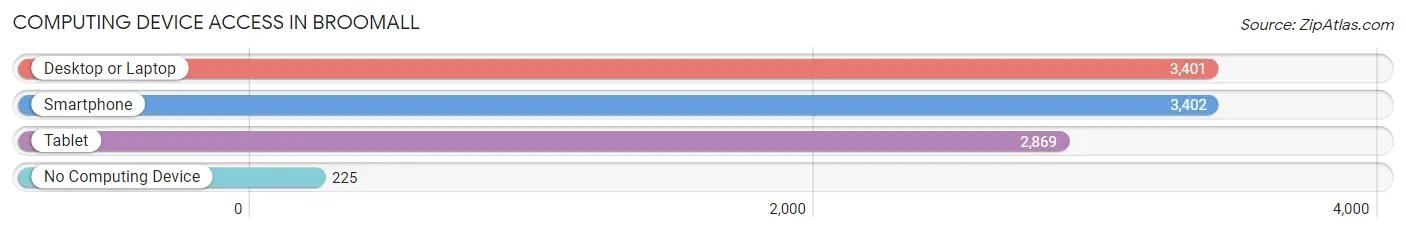
| Device Type | # Households | % Households |
| Desktop or Laptop | 3,401 | 86.9% |
| Smartphone | 3,402 | 86.9% |
| Tablet | 2,869 | 73.3% |
| No Computing Device | 225 | 5.8% |
| Total | 3,913 | 100.0% |
Internet Access in Broomall
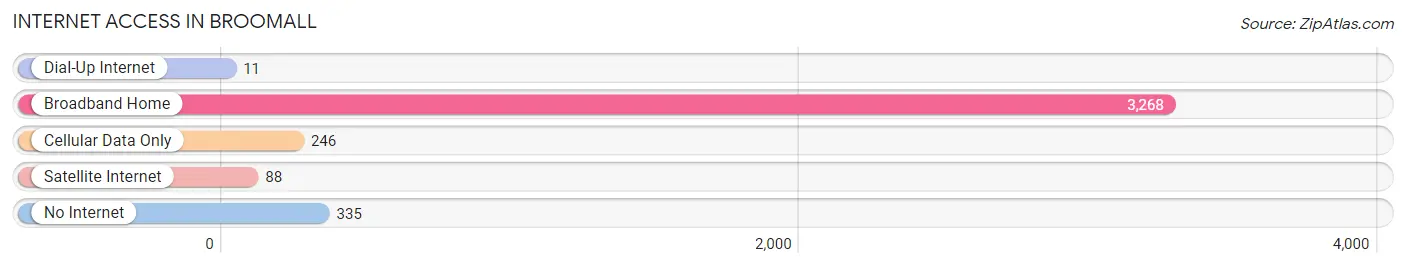
| Internet Type | # Households | % Households |
| Dial-Up Internet | 11 | 0.3% |
| Broadband Home | 3,268 | 83.5% |
| Cellular Data Only | 246 | 6.3% |
| Satellite Internet | 88 | 2.2% |
| No Internet | 335 | 8.6% |
| Total | 3,913 | 100.0% |
Broomall Summary
Broomall is a census-designated place (CDP) located in Delaware County, Pennsylvania, United States. It is a suburb of Philadelphia, located approximately 15 miles west of the city. As of the 2010 census, the population of Broomall was 6,169.
History
The area now known as Broomall was originally inhabited by the Lenni Lenape Native Americans. The first European settlers arrived in the area in the late 1600s. The area was originally part of Marple Township, which was established in 1687. In 1836, the area was split off from Marple Township and became part of Newtown Township.
In 1853, the area was renamed Broomall after the family of John Broomall, who had settled in the area in the late 1700s. The Broomall family was prominent in the area and owned a large amount of land. The family also operated a mill and a store in the area.
In the late 1800s, the area began to develop as a residential suburb of Philadelphia. The population of Broomall grew steadily throughout the 20th century, reaching 6,169 by the 2010 census.
Geography
Broomall is located at 39°57'45"N 75°22'45"W (39.9625, -75.3792). It is situated in the southeastern corner of Delaware County, approximately 15 miles west of Philadelphia.
The CDP has a total area of 2.2 square miles, all of which is land. It is bordered to the north by Marple Township, to the east by Newtown Township, to the south by Springfield Township, and to the west by Radnor Township.
Economy
Broomall is primarily a residential community, with no major industries or employers located within its borders. However, many residents commute to Philadelphia and other nearby towns for work.
The largest employers in the area are the Marple Newtown School District, the Springfield Township School District, and the Delaware County Intermediate Unit. Other major employers include the Broomall Fire Company, the Broomall-Newtown Library, and the Broomall-Newtown Athletic Association.
Demographics
As of the 2010 census, there were 6,169 people, 2,521 households, and 1,717 families residing in the CDP. The population density was 2,811.4 people per square mile. There were 2,637 housing units, with an average density of 1,193.2 per square mile.
The racial makeup of the CDP was 92.2% White, 3.3% African American, 0.2% Native American, 2.3% Asian, 0.1% Pacific Islander, 0.7% from other races, and 1.2% from two or more races. Hispanic or Latino of any race were 2.3% of the population.
There were 2,521 households, out of which 28.2% had children under the age of 18 living with them, 56.2% were married couples living together, 9.2% had a female householder with no husband present, and 31.2% were non-families. 25.7% of all households were made up of individuals, and 11.2% had someone living alone who was 65 years of age or older. The average household size was 2.44 and the average family size was 2.94.
In the CDP, the population was spread out, with 22.2% under the age of 18, 5.7% from 18 to 24, 25.2% from 25 to 44, 28.7% from 45 to 64, and 18.2% who were 65 years of age or older. The median age was 43 years. For every 100 females, there were 92.2 males. For every 100 females age 18 and over, there were 88.3 males.
The median income for a household in the CDP was $68,958, and the median income for a family was $81,944. Males had a median income of $51,932 versus $41,964 for females. The per capita income for the CDP was $33,945. About 2.2% of families and 3.3% of the population were below the poverty line, including 4.2% of those under age 18 and 4.2% of those age 65 or over.
Common Questions
What is the Total Population of Broomall?
Total Population of Broomall is 10,663.
What is the Total Male Population of Broomall?
Total Male Population of Broomall is 4,956.
What is the Total Female Population of Broomall?
Total Female Population of Broomall is 5,707.
What is the Ratio of Males per 100 Females in Broomall?
There are 86.84 Males per 100 Females in Broomall.
What is the Ratio of Females per 100 Males in Broomall?
There are 115.15 Females per 100 Males in Broomall.
What is the Median Population Age in Broomall?
Median Population Age in Broomall is 44.1 Years.
What is the Average Family Size in Broomall
Average Family Size in Broomall is 3.2 People.
What is the Average Household Size in Broomall
Average Household Size in Broomall is 2.7 People.
What is Per Capita Income in Broomall?
Per Capita income in Broomall is $52,015.
What is the Median Family Income in Broomall?
Median Family Income in Broomall is $130,833.
What is the Median Household income in Broomall?
Median Household Income in Broomall is $113,242.
What is Income or Wage Gap in Broomall?
Income or Wage Gap in Broomall is 15.9%.
Women in Broomall earn 84.1 cents for every dollar earned by a man.
What is Inequality or Gini Index in Broomall?
Inequality or Gini Index in Broomall is 0.41.
How Large is the Labor Force in Broomall?
There are 5,905 People in the Labor Forcein in Broomall.
What is the Percentage of People in the Labor Force in Broomall?
67.4% of People are in the Labor Force in Broomall.
What is the Unemployment Rate in Broomall?
Unemployment Rate in Broomall is 2.8%.