Cities with the Highest Percentage of Households Heated by Utility Gas in Pennsylvania
RELATED REPORTS & OPTIONS
Utility Gas Heating
Pennsylvania
Compare Cities
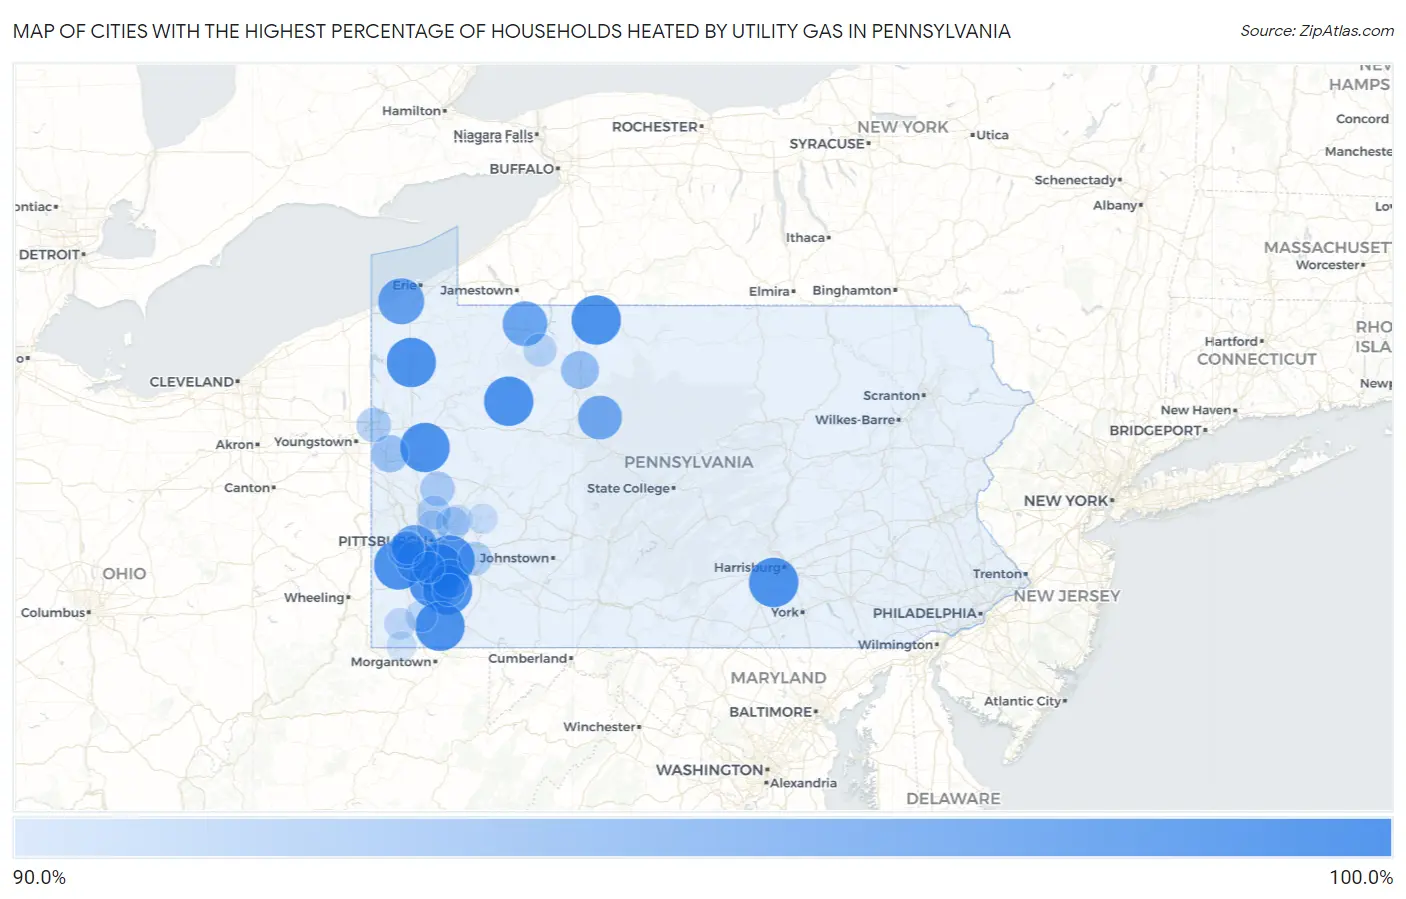
Map of Cities with the Highest Percentage of Households Heated by Utility Gas in Pennsylvania
0.0%
100.0%
Cities with the Highest Percentage of Households Heated by Utility Gas in Pennsylvania
| City | Utility Gas Heating | vs State | vs National | |
| 1. | Slippery Rock University | 100.0% | 51.3%(+48.7)#1 | 47.1%(+52.9)#6 |
| 2. | Messiah College | 100.0% | 51.3%(+48.7)#2 | 47.1%(+52.9)#7 |
| 3. | Misericordia University | 100.0% | 51.3%(+48.7)#3 | 47.1%(+52.9)#12 |
| 4. | Van Voorhis | 100.0% | 51.3%(+48.7)#4 | 47.1%(+52.9)#30 |
| 5. | Eagle | 100.0% | 51.3%(+48.7)#5 | 47.1%(+52.9)#41 |
| 6. | Boston | 100.0% | 51.3%(+48.7)#6 | 47.1%(+52.9)#61 |
| 7. | Elrama | 100.0% | 51.3%(+48.7)#7 | 47.1%(+52.9)#72 |
| 8. | Plumville Borough | 100.0% | 51.3%(+48.7)#8 | 47.1%(+52.9)#79 |
| 9. | Rew | 100.0% | 51.3%(+48.7)#10 | 47.1%(+52.9)#120 |
| 10. | Leeper | 100.0% | 51.3%(+48.7)#11 | 47.1%(+52.9)#121 |
| 11. | Naomi | 100.0% | 51.3%(+48.7)#12 | 47.1%(+52.9)#158 |
| 12. | Kerrtown | 100.0% | 51.3%(+48.7)#13 | 47.1%(+52.9)#213 |
| 13. | Ronco | 100.0% | 51.3%(+48.7)#14 | 47.1%(+52.9)#223 |
| 14. | Westland | 100.0% | 51.3%(+48.7)#15 | 47.1%(+52.9)#224 |
| 15. | Green Hills Borough | 100.0% | 51.3%(+48.7)#16 | 47.1%(+52.9)#289 |
| 16. | Sligo Borough | 99.0% | 51.3%(+47.7)#17 | 47.1%(+51.9)#299 |
| 17. | Petrolia Borough | 98.8% | 51.3%(+47.5)#18 | 47.1%(+51.7)#307 |
| 18. | Fairview | 98.3% | 51.3%(+47.0)#19 | 47.1%(+51.2)#313 |
| 19. | Churchill Borough | 97.9% | 51.3%(+46.6)#20 | 47.1%(+50.8)#319 |
| 20. | Rennerdale | 97.9% | 51.3%(+46.6)#21 | 47.1%(+50.8)#321 |
| 21. | North Warren | 97.7% | 51.3%(+46.4)#22 | 47.1%(+50.6)#327 |
| 22. | Marianna Borough | 97.5% | 51.3%(+46.2)#23 | 47.1%(+50.4)#337 |
| 23. | Callensburg Borough | 97.5% | 51.3%(+46.2)#24 | 47.1%(+50.4)#339 |
| 24. | Force | 97.3% | 51.3%(+46.0)#25 | 47.1%(+50.2)#349 |
| 25. | Rosslyn Farms Borough | 97.2% | 51.3%(+45.9)#26 | 47.1%(+50.1)#354 |
| 26. | Chicora Borough | 96.8% | 51.3%(+45.5)#27 | 47.1%(+49.7)#378 |
| 27. | Worthville Borough | 96.8% | 51.3%(+45.5)#28 | 47.1%(+49.7)#381 |
| 28. | Bruin Borough | 96.4% | 51.3%(+45.1)#29 | 47.1%(+49.3)#401 |
| 29. | Whitaker Borough | 96.3% | 51.3%(+45.0)#30 | 47.1%(+49.2)#403 |
| 30. | West Middlesex Borough | 95.8% | 51.3%(+44.5)#31 | 47.1%(+48.7)#428 |
| 31. | Lawrence | 95.8% | 51.3%(+44.5)#32 | 47.1%(+48.7)#429 |
| 32. | Freedom Borough | 95.7% | 51.3%(+44.4)#33 | 47.1%(+48.6)#434 |
| 33. | Georgetown Borough | 95.7% | 51.3%(+44.4)#34 | 47.1%(+48.6)#437 |
| 34. | Speers Borough | 95.6% | 51.3%(+44.3)#35 | 47.1%(+48.5)#442 |
| 35. | St Petersburg Borough | 95.6% | 51.3%(+44.3)#36 | 47.1%(+48.5)#446 |
| 36. | Glenfield Borough | 95.6% | 51.3%(+44.3)#37 | 47.1%(+48.5)#447 |
| 37. | North Apollo Borough | 95.4% | 51.3%(+44.1)#38 | 47.1%(+48.3)#460 |
| 38. | Venango Borough | 95.1% | 51.3%(+43.8)#39 | 47.1%(+48.0)#496 |
| 39. | Fellsburg | 94.7% | 51.3%(+43.4)#40 | 47.1%(+47.6)#533 |
| 40. | Smithton Borough | 94.7% | 51.3%(+43.4)#41 | 47.1%(+47.6)#538 |
| 41. | Wilcox | 94.5% | 51.3%(+43.2)#42 | 47.1%(+47.4)#561 |
| 42. | Port Vue Borough | 94.4% | 51.3%(+43.1)#43 | 47.1%(+47.3)#566 |
| 43. | New Castle Northwest | 94.2% | 51.3%(+42.9)#44 | 47.1%(+47.1)#585 |
| 44. | Coal Center Borough | 94.0% | 51.3%(+42.7)#45 | 47.1%(+46.9)#604 |
| 45. | Atwood Borough | 93.9% | 51.3%(+42.6)#46 | 47.1%(+46.8)#617 |
| 46. | Sturgeon | 93.8% | 51.3%(+42.5)#47 | 47.1%(+46.7)#622 |
| 47. | West Kittanning Borough | 93.7% | 51.3%(+42.4)#48 | 47.1%(+46.6)#634 |
| 48. | Tioga Borough | 93.4% | 51.3%(+42.1)#49 | 47.1%(+46.3)#662 |
| 49. | Roscoe Borough | 93.4% | 51.3%(+42.1)#50 | 47.1%(+46.3)#663 |
| 50. | Lorain Borough | 93.3% | 51.3%(+42.0)#51 | 47.1%(+46.2)#673 |
| 51. | Wattsburg Borough | 93.3% | 51.3%(+42.0)#52 | 47.1%(+46.2)#674 |
| 52. | Ben Avon Heights Borough | 93.3% | 51.3%(+42.0)#53 | 47.1%(+46.2)#676 |
| 53. | Dravosburg Borough | 93.2% | 51.3%(+41.9)#54 | 47.1%(+46.1)#689 |
| 54. | Patterson Heights Borough | 93.2% | 51.3%(+41.9)#55 | 47.1%(+46.1)#692 |
| 55. | Thornburg Borough | 93.2% | 51.3%(+41.9)#56 | 47.1%(+46.1)#693 |
| 56. | Eastvale Borough | 93.2% | 51.3%(+41.9)#57 | 47.1%(+46.1)#701 |
| 57. | Ben Avon Borough | 93.1% | 51.3%(+41.8)#58 | 47.1%(+46.0)#709 |
| 58. | Foxburg Borough | 93.1% | 51.3%(+41.8)#59 | 47.1%(+46.0)#719 |
| 59. | Nixon | 93.0% | 51.3%(+41.7)#60 | 47.1%(+45.9)#730 |
| 60. | Farrell | 92.9% | 51.3%(+41.6)#61 | 47.1%(+45.8)#740 |
| 61. | Hawthorn Borough | 92.9% | 51.3%(+41.6)#62 | 47.1%(+45.8)#744 |
| 62. | Volant Borough | 92.7% | 51.3%(+41.4)#63 | 47.1%(+45.6)#772 |
| 63. | Ford City Borough | 92.6% | 51.3%(+41.3)#64 | 47.1%(+45.5)#778 |
| 64. | Grapeville | 92.6% | 51.3%(+41.3)#65 | 47.1%(+45.5)#783 |
| 65. | Gibsonia | 92.5% | 51.3%(+41.2)#66 | 47.1%(+45.4)#790 |
| 66. | Oakland Cdp Cambria County | 92.5% | 51.3%(+41.2)#67 | 47.1%(+45.4)#792 |
| 67. | Ferndale Borough | 92.5% | 51.3%(+41.2)#68 | 47.1%(+45.4)#793 |
| 68. | Noblestown | 92.5% | 51.3%(+41.2)#69 | 47.1%(+45.4)#795 |
| 69. | Harwick | 92.4% | 51.3%(+41.1)#70 | 47.1%(+45.3)#811 |
| 70. | Wheatland Borough | 92.4% | 51.3%(+41.1)#71 | 47.1%(+45.3)#815 |
| 71. | Port Allegany Borough | 92.3% | 51.3%(+41.0)#72 | 47.1%(+45.2)#825 |
| 72. | West Leechburg Borough | 92.3% | 51.3%(+41.0)#73 | 47.1%(+45.2)#829 |
| 73. | Sheffield | 92.3% | 51.3%(+41.0)#74 | 47.1%(+45.2)#831 |
| 74. | Morgan Hill | 92.1% | 51.3%(+40.8)#75 | 47.1%(+45.0)#860 |
| 75. | Fairhope | 91.9% | 51.3%(+40.6)#76 | 47.1%(+44.8)#894 |
| 76. | Applewold Borough | 91.8% | 51.3%(+40.5)#77 | 47.1%(+44.7)#912 |
| 77. | Elderton Borough | 91.7% | 51.3%(+40.4)#78 | 47.1%(+44.6)#941 |
| 78. | Glenshaw | 91.6% | 51.3%(+40.3)#79 | 47.1%(+44.5)#947 |
| 79. | Gastonville | 91.6% | 51.3%(+40.3)#80 | 47.1%(+44.5)#954 |
| 80. | Mather | 91.6% | 51.3%(+40.3)#81 | 47.1%(+44.5)#966 |
| 81. | West Homestead Borough | 91.5% | 51.3%(+40.2)#82 | 47.1%(+44.4)#978 |
| 82. | Rogersville | 91.5% | 51.3%(+40.2)#83 | 47.1%(+44.4)#990 |
| 83. | Ford Cliff Borough | 91.4% | 51.3%(+40.1)#84 | 47.1%(+44.3)#1,012 |
| 84. | Creekside Borough | 91.4% | 51.3%(+40.1)#85 | 47.1%(+44.3)#1,015 |
| 85. | Tarentum Borough | 91.3% | 51.3%(+40.0)#86 | 47.1%(+44.2)#1,022 |
| 86. | Corsica Borough | 91.3% | 51.3%(+40.0)#87 | 47.1%(+44.2)#1,032 |
| 87. | East Mckeesport Borough | 91.2% | 51.3%(+39.9)#88 | 47.1%(+44.1)#1,041 |
| 88. | Frisco | 91.2% | 51.3%(+39.9)#89 | 47.1%(+44.1)#1,044 |
| 89. | Chalfant Borough | 91.2% | 51.3%(+39.9)#90 | 47.1%(+44.1)#1,047 |
| 90. | Arnold | 91.1% | 51.3%(+39.8)#91 | 47.1%(+44.0)#1,053 |
| 91. | Edgeworth Borough | 91.1% | 51.3%(+39.8)#92 | 47.1%(+44.0)#1,058 |
| 92. | Orchard Hills | 90.9% | 51.3%(+39.6)#93 | 47.1%(+43.8)#1,097 |
| 93. | Brave | 90.9% | 51.3%(+39.6)#94 | 47.1%(+43.8)#1,103 |
| 94. | Westmont Borough | 90.7% | 51.3%(+39.4)#95 | 47.1%(+43.6)#1,129 |
| 95. | Smethport Borough | 90.7% | 51.3%(+39.4)#96 | 47.1%(+43.6)#1,135 |
| 96. | Cresson Borough | 90.7% | 51.3%(+39.4)#97 | 47.1%(+43.6)#1,136 |
| 97. | Leechburg Borough | 90.5% | 51.3%(+39.2)#98 | 47.1%(+43.4)#1,175 |
| 98. | Mount Wolf Borough | 90.5% | 51.3%(+39.2)#99 | 47.1%(+43.4)#1,177 |
| 99. | Darlington Borough | 90.5% | 51.3%(+39.2)#100 | 47.1%(+43.4)#1,182 |
| 100. | Clarksville Borough | 90.5% | 51.3%(+39.2)#101 | 47.1%(+43.4)#1,185 |
Common Questions
What are the Top 10 Cities with the Highest Percentage of Households Heated by Utility Gas in Pennsylvania?
Top 10 Cities with the Highest Percentage of Households Heated by Utility Gas in Pennsylvania are:
#1
100.0%
#2
100.0%
#3
100.0%
#4
100.0%
#5
100.0%
#6
100.0%
#7
100.0%
#8
100.0%
#9
100.0%
#10
100.0%
What city has the Highest Percentage of Households Heated by Utility Gas in Pennsylvania?
Slippery Rock University has the Highest Percentage of Households Heated by Utility Gas in Pennsylvania with 100.0%.
What is the Percentage of Households Heated by Utility Gas in the State of Pennsylvania?
Percentage of Households Heated by Utility Gas in Pennsylvania is 51.3%.
What is the Percentage of Households Heated by Utility Gas in the United States?
Percentage of Households Heated by Utility Gas in the United States is 47.1%.