Cities with the Largest Mexican Community in Pennsylvania
RELATED REPORTS & OPTIONS
Mexican
Pennsylvania
Compare Cities
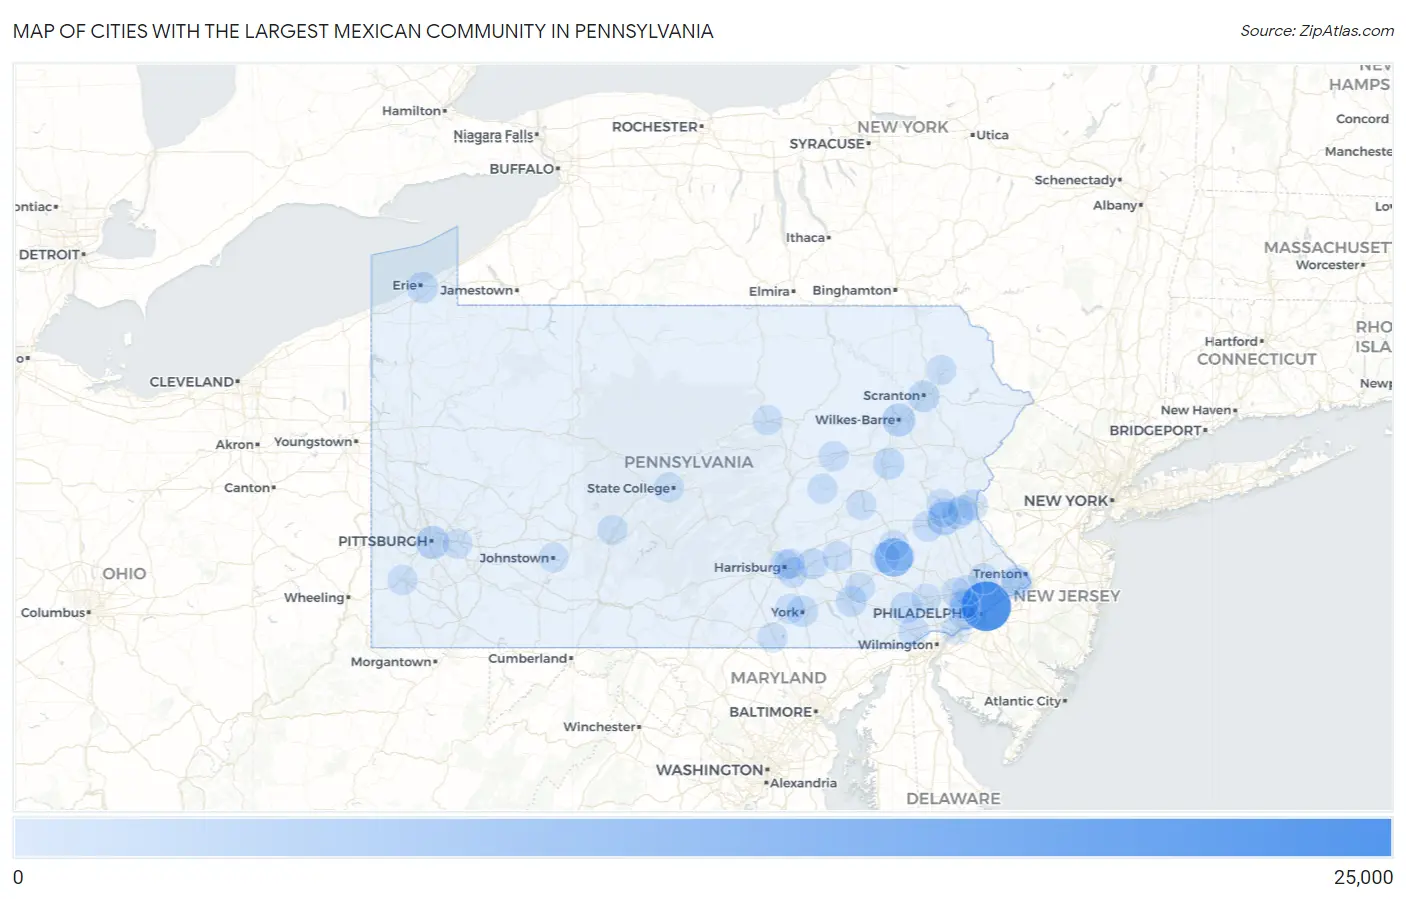
Map of Cities with the Largest Mexican Community in Pennsylvania
0
25,000
Cities with the Largest Mexican Community in Pennsylvania
| City | Mexican | vs State | vs National | |
| 1. | Philadelphia | 22,350 | 170,416(13.11%)#1 | 37,145,956(0.06%)#247 |
| 2. | Reading | 9,592 | 170,416(5.63%)#2 | 37,145,956(0.03%)#538 |
| 3. | Norristown Borough | 5,514 | 170,416(3.24%)#3 | 37,145,956(0.01%)#860 |
| 4. | Allentown | 3,791 | 170,416(2.22%)#4 | 37,145,956(0.01%)#1,138 |
| 5. | Pittsburgh | 3,586 | 170,416(2.10%)#5 | 37,145,956(0.01%)#1,184 |
| 6. | Wilkes Barre | 3,351 | 170,416(1.97%)#6 | 37,145,956(0.01%)#1,256 |
| 7. | Scranton | 1,820 | 170,416(1.07%)#7 | 37,145,956(0.00%)#1,925 |
| 8. | Kennett Square Borough | 1,808 | 170,416(1.06%)#8 | 37,145,956(0.00%)#1,934 |
| 9. | Hazleton | 1,774 | 170,416(1.04%)#9 | 37,145,956(0.00%)#1,960 |
| 10. | Chambersburg Borough | 1,674 | 170,416(0.98%)#10 | 37,145,956(0.00%)#2,035 |
| 11. | Erie | 1,630 | 170,416(0.96%)#11 | 37,145,956(0.00%)#2,064 |
| 12. | Coatesville | 1,548 | 170,416(0.91%)#12 | 37,145,956(0.00%)#2,143 |
| 13. | Bethlehem | 1,450 | 170,416(0.85%)#13 | 37,145,956(0.00%)#2,232 |
| 14. | York | 1,326 | 170,416(0.78%)#14 | 37,145,956(0.00%)#2,361 |
| 15. | Lancaster | 1,253 | 170,416(0.74%)#15 | 37,145,956(0.00%)#2,441 |
| 16. | Easton | 1,134 | 170,416(0.67%)#16 | 37,145,956(0.00%)#2,605 |
| 17. | Hanover Borough | 1,114 | 170,416(0.65%)#17 | 37,145,956(0.00%)#2,628 |
| 18. | Hershey | 1,103 | 170,416(0.65%)#18 | 37,145,956(0.00%)#2,652 |
| 19. | Levittown | 1,095 | 170,416(0.64%)#19 | 37,145,956(0.00%)#2,663 |
| 20. | Oxford Borough | 1,093 | 170,416(0.64%)#20 | 37,145,956(0.00%)#2,669 |
| 21. | Horsham | 1,087 | 170,416(0.64%)#21 | 37,145,956(0.00%)#2,684 |
| 22. | Quakertown Borough | 886 | 170,416(0.52%)#22 | 37,145,956(0.00%)#3,044 |
| 23. | Harrisburg | 816 | 170,416(0.48%)#23 | 37,145,956(0.00%)#3,200 |
| 24. | Breinigsville | 729 | 170,416(0.43%)#24 | 37,145,956(0.00%)#3,436 |
| 25. | Bressler | 663 | 170,416(0.39%)#25 | 37,145,956(0.00%)#3,628 |
| 26. | Gettysburg Borough | 648 | 170,416(0.38%)#26 | 37,145,956(0.00%)#3,674 |
| 27. | Pottstown Borough | 635 | 170,416(0.37%)#27 | 37,145,956(0.00%)#3,721 |
| 28. | Avondale Borough | 603 | 170,416(0.35%)#28 | 37,145,956(0.00%)#3,840 |
| 29. | Toughkenamon | 571 | 170,416(0.34%)#29 | 37,145,956(0.00%)#3,967 |
| 30. | West Grove Borough | 558 | 170,416(0.33%)#30 | 37,145,956(0.00%)#4,020 |
| 31. | Waynesboro Borough | 557 | 170,416(0.33%)#31 | 37,145,956(0.00%)#4,024 |
| 32. | West Chester Borough | 513 | 170,416(0.30%)#32 | 37,145,956(0.00%)#4,210 |
| 33. | Bloomsburg | 509 | 170,416(0.30%)#33 | 37,145,956(0.00%)#4,224 |
| 34. | Drexel Hill | 496 | 170,416(0.29%)#34 | 37,145,956(0.00%)#4,290 |
| 35. | Lebanon | 488 | 170,416(0.29%)#35 | 37,145,956(0.00%)#4,327 |
| 36. | State College Borough | 486 | 170,416(0.29%)#36 | 37,145,956(0.00%)#4,337 |
| 37. | Berwick Borough | 437 | 170,416(0.26%)#37 | 37,145,956(0.00%)#4,592 |
| 38. | Shillington Borough | 425 | 170,416(0.25%)#38 | 37,145,956(0.00%)#4,680 |
| 39. | Shamokin | 392 | 170,416(0.23%)#39 | 37,145,956(0.00%)#4,903 |
| 40. | Ardmore | 389 | 170,416(0.23%)#40 | 37,145,956(0.00%)#4,925 |
| 41. | Springmont | 375 | 170,416(0.22%)#41 | 37,145,956(0.00%)#5,026 |
| 42. | Bryn Mawr | 374 | 170,416(0.22%)#42 | 37,145,956(0.00%)#5,032 |
| 43. | Bridgeport Borough | 366 | 170,416(0.21%)#43 | 37,145,956(0.00%)#5,080 |
| 44. | Progress | 363 | 170,416(0.21%)#44 | 37,145,956(0.00%)#5,094 |
| 45. | Tamaqua Borough | 359 | 170,416(0.21%)#45 | 37,145,956(0.00%)#5,130 |
| 46. | York Springs Borough | 354 | 170,416(0.21%)#46 | 37,145,956(0.00%)#5,167 |
| 47. | Ephrata Borough | 352 | 170,416(0.21%)#47 | 37,145,956(0.00%)#5,175 |
| 48. | Pottsville | 341 | 170,416(0.20%)#48 | 37,145,956(0.00%)#5,249 |
| 49. | Wayne | 340 | 170,416(0.20%)#49 | 37,145,956(0.00%)#5,258 |
| 50. | Park Forest Village | 338 | 170,416(0.20%)#50 | 37,145,956(0.00%)#5,276 |
| 51. | Collingdale Borough | 338 | 170,416(0.20%)#51 | 37,145,956(0.00%)#5,277 |
| 52. | Washington | 330 | 170,416(0.19%)#52 | 37,145,956(0.00%)#5,338 |
| 53. | West Reading Borough | 321 | 170,416(0.19%)#53 | 37,145,956(0.00%)#5,415 |
| 54. | Valley View Cdp York County | 308 | 170,416(0.18%)#54 | 37,145,956(0.00%)#5,524 |
| 55. | Girard Borough | 304 | 170,416(0.18%)#55 | 37,145,956(0.00%)#5,553 |
| 56. | Laureldale Borough | 297 | 170,416(0.17%)#56 | 37,145,956(0.00%)#5,617 |
| 57. | Lionville | 295 | 170,416(0.17%)#57 | 37,145,956(0.00%)#5,633 |
| 58. | Plymouth Meeting | 290 | 170,416(0.17%)#58 | 37,145,956(0.00%)#5,680 |
| 59. | Baldwin Borough | 286 | 170,416(0.17%)#59 | 37,145,956(0.00%)#5,720 |
| 60. | Williamsport | 285 | 170,416(0.17%)#60 | 37,145,956(0.00%)#5,730 |
| 61. | New Oxford Borough | 285 | 170,416(0.17%)#61 | 37,145,956(0.00%)#5,740 |
| 62. | Fairless Hills | 278 | 170,416(0.16%)#62 | 37,145,956(0.00%)#5,800 |
| 63. | West Hazleton Borough | 276 | 170,416(0.16%)#63 | 37,145,956(0.00%)#5,816 |
| 64. | Cementon | 276 | 170,416(0.16%)#64 | 37,145,956(0.00%)#5,820 |
| 65. | Carlisle Borough | 274 | 170,416(0.16%)#65 | 37,145,956(0.00%)#5,832 |
| 66. | Altoona | 272 | 170,416(0.16%)#66 | 37,145,956(0.00%)#5,845 |
| 67. | Chester | 259 | 170,416(0.15%)#67 | 37,145,956(0.00%)#5,984 |
| 68. | Parkesburg Borough | 250 | 170,416(0.15%)#68 | 37,145,956(0.00%)#6,092 |
| 69. | Nottingham | 247 | 170,416(0.14%)#69 | 37,145,956(0.00%)#6,130 |
| 70. | Dunmore Borough | 245 | 170,416(0.14%)#70 | 37,145,956(0.00%)#6,146 |
| 71. | Pennville | 241 | 170,416(0.14%)#71 | 37,145,956(0.00%)#6,204 |
| 72. | Middletown | 237 | 170,416(0.14%)#72 | 37,145,956(0.00%)#6,250 |
| 73. | Eagleville Cdp Montgomery County | 234 | 170,416(0.14%)#73 | 37,145,956(0.00%)#6,283 |
| 74. | Taylor Borough | 224 | 170,416(0.13%)#74 | 37,145,956(0.00%)#6,416 |
| 75. | Windsor Borough | 219 | 170,416(0.13%)#75 | 37,145,956(0.00%)#6,484 |
| 76. | Phoenixville Borough | 216 | 170,416(0.13%)#76 | 37,145,956(0.00%)#6,521 |
| 77. | Lansdowne Borough | 215 | 170,416(0.13%)#77 | 37,145,956(0.00%)#6,540 |
| 78. | Fleetwood Borough | 214 | 170,416(0.13%)#78 | 37,145,956(0.00%)#6,563 |
| 79. | Plymouth Borough | 213 | 170,416(0.12%)#79 | 37,145,956(0.00%)#6,582 |
| 80. | King Of Prussia | 208 | 170,416(0.12%)#80 | 37,145,956(0.00%)#6,655 |
| 81. | Hummelstown Borough | 207 | 170,416(0.12%)#81 | 37,145,956(0.00%)#6,676 |
| 82. | Temple | 206 | 170,416(0.12%)#82 | 37,145,956(0.00%)#6,688 |
| 83. | Weigelstown | 205 | 170,416(0.12%)#83 | 37,145,956(0.00%)#6,694 |
| 84. | Milton Borough | 203 | 170,416(0.12%)#84 | 37,145,956(0.00%)#6,727 |
| 85. | Kingston Borough | 201 | 170,416(0.12%)#85 | 37,145,956(0.00%)#6,751 |
| 86. | Lehighton Borough | 201 | 170,416(0.12%)#86 | 37,145,956(0.00%)#6,753 |
| 87. | Lititz Borough | 198 | 170,416(0.12%)#87 | 37,145,956(0.00%)#6,794 |
| 88. | Mont Clare | 198 | 170,416(0.12%)#88 | 37,145,956(0.00%)#6,799 |
| 89. | Bristol Borough | 193 | 170,416(0.11%)#89 | 37,145,956(0.00%)#6,867 |
| 90. | Bendersville Borough | 193 | 170,416(0.11%)#90 | 37,145,956(0.00%)#6,882 |
| 91. | Brownstown | 190 | 170,416(0.11%)#91 | 37,145,956(0.00%)#6,917 |
| 92. | Johnstown | 189 | 170,416(0.11%)#92 | 37,145,956(0.00%)#6,926 |
| 93. | Fullerton | 188 | 170,416(0.11%)#93 | 37,145,956(0.00%)#6,949 |
| 94. | Carbondale | 186 | 170,416(0.11%)#94 | 37,145,956(0.00%)#6,987 |
| 95. | Pennside | 181 | 170,416(0.11%)#95 | 37,145,956(0.00%)#7,070 |
| 96. | Shenandoah Borough | 176 | 170,416(0.10%)#96 | 37,145,956(0.00%)#7,157 |
| 97. | Glen Rock Borough | 175 | 170,416(0.10%)#97 | 37,145,956(0.00%)#7,178 |
| 98. | Monroeville | 173 | 170,416(0.10%)#98 | 37,145,956(0.00%)#7,199 |
| 99. | Wyomissing Borough | 173 | 170,416(0.10%)#99 | 37,145,956(0.00%)#7,200 |
| 100. | East Stroudsburg Borough | 173 | 170,416(0.10%)#100 | 37,145,956(0.00%)#7,202 |
Common Questions
What are the Top 10 Cities with the Largest Mexican Community in Pennsylvania?
Top 10 Cities with the Largest Mexican Community in Pennsylvania are:
#1
22,350
#2
9,592
#3
3,791
#4
3,586
#5
3,351
#6
1,820
#7
1,774
#8
1,630
#9
1,548
#10
1,450
What city has the Largest Mexican Community in Pennsylvania?
Philadelphia has the Largest Mexican Community in Pennsylvania with 22,350.
What is the Total Mexican Population in the State of Pennsylvania?
Total Mexican Population in Pennsylvania is 170,416.
What is the Total Mexican Population in the United States?
Total Mexican Population in the United States is 37,145,956.