Schlusser, PA
Schlusser Map
Schlusser Overview
5,725
TOTAL POPULATION
2,857
MALE POPULATION
2,868
FEMALE POPULATION
99.62
MALES / 100 FEMALES
100.39
FEMALES / 100 MALES
41.9
MEDIAN AGE
3.0
AVG FAMILY SIZE
2.4
AVG HOUSEHOLD SIZE
$42,167
PER CAPITA INCOME
$107,574
AVG FAMILY INCOME
$82,835
AVG HOUSEHOLD INCOME
39.8%
WAGE / INCOME GAP [ % ]
60.2¢/ $1
WAGE / INCOME GAP [ $ ]
0.34
INEQUALITY / GINI INDEX
3,348
LABOR FORCE [ PEOPLE ]
69.0%
PERCENT IN LABOR FORCE
4.4%
UNEMPLOYMENT RATE
Race in Schlusser
The most populous races in Schlusser are White / Caucasian (4,752 | 83.0%), Black / African American (613 | 10.7%), and Two or more Races (287 | 5.0%).
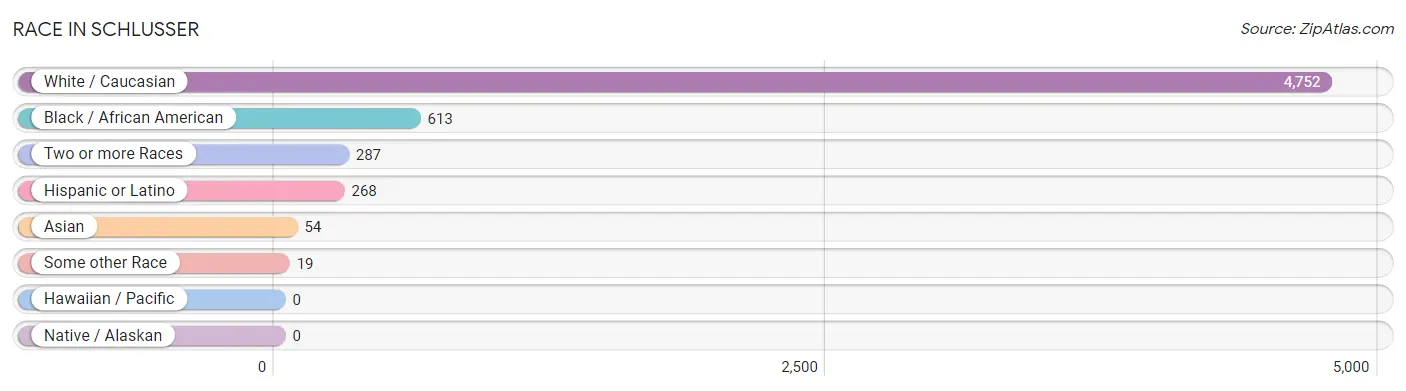
| Race | # Population | % Population |
| Asian | 54 | 0.9% |
| Black / African American | 613 | 10.7% |
| Hawaiian / Pacific | 0 | 0.0% |
| Hispanic or Latino | 268 | 4.7% |
| Native / Alaskan | 0 | 0.0% |
| White / Caucasian | 4,752 | 83.0% |
| Two or more Races | 287 | 5.0% |
| Some other Race | 19 | 0.3% |
| Total | 5,725 | 100.0% |
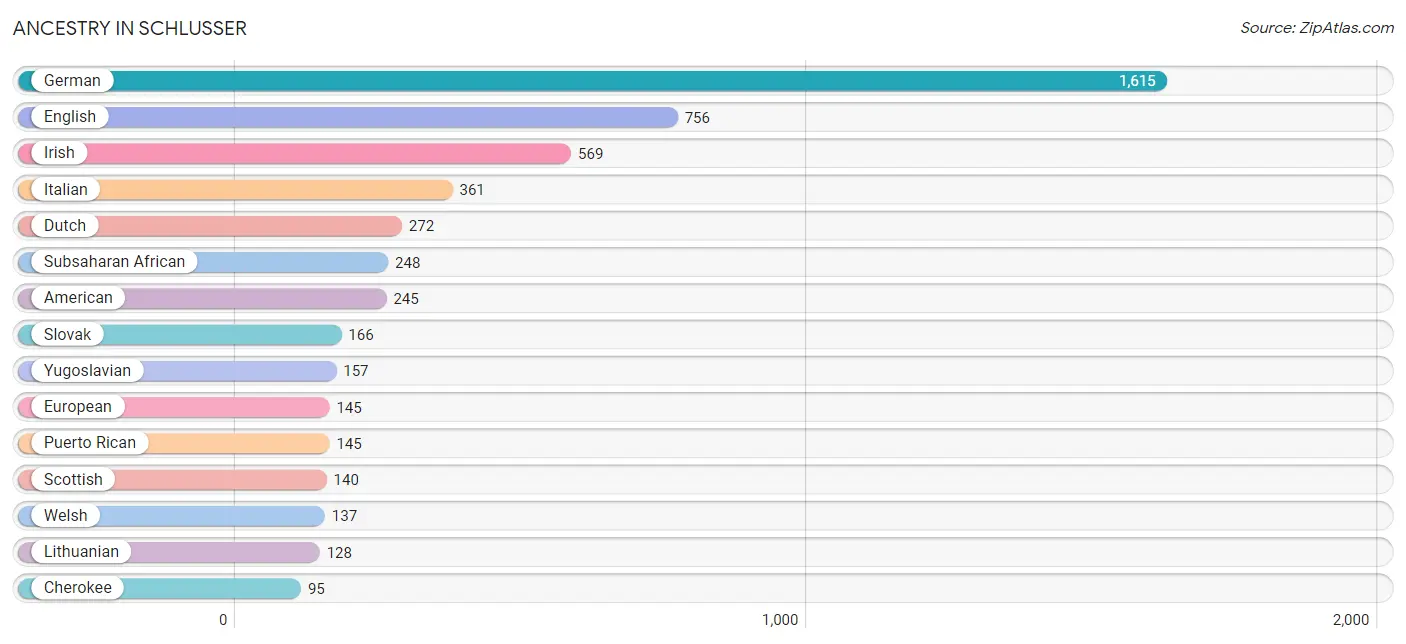
Ancestry in Schlusser
The most populous ancestries reported in Schlusser are German (1,615 | 28.2%), English (756 | 13.2%), Irish (569 | 9.9%), Italian (361 | 6.3%), and Dutch (272 | 4.8%), together accounting for 62.4% of all Schlusser residents.
| Ancestry | # Population | % Population |
| African | 1 | 0.0% |
| American | 245 | 4.3% |
| Arab | 34 | 0.6% |
| Austrian | 39 | 0.7% |
| British | 18 | 0.3% |
| Bulgarian | 12 | 0.2% |
| Canadian | 11 | 0.2% |
| Central American | 51 | 0.9% |
| Cherokee | 95 | 1.7% |
| Cuban | 43 | 0.7% |
| Czech | 9 | 0.2% |
| Danish | 12 | 0.2% |
| Dutch | 272 | 4.8% |
| English | 756 | 13.2% |
| European | 145 | 2.5% |
| French | 28 | 0.5% |
| German | 1,615 | 28.2% |
| Ghanaian | 47 | 0.8% |
| Greek | 68 | 1.2% |
| Guatemalan | 51 | 0.9% |
| Hungarian | 79 | 1.4% |
| Irish | 569 | 9.9% |
| Italian | 361 | 6.3% |
| Lithuanian | 128 | 2.2% |
| Mexican | 29 | 0.5% |
| Moroccan | 25 | 0.4% |
| Native Hawaiian | 83 | 1.5% |
| Northern European | 13 | 0.2% |
| Pennsylvania German | 89 | 1.5% |
| Polish | 15 | 0.3% |
| Puerto Rican | 145 | 2.5% |
| Scandinavian | 65 | 1.1% |
| Scotch-Irish | 61 | 1.1% |
| Scottish | 140 | 2.5% |
| Slavic | 48 | 0.8% |
| Slovak | 166 | 2.9% |
| Sri Lankan | 25 | 0.4% |
| Subsaharan African | 248 | 4.3% |
| Swedish | 14 | 0.2% |
| Swiss | 19 | 0.3% |
| Thai | 29 | 0.5% |
| Ukrainian | 33 | 0.6% |
| Welsh | 137 | 2.4% |
| Yugoslavian | 157 | 2.7% | View All 44 Rows |
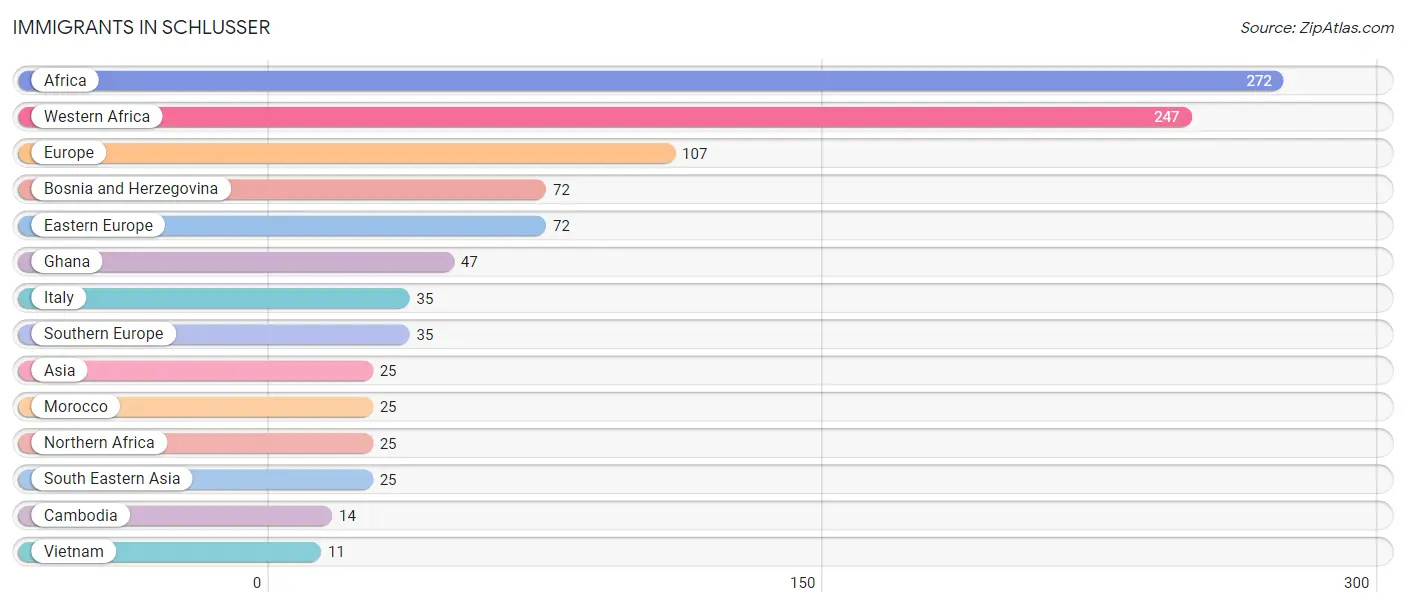
Immigrants in Schlusser
The most numerous immigrant groups reported in Schlusser came from Africa (272 | 4.8%), Western Africa (247 | 4.3%), Europe (107 | 1.9%), Bosnia and Herzegovina (72 | 1.3%), and Eastern Europe (72 | 1.3%), together accounting for 13.5% of all Schlusser residents.
| Immigration Origin | # Population | % Population |
| Africa | 272 | 4.8% |
| Asia | 25 | 0.4% |
| Bosnia and Herzegovina | 72 | 1.3% |
| Cambodia | 14 | 0.2% |
| Eastern Europe | 72 | 1.3% |
| Europe | 107 | 1.9% |
| Ghana | 47 | 0.8% |
| Italy | 35 | 0.6% |
| Morocco | 25 | 0.4% |
| Northern Africa | 25 | 0.4% |
| South Eastern Asia | 25 | 0.4% |
| Southern Europe | 35 | 0.6% |
| Vietnam | 11 | 0.2% |
| Western Africa | 247 | 4.3% | View All 14 Rows |
Sex and Age in Schlusser
Sex and Age in Schlusser
The most populous age groups in Schlusser are 40 to 44 Years (322 | 11.3%) for men and 35 to 39 Years (346 | 12.1%) for women.
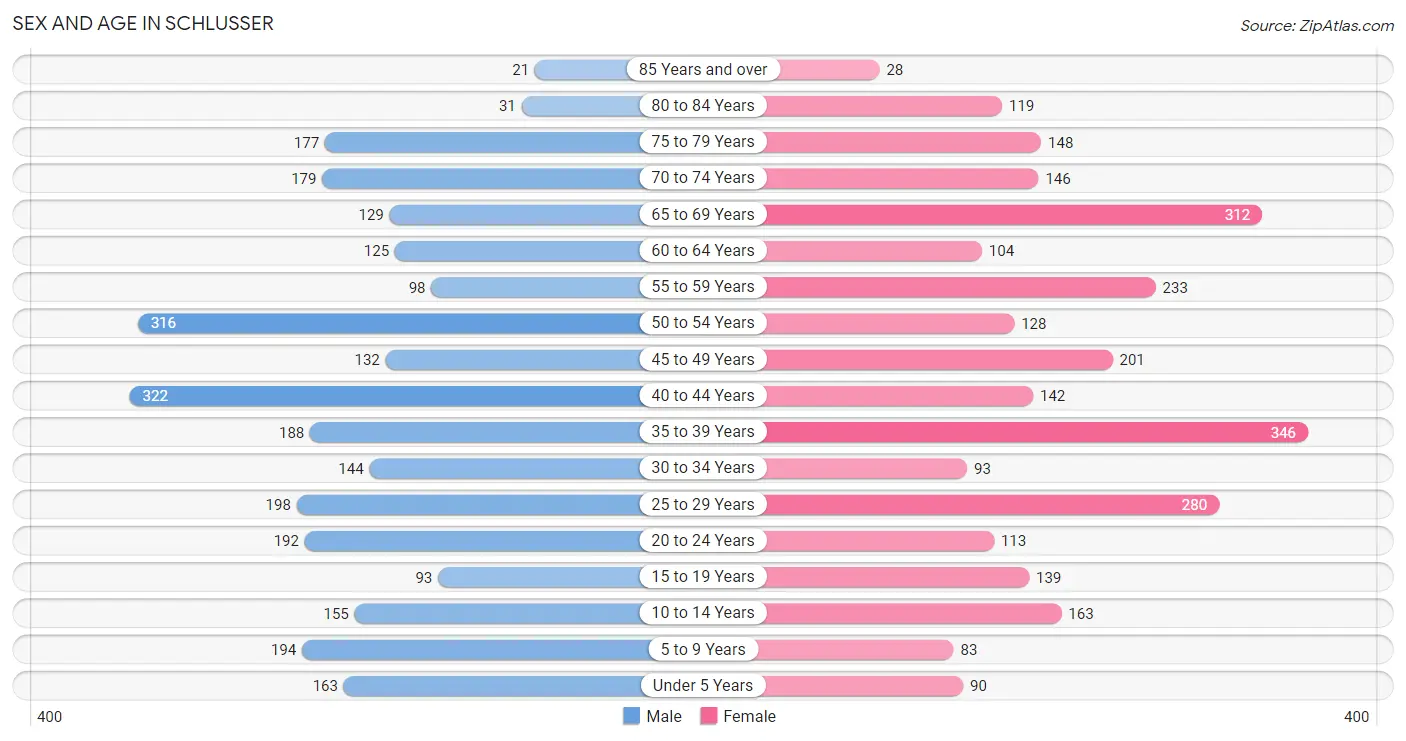
| Age Bracket | Male | Female |
| Under 5 Years | 163 (5.7%) | 90 (3.1%) |
| 5 to 9 Years | 194 (6.8%) | 83 (2.9%) |
| 10 to 14 Years | 155 (5.4%) | 163 (5.7%) |
| 15 to 19 Years | 93 (3.3%) | 139 (4.9%) |
| 20 to 24 Years | 192 (6.7%) | 113 (3.9%) |
| 25 to 29 Years | 198 (6.9%) | 280 (9.8%) |
| 30 to 34 Years | 144 (5.0%) | 93 (3.2%) |
| 35 to 39 Years | 188 (6.6%) | 346 (12.1%) |
| 40 to 44 Years | 322 (11.3%) | 142 (5.0%) |
| 45 to 49 Years | 132 (4.6%) | 201 (7.0%) |
| 50 to 54 Years | 316 (11.1%) | 128 (4.5%) |
| 55 to 59 Years | 98 (3.4%) | 233 (8.1%) |
| 60 to 64 Years | 125 (4.4%) | 104 (3.6%) |
| 65 to 69 Years | 129 (4.5%) | 312 (10.9%) |
| 70 to 74 Years | 179 (6.3%) | 146 (5.1%) |
| 75 to 79 Years | 177 (6.2%) | 148 (5.2%) |
| 80 to 84 Years | 31 (1.1%) | 119 (4.2%) |
| 85 Years and over | 21 (0.7%) | 28 (1.0%) |
| Total | 2,857 (100.0%) | 2,868 (100.0%) |
Families and Households in Schlusser
Median Family Size in Schlusser
The median family size in Schlusser is 2.97 persons per family, with single male/father families (131 | 8.4%) accounting for the largest median family size of 3.16 persons per family. On the other hand, single female/mother families (133 | 8.5%) represent the smallest median family size with 2.02 persons per family.
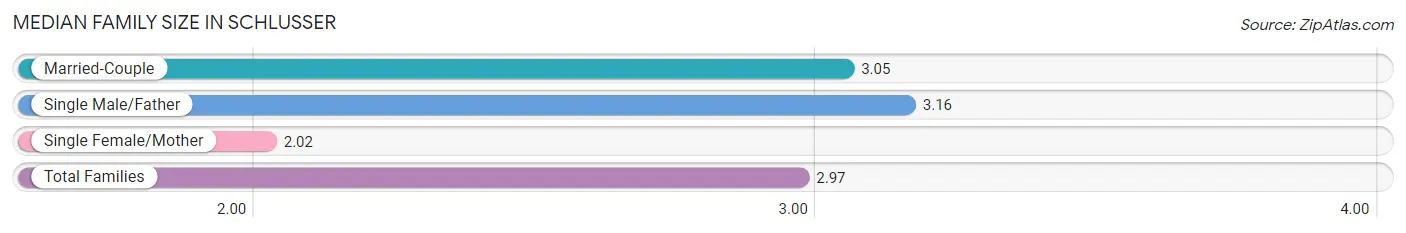
| Family Type | # Families | Family Size |
| Married-Couple | 1,296 (83.1%) | 3.05 |
| Single Male/Father | 131 (8.4%) | 3.16 |
| Single Female/Mother | 133 (8.5%) | 2.02 |
| Total Families | 1,560 (100.0%) | 2.97 |
Median Household Size in Schlusser
The median household size in Schlusser is 2.36 persons per household, with single male/father households (131 | 5.4%) accounting for the largest median household size of 3.47 persons per household. non-family households (867 | 35.7%) represent the smallest median household size with 1.17 persons per household.
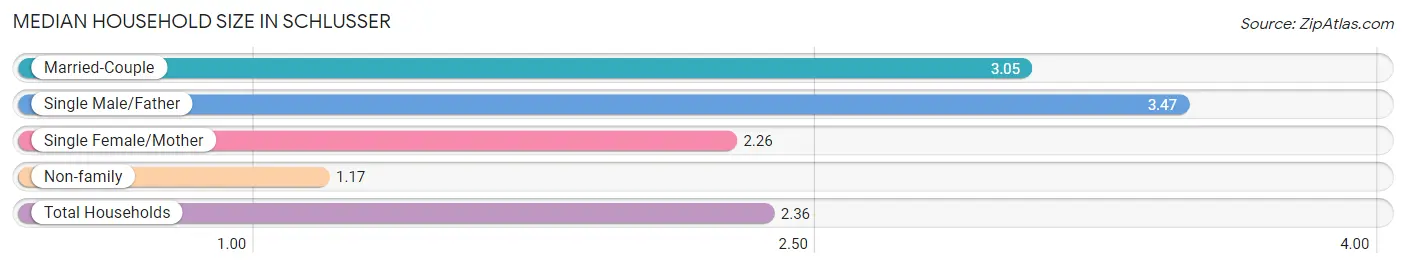
| Household Type | # Households | Household Size |
| Married-Couple | 1,296 (53.4%) | 3.05 |
| Single Male/Father | 131 (5.4%) | 3.47 |
| Single Female/Mother | 133 (5.5%) | 2.26 |
| Non-family | 867 (35.7%) | 1.17 |
| Total Households | 2,427 (100.0%) | 2.36 |
Household Size by Marriage Status in Schlusser
Out of a total of 2,427 households in Schlusser, 1,560 (64.3%) are family households, while 867 (35.7%) are nonfamily households. The most numerous type of family households are 2-person households, comprising 726, and the most common type of nonfamily households are 1-person households, comprising 727.
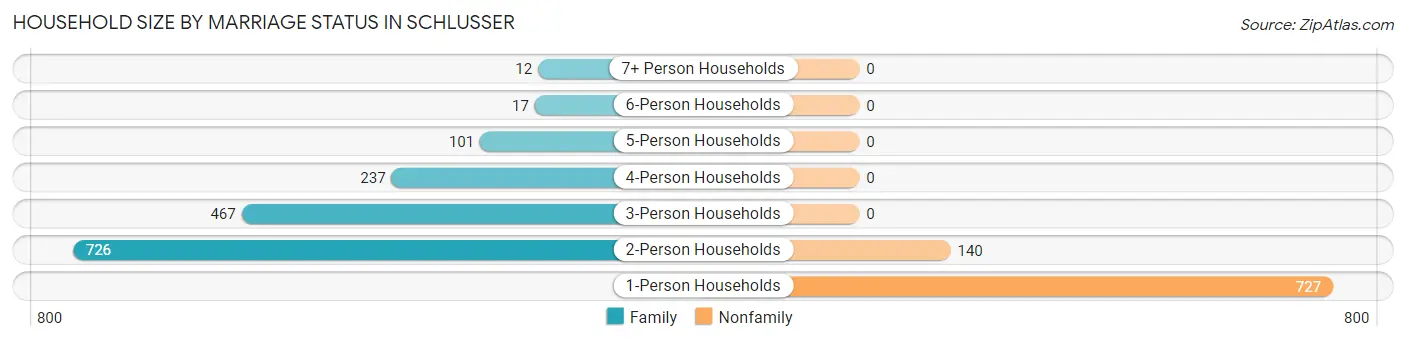
| Household Size | Family Households | Nonfamily Households |
| 1-Person Households | - | 727 (29.9%) |
| 2-Person Households | 726 (29.9%) | 140 (5.8%) |
| 3-Person Households | 467 (19.2%) | 0 (0.0%) |
| 4-Person Households | 237 (9.8%) | 0 (0.0%) |
| 5-Person Households | 101 (4.2%) | 0 (0.0%) |
| 6-Person Households | 17 (0.7%) | 0 (0.0%) |
| 7+ Person Households | 12 (0.5%) | 0 (0.0%) |
| Total | 1,560 (64.3%) | 867 (35.7%) |
Female Fertility in Schlusser
Fertility by Age in Schlusser
Average fertility rate in Schlusser is 28.0 births per 1,000 women. Women in the age bracket of 20 to 34 years have the highest fertility rate with 80.0 births per 1,000 women. Women in the age bracket of 20 to 34 years acount for 100.0% of all women with births.
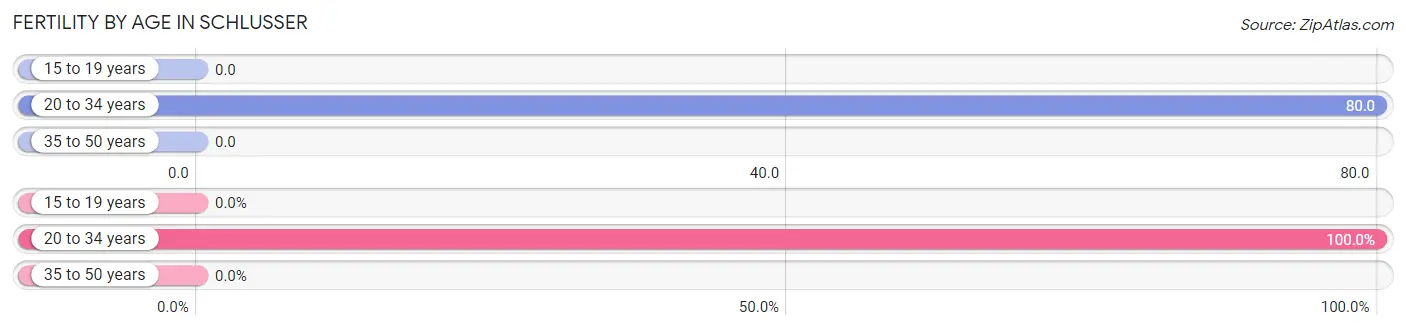
| Age Bracket | Women with Births | Births / 1,000 Women |
| 15 to 19 years | 0 (0.0%) | 0.0 |
| 20 to 34 years | 39 (100.0%) | 80.0 |
| 35 to 50 years | 0 (0.0%) | 0.0 |
| Total | 39 (100.0%) | 28.0 |
Fertility by Age by Marriage Status in Schlusser
59.0% of women with births (39) in Schlusser are married. The highest percentage of unmarried women with births falls into 20 to 34 years age bracket with 41.0% of them unmarried at the time of birth, while the lowest percentage of unmarried women with births belong to 20 to 34 years age bracket with 41.0% of them unmarried.
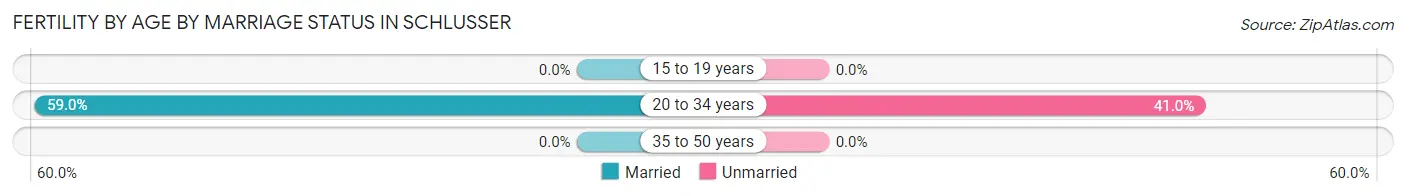
| Age Bracket | Married | Unmarried |
| 15 to 19 years | 0 (0.0%) | 0 (0.0%) |
| 20 to 34 years | 23 (59.0%) | 16 (41.0%) |
| 35 to 50 years | 0 (0.0%) | 0 (0.0%) |
| Total | 23 (59.0%) | 16 (41.0%) |
Fertility by Education in Schlusser
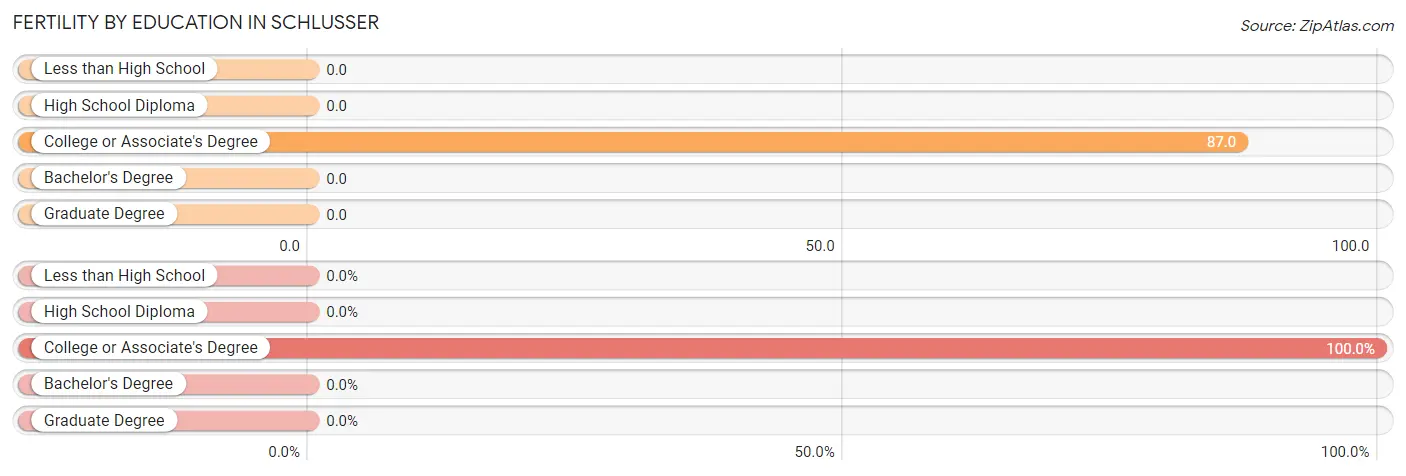
| Educational Attainment | Women with Births | Births / 1,000 Women |
| Less than High School | 0 (0.0%) | 0.0 |
| High School Diploma | 0 (0.0%) | 0.0 |
| College or Associate's Degree | 39 (100.0%) | 87.0 |
| Bachelor's Degree | 0 (0.0%) | 0.0 |
| Graduate Degree | 0 (0.0%) | 0.0 |
| Total | 39 (100.0%) | 28.0 |
Fertility by Education by Marriage Status in Schlusser
41.0% of women with births in Schlusser are unmarried. Women with the educational attainment of college or associate's degree are most likely to be married with 59.0% of them married at childbirth, while women with the educational attainment of college or associate's degree are least likely to be married with 41.0% of them unmarried at childbirth.
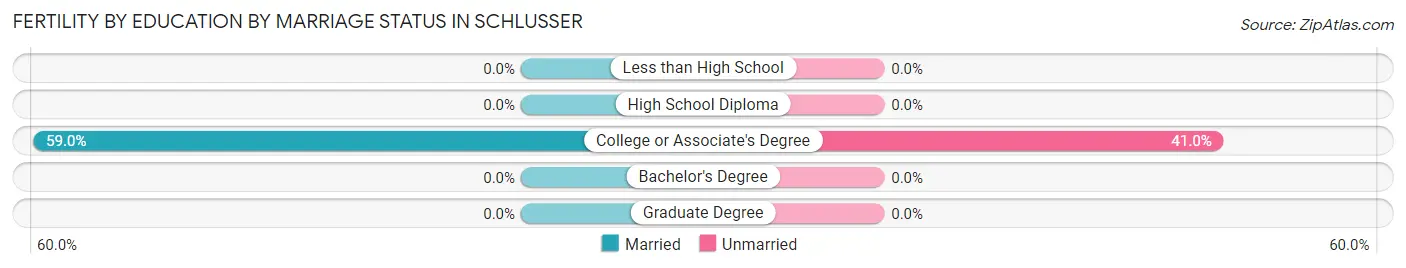
| Educational Attainment | Married | Unmarried |
| Less than High School | 0 (0.0%) | 0 (0.0%) |
| High School Diploma | 0 (0.0%) | 0 (0.0%) |
| College or Associate's Degree | 23 (59.0%) | 16 (41.0%) |
| Bachelor's Degree | 0 (0.0%) | 0 (0.0%) |
| Graduate Degree | 0 (0.0%) | 0 (0.0%) |
| Total | 23 (59.0%) | 16 (41.0%) |
Income in Schlusser
Income Overview in Schlusser
Per Capita Income in Schlusser is $42,167, while median incomes of families and households are $107,574 and $82,835 respectively.
| Characteristic | Number | Measure |
| Per Capita Income | 5,725 | $42,167 |
| Median Family Income | 1,560 | $107,574 |
| Mean Family Income | 1,560 | $111,581 |
| Median Household Income | 2,427 | $82,835 |
| Mean Household Income | 2,427 | $97,054 |
| Income Deficit | 1,560 | $0 |
| Wage / Income Gap (%) | 5,725 | 39.82% |
| Wage / Income Gap ($) | 5,725 | 60.18¢ per $1 |
| Gini / Inequality Index | 5,725 | 0.34 |
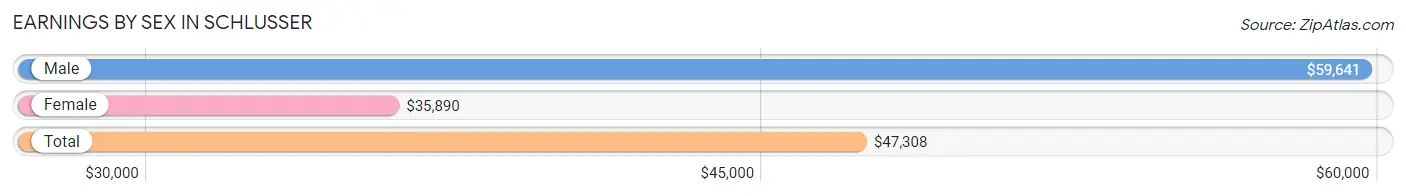
Earnings by Sex in Schlusser
Average Earnings in Schlusser are $47,308, $59,641 for men and $35,890 for women, a difference of 39.8%.
| Sex | Number | Average Earnings |
| Male | 1,741 (50.9%) | $59,641 |
| Female | 1,682 (49.1%) | $35,890 |
| Total | 3,423 (100.0%) | $47,308 |
Earnings by Sex by Income Bracket in Schlusser
The most common earnings brackets in Schlusser are $55,000 to $64,999 for men (337 | 19.4%) and $65,000 to $74,999 for women (144 | 8.6%).
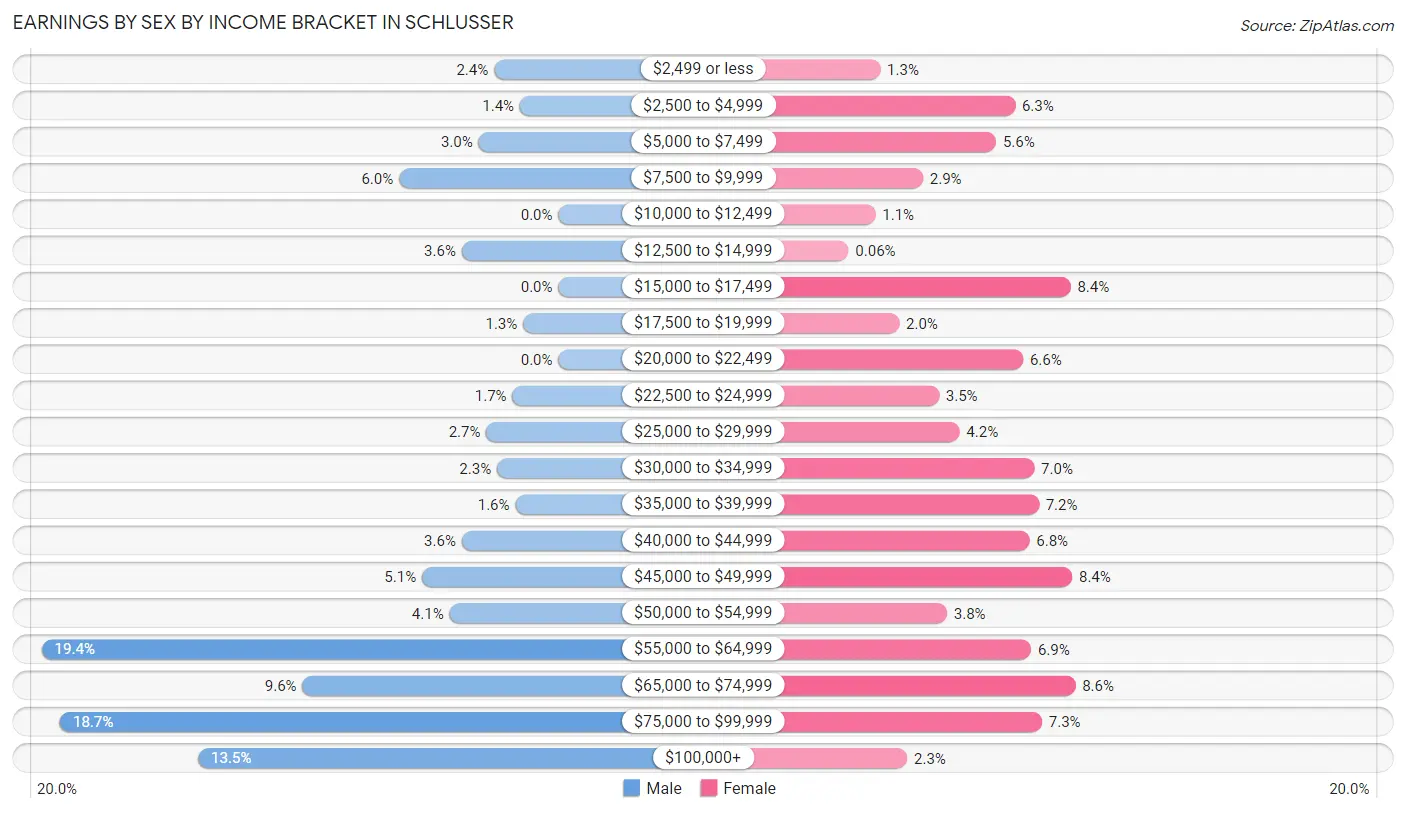
| Income | Male | Female |
| $2,499 or less | 42 (2.4%) | 21 (1.3%) |
| $2,500 to $4,999 | 25 (1.4%) | 106 (6.3%) |
| $5,000 to $7,499 | 52 (3.0%) | 94 (5.6%) |
| $7,500 to $9,999 | 104 (6.0%) | 48 (2.9%) |
| $10,000 to $12,499 | 0 (0.0%) | 18 (1.1%) |
| $12,500 to $14,999 | 63 (3.6%) | 1 (0.1%) |
| $15,000 to $17,499 | 0 (0.0%) | 141 (8.4%) |
| $17,500 to $19,999 | 23 (1.3%) | 33 (2.0%) |
| $20,000 to $22,499 | 0 (0.0%) | 111 (6.6%) |
| $22,500 to $24,999 | 30 (1.7%) | 58 (3.5%) |
| $25,000 to $29,999 | 47 (2.7%) | 71 (4.2%) |
| $30,000 to $34,999 | 40 (2.3%) | 118 (7.0%) |
| $35,000 to $39,999 | 28 (1.6%) | 121 (7.2%) |
| $40,000 to $44,999 | 63 (3.6%) | 115 (6.8%) |
| $45,000 to $49,999 | 89 (5.1%) | 142 (8.4%) |
| $50,000 to $54,999 | 71 (4.1%) | 63 (3.7%) |
| $55,000 to $64,999 | 337 (19.4%) | 116 (6.9%) |
| $65,000 to $74,999 | 167 (9.6%) | 144 (8.6%) |
| $75,000 to $99,999 | 325 (18.7%) | 123 (7.3%) |
| $100,000+ | 235 (13.5%) | 38 (2.3%) |
| Total | 1,741 (100.0%) | 1,682 (100.0%) |
Earnings by Sex by Educational Attainment in Schlusser
Average earnings in Schlusser are $63,734 for men and $38,165 for women, a difference of 40.1%. Men with an educational attainment of graduate degree enjoy the highest average annual earnings of $69,375, while those with high school diploma education earn the least with $60,682. Women with an educational attainment of graduate degree earn the most with the average annual earnings of $61,902, while those with college or associate's degree education have the smallest earnings of $35,240.
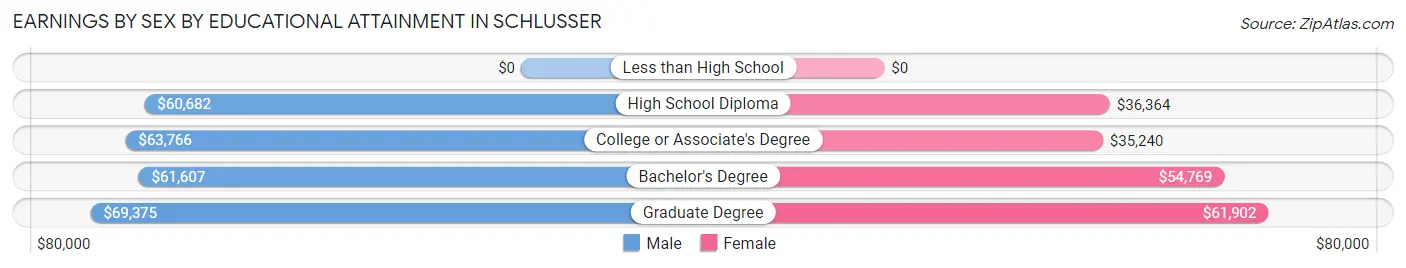
| Educational Attainment | Male Income | Female Income |
| Less than High School | - | - |
| High School Diploma | $60,682 | $36,364 |
| College or Associate's Degree | $63,766 | $35,240 |
| Bachelor's Degree | $61,607 | $54,769 |
| Graduate Degree | $69,375 | $61,902 |
| Total | $63,734 | $38,165 |
Family Income in Schlusser
Family Income Brackets in Schlusser
According to the Schlusser family income data, there are 410 families falling into the $100,000 to $149,999 income range, which is the most common income bracket and makes up 26.3% of all families.
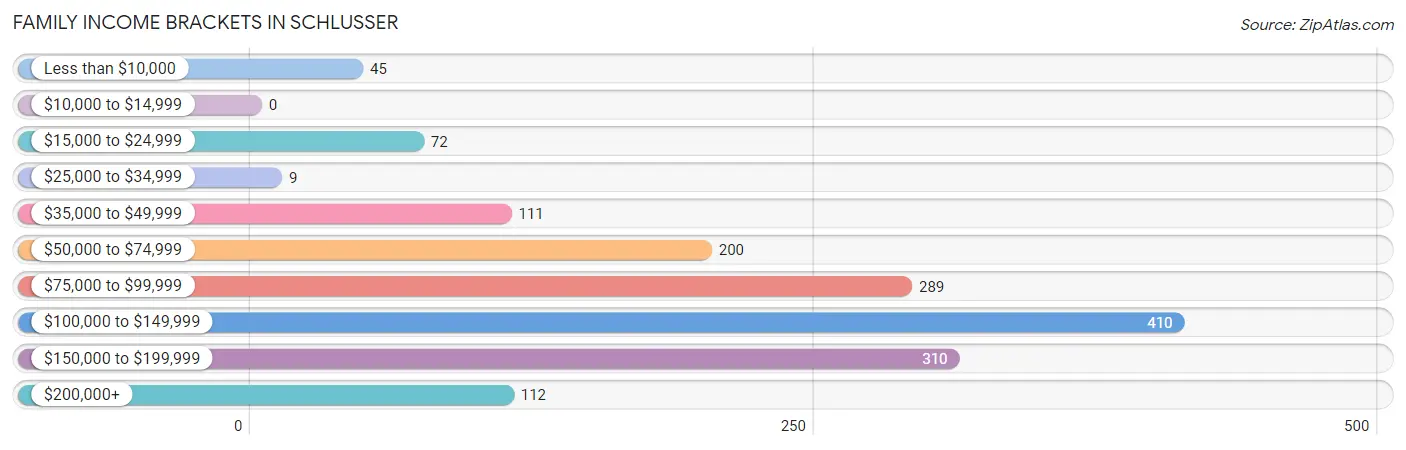
| Income Bracket | # Families | % Families |
| Less than $10,000 | 45 | 2.9% |
| $10,000 to $14,999 | 0 | 0.0% |
| $15,000 to $24,999 | 72 | 4.6% |
| $25,000 to $34,999 | 9 | 0.6% |
| $35,000 to $49,999 | 111 | 7.1% |
| $50,000 to $74,999 | 200 | 12.8% |
| $75,000 to $99,999 | 289 | 18.5% |
| $100,000 to $149,999 | 410 | 26.3% |
| $150,000 to $199,999 | 310 | 19.9% |
| $200,000+ | 112 | 7.2% |
Family Income by Famaliy Size in Schlusser
5-person families (101 | 6.5%) account for the highest median family income in Schlusser with $131,734 per family, while 3-person families (451 | 28.9%) have the highest median income of $43,083 per family member.
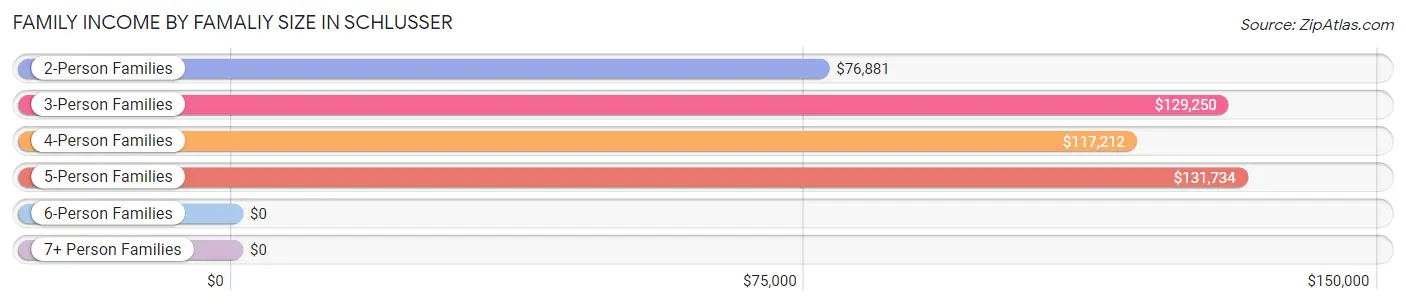
| Income Bracket | # Families | Median Income |
| 2-Person Families | 742 (47.6%) | $76,881 |
| 3-Person Families | 451 (28.9%) | $129,250 |
| 4-Person Families | 237 (15.2%) | $117,212 |
| 5-Person Families | 101 (6.5%) | $131,734 |
| 6-Person Families | 17 (1.1%) | $0 |
| 7+ Person Families | 12 (0.8%) | $0 |
| Total | 1,560 (100.0%) | $107,574 |
Family Income by Number of Earners in Schlusser
The median family income in Schlusser is $107,574, with families comprising 3+ earners (229) having the highest median family income of $152,228, while families with 1 earner (458) have the lowest median family income of $75,029, accounting for 14.7% and 29.4% of families, respectively.
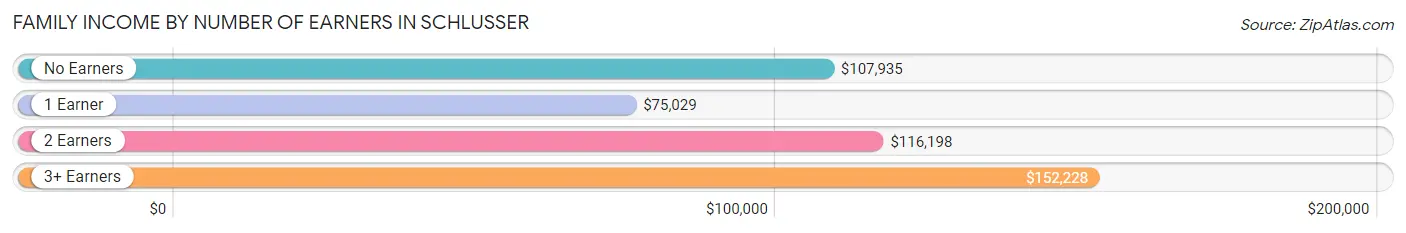
| Number of Earners | # Families | Median Income |
| No Earners | 266 (17.1%) | $107,935 |
| 1 Earner | 458 (29.4%) | $75,029 |
| 2 Earners | 607 (38.9%) | $116,198 |
| 3+ Earners | 229 (14.7%) | $152,228 |
| Total | 1,560 (100.0%) | $107,574 |
Household Income in Schlusser
Household Income Brackets in Schlusser
With 551 households falling in the category, the $50,000 to $74,999 income range is the most frequent in Schlusser, accounting for 22.7% of all households. In contrast, only 27 households (1.1%) fall into the $10,000 to $14,999 income bracket, making it the least populous group.
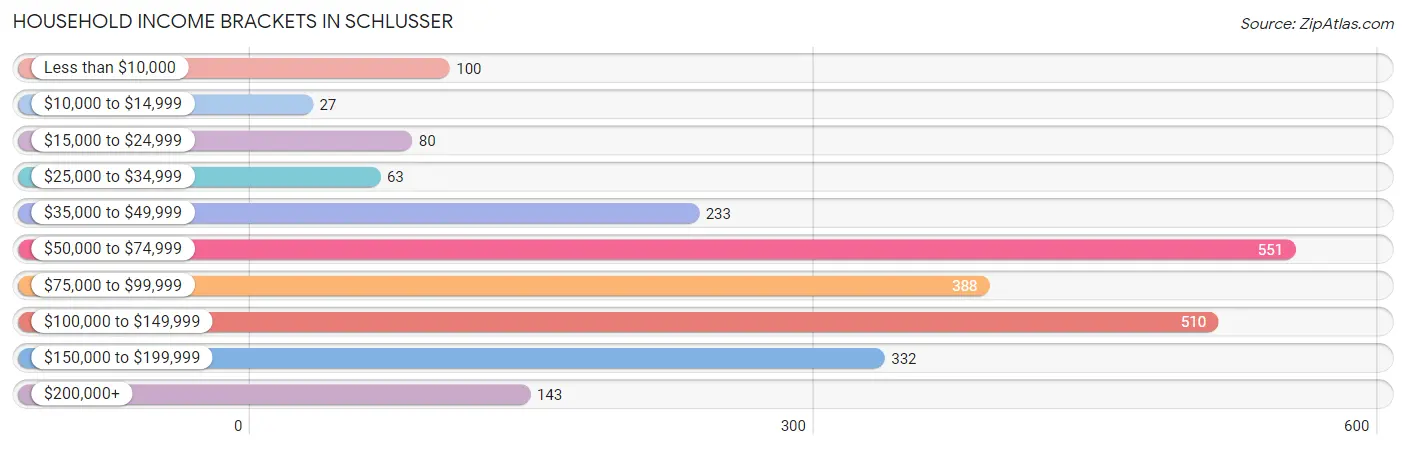
| Income Bracket | # Households | % Households |
| Less than $10,000 | 100 | 4.1% |
| $10,000 to $14,999 | 27 | 1.1% |
| $15,000 to $24,999 | 80 | 3.3% |
| $25,000 to $34,999 | 63 | 2.6% |
| $35,000 to $49,999 | 233 | 9.6% |
| $50,000 to $74,999 | 551 | 22.7% |
| $75,000 to $99,999 | 388 | 16.0% |
| $100,000 to $149,999 | 510 | 21.0% |
| $150,000 to $199,999 | 332 | 13.7% |
| $200,000+ | 143 | 5.9% |
Household Income by Householder Age in Schlusser
The median household income in Schlusser is $82,835, with the highest median household income of $90,441 found in the 45 to 64 years age bracket for the primary householder. A total of 734 households (30.2%) fall into this category. Meanwhile, the 15 to 24 years age bracket for the primary householder has the lowest median household income of $0, with 14 households (0.6%) in this group.
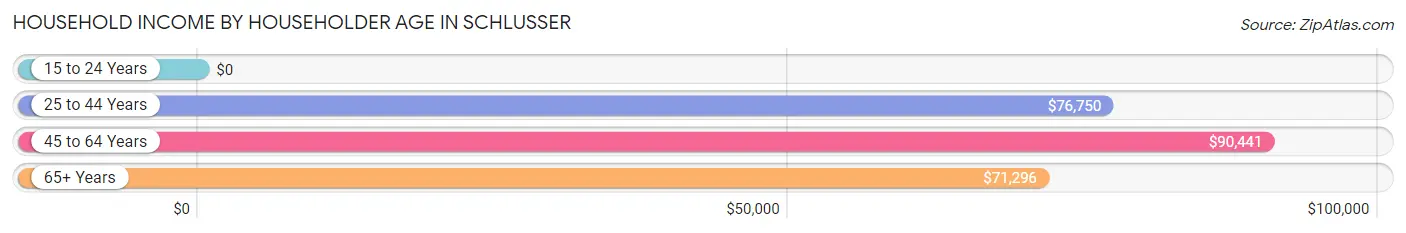
| Income Bracket | # Households | Median Income |
| 15 to 24 Years | 14 (0.6%) | $0 |
| 25 to 44 Years | 935 (38.5%) | $76,750 |
| 45 to 64 Years | 734 (30.2%) | $90,441 |
| 65+ Years | 744 (30.7%) | $71,296 |
| Total | 2,427 (100.0%) | $82,835 |
Poverty in Schlusser
Income Below Poverty by Sex and Age in Schlusser
With 4.4% poverty level for males and 7.8% for females among the residents of Schlusser, 6 to 11 year old males and 6 to 11 year old females are the most vulnerable to poverty, with 32 males (15.9%) and 45 females (40.2%) in their respective age groups living below the poverty level.
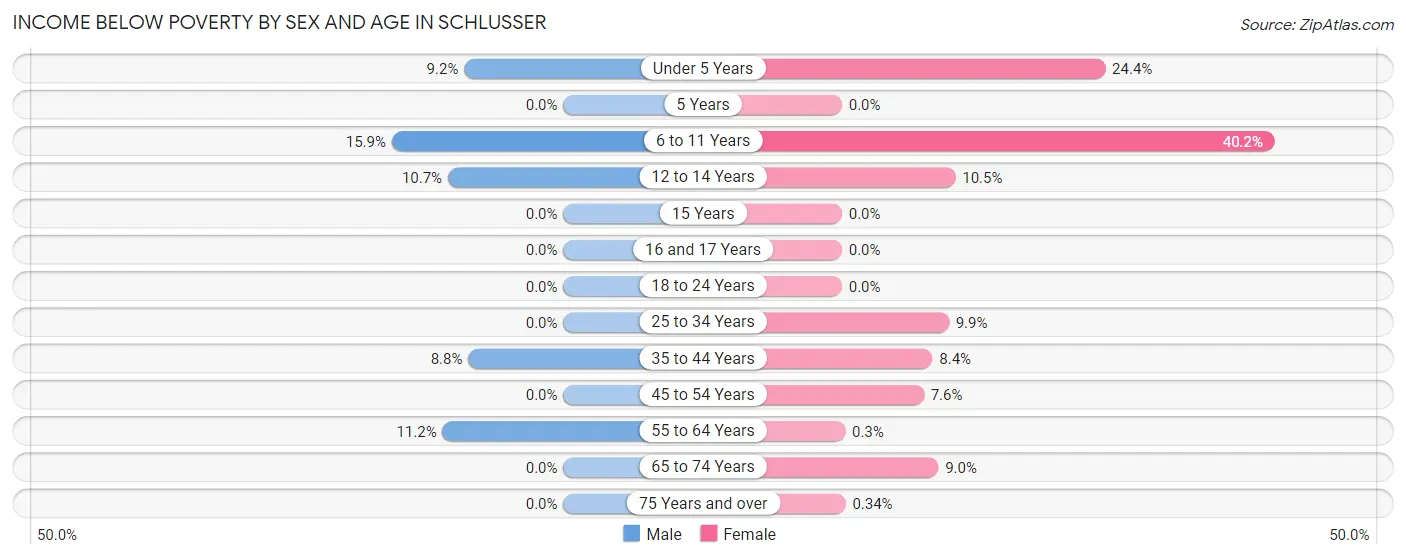
| Age Bracket | Male | Female |
| Under 5 Years | 15 (9.2%) | 22 (24.4%) |
| 5 Years | 0 (0.0%) | 0 (0.0%) |
| 6 to 11 Years | 32 (15.9%) | 45 (40.2%) |
| 12 to 14 Years | 9 (10.7%) | 10 (10.5%) |
| 15 Years | 0 (0.0%) | 0 (0.0%) |
| 16 and 17 Years | 0 (0.0%) | 0 (0.0%) |
| 18 to 24 Years | 0 (0.0%) | 0 (0.0%) |
| 25 to 34 Years | 0 (0.0%) | 37 (9.9%) |
| 35 to 44 Years | 45 (8.8%) | 41 (8.4%) |
| 45 to 54 Years | 0 (0.0%) | 25 (7.6%) |
| 55 to 64 Years | 25 (11.2%) | 1 (0.3%) |
| 65 to 74 Years | 0 (0.0%) | 41 (8.9%) |
| 75 Years and over | 0 (0.0%) | 1 (0.3%) |
| Total | 126 (4.4%) | 223 (7.8%) |
Income Above Poverty by Sex and Age in Schlusser
According to the poverty statistics in Schlusser, males aged 5 years and females aged 5 years are the age groups that are most secure financially, with 100.0% of males and 100.0% of females in these age groups living above the poverty line.
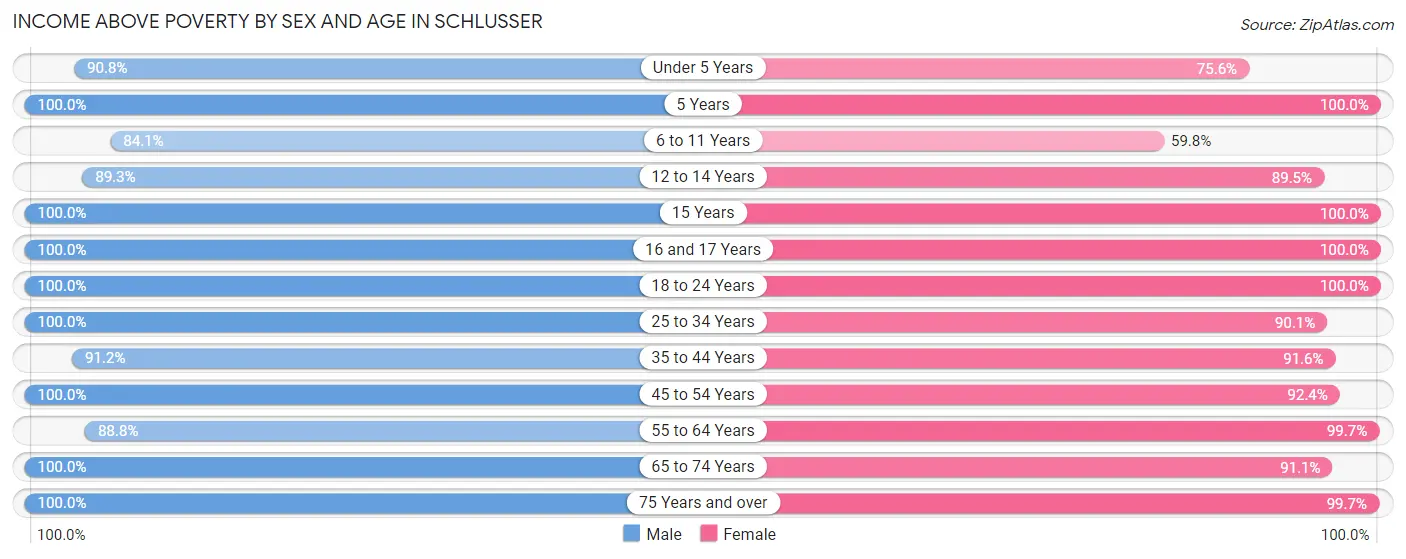
| Age Bracket | Male | Female |
| Under 5 Years | 148 (90.8%) | 68 (75.6%) |
| 5 Years | 64 (100.0%) | 39 (100.0%) |
| 6 to 11 Years | 169 (84.1%) | 67 (59.8%) |
| 12 to 14 Years | 75 (89.3%) | 85 (89.5%) |
| 15 Years | 7 (100.0%) | 18 (100.0%) |
| 16 and 17 Years | 61 (100.0%) | 87 (100.0%) |
| 18 to 24 Years | 217 (100.0%) | 147 (100.0%) |
| 25 to 34 Years | 342 (100.0%) | 336 (90.1%) |
| 35 to 44 Years | 465 (91.2%) | 447 (91.6%) |
| 45 to 54 Years | 448 (100.0%) | 304 (92.4%) |
| 55 to 64 Years | 198 (88.8%) | 336 (99.7%) |
| 65 to 74 Years | 308 (100.0%) | 417 (91.0%) |
| 75 Years and over | 229 (100.0%) | 294 (99.7%) |
| Total | 2,731 (95.6%) | 2,645 (92.2%) |
Income Below Poverty Among Married-Couple Families in Schlusser
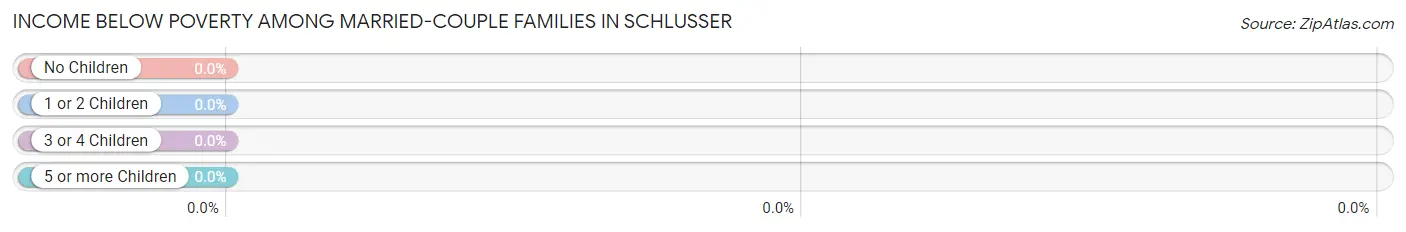
| Children | Above Poverty | Below Poverty |
| No Children | 841 (100.0%) | 0 (0.0%) |
| 1 or 2 Children | 352 (100.0%) | 0 (0.0%) |
| 3 or 4 Children | 103 (100.0%) | 0 (0.0%) |
| 5 or more Children | 0 (0.0%) | 0 (0.0%) |
| Total | 1,296 (100.0%) | 0 (0.0%) |
Income Below Poverty Among Single-Parent Households in Schlusser
According to the poverty data in Schlusser, 34.4% or 45 single-father households and 33.1% or 44 single-mother households are living below the poverty line. Among single-father households, those with 1 or 2 children have the highest poverty rate, with 33 households (100.0%) experiencing poverty. Likewise, among single-mother households, those with 1 or 2 children have the highest poverty rate, with 44 households (64.7%) falling below the poverty line.
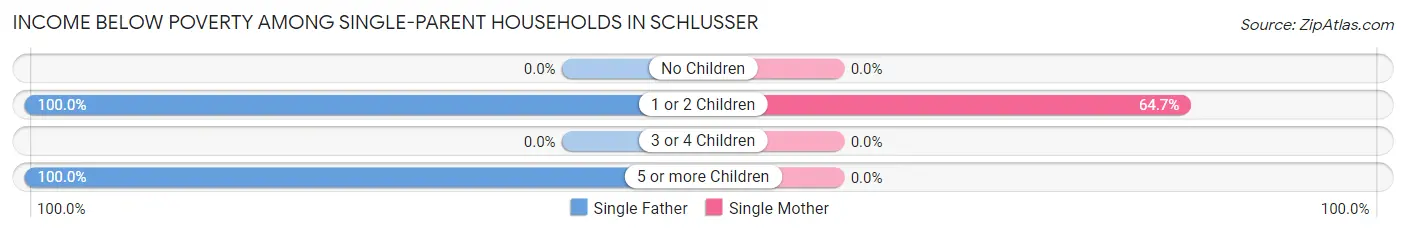
| Children | Single Father | Single Mother |
| No Children | 0 (0.0%) | 0 (0.0%) |
| 1 or 2 Children | 33 (100.0%) | 44 (64.7%) |
| 3 or 4 Children | 0 (0.0%) | 0 (0.0%) |
| 5 or more Children | 12 (100.0%) | 0 (0.0%) |
| Total | 45 (34.4%) | 44 (33.1%) |
Income Below Poverty Among Married-Couple vs Single-Parent Households in Schlusser
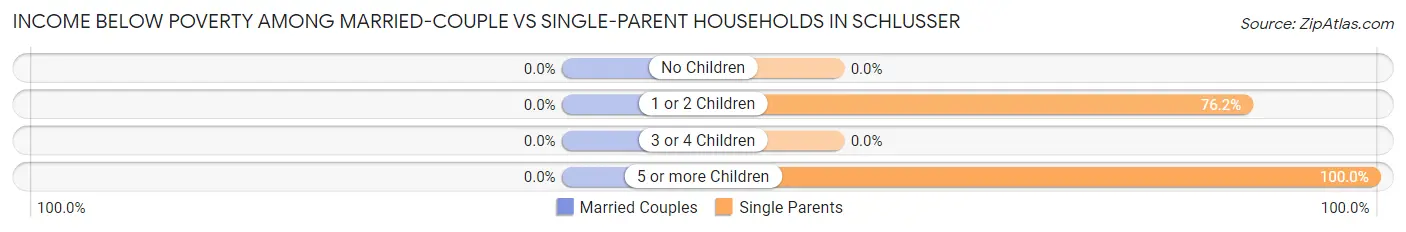
| Children | Married-Couple Families | Single-Parent Households |
| No Children | 0 (0.0%) | 0 (0.0%) |
| 1 or 2 Children | 0 (0.0%) | 77 (76.2%) |
| 3 or 4 Children | 0 (0.0%) | 0 (0.0%) |
| 5 or more Children | 0 (0.0%) | 12 (100.0%) |
| Total | 0 (0.0%) | 89 (33.7%) |
Employment Characteristics in Schlusser
Employment by Class of Employer in Schlusser
Among the 3,149 employed individuals in Schlusser, private company employees (1,899 | 60.3%), not-for-profit organizations (407 | 12.9%), and federal government employees (302 | 9.6%) make up the most common classes of employment.
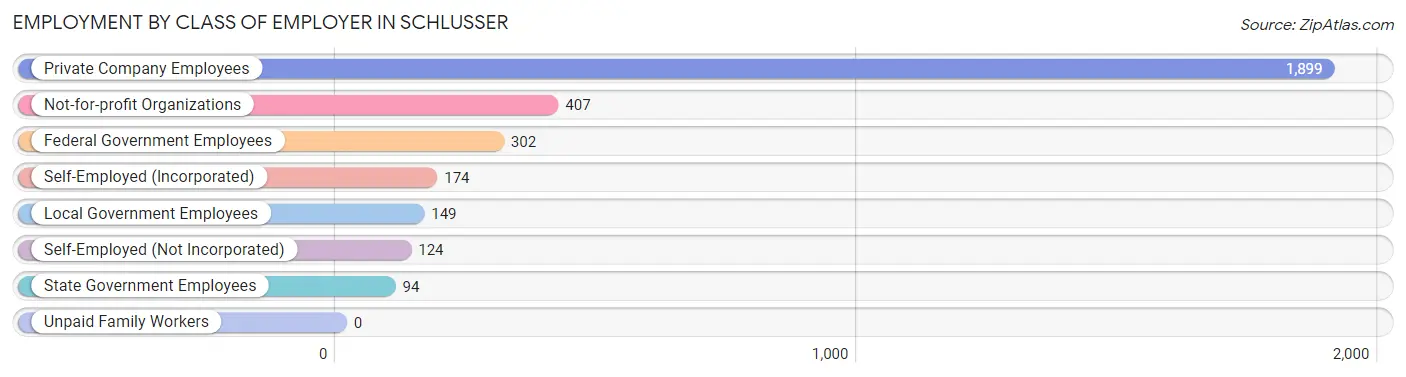
| Employer Class | # Employees | % Employees |
| Private Company Employees | 1,899 | 60.3% |
| Self-Employed (Incorporated) | 174 | 5.5% |
| Self-Employed (Not Incorporated) | 124 | 3.9% |
| Not-for-profit Organizations | 407 | 12.9% |
| Local Government Employees | 149 | 4.7% |
| State Government Employees | 94 | 3.0% |
| Federal Government Employees | 302 | 9.6% |
| Unpaid Family Workers | 0 | 0.0% |
| Total | 3,149 | 100.0% |
Employment Status by Age in Schlusser
According to the labor force statistics for Schlusser, out of the total population over 16 years of age (4,852), 69.0% or 3,348 individuals are in the labor force, with 4.4% or 147 of them unemployed. The age group with the highest labor force participation rate is 45 to 54 years, with 94.6% or 735 individuals in the labor force. Within the labor force, the 25 to 29 years age range has the highest percentage of unemployed individuals, with 18.1% or 76 of them being unemployed.
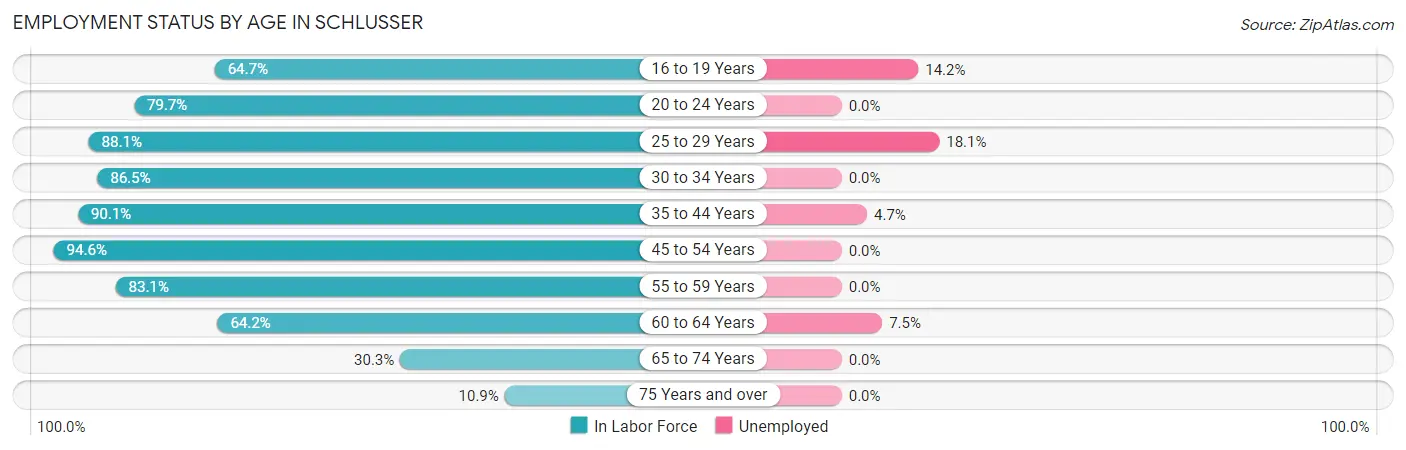
| Age Bracket | In Labor Force | Unemployed |
| 16 to 19 Years | 134 (64.7%) | 19 (14.2%) |
| 20 to 24 Years | 243 (79.7%) | 0 (0.0%) |
| 25 to 29 Years | 421 (88.1%) | 76 (18.1%) |
| 30 to 34 Years | 205 (86.5%) | 0 (0.0%) |
| 35 to 44 Years | 899 (90.1%) | 42 (4.7%) |
| 45 to 54 Years | 735 (94.6%) | 0 (0.0%) |
| 55 to 59 Years | 275 (83.1%) | 0 (0.0%) |
| 60 to 64 Years | 147 (64.2%) | 11 (7.5%) |
| 65 to 74 Years | 232 (30.3%) | 0 (0.0%) |
| 75 Years and over | 57 (10.9%) | 0 (0.0%) |
| Total | 3,348 (69.0%) | 147 (4.4%) |
Employment Status by Educational Attainment in Schlusser
According to labor force statistics for Schlusser, 87.9% of individuals (2,681) out of the total population between 25 and 64 years of age (3,050) are in the labor force, with 4.8% or 129 of them being unemployed. The group with the highest labor force participation rate are those with the educational attainment of college / associate degree, with 93.4% or 787 individuals in the labor force. Within the labor force, individuals with less than high school education have the highest percentage of unemployment, with 30.0% or 76 of them being unemployed.
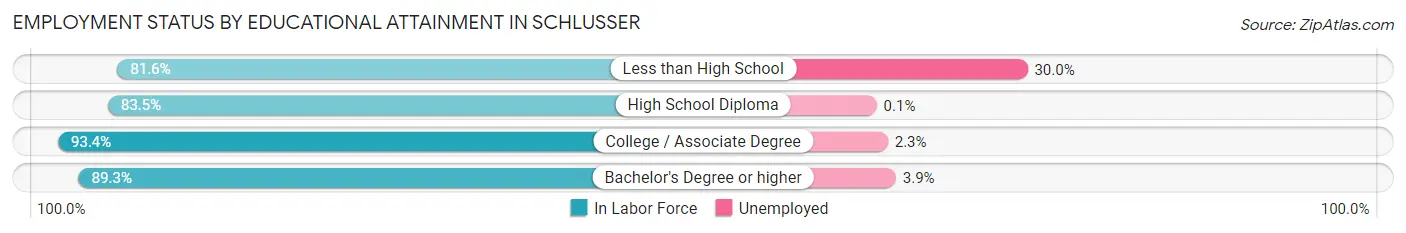
| Educational Attainment | In Labor Force | Unemployed |
| Less than High School | 253 (81.6%) | 93 (30.0%) |
| High School Diploma | 743 (83.5%) | 1 (0.1%) |
| College / Associate Degree | 787 (93.4%) | 19 (2.3%) |
| Bachelor's Degree or higher | 899 (89.3%) | 39 (3.9%) |
| Total | 2,681 (87.9%) | 146 (4.8%) |
Employment Occupations by Sex in Schlusser
Management, Business, Science and Arts Occupations
The most common Management, Business, Science and Arts occupations in Schlusser are Community & Social Service (401 | 12.6%), Management (322 | 10.1%), Education Instruction & Library (249 | 7.8%), Health Diagnosing & Treating (229 | 7.2%), and Business & Financial (184 | 5.8%).
Management, Business, Science and Arts Occupations by Sex
Within the Management, Business, Science and Arts occupations in Schlusser, the most male-oriented occupations are Computers, Engineering & Science (100.0%), Computers & Mathematics (100.0%), and Architecture & Engineering (100.0%), while the most female-oriented occupations are Health Diagnosing & Treating (96.5%), Health Technologists (92.7%), and Arts, Media & Entertainment (87.1%).
| Occupation | Male | Female |
| Management | 310 (96.3%) | 12 (3.7%) |
| Business & Financial | 81 (44.0%) | 103 (56.0%) |
| Computers, Engineering & Science | 105 (100.0%) | 0 (0.0%) |
| Computers & Mathematics | 74 (100.0%) | 0 (0.0%) |
| Architecture & Engineering | 31 (100.0%) | 0 (0.0%) |
| Life, Physical & Social Science | 0 (0.0%) | 0 (0.0%) |
| Community & Social Service | 101 (25.2%) | 300 (74.8%) |
| Education, Arts & Media | 16 (31.4%) | 35 (68.6%) |
| Legal Services & Support | 0 (0.0%) | 0 (0.0%) |
| Education Instruction & Library | 72 (28.9%) | 177 (71.1%) |
| Arts, Media & Entertainment | 13 (12.9%) | 88 (87.1%) |
| Health Diagnosing & Treating | 8 (3.5%) | 221 (96.5%) |
| Health Technologists | 8 (7.3%) | 102 (92.7%) |
| Total (Category) | 605 (48.7%) | 636 (51.2%) |
| Total (Overall) | 1,615 (50.8%) | 1,564 (49.2%) |
Services Occupations
The most common Services occupations in Schlusser are Cleaning & Maintenance (126 | 4.0%), Healthcare Support (120 | 3.8%), Personal Care & Service (105 | 3.3%), Security & Protection (85 | 2.7%), and Law Enforcement (56 | 1.8%).
Services Occupations by Sex
Within the Services occupations in Schlusser, the most male-oriented occupations are Security & Protection (100.0%), Firefighting & Prevention (100.0%), and Law Enforcement (100.0%), while the most female-oriented occupations are Healthcare Support (100.0%), Personal Care & Service (90.5%), and Cleaning & Maintenance (58.7%).
| Occupation | Male | Female |
| Healthcare Support | 0 (0.0%) | 120 (100.0%) |
| Security & Protection | 85 (100.0%) | 0 (0.0%) |
| Firefighting & Prevention | 29 (100.0%) | 0 (0.0%) |
| Law Enforcement | 56 (100.0%) | 0 (0.0%) |
| Food Preparation & Serving | 24 (47.1%) | 27 (52.9%) |
| Cleaning & Maintenance | 52 (41.3%) | 74 (58.7%) |
| Personal Care & Service | 10 (9.5%) | 95 (90.5%) |
| Total (Category) | 171 (35.1%) | 316 (64.9%) |
| Total (Overall) | 1,615 (50.8%) | 1,564 (49.2%) |
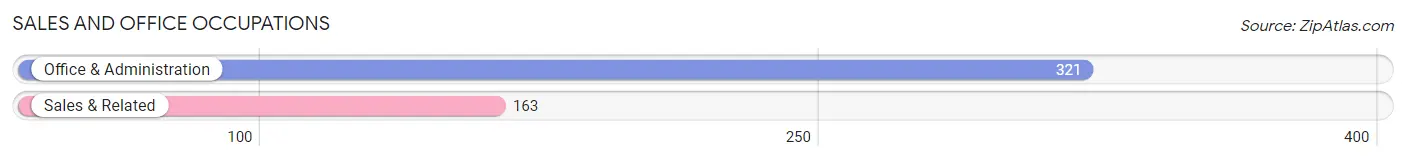
Sales and Office Occupations
The most common Sales and Office occupations in Schlusser are Office & Administration (321 | 10.1%), and Sales & Related (163 | 5.1%).
Sales and Office Occupations by Sex
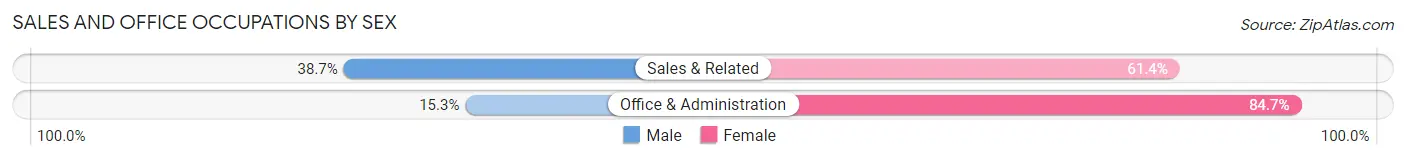
| Occupation | Male | Female |
| Sales & Related | 63 (38.7%) | 100 (61.4%) |
| Office & Administration | 49 (15.3%) | 272 (84.7%) |
| Total (Category) | 112 (23.1%) | 372 (76.9%) |
| Total (Overall) | 1,615 (50.8%) | 1,564 (49.2%) |
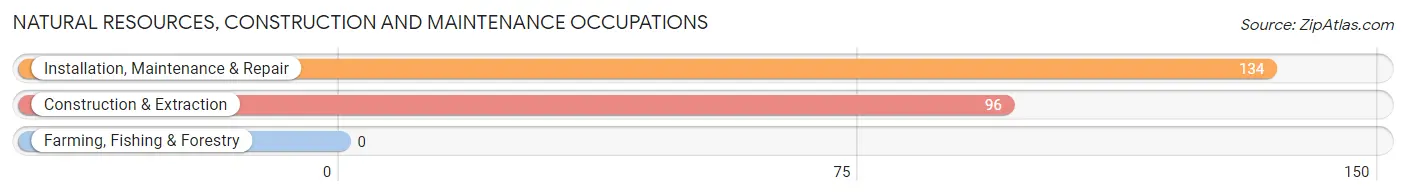
Natural Resources, Construction and Maintenance Occupations
The most common Natural Resources, Construction and Maintenance occupations in Schlusser are Installation, Maintenance & Repair (134 | 4.2%), and Construction & Extraction (96 | 3.0%).
Natural Resources, Construction and Maintenance Occupations by Sex
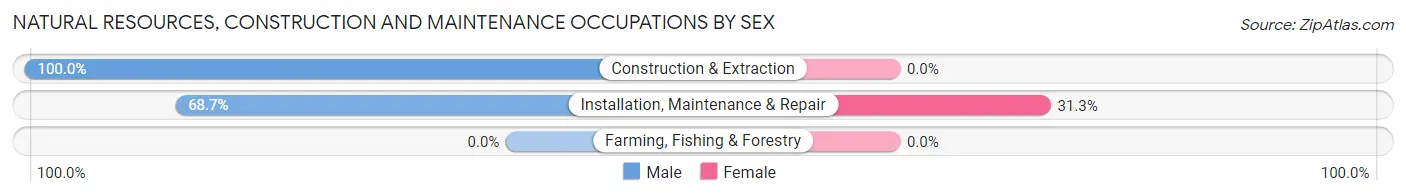
| Occupation | Male | Female |
| Farming, Fishing & Forestry | 0 (0.0%) | 0 (0.0%) |
| Construction & Extraction | 96 (100.0%) | 0 (0.0%) |
| Installation, Maintenance & Repair | 92 (68.7%) | 42 (31.3%) |
| Total (Category) | 188 (81.7%) | 42 (18.3%) |
| Total (Overall) | 1,615 (50.8%) | 1,564 (49.2%) |
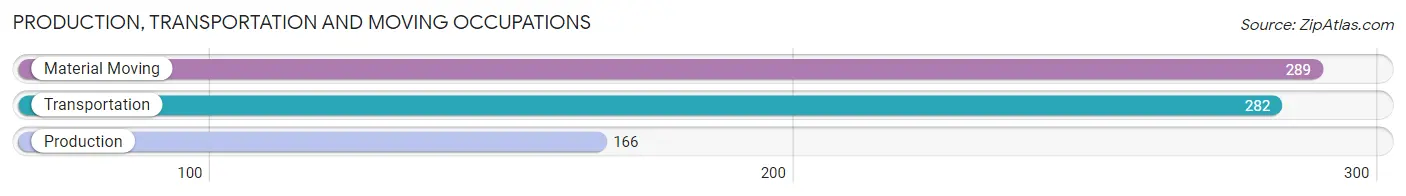
Production, Transportation and Moving Occupations
The most common Production, Transportation and Moving occupations in Schlusser are Material Moving (289 | 9.1%), Transportation (282 | 8.9%), and Production (166 | 5.2%).
Production, Transportation and Moving Occupations by Sex
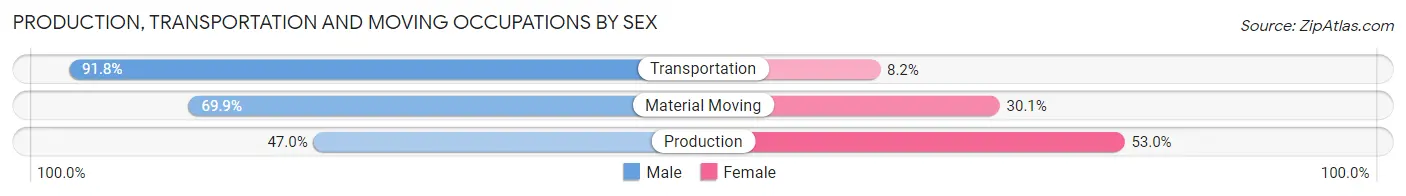
| Occupation | Male | Female |
| Production | 78 (47.0%) | 88 (53.0%) |
| Transportation | 259 (91.8%) | 23 (8.2%) |
| Material Moving | 202 (69.9%) | 87 (30.1%) |
| Total (Category) | 539 (73.1%) | 198 (26.9%) |
| Total (Overall) | 1,615 (50.8%) | 1,564 (49.2%) |
Employment Industries by Sex in Schlusser
Employment Industries in Schlusser
The major employment industries in Schlusser include Health Care & Social Assistance (603 | 19.0%), Transportation & Warehousing (415 | 13.1%), Educational Services (373 | 11.7%), Retail Trade (314 | 9.9%), and Manufacturing (280 | 8.8%).
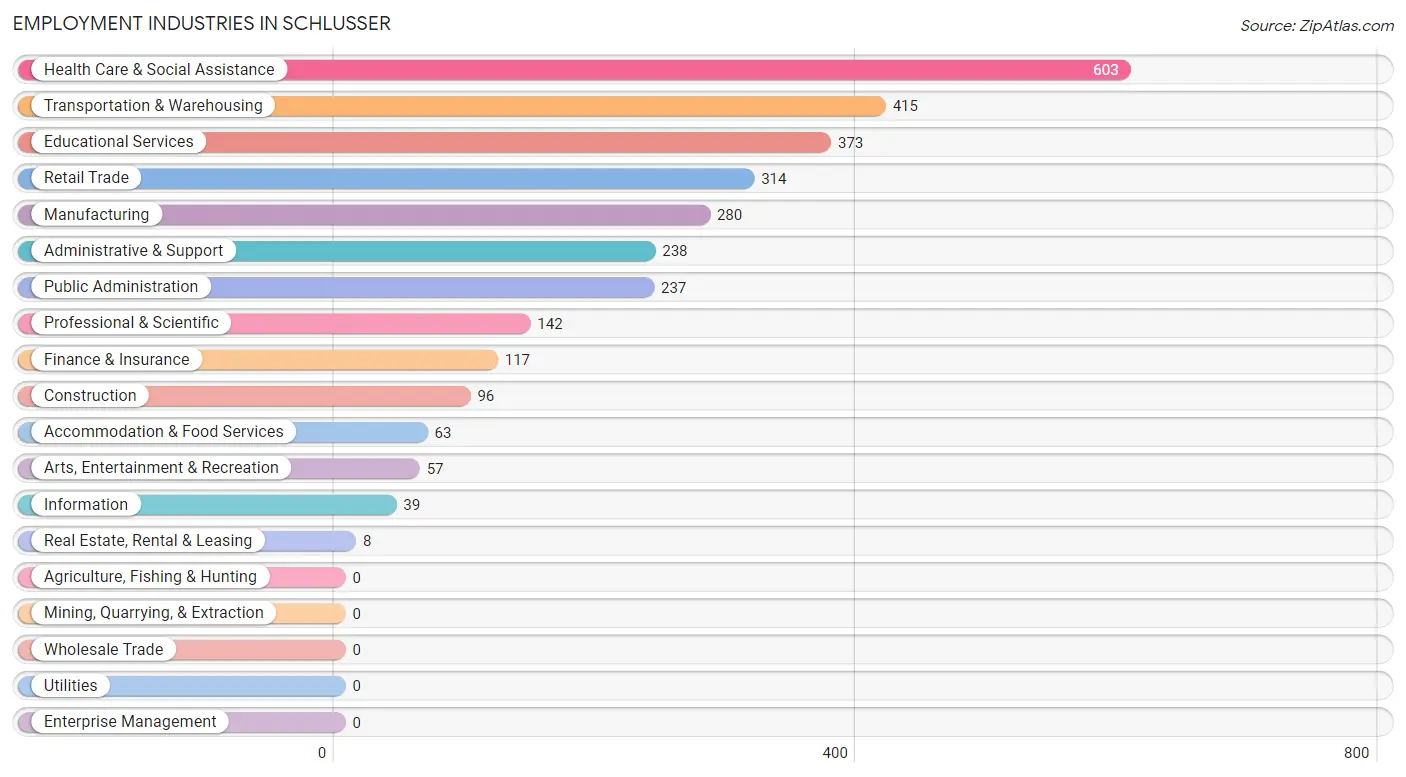
Employment Industries by Sex in Schlusser
The Schlusser industries that see more men than women are Construction (100.0%), Public Administration (87.3%), and Transportation & Warehousing (84.1%), whereas the industries that tend to have a higher number of women are Information (100.0%), Real Estate, Rental & Leasing (100.0%), and Arts, Entertainment & Recreation (82.5%).
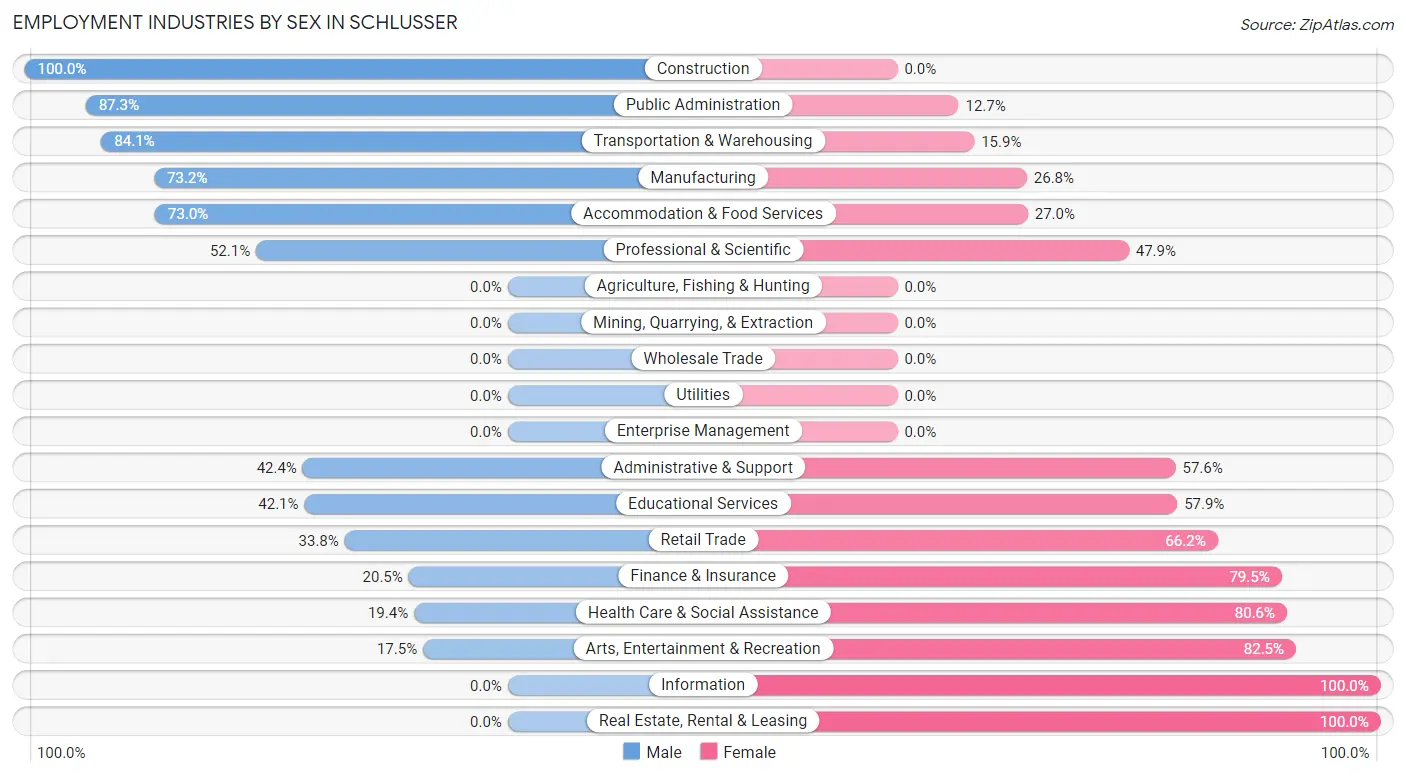
| Industry | Male | Female |
| Agriculture, Fishing & Hunting | 0 (0.0%) | 0 (0.0%) |
| Mining, Quarrying, & Extraction | 0 (0.0%) | 0 (0.0%) |
| Construction | 96 (100.0%) | 0 (0.0%) |
| Manufacturing | 205 (73.2%) | 75 (26.8%) |
| Wholesale Trade | 0 (0.0%) | 0 (0.0%) |
| Retail Trade | 106 (33.8%) | 208 (66.2%) |
| Transportation & Warehousing | 349 (84.1%) | 66 (15.9%) |
| Utilities | 0 (0.0%) | 0 (0.0%) |
| Information | 0 (0.0%) | 39 (100.0%) |
| Finance & Insurance | 24 (20.5%) | 93 (79.5%) |
| Real Estate, Rental & Leasing | 0 (0.0%) | 8 (100.0%) |
| Professional & Scientific | 74 (52.1%) | 68 (47.9%) |
| Enterprise Management | 0 (0.0%) | 0 (0.0%) |
| Administrative & Support | 101 (42.4%) | 137 (57.6%) |
| Educational Services | 157 (42.1%) | 216 (57.9%) |
| Health Care & Social Assistance | 117 (19.4%) | 486 (80.6%) |
| Arts, Entertainment & Recreation | 10 (17.5%) | 47 (82.5%) |
| Accommodation & Food Services | 46 (73.0%) | 17 (27.0%) |
| Public Administration | 207 (87.3%) | 30 (12.7%) |
| Total | 1,615 (50.8%) | 1,564 (49.2%) |
Education in Schlusser
School Enrollment in Schlusser
The most common levels of schooling among the 1,225 students in Schlusser are college / undergraduate (389 | 31.8%), middle school (216 | 17.6%), and high school (200 | 16.3%).
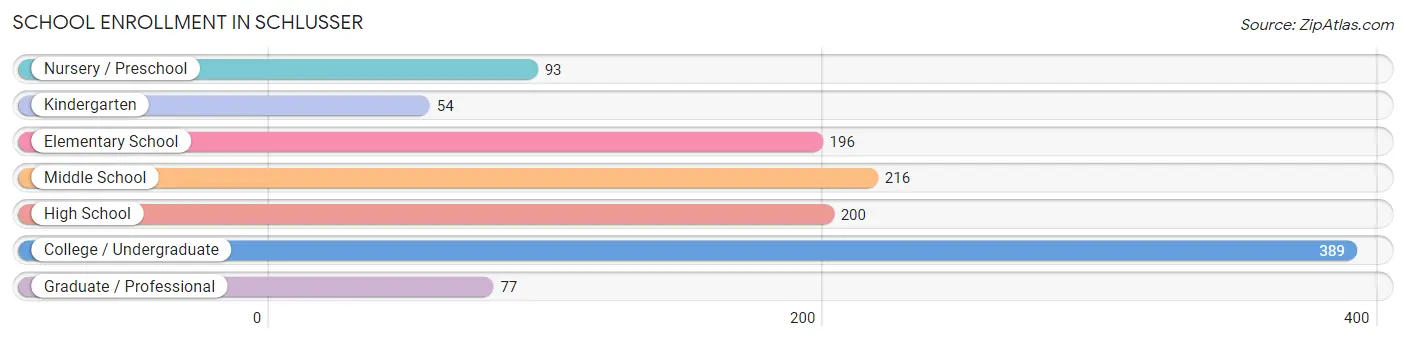
| School Level | # Students | % Students |
| Nursery / Preschool | 93 | 7.6% |
| Kindergarten | 54 | 4.4% |
| Elementary School | 196 | 16.0% |
| Middle School | 216 | 17.6% |
| High School | 200 | 16.3% |
| College / Undergraduate | 389 | 31.8% |
| Graduate / Professional | 77 | 6.3% |
| Total | 1,225 | 100.0% |
School Enrollment by Age by Funding Source in Schlusser
Out of a total of 1,225 students who are enrolled in schools in Schlusser, 309 (25.2%) attend a private institution, while the remaining 916 (74.8%) are enrolled in public schools. The age group of 3 to 4 year olds has the highest likelihood of being enrolled in private schools, with 21 (100.0% in the age bracket) enrolled. Conversely, the age group of 18 to 19 year olds has the lowest likelihood of being enrolled in a private school, with 59 (100.0% in the age bracket) attending a public institution.
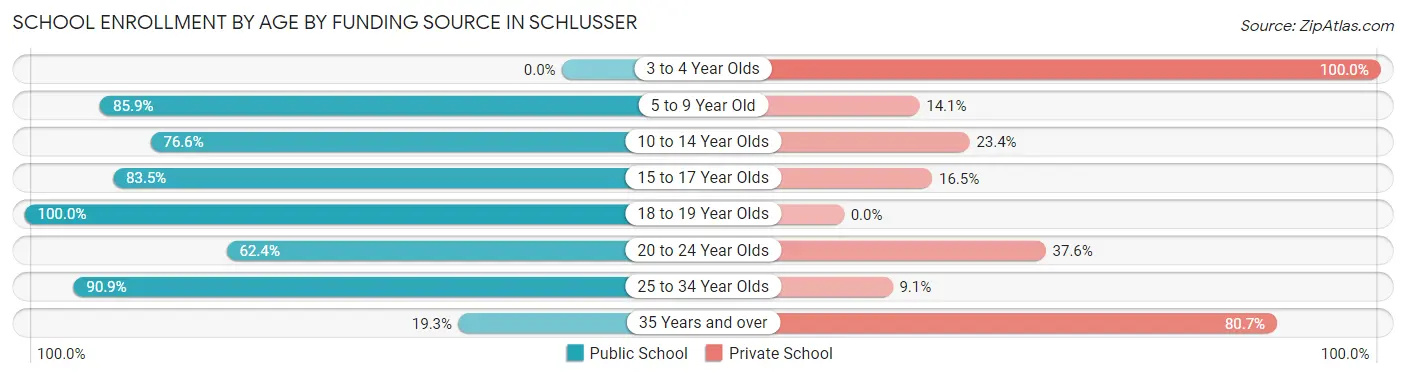
| Age Bracket | Public School | Private School |
| 3 to 4 Year Olds | 0 (0.0%) | 21 (100.0%) |
| 5 to 9 Year Old | 238 (85.9%) | 39 (14.1%) |
| 10 to 14 Year Olds | 232 (76.6%) | 71 (23.4%) |
| 15 to 17 Year Olds | 132 (83.5%) | 26 (16.5%) |
| 18 to 19 Year Olds | 59 (100.0%) | 0 (0.0%) |
| 20 to 24 Year Olds | 73 (62.4%) | 44 (37.6%) |
| 25 to 34 Year Olds | 160 (90.9%) | 16 (9.1%) |
| 35 Years and over | 22 (19.3%) | 92 (80.7%) |
| Total | 916 (74.8%) | 309 (25.2%) |
Educational Attainment by Field of Study in Schlusser
Education (428 | 25.7%), business (239 | 14.3%), literature & languages (205 | 12.3%), science & technology (157 | 9.4%), and arts & humanities (140 | 8.4%) are the most common fields of study among 1,668 individuals in Schlusser who have obtained a bachelor's degree or higher.
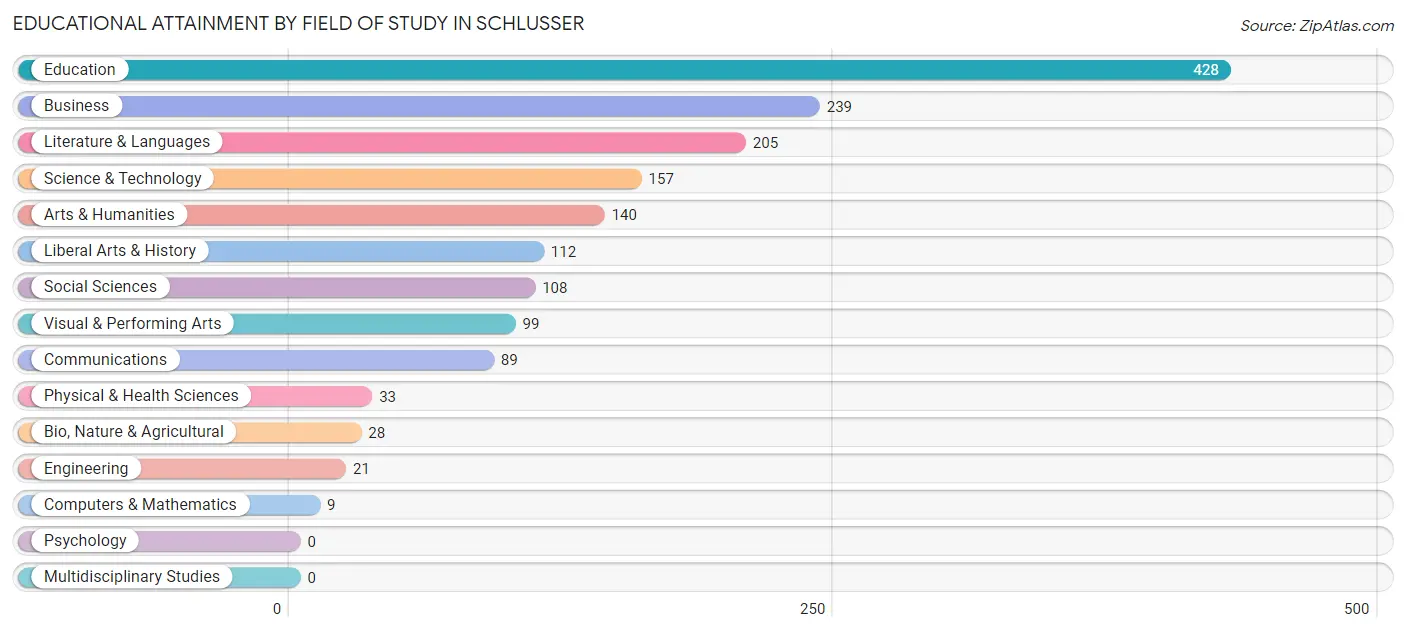
| Field of Study | # Graduates | % Graduates |
| Computers & Mathematics | 9 | 0.5% |
| Bio, Nature & Agricultural | 28 | 1.7% |
| Physical & Health Sciences | 33 | 2.0% |
| Psychology | 0 | 0.0% |
| Social Sciences | 108 | 6.5% |
| Engineering | 21 | 1.3% |
| Multidisciplinary Studies | 0 | 0.0% |
| Science & Technology | 157 | 9.4% |
| Business | 239 | 14.3% |
| Education | 428 | 25.7% |
| Literature & Languages | 205 | 12.3% |
| Liberal Arts & History | 112 | 6.7% |
| Visual & Performing Arts | 99 | 5.9% |
| Communications | 89 | 5.3% |
| Arts & Humanities | 140 | 8.4% |
| Total | 1,668 | 100.0% |
Transportation & Commute in Schlusser
Vehicle Availability by Sex in Schlusser
The most prevalent vehicle ownership categories in Schlusser are males with 2 vehicles (827, accounting for 50.6%) and females with 2 vehicles (618, making up 54.7%).
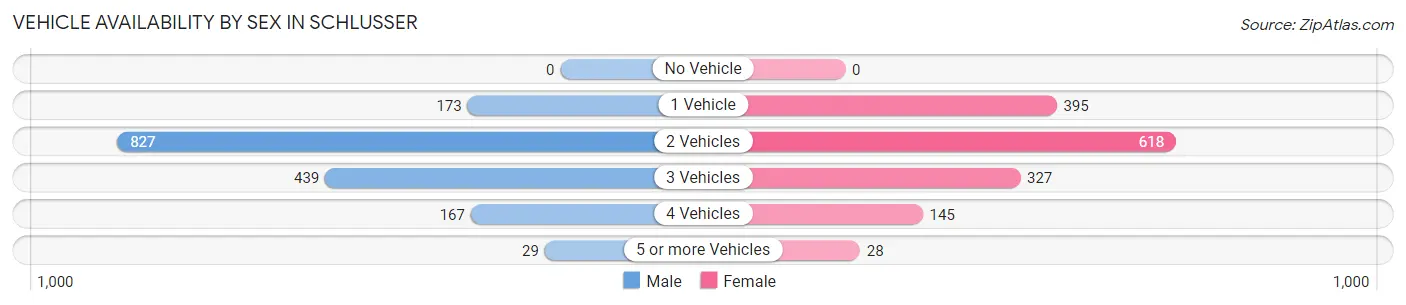
| Vehicles Available | Male | Female |
| No Vehicle | 0 (0.0%) | 0 (0.0%) |
| 1 Vehicle | 173 (10.6%) | 395 (26.1%) |
| 2 Vehicles | 827 (50.6%) | 618 (40.8%) |
| 3 Vehicles | 439 (26.9%) | 327 (21.6%) |
| 4 Vehicles | 167 (10.2%) | 145 (9.6%) |
| 5 or more Vehicles | 29 (1.8%) | 28 (1.8%) |
| Total | 1,635 (100.0%) | 1,513 (100.0%) |
Commute Time in Schlusser
The most frequently occuring commute durations in Schlusser are 15 to 19 minutes (685 commuters, 23.5%), 20 to 24 minutes (440 commuters, 15.1%), and 10 to 14 minutes (402 commuters, 13.8%).
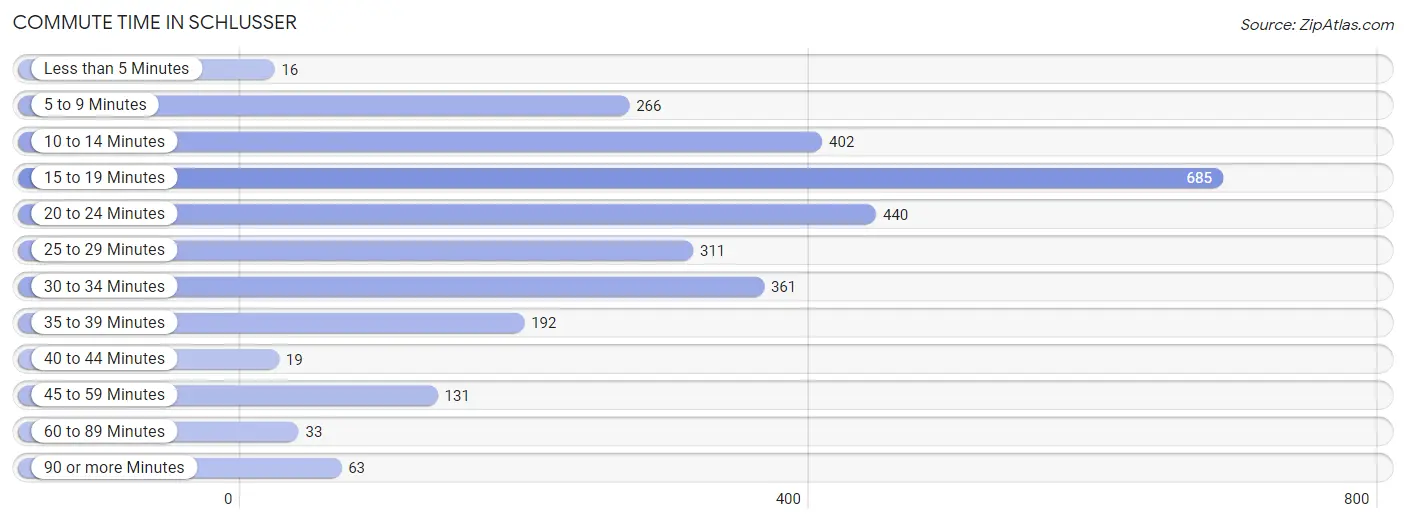
| Commute Time | # Commuters | % Commuters |
| Less than 5 Minutes | 16 | 0.5% |
| 5 to 9 Minutes | 266 | 9.1% |
| 10 to 14 Minutes | 402 | 13.8% |
| 15 to 19 Minutes | 685 | 23.5% |
| 20 to 24 Minutes | 440 | 15.1% |
| 25 to 29 Minutes | 311 | 10.6% |
| 30 to 34 Minutes | 361 | 12.4% |
| 35 to 39 Minutes | 192 | 6.6% |
| 40 to 44 Minutes | 19 | 0.6% |
| 45 to 59 Minutes | 131 | 4.5% |
| 60 to 89 Minutes | 33 | 1.1% |
| 90 or more Minutes | 63 | 2.2% |
Commute Time by Sex in Schlusser
The most common commute times in Schlusser are 15 to 19 minutes (322 commuters, 21.6%) for males and 15 to 19 minutes (363 commuters, 25.4%) for females.
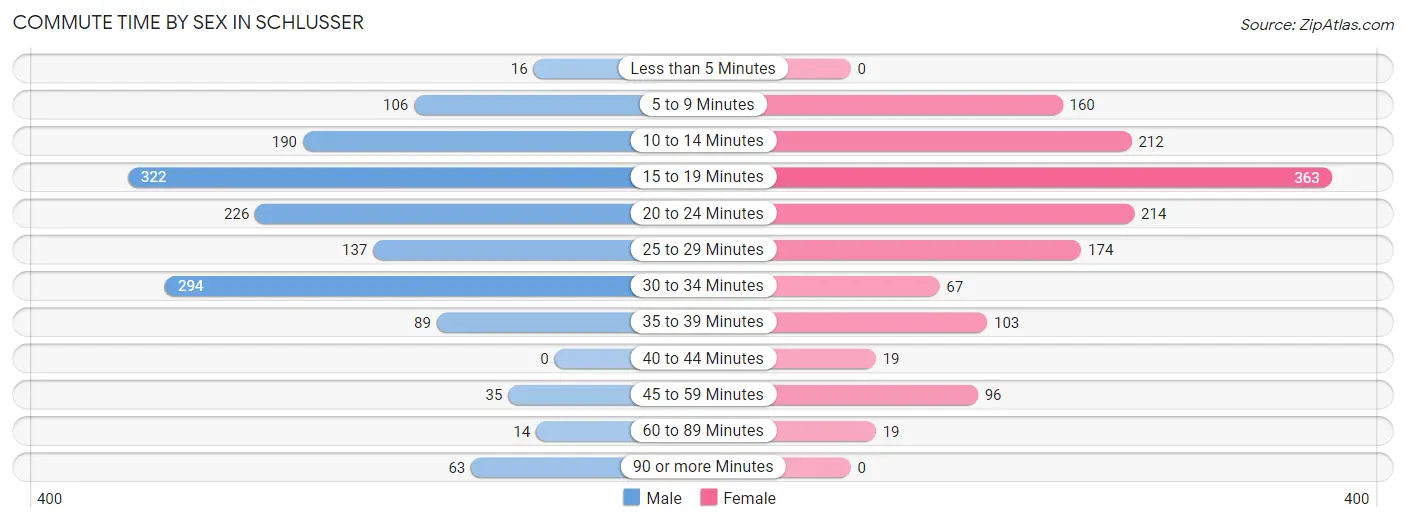
| Commute Time | Male | Female |
| Less than 5 Minutes | 16 (1.1%) | 0 (0.0%) |
| 5 to 9 Minutes | 106 (7.1%) | 160 (11.2%) |
| 10 to 14 Minutes | 190 (12.7%) | 212 (14.9%) |
| 15 to 19 Minutes | 322 (21.6%) | 363 (25.4%) |
| 20 to 24 Minutes | 226 (15.1%) | 214 (15.0%) |
| 25 to 29 Minutes | 137 (9.2%) | 174 (12.2%) |
| 30 to 34 Minutes | 294 (19.7%) | 67 (4.7%) |
| 35 to 39 Minutes | 89 (6.0%) | 103 (7.2%) |
| 40 to 44 Minutes | 0 (0.0%) | 19 (1.3%) |
| 45 to 59 Minutes | 35 (2.4%) | 96 (6.7%) |
| 60 to 89 Minutes | 14 (0.9%) | 19 (1.3%) |
| 90 or more Minutes | 63 (4.2%) | 0 (0.0%) |
Time of Departure to Work by Sex in Schlusser
The most frequent times of departure to work in Schlusser are 6:30 AM to 6:59 AM (223, 14.9%) for males and 6:30 AM to 6:59 AM (253, 17.7%) for females.
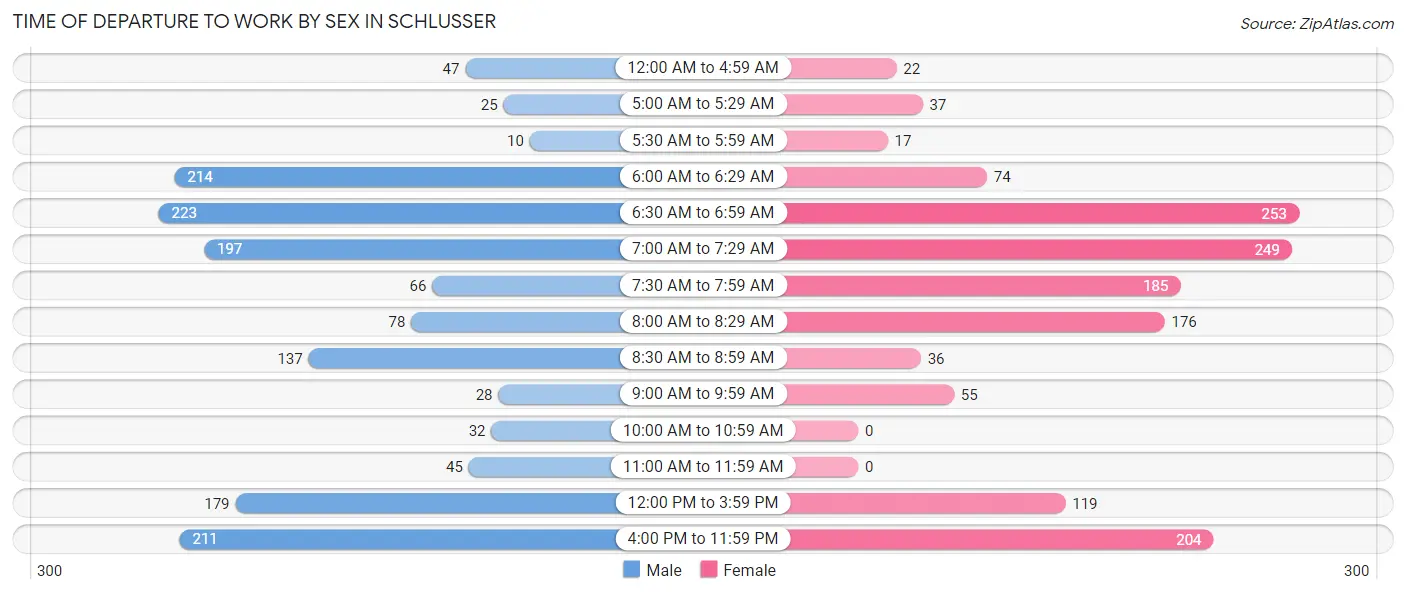
| Time of Departure | Male | Female |
| 12:00 AM to 4:59 AM | 47 (3.2%) | 22 (1.5%) |
| 5:00 AM to 5:29 AM | 25 (1.7%) | 37 (2.6%) |
| 5:30 AM to 5:59 AM | 10 (0.7%) | 17 (1.2%) |
| 6:00 AM to 6:29 AM | 214 (14.3%) | 74 (5.2%) |
| 6:30 AM to 6:59 AM | 223 (14.9%) | 253 (17.7%) |
| 7:00 AM to 7:29 AM | 197 (13.2%) | 249 (17.4%) |
| 7:30 AM to 7:59 AM | 66 (4.4%) | 185 (13.0%) |
| 8:00 AM to 8:29 AM | 78 (5.2%) | 176 (12.3%) |
| 8:30 AM to 8:59 AM | 137 (9.2%) | 36 (2.5%) |
| 9:00 AM to 9:59 AM | 28 (1.9%) | 55 (3.8%) |
| 10:00 AM to 10:59 AM | 32 (2.1%) | 0 (0.0%) |
| 11:00 AM to 11:59 AM | 45 (3.0%) | 0 (0.0%) |
| 12:00 PM to 3:59 PM | 179 (12.0%) | 119 (8.3%) |
| 4:00 PM to 11:59 PM | 211 (14.1%) | 204 (14.3%) |
| Total | 1,492 (100.0%) | 1,427 (100.0%) |
Housing Occupancy in Schlusser
Occupancy by Ownership in Schlusser
Of the total 2,427 dwellings in Schlusser, owner-occupied units account for 1,903 (78.4%), while renter-occupied units make up 524 (21.6%).
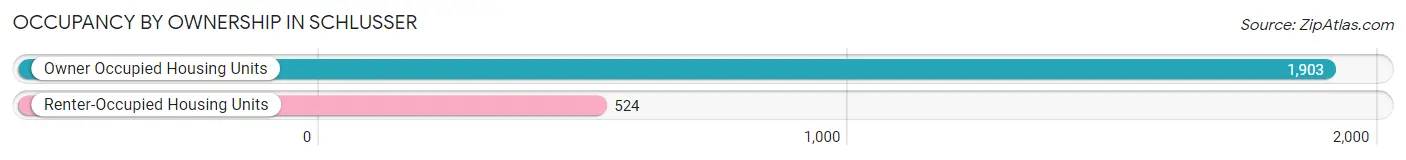
| Occupancy | # Housing Units | % Housing Units |
| Owner Occupied Housing Units | 1,903 | 78.4% |
| Renter-Occupied Housing Units | 524 | 21.6% |
| Total Occupied Housing Units | 2,427 | 100.0% |
Occupancy by Household Size in Schlusser
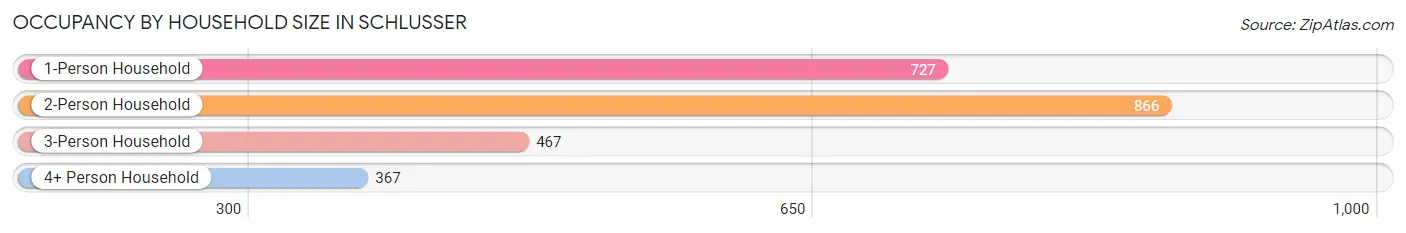
| Household Size | # Housing Units | % Housing Units |
| 1-Person Household | 727 | 29.9% |
| 2-Person Household | 866 | 35.7% |
| 3-Person Household | 467 | 19.2% |
| 4+ Person Household | 367 | 15.1% |
| Total Housing Units | 2,427 | 100.0% |
Occupancy by Ownership by Household Size in Schlusser
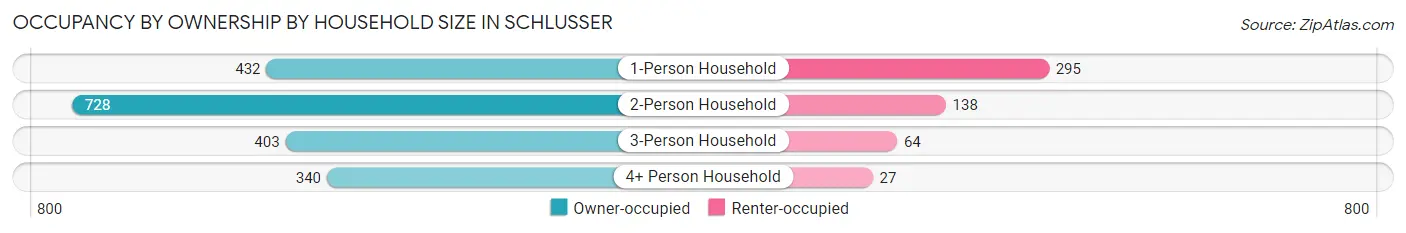
| Household Size | Owner-occupied | Renter-occupied |
| 1-Person Household | 432 (59.4%) | 295 (40.6%) |
| 2-Person Household | 728 (84.1%) | 138 (15.9%) |
| 3-Person Household | 403 (86.3%) | 64 (13.7%) |
| 4+ Person Household | 340 (92.6%) | 27 (7.4%) |
| Total Housing Units | 1,903 (78.4%) | 524 (21.6%) |
Occupancy by Educational Attainment in Schlusser
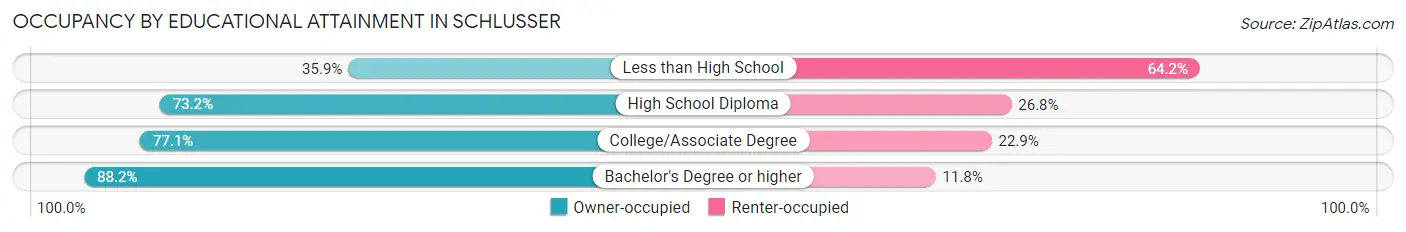
| Household Size | Owner-occupied | Renter-occupied |
| Less than High School | 38 (35.8%) | 68 (64.1%) |
| High School Diploma | 497 (73.2%) | 182 (26.8%) |
| College/Associate Degree | 560 (77.1%) | 166 (22.9%) |
| Bachelor's Degree or higher | 808 (88.2%) | 108 (11.8%) |
Occupancy by Age of Householder in Schlusser
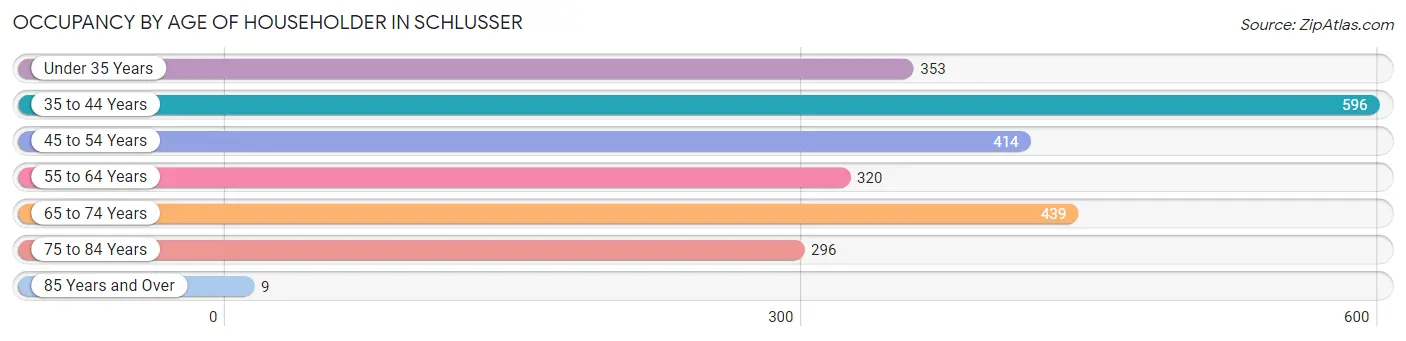
| Age Bracket | # Households | % Households |
| Under 35 Years | 353 | 14.5% |
| 35 to 44 Years | 596 | 24.6% |
| 45 to 54 Years | 414 | 17.1% |
| 55 to 64 Years | 320 | 13.2% |
| 65 to 74 Years | 439 | 18.1% |
| 75 to 84 Years | 296 | 12.2% |
| 85 Years and Over | 9 | 0.4% |
| Total | 2,427 | 100.0% |
Housing Finances in Schlusser
Median Income by Occupancy in Schlusser
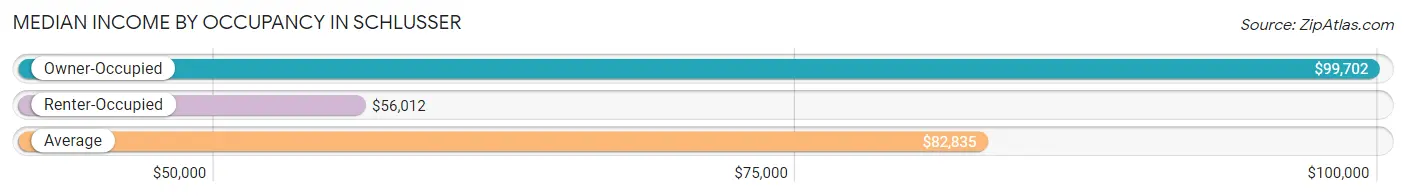
| Occupancy Type | # Households | Median Income |
| Owner-Occupied | 1,903 (78.4%) | $99,702 |
| Renter-Occupied | 524 (21.6%) | $56,012 |
| Average | 2,427 (100.0%) | $82,835 |
Occupancy by Householder Income Bracket in Schlusser
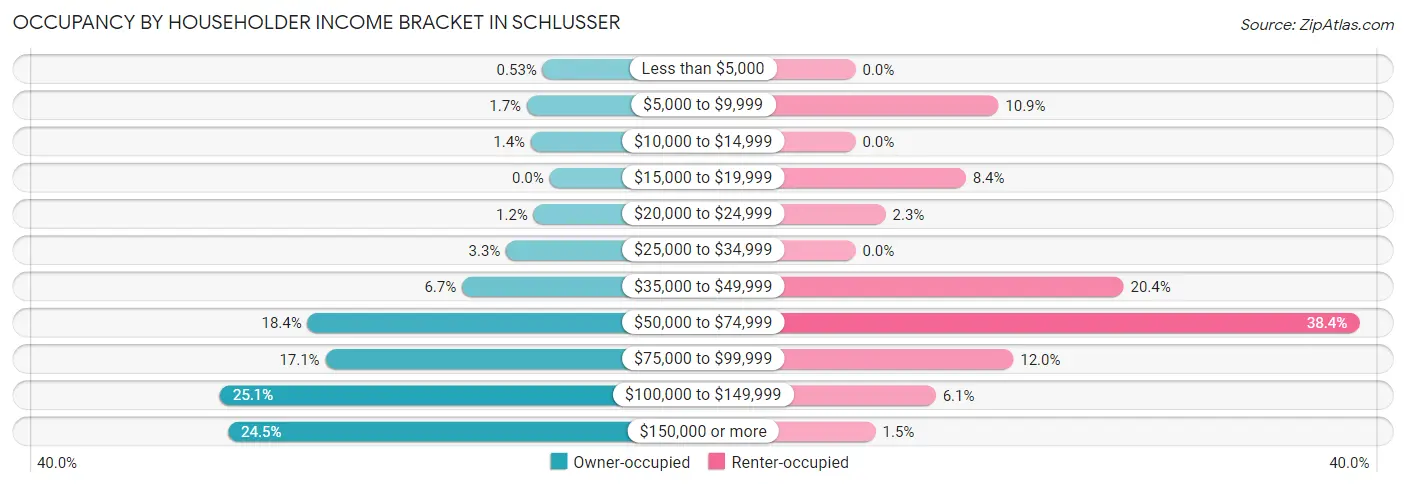
| Income Bracket | Owner-occupied | Renter-occupied |
| Less than $5,000 | 10 (0.5%) | 0 (0.0%) |
| $5,000 to $9,999 | 33 (1.7%) | 57 (10.9%) |
| $10,000 to $14,999 | 27 (1.4%) | 0 (0.0%) |
| $15,000 to $19,999 | 0 (0.0%) | 44 (8.4%) |
| $20,000 to $24,999 | 23 (1.2%) | 12 (2.3%) |
| $25,000 to $34,999 | 63 (3.3%) | 0 (0.0%) |
| $35,000 to $49,999 | 127 (6.7%) | 107 (20.4%) |
| $50,000 to $74,999 | 351 (18.4%) | 201 (38.4%) |
| $75,000 to $99,999 | 325 (17.1%) | 63 (12.0%) |
| $100,000 to $149,999 | 478 (25.1%) | 32 (6.1%) |
| $150,000 or more | 466 (24.5%) | 8 (1.5%) |
| Total | 1,903 (100.0%) | 524 (100.0%) |
Monthly Housing Cost Tiers in Schlusser
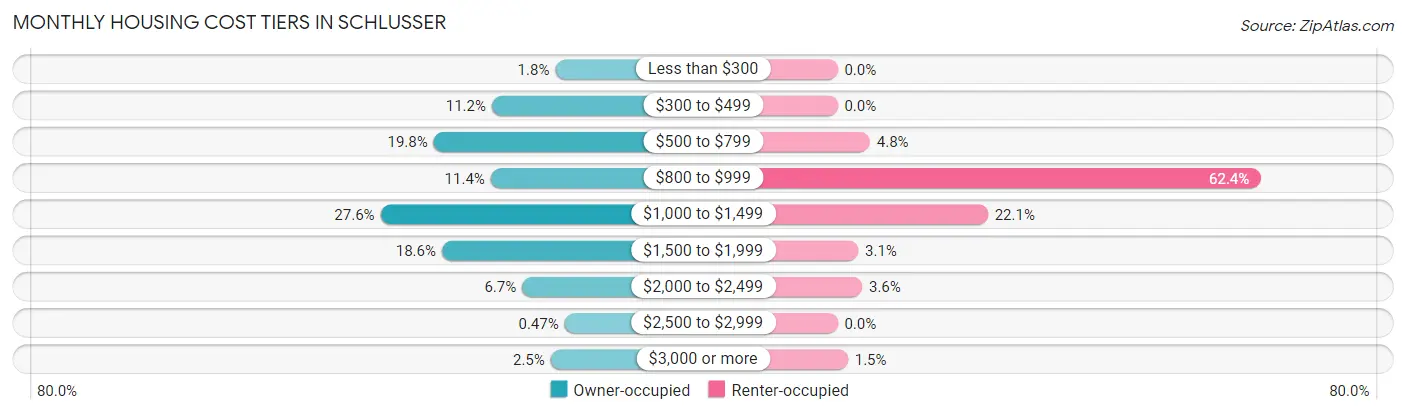
| Monthly Cost | Owner-occupied | Renter-occupied |
| Less than $300 | 35 (1.8%) | 0 (0.0%) |
| $300 to $499 | 213 (11.2%) | 0 (0.0%) |
| $500 to $799 | 376 (19.8%) | 25 (4.8%) |
| $800 to $999 | 216 (11.4%) | 327 (62.4%) |
| $1,000 to $1,499 | 525 (27.6%) | 116 (22.1%) |
| $1,500 to $1,999 | 353 (18.5%) | 16 (3.0%) |
| $2,000 to $2,499 | 128 (6.7%) | 19 (3.6%) |
| $2,500 to $2,999 | 9 (0.5%) | 0 (0.0%) |
| $3,000 or more | 48 (2.5%) | 8 (1.5%) |
| Total | 1,903 (100.0%) | 524 (100.0%) |
Physical Housing Characteristics in Schlusser
Housing Structures in Schlusser
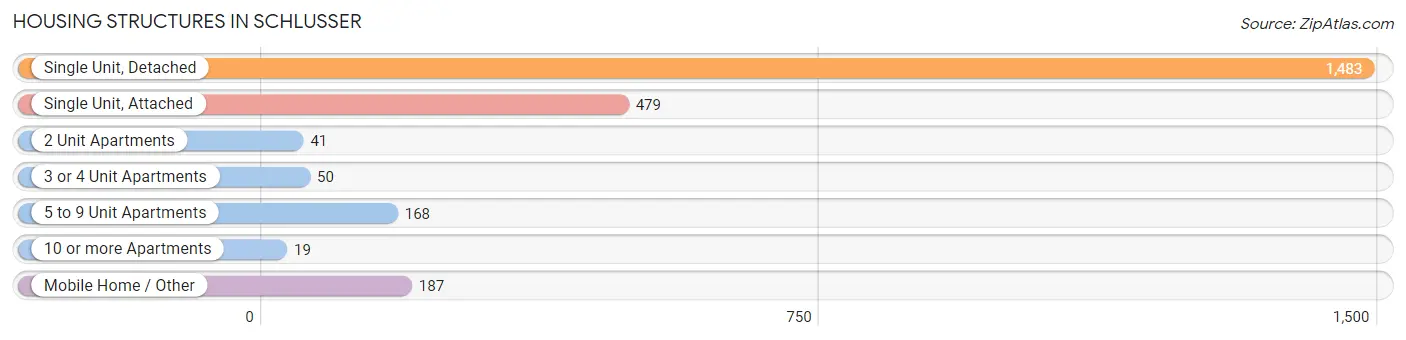
| Structure Type | # Housing Units | % Housing Units |
| Single Unit, Detached | 1,483 | 61.1% |
| Single Unit, Attached | 479 | 19.7% |
| 2 Unit Apartments | 41 | 1.7% |
| 3 or 4 Unit Apartments | 50 | 2.1% |
| 5 to 9 Unit Apartments | 168 | 6.9% |
| 10 or more Apartments | 19 | 0.8% |
| Mobile Home / Other | 187 | 7.7% |
| Total | 2,427 | 100.0% |
Housing Structures by Occupancy in Schlusser
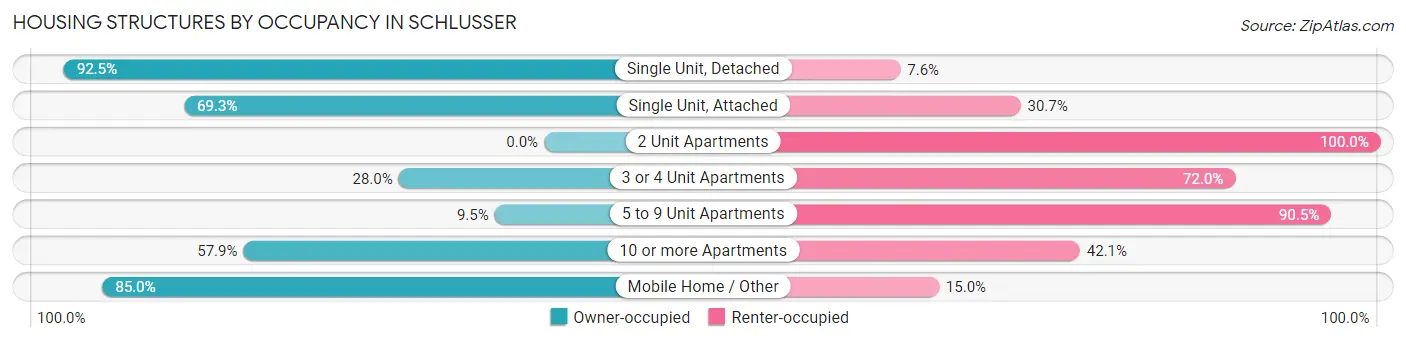
| Structure Type | Owner-occupied | Renter-occupied |
| Single Unit, Detached | 1,371 (92.4%) | 112 (7.5%) |
| Single Unit, Attached | 332 (69.3%) | 147 (30.7%) |
| 2 Unit Apartments | 0 (0.0%) | 41 (100.0%) |
| 3 or 4 Unit Apartments | 14 (28.0%) | 36 (72.0%) |
| 5 to 9 Unit Apartments | 16 (9.5%) | 152 (90.5%) |
| 10 or more Apartments | 11 (57.9%) | 8 (42.1%) |
| Mobile Home / Other | 159 (85.0%) | 28 (15.0%) |
| Total | 1,903 (78.4%) | 524 (21.6%) |
Housing Structures by Number of Rooms in Schlusser
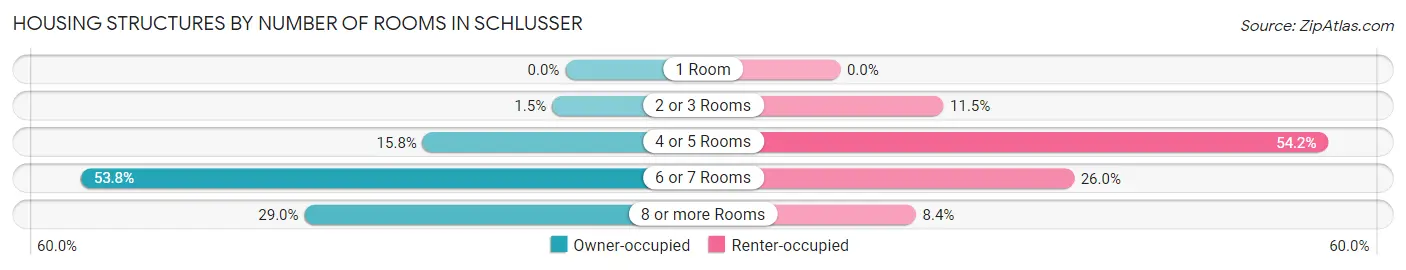
| Number of Rooms | Owner-occupied | Renter-occupied |
| 1 Room | 0 (0.0%) | 0 (0.0%) |
| 2 or 3 Rooms | 28 (1.5%) | 60 (11.5%) |
| 4 or 5 Rooms | 301 (15.8%) | 284 (54.2%) |
| 6 or 7 Rooms | 1,023 (53.8%) | 136 (26.0%) |
| 8 or more Rooms | 551 (28.9%) | 44 (8.4%) |
| Total | 1,903 (100.0%) | 524 (100.0%) |
Housing Structure by Heating Type in Schlusser
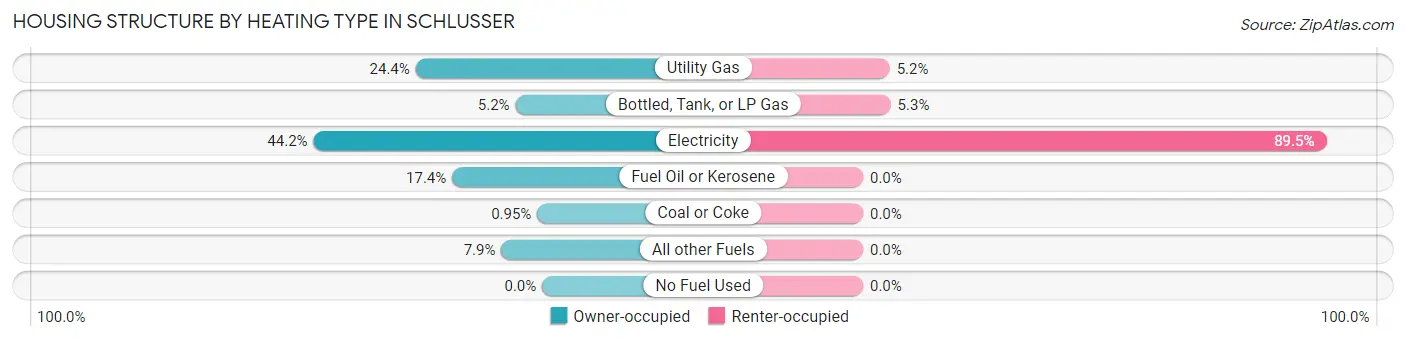
| Heating Type | Owner-occupied | Renter-occupied |
| Utility Gas | 465 (24.4%) | 27 (5.1%) |
| Bottled, Tank, or LP Gas | 98 (5.1%) | 28 (5.3%) |
| Electricity | 841 (44.2%) | 469 (89.5%) |
| Fuel Oil or Kerosene | 331 (17.4%) | 0 (0.0%) |
| Coal or Coke | 18 (0.9%) | 0 (0.0%) |
| All other Fuels | 150 (7.9%) | 0 (0.0%) |
| No Fuel Used | 0 (0.0%) | 0 (0.0%) |
| Total | 1,903 (100.0%) | 524 (100.0%) |
Household Vehicle Usage in Schlusser
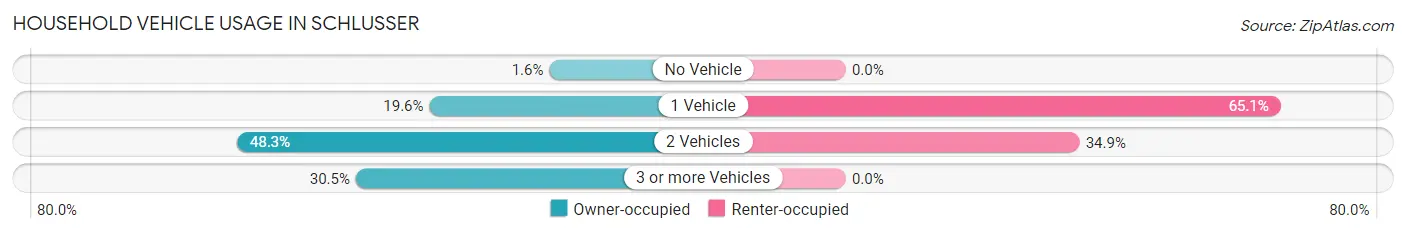
| Vehicles per Household | Owner-occupied | Renter-occupied |
| No Vehicle | 31 (1.6%) | 0 (0.0%) |
| 1 Vehicle | 372 (19.6%) | 341 (65.1%) |
| 2 Vehicles | 919 (48.3%) | 183 (34.9%) |
| 3 or more Vehicles | 581 (30.5%) | 0 (0.0%) |
| Total | 1,903 (100.0%) | 524 (100.0%) |
Real Estate & Mortgages in Schlusser
Real Estate and Mortgage Overview in Schlusser
| Characteristic | Without Mortgage | With Mortgage |
| Housing Units | 779 | 1,124 |
| Median Property Value | $200,600 | $204,800 |
| Median Household Income | $77,474 | $311 |
| Monthly Housing Costs | $589 | $48 |
| Real Estate Taxes | $3,057 | $0 |
Property Value by Mortgage Status in Schlusser
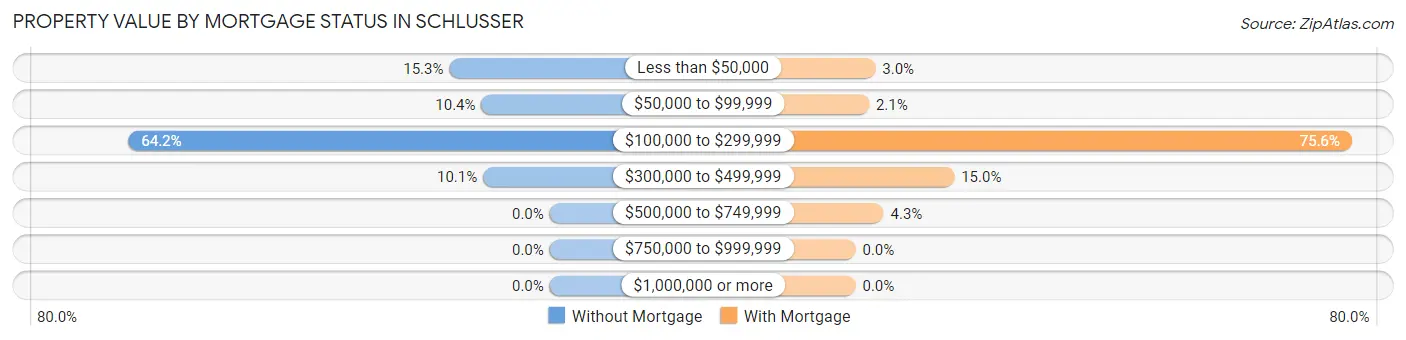
| Property Value | Without Mortgage | With Mortgage |
| Less than $50,000 | 119 (15.3%) | 34 (3.0%) |
| $50,000 to $99,999 | 81 (10.4%) | 23 (2.1%) |
| $100,000 to $299,999 | 500 (64.2%) | 850 (75.6%) |
| $300,000 to $499,999 | 79 (10.1%) | 169 (15.0%) |
| $500,000 to $749,999 | 0 (0.0%) | 48 (4.3%) |
| $750,000 to $999,999 | 0 (0.0%) | 0 (0.0%) |
| $1,000,000 or more | 0 (0.0%) | 0 (0.0%) |
| Total | 779 (100.0%) | 1,124 (100.0%) |
Household Income by Mortgage Status in Schlusser
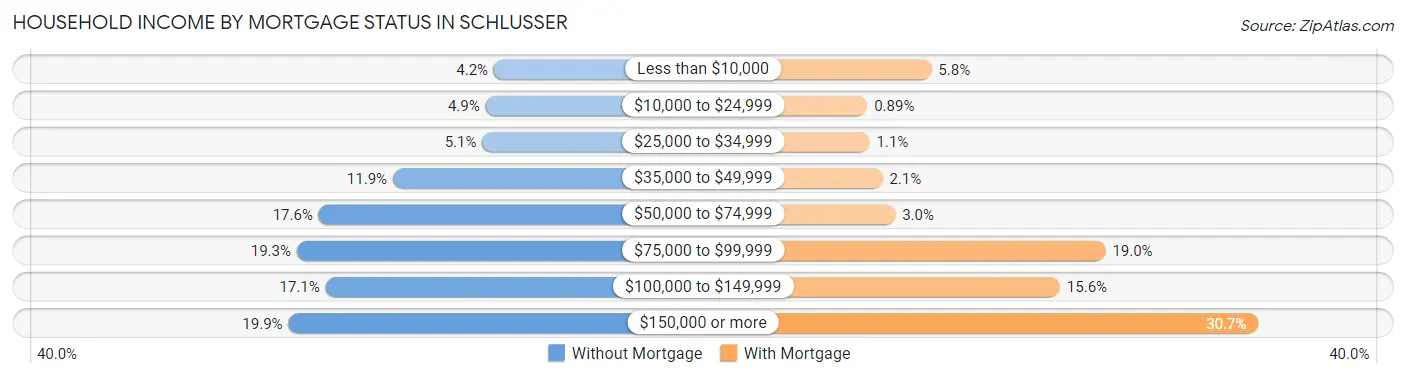
| Household Income | Without Mortgage | With Mortgage |
| Less than $10,000 | 33 (4.2%) | 65 (5.8%) |
| $10,000 to $24,999 | 38 (4.9%) | 10 (0.9%) |
| $25,000 to $34,999 | 40 (5.1%) | 12 (1.1%) |
| $35,000 to $49,999 | 93 (11.9%) | 23 (2.1%) |
| $50,000 to $74,999 | 137 (17.6%) | 34 (3.0%) |
| $75,000 to $99,999 | 150 (19.3%) | 214 (19.0%) |
| $100,000 to $149,999 | 133 (17.1%) | 175 (15.6%) |
| $150,000 or more | 155 (19.9%) | 345 (30.7%) |
| Total | 779 (100.0%) | 1,124 (100.0%) |
Property Value to Household Income Ratio in Schlusser
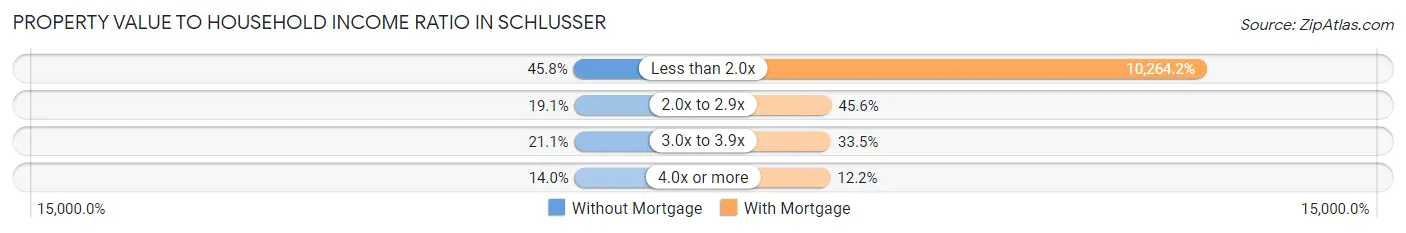
| Value-to-Income Ratio | Without Mortgage | With Mortgage |
| Less than 2.0x | 357 (45.8%) | 115,370 (10,264.2%) |
| 2.0x to 2.9x | 149 (19.1%) | 513 (45.6%) |
| 3.0x to 3.9x | 164 (21.0%) | 376 (33.5%) |
| 4.0x or more | 109 (14.0%) | 137 (12.2%) |
| Total | 779 (100.0%) | 1,124 (100.0%) |
Real Estate Taxes by Mortgage Status in Schlusser
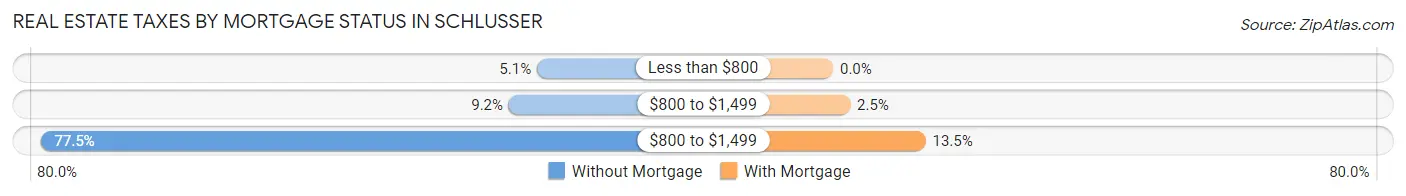
| Property Taxes | Without Mortgage | With Mortgage |
| Less than $800 | 40 (5.1%) | 0 (0.0%) |
| $800 to $1,499 | 72 (9.2%) | 28 (2.5%) |
| $800 to $1,499 | 604 (77.5%) | 152 (13.5%) |
| Total | 779 (100.0%) | 1,124 (100.0%) |
Health & Disability in Schlusser
Health Insurance Coverage by Age in Schlusser
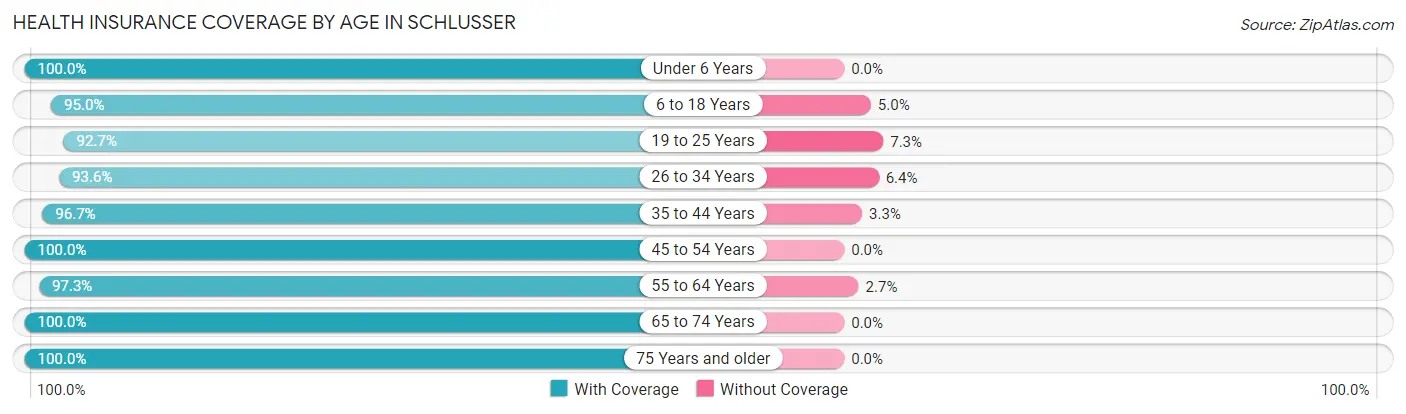
| Age Bracket | With Coverage | Without Coverage |
| Under 6 Years | 356 (100.0%) | 0 (0.0%) |
| 6 to 18 Years | 632 (95.0%) | 33 (5.0%) |
| 19 to 25 Years | 408 (92.7%) | 32 (7.3%) |
| 26 to 34 Years | 598 (93.6%) | 41 (6.4%) |
| 35 to 44 Years | 957 (96.7%) | 33 (3.3%) |
| 45 to 54 Years | 764 (100.0%) | 0 (0.0%) |
| 55 to 64 Years | 545 (97.3%) | 15 (2.7%) |
| 65 to 74 Years | 766 (100.0%) | 0 (0.0%) |
| 75 Years and older | 524 (100.0%) | 0 (0.0%) |
| Total | 5,550 (97.3%) | 154 (2.7%) |
Health Insurance Coverage by Citizenship Status in Schlusser
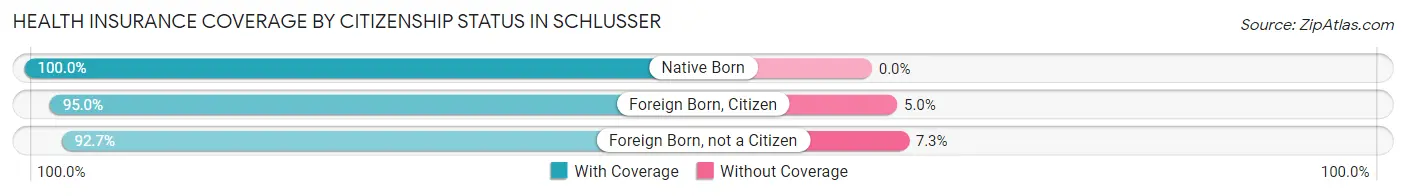
| Citizenship Status | With Coverage | Without Coverage |
| Native Born | 356 (100.0%) | 0 (0.0%) |
| Foreign Born, Citizen | 632 (95.0%) | 33 (5.0%) |
| Foreign Born, not a Citizen | 408 (92.7%) | 32 (7.3%) |
Health Insurance Coverage by Household Income in Schlusser
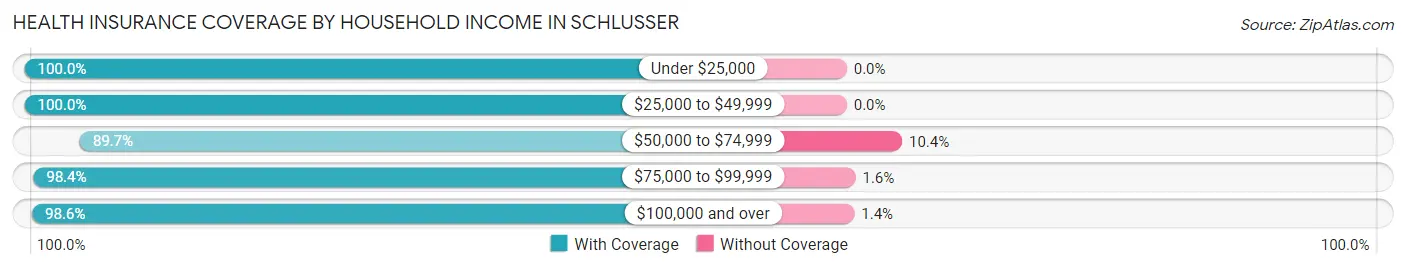
| Household Income | With Coverage | Without Coverage |
| Under $25,000 | 396 (100.0%) | 0 (0.0%) |
| $25,000 to $49,999 | 534 (100.0%) | 0 (0.0%) |
| $50,000 to $74,999 | 840 (89.6%) | 97 (10.3%) |
| $75,000 to $99,999 | 898 (98.4%) | 15 (1.6%) |
| $100,000 and over | 2,875 (98.6%) | 41 (1.4%) |
Public vs Private Health Insurance Coverage by Age in Schlusser
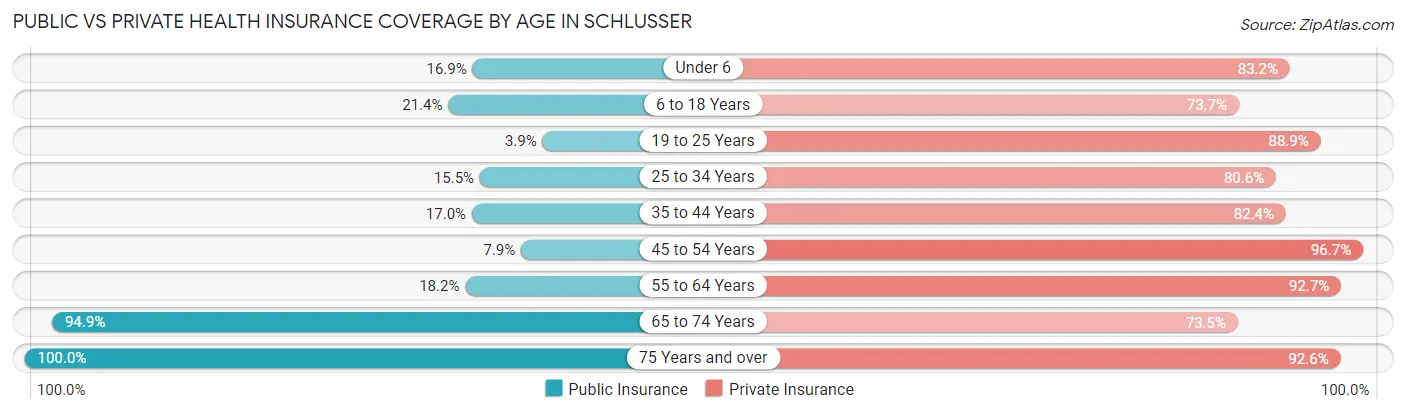
| Age Bracket | Public Insurance | Private Insurance |
| Under 6 | 60 (16.9%) | 296 (83.2%) |
| 6 to 18 Years | 142 (21.3%) | 490 (73.7%) |
| 19 to 25 Years | 17 (3.9%) | 391 (88.9%) |
| 25 to 34 Years | 99 (15.5%) | 515 (80.6%) |
| 35 to 44 Years | 168 (17.0%) | 816 (82.4%) |
| 45 to 54 Years | 60 (7.9%) | 739 (96.7%) |
| 55 to 64 Years | 102 (18.2%) | 519 (92.7%) |
| 65 to 74 Years | 727 (94.9%) | 563 (73.5%) |
| 75 Years and over | 524 (100.0%) | 485 (92.6%) |
| Total | 1,899 (33.3%) | 4,814 (84.4%) |
Disability Status by Sex by Age in Schlusser
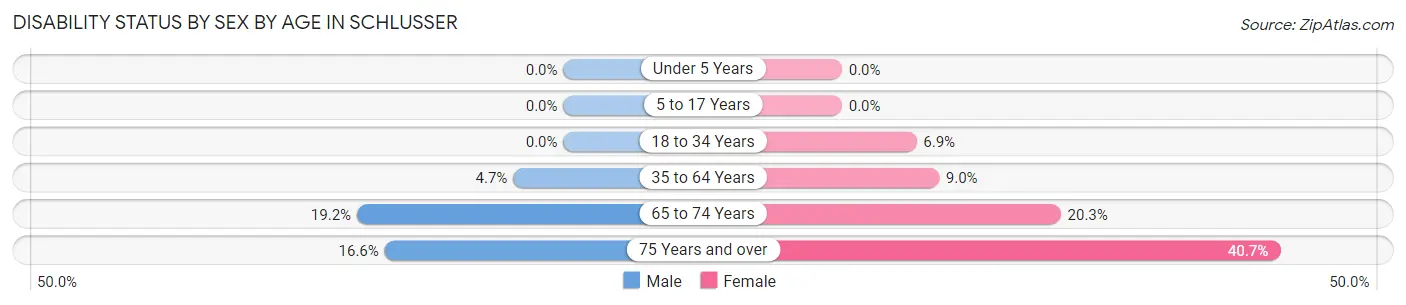
| Age Bracket | Male | Female |
| Under 5 Years | 0 (0.0%) | 0 (0.0%) |
| 5 to 17 Years | 0 (0.0%) | 0 (0.0%) |
| 18 to 34 Years | 0 (0.0%) | 36 (6.9%) |
| 35 to 64 Years | 54 (4.7%) | 104 (9.0%) |
| 65 to 74 Years | 59 (19.2%) | 93 (20.3%) |
| 75 Years and over | 38 (16.6%) | 120 (40.7%) |
Disability Class by Sex by Age in Schlusser
Disability Class: Hearing Difficulty
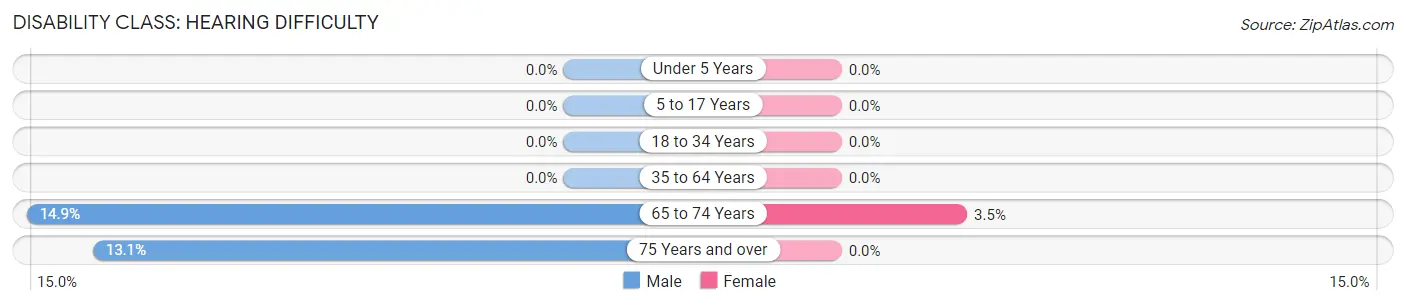
| Age Bracket | Male | Female |
| Under 5 Years | 0 (0.0%) | 0 (0.0%) |
| 5 to 17 Years | 0 (0.0%) | 0 (0.0%) |
| 18 to 34 Years | 0 (0.0%) | 0 (0.0%) |
| 35 to 64 Years | 0 (0.0%) | 0 (0.0%) |
| 65 to 74 Years | 46 (14.9%) | 16 (3.5%) |
| 75 Years and over | 30 (13.1%) | 0 (0.0%) |
Disability Class: Vision Difficulty
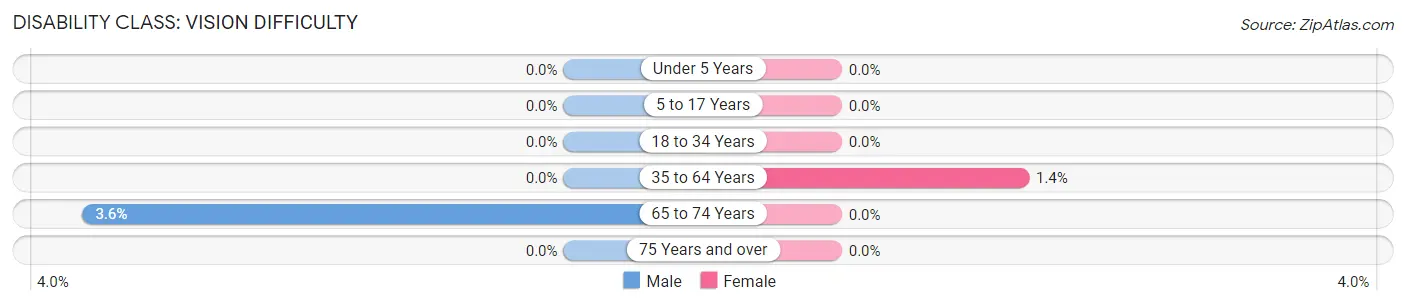
| Age Bracket | Male | Female |
| Under 5 Years | 0 (0.0%) | 0 (0.0%) |
| 5 to 17 Years | 0 (0.0%) | 0 (0.0%) |
| 18 to 34 Years | 0 (0.0%) | 0 (0.0%) |
| 35 to 64 Years | 0 (0.0%) | 16 (1.4%) |
| 65 to 74 Years | 11 (3.6%) | 0 (0.0%) |
| 75 Years and over | 0 (0.0%) | 0 (0.0%) |
Disability Class: Cognitive Difficulty
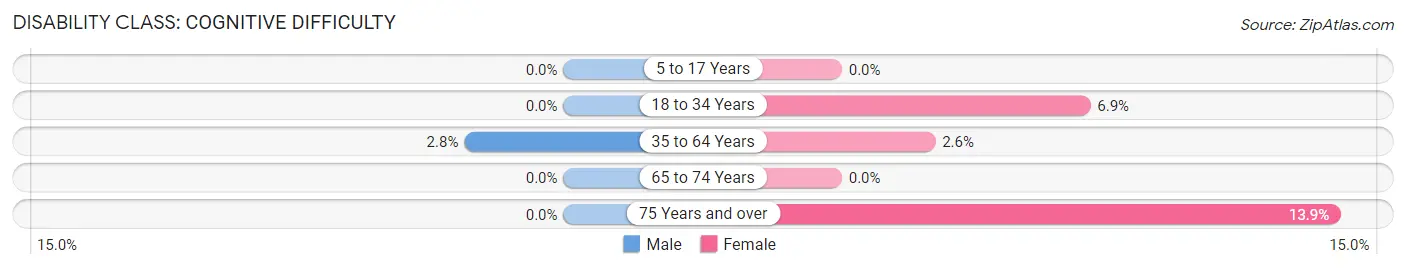
| Age Bracket | Male | Female |
| 5 to 17 Years | 0 (0.0%) | 0 (0.0%) |
| 18 to 34 Years | 0 (0.0%) | 36 (6.9%) |
| 35 to 64 Years | 32 (2.8%) | 30 (2.6%) |
| 65 to 74 Years | 0 (0.0%) | 0 (0.0%) |
| 75 Years and over | 0 (0.0%) | 41 (13.9%) |
Disability Class: Ambulatory Difficulty
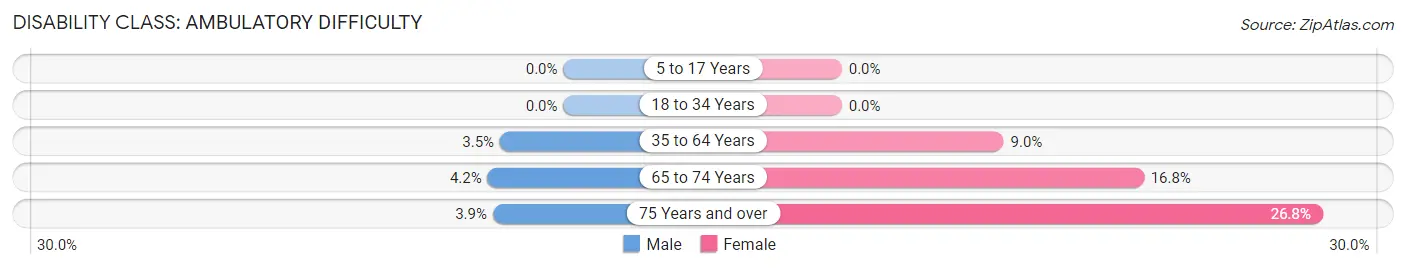
| Age Bracket | Male | Female |
| 5 to 17 Years | 0 (0.0%) | 0 (0.0%) |
| 18 to 34 Years | 0 (0.0%) | 0 (0.0%) |
| 35 to 64 Years | 41 (3.5%) | 104 (9.0%) |
| 65 to 74 Years | 13 (4.2%) | 77 (16.8%) |
| 75 Years and over | 9 (3.9%) | 79 (26.8%) |
Disability Class: Self-Care Difficulty
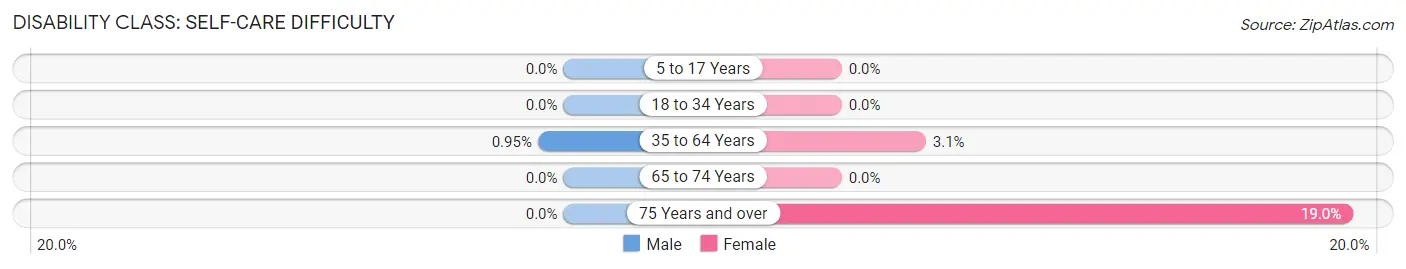
| Age Bracket | Male | Female |
| 5 to 17 Years | 0 (0.0%) | 0 (0.0%) |
| 18 to 34 Years | 0 (0.0%) | 0 (0.0%) |
| 35 to 64 Years | 11 (0.9%) | 36 (3.1%) |
| 65 to 74 Years | 0 (0.0%) | 0 (0.0%) |
| 75 Years and over | 0 (0.0%) | 56 (19.0%) |
Technology Access in Schlusser
Computing Device Access in Schlusser
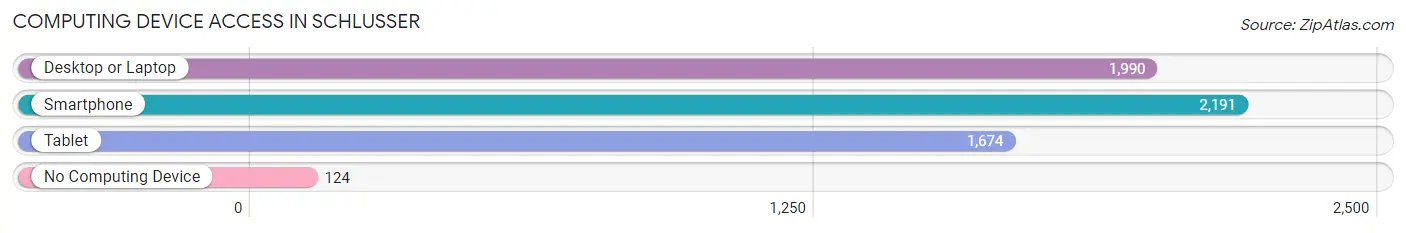
| Device Type | # Households | % Households |
| Desktop or Laptop | 1,990 | 82.0% |
| Smartphone | 2,191 | 90.3% |
| Tablet | 1,674 | 69.0% |
| No Computing Device | 124 | 5.1% |
| Total | 2,427 | 100.0% |
Internet Access in Schlusser
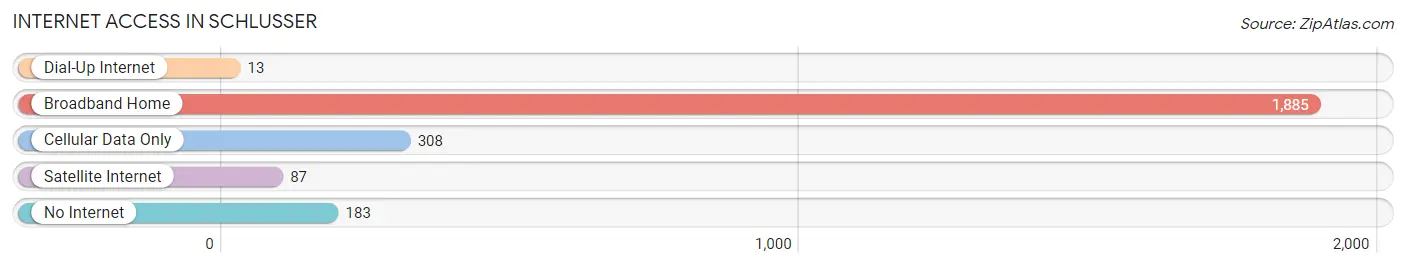
| Internet Type | # Households | % Households |
| Dial-Up Internet | 13 | 0.5% |
| Broadband Home | 1,885 | 77.7% |
| Cellular Data Only | 308 | 12.7% |
| Satellite Internet | 87 | 3.6% |
| No Internet | 183 | 7.5% |
| Total | 2,427 | 100.0% |
Schlusser Summary
Pennsylvania, located in the northeastern United States, is the 33rd most populous state in the country. It is bordered by New York, New Jersey, Delaware, Maryland, West Virginia, and Ohio. Pennsylvania is known for its rich history, diverse geography, and vibrant economy.
History
Pennsylvania was founded in 1681 by William Penn, a Quaker, as a refuge for religious freedom. Penn named the state after his father, Admiral William Penn. The state was originally part of the British colony of Pennsylvania, which was established in 1682. Pennsylvania was one of the original 13 colonies that declared independence from Britain in 1776. During the Revolutionary War, Pennsylvania was a major battleground, with the Battle of Gettysburg being one of the most important battles of the war.
Pennsylvania was also a major center of the Industrial Revolution. The state was home to many of the first factories and mills in the United States. The state was also a major producer of coal, steel, and other industrial products.
Geography
Pennsylvania is divided into two distinct regions: the Appalachian Mountains in the east and the Great Lakes and Ohio River Valley in the west. The Appalachian Mountains are home to the Allegheny and Susquehanna Rivers, which flow through the state. The Great Lakes and Ohio River Valley are home to the Ohio River, which forms the western border of the state.
Pennsylvania is home to a variety of landscapes, including rolling hills, forests, and farmland. The state is also home to many rivers, lakes, and streams. The highest point in the state is Mount Davis, which is located in the Allegheny Mountains.
Economy
Pennsylvania has a diverse economy, with a variety of industries. The state is a major producer of coal, steel, and other industrial products. It is also a major producer of agricultural products, including dairy, poultry, and livestock.
The state is also home to a number of major corporations, including Hershey, PNC Financial Services, and Comcast. Pennsylvania is also home to a number of universities, including the University of Pennsylvania, Carnegie Mellon University, and the University of Pittsburgh.
Demographics
As of 2020, Pennsylvania had an estimated population of 12.8 million people. The state is home to a diverse population, with the largest ethnic groups being White (77.3%), Black or African American (11.2%), and Hispanic or Latino (7.2%). The state is also home to a large number of immigrants, with the largest groups being from India, China, and Mexico.
The median household income in Pennsylvania is $60,872, and the median home value is $187,400. The state has a poverty rate of 12.3%, which is slightly higher than the national average.
Conclusion
Pennsylvania is a state with a rich history, diverse geography, and vibrant economy. The state is home to a diverse population, with a variety of ethnic and immigrant groups. The state is also home to a number of major corporations and universities. Pennsylvania is a great place to live, work, and visit.
Common Questions
What is the Total Population of Schlusser?
Total Population of Schlusser is 5,725.
What is the Total Male Population of Schlusser?
Total Male Population of Schlusser is 2,857.
What is the Total Female Population of Schlusser?
Total Female Population of Schlusser is 2,868.
What is the Ratio of Males per 100 Females in Schlusser?
There are 99.62 Males per 100 Females in Schlusser.
What is the Ratio of Females per 100 Males in Schlusser?
There are 100.39 Females per 100 Males in Schlusser.
What is the Median Population Age in Schlusser?
Median Population Age in Schlusser is 41.9 Years.
What is the Average Family Size in Schlusser
Average Family Size in Schlusser is 3.0 People.
What is the Average Household Size in Schlusser
Average Household Size in Schlusser is 2.4 People.
What is Per Capita Income in Schlusser?
Per Capita income in Schlusser is $42,167.
What is the Median Family Income in Schlusser?
Median Family Income in Schlusser is $107,574.
What is the Median Household income in Schlusser?
Median Household Income in Schlusser is $82,835.
What is Income or Wage Gap in Schlusser?
Income or Wage Gap in Schlusser is 39.8%.
Women in Schlusser earn 60.2 cents for every dollar earned by a man.
What is Inequality or Gini Index in Schlusser?
Inequality or Gini Index in Schlusser is 0.34.
How Large is the Labor Force in Schlusser?
There are 3,348 People in the Labor Forcein in Schlusser.
What is the Percentage of People in the Labor Force in Schlusser?
69.0% of People are in the Labor Force in Schlusser.
What is the Unemployment Rate in Schlusser?
Unemployment Rate in Schlusser is 4.4%.