Cities with the Most Immigrants from Lebanon in Pennsylvania
RELATED REPORTS & OPTIONS
Lebanon
Pennsylvania
Compare Cities
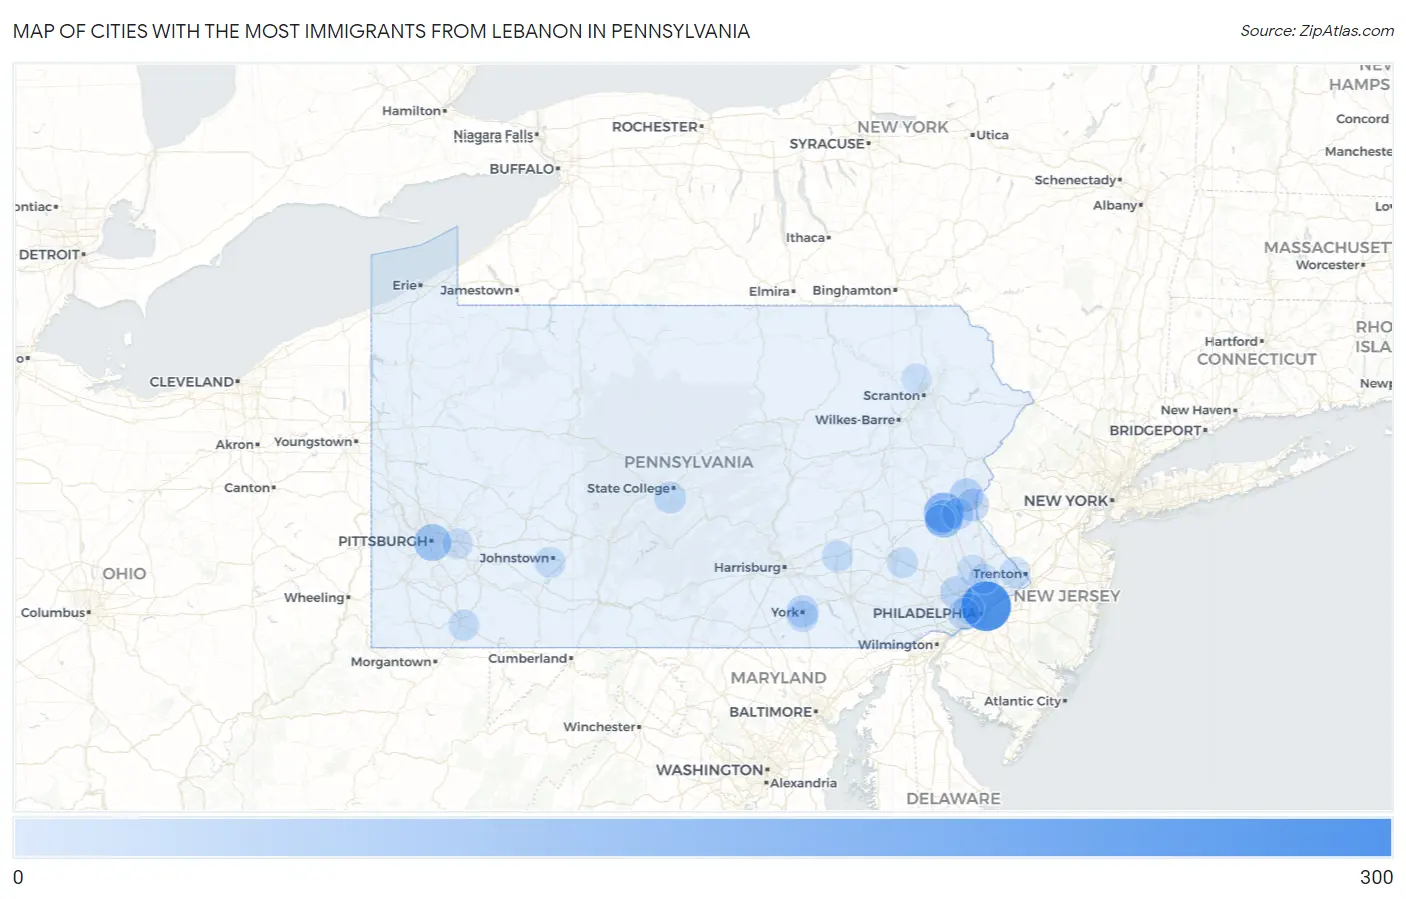
Map of Cities with the Most Immigrants from Lebanon in Pennsylvania
0
300
Cities with the Most Immigrants from Lebanon in Pennsylvania
| City | Lebanon | vs State | vs National | |
| 1. | Philadelphia | 280 | 2,601(10.77%)#1 | 133,021(0.21%)#59 |
| 2. | Fullerton | 136 | 2,601(5.23%)#2 | 133,021(0.10%)#142 |
| 3. | Allentown | 109 | 2,601(4.19%)#3 | 133,021(0.08%)#176 |
| 4. | Pittsburgh | 95 | 2,601(3.65%)#4 | 133,021(0.07%)#211 |
| 5. | Chestnut Hill | 70 | 2,601(2.69%)#5 | 133,021(0.05%)#305 |
| 6. | Hamburg Borough | 55 | 2,601(2.11%)#6 | 133,021(0.04%)#386 |
| 7. | Towanda Borough | 50 | 2,601(1.92%)#7 | 133,021(0.04%)#418 |
| 8. | Eastlawn Gardens | 47 | 2,601(1.81%)#8 | 133,021(0.04%)#447 |
| 9. | Easton | 37 | 2,601(1.42%)#9 | 133,021(0.03%)#541 |
| 10. | King Of Prussia | 31 | 2,601(1.19%)#10 | 133,021(0.02%)#638 |
| 11. | Bridgeport Borough | 31 | 2,601(1.19%)#11 | 133,021(0.02%)#642 |
| 12. | York | 27 | 2,601(1.04%)#12 | 133,021(0.02%)#701 |
| 13. | Bethlehem | 25 | 2,601(0.96%)#13 | 133,021(0.02%)#732 |
| 14. | Phoenixville Borough | 25 | 2,601(0.96%)#14 | 133,021(0.02%)#742 |
| 15. | Pine Grove Mills | 24 | 2,601(0.92%)#15 | 133,021(0.02%)#771 |
| 16. | Bala Cynwyd | 23 | 2,601(0.88%)#16 | 133,021(0.02%)#784 |
| 17. | Downingtown Borough | 23 | 2,601(0.88%)#17 | 133,021(0.02%)#787 |
| 18. | Drexel Hill | 22 | 2,601(0.85%)#18 | 133,021(0.02%)#802 |
| 19. | Carlisle Borough | 22 | 2,601(0.85%)#19 | 133,021(0.02%)#805 |
| 20. | Kutztown Borough | 21 | 2,601(0.81%)#20 | 133,021(0.02%)#839 |
| 21. | Perkasie Borough | 20 | 2,601(0.77%)#21 | 133,021(0.02%)#862 |
| 22. | Grantley | 19 | 2,601(0.73%)#22 | 133,021(0.01%)#891 |
| 23. | Lebanon | 17 | 2,601(0.65%)#23 | 133,021(0.01%)#942 |
| 24. | Wilson Borough | 17 | 2,601(0.65%)#24 | 133,021(0.01%)#953 |
| 25. | Chambersburg Borough | 16 | 2,601(0.62%)#25 | 133,021(0.01%)#982 |
| 26. | Woodside | 16 | 2,601(0.62%)#26 | 133,021(0.01%)#995 |
| 27. | Plum Borough | 15 | 2,601(0.58%)#27 | 133,021(0.01%)#1,006 |
| 28. | West Chester Borough | 12 | 2,601(0.46%)#28 | 133,021(0.01%)#1,108 |
| 29. | Lorane | 12 | 2,601(0.46%)#29 | 133,021(0.01%)#1,122 |
| 30. | Elim | 12 | 2,601(0.46%)#30 | 133,021(0.01%)#1,123 |
| 31. | Hopwood | 12 | 2,601(0.46%)#31 | 133,021(0.01%)#1,128 |
| 32. | Montgomeryville | 11 | 2,601(0.42%)#32 | 133,021(0.01%)#1,155 |
| 33. | Forest Hills Borough | 11 | 2,601(0.42%)#33 | 133,021(0.01%)#1,171 |
| 34. | Penn Wynne | 11 | 2,601(0.42%)#34 | 133,021(0.01%)#1,172 |
| 35. | Deer Lake Borough | 11 | 2,601(0.42%)#35 | 133,021(0.01%)#1,180 |
| 36. | Rosemont | 10 | 2,601(0.38%)#36 | 133,021(0.01%)#1,238 |
| 37. | Frazer | 10 | 2,601(0.38%)#37 | 133,021(0.01%)#1,239 |
| 38. | Fox Chapel Borough | 8 | 2,601(0.31%)#38 | 133,021(0.01%)#1,324 |
| 39. | Forty Fort Borough | 8 | 2,601(0.31%)#39 | 133,021(0.01%)#1,326 |
| 40. | Monroeville | 7 | 2,601(0.27%)#40 | 133,021(0.01%)#1,358 |
| 41. | Coplay Borough | 7 | 2,601(0.27%)#41 | 133,021(0.01%)#1,383 |
| 42. | Roslyn | 6 | 2,601(0.23%)#42 | 133,021(0.00%)#1,405 |
| 43. | Dorneyville | 6 | 2,601(0.23%)#43 | 133,021(0.00%)#1,412 |
| 44. | Braddock Hills Borough | 6 | 2,601(0.23%)#44 | 133,021(0.00%)#1,419 |
| 45. | Horsham | 5 | 2,601(0.19%)#45 | 133,021(0.00%)#1,431 |
| 46. | Glenburn | 2 | 2,601(0.08%)#46 | 133,021(0.00%)#1,526 |
Common Questions
What are the Top 10 Cities with the Most Immigrants from Lebanon in Pennsylvania?
Top 10 Cities with the Most Immigrants from Lebanon in Pennsylvania are:
#1
280
#2
136
#3
109
#4
95
#5
47
#6
37
#7
31
#8
27
#9
25
#10
24
What city has the Most Immigrants from Lebanon in Pennsylvania?
Philadelphia has the Most Immigrants from Lebanon in Pennsylvania with 280.
What is the Total Immigrants from Lebanon in the State of Pennsylvania?
Total Immigrants from Lebanon in Pennsylvania is 2,601.
What is the Total Immigrants from Lebanon in the United States?
Total Immigrants from Lebanon in the United States is 133,021.