Cities with the Highest Percentage of Population Employed in Educational Services in Pennsylvania
RELATED REPORTS & OPTIONS
Educational Services
Pennsylvania
Compare Cities
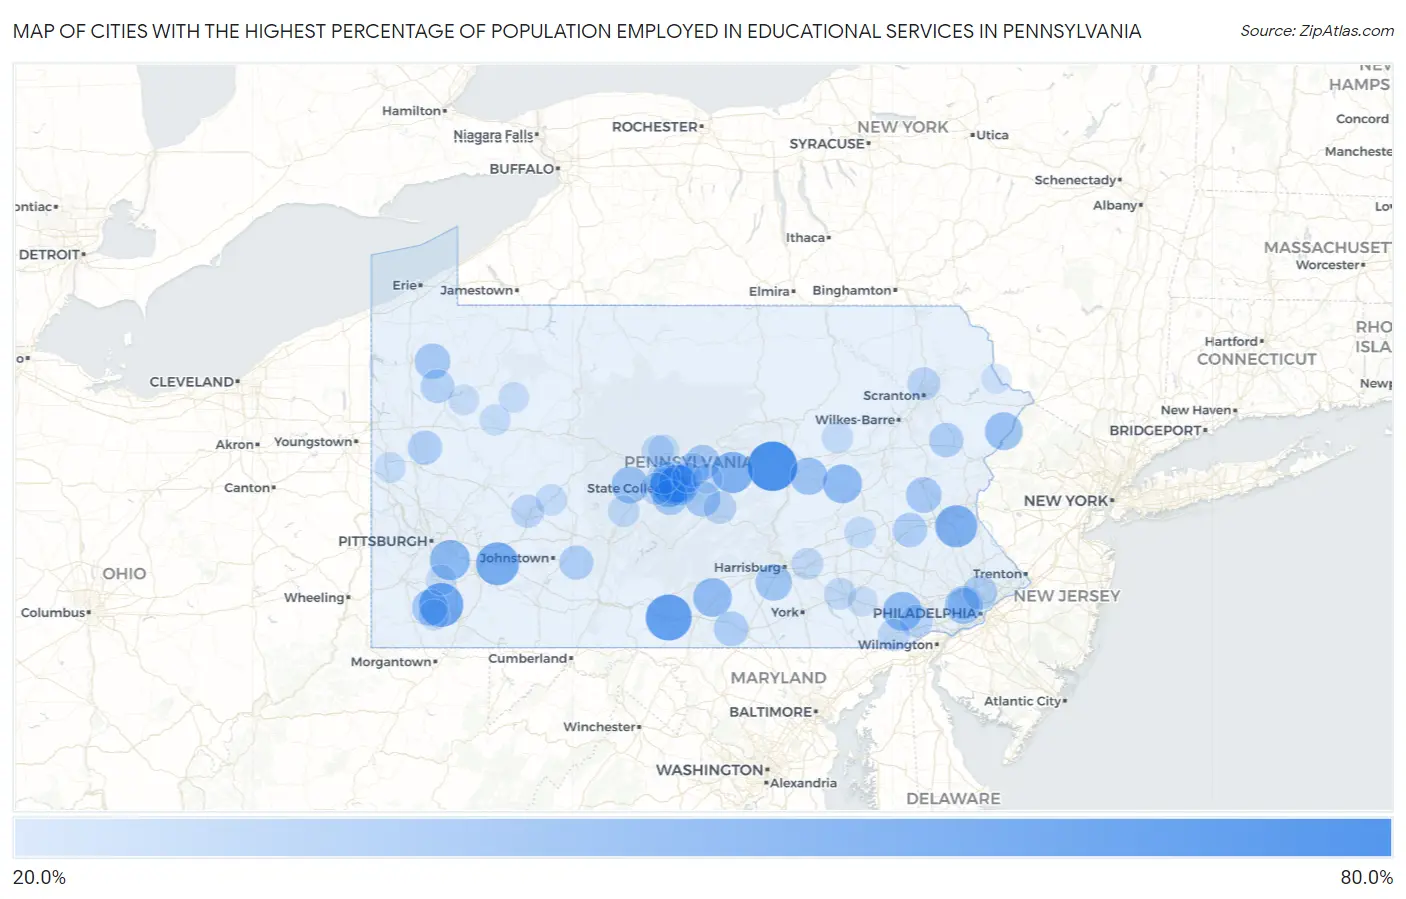
Map of Cities with the Highest Percentage of Population Employed in Educational Services in Pennsylvania
0.0%
80.0%
Cities with the Highest Percentage of Population Employed in Educational Services in Pennsylvania
| City | % Employed | vs State | vs National | |
| 1. | Vicksburg | 69.9% | 9.6%(+60.3)#1 | 9.3%(+60.6)#70 |
| 2. | Potters Mills | 65.4% | 9.6%(+55.8)#2 | 9.3%(+56.1)#88 |
| 3. | Fort Loudon | 60.9% | 9.6%(+51.3)#3 | 9.3%(+51.6)#109 |
| 4. | Hiller | 55.8% | 9.6%(+46.2)#4 | 9.3%(+46.5)#148 |
| 5. | St Vincent College | 52.9% | 9.6%(+43.3)#5 | 9.3%(+43.6)#174 |
| 6. | Desales University | 50.7% | 9.6%(+41.1)#6 | 9.3%(+41.4)#199 |
| 7. | Green Hills Borough | 50.0% | 9.6%(+40.4)#7 | 9.3%(+40.7)#217 |
| 8. | Toftrees | 49.2% | 9.6%(+39.6)#8 | 9.3%(+39.9)#224 |
| 9. | Woodward | 48.6% | 9.6%(+39.1)#9 | 9.3%(+39.3)#227 |
| 10. | Carlisle Barracks | 46.3% | 9.6%(+36.7)#10 | 9.3%(+37.0)#264 |
| 11. | Boston | 45.7% | 9.6%(+36.1)#11 | 9.3%(+36.4)#276 |
| 12. | Birmingham Borough | 45.2% | 9.6%(+35.6)#12 | 9.3%(+35.8)#285 |
| 13. | Lemont | 45.0% | 9.6%(+35.4)#13 | 9.3%(+35.7)#289 |
| 14. | Misericordia University | 44.1% | 9.6%(+34.5)#14 | 9.3%(+34.8)#302 |
| 15. | Park Forest Village | 43.8% | 9.6%(+34.2)#15 | 9.3%(+34.5)#309 |
| 16. | Wilburton Number Two | 42.9% | 9.6%(+33.3)#16 | 9.3%(+33.5)#331 |
| 17. | Westwood | 42.8% | 9.6%(+33.2)#17 | 9.3%(+33.5)#334 |
| 18. | Shippensburg University | 42.2% | 9.6%(+32.6)#18 | 9.3%(+32.9)#346 |
| 19. | Houserville | 41.1% | 9.6%(+31.5)#19 | 9.3%(+31.7)#368 |
| 20. | Haverford College | 39.7% | 9.6%(+30.1)#20 | 9.3%(+30.4)#396 |
| 21. | Pocono Ranch Lands | 39.6% | 9.6%(+30.0)#21 | 9.3%(+30.3)#403 |
| 22. | Yarnell | 39.2% | 9.6%(+29.6)#22 | 9.3%(+29.9)#413 |
| 23. | Snydertown | 38.3% | 9.6%(+28.7)#23 | 9.3%(+29.0)#440 |
| 24. | Lewisburg Borough | 38.0% | 9.6%(+28.4)#24 | 9.3%(+28.7)#448 |
| 25. | Sandy Ridge | 37.7% | 9.6%(+28.1)#25 | 9.3%(+28.4)#456 |
| 26. | Franklin Forge | 37.5% | 9.6%(+27.9)#26 | 9.3%(+28.2)#468 |
| 27. | State College Borough | 37.1% | 9.6%(+27.5)#27 | 9.3%(+27.8)#473 |
| 28. | Continental Courts | 36.8% | 9.6%(+27.2)#28 | 9.3%(+27.5)#488 |
| 29. | Messiah College | 36.4% | 9.6%(+26.8)#29 | 9.3%(+27.1)#503 |
| 30. | Armagh Borough | 35.6% | 9.6%(+26.0)#30 | 9.3%(+26.2)#535 |
| 31. | Millsboro | 35.4% | 9.6%(+25.8)#31 | 9.3%(+26.1)#545 |
| 32. | Shellytown | 35.3% | 9.6%(+25.7)#32 | 9.3%(+26.0)#552 |
| 33. | Potlicker Flats | 34.6% | 9.6%(+25.0)#33 | 9.3%(+25.3)#591 |
| 34. | Slatedale | 34.4% | 9.6%(+24.8)#34 | 9.3%(+25.1)#600 |
| 35. | Guys Mills | 34.4% | 9.6%(+24.8)#35 | 9.3%(+25.1)#601 |
| 36. | Hublersburg | 33.8% | 9.6%(+24.2)#36 | 9.3%(+24.5)#618 |
| 37. | Pine Grove Mills | 33.5% | 9.6%(+23.9)#37 | 9.3%(+24.2)#629 |
| 38. | New Wilmington Borough | 32.9% | 9.6%(+23.3)#38 | 9.3%(+23.6)#664 |
| 39. | Penn State Berks | 32.9% | 9.6%(+23.3)#39 | 9.3%(+23.5)#667 |
| 40. | Juniata Gap | 32.8% | 9.6%(+23.2)#40 | 9.3%(+23.4)#673 |
| 41. | University Of Pittsburgh Bradford | 32.4% | 9.6%(+22.8)#41 | 9.3%(+23.1)#694 |
| 42. | Orrtanna | 31.8% | 9.6%(+22.2)#42 | 9.3%(+22.5)#713 |
| 43. | Kutztown University | 31.7% | 9.6%(+22.1)#43 | 9.3%(+22.4)#723 |
| 44. | Pocono Pines | 31.3% | 9.6%(+21.7)#44 | 9.3%(+22.0)#743 |
| 45. | Arcadia University | 31.3% | 9.6%(+21.7)#45 | 9.3%(+22.0)#747 |
| 46. | Loretto Borough | 31.0% | 9.6%(+21.4)#46 | 9.3%(+21.6)#767 |
| 47. | Dunlo | 30.6% | 9.6%(+21.0)#47 | 9.3%(+21.3)#786 |
| 48. | New Boston | 30.6% | 9.6%(+21.0)#48 | 9.3%(+21.3)#787 |
| 49. | Zion | 30.4% | 9.6%(+20.8)#49 | 9.3%(+21.1)#798 |
| 50. | Slippery Rock University | 30.4% | 9.6%(+20.8)#50 | 9.3%(+21.1)#802 |
| 51. | Curryville | 30.0% | 9.6%(+20.4)#51 | 9.3%(+20.7)#824 |
| 52. | Hannasville | 29.9% | 9.6%(+20.3)#52 | 9.3%(+20.5)#835 |
| 53. | Julian | 28.3% | 9.6%(+18.7)#53 | 9.3%(+19.0)#942 |
| 54. | Gettysburg Borough | 28.1% | 9.6%(+18.5)#54 | 9.3%(+18.8)#963 |
| 55. | Unionville | 27.9% | 9.6%(+18.3)#55 | 9.3%(+18.6)#974 |
| 56. | Chinchilla | 27.9% | 9.6%(+18.3)#56 | 9.3%(+18.6)#984 |
| 57. | Selinsgrove Borough | 27.7% | 9.6%(+18.1)#57 | 9.3%(+18.4)#996 |
| 58. | Chevy Chase Heights | 27.7% | 9.6%(+18.1)#58 | 9.3%(+18.4)#1,001 |
| 59. | Port Allegany Borough | 27.5% | 9.6%(+17.9)#59 | 9.3%(+18.2)#1,010 |
| 60. | Alfarata | 27.4% | 9.6%(+17.8)#60 | 9.3%(+18.0)#1,023 |
| 61. | Factoryville Borough | 27.2% | 9.6%(+17.6)#61 | 9.3%(+17.9)#1,043 |
| 62. | Wopsononock | 27.1% | 9.6%(+17.5)#62 | 9.3%(+17.8)#1,050 |
| 63. | Morgan Hill | 25.9% | 9.6%(+16.3)#63 | 9.3%(+16.6)#1,156 |
| 64. | Moshannon | 25.7% | 9.6%(+16.1)#64 | 9.3%(+16.4)#1,180 |
| 65. | Lincoln University | 25.6% | 9.6%(+16.0)#65 | 9.3%(+16.3)#1,186 |
| 66. | Stormstown | 25.6% | 9.6%(+16.0)#66 | 9.3%(+16.3)#1,187 |
| 67. | Bryn Mawr | 25.6% | 9.6%(+16.0)#67 | 9.3%(+16.3)#1,193 |
| 68. | Edinboro Borough | 25.5% | 9.6%(+15.9)#68 | 9.3%(+16.1)#1,204 |
| 69. | Landisville | 25.4% | 9.6%(+15.8)#69 | 9.3%(+16.1)#1,214 |
| 70. | Union Deposit | 25.1% | 9.6%(+15.5)#70 | 9.3%(+15.8)#1,232 |
| 71. | Tipton | 24.8% | 9.6%(+15.2)#71 | 9.3%(+15.5)#1,268 |
| 72. | Schubert | 24.7% | 9.6%(+15.1)#72 | 9.3%(+15.4)#1,286 |
| 73. | Rohrsburg | 24.6% | 9.6%(+15.0)#73 | 9.3%(+15.3)#1,294 |
| 74. | California Borough | 24.3% | 9.6%(+14.7)#74 | 9.3%(+15.0)#1,328 |
| 75. | Commodore | 24.3% | 9.6%(+14.7)#75 | 9.3%(+15.0)#1,335 |
| 76. | Villanova | 23.9% | 9.6%(+14.3)#76 | 9.3%(+14.6)#1,386 |
| 77. | Chestnut Hill | 23.9% | 9.6%(+14.3)#77 | 9.3%(+14.5)#1,387 |
| 78. | Marianne | 23.7% | 9.6%(+14.1)#78 | 9.3%(+14.4)#1,410 |
| 79. | Clarence | 23.7% | 9.6%(+14.1)#79 | 9.3%(+14.3)#1,426 |
| 80. | Crucible | 23.3% | 9.6%(+13.7)#80 | 9.3%(+14.0)#1,477 |
| 81. | West Pittsburg | 23.2% | 9.6%(+13.6)#81 | 9.3%(+13.8)#1,498 |
| 82. | Port Matilda Borough | 23.1% | 9.6%(+13.5)#82 | 9.3%(+13.8)#1,503 |
| 83. | Clarion Borough | 23.1% | 9.6%(+13.5)#83 | 9.3%(+13.8)#1,511 |
| 84. | Penbrook Borough | 22.8% | 9.6%(+13.2)#84 | 9.3%(+13.5)#1,554 |
| 85. | Wickerham Manor Fisher | 22.8% | 9.6%(+13.2)#85 | 9.3%(+13.5)#1,555 |
| 86. | Oakland Cdp Lawrence County | 22.7% | 9.6%(+13.1)#86 | 9.3%(+13.3)#1,579 |
| 87. | Seneca | 22.6% | 9.6%(+13.0)#87 | 9.3%(+13.3)#1,586 |
| 88. | Pinecroft | 22.6% | 9.6%(+13.0)#88 | 9.3%(+13.3)#1,597 |
| 89. | Runville | 22.4% | 9.6%(+12.8)#89 | 9.3%(+13.1)#1,629 |
| 90. | Crown | 22.4% | 9.6%(+12.8)#90 | 9.3%(+13.1)#1,637 |
| 91. | Smoketown | 22.1% | 9.6%(+12.5)#91 | 9.3%(+12.8)#1,680 |
| 92. | Sylvan Hills | 22.0% | 9.6%(+12.4)#92 | 9.3%(+12.6)#1,701 |
| 93. | Swarthmore Borough | 21.9% | 9.6%(+12.3)#93 | 9.3%(+12.6)#1,707 |
| 94. | Edgewood Borough | 21.8% | 9.6%(+12.2)#94 | 9.3%(+12.5)#1,716 |
| 95. | Pleasant Gap | 21.8% | 9.6%(+12.2)#95 | 9.3%(+12.5)#1,728 |
| 96. | Landingville Borough | 21.7% | 9.6%(+12.1)#96 | 9.3%(+12.4)#1,734 |
| 97. | Spring Mills | 21.1% | 9.6%(+11.5)#97 | 9.3%(+11.8)#1,844 |
| 98. | Grove City Borough | 21.1% | 9.6%(+11.5)#98 | 9.3%(+11.8)#1,856 |
| 99. | Masthope | 21.1% | 9.6%(+11.5)#99 | 9.3%(+11.7)#1,865 |
| 100. | Mount Carbon Borough | 21.1% | 9.6%(+11.5)#100 | 9.3%(+11.7)#1,874 |
Common Questions
What are the Top 10 Cities with the Highest Percentage of Population Employed in Educational Services in Pennsylvania?
Top 10 Cities with the Highest Percentage of Population Employed in Educational Services in Pennsylvania are:
#1
69.9%
#2
60.9%
#3
55.8%
#4
52.9%
#5
50.7%
#6
49.2%
#7
48.6%
#8
45.7%
#9
45.0%
#10
43.8%
What city has the Highest Percentage of Population Employed in Educational Services in Pennsylvania?
Vicksburg has the Highest Percentage of Population Employed in Educational Services in Pennsylvania with 69.9%.
What is the Percentage of Population Employed in Educational Services in the State of Pennsylvania?
Percentage of Population Employed in Educational Services in Pennsylvania is 9.6%.
What is the Percentage of Population Employed in Educational Services in the United States?
Percentage of Population Employed in Educational Services in the United States is 9.3%.