Churchill borough, PA
Churchill borough Overview
3,127
TOTAL POPULATION
1,528
MALE POPULATION
1,599
FEMALE POPULATION
95.56
MALES / 100 FEMALES
104.65
FEMALES / 100 MALES
45.9
MEDIAN AGE
2.8
AVG FAMILY SIZE
2.4
AVG HOUSEHOLD SIZE
$53,203
PER CAPITA INCOME
$118,137
AVG FAMILY INCOME
$102,216
AVG HOUSEHOLD INCOME
39.3%
WAGE / INCOME GAP [ % ]
60.7¢/ $1
WAGE / INCOME GAP [ $ ]
0.37
INEQUALITY / GINI INDEX
1,684
LABOR FORCE [ PEOPLE ]
67.3%
PERCENT IN LABOR FORCE
6.6%
UNEMPLOYMENT RATE
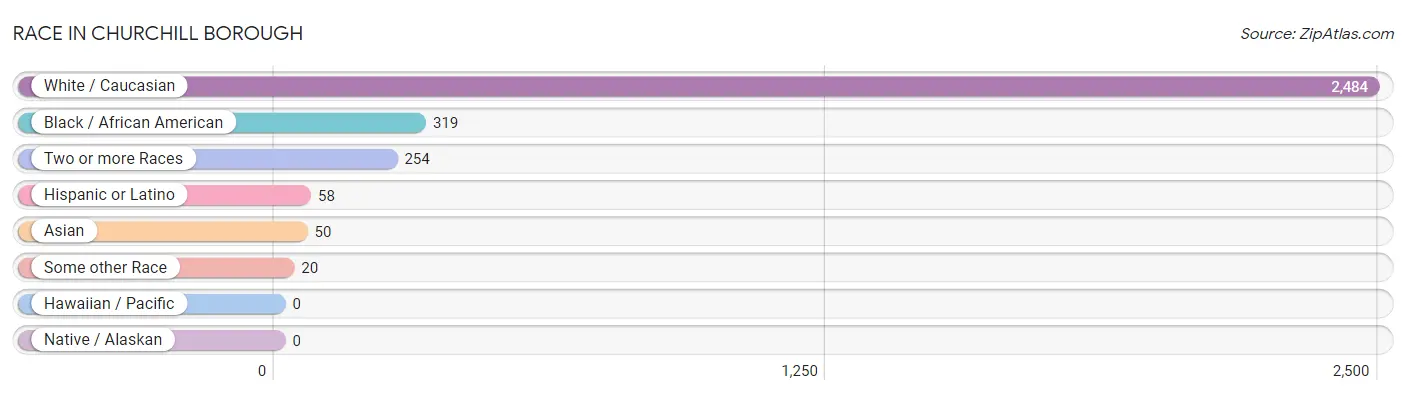
Race in Churchill borough
The most populous races in Churchill borough are White / Caucasian (2,484 | 79.4%), Black / African American (319 | 10.2%), and Two or more Races (254 | 8.1%).
| Race | # Population | % Population |
| Asian | 50 | 1.6% |
| Black / African American | 319 | 10.2% |
| Hawaiian / Pacific | 0 | 0.0% |
| Hispanic or Latino | 58 | 1.8% |
| Native / Alaskan | 0 | 0.0% |
| White / Caucasian | 2,484 | 79.4% |
| Two or more Races | 254 | 8.1% |
| Some other Race | 20 | 0.6% |
| Total | 3,127 | 100.0% |
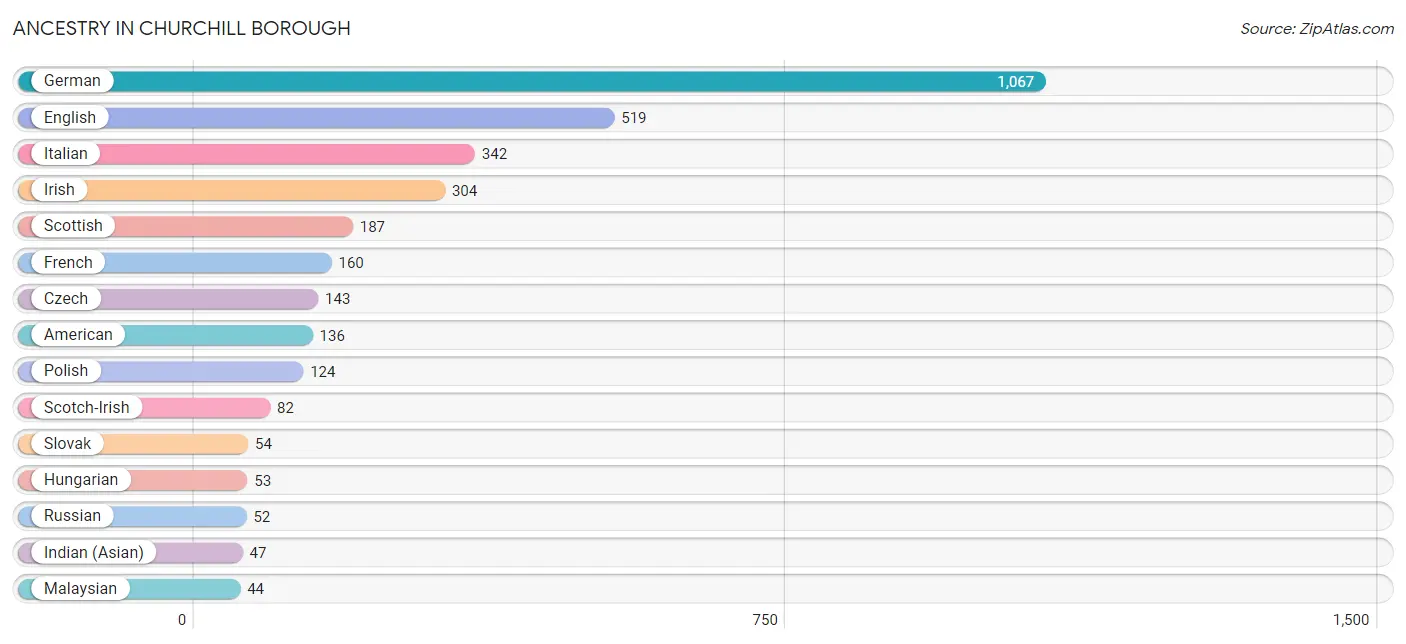
Ancestry in Churchill borough
The most populous ancestries reported in Churchill borough are German (1,067 | 34.1%), English (519 | 16.6%), Italian (342 | 10.9%), Irish (304 | 9.7%), and Scottish (187 | 6.0%), together accounting for 77.4% of all Churchill borough residents.
| Ancestry | # Population | % Population |
| American | 136 | 4.3% |
| Arab | 39 | 1.3% |
| Australian | 8 | 0.3% |
| Austrian | 19 | 0.6% |
| Belgian | 21 | 0.7% |
| British | 5 | 0.2% |
| Central American | 7 | 0.2% |
| Costa Rican | 3 | 0.1% |
| Croatian | 41 | 1.3% |
| Czech | 143 | 4.6% |
| Czechoslovakian | 9 | 0.3% |
| Dominican | 30 | 1.0% |
| Dutch | 21 | 0.7% |
| Eastern European | 38 | 1.2% |
| English | 519 | 16.6% |
| European | 21 | 0.7% |
| French | 160 | 5.1% |
| German | 1,067 | 34.1% |
| Greek | 32 | 1.0% |
| Guatemalan | 4 | 0.1% |
| Hungarian | 53 | 1.7% |
| Indian (Asian) | 47 | 1.5% |
| Irish | 304 | 9.7% |
| Italian | 342 | 10.9% |
| Lebanese | 16 | 0.5% |
| Lithuanian | 15 | 0.5% |
| Malaysian | 44 | 1.4% |
| Mexican | 3 | 0.1% |
| Norwegian | 10 | 0.3% |
| Polish | 124 | 4.0% |
| Puerto Rican | 18 | 0.6% |
| Russian | 52 | 1.7% |
| Scandinavian | 9 | 0.3% |
| Scotch-Irish | 82 | 2.6% |
| Scottish | 187 | 6.0% |
| Serbian | 18 | 0.6% |
| Slavic | 10 | 0.3% |
| Slovak | 54 | 1.7% |
| Slovene | 6 | 0.2% |
| Swedish | 33 | 1.1% |
| Ukrainian | 21 | 0.7% |
| Welsh | 43 | 1.4% | View All 42 Rows |
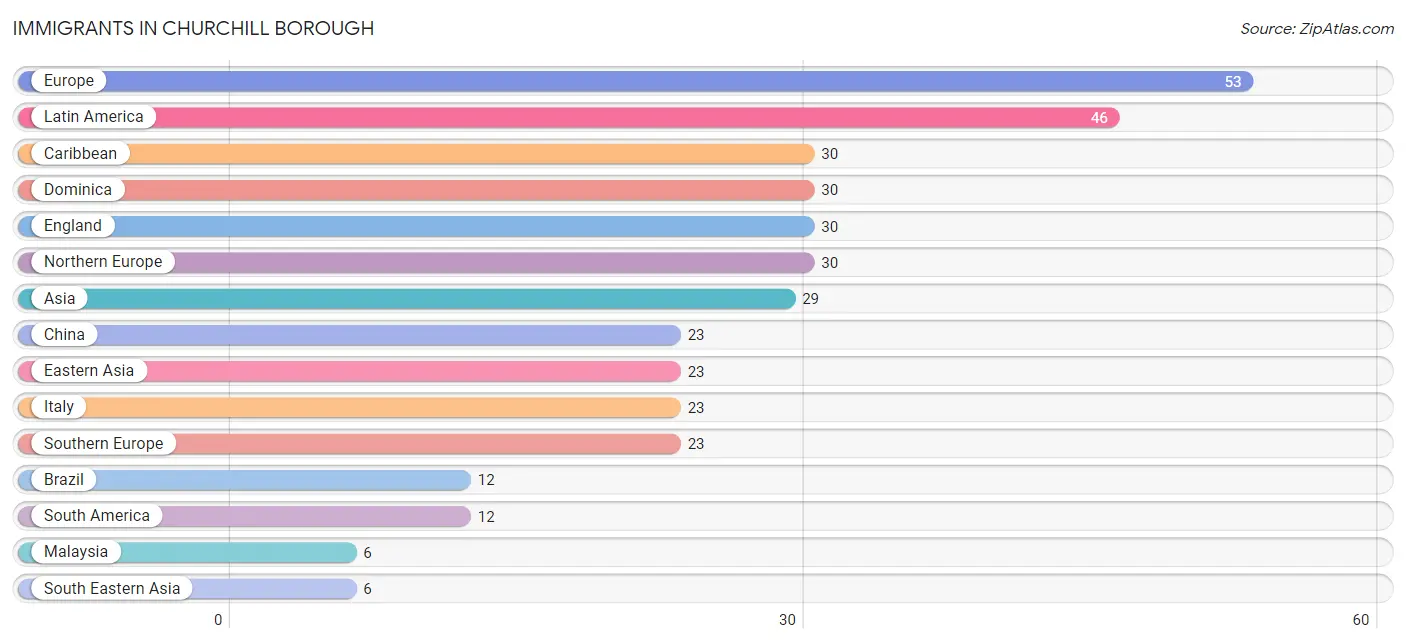
Immigrants in Churchill borough
The most numerous immigrant groups reported in Churchill borough came from Europe (53 | 1.7%), Latin America (46 | 1.5%), Caribbean (30 | 1.0%), Dominica (30 | 1.0%), and England (30 | 1.0%), together accounting for 6.0% of all Churchill borough residents.
| Immigration Origin | # Population | % Population |
| Asia | 29 | 0.9% |
| Brazil | 12 | 0.4% |
| Caribbean | 30 | 1.0% |
| Central America | 4 | 0.1% |
| China | 23 | 0.7% |
| Dominica | 30 | 1.0% |
| Eastern Asia | 23 | 0.7% |
| England | 30 | 1.0% |
| Europe | 53 | 1.7% |
| Guatemala | 4 | 0.1% |
| Italy | 23 | 0.7% |
| Latin America | 46 | 1.5% |
| Malaysia | 6 | 0.2% |
| Northern Europe | 30 | 1.0% |
| South America | 12 | 0.4% |
| South Eastern Asia | 6 | 0.2% |
| Southern Europe | 23 | 0.7% | View All 17 Rows |
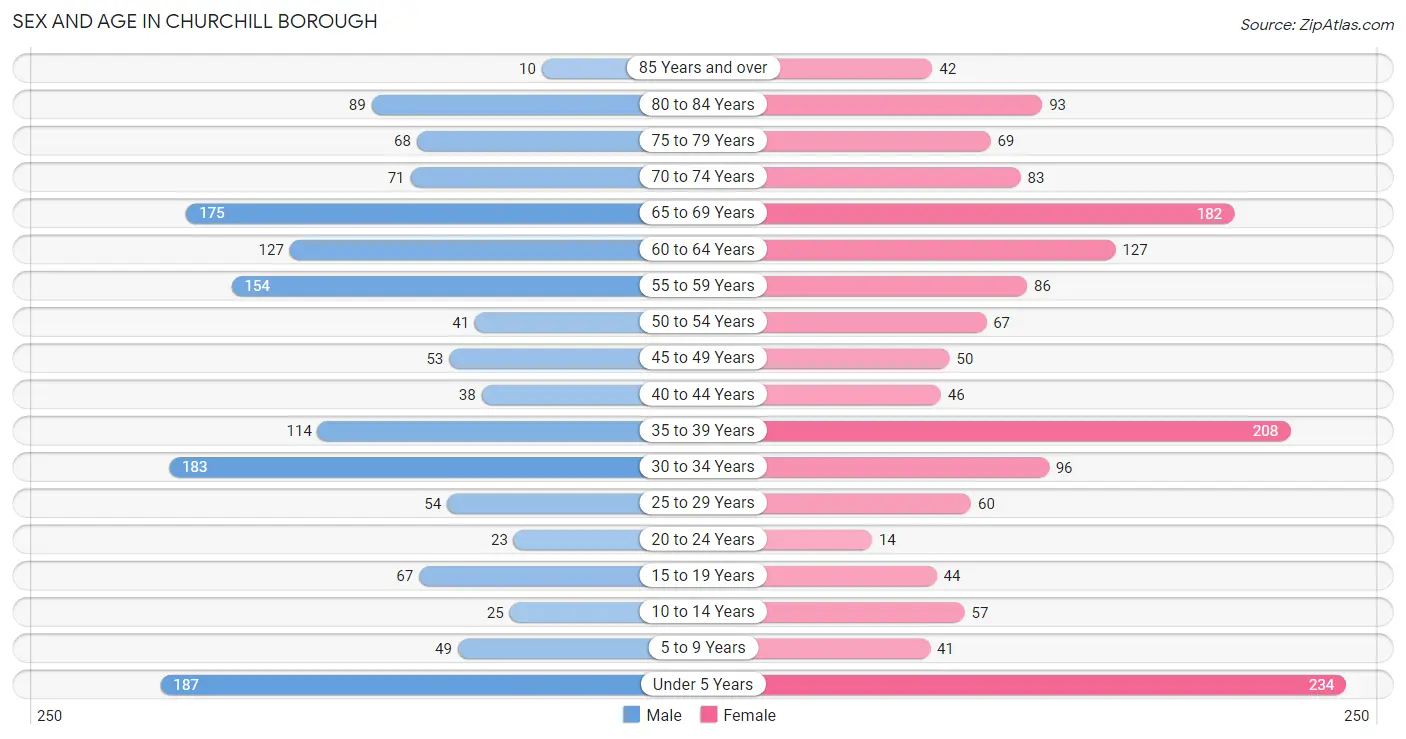
Sex and Age in Churchill borough
Sex and Age in Churchill borough
The most populous age groups in Churchill borough are Under 5 Years (187 | 12.2%) for men and Under 5 Years (234 | 14.6%) for women.
| Age Bracket | Male | Female |
| Under 5 Years | 187 (12.2%) | 234 (14.6%) |
| 5 to 9 Years | 49 (3.2%) | 41 (2.6%) |
| 10 to 14 Years | 25 (1.6%) | 57 (3.6%) |
| 15 to 19 Years | 67 (4.4%) | 44 (2.8%) |
| 20 to 24 Years | 23 (1.5%) | 14 (0.9%) |
| 25 to 29 Years | 54 (3.5%) | 60 (3.7%) |
| 30 to 34 Years | 183 (12.0%) | 96 (6.0%) |
| 35 to 39 Years | 114 (7.5%) | 208 (13.0%) |
| 40 to 44 Years | 38 (2.5%) | 46 (2.9%) |
| 45 to 49 Years | 53 (3.5%) | 50 (3.1%) |
| 50 to 54 Years | 41 (2.7%) | 67 (4.2%) |
| 55 to 59 Years | 154 (10.1%) | 86 (5.4%) |
| 60 to 64 Years | 127 (8.3%) | 127 (7.9%) |
| 65 to 69 Years | 175 (11.5%) | 182 (11.4%) |
| 70 to 74 Years | 71 (4.6%) | 83 (5.2%) |
| 75 to 79 Years | 68 (4.4%) | 69 (4.3%) |
| 80 to 84 Years | 89 (5.8%) | 93 (5.8%) |
| 85 Years and over | 10 (0.6%) | 42 (2.6%) |
| Total | 1,528 (100.0%) | 1,599 (100.0%) |
Families and Households in Churchill borough
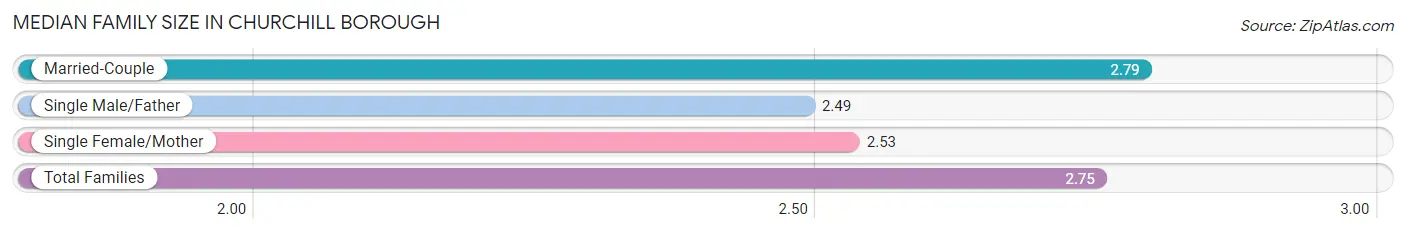
Median Family Size in Churchill borough
The median family size in Churchill borough is 2.75 persons per family, with married-couple families (766 | 85.6%) accounting for the largest median family size of 2.79 persons per family. On the other hand, single male/father families (43 | 4.8%) represent the smallest median family size with 2.49 persons per family.
| Family Type | # Families | Family Size |
| Married-Couple | 766 (85.6%) | 2.79 |
| Single Male/Father | 43 (4.8%) | 2.49 |
| Single Female/Mother | 86 (9.6%) | 2.53 |
| Total Families | 895 (100.0%) | 2.75 |
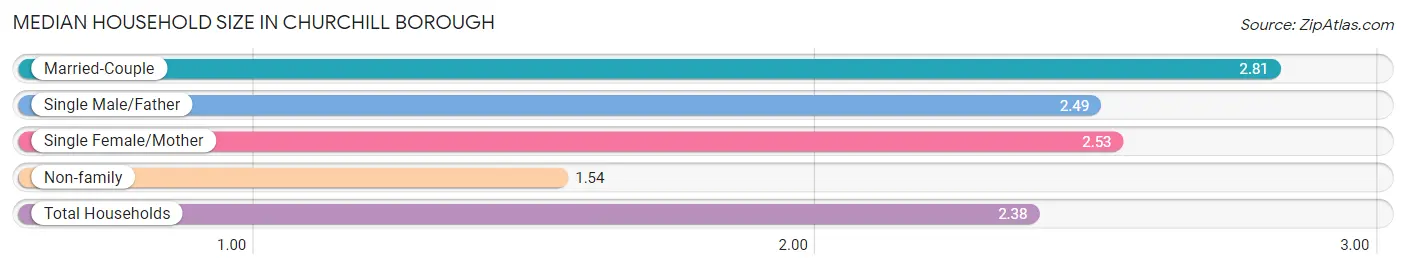
Median Household Size in Churchill borough
The median household size in Churchill borough is 2.38 persons per household, with married-couple households (766 | 58.4%) accounting for the largest median household size of 2.81 persons per household. non-family households (416 | 31.7%) represent the smallest median household size with 1.54 persons per household.
| Household Type | # Households | Household Size |
| Married-Couple | 766 (58.4%) | 2.81 |
| Single Male/Father | 43 (3.3%) | 2.49 |
| Single Female/Mother | 86 (6.6%) | 2.53 |
| Non-family | 416 (31.7%) | 1.54 |
| Total Households | 1,311 (100.0%) | 2.38 |
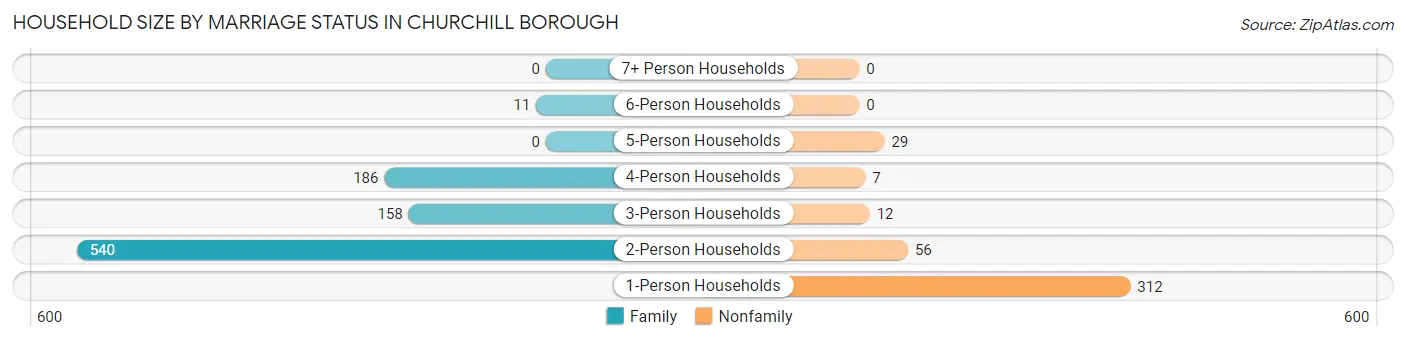
Household Size by Marriage Status in Churchill borough
Out of a total of 1,311 households in Churchill borough, 895 (68.3%) are family households, while 416 (31.7%) are nonfamily households. The most numerous type of family households are 2-person households, comprising 540, and the most common type of nonfamily households are 1-person households, comprising 312.
| Household Size | Family Households | Nonfamily Households |
| 1-Person Households | - | 312 (23.8%) |
| 2-Person Households | 540 (41.2%) | 56 (4.3%) |
| 3-Person Households | 158 (12.0%) | 12 (0.9%) |
| 4-Person Households | 186 (14.2%) | 7 (0.5%) |
| 5-Person Households | 0 (0.0%) | 29 (2.2%) |
| 6-Person Households | 11 (0.8%) | 0 (0.0%) |
| 7+ Person Households | 0 (0.0%) | 0 (0.0%) |
| Total | 895 (68.3%) | 416 (31.7%) |
Female Fertility in Churchill borough
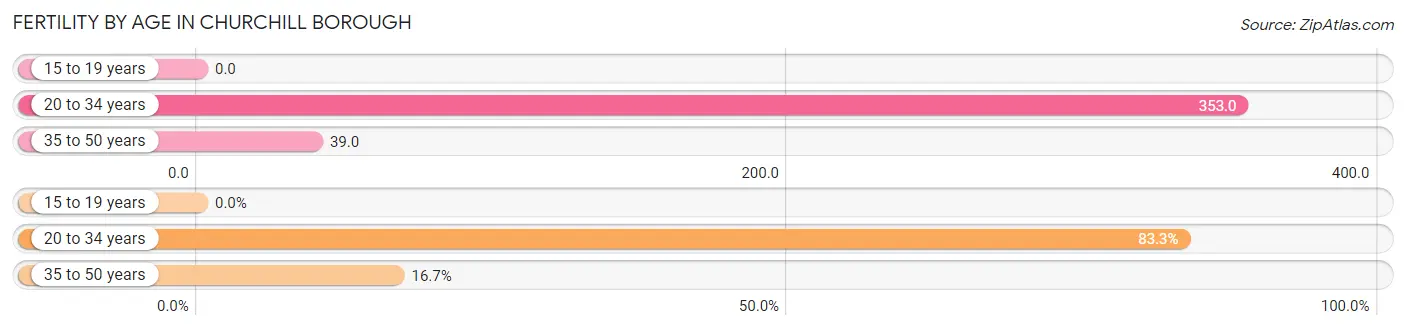
Fertility by Age in Churchill borough
Average fertility rate in Churchill borough is 139.0 births per 1,000 women. Women in the age bracket of 20 to 34 years have the highest fertility rate with 353.0 births per 1,000 women. Women in the age bracket of 20 to 34 years acount for 83.3% of all women with births.
| Age Bracket | Women with Births | Births / 1,000 Women |
| 15 to 19 years | 0 (0.0%) | 0.0 |
| 20 to 34 years | 60 (83.3%) | 353.0 |
| 35 to 50 years | 12 (16.7%) | 39.0 |
| Total | 72 (100.0%) | 139.0 |
Fertility by Age by Marriage Status in Churchill borough
83.3% of women with births (72) in Churchill borough are married. The highest percentage of unmarried women with births falls into 35 to 50 years age bracket with 100.0% of them unmarried at the time of birth, while the lowest percentage of unmarried women with births belong to 20 to 34 years age bracket with 0.0% of them unmarried.
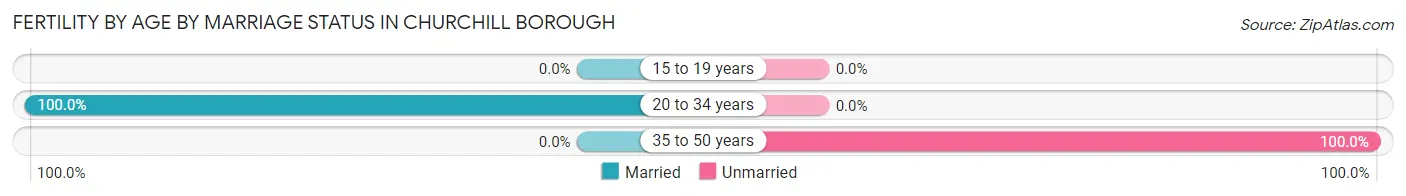
| Age Bracket | Married | Unmarried |
| 15 to 19 years | 0 (0.0%) | 0 (0.0%) |
| 20 to 34 years | 60 (100.0%) | 0 (0.0%) |
| 35 to 50 years | 0 (0.0%) | 12 (100.0%) |
| Total | 60 (83.3%) | 12 (16.7%) |
Fertility by Education in Churchill borough
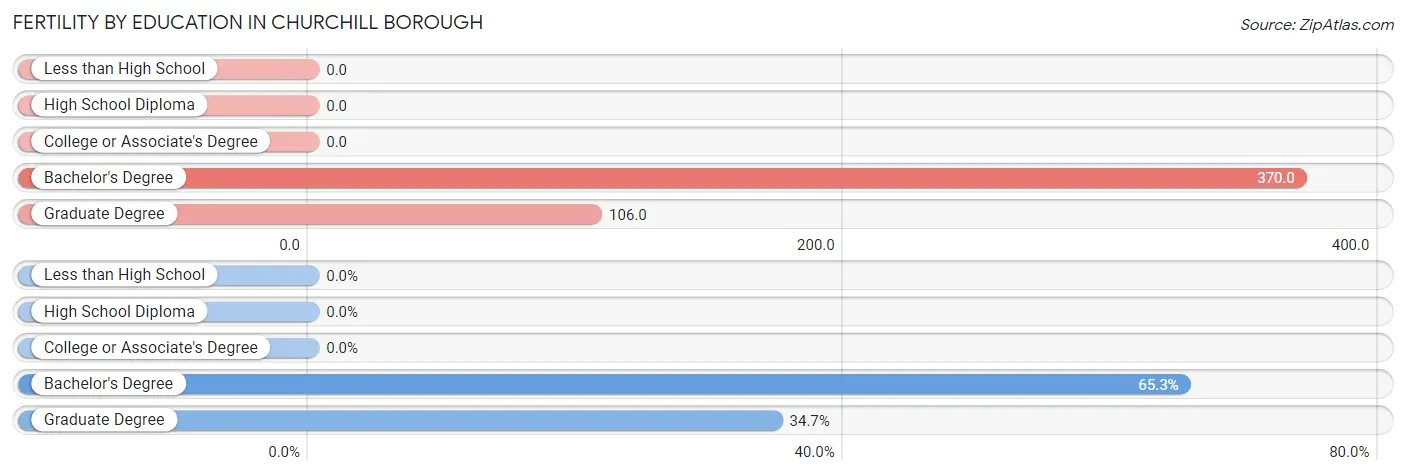
| Educational Attainment | Women with Births | Births / 1,000 Women |
| Less than High School | 0 (0.0%) | 0.0 |
| High School Diploma | 0 (0.0%) | 0.0 |
| College or Associate's Degree | 0 (0.0%) | 0.0 |
| Bachelor's Degree | 47 (65.3%) | 370.0 |
| Graduate Degree | 25 (34.7%) | 106.0 |
| Total | 72 (100.0%) | 139.0 |
Fertility by Education by Marriage Status in Churchill borough
16.7% of women with births in Churchill borough are unmarried. Women with the educational attainment of graduate degree are most likely to be married with 100.0% of them married at childbirth, while women with the educational attainment of bachelor's degree are least likely to be married with 25.5% of them unmarried at childbirth.
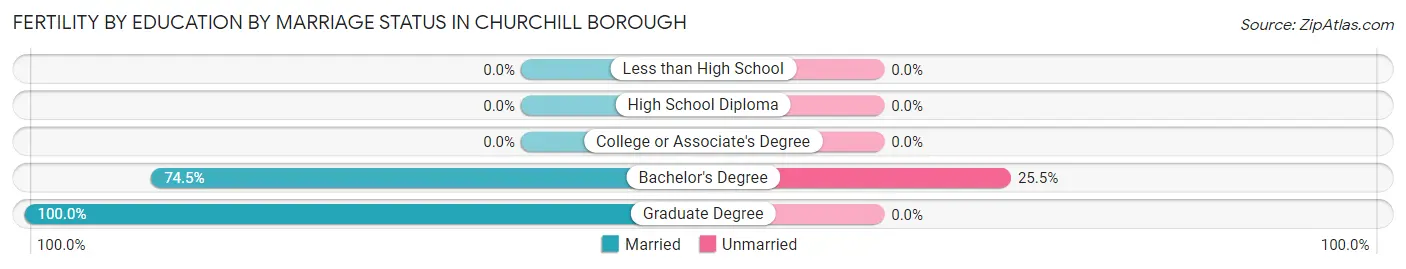
| Educational Attainment | Married | Unmarried |
| Less than High School | 0 (0.0%) | 0 (0.0%) |
| High School Diploma | 0 (0.0%) | 0 (0.0%) |
| College or Associate's Degree | 0 (0.0%) | 0 (0.0%) |
| Bachelor's Degree | 35 (74.5%) | 12 (25.5%) |
| Graduate Degree | 25 (100.0%) | 0 (0.0%) |
| Total | 60 (83.3%) | 12 (16.7%) |
Income in Churchill borough
Income Overview in Churchill borough
Per Capita Income in Churchill borough is $53,203, while median incomes of families and households are $118,137 and $102,216 respectively.
| Characteristic | Number | Measure |
| Per Capita Income | 3,127 | $53,203 |
| Median Family Income | 895 | $118,137 |
| Mean Family Income | 895 | $140,151 |
| Median Household Income | 1,311 | $102,216 |
| Mean Household Income | 1,311 | $125,111 |
| Income Deficit | 895 | $0 |
| Wage / Income Gap (%) | 3,127 | 39.34% |
| Wage / Income Gap ($) | 3,127 | 60.66¢ per $1 |
| Gini / Inequality Index | 3,127 | 0.37 |
Earnings by Sex in Churchill borough
Average Earnings in Churchill borough are $58,254, $68,002 for men and $41,250 for women, a difference of 39.3%.
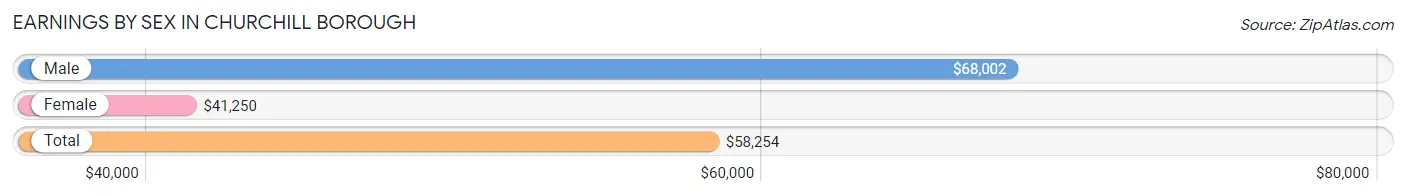
| Sex | Number | Average Earnings |
| Male | 897 (54.6%) | $68,002 |
| Female | 746 (45.4%) | $41,250 |
| Total | 1,643 (100.0%) | $58,254 |
Earnings by Sex by Income Bracket in Churchill borough
The most common earnings brackets in Churchill borough are $100,000+ for men (253 | 28.2%) and $100,000+ for women (129 | 17.3%).
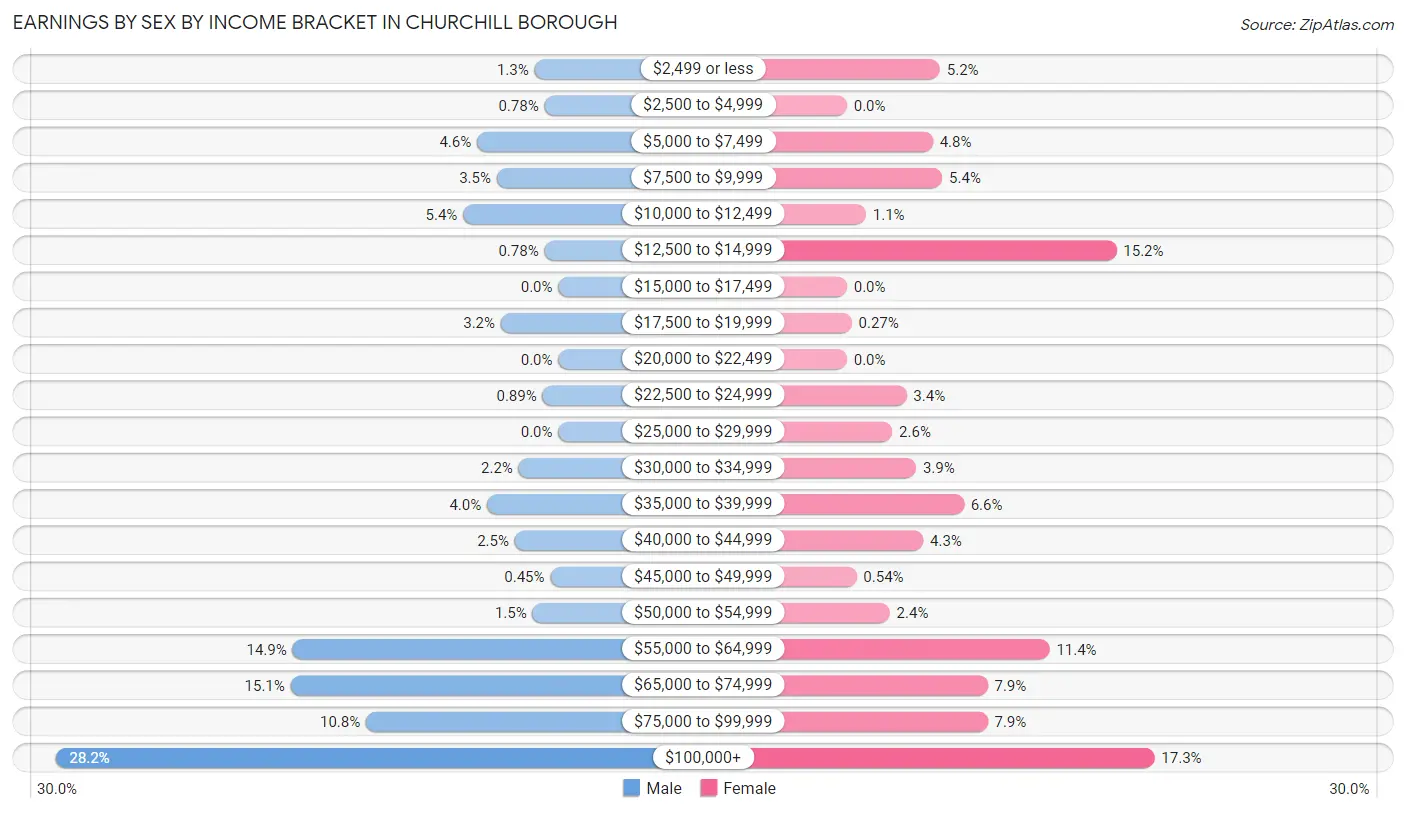
| Income | Male | Female |
| $2,499 or less | 12 (1.3%) | 39 (5.2%) |
| $2,500 to $4,999 | 7 (0.8%) | 0 (0.0%) |
| $5,000 to $7,499 | 41 (4.6%) | 36 (4.8%) |
| $7,500 to $9,999 | 31 (3.5%) | 40 (5.4%) |
| $10,000 to $12,499 | 48 (5.3%) | 8 (1.1%) |
| $12,500 to $14,999 | 7 (0.8%) | 113 (15.1%) |
| $15,000 to $17,499 | 0 (0.0%) | 0 (0.0%) |
| $17,500 to $19,999 | 29 (3.2%) | 2 (0.3%) |
| $20,000 to $22,499 | 0 (0.0%) | 0 (0.0%) |
| $22,500 to $24,999 | 8 (0.9%) | 25 (3.4%) |
| $25,000 to $29,999 | 0 (0.0%) | 19 (2.5%) |
| $30,000 to $34,999 | 20 (2.2%) | 29 (3.9%) |
| $35,000 to $39,999 | 36 (4.0%) | 49 (6.6%) |
| $40,000 to $44,999 | 22 (2.5%) | 32 (4.3%) |
| $45,000 to $49,999 | 4 (0.4%) | 4 (0.5%) |
| $50,000 to $54,999 | 13 (1.5%) | 18 (2.4%) |
| $55,000 to $64,999 | 134 (14.9%) | 85 (11.4%) |
| $65,000 to $74,999 | 135 (15.0%) | 59 (7.9%) |
| $75,000 to $99,999 | 97 (10.8%) | 59 (7.9%) |
| $100,000+ | 253 (28.2%) | 129 (17.3%) |
| Total | 897 (100.0%) | 746 (100.0%) |
Earnings by Sex by Educational Attainment in Churchill borough
Average earnings in Churchill borough are $68,605 for men and $45,625 for women, a difference of 33.5%. Men with an educational attainment of bachelor's degree enjoy the highest average annual earnings of $131,250, while those with college or associate's degree education earn the least with $56,336. Women with an educational attainment of graduate degree earn the most with the average annual earnings of $73,688, while those with college or associate's degree education have the smallest earnings of $37,981.
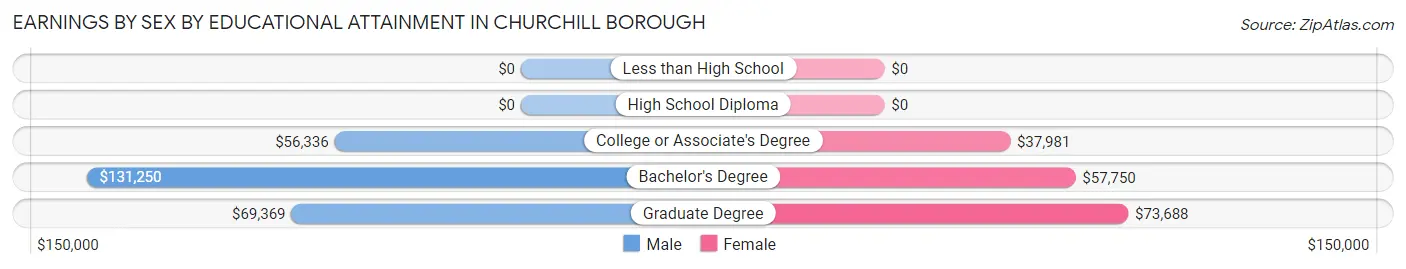
| Educational Attainment | Male Income | Female Income |
| Less than High School | - | - |
| High School Diploma | - | - |
| College or Associate's Degree | $56,336 | $37,981 |
| Bachelor's Degree | $131,250 | $57,750 |
| Graduate Degree | $69,369 | $73,688 |
| Total | $68,605 | $45,625 |
Family Income in Churchill borough
Family Income Brackets in Churchill borough
According to the Churchill borough family income data, there are 199 families falling into the $100,000 to $149,999 income range, which is the most common income bracket and makes up 22.2% of all families.
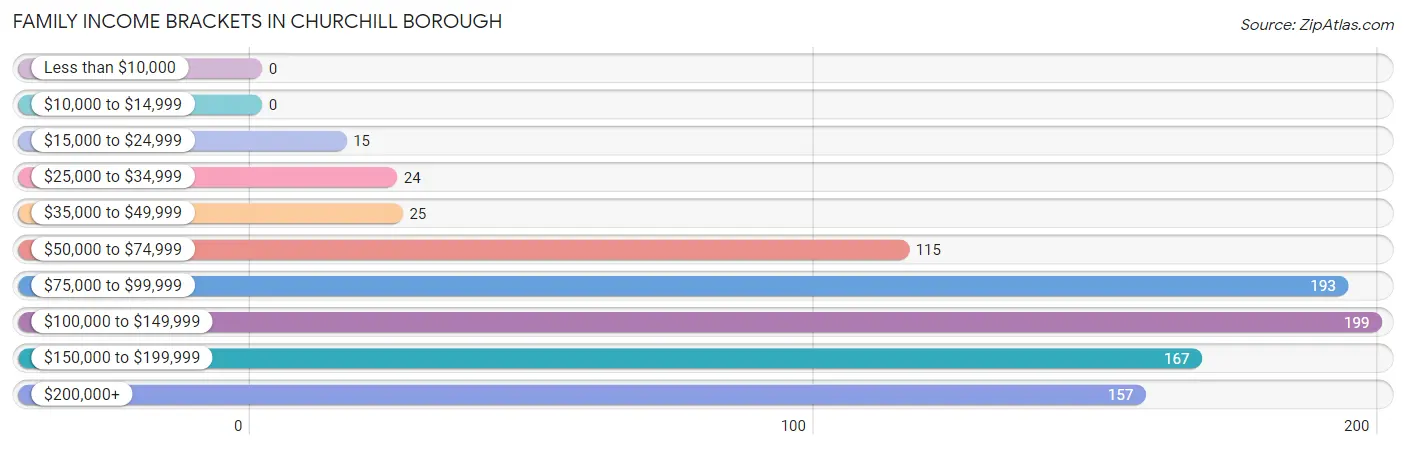
| Income Bracket | # Families | % Families |
| Less than $10,000 | 0 | 0.0% |
| $10,000 to $14,999 | 0 | 0.0% |
| $15,000 to $24,999 | 15 | 1.7% |
| $25,000 to $34,999 | 24 | 2.7% |
| $35,000 to $49,999 | 25 | 2.8% |
| $50,000 to $74,999 | 115 | 12.8% |
| $75,000 to $99,999 | 193 | 21.6% |
| $100,000 to $149,999 | 199 | 22.2% |
| $150,000 to $199,999 | 167 | 18.7% |
| $200,000+ | 157 | 17.5% |
Family Income by Famaliy Size in Churchill borough
2-person families (540 | 60.3%) account for the highest median family income in Churchill borough with $118,585 per family, while 2-person families (540 | 60.3%) have the highest median income of $59,292 per family member.
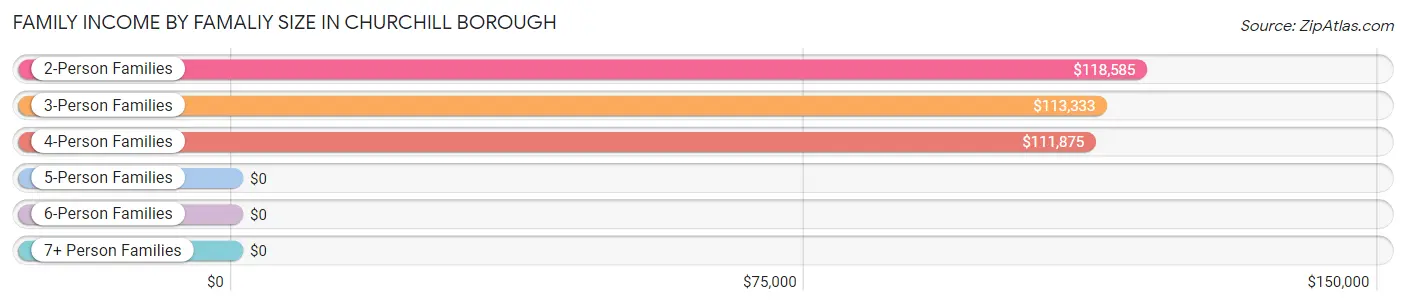
| Income Bracket | # Families | Median Income |
| 2-Person Families | 540 (60.3%) | $118,585 |
| 3-Person Families | 162 (18.1%) | $113,333 |
| 4-Person Families | 182 (20.3%) | $111,875 |
| 5-Person Families | 11 (1.2%) | $0 |
| 6-Person Families | 0 (0.0%) | $0 |
| 7+ Person Families | 0 (0.0%) | $0 |
| Total | 895 (100.0%) | $118,137 |
Family Income by Number of Earners in Churchill borough
The median family income in Churchill borough is $118,137, with families comprising 2 earners (413) having the highest median family income of $137,411, while families with no earners (153) have the lowest median family income of $79,519, accounting for 46.2% and 17.1% of families, respectively.
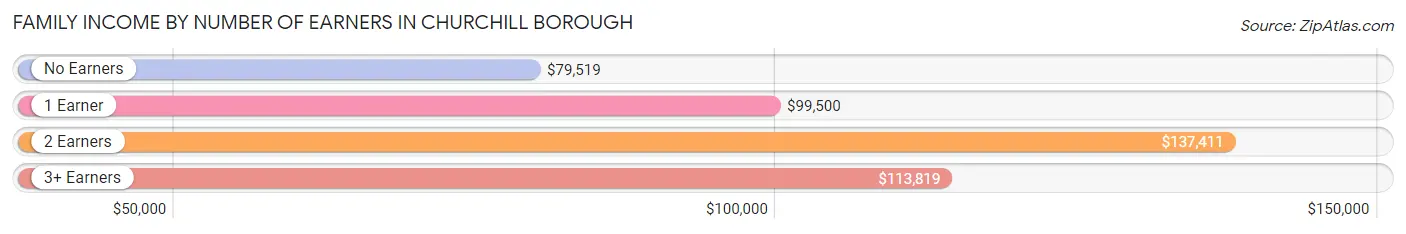
| Number of Earners | # Families | Median Income |
| No Earners | 153 (17.1%) | $79,519 |
| 1 Earner | 290 (32.4%) | $99,500 |
| 2 Earners | 413 (46.2%) | $137,411 |
| 3+ Earners | 39 (4.4%) | $113,819 |
| Total | 895 (100.0%) | $118,137 |
Household Income in Churchill borough
Household Income Brackets in Churchill borough
With 305 households falling in the category, the $100,000 to $149,999 income range is the most frequent in Churchill borough, accounting for 23.3% of all households.
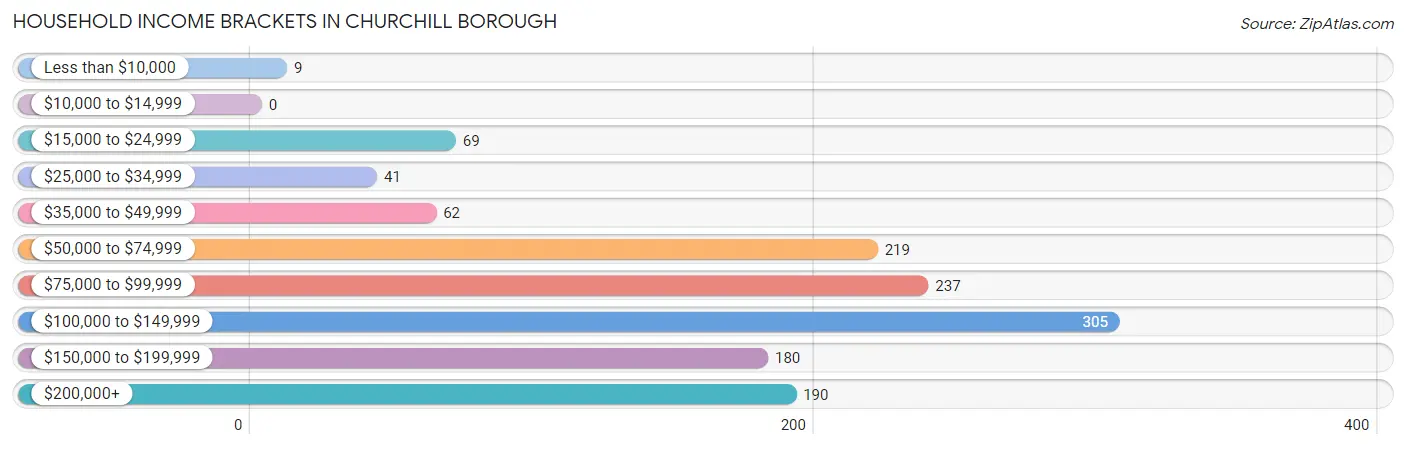
| Income Bracket | # Households | % Households |
| Less than $10,000 | 9 | 0.7% |
| $10,000 to $14,999 | 0 | 0.0% |
| $15,000 to $24,999 | 69 | 5.3% |
| $25,000 to $34,999 | 41 | 3.1% |
| $35,000 to $49,999 | 62 | 4.7% |
| $50,000 to $74,999 | 219 | 16.7% |
| $75,000 to $99,999 | 237 | 18.1% |
| $100,000 to $149,999 | 305 | 23.3% |
| $150,000 to $199,999 | 180 | 13.7% |
| $200,000+ | 190 | 14.5% |
Household Income by Householder Age in Churchill borough
The median household income in Churchill borough is $102,216, with the highest median household income of $111,136 found in the 25 to 44 years age bracket for the primary householder. A total of 398 households (30.4%) fall into this category.
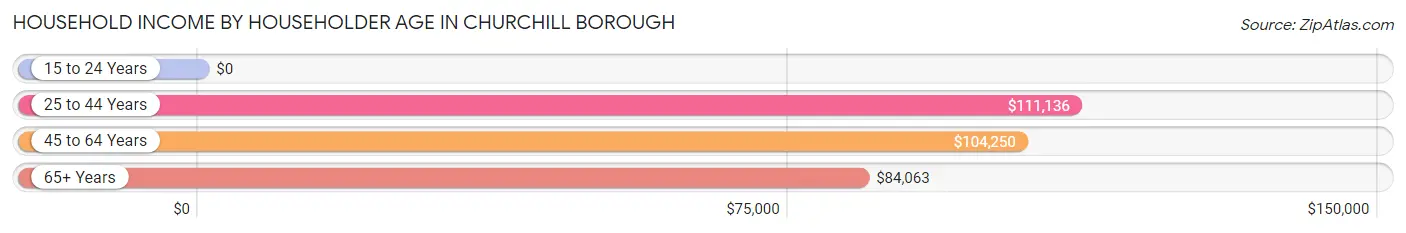
| Income Bracket | # Households | Median Income |
| 15 to 24 Years | 0 (0.0%) | $0 |
| 25 to 44 Years | 398 (30.4%) | $111,136 |
| 45 to 64 Years | 429 (32.7%) | $104,250 |
| 65+ Years | 484 (36.9%) | $84,063 |
| Total | 1,311 (100.0%) | $102,216 |
Poverty in Churchill borough
Income Below Poverty by Sex and Age in Churchill borough
With 3.7% poverty level for males and 2.9% for females among the residents of Churchill borough, 16 and 17 year old males and 25 to 34 year old females are the most vulnerable to poverty, with 16 males (51.6%) and 31 females (19.9%) in their respective age groups living below the poverty level.
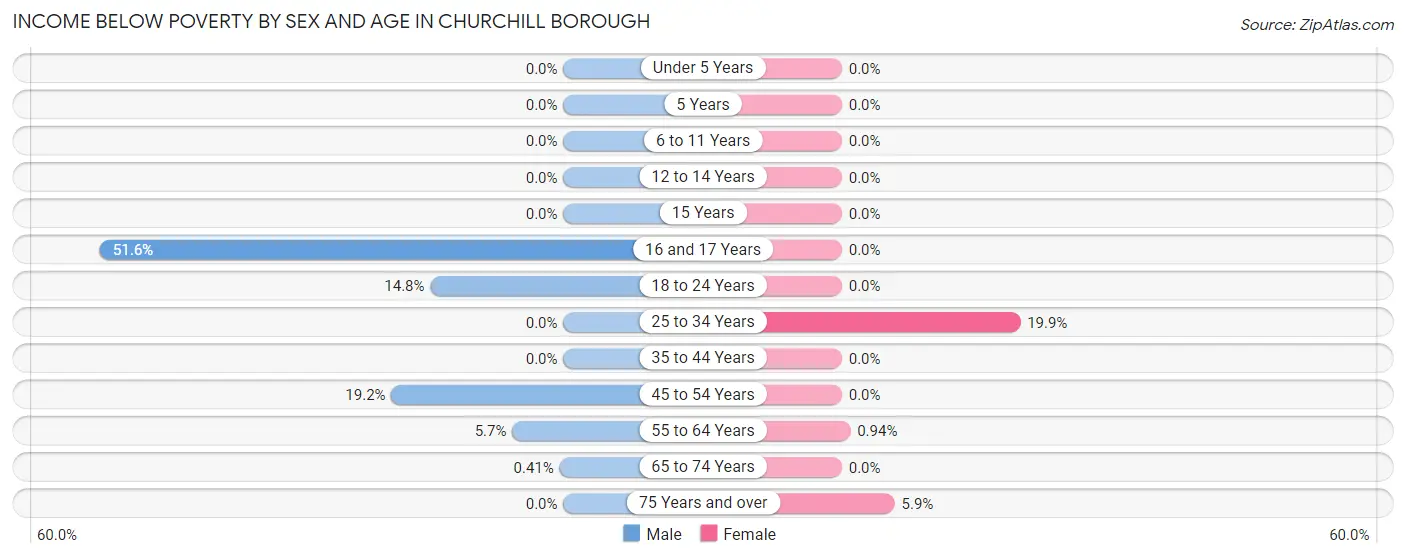
| Age Bracket | Male | Female |
| Under 5 Years | 0 (0.0%) | 0 (0.0%) |
| 5 Years | 0 (0.0%) | 0 (0.0%) |
| 6 to 11 Years | 0 (0.0%) | 0 (0.0%) |
| 12 to 14 Years | 0 (0.0%) | 0 (0.0%) |
| 15 Years | 0 (0.0%) | 0 (0.0%) |
| 16 and 17 Years | 16 (51.6%) | 0 (0.0%) |
| 18 to 24 Years | 4 (14.8%) | 0 (0.0%) |
| 25 to 34 Years | 0 (0.0%) | 31 (19.9%) |
| 35 to 44 Years | 0 (0.0%) | 0 (0.0%) |
| 45 to 54 Years | 18 (19.2%) | 0 (0.0%) |
| 55 to 64 Years | 16 (5.7%) | 2 (0.9%) |
| 65 to 74 Years | 1 (0.4%) | 0 (0.0%) |
| 75 Years and over | 0 (0.0%) | 12 (5.9%) |
| Total | 55 (3.7%) | 45 (2.9%) |
Income Above Poverty by Sex and Age in Churchill borough
According to the poverty statistics in Churchill borough, males aged under 5 years and females aged under 5 years are the age groups that are most secure financially, with 100.0% of males and 100.0% of females in these age groups living above the poverty line.
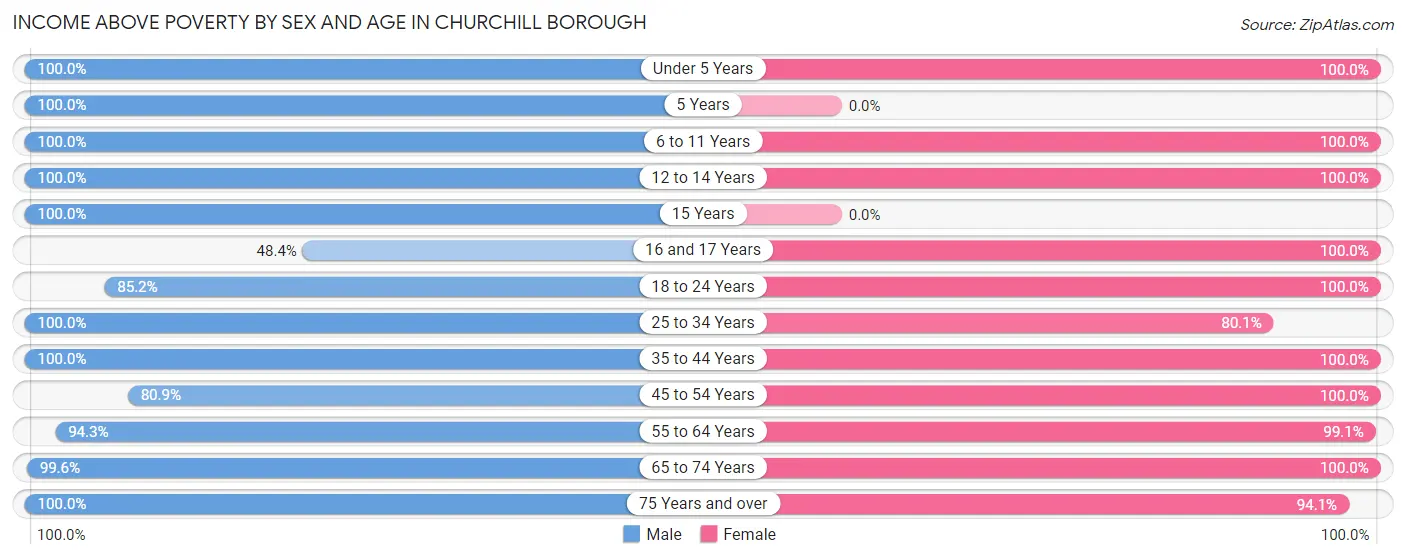
| Age Bracket | Male | Female |
| Under 5 Years | 187 (100.0%) | 204 (100.0%) |
| 5 Years | 5 (100.0%) | 0 (0.0%) |
| 6 to 11 Years | 27 (100.0%) | 39 (100.0%) |
| 12 to 14 Years | 12 (100.0%) | 28 (100.0%) |
| 15 Years | 32 (100.0%) | 0 (0.0%) |
| 16 and 17 Years | 15 (48.4%) | 44 (100.0%) |
| 18 to 24 Years | 23 (85.2%) | 14 (100.0%) |
| 25 to 34 Years | 237 (100.0%) | 125 (80.1%) |
| 35 to 44 Years | 152 (100.0%) | 254 (100.0%) |
| 45 to 54 Years | 76 (80.8%) | 117 (100.0%) |
| 55 to 64 Years | 265 (94.3%) | 211 (99.1%) |
| 65 to 74 Years | 245 (99.6%) | 265 (100.0%) |
| 75 Years and over | 167 (100.0%) | 192 (94.1%) |
| Total | 1,443 (96.3%) | 1,493 (97.1%) |
Income Below Poverty Among Married-Couple Families in Churchill borough
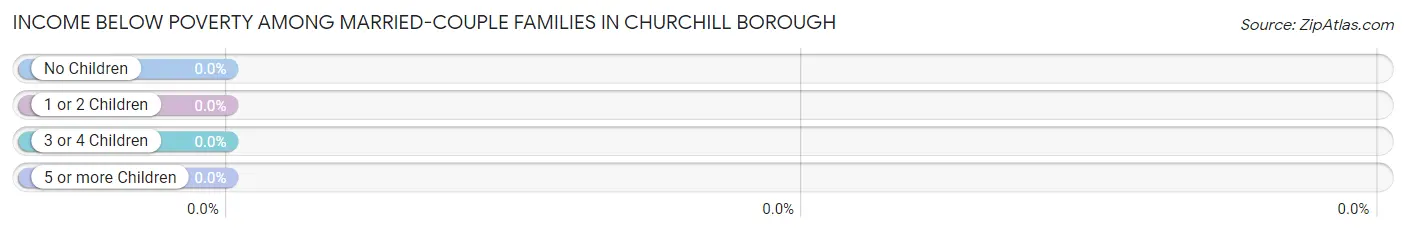
| Children | Above Poverty | Below Poverty |
| No Children | 491 (100.0%) | 0 (0.0%) |
| 1 or 2 Children | 264 (100.0%) | 0 (0.0%) |
| 3 or 4 Children | 11 (100.0%) | 0 (0.0%) |
| 5 or more Children | 0 (0.0%) | 0 (0.0%) |
| Total | 766 (100.0%) | 0 (0.0%) |
Income Below Poverty Among Single-Parent Households in Churchill borough
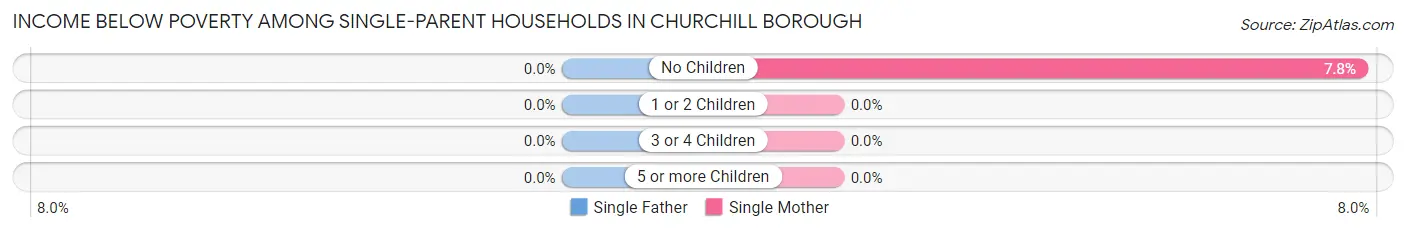
| Children | Single Father | Single Mother |
| No Children | 0 (0.0%) | 5 (7.8%) |
| 1 or 2 Children | 0 (0.0%) | 0 (0.0%) |
| 3 or 4 Children | 0 (0.0%) | 0 (0.0%) |
| 5 or more Children | 0 (0.0%) | 0 (0.0%) |
| Total | 0 (0.0%) | 5 (5.8%) |
Income Below Poverty Among Married-Couple vs Single-Parent Households in Churchill borough
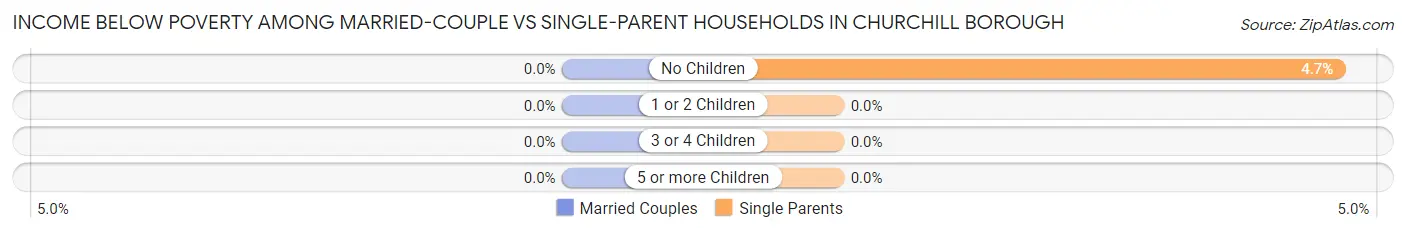
| Children | Married-Couple Families | Single-Parent Households |
| No Children | 0 (0.0%) | 5 (4.7%) |
| 1 or 2 Children | 0 (0.0%) | 0 (0.0%) |
| 3 or 4 Children | 0 (0.0%) | 0 (0.0%) |
| 5 or more Children | 0 (0.0%) | 0 (0.0%) |
| Total | 0 (0.0%) | 5 (3.9%) |
Employment Characteristics in Churchill borough
Employment by Class of Employer in Churchill borough
Among the 1,554 employed individuals in Churchill borough, private company employees (837 | 53.9%), not-for-profit organizations (393 | 25.3%), and self-employed (not incorporated) (106 | 6.8%) make up the most common classes of employment.
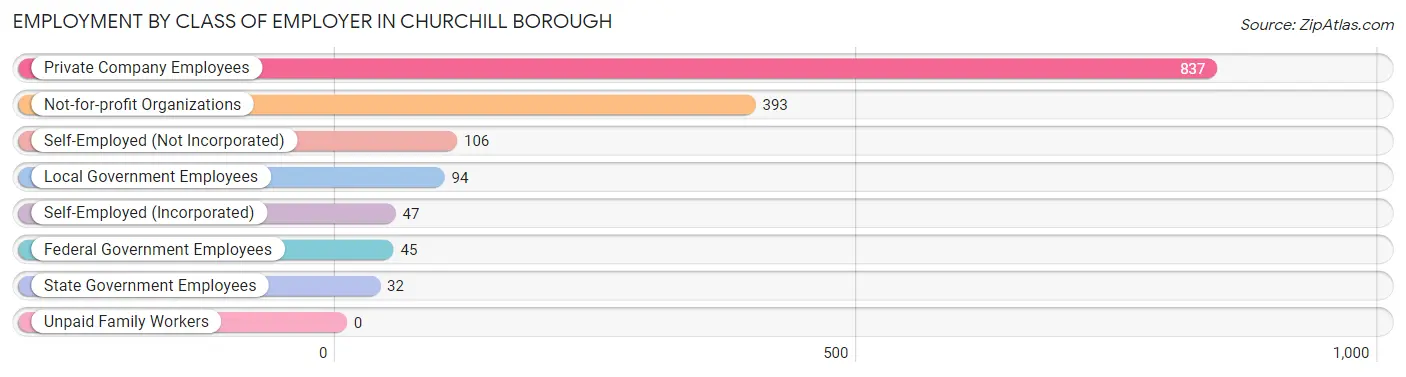
| Employer Class | # Employees | % Employees |
| Private Company Employees | 837 | 53.9% |
| Self-Employed (Incorporated) | 47 | 3.0% |
| Self-Employed (Not Incorporated) | 106 | 6.8% |
| Not-for-profit Organizations | 393 | 25.3% |
| Local Government Employees | 94 | 6.0% |
| State Government Employees | 32 | 2.1% |
| Federal Government Employees | 45 | 2.9% |
| Unpaid Family Workers | 0 | 0.0% |
| Total | 1,554 | 100.0% |
Employment Status by Age in Churchill borough
According to the labor force statistics for Churchill borough, out of the total population over 16 years of age (2,502), 67.3% or 1,684 individuals are in the labor force, with 6.6% or 111 of them unemployed. The age group with the highest labor force participation rate is 20 to 24 years, with 100.0% or 37 individuals in the labor force. Within the labor force, the 20 to 24 years age range has the highest percentage of unemployed individuals, with 62.2% or 23 of them being unemployed.
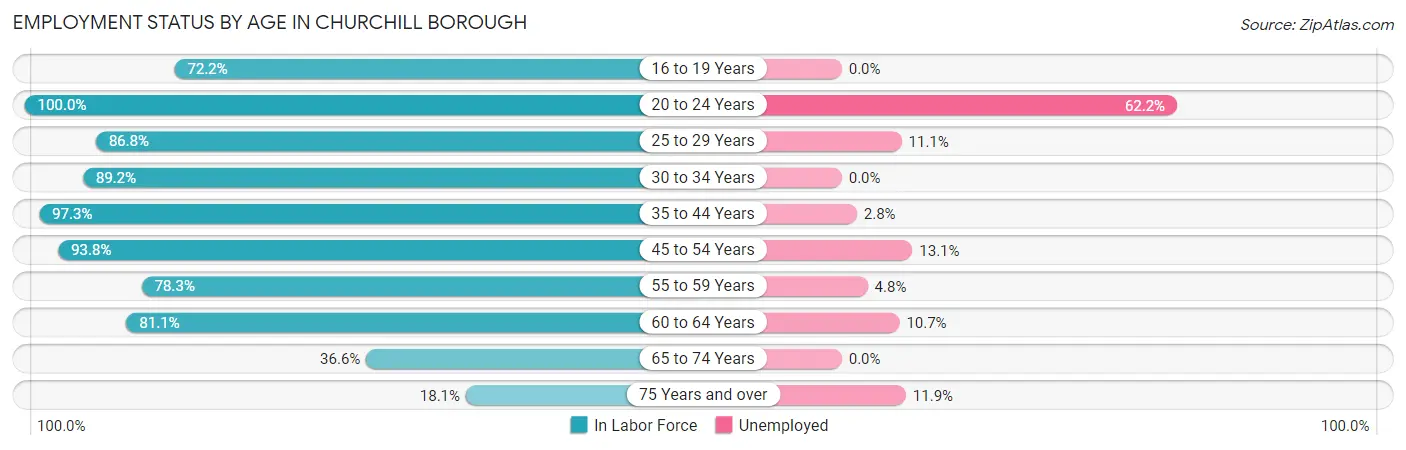
| Age Bracket | In Labor Force | Unemployed |
| 16 to 19 Years | 57 (72.2%) | 0 (0.0%) |
| 20 to 24 Years | 37 (100.0%) | 23 (62.2%) |
| 25 to 29 Years | 99 (86.8%) | 11 (11.1%) |
| 30 to 34 Years | 249 (89.2%) | 0 (0.0%) |
| 35 to 44 Years | 395 (97.3%) | 11 (2.8%) |
| 45 to 54 Years | 198 (93.8%) | 26 (13.1%) |
| 55 to 59 Years | 188 (78.3%) | 9 (4.8%) |
| 60 to 64 Years | 206 (81.1%) | 22 (10.7%) |
| 65 to 74 Years | 187 (36.6%) | 0 (0.0%) |
| 75 Years and over | 67 (18.1%) | 8 (11.9%) |
| Total | 1,684 (67.3%) | 111 (6.6%) |
Employment Status by Educational Attainment in Churchill borough
According to labor force statistics for Churchill borough, 88.8% of individuals (1,336) out of the total population between 25 and 64 years of age (1,504) are in the labor force, with 6.0% or 80 of them being unemployed. The group with the highest labor force participation rate are those with the educational attainment of college / associate degree, with 95.6% or 239 individuals in the labor force. Within the labor force, individuals with high school diploma education have the highest percentage of unemployment, with 17.4% or 28 of them being unemployed.
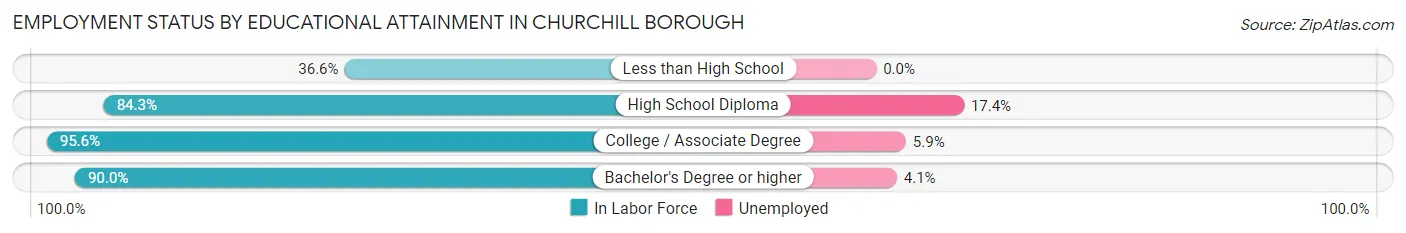
| Educational Attainment | In Labor Force | Unemployed |
| Less than High School | 15 (36.6%) | 0 (0.0%) |
| High School Diploma | 161 (84.3%) | 33 (17.4%) |
| College / Associate Degree | 239 (95.6%) | 15 (5.9%) |
| Bachelor's Degree or higher | 920 (90.0%) | 42 (4.1%) |
| Total | 1,336 (88.8%) | 90 (6.0%) |
Employment Occupations by Sex in Churchill borough
Management, Business, Science and Arts Occupations
The most common Management, Business, Science and Arts occupations in Churchill borough are Computers, Engineering & Science (281 | 18.0%), Management (224 | 14.3%), Community & Social Service (215 | 13.8%), Health Diagnosing & Treating (155 | 9.9%), and Computers & Mathematics (140 | 9.0%).
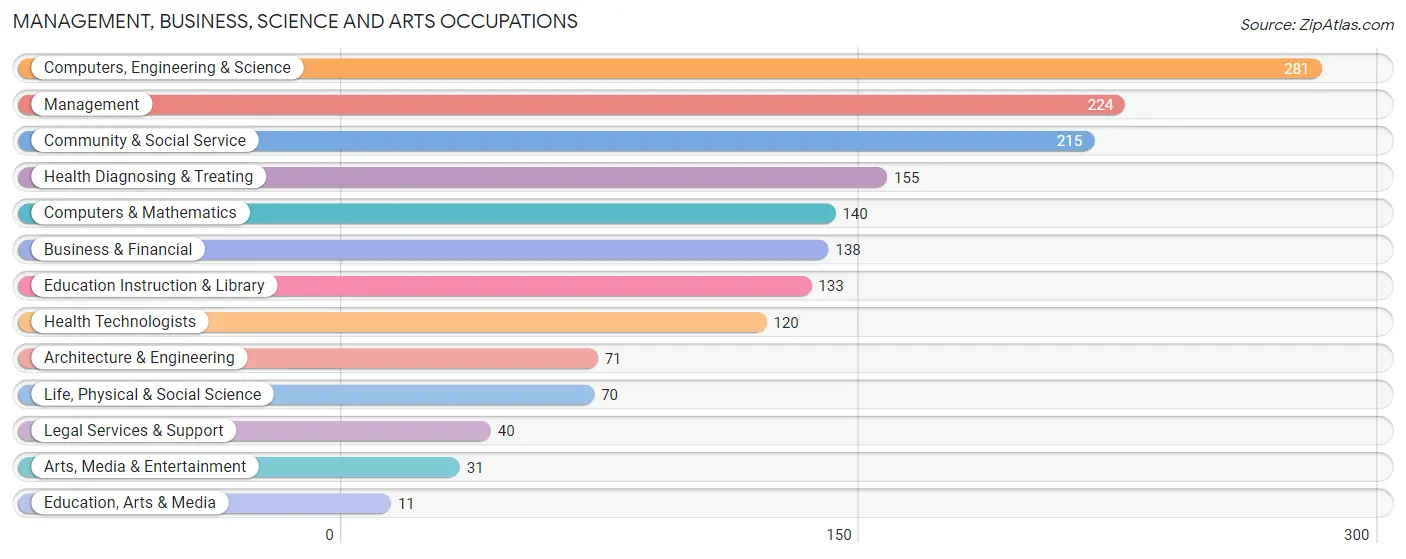
Management, Business, Science and Arts Occupations by Sex
Within the Management, Business, Science and Arts occupations in Churchill borough, the most male-oriented occupations are Architecture & Engineering (100.0%), Life, Physical & Social Science (91.4%), and Education Instruction & Library (78.2%), while the most female-oriented occupations are Health Diagnosing & Treating (83.9%), Arts, Media & Entertainment (80.6%), and Health Technologists (79.2%).
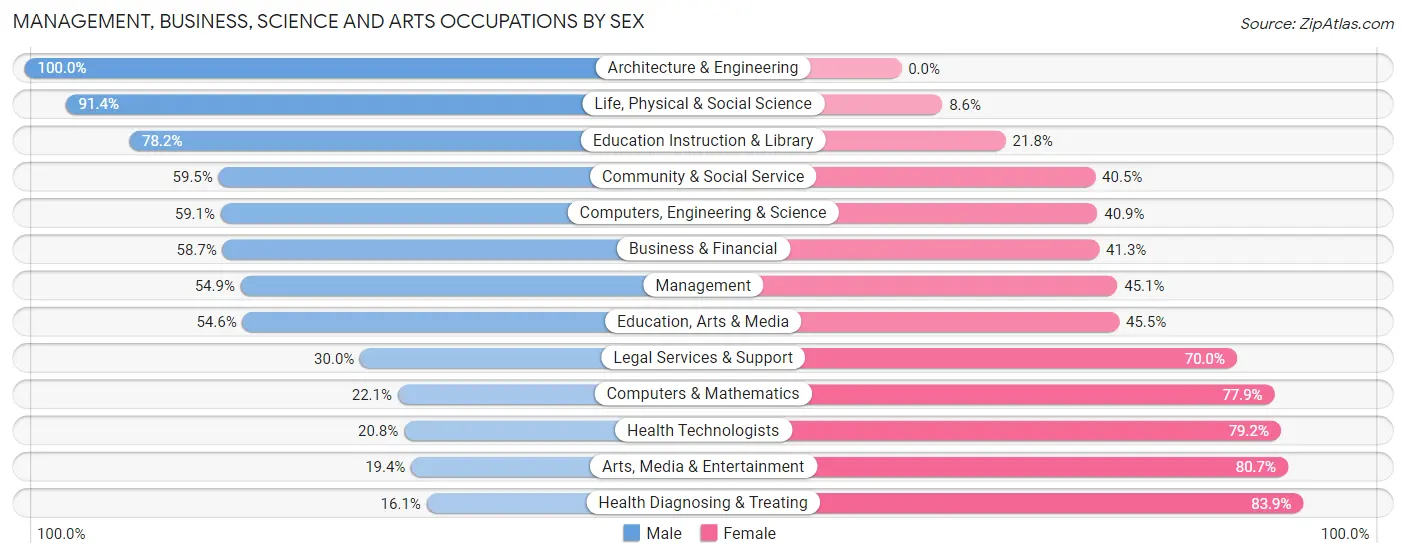
| Occupation | Male | Female |
| Management | 123 (54.9%) | 101 (45.1%) |
| Business & Financial | 81 (58.7%) | 57 (41.3%) |
| Computers, Engineering & Science | 166 (59.1%) | 115 (40.9%) |
| Computers & Mathematics | 31 (22.1%) | 109 (77.9%) |
| Architecture & Engineering | 71 (100.0%) | 0 (0.0%) |
| Life, Physical & Social Science | 64 (91.4%) | 6 (8.6%) |
| Community & Social Service | 128 (59.5%) | 87 (40.5%) |
| Education, Arts & Media | 6 (54.5%) | 5 (45.5%) |
| Legal Services & Support | 12 (30.0%) | 28 (70.0%) |
| Education Instruction & Library | 104 (78.2%) | 29 (21.8%) |
| Arts, Media & Entertainment | 6 (19.4%) | 25 (80.6%) |
| Health Diagnosing & Treating | 25 (16.1%) | 130 (83.9%) |
| Health Technologists | 25 (20.8%) | 95 (79.2%) |
| Total (Category) | 523 (51.6%) | 490 (48.4%) |
| Total (Overall) | 852 (54.6%) | 709 (45.4%) |
Services Occupations
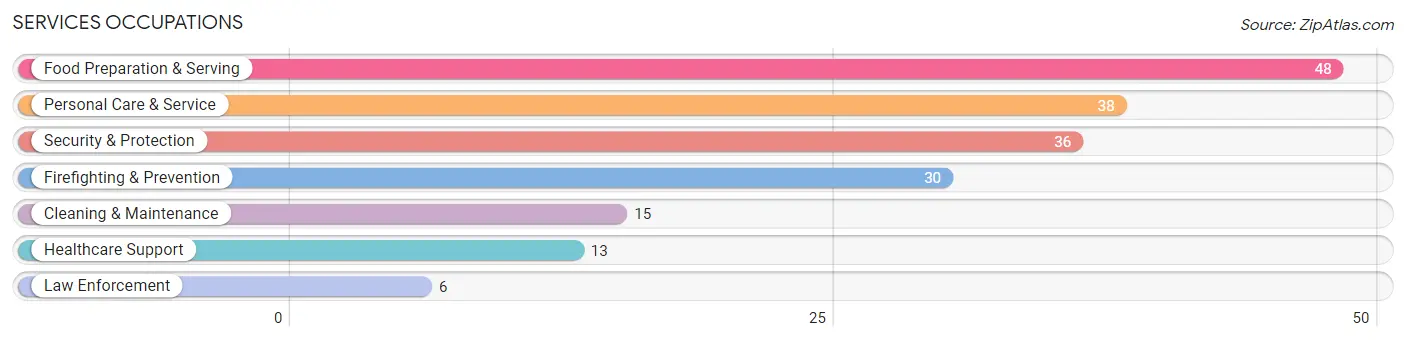
The most common Services occupations in Churchill borough are Food Preparation & Serving (48 | 3.1%), Personal Care & Service (38 | 2.4%), Security & Protection (36 | 2.3%), Firefighting & Prevention (30 | 1.9%), and Cleaning & Maintenance (15 | 1.0%).
Services Occupations by Sex
Within the Services occupations in Churchill borough, the most male-oriented occupations are Security & Protection (100.0%), Firefighting & Prevention (100.0%), and Law Enforcement (100.0%), while the most female-oriented occupations are Healthcare Support (100.0%), Personal Care & Service (100.0%), and Food Preparation & Serving (81.2%).
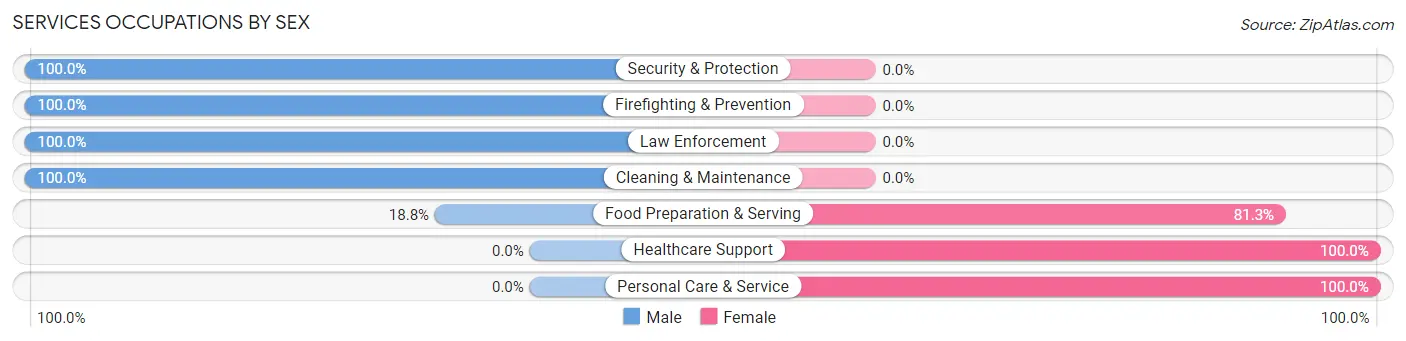
| Occupation | Male | Female |
| Healthcare Support | 0 (0.0%) | 13 (100.0%) |
| Security & Protection | 36 (100.0%) | 0 (0.0%) |
| Firefighting & Prevention | 30 (100.0%) | 0 (0.0%) |
| Law Enforcement | 6 (100.0%) | 0 (0.0%) |
| Food Preparation & Serving | 9 (18.8%) | 39 (81.2%) |
| Cleaning & Maintenance | 15 (100.0%) | 0 (0.0%) |
| Personal Care & Service | 0 (0.0%) | 38 (100.0%) |
| Total (Category) | 60 (40.0%) | 90 (60.0%) |
| Total (Overall) | 852 (54.6%) | 709 (45.4%) |
Sales and Office Occupations
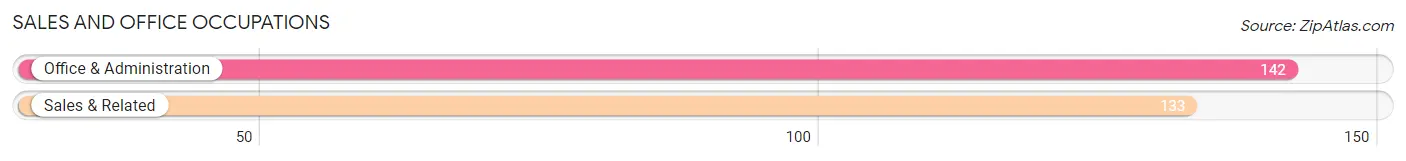
The most common Sales and Office occupations in Churchill borough are Office & Administration (142 | 9.1%), and Sales & Related (133 | 8.5%).
Sales and Office Occupations by Sex
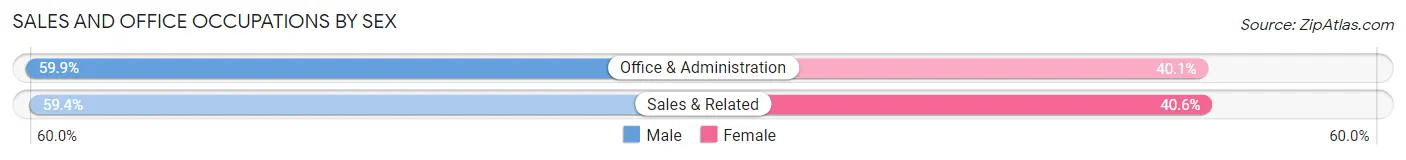
| Occupation | Male | Female |
| Sales & Related | 79 (59.4%) | 54 (40.6%) |
| Office & Administration | 85 (59.9%) | 57 (40.1%) |
| Total (Category) | 164 (59.6%) | 111 (40.4%) |
| Total (Overall) | 852 (54.6%) | 709 (45.4%) |
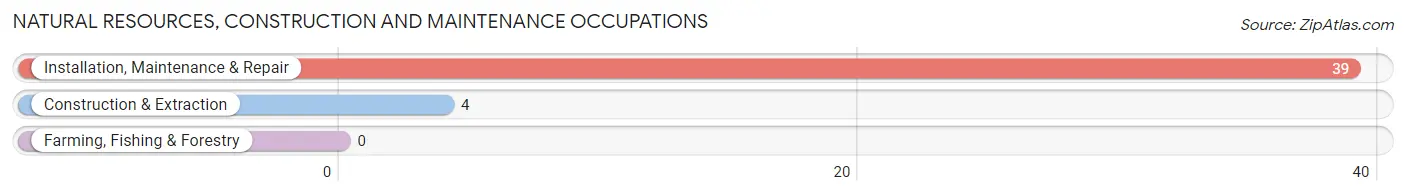
Natural Resources, Construction and Maintenance Occupations
The most common Natural Resources, Construction and Maintenance occupations in Churchill borough are Installation, Maintenance & Repair (39 | 2.5%), and Construction & Extraction (4 | 0.3%).
Natural Resources, Construction and Maintenance Occupations by Sex
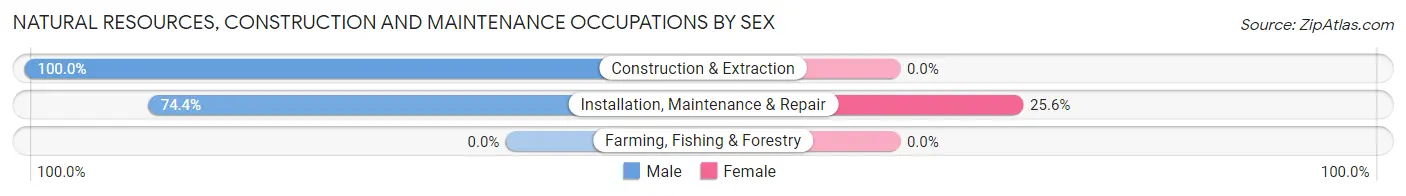
| Occupation | Male | Female |
| Farming, Fishing & Forestry | 0 (0.0%) | 0 (0.0%) |
| Construction & Extraction | 4 (100.0%) | 0 (0.0%) |
| Installation, Maintenance & Repair | 29 (74.4%) | 10 (25.6%) |
| Total (Category) | 33 (76.7%) | 10 (23.3%) |
| Total (Overall) | 852 (54.6%) | 709 (45.4%) |
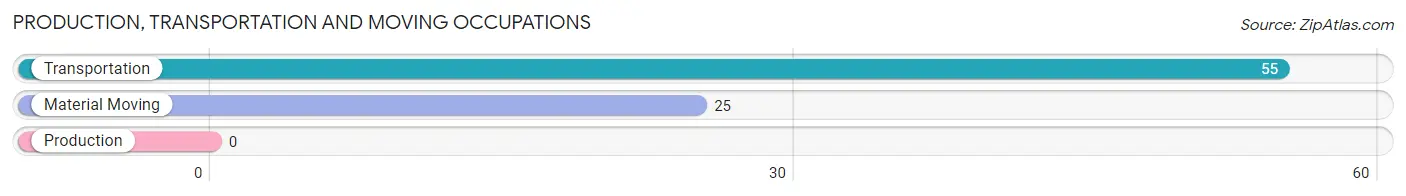
Production, Transportation and Moving Occupations
The most common Production, Transportation and Moving occupations in Churchill borough are Transportation (55 | 3.5%), and Material Moving (25 | 1.6%).
Production, Transportation and Moving Occupations by Sex
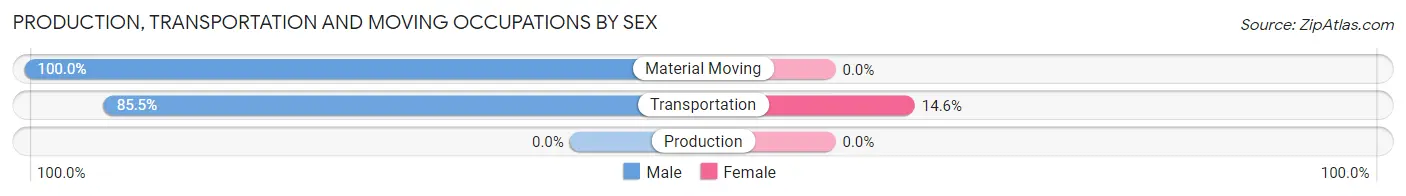
| Occupation | Male | Female |
| Production | 0 (0.0%) | 0 (0.0%) |
| Transportation | 47 (85.5%) | 8 (14.5%) |
| Material Moving | 25 (100.0%) | 0 (0.0%) |
| Total (Category) | 72 (90.0%) | 8 (10.0%) |
| Total (Overall) | 852 (54.6%) | 709 (45.4%) |
Employment Industries by Sex in Churchill borough
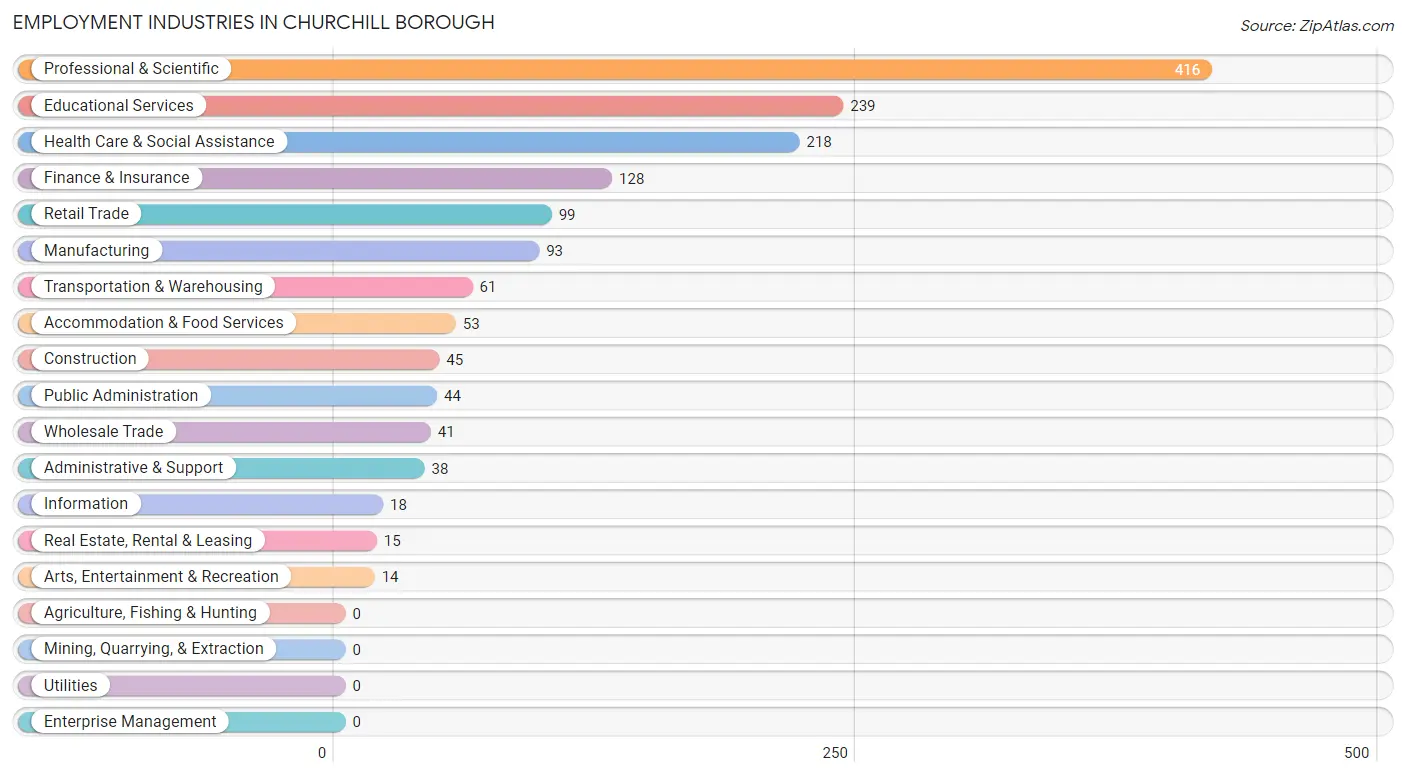
Employment Industries in Churchill borough
The major employment industries in Churchill borough include Professional & Scientific (416 | 26.7%), Educational Services (239 | 15.3%), Health Care & Social Assistance (218 | 14.0%), Finance & Insurance (128 | 8.2%), and Retail Trade (99 | 6.3%).
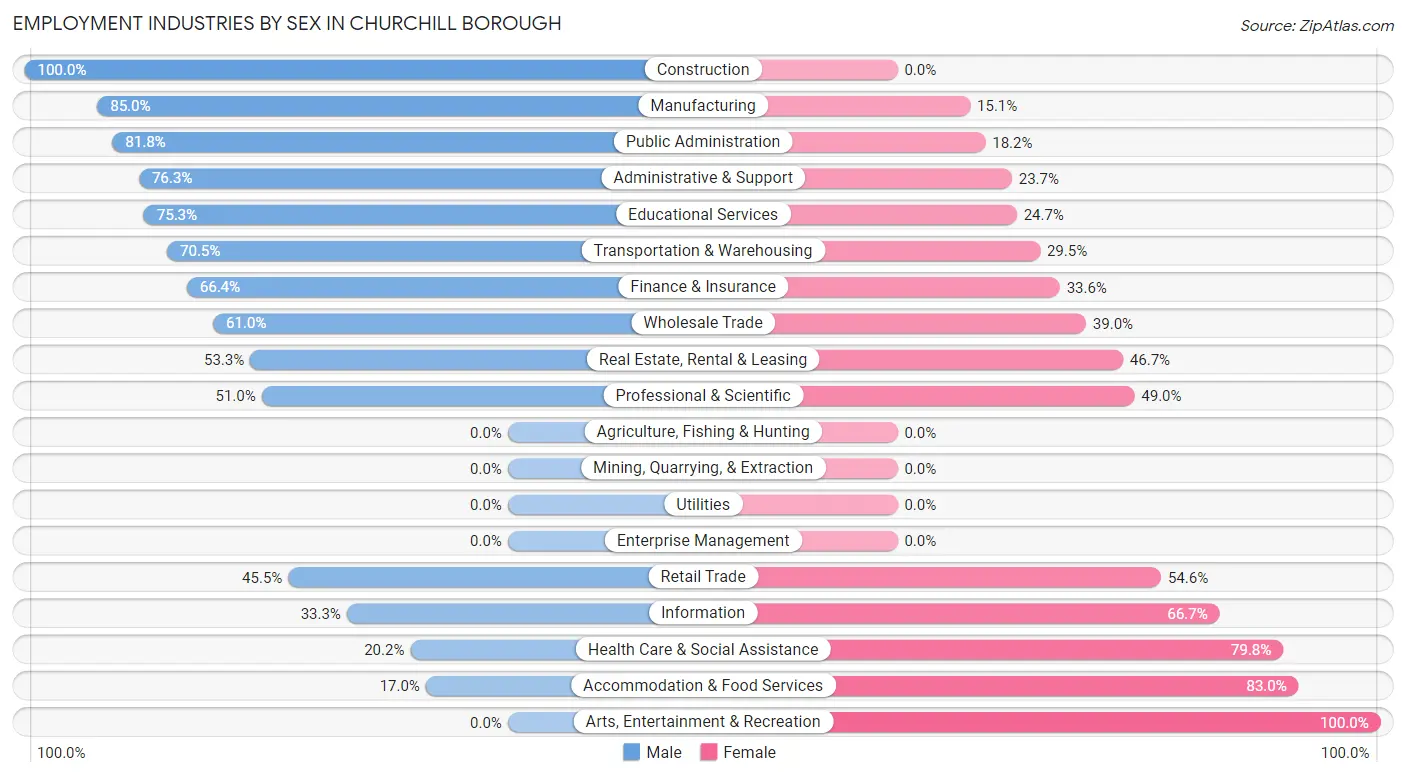
Employment Industries by Sex in Churchill borough
The Churchill borough industries that see more men than women are Construction (100.0%), Manufacturing (85.0%), and Public Administration (81.8%), whereas the industries that tend to have a higher number of women are Arts, Entertainment & Recreation (100.0%), Accommodation & Food Services (83.0%), and Health Care & Social Assistance (79.8%).
| Industry | Male | Female |
| Agriculture, Fishing & Hunting | 0 (0.0%) | 0 (0.0%) |
| Mining, Quarrying, & Extraction | 0 (0.0%) | 0 (0.0%) |
| Construction | 45 (100.0%) | 0 (0.0%) |
| Manufacturing | 79 (85.0%) | 14 (15.0%) |
| Wholesale Trade | 25 (61.0%) | 16 (39.0%) |
| Retail Trade | 45 (45.5%) | 54 (54.5%) |
| Transportation & Warehousing | 43 (70.5%) | 18 (29.5%) |
| Utilities | 0 (0.0%) | 0 (0.0%) |
| Information | 6 (33.3%) | 12 (66.7%) |
| Finance & Insurance | 85 (66.4%) | 43 (33.6%) |
| Real Estate, Rental & Leasing | 8 (53.3%) | 7 (46.7%) |
| Professional & Scientific | 212 (51.0%) | 204 (49.0%) |
| Enterprise Management | 0 (0.0%) | 0 (0.0%) |
| Administrative & Support | 29 (76.3%) | 9 (23.7%) |
| Educational Services | 180 (75.3%) | 59 (24.7%) |
| Health Care & Social Assistance | 44 (20.2%) | 174 (79.8%) |
| Arts, Entertainment & Recreation | 0 (0.0%) | 14 (100.0%) |
| Accommodation & Food Services | 9 (17.0%) | 44 (83.0%) |
| Public Administration | 36 (81.8%) | 8 (18.2%) |
| Total | 852 (54.6%) | 709 (45.4%) |
Education in Churchill borough
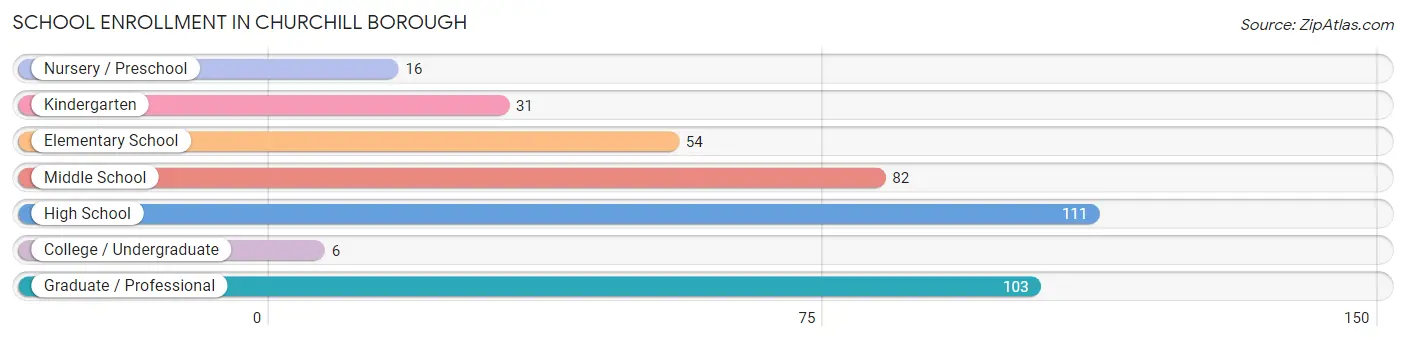
School Enrollment in Churchill borough
The most common levels of schooling among the 403 students in Churchill borough are high school (111 | 27.5%), graduate / professional (103 | 25.6%), and middle school (82 | 20.3%).
| School Level | # Students | % Students |
| Nursery / Preschool | 16 | 4.0% |
| Kindergarten | 31 | 7.7% |
| Elementary School | 54 | 13.4% |
| Middle School | 82 | 20.3% |
| High School | 111 | 27.5% |
| College / Undergraduate | 6 | 1.5% |
| Graduate / Professional | 103 | 25.6% |
| Total | 403 | 100.0% |
School Enrollment by Age by Funding Source in Churchill borough
Out of a total of 403 students who are enrolled in schools in Churchill borough, 99 (24.6%) attend a private institution, while the remaining 304 (75.4%) are enrolled in public schools. The age group of 3 to 4 year olds has the highest likelihood of being enrolled in private schools, with 11 (100.0% in the age bracket) enrolled. Conversely, the age group of 18 to 19 year olds has the lowest likelihood of being enrolled in a private school, with 4 (100.0% in the age bracket) attending a public institution.
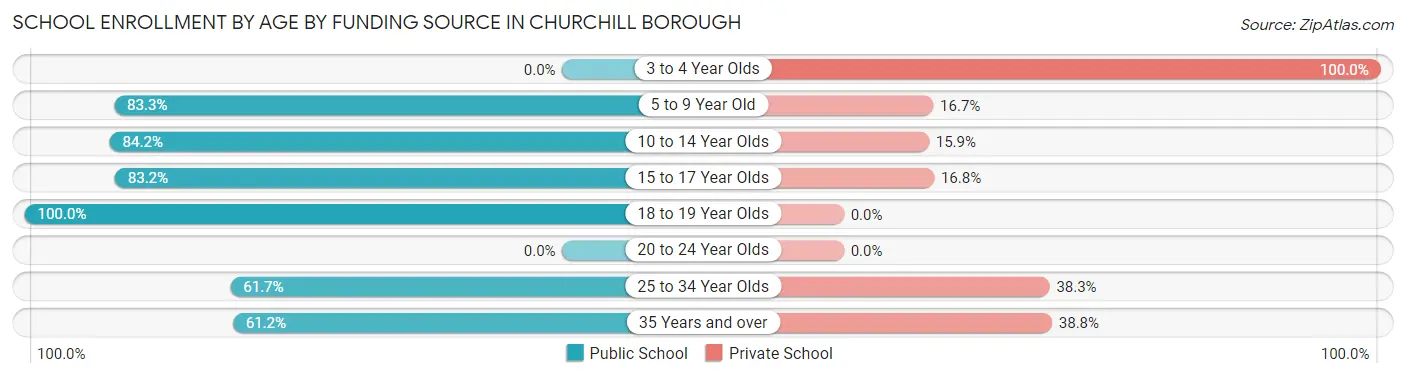
| Age Bracket | Public School | Private School |
| 3 to 4 Year Olds | 0 (0.0%) | 11 (100.0%) |
| 5 to 9 Year Old | 75 (83.3%) | 15 (16.7%) |
| 10 to 14 Year Olds | 69 (84.2%) | 13 (15.9%) |
| 15 to 17 Year Olds | 89 (83.2%) | 18 (16.8%) |
| 18 to 19 Year Olds | 4 (100.0%) | 0 (0.0%) |
| 20 to 24 Year Olds | 0 (0.0%) | 0 (0.0%) |
| 25 to 34 Year Olds | 37 (61.7%) | 23 (38.3%) |
| 35 Years and over | 30 (61.2%) | 19 (38.8%) |
| Total | 304 (75.4%) | 99 (24.6%) |
Educational Attainment by Field of Study in Churchill borough
Business (338 | 19.4%), social sciences (185 | 10.6%), education (184 | 10.6%), computers & mathematics (164 | 9.4%), and psychology (152 | 8.7%) are the most common fields of study among 1,743 individuals in Churchill borough who have obtained a bachelor's degree or higher.
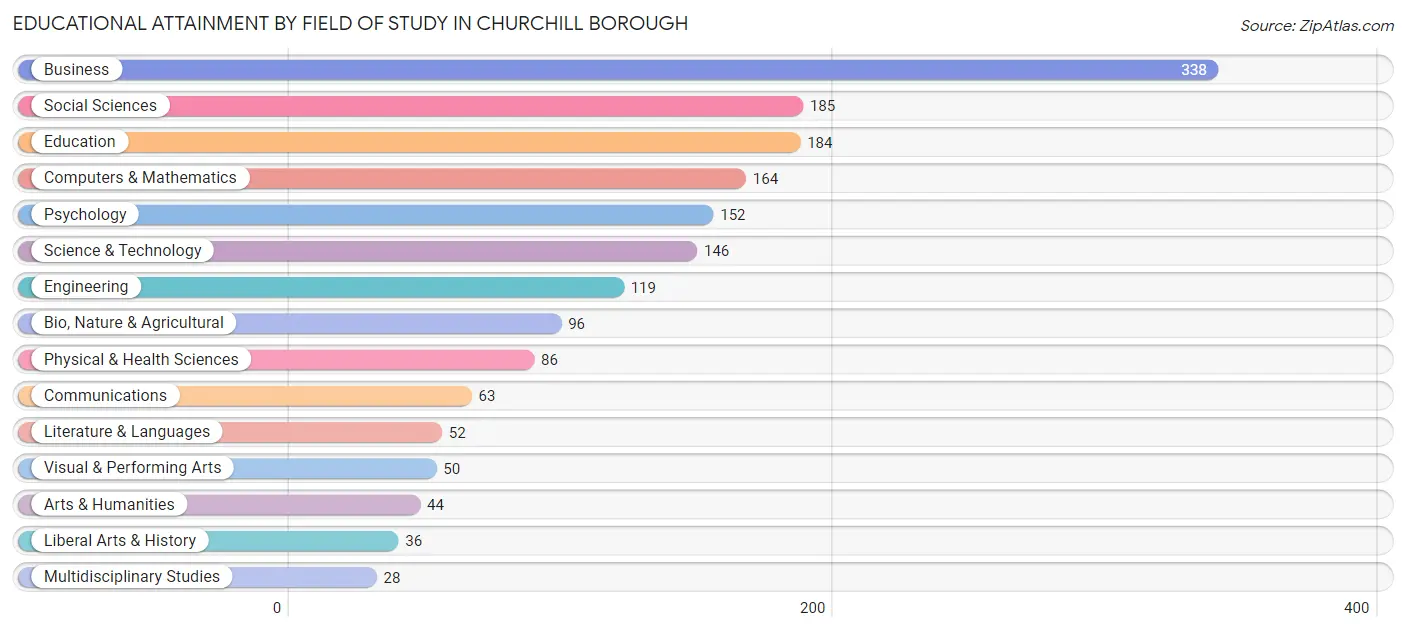
| Field of Study | # Graduates | % Graduates |
| Computers & Mathematics | 164 | 9.4% |
| Bio, Nature & Agricultural | 96 | 5.5% |
| Physical & Health Sciences | 86 | 4.9% |
| Psychology | 152 | 8.7% |
| Social Sciences | 185 | 10.6% |
| Engineering | 119 | 6.8% |
| Multidisciplinary Studies | 28 | 1.6% |
| Science & Technology | 146 | 8.4% |
| Business | 338 | 19.4% |
| Education | 184 | 10.6% |
| Literature & Languages | 52 | 3.0% |
| Liberal Arts & History | 36 | 2.1% |
| Visual & Performing Arts | 50 | 2.9% |
| Communications | 63 | 3.6% |
| Arts & Humanities | 44 | 2.5% |
| Total | 1,743 | 100.0% |
Transportation & Commute in Churchill borough
Vehicle Availability by Sex in Churchill borough
The most prevalent vehicle ownership categories in Churchill borough are males with 2 vehicles (469, accounting for 55.5%) and females with 2 vehicles (370, making up 66.2%).
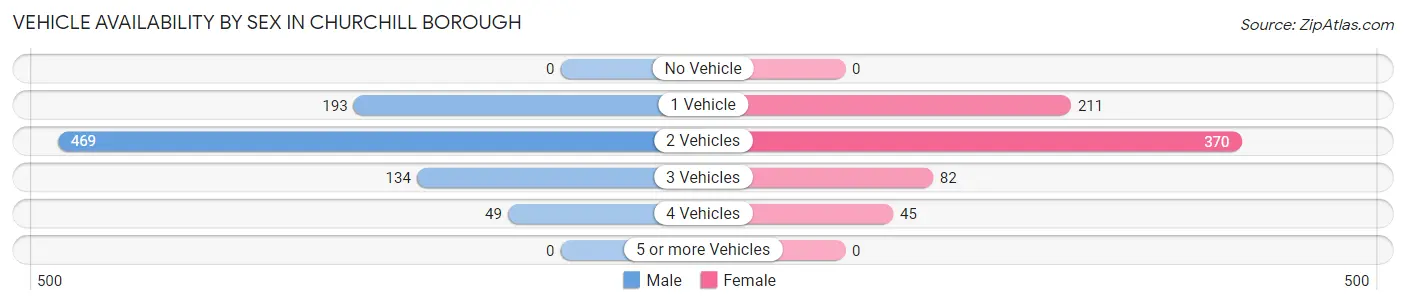
| Vehicles Available | Male | Female |
| No Vehicle | 0 (0.0%) | 0 (0.0%) |
| 1 Vehicle | 193 (22.8%) | 211 (29.8%) |
| 2 Vehicles | 469 (55.5%) | 370 (52.3%) |
| 3 Vehicles | 134 (15.9%) | 82 (11.6%) |
| 4 Vehicles | 49 (5.8%) | 45 (6.4%) |
| 5 or more Vehicles | 0 (0.0%) | 0 (0.0%) |
| Total | 845 (100.0%) | 708 (100.0%) |
Commute Time in Churchill borough
The most frequently occuring commute durations in Churchill borough are 30 to 34 minutes (244 commuters, 23.9%), 10 to 14 minutes (188 commuters, 18.4%), and 20 to 24 minutes (156 commuters, 15.3%).
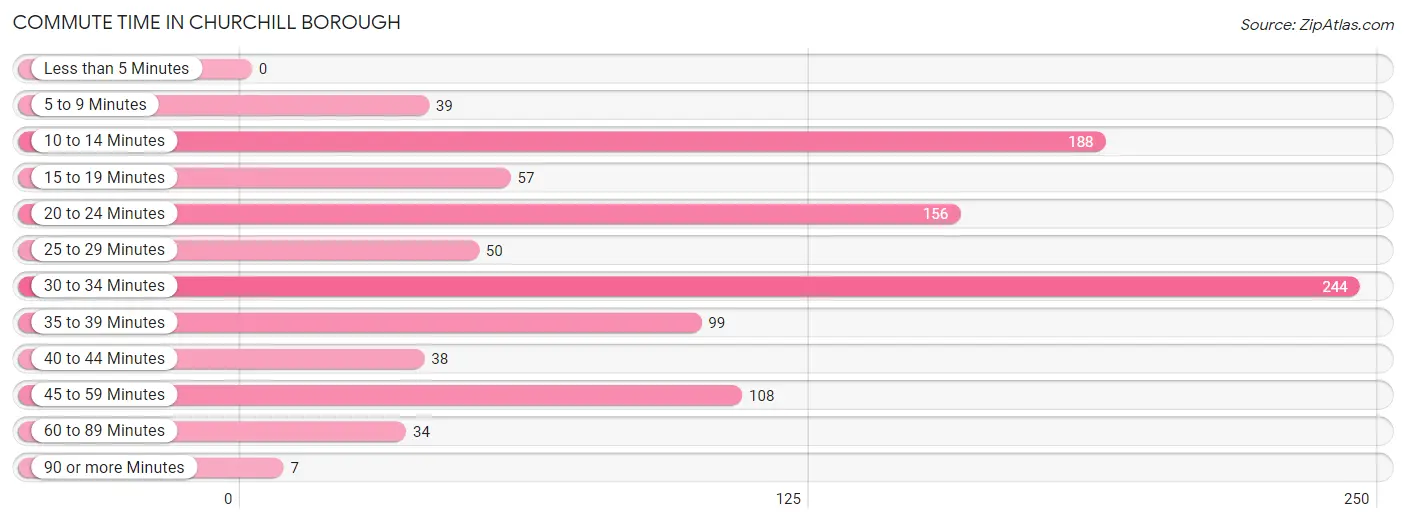
| Commute Time | # Commuters | % Commuters |
| Less than 5 Minutes | 0 | 0.0% |
| 5 to 9 Minutes | 39 | 3.8% |
| 10 to 14 Minutes | 188 | 18.4% |
| 15 to 19 Minutes | 57 | 5.6% |
| 20 to 24 Minutes | 156 | 15.3% |
| 25 to 29 Minutes | 50 | 4.9% |
| 30 to 34 Minutes | 244 | 23.9% |
| 35 to 39 Minutes | 99 | 9.7% |
| 40 to 44 Minutes | 38 | 3.7% |
| 45 to 59 Minutes | 108 | 10.6% |
| 60 to 89 Minutes | 34 | 3.3% |
| 90 or more Minutes | 7 | 0.7% |
Commute Time by Sex in Churchill borough
The most common commute times in Churchill borough are 30 to 34 minutes (133 commuters, 22.4%) for males and 30 to 34 minutes (111 commuters, 26.0%) for females.
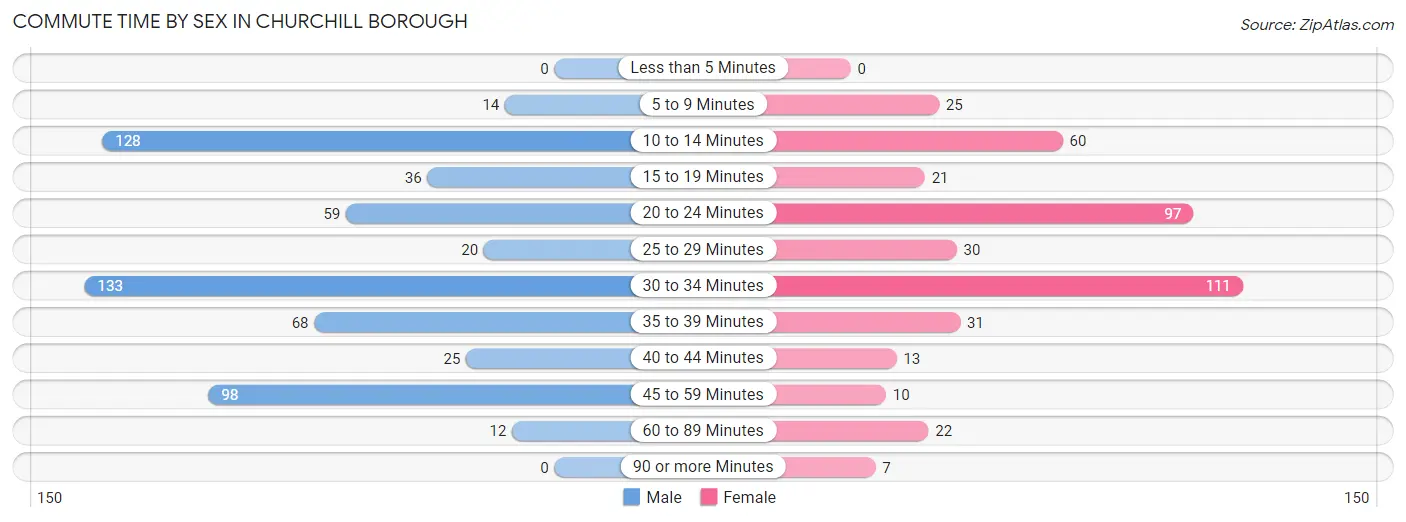
| Commute Time | Male | Female |
| Less than 5 Minutes | 0 (0.0%) | 0 (0.0%) |
| 5 to 9 Minutes | 14 (2.4%) | 25 (5.9%) |
| 10 to 14 Minutes | 128 (21.6%) | 60 (14.1%) |
| 15 to 19 Minutes | 36 (6.1%) | 21 (4.9%) |
| 20 to 24 Minutes | 59 (10.0%) | 97 (22.7%) |
| 25 to 29 Minutes | 20 (3.4%) | 30 (7.0%) |
| 30 to 34 Minutes | 133 (22.4%) | 111 (26.0%) |
| 35 to 39 Minutes | 68 (11.5%) | 31 (7.3%) |
| 40 to 44 Minutes | 25 (4.2%) | 13 (3.0%) |
| 45 to 59 Minutes | 98 (16.5%) | 10 (2.3%) |
| 60 to 89 Minutes | 12 (2.0%) | 22 (5.1%) |
| 90 or more Minutes | 0 (0.0%) | 7 (1.6%) |
Time of Departure to Work by Sex in Churchill borough
The most frequent times of departure to work in Churchill borough are 8:00 AM to 8:29 AM (157, 26.5%) for males and 8:30 AM to 8:59 AM (92, 21.5%) for females.
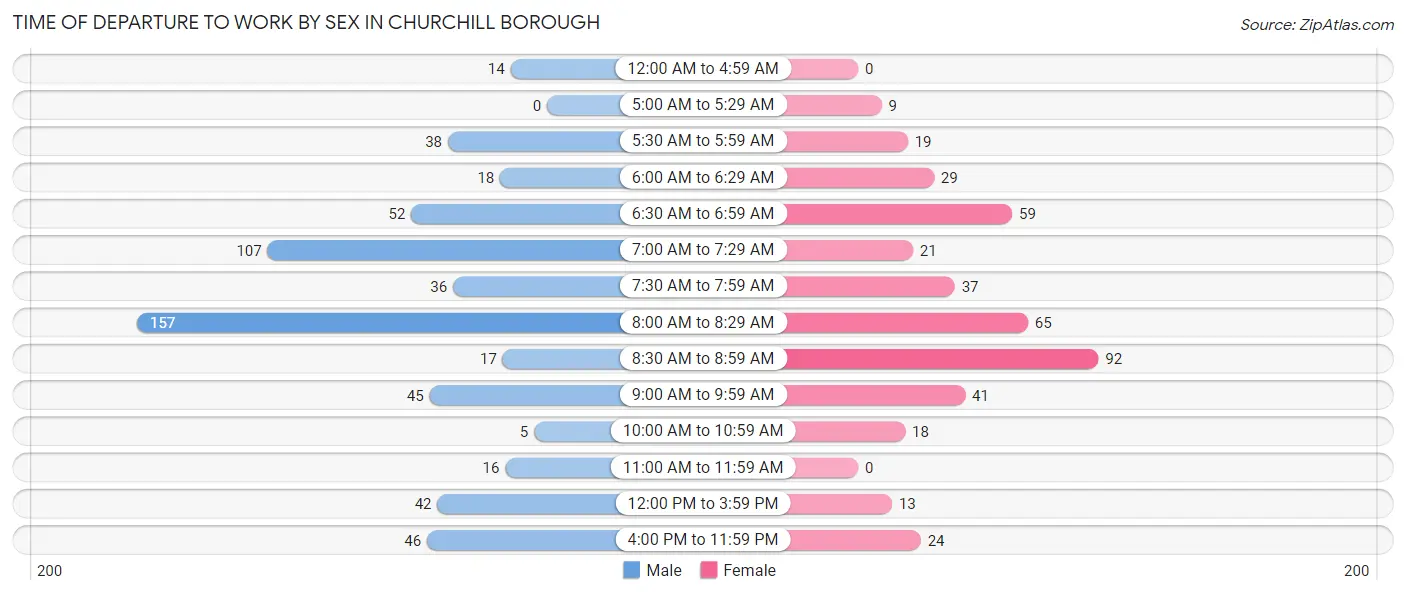
| Time of Departure | Male | Female |
| 12:00 AM to 4:59 AM | 14 (2.4%) | 0 (0.0%) |
| 5:00 AM to 5:29 AM | 0 (0.0%) | 9 (2.1%) |
| 5:30 AM to 5:59 AM | 38 (6.4%) | 19 (4.4%) |
| 6:00 AM to 6:29 AM | 18 (3.0%) | 29 (6.8%) |
| 6:30 AM to 6:59 AM | 52 (8.8%) | 59 (13.8%) |
| 7:00 AM to 7:29 AM | 107 (18.0%) | 21 (4.9%) |
| 7:30 AM to 7:59 AM | 36 (6.1%) | 37 (8.7%) |
| 8:00 AM to 8:29 AM | 157 (26.5%) | 65 (15.2%) |
| 8:30 AM to 8:59 AM | 17 (2.9%) | 92 (21.5%) |
| 9:00 AM to 9:59 AM | 45 (7.6%) | 41 (9.6%) |
| 10:00 AM to 10:59 AM | 5 (0.8%) | 18 (4.2%) |
| 11:00 AM to 11:59 AM | 16 (2.7%) | 0 (0.0%) |
| 12:00 PM to 3:59 PM | 42 (7.1%) | 13 (3.0%) |
| 4:00 PM to 11:59 PM | 46 (7.8%) | 24 (5.6%) |
| Total | 593 (100.0%) | 427 (100.0%) |
Housing Occupancy in Churchill borough
Occupancy by Ownership in Churchill borough
Of the total 1,311 dwellings in Churchill borough, owner-occupied units account for 1,268 (96.7%), while renter-occupied units make up 43 (3.3%).
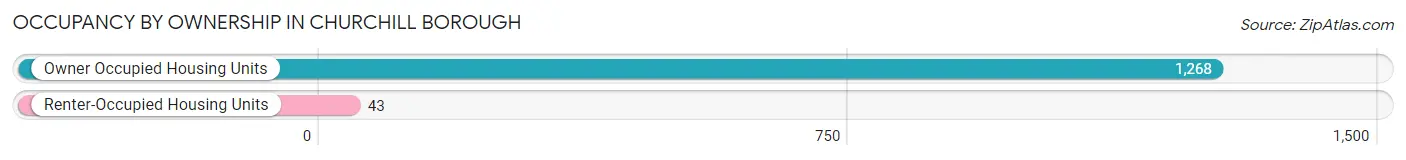
| Occupancy | # Housing Units | % Housing Units |
| Owner Occupied Housing Units | 1,268 | 96.7% |
| Renter-Occupied Housing Units | 43 | 3.3% |
| Total Occupied Housing Units | 1,311 | 100.0% |
Occupancy by Household Size in Churchill borough
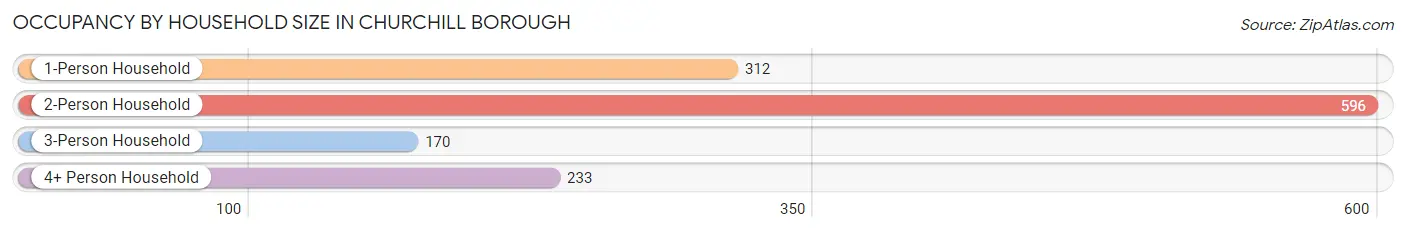
| Household Size | # Housing Units | % Housing Units |
| 1-Person Household | 312 | 23.8% |
| 2-Person Household | 596 | 45.5% |
| 3-Person Household | 170 | 13.0% |
| 4+ Person Household | 233 | 17.8% |
| Total Housing Units | 1,311 | 100.0% |
Occupancy by Ownership by Household Size in Churchill borough
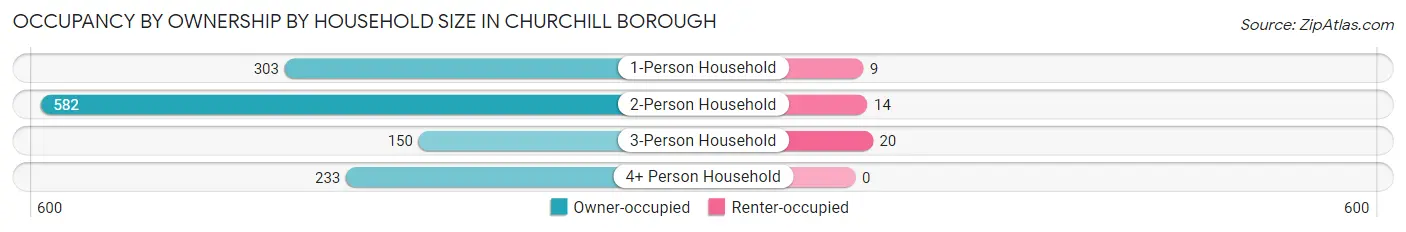
| Household Size | Owner-occupied | Renter-occupied |
| 1-Person Household | 303 (97.1%) | 9 (2.9%) |
| 2-Person Household | 582 (97.7%) | 14 (2.4%) |
| 3-Person Household | 150 (88.2%) | 20 (11.8%) |
| 4+ Person Household | 233 (100.0%) | 0 (0.0%) |
| Total Housing Units | 1,268 (96.7%) | 43 (3.3%) |
Occupancy by Educational Attainment in Churchill borough
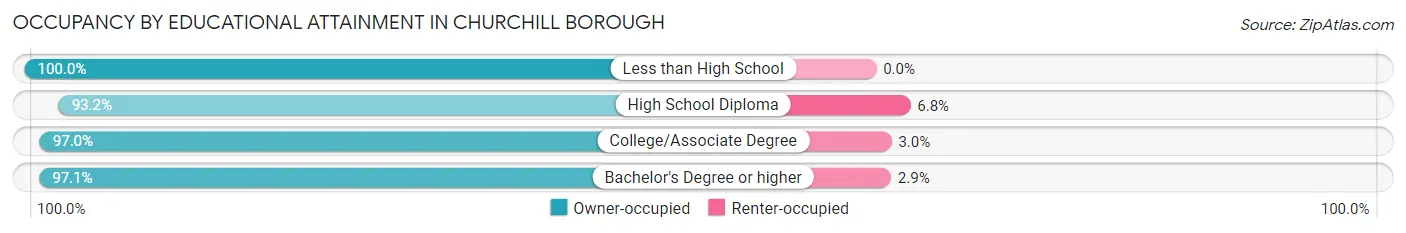
| Household Size | Owner-occupied | Renter-occupied |
| Less than High School | 21 (100.0%) | 0 (0.0%) |
| High School Diploma | 124 (93.2%) | 9 (6.8%) |
| College/Associate Degree | 160 (97.0%) | 5 (3.0%) |
| Bachelor's Degree or higher | 963 (97.1%) | 29 (2.9%) |
Occupancy by Age of Householder in Churchill borough
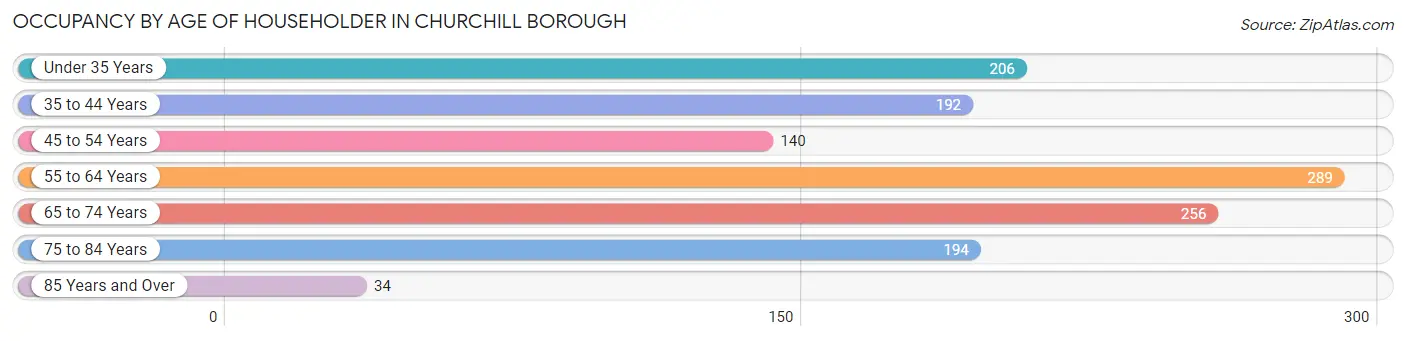
| Age Bracket | # Households | % Households |
| Under 35 Years | 206 | 15.7% |
| 35 to 44 Years | 192 | 14.6% |
| 45 to 54 Years | 140 | 10.7% |
| 55 to 64 Years | 289 | 22.0% |
| 65 to 74 Years | 256 | 19.5% |
| 75 to 84 Years | 194 | 14.8% |
| 85 Years and Over | 34 | 2.6% |
| Total | 1,311 | 100.0% |
Housing Finances in Churchill borough
Median Income by Occupancy in Churchill borough
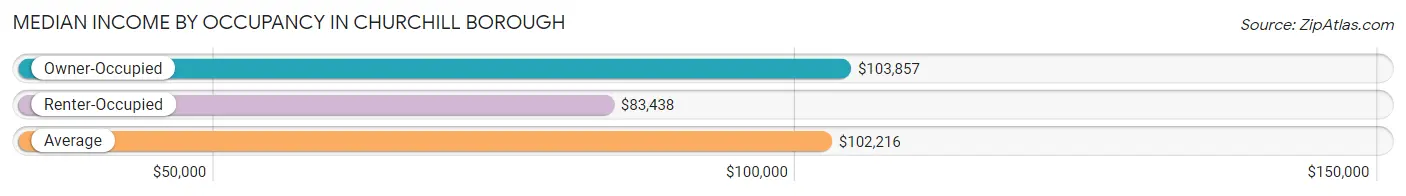
| Occupancy Type | # Households | Median Income |
| Owner-Occupied | 1,268 (96.7%) | $103,857 |
| Renter-Occupied | 43 (3.3%) | $83,438 |
| Average | 1,311 (100.0%) | $102,216 |
Occupancy by Householder Income Bracket in Churchill borough
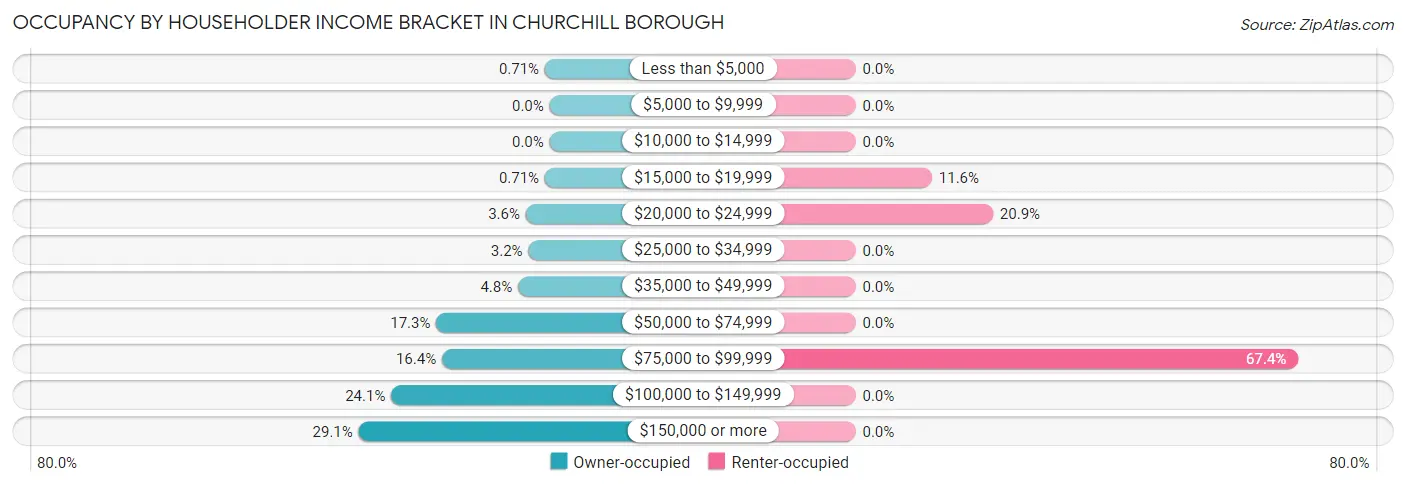
| Income Bracket | Owner-occupied | Renter-occupied |
| Less than $5,000 | 9 (0.7%) | 0 (0.0%) |
| $5,000 to $9,999 | 0 (0.0%) | 0 (0.0%) |
| $10,000 to $14,999 | 0 (0.0%) | 0 (0.0%) |
| $15,000 to $19,999 | 9 (0.7%) | 5 (11.6%) |
| $20,000 to $24,999 | 46 (3.6%) | 9 (20.9%) |
| $25,000 to $34,999 | 41 (3.2%) | 0 (0.0%) |
| $35,000 to $49,999 | 61 (4.8%) | 0 (0.0%) |
| $50,000 to $74,999 | 219 (17.3%) | 0 (0.0%) |
| $75,000 to $99,999 | 208 (16.4%) | 29 (67.4%) |
| $100,000 to $149,999 | 306 (24.1%) | 0 (0.0%) |
| $150,000 or more | 369 (29.1%) | 0 (0.0%) |
| Total | 1,268 (100.0%) | 43 (100.0%) |
Monthly Housing Cost Tiers in Churchill borough
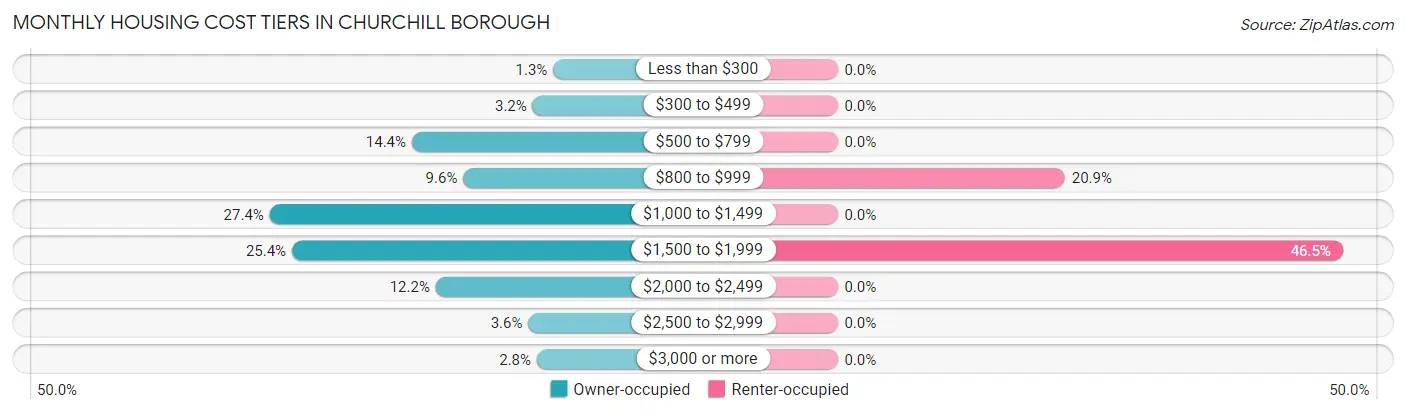
| Monthly Cost | Owner-occupied | Renter-occupied |
| Less than $300 | 17 (1.3%) | 0 (0.0%) |
| $300 to $499 | 41 (3.2%) | 0 (0.0%) |
| $500 to $799 | 182 (14.3%) | 0 (0.0%) |
| $800 to $999 | 122 (9.6%) | 9 (20.9%) |
| $1,000 to $1,499 | 348 (27.4%) | 0 (0.0%) |
| $1,500 to $1,999 | 322 (25.4%) | 20 (46.5%) |
| $2,000 to $2,499 | 154 (12.1%) | 0 (0.0%) |
| $2,500 to $2,999 | 46 (3.6%) | 0 (0.0%) |
| $3,000 or more | 36 (2.8%) | 0 (0.0%) |
| Total | 1,268 (100.0%) | 43 (100.0%) |
Physical Housing Characteristics in Churchill borough
Housing Structures in Churchill borough
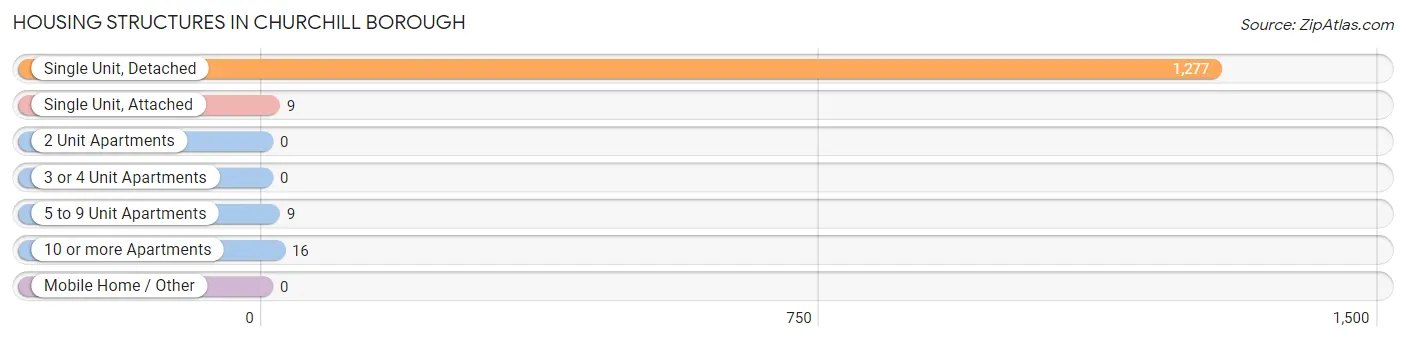
| Structure Type | # Housing Units | % Housing Units |
| Single Unit, Detached | 1,277 | 97.4% |
| Single Unit, Attached | 9 | 0.7% |
| 2 Unit Apartments | 0 | 0.0% |
| 3 or 4 Unit Apartments | 0 | 0.0% |
| 5 to 9 Unit Apartments | 9 | 0.7% |
| 10 or more Apartments | 16 | 1.2% |
| Mobile Home / Other | 0 | 0.0% |
| Total | 1,311 | 100.0% |
Housing Structures by Occupancy in Churchill borough
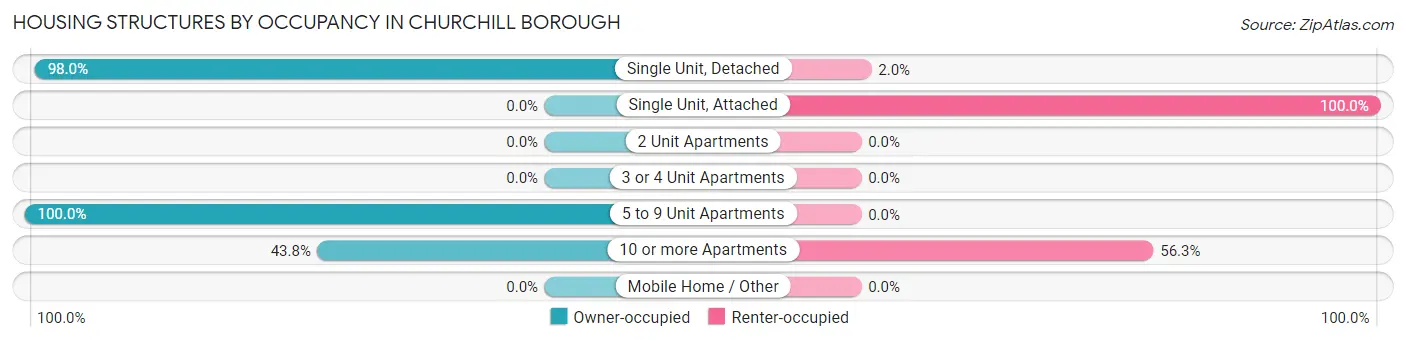
| Structure Type | Owner-occupied | Renter-occupied |
| Single Unit, Detached | 1,252 (98.0%) | 25 (2.0%) |
| Single Unit, Attached | 0 (0.0%) | 9 (100.0%) |
| 2 Unit Apartments | 0 (0.0%) | 0 (0.0%) |
| 3 or 4 Unit Apartments | 0 (0.0%) | 0 (0.0%) |
| 5 to 9 Unit Apartments | 9 (100.0%) | 0 (0.0%) |
| 10 or more Apartments | 7 (43.8%) | 9 (56.2%) |
| Mobile Home / Other | 0 (0.0%) | 0 (0.0%) |
| Total | 1,268 (96.7%) | 43 (3.3%) |
Housing Structures by Number of Rooms in Churchill borough
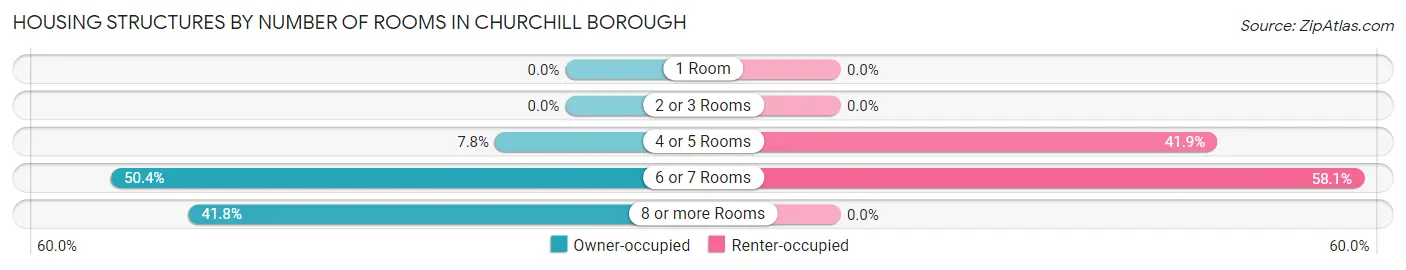
| Number of Rooms | Owner-occupied | Renter-occupied |
| 1 Room | 0 (0.0%) | 0 (0.0%) |
| 2 or 3 Rooms | 0 (0.0%) | 0 (0.0%) |
| 4 or 5 Rooms | 99 (7.8%) | 18 (41.9%) |
| 6 or 7 Rooms | 639 (50.4%) | 25 (58.1%) |
| 8 or more Rooms | 530 (41.8%) | 0 (0.0%) |
| Total | 1,268 (100.0%) | 43 (100.0%) |
Housing Structure by Heating Type in Churchill borough
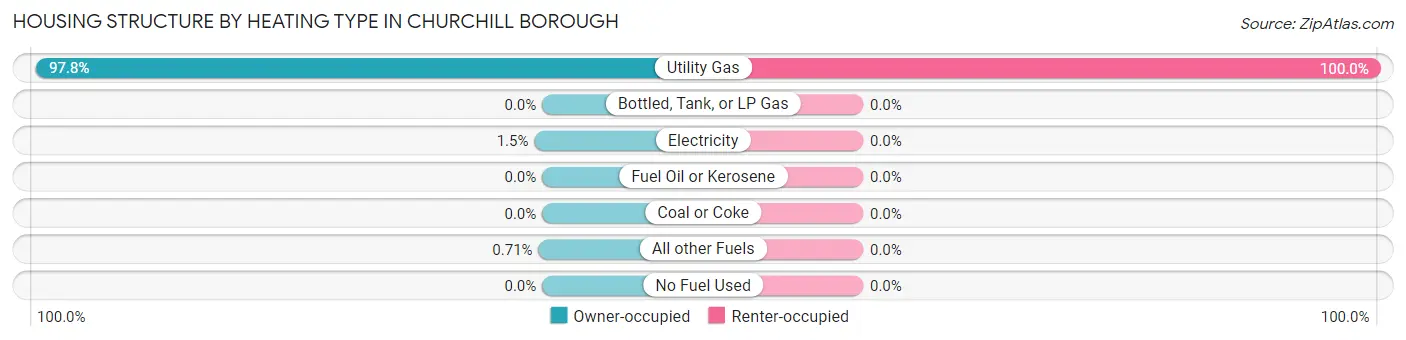
| Heating Type | Owner-occupied | Renter-occupied |
| Utility Gas | 1,240 (97.8%) | 43 (100.0%) |
| Bottled, Tank, or LP Gas | 0 (0.0%) | 0 (0.0%) |
| Electricity | 19 (1.5%) | 0 (0.0%) |
| Fuel Oil or Kerosene | 0 (0.0%) | 0 (0.0%) |
| Coal or Coke | 0 (0.0%) | 0 (0.0%) |
| All other Fuels | 9 (0.7%) | 0 (0.0%) |
| No Fuel Used | 0 (0.0%) | 0 (0.0%) |
| Total | 1,268 (100.0%) | 43 (100.0%) |
Household Vehicle Usage in Churchill borough
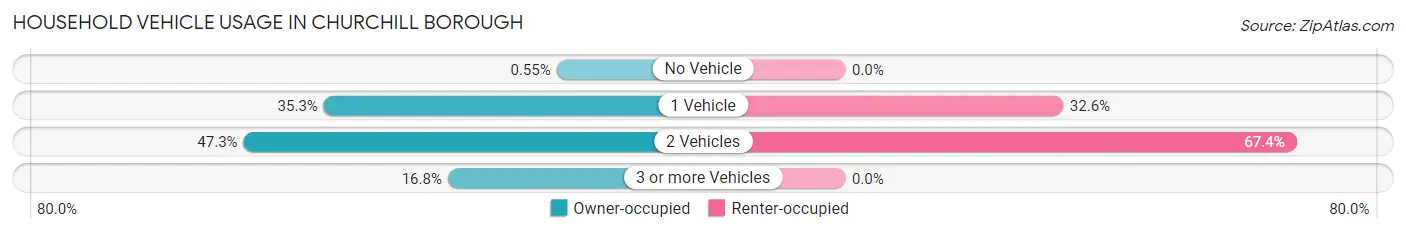
| Vehicles per Household | Owner-occupied | Renter-occupied |
| No Vehicle | 7 (0.5%) | 0 (0.0%) |
| 1 Vehicle | 448 (35.3%) | 14 (32.6%) |
| 2 Vehicles | 600 (47.3%) | 29 (67.4%) |
| 3 or more Vehicles | 213 (16.8%) | 0 (0.0%) |
| Total | 1,268 (100.0%) | 43 (100.0%) |
Real Estate & Mortgages in Churchill borough
Real Estate and Mortgage Overview in Churchill borough
| Characteristic | Without Mortgage | With Mortgage |
| Housing Units | 564 | 704 |
| Median Property Value | $221,000 | $219,700 |
| Median Household Income | $87,095 | $232 |
| Monthly Housing Costs | $888 | $36 |
| Real Estate Taxes | $5,321 | $0 |
Property Value by Mortgage Status in Churchill borough
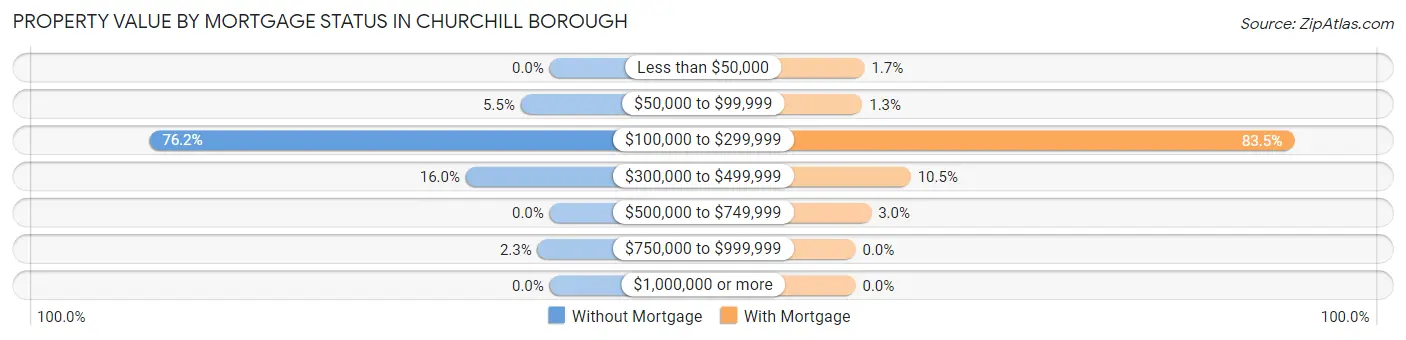
| Property Value | Without Mortgage | With Mortgage |
| Less than $50,000 | 0 (0.0%) | 12 (1.7%) |
| $50,000 to $99,999 | 31 (5.5%) | 9 (1.3%) |
| $100,000 to $299,999 | 430 (76.2%) | 588 (83.5%) |
| $300,000 to $499,999 | 90 (16.0%) | 74 (10.5%) |
| $500,000 to $749,999 | 0 (0.0%) | 21 (3.0%) |
| $750,000 to $999,999 | 13 (2.3%) | 0 (0.0%) |
| $1,000,000 or more | 0 (0.0%) | 0 (0.0%) |
| Total | 564 (100.0%) | 704 (100.0%) |
Household Income by Mortgage Status in Churchill borough
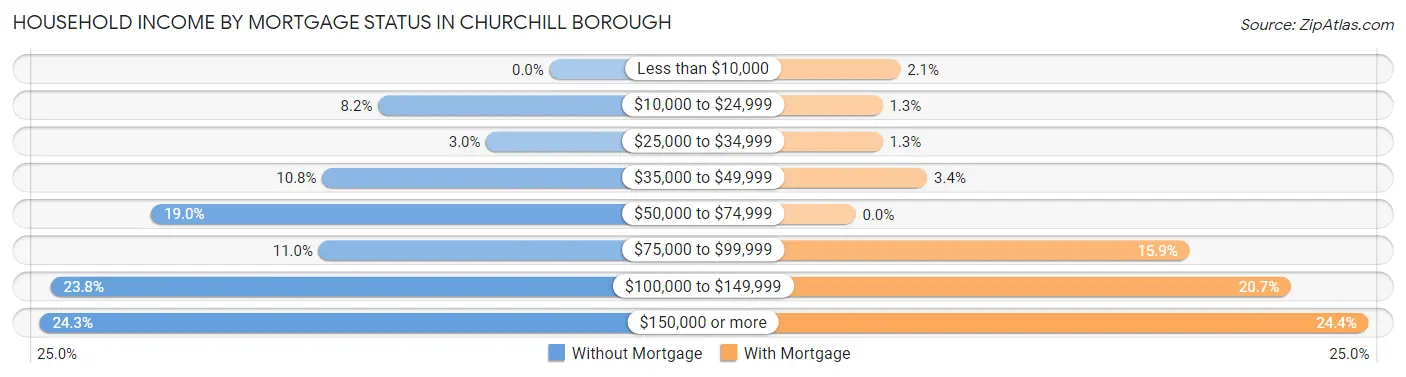
| Household Income | Without Mortgage | With Mortgage |
| Less than $10,000 | 0 (0.0%) | 15 (2.1%) |
| $10,000 to $24,999 | 46 (8.2%) | 9 (1.3%) |
| $25,000 to $34,999 | 17 (3.0%) | 9 (1.3%) |
| $35,000 to $49,999 | 61 (10.8%) | 24 (3.4%) |
| $50,000 to $74,999 | 107 (19.0%) | 0 (0.0%) |
| $75,000 to $99,999 | 62 (11.0%) | 112 (15.9%) |
| $100,000 to $149,999 | 134 (23.8%) | 146 (20.7%) |
| $150,000 or more | 137 (24.3%) | 172 (24.4%) |
| Total | 564 (100.0%) | 704 (100.0%) |
Property Value to Household Income Ratio in Churchill borough
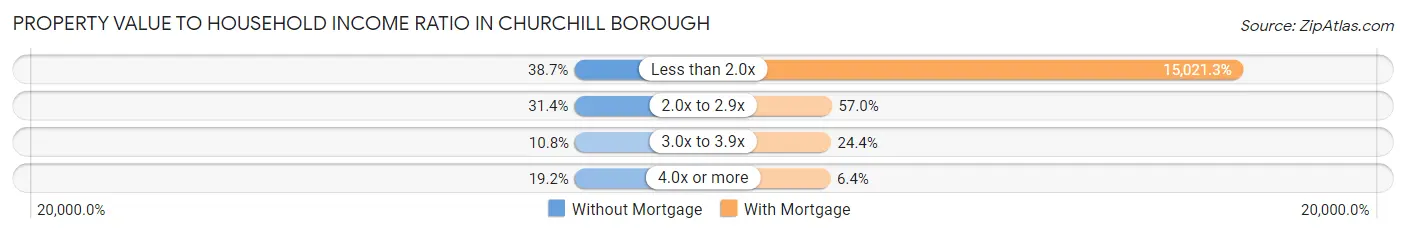
| Value-to-Income Ratio | Without Mortgage | With Mortgage |
| Less than 2.0x | 218 (38.7%) | 105,750 (15,021.3%) |
| 2.0x to 2.9x | 177 (31.4%) | 401 (57.0%) |
| 3.0x to 3.9x | 61 (10.8%) | 172 (24.4%) |
| 4.0x or more | 108 (19.2%) | 45 (6.4%) |
| Total | 564 (100.0%) | 704 (100.0%) |
Real Estate Taxes by Mortgage Status in Churchill borough
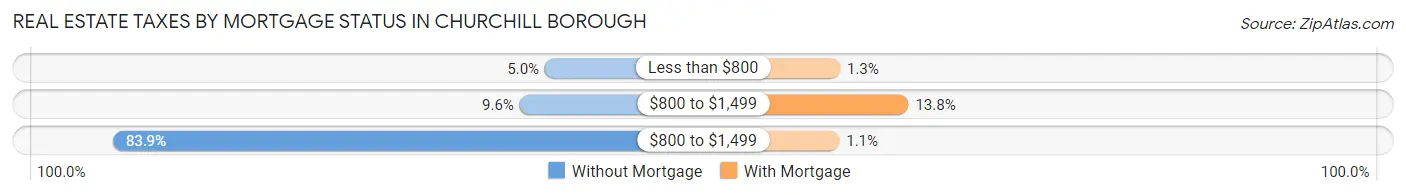
| Property Taxes | Without Mortgage | With Mortgage |
| Less than $800 | 28 (5.0%) | 9 (1.3%) |
| $800 to $1,499 | 54 (9.6%) | 97 (13.8%) |
| $800 to $1,499 | 473 (83.9%) | 8 (1.1%) |
| Total | 564 (100.0%) | 704 (100.0%) |
Health & Disability in Churchill borough
Health Insurance Coverage by Age in Churchill borough
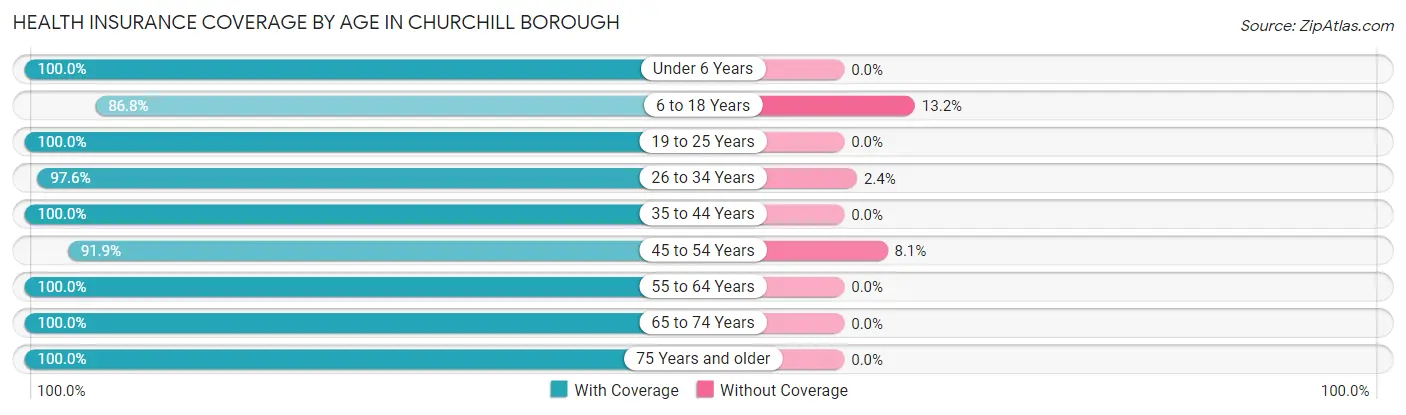
| Age Bracket | With Coverage | Without Coverage |
| Under 6 Years | 457 (100.0%) | 0 (0.0%) |
| 6 to 18 Years | 211 (86.8%) | 32 (13.2%) |
| 19 to 25 Years | 42 (100.0%) | 0 (0.0%) |
| 26 to 34 Years | 371 (97.6%) | 9 (2.4%) |
| 35 to 44 Years | 406 (100.0%) | 0 (0.0%) |
| 45 to 54 Years | 194 (91.9%) | 17 (8.1%) |
| 55 to 64 Years | 494 (100.0%) | 0 (0.0%) |
| 65 to 74 Years | 511 (100.0%) | 0 (0.0%) |
| 75 Years and older | 371 (100.0%) | 0 (0.0%) |
| Total | 3,057 (98.1%) | 58 (1.9%) |
Health Insurance Coverage by Citizenship Status in Churchill borough
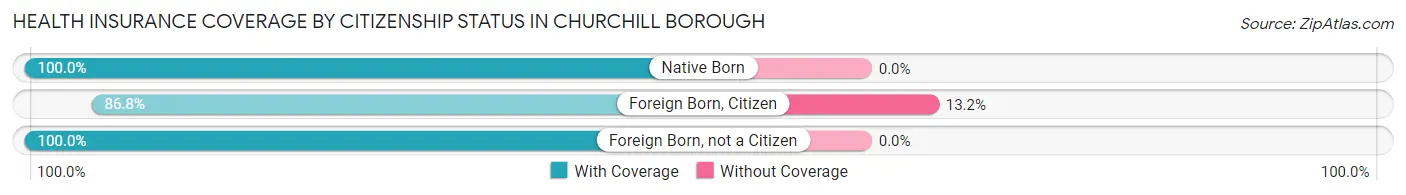
| Citizenship Status | With Coverage | Without Coverage |
| Native Born | 457 (100.0%) | 0 (0.0%) |
| Foreign Born, Citizen | 211 (86.8%) | 32 (13.2%) |
| Foreign Born, not a Citizen | 42 (100.0%) | 0 (0.0%) |
Health Insurance Coverage by Household Income in Churchill borough
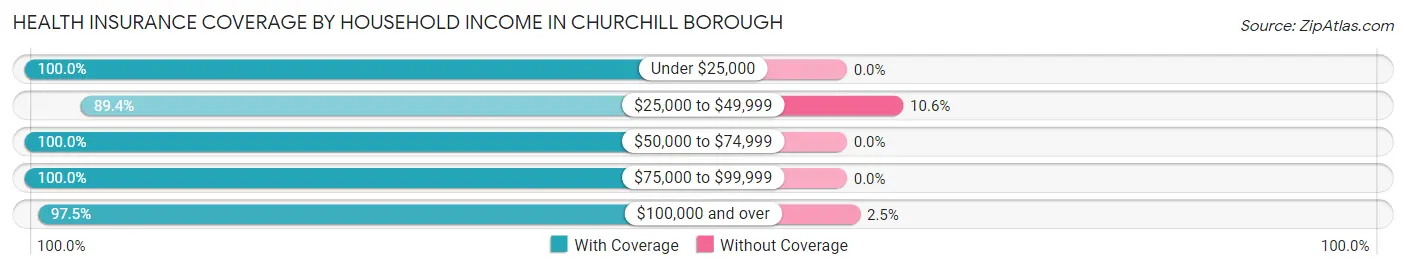
| Household Income | With Coverage | Without Coverage |
| Under $25,000 | 218 (100.0%) | 0 (0.0%) |
| $25,000 to $49,999 | 144 (89.4%) | 17 (10.6%) |
| $50,000 to $74,999 | 380 (100.0%) | 0 (0.0%) |
| $75,000 to $99,999 | 699 (100.0%) | 0 (0.0%) |
| $100,000 and over | 1,610 (97.5%) | 41 (2.5%) |
Public vs Private Health Insurance Coverage by Age in Churchill borough
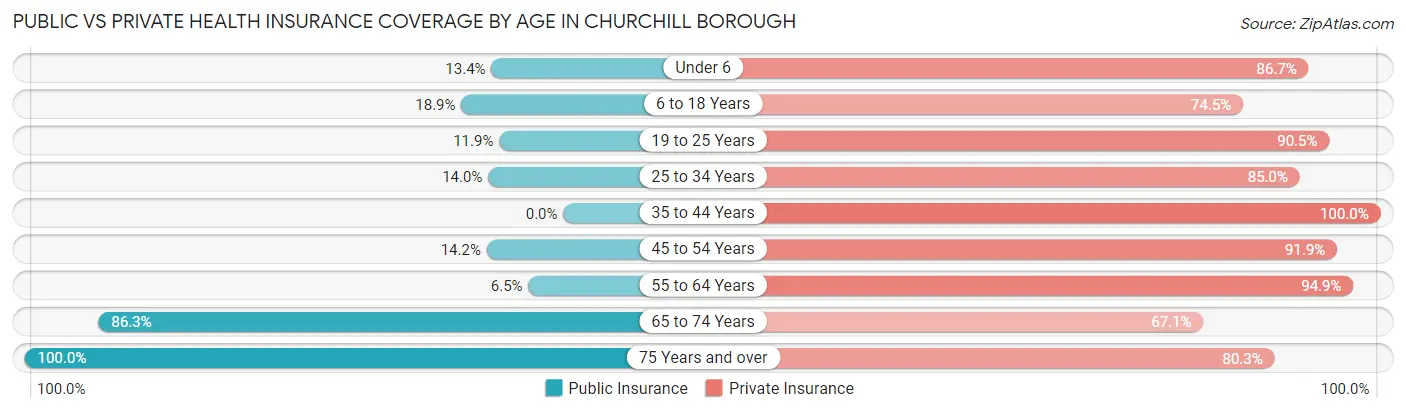
| Age Bracket | Public Insurance | Private Insurance |
| Under 6 | 61 (13.4%) | 396 (86.7%) |
| 6 to 18 Years | 46 (18.9%) | 181 (74.5%) |
| 19 to 25 Years | 5 (11.9%) | 38 (90.5%) |
| 25 to 34 Years | 53 (14.0%) | 323 (85.0%) |
| 35 to 44 Years | 0 (0.0%) | 406 (100.0%) |
| 45 to 54 Years | 30 (14.2%) | 194 (91.9%) |
| 55 to 64 Years | 32 (6.5%) | 469 (94.9%) |
| 65 to 74 Years | 441 (86.3%) | 343 (67.1%) |
| 75 Years and over | 371 (100.0%) | 298 (80.3%) |
| Total | 1,039 (33.4%) | 2,648 (85.0%) |
Disability Status by Sex by Age in Churchill borough
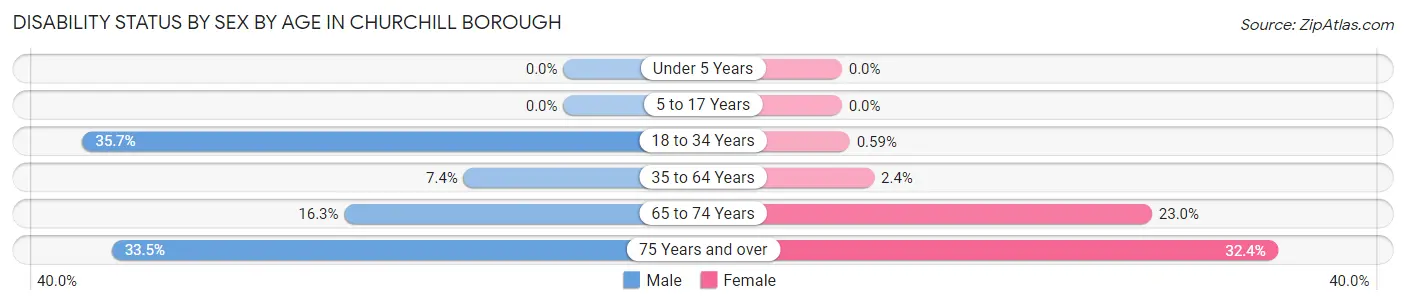
| Age Bracket | Male | Female |
| Under 5 Years | 0 (0.0%) | 0 (0.0%) |
| 5 to 17 Years | 0 (0.0%) | 0 (0.0%) |
| 18 to 34 Years | 90 (35.7%) | 1 (0.6%) |
| 35 to 64 Years | 39 (7.4%) | 14 (2.4%) |
| 65 to 74 Years | 40 (16.3%) | 61 (23.0%) |
| 75 Years and over | 56 (33.5%) | 66 (32.4%) |
Disability Class by Sex by Age in Churchill borough
Disability Class: Hearing Difficulty
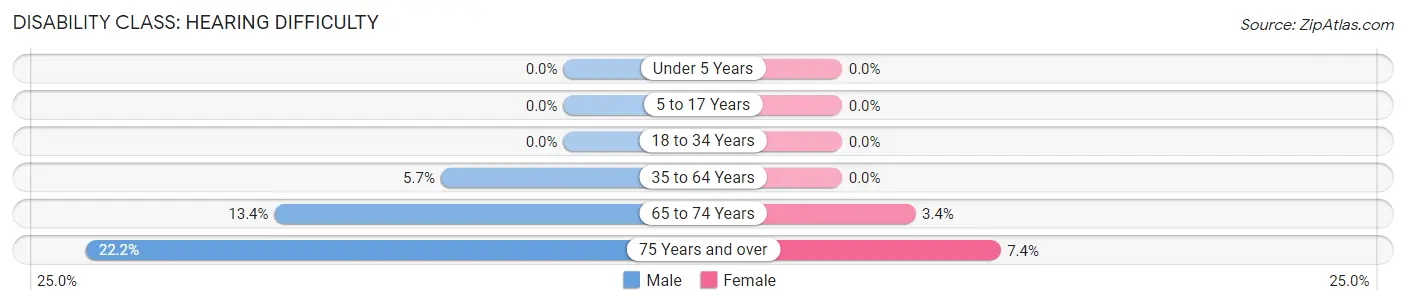
| Age Bracket | Male | Female |
| Under 5 Years | 0 (0.0%) | 0 (0.0%) |
| 5 to 17 Years | 0 (0.0%) | 0 (0.0%) |
| 18 to 34 Years | 0 (0.0%) | 0 (0.0%) |
| 35 to 64 Years | 30 (5.7%) | 0 (0.0%) |
| 65 to 74 Years | 33 (13.4%) | 9 (3.4%) |
| 75 Years and over | 37 (22.2%) | 15 (7.3%) |
Disability Class: Vision Difficulty
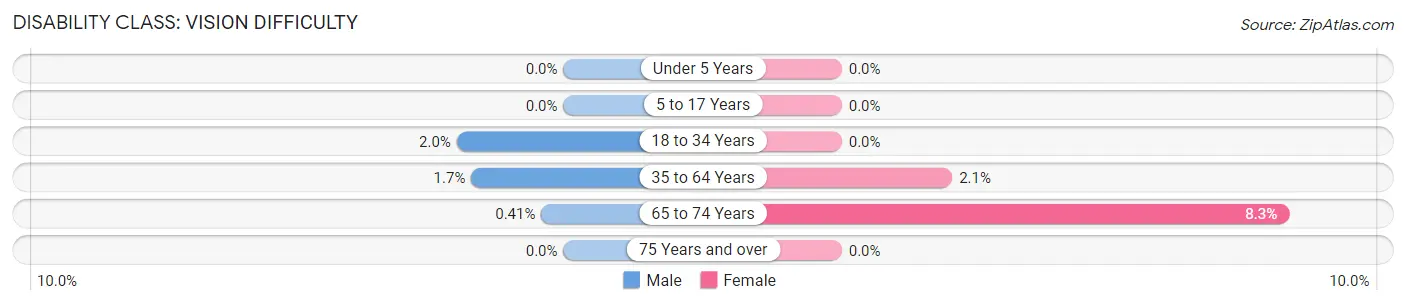
| Age Bracket | Male | Female |
| Under 5 Years | 0 (0.0%) | 0 (0.0%) |
| 5 to 17 Years | 0 (0.0%) | 0 (0.0%) |
| 18 to 34 Years | 5 (2.0%) | 0 (0.0%) |
| 35 to 64 Years | 9 (1.7%) | 12 (2.1%) |
| 65 to 74 Years | 1 (0.4%) | 22 (8.3%) |
| 75 Years and over | 0 (0.0%) | 0 (0.0%) |
Disability Class: Cognitive Difficulty
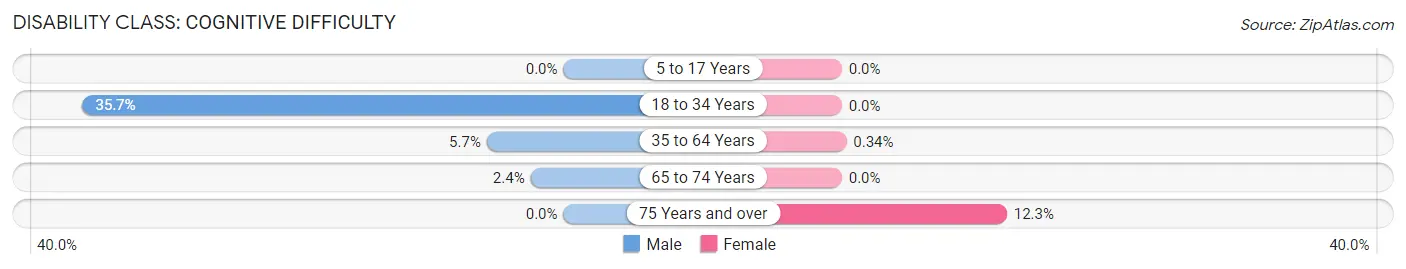
| Age Bracket | Male | Female |
| 5 to 17 Years | 0 (0.0%) | 0 (0.0%) |
| 18 to 34 Years | 90 (35.7%) | 0 (0.0%) |
| 35 to 64 Years | 30 (5.7%) | 2 (0.3%) |
| 65 to 74 Years | 6 (2.4%) | 0 (0.0%) |
| 75 Years and over | 0 (0.0%) | 25 (12.2%) |
Disability Class: Ambulatory Difficulty
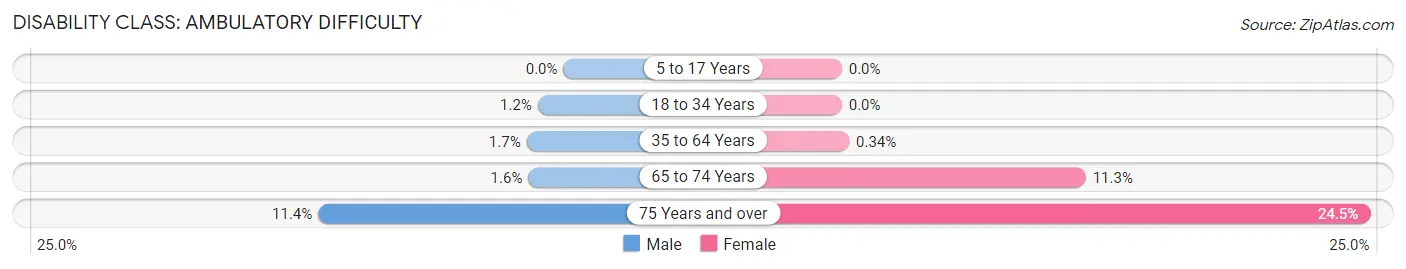
| Age Bracket | Male | Female |
| 5 to 17 Years | 0 (0.0%) | 0 (0.0%) |
| 18 to 34 Years | 3 (1.2%) | 0 (0.0%) |
| 35 to 64 Years | 9 (1.7%) | 2 (0.3%) |
| 65 to 74 Years | 4 (1.6%) | 30 (11.3%) |
| 75 Years and over | 19 (11.4%) | 50 (24.5%) |
Disability Class: Self-Care Difficulty
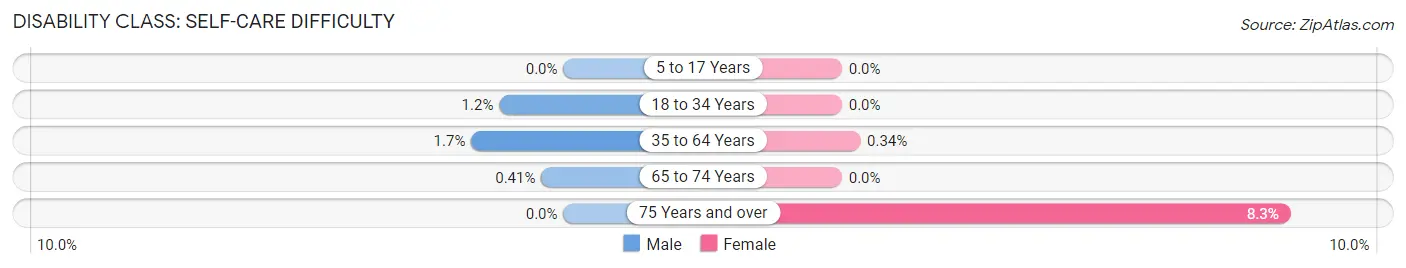
| Age Bracket | Male | Female |
| 5 to 17 Years | 0 (0.0%) | 0 (0.0%) |
| 18 to 34 Years | 3 (1.2%) | 0 (0.0%) |
| 35 to 64 Years | 9 (1.7%) | 2 (0.3%) |
| 65 to 74 Years | 1 (0.4%) | 0 (0.0%) |
| 75 Years and over | 0 (0.0%) | 17 (8.3%) |
Technology Access in Churchill borough
Computing Device Access in Churchill borough
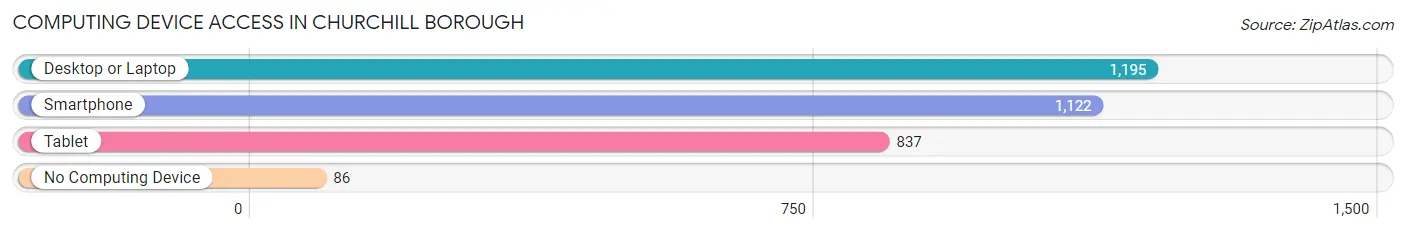
| Device Type | # Households | % Households |
| Desktop or Laptop | 1,195 | 91.1% |
| Smartphone | 1,122 | 85.6% |
| Tablet | 837 | 63.8% |
| No Computing Device | 86 | 6.6% |
| Total | 1,311 | 100.0% |
Internet Access in Churchill borough
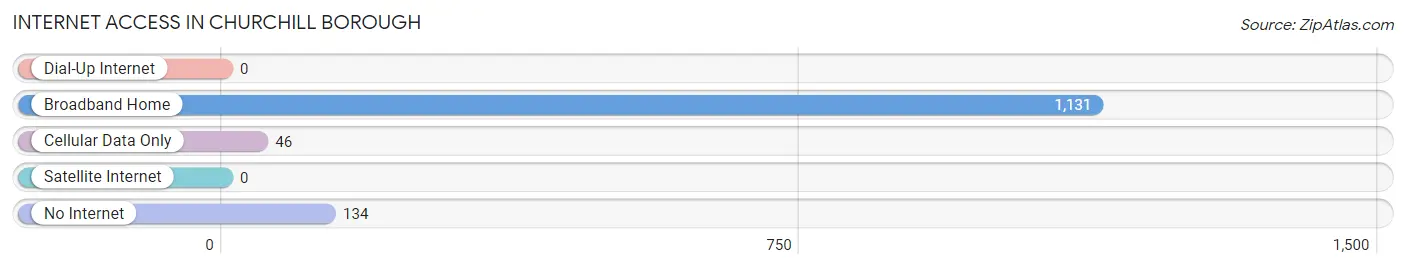
| Internet Type | # Households | % Households |
| Dial-Up Internet | 0 | 0.0% |
| Broadband Home | 1,131 | 86.3% |
| Cellular Data Only | 46 | 3.5% |
| Satellite Internet | 0 | 0.0% |
| No Internet | 134 | 10.2% |
| Total | 1,311 | 100.0% |
Churchill borough Summary
Churchill Borough is a borough located in Allegheny County, Pennsylvania. It is a small, residential community located just east of Pittsburgh. The borough was incorporated in 1891 and is home to approximately 3,000 people.
History
The area that is now Churchill Borough was originally part of Wilkins Township. In 1891, the area was incorporated as the Borough of Churchill. The name was chosen to honor the British statesman, Winston Churchill. The borough was originally a rural farming community, but in the early 20th century, it began to develop into a residential suburb of Pittsburgh.
Geography
Churchill Borough is located in Allegheny County, Pennsylvania. It is situated just east of Pittsburgh, and is bordered by Wilkins Township to the north, Wilkinsburg to the east, Edgewood to the south, and Swissvale to the west. The borough covers an area of 1.2 square miles and is home to approximately 3,000 people.
The terrain of Churchill Borough is mostly flat, with some rolling hills. The borough is located in the Allegheny Plateau region of Pennsylvania, and is part of the Allegheny Mountains. The borough is located in the watershed of the Monongahela River.
Economy
The economy of Churchill Borough is largely based on the service industry. The borough is home to a variety of restaurants, retail stores, and other businesses. The borough is also home to a number of small manufacturing companies.
The median household income in Churchill Borough is $45,000, and the median home value is $125,000. The unemployment rate in the borough is 4.2%, which is lower than the national average.
Demographics
As of the 2010 census, there were 3,072 people living in Churchill Borough. The population density was 2,541 people per square mile. The racial makeup of the borough was 87.3% White, 8.2% African American, 0.7% Asian, 0.3% Native American, and 3.5% from other races.
The median age in Churchill Borough is 40.5 years. About 25.3% of the population is under the age of 18, and 11.2% is over the age of 65. The gender makeup of the borough is 48.7% male and 51.3% female.
The median household income in Churchill Borough is $45,000, and the median home value is $125,000. The poverty rate in the borough is 8.3%, which is lower than the national average. The majority of the population is employed in the service industry.
Common Questions
What is the Total Population of Churchill borough?
Total Population of Churchill borough is 3,127.
What is the Total Male Population of Churchill borough?
Total Male Population of Churchill borough is 1,528.
What is the Total Female Population of Churchill borough?
Total Female Population of Churchill borough is 1,599.
What is the Ratio of Males per 100 Females in Churchill borough?
There are 95.56 Males per 100 Females in Churchill borough.
What is the Ratio of Females per 100 Males in Churchill borough?
There are 104.65 Females per 100 Males in Churchill borough.
What is the Median Population Age in Churchill borough?
Median Population Age in Churchill borough is 45.9 Years.
What is the Average Family Size in Churchill borough
Average Family Size in Churchill borough is 2.8 People.
What is the Average Household Size in Churchill borough
Average Household Size in Churchill borough is 2.4 People.
What is Per Capita Income in Churchill borough?
Per Capita income in Churchill borough is $53,203.
What is the Median Family Income in Churchill borough?
Median Family Income in Churchill borough is $118,137.
What is the Median Household income in Churchill borough?
Median Household Income in Churchill borough is $102,216.
What is Income or Wage Gap in Churchill borough?
Income or Wage Gap in Churchill borough is 39.3%.
Women in Churchill borough earn 60.7 cents for every dollar earned by a man.
What is Inequality or Gini Index in Churchill borough?
Inequality or Gini Index in Churchill borough is 0.37.
How Large is the Labor Force in Churchill borough?
There are 1,684 People in the Labor Forcein in Churchill borough.
What is the Percentage of People in the Labor Force in Churchill borough?
67.3% of People are in the Labor Force in Churchill borough.
What is the Unemployment Rate in Churchill borough?
Unemployment Rate in Churchill borough is 6.6%.