Waymart borough, PA
Waymart borough Overview
1,226
TOTAL POPULATION
495
MALE POPULATION
731
FEMALE POPULATION
67.72
MALES / 100 FEMALES
147.68
FEMALES / 100 MALES
38.0
MEDIAN AGE
3.4
AVG FAMILY SIZE
2.6
AVG HOUSEHOLD SIZE
$23,962
PER CAPITA INCOME
$70,417
AVG FAMILY INCOME
$50,568
AVG HOUSEHOLD INCOME
48.7%
WAGE / INCOME GAP [ % ]
51.3¢/ $1
WAGE / INCOME GAP [ $ ]
0.39
INEQUALITY / GINI INDEX
452
LABOR FORCE [ PEOPLE ]
48.5%
PERCENT IN LABOR FORCE
6.0%
UNEMPLOYMENT RATE
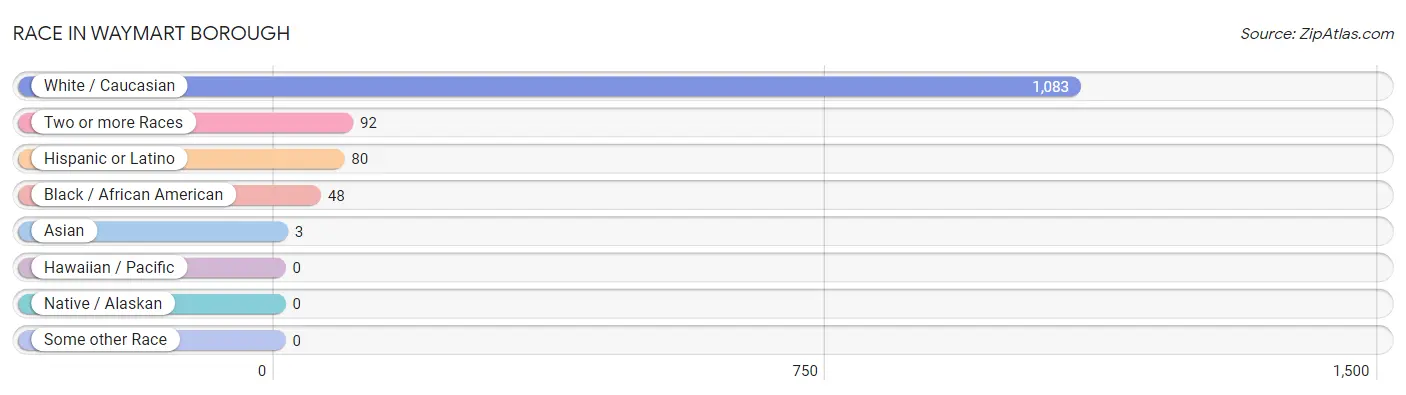
Race in Waymart borough
The most populous races in Waymart borough are White / Caucasian (1,083 | 88.3%), Two or more Races (92 | 7.5%), and Hispanic or Latino (80 | 6.5%).
| Race | # Population | % Population |
| Asian | 3 | 0.2% |
| Black / African American | 48 | 3.9% |
| Hawaiian / Pacific | 0 | 0.0% |
| Hispanic or Latino | 80 | 6.5% |
| Native / Alaskan | 0 | 0.0% |
| White / Caucasian | 1,083 | 88.3% |
| Two or more Races | 92 | 7.5% |
| Some other Race | 0 | 0.0% |
| Total | 1,226 | 100.0% |
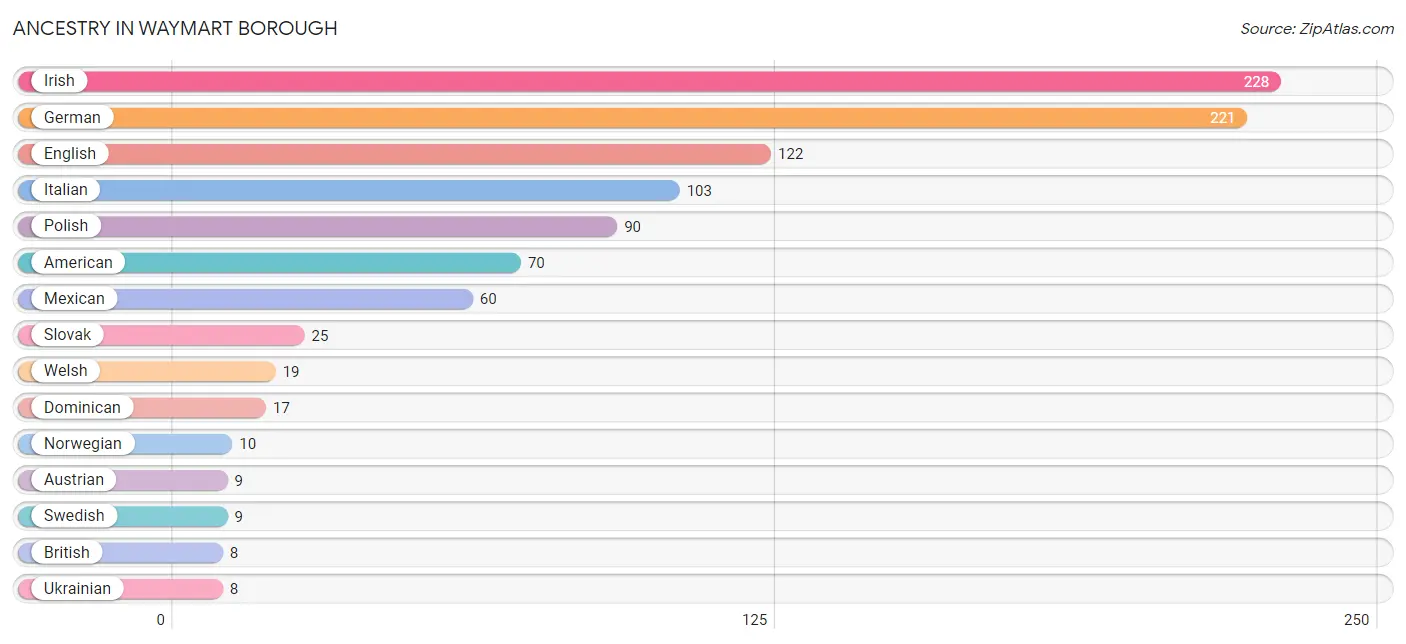
Ancestry in Waymart borough
The most populous ancestries reported in Waymart borough are Irish (228 | 18.6%), German (221 | 18.0%), English (122 | 10.0%), Italian (103 | 8.4%), and Polish (90 | 7.3%), together accounting for 62.3% of all Waymart borough residents.
| Ancestry | # Population | % Population |
| American | 70 | 5.7% |
| Austrian | 9 | 0.7% |
| Bhutanese | 3 | 0.2% |
| British | 8 | 0.6% |
| Cherokee | 6 | 0.5% |
| Cuban | 3 | 0.2% |
| Czechoslovakian | 3 | 0.2% |
| Danish | 3 | 0.2% |
| Dominican | 17 | 1.4% |
| English | 122 | 10.0% |
| European | 2 | 0.2% |
| French | 3 | 0.2% |
| German | 221 | 18.0% |
| Irish | 228 | 18.6% |
| Italian | 103 | 8.4% |
| Jamaican | 3 | 0.2% |
| Lithuanian | 4 | 0.3% |
| Mexican | 60 | 4.9% |
| Norwegian | 10 | 0.8% |
| Polish | 90 | 7.3% |
| Scotch-Irish | 4 | 0.3% |
| Slavic | 3 | 0.2% |
| Slovak | 25 | 2.0% |
| Swedish | 9 | 0.7% |
| Ukrainian | 8 | 0.6% |
| Welsh | 19 | 1.5% | View All 26 Rows |
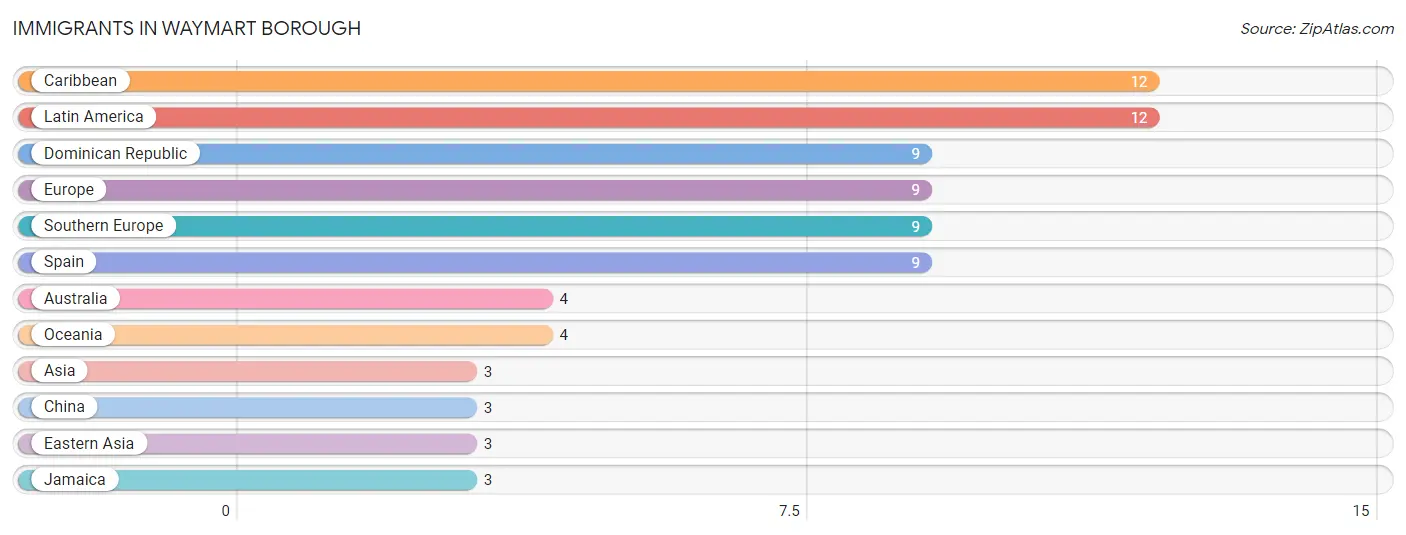
Immigrants in Waymart borough
The most numerous immigrant groups reported in Waymart borough came from Caribbean (12 | 1.0%), Latin America (12 | 1.0%), Dominican Republic (9 | 0.7%), Europe (9 | 0.7%), and Southern Europe (9 | 0.7%), together accounting for 4.2% of all Waymart borough residents.
| Immigration Origin | # Population | % Population |
| Asia | 3 | 0.2% |
| Australia | 4 | 0.3% |
| Caribbean | 12 | 1.0% |
| China | 3 | 0.2% |
| Dominican Republic | 9 | 0.7% |
| Eastern Asia | 3 | 0.2% |
| Europe | 9 | 0.7% |
| Jamaica | 3 | 0.2% |
| Latin America | 12 | 1.0% |
| Oceania | 4 | 0.3% |
| Southern Europe | 9 | 0.7% |
| Spain | 9 | 0.7% | View All 12 Rows |
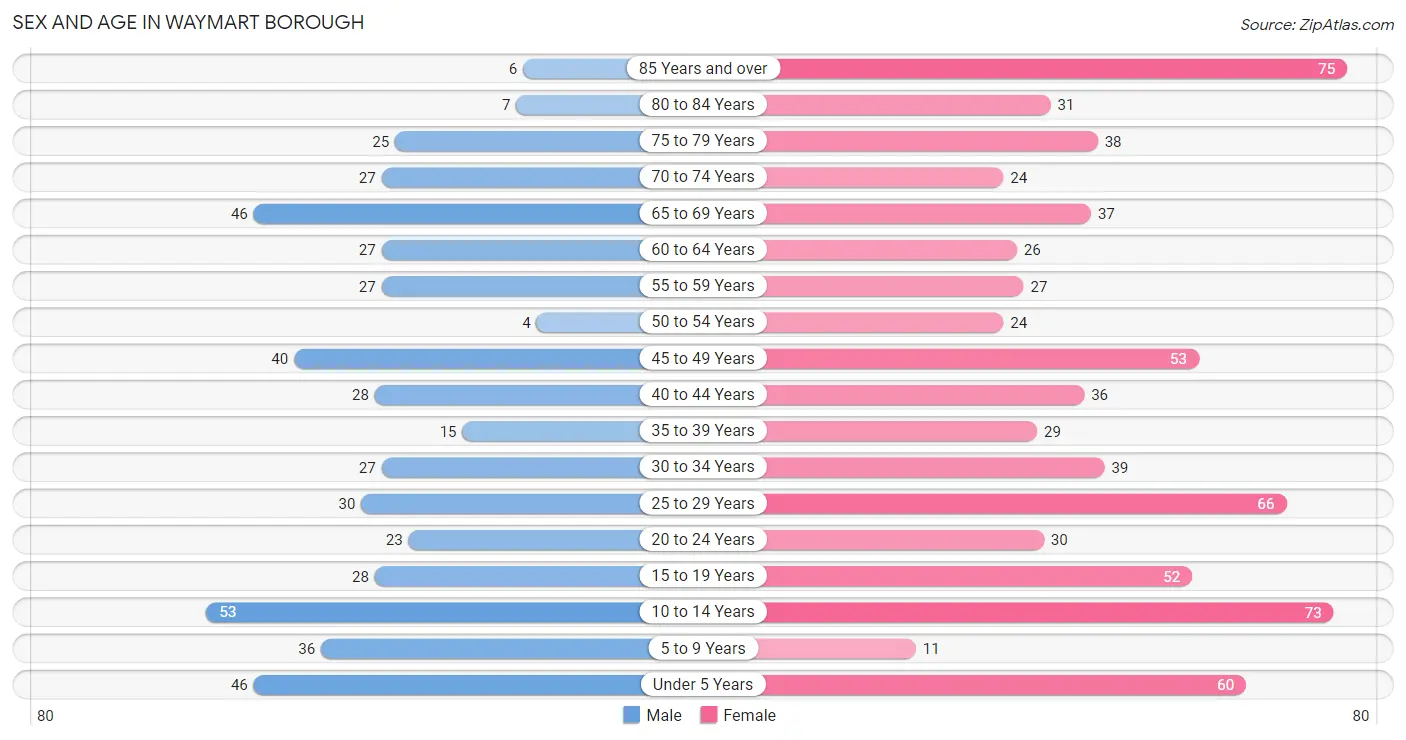
Sex and Age in Waymart borough
Sex and Age in Waymart borough
The most populous age groups in Waymart borough are 10 to 14 Years (53 | 10.7%) for men and 85 Years and over (75 | 10.3%) for women.
| Age Bracket | Male | Female |
| Under 5 Years | 46 (9.3%) | 60 (8.2%) |
| 5 to 9 Years | 36 (7.3%) | 11 (1.5%) |
| 10 to 14 Years | 53 (10.7%) | 73 (10.0%) |
| 15 to 19 Years | 28 (5.7%) | 52 (7.1%) |
| 20 to 24 Years | 23 (4.6%) | 30 (4.1%) |
| 25 to 29 Years | 30 (6.1%) | 66 (9.0%) |
| 30 to 34 Years | 27 (5.4%) | 39 (5.3%) |
| 35 to 39 Years | 15 (3.0%) | 29 (4.0%) |
| 40 to 44 Years | 28 (5.7%) | 36 (4.9%) |
| 45 to 49 Years | 40 (8.1%) | 53 (7.2%) |
| 50 to 54 Years | 4 (0.8%) | 24 (3.3%) |
| 55 to 59 Years | 27 (5.4%) | 27 (3.7%) |
| 60 to 64 Years | 27 (5.4%) | 26 (3.6%) |
| 65 to 69 Years | 46 (9.3%) | 37 (5.1%) |
| 70 to 74 Years | 27 (5.4%) | 24 (3.3%) |
| 75 to 79 Years | 25 (5.1%) | 38 (5.2%) |
| 80 to 84 Years | 7 (1.4%) | 31 (4.2%) |
| 85 Years and over | 6 (1.2%) | 75 (10.3%) |
| Total | 495 (100.0%) | 731 (100.0%) |
Families and Households in Waymart borough
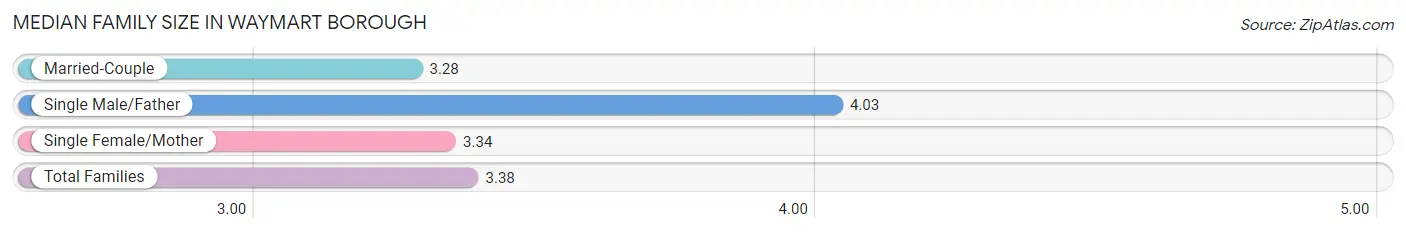
Median Family Size in Waymart borough
The median family size in Waymart borough is 3.38 persons per family, with single male/father families (30 | 11.6%) accounting for the largest median family size of 4.03 persons per family. On the other hand, married-couple families (173 | 66.8%) represent the smallest median family size with 3.28 persons per family.
| Family Type | # Families | Family Size |
| Married-Couple | 173 (66.8%) | 3.28 |
| Single Male/Father | 30 (11.6%) | 4.03 |
| Single Female/Mother | 56 (21.6%) | 3.34 |
| Total Families | 259 (100.0%) | 3.38 |
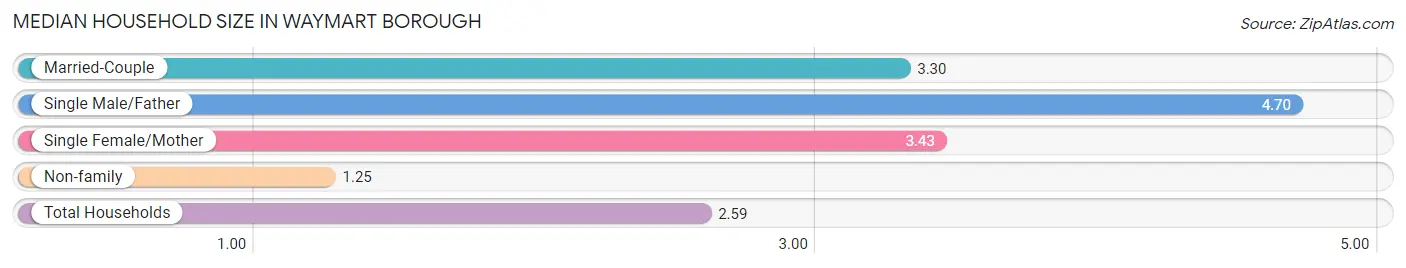
Median Household Size in Waymart borough
The median household size in Waymart borough is 2.59 persons per household, with single male/father households (30 | 6.9%) accounting for the largest median household size of 4.7 persons per household. non-family households (175 | 40.3%) represent the smallest median household size with 1.25 persons per household.
| Household Type | # Households | Household Size |
| Married-Couple | 173 (39.9%) | 3.30 |
| Single Male/Father | 30 (6.9%) | 4.70 |
| Single Female/Mother | 56 (12.9%) | 3.43 |
| Non-family | 175 (40.3%) | 1.25 |
| Total Households | 434 (100.0%) | 2.59 |
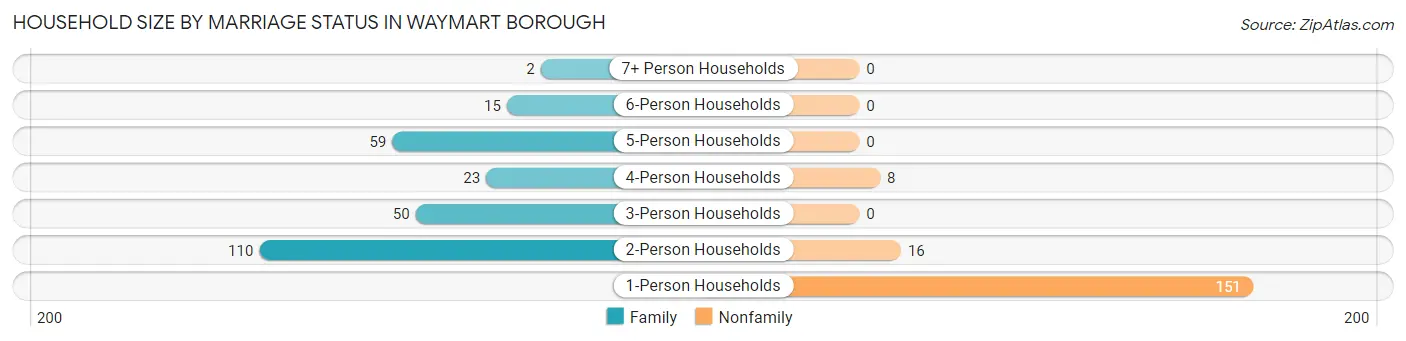
Household Size by Marriage Status in Waymart borough
Out of a total of 434 households in Waymart borough, 259 (59.7%) are family households, while 175 (40.3%) are nonfamily households. The most numerous type of family households are 2-person households, comprising 110, and the most common type of nonfamily households are 1-person households, comprising 151.
| Household Size | Family Households | Nonfamily Households |
| 1-Person Households | - | 151 (34.8%) |
| 2-Person Households | 110 (25.4%) | 16 (3.7%) |
| 3-Person Households | 50 (11.5%) | 0 (0.0%) |
| 4-Person Households | 23 (5.3%) | 8 (1.8%) |
| 5-Person Households | 59 (13.6%) | 0 (0.0%) |
| 6-Person Households | 15 (3.5%) | 0 (0.0%) |
| 7+ Person Households | 2 (0.5%) | 0 (0.0%) |
| Total | 259 (59.7%) | 175 (40.3%) |
Female Fertility in Waymart borough
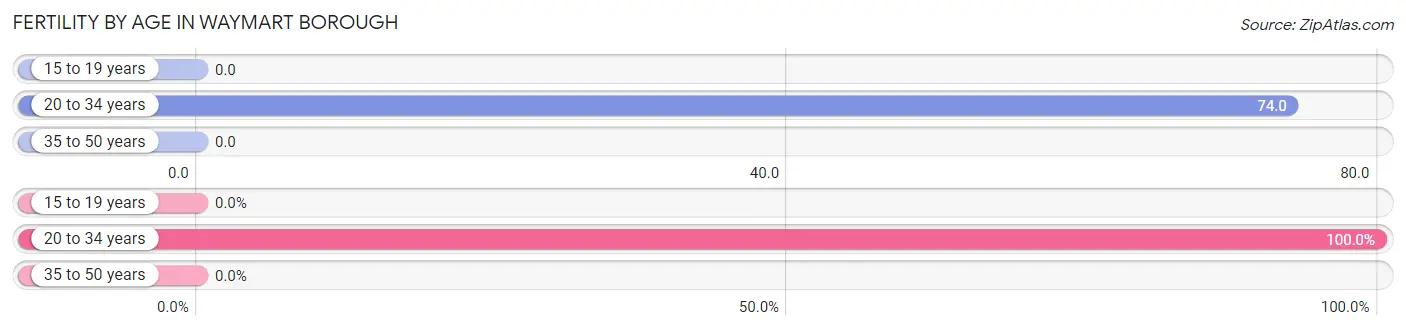
Fertility by Age in Waymart borough
Average fertility rate in Waymart borough is 33.0 births per 1,000 women. Women in the age bracket of 20 to 34 years have the highest fertility rate with 74.0 births per 1,000 women. Women in the age bracket of 20 to 34 years acount for 100.0% of all women with births.
| Age Bracket | Women with Births | Births / 1,000 Women |
| 15 to 19 years | 0 (0.0%) | 0.0 |
| 20 to 34 years | 10 (100.0%) | 74.0 |
| 35 to 50 years | 0 (0.0%) | 0.0 |
| Total | 10 (100.0%) | 33.0 |
Fertility by Age by Marriage Status in Waymart borough
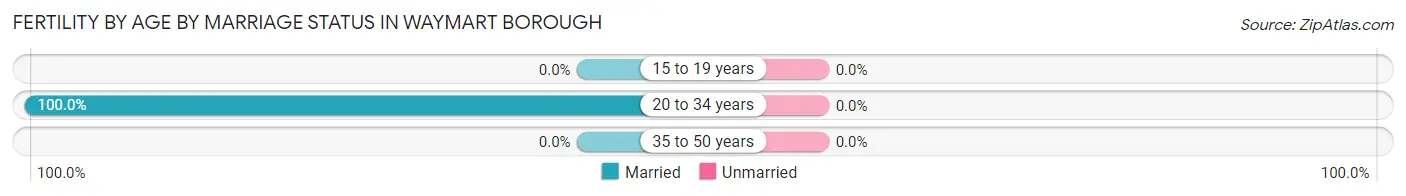
| Age Bracket | Married | Unmarried |
| 15 to 19 years | 0 (0.0%) | 0 (0.0%) |
| 20 to 34 years | 10 (100.0%) | 0 (0.0%) |
| 35 to 50 years | 0 (0.0%) | 0 (0.0%) |
| Total | 10 (100.0%) | 0 (0.0%) |
Fertility by Education in Waymart borough
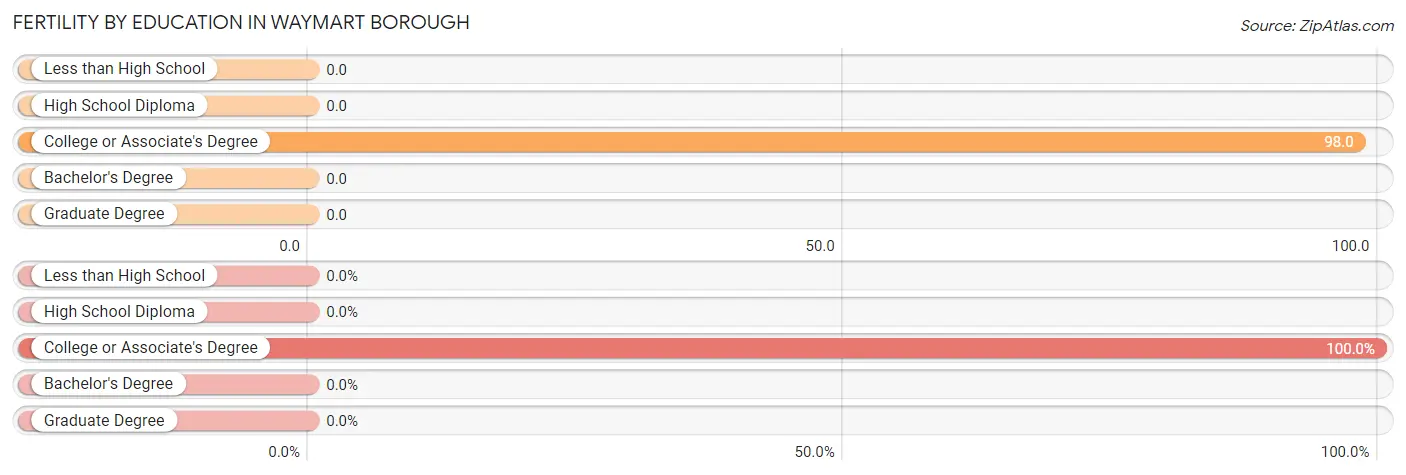
| Educational Attainment | Women with Births | Births / 1,000 Women |
| Less than High School | 0 (0.0%) | 0.0 |
| High School Diploma | 0 (0.0%) | 0.0 |
| College or Associate's Degree | 10 (100.0%) | 98.0 |
| Bachelor's Degree | 0 (0.0%) | 0.0 |
| Graduate Degree | 0 (0.0%) | 0.0 |
| Total | 10 (100.0%) | 33.0 |
Fertility by Education by Marriage Status in Waymart borough
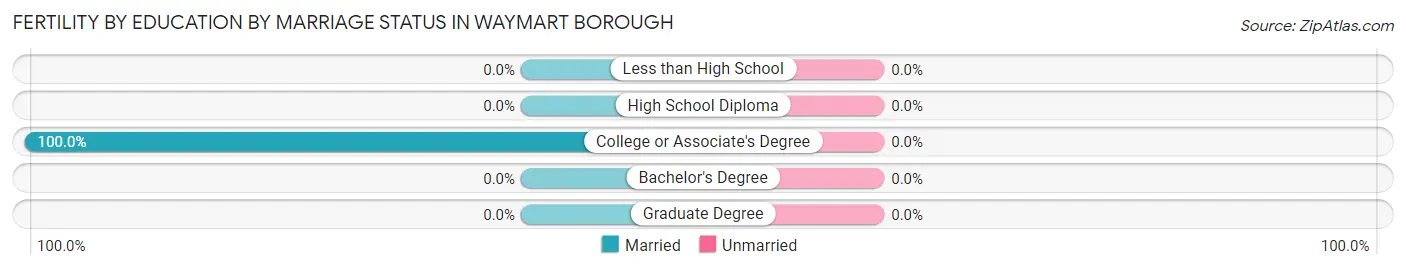
| Educational Attainment | Married | Unmarried |
| Less than High School | 0 (0.0%) | 0 (0.0%) |
| High School Diploma | 0 (0.0%) | 0 (0.0%) |
| College or Associate's Degree | 10 (100.0%) | 0 (0.0%) |
| Bachelor's Degree | 0 (0.0%) | 0 (0.0%) |
| Graduate Degree | 0 (0.0%) | 0 (0.0%) |
| Total | 10 (100.0%) | 0 (0.0%) |
Income in Waymart borough
Income Overview in Waymart borough
Per Capita Income in Waymart borough is $23,962, while median incomes of families and households are $70,417 and $50,568 respectively.
| Characteristic | Number | Measure |
| Per Capita Income | 1,226 | $23,962 |
| Median Family Income | 259 | $70,417 |
| Mean Family Income | 259 | $75,785 |
| Median Household Income | 434 | $50,568 |
| Mean Household Income | 434 | $60,999 |
| Income Deficit | 259 | $0 |
| Wage / Income Gap (%) | 1,226 | 48.66% |
| Wage / Income Gap ($) | 1,226 | 51.34¢ per $1 |
| Gini / Inequality Index | 1,226 | 0.39 |
Earnings by Sex in Waymart borough
Average Earnings in Waymart borough are $33,527, $54,750 for men and $28,106 for women, a difference of 48.7%.
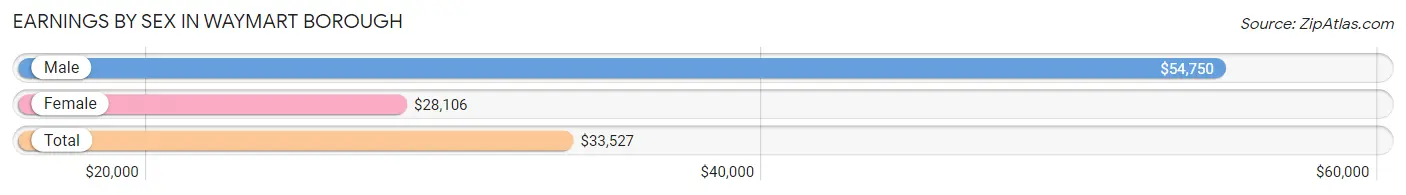
| Sex | Number | Average Earnings |
| Male | 211 (42.4%) | $54,750 |
| Female | 286 (57.6%) | $28,106 |
| Total | 497 (100.0%) | $33,527 |
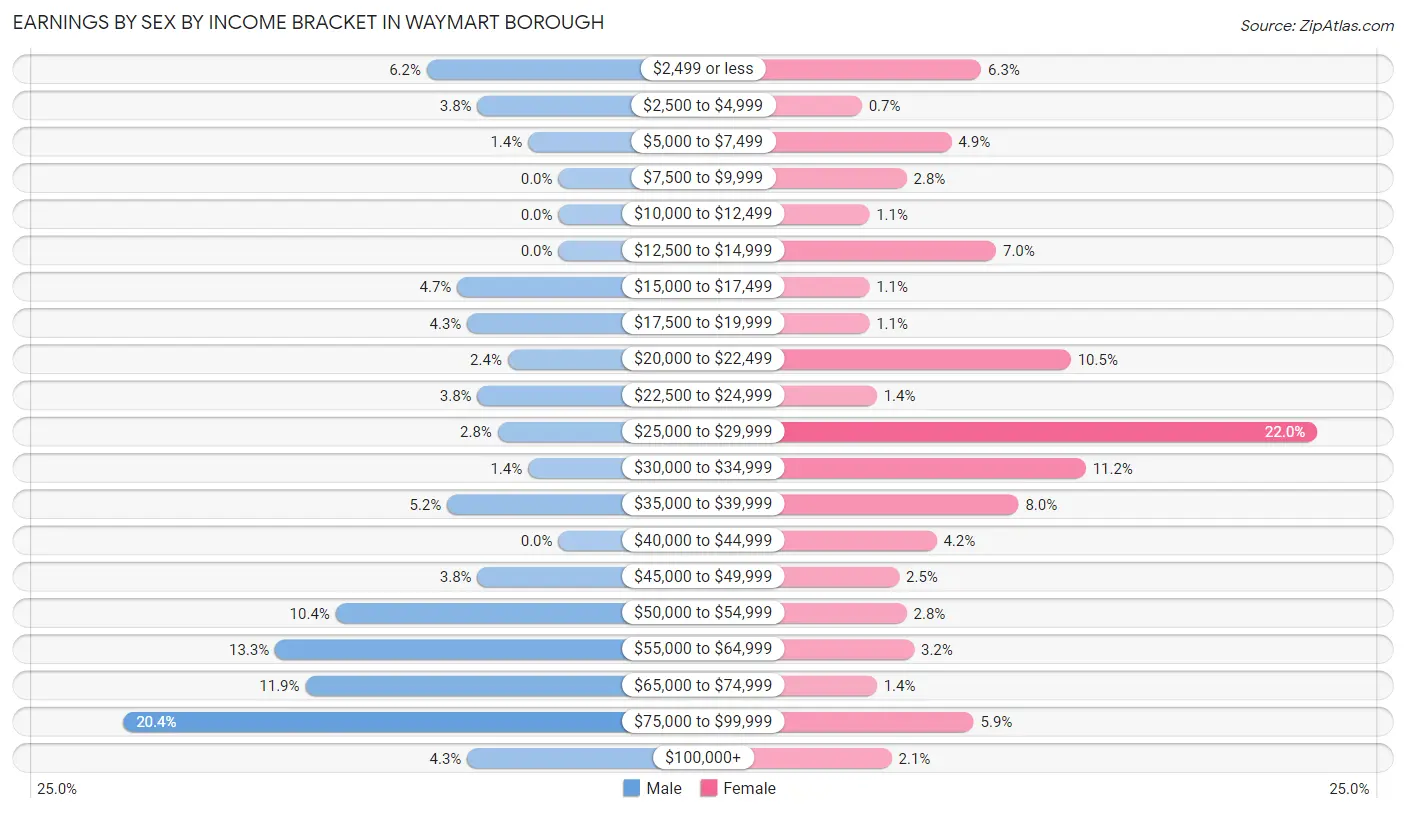
Earnings by Sex by Income Bracket in Waymart borough
The most common earnings brackets in Waymart borough are $75,000 to $99,999 for men (43 | 20.4%) and $25,000 to $29,999 for women (63 | 22.0%).
| Income | Male | Female |
| $2,499 or less | 13 (6.2%) | 18 (6.3%) |
| $2,500 to $4,999 | 8 (3.8%) | 2 (0.7%) |
| $5,000 to $7,499 | 3 (1.4%) | 14 (4.9%) |
| $7,500 to $9,999 | 0 (0.0%) | 8 (2.8%) |
| $10,000 to $12,499 | 0 (0.0%) | 3 (1.1%) |
| $12,500 to $14,999 | 0 (0.0%) | 20 (7.0%) |
| $15,000 to $17,499 | 10 (4.7%) | 3 (1.1%) |
| $17,500 to $19,999 | 9 (4.3%) | 3 (1.1%) |
| $20,000 to $22,499 | 5 (2.4%) | 30 (10.5%) |
| $22,500 to $24,999 | 8 (3.8%) | 4 (1.4%) |
| $25,000 to $29,999 | 6 (2.8%) | 63 (22.0%) |
| $30,000 to $34,999 | 3 (1.4%) | 32 (11.2%) |
| $35,000 to $39,999 | 11 (5.2%) | 23 (8.0%) |
| $40,000 to $44,999 | 0 (0.0%) | 12 (4.2%) |
| $45,000 to $49,999 | 8 (3.8%) | 7 (2.5%) |
| $50,000 to $54,999 | 22 (10.4%) | 8 (2.8%) |
| $55,000 to $64,999 | 28 (13.3%) | 9 (3.2%) |
| $65,000 to $74,999 | 25 (11.8%) | 4 (1.4%) |
| $75,000 to $99,999 | 43 (20.4%) | 17 (5.9%) |
| $100,000+ | 9 (4.3%) | 6 (2.1%) |
| Total | 211 (100.0%) | 286 (100.0%) |
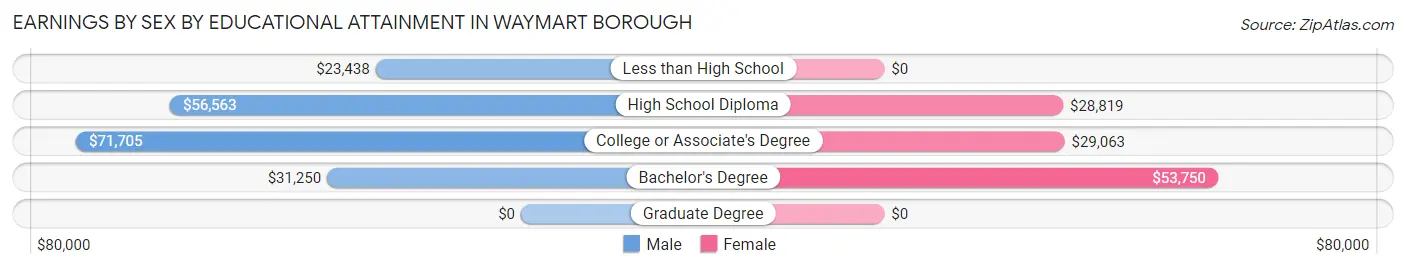
Earnings by Sex by Educational Attainment in Waymart borough
Average earnings in Waymart borough are $59,875 for men and $29,760 for women, a difference of 50.3%. Men with an educational attainment of college or associate's degree enjoy the highest average annual earnings of $71,705, while those with less than high school education earn the least with $23,438. Women with an educational attainment of bachelor's degree earn the most with the average annual earnings of $53,750, while those with high school diploma education have the smallest earnings of $28,819.
| Educational Attainment | Male Income | Female Income |
| Less than High School | $23,438 | $0 |
| High School Diploma | $56,563 | $28,819 |
| College or Associate's Degree | $71,705 | $29,063 |
| Bachelor's Degree | $31,250 | $53,750 |
| Graduate Degree | - | - |
| Total | $59,875 | $29,760 |
Family Income in Waymart borough
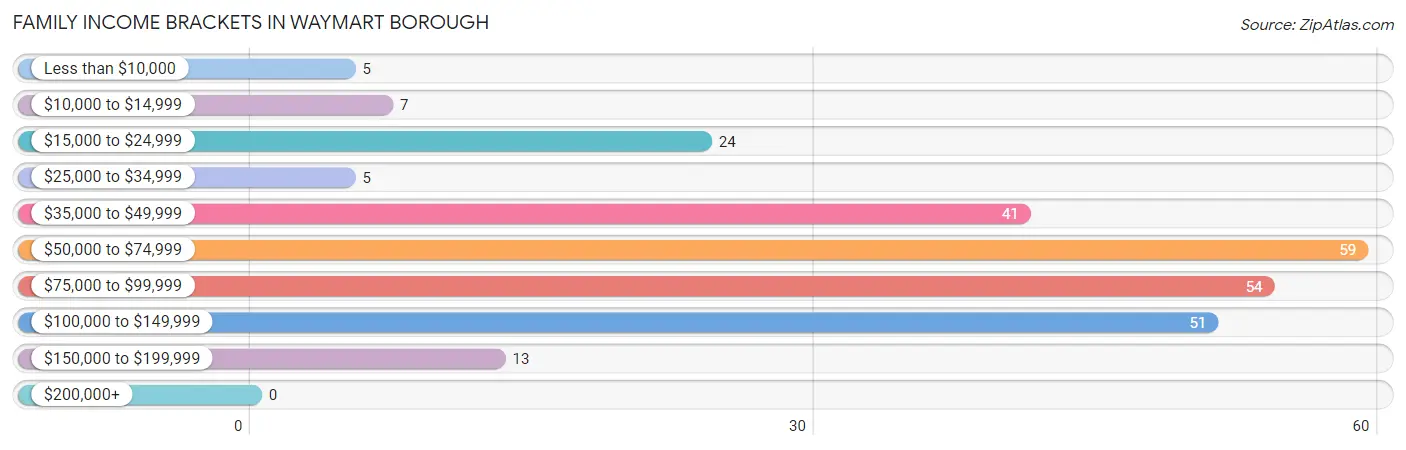
Family Income Brackets in Waymart borough
According to the Waymart borough family income data, there are 59 families falling into the $50,000 to $74,999 income range, which is the most common income bracket and makes up 22.8% of all families.
| Income Bracket | # Families | % Families |
| Less than $10,000 | 5 | 1.9% |
| $10,000 to $14,999 | 7 | 2.7% |
| $15,000 to $24,999 | 24 | 9.3% |
| $25,000 to $34,999 | 5 | 1.9% |
| $35,000 to $49,999 | 41 | 15.8% |
| $50,000 to $74,999 | 59 | 22.8% |
| $75,000 to $99,999 | 54 | 20.8% |
| $100,000 to $149,999 | 51 | 19.7% |
| $150,000 to $199,999 | 13 | 5.0% |
| $200,000+ | 0 | 0.0% |
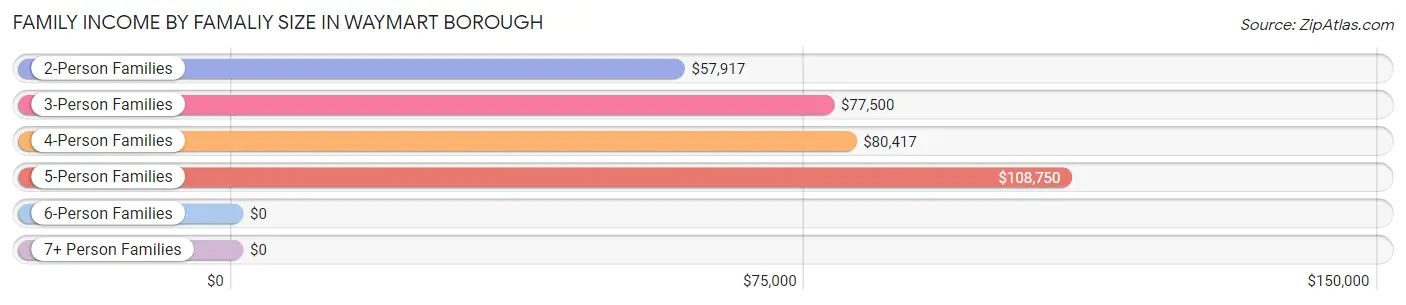
Family Income by Famaliy Size in Waymart borough
5-person families (36 | 13.9%) account for the highest median family income in Waymart borough with $108,750 per family, while 2-person families (115 | 44.4%) have the highest median income of $28,958 per family member.
| Income Bracket | # Families | Median Income |
| 2-Person Families | 115 (44.4%) | $57,917 |
| 3-Person Families | 50 (19.3%) | $77,500 |
| 4-Person Families | 41 (15.8%) | $80,417 |
| 5-Person Families | 36 (13.9%) | $108,750 |
| 6-Person Families | 15 (5.8%) | $0 |
| 7+ Person Families | 2 (0.8%) | $0 |
| Total | 259 (100.0%) | $70,417 |
Family Income by Number of Earners in Waymart borough
The median family income in Waymart borough is $70,417, with families comprising 3+ earners (42) having the highest median family income of $120,536, while families with no earners (47) have the lowest median family income of $49,297, accounting for 16.2% and 18.1% of families, respectively.
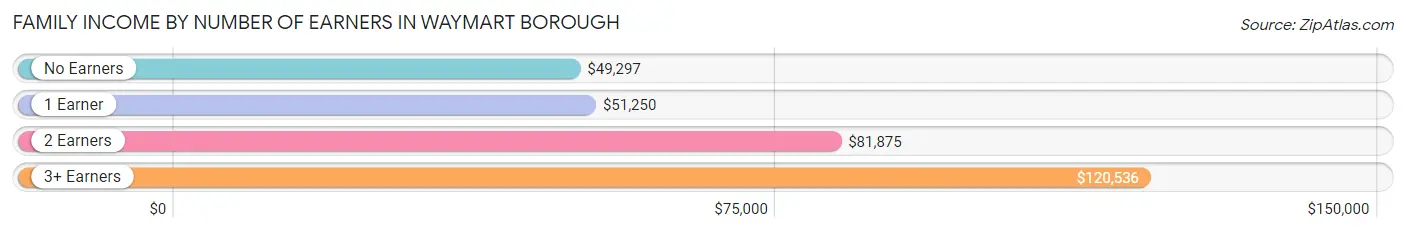
| Number of Earners | # Families | Median Income |
| No Earners | 47 (18.1%) | $49,297 |
| 1 Earner | 100 (38.6%) | $51,250 |
| 2 Earners | 70 (27.0%) | $81,875 |
| 3+ Earners | 42 (16.2%) | $120,536 |
| Total | 259 (100.0%) | $70,417 |
Household Income in Waymart borough
Household Income Brackets in Waymart borough
With 87 households falling in the category, the $50,000 to $74,999 income range is the most frequent in Waymart borough, accounting for 20.1% of all households. In contrast, only 5 households (1.1%) fall into the $200,000+ income bracket, making it the least populous group.
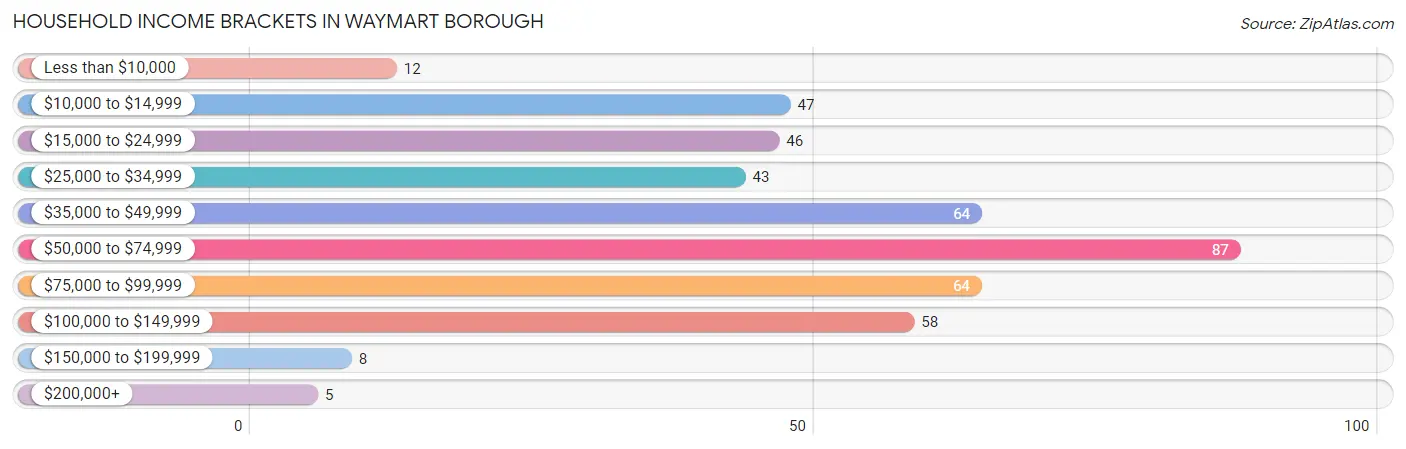
| Income Bracket | # Households | % Households |
| Less than $10,000 | 12 | 2.8% |
| $10,000 to $14,999 | 47 | 10.8% |
| $15,000 to $24,999 | 46 | 10.6% |
| $25,000 to $34,999 | 43 | 9.9% |
| $35,000 to $49,999 | 64 | 14.7% |
| $50,000 to $74,999 | 87 | 20.0% |
| $75,000 to $99,999 | 64 | 14.7% |
| $100,000 to $149,999 | 58 | 13.4% |
| $150,000 to $199,999 | 8 | 1.8% |
| $200,000+ | 5 | 1.2% |
Household Income by Householder Age in Waymart borough
The median household income in Waymart borough is $50,568, with the highest median household income of $68,571 found in the 25 to 44 years age bracket for the primary householder. A total of 126 households (29.0%) fall into this category. Meanwhile, the 45 to 64 years age bracket for the primary householder has the lowest median household income of $39,643, with 150 households (34.6%) in this group.
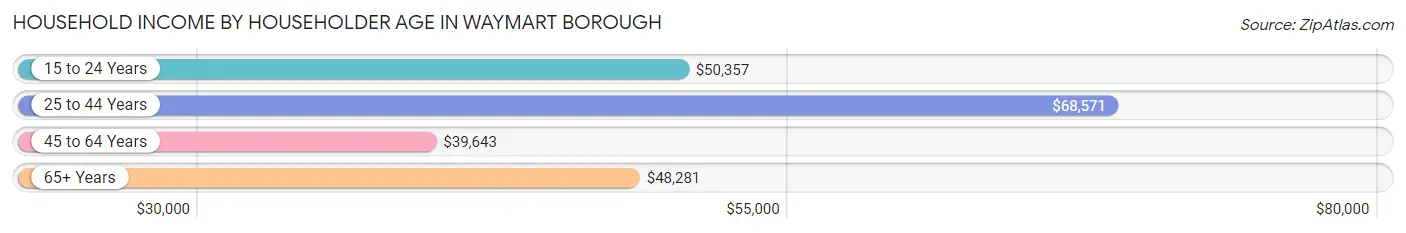
| Income Bracket | # Households | Median Income |
| 15 to 24 Years | 24 (5.5%) | $50,357 |
| 25 to 44 Years | 126 (29.0%) | $68,571 |
| 45 to 64 Years | 150 (34.6%) | $39,643 |
| 65+ Years | 134 (30.9%) | $48,281 |
| Total | 434 (100.0%) | $50,568 |
Poverty in Waymart borough
Income Below Poverty by Sex and Age in Waymart borough
With 13.0% poverty level for males and 15.2% for females among the residents of Waymart borough, 15 year old males and 55 to 64 year old females are the most vulnerable to poverty, with 3 males (100.0%) and 16 females (30.2%) in their respective age groups living below the poverty level.
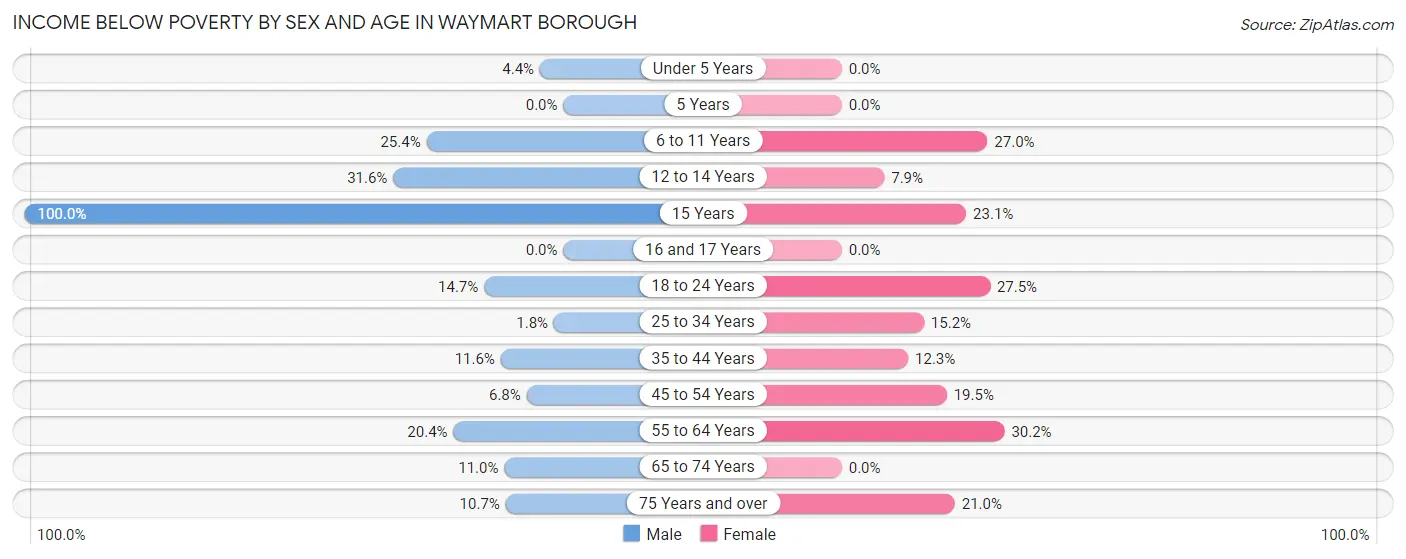
| Age Bracket | Male | Female |
| Under 5 Years | 2 (4.3%) | 0 (0.0%) |
| 5 Years | 0 (0.0%) | 0 (0.0%) |
| 6 to 11 Years | 16 (25.4%) | 10 (27.0%) |
| 12 to 14 Years | 6 (31.6%) | 3 (7.9%) |
| 15 Years | 3 (100.0%) | 3 (23.1%) |
| 16 and 17 Years | 0 (0.0%) | 0 (0.0%) |
| 18 to 24 Years | 5 (14.7%) | 11 (27.5%) |
| 25 to 34 Years | 1 (1.8%) | 16 (15.2%) |
| 35 to 44 Years | 5 (11.6%) | 8 (12.3%) |
| 45 to 54 Years | 3 (6.8%) | 15 (19.5%) |
| 55 to 64 Years | 10 (20.4%) | 16 (30.2%) |
| 65 to 74 Years | 8 (11.0%) | 0 (0.0%) |
| 75 Years and over | 3 (10.7%) | 13 (21.0%) |
| Total | 62 (13.0%) | 95 (15.2%) |
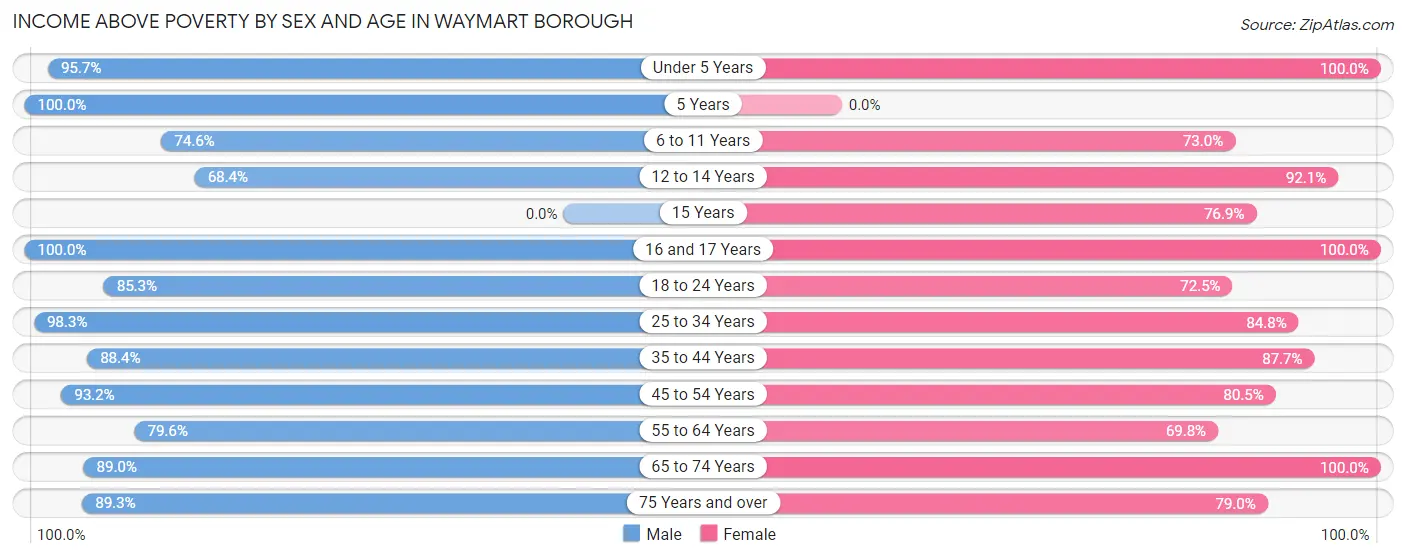
Income Above Poverty by Sex and Age in Waymart borough
According to the poverty statistics in Waymart borough, males aged 5 years and females aged under 5 years are the age groups that are most secure financially, with 100.0% of males and 100.0% of females in these age groups living above the poverty line.
| Age Bracket | Male | Female |
| Under 5 Years | 44 (95.7%) | 51 (100.0%) |
| 5 Years | 3 (100.0%) | 0 (0.0%) |
| 6 to 11 Years | 47 (74.6%) | 27 (73.0%) |
| 12 to 14 Years | 13 (68.4%) | 35 (92.1%) |
| 15 Years | 0 (0.0%) | 10 (76.9%) |
| 16 and 17 Years | 14 (100.0%) | 29 (100.0%) |
| 18 to 24 Years | 29 (85.3%) | 29 (72.5%) |
| 25 to 34 Years | 56 (98.3%) | 89 (84.8%) |
| 35 to 44 Years | 38 (88.4%) | 57 (87.7%) |
| 45 to 54 Years | 41 (93.2%) | 62 (80.5%) |
| 55 to 64 Years | 39 (79.6%) | 37 (69.8%) |
| 65 to 74 Years | 65 (89.0%) | 55 (100.0%) |
| 75 Years and over | 25 (89.3%) | 49 (79.0%) |
| Total | 414 (87.0%) | 530 (84.8%) |
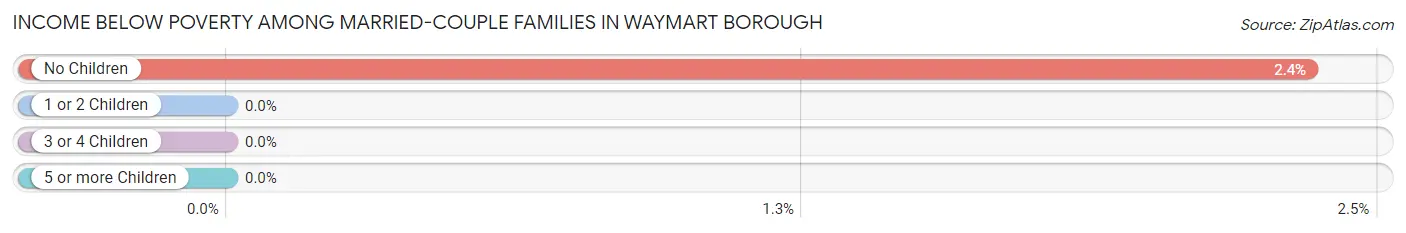
Income Below Poverty Among Married-Couple Families in Waymart borough
The poverty statistics for married-couple families in Waymart borough show that 1.2% or 2 of the total 173 families live below the poverty line. Families with no children have the highest poverty rate of 2.4%, comprising of 2 families. On the other hand, families with 1 or 2 children have the lowest poverty rate of 0.0%, which includes 0 families.
| Children | Above Poverty | Below Poverty |
| No Children | 83 (97.7%) | 2 (2.4%) |
| 1 or 2 Children | 63 (100.0%) | 0 (0.0%) |
| 3 or 4 Children | 25 (100.0%) | 0 (0.0%) |
| 5 or more Children | 0 (0.0%) | 0 (0.0%) |
| Total | 171 (98.8%) | 2 (1.2%) |
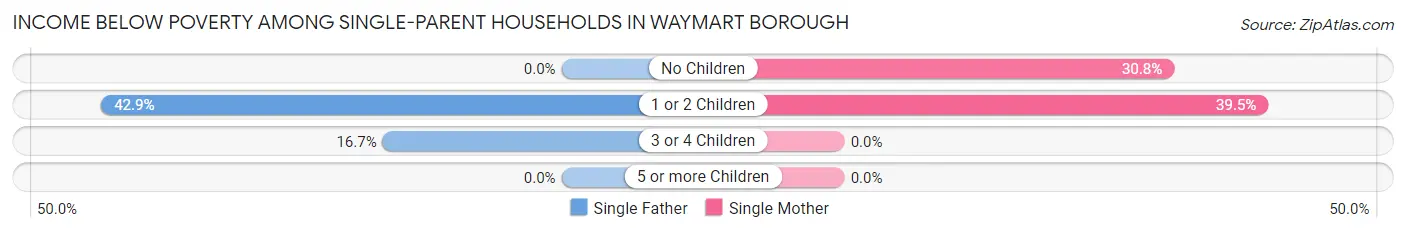
Income Below Poverty Among Single-Parent Households in Waymart borough
According to the poverty data in Waymart borough, 16.7% or 5 single-father households and 37.5% or 21 single-mother households are living below the poverty line. Among single-father households, those with 1 or 2 children have the highest poverty rate, with 3 households (42.9%) experiencing poverty. Likewise, among single-mother households, those with 1 or 2 children have the highest poverty rate, with 17 households (39.5%) falling below the poverty line.
| Children | Single Father | Single Mother |
| No Children | 0 (0.0%) | 4 (30.8%) |
| 1 or 2 Children | 3 (42.9%) | 17 (39.5%) |
| 3 or 4 Children | 2 (16.7%) | 0 (0.0%) |
| 5 or more Children | 0 (0.0%) | 0 (0.0%) |
| Total | 5 (16.7%) | 21 (37.5%) |
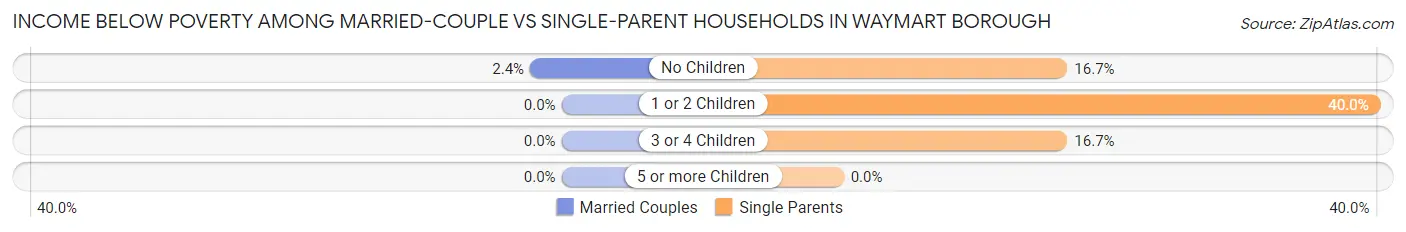
Income Below Poverty Among Married-Couple vs Single-Parent Households in Waymart borough
The poverty data for Waymart borough shows that 2 of the married-couple family households (1.2%) and 26 of the single-parent households (30.2%) are living below the poverty level. Within the married-couple family households, those with no children have the highest poverty rate, with 2 households (2.4%) falling below the poverty line. Among the single-parent households, those with 1 or 2 children have the highest poverty rate, with 20 household (40.0%) living below poverty.
| Children | Married-Couple Families | Single-Parent Households |
| No Children | 2 (2.4%) | 4 (16.7%) |
| 1 or 2 Children | 0 (0.0%) | 20 (40.0%) |
| 3 or 4 Children | 0 (0.0%) | 2 (16.7%) |
| 5 or more Children | 0 (0.0%) | 0 (0.0%) |
| Total | 2 (1.2%) | 26 (30.2%) |
Employment Characteristics in Waymart borough
Employment by Class of Employer in Waymart borough
Among the 417 employed individuals in Waymart borough, private company employees (305 | 73.1%), not-for-profit organizations (50 | 12.0%), and federal government employees (39 | 9.3%) make up the most common classes of employment.

| Employer Class | # Employees | % Employees |
| Private Company Employees | 305 | 73.1% |
| Self-Employed (Incorporated) | 11 | 2.6% |
| Self-Employed (Not Incorporated) | 0 | 0.0% |
| Not-for-profit Organizations | 50 | 12.0% |
| Local Government Employees | 9 | 2.2% |
| State Government Employees | 3 | 0.7% |
| Federal Government Employees | 39 | 9.3% |
| Unpaid Family Workers | 0 | 0.0% |
| Total | 417 | 100.0% |
Employment Status by Age in Waymart borough
According to the labor force statistics for Waymart borough, out of the total population over 16 years of age (931), 48.5% or 452 individuals are in the labor force, with 6.0% or 27 of them unemployed. The age group with the highest labor force participation rate is 35 to 44 years, with 83.3% or 90 individuals in the labor force. Within the labor force, the 16 to 19 years age range has the highest percentage of unemployed individuals, with 32.6% or 14 of them being unemployed.
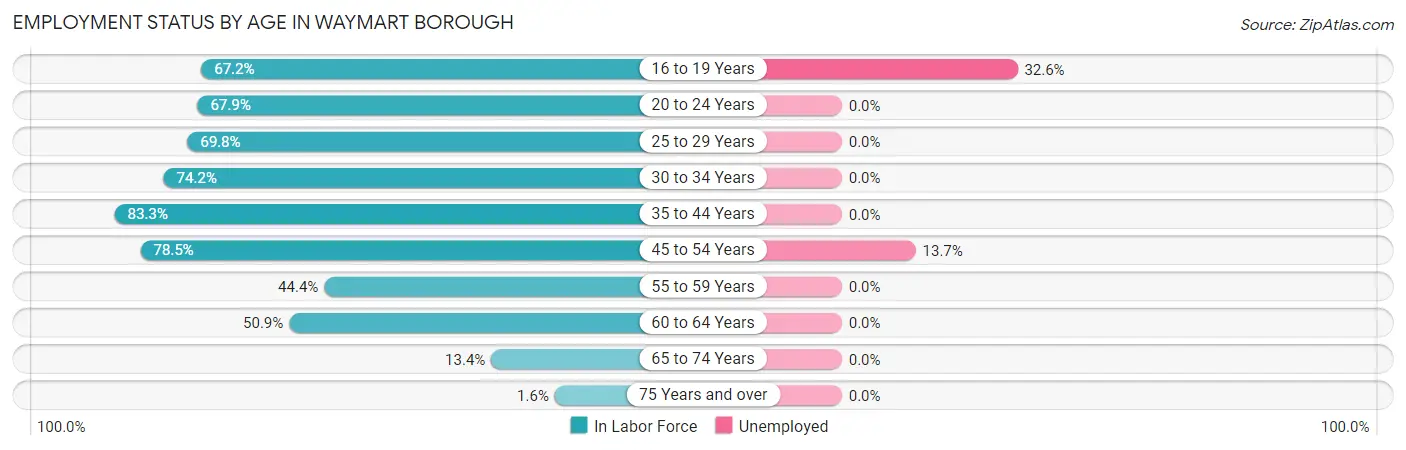
| Age Bracket | In Labor Force | Unemployed |
| 16 to 19 Years | 43 (67.2%) | 14 (32.6%) |
| 20 to 24 Years | 36 (67.9%) | 0 (0.0%) |
| 25 to 29 Years | 67 (69.8%) | 0 (0.0%) |
| 30 to 34 Years | 49 (74.2%) | 0 (0.0%) |
| 35 to 44 Years | 90 (83.3%) | 0 (0.0%) |
| 45 to 54 Years | 95 (78.5%) | 13 (13.7%) |
| 55 to 59 Years | 24 (44.4%) | 0 (0.0%) |
| 60 to 64 Years | 27 (50.9%) | 0 (0.0%) |
| 65 to 74 Years | 18 (13.4%) | 0 (0.0%) |
| 75 Years and over | 3 (1.6%) | 0 (0.0%) |
| Total | 452 (48.5%) | 27 (6.0%) |
Employment Status by Educational Attainment in Waymart borough
According to labor force statistics for Waymart borough, 70.7% of individuals (352) out of the total population between 25 and 64 years of age (498) are in the labor force, with 3.7% or 13 of them being unemployed. The group with the highest labor force participation rate are those with the educational attainment of bachelor's degree or higher, with 85.1% or 40 individuals in the labor force. Within the labor force, individuals with college / associate degree education have the highest percentage of unemployment, with 10.9% or 13 of them being unemployed.
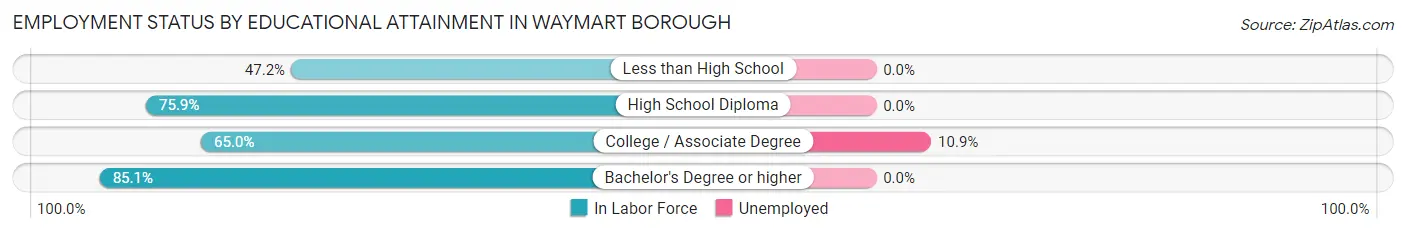
| Educational Attainment | In Labor Force | Unemployed |
| Less than High School | 17 (47.2%) | 0 (0.0%) |
| High School Diploma | 176 (75.9%) | 0 (0.0%) |
| College / Associate Degree | 119 (65.0%) | 20 (10.9%) |
| Bachelor's Degree or higher | 40 (85.1%) | 0 (0.0%) |
| Total | 352 (70.7%) | 18 (3.7%) |
Employment Occupations by Sex in Waymart borough
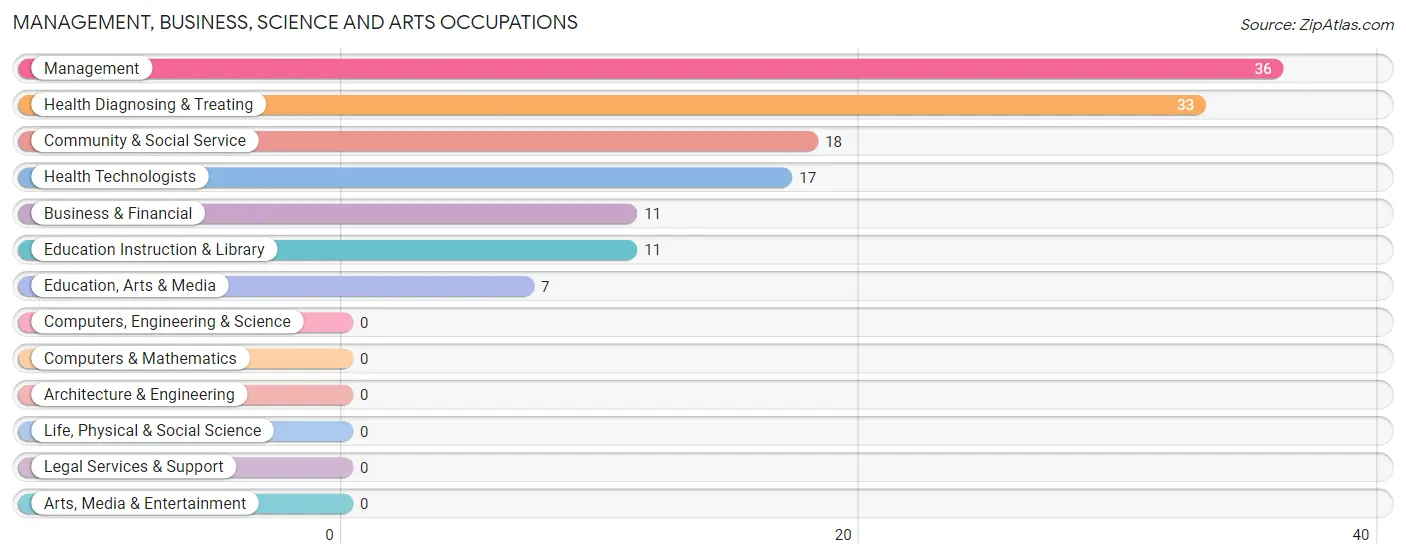
Management, Business, Science and Arts Occupations
The most common Management, Business, Science and Arts occupations in Waymart borough are Management (36 | 8.5%), Health Diagnosing & Treating (33 | 7.8%), Community & Social Service (18 | 4.2%), Health Technologists (17 | 4.0%), and Business & Financial (11 | 2.6%).
Management, Business, Science and Arts Occupations by Sex
Within the Management, Business, Science and Arts occupations in Waymart borough, the most male-oriented occupations are Business & Financial (63.6%), Management (52.8%), and Education Instruction & Library (45.5%), while the most female-oriented occupations are Education, Arts & Media (100.0%), Health Diagnosing & Treating (87.9%), and Health Technologists (76.5%).
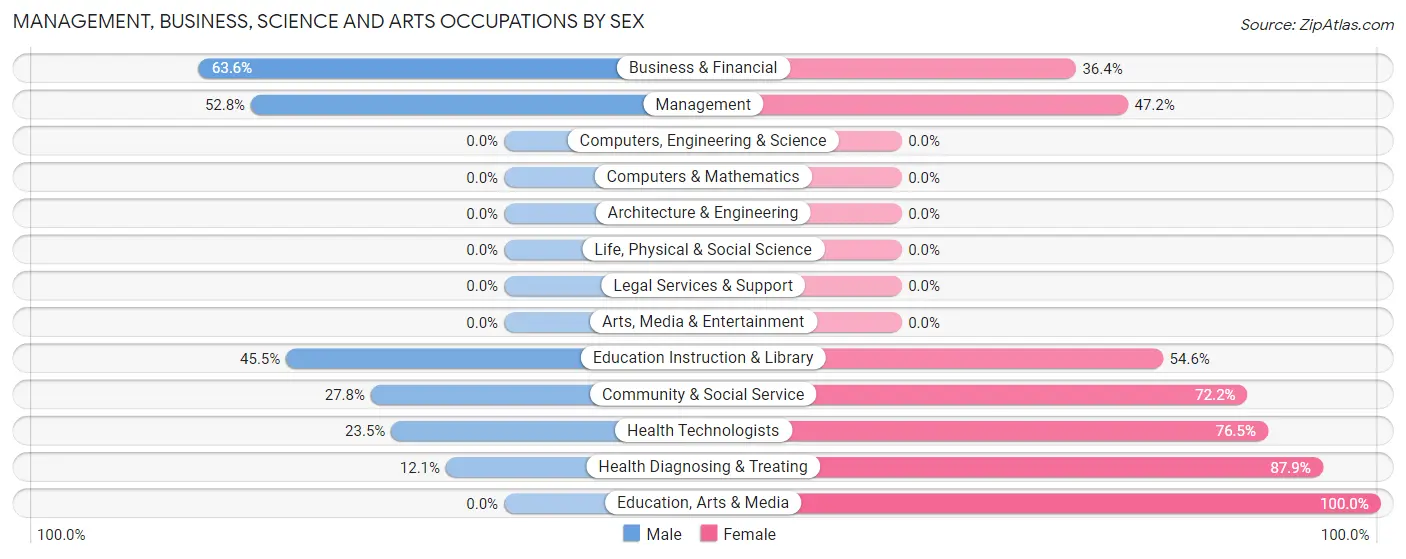
| Occupation | Male | Female |
| Management | 19 (52.8%) | 17 (47.2%) |
| Business & Financial | 7 (63.6%) | 4 (36.4%) |
| Computers, Engineering & Science | 0 (0.0%) | 0 (0.0%) |
| Computers & Mathematics | 0 (0.0%) | 0 (0.0%) |
| Architecture & Engineering | 0 (0.0%) | 0 (0.0%) |
| Life, Physical & Social Science | 0 (0.0%) | 0 (0.0%) |
| Community & Social Service | 5 (27.8%) | 13 (72.2%) |
| Education, Arts & Media | 0 (0.0%) | 7 (100.0%) |
| Legal Services & Support | 0 (0.0%) | 0 (0.0%) |
| Education Instruction & Library | 5 (45.5%) | 6 (54.5%) |
| Arts, Media & Entertainment | 0 (0.0%) | 0 (0.0%) |
| Health Diagnosing & Treating | 4 (12.1%) | 29 (87.9%) |
| Health Technologists | 4 (23.5%) | 13 (76.5%) |
| Total (Category) | 35 (35.7%) | 63 (64.3%) |
| Total (Overall) | 189 (44.5%) | 236 (55.5%) |
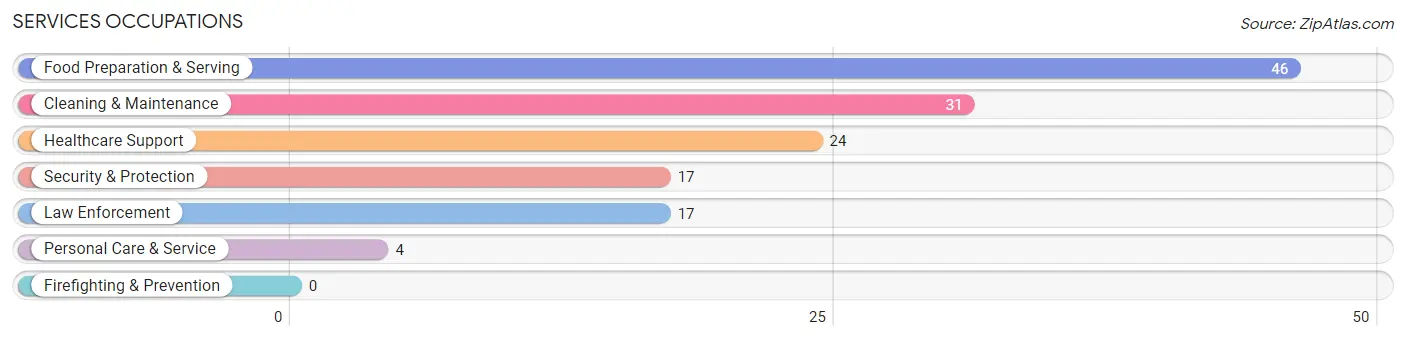
Services Occupations
The most common Services occupations in Waymart borough are Food Preparation & Serving (46 | 10.8%), Cleaning & Maintenance (31 | 7.3%), Healthcare Support (24 | 5.7%), Security & Protection (17 | 4.0%), and Law Enforcement (17 | 4.0%).
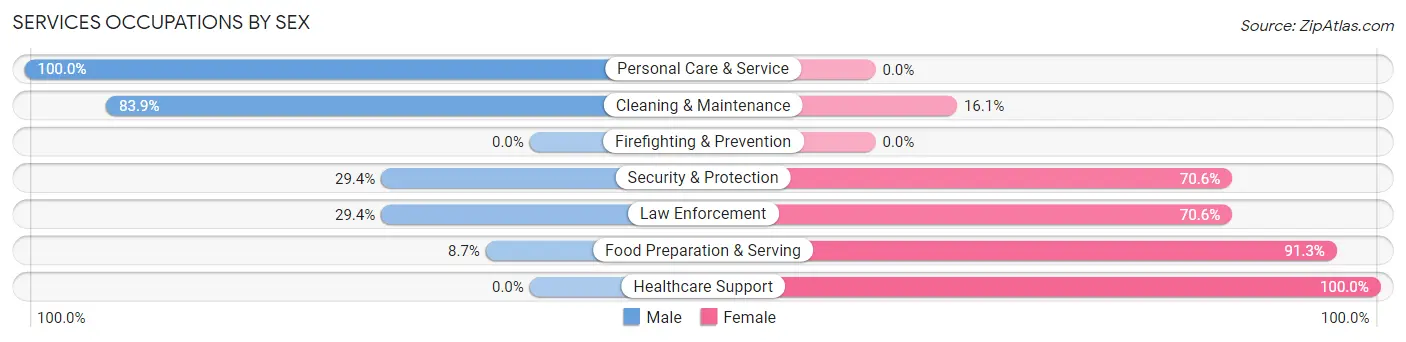
Services Occupations by Sex
Within the Services occupations in Waymart borough, the most male-oriented occupations are Personal Care & Service (100.0%), Cleaning & Maintenance (83.9%), and Security & Protection (29.4%), while the most female-oriented occupations are Healthcare Support (100.0%), Food Preparation & Serving (91.3%), and Security & Protection (70.6%).
| Occupation | Male | Female |
| Healthcare Support | 0 (0.0%) | 24 (100.0%) |
| Security & Protection | 5 (29.4%) | 12 (70.6%) |
| Firefighting & Prevention | 0 (0.0%) | 0 (0.0%) |
| Law Enforcement | 5 (29.4%) | 12 (70.6%) |
| Food Preparation & Serving | 4 (8.7%) | 42 (91.3%) |
| Cleaning & Maintenance | 26 (83.9%) | 5 (16.1%) |
| Personal Care & Service | 4 (100.0%) | 0 (0.0%) |
| Total (Category) | 39 (32.0%) | 83 (68.0%) |
| Total (Overall) | 189 (44.5%) | 236 (55.5%) |
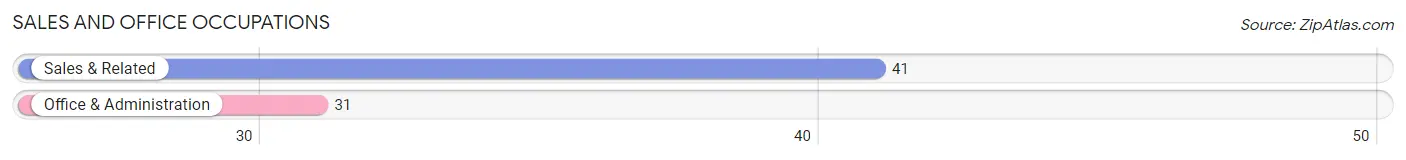
Sales and Office Occupations
The most common Sales and Office occupations in Waymart borough are Sales & Related (41 | 9.7%), and Office & Administration (31 | 7.3%).
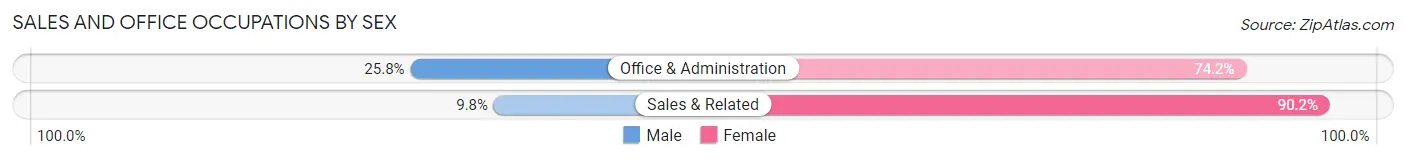
Sales and Office Occupations by Sex
| Occupation | Male | Female |
| Sales & Related | 4 (9.8%) | 37 (90.2%) |
| Office & Administration | 8 (25.8%) | 23 (74.2%) |
| Total (Category) | 12 (16.7%) | 60 (83.3%) |
| Total (Overall) | 189 (44.5%) | 236 (55.5%) |
Natural Resources, Construction and Maintenance Occupations
The most common Natural Resources, Construction and Maintenance occupations in Waymart borough are Construction & Extraction (41 | 9.7%), and Installation, Maintenance & Repair (17 | 4.0%).
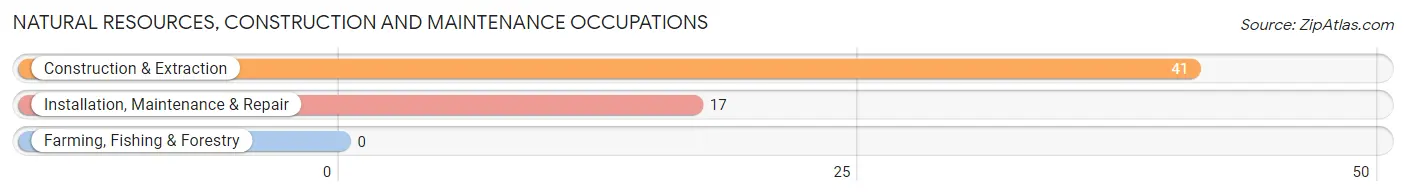
Natural Resources, Construction and Maintenance Occupations by Sex
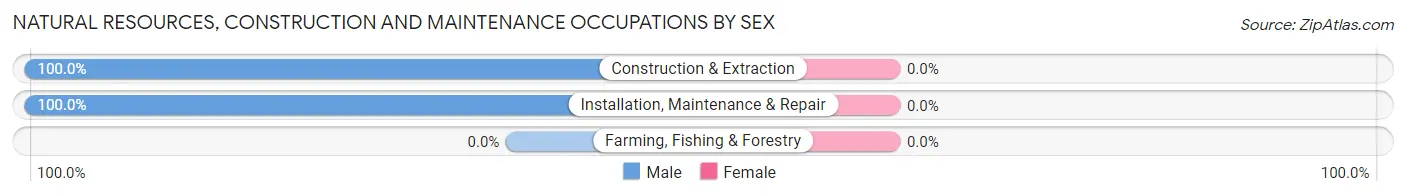
| Occupation | Male | Female |
| Farming, Fishing & Forestry | 0 (0.0%) | 0 (0.0%) |
| Construction & Extraction | 41 (100.0%) | 0 (0.0%) |
| Installation, Maintenance & Repair | 17 (100.0%) | 0 (0.0%) |
| Total (Category) | 58 (100.0%) | 0 (0.0%) |
| Total (Overall) | 189 (44.5%) | 236 (55.5%) |
Production, Transportation and Moving Occupations
The most common Production, Transportation and Moving occupations in Waymart borough are Material Moving (27 | 6.4%), Production (26 | 6.1%), and Transportation (22 | 5.2%).
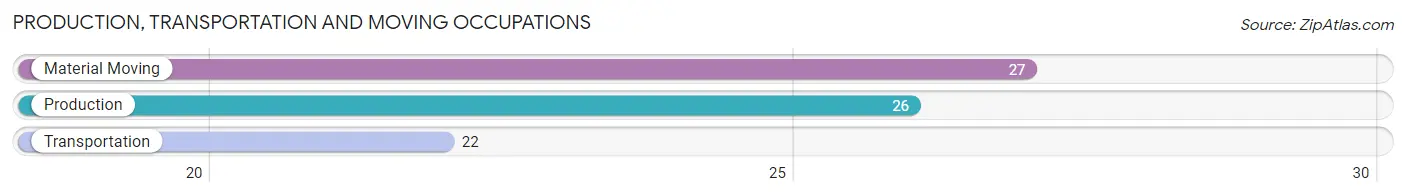
Production, Transportation and Moving Occupations by Sex
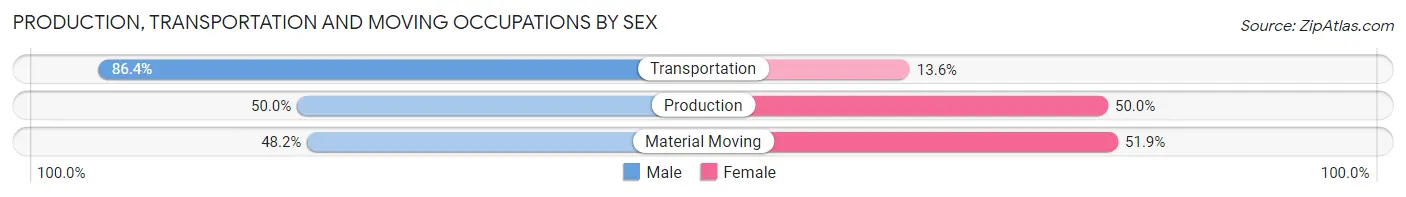
| Occupation | Male | Female |
| Production | 13 (50.0%) | 13 (50.0%) |
| Transportation | 19 (86.4%) | 3 (13.6%) |
| Material Moving | 13 (48.1%) | 14 (51.8%) |
| Total (Category) | 45 (60.0%) | 30 (40.0%) |
| Total (Overall) | 189 (44.5%) | 236 (55.5%) |
Employment Industries by Sex in Waymart borough
Employment Industries in Waymart borough
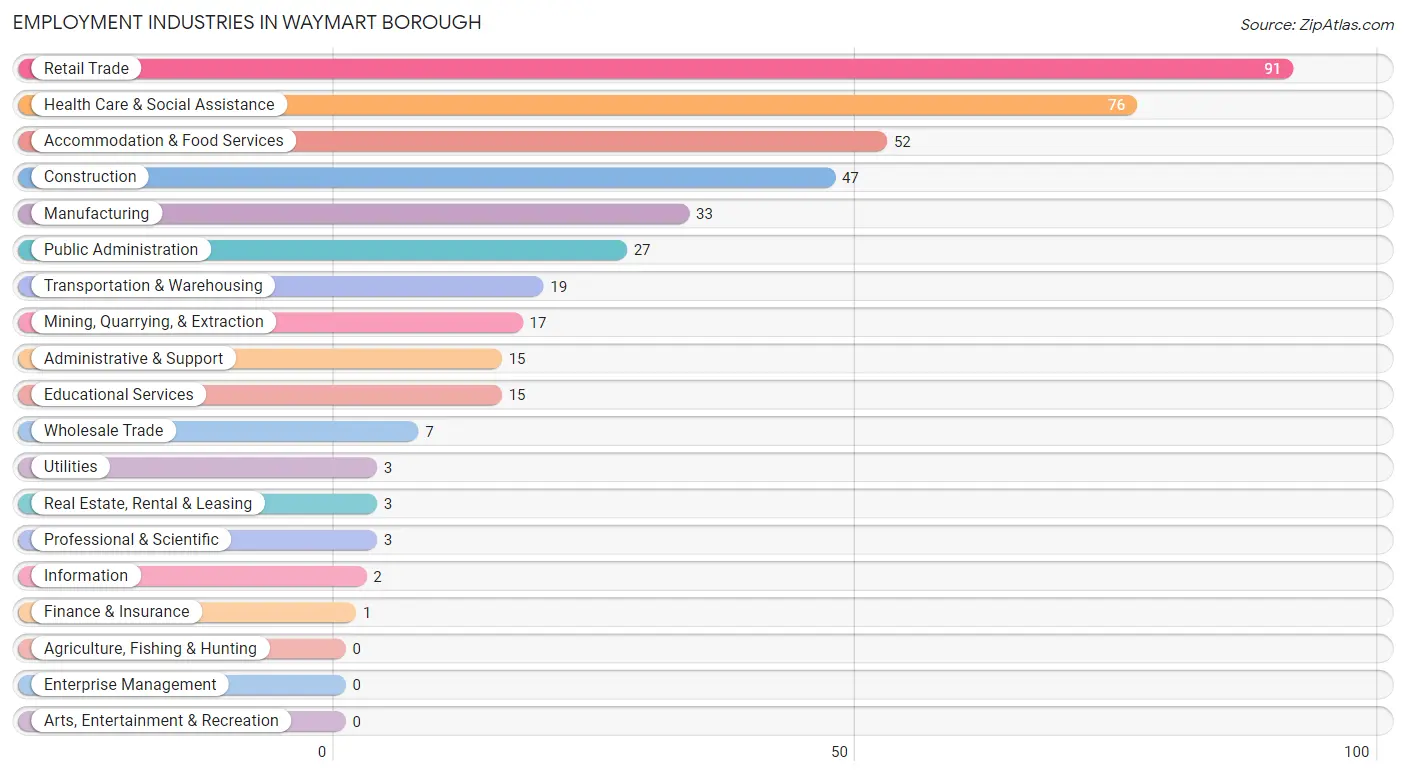
The major employment industries in Waymart borough include Retail Trade (91 | 21.4%), Health Care & Social Assistance (76 | 17.9%), Accommodation & Food Services (52 | 12.2%), Construction (47 | 11.1%), and Manufacturing (33 | 7.8%).
Employment Industries by Sex in Waymart borough
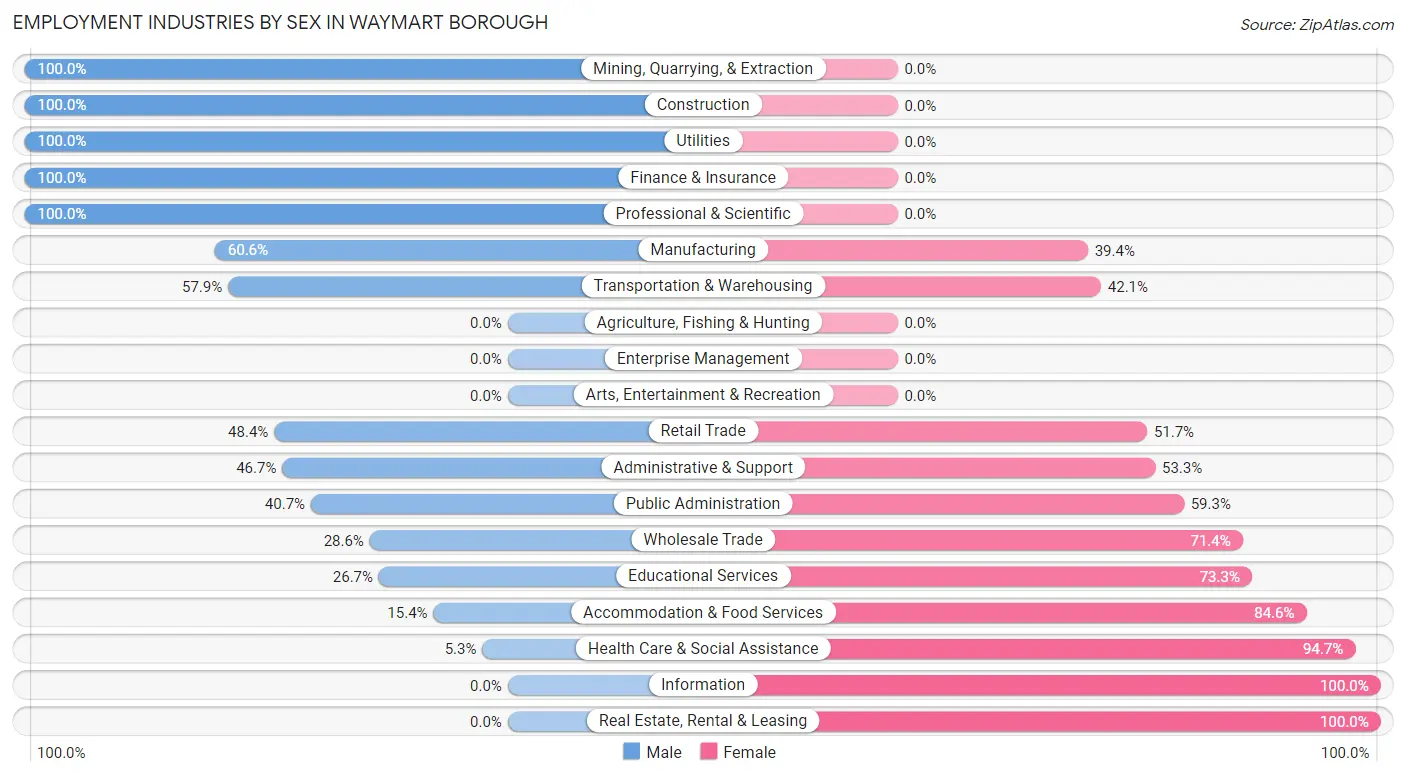
The Waymart borough industries that see more men than women are Mining, Quarrying, & Extraction (100.0%), Construction (100.0%), and Utilities (100.0%), whereas the industries that tend to have a higher number of women are Information (100.0%), Real Estate, Rental & Leasing (100.0%), and Health Care & Social Assistance (94.7%).
| Industry | Male | Female |
| Agriculture, Fishing & Hunting | 0 (0.0%) | 0 (0.0%) |
| Mining, Quarrying, & Extraction | 17 (100.0%) | 0 (0.0%) |
| Construction | 47 (100.0%) | 0 (0.0%) |
| Manufacturing | 20 (60.6%) | 13 (39.4%) |
| Wholesale Trade | 2 (28.6%) | 5 (71.4%) |
| Retail Trade | 44 (48.3%) | 47 (51.6%) |
| Transportation & Warehousing | 11 (57.9%) | 8 (42.1%) |
| Utilities | 3 (100.0%) | 0 (0.0%) |
| Information | 0 (0.0%) | 2 (100.0%) |
| Finance & Insurance | 1 (100.0%) | 0 (0.0%) |
| Real Estate, Rental & Leasing | 0 (0.0%) | 3 (100.0%) |
| Professional & Scientific | 3 (100.0%) | 0 (0.0%) |
| Enterprise Management | 0 (0.0%) | 0 (0.0%) |
| Administrative & Support | 7 (46.7%) | 8 (53.3%) |
| Educational Services | 4 (26.7%) | 11 (73.3%) |
| Health Care & Social Assistance | 4 (5.3%) | 72 (94.7%) |
| Arts, Entertainment & Recreation | 0 (0.0%) | 0 (0.0%) |
| Accommodation & Food Services | 8 (15.4%) | 44 (84.6%) |
| Public Administration | 11 (40.7%) | 16 (59.3%) |
| Total | 189 (44.5%) | 236 (55.5%) |
Education in Waymart borough
School Enrollment in Waymart borough
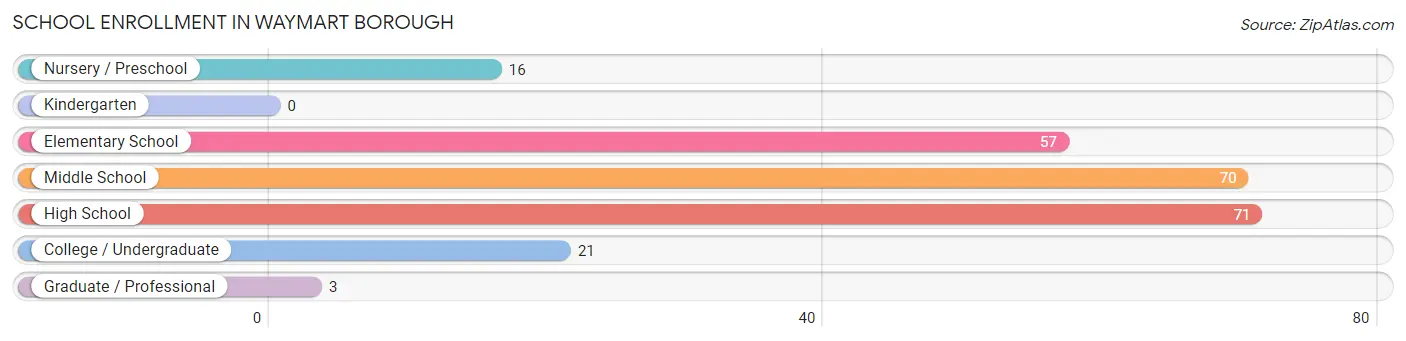
The most common levels of schooling among the 238 students in Waymart borough are high school (71 | 29.8%), middle school (70 | 29.4%), and elementary school (57 | 23.9%).
| School Level | # Students | % Students |
| Nursery / Preschool | 16 | 6.7% |
| Kindergarten | 0 | 0.0% |
| Elementary School | 57 | 23.9% |
| Middle School | 70 | 29.4% |
| High School | 71 | 29.8% |
| College / Undergraduate | 21 | 8.8% |
| Graduate / Professional | 3 | 1.3% |
| Total | 238 | 100.0% |
School Enrollment by Age by Funding Source in Waymart borough
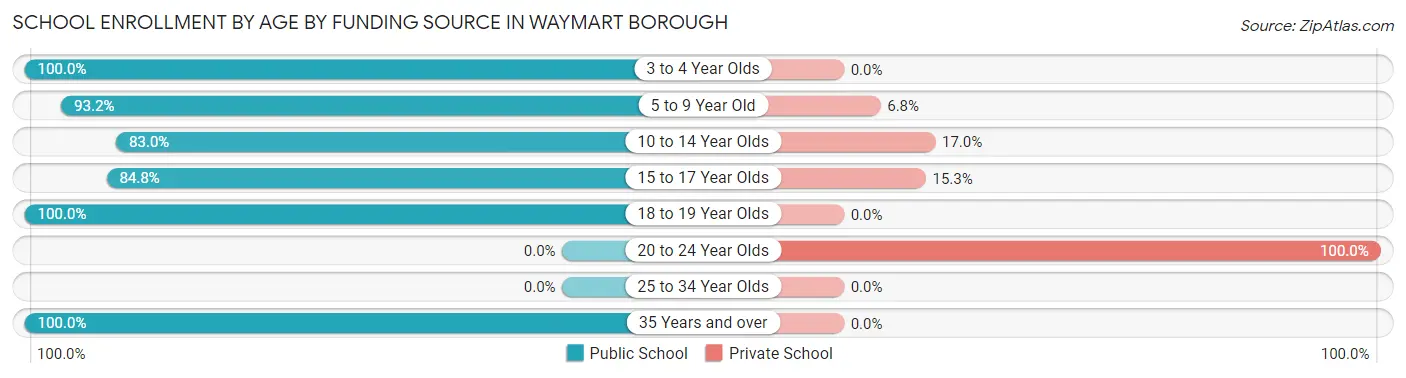
Out of a total of 238 students who are enrolled in schools in Waymart borough, 38 (16.0%) attend a private institution, while the remaining 200 (84.0%) are enrolled in public schools. The age group of 20 to 24 year olds has the highest likelihood of being enrolled in private schools, with 10 (100.0% in the age bracket) enrolled. Conversely, the age group of 3 to 4 year olds has the lowest likelihood of being enrolled in a private school, with 13 (100.0% in the age bracket) attending a public institution.
| Age Bracket | Public School | Private School |
| 3 to 4 Year Olds | 13 (100.0%) | 0 (0.0%) |
| 5 to 9 Year Old | 41 (93.2%) | 3 (6.8%) |
| 10 to 14 Year Olds | 78 (83.0%) | 16 (17.0%) |
| 15 to 17 Year Olds | 50 (84.8%) | 9 (15.2%) |
| 18 to 19 Year Olds | 3 (100.0%) | 0 (0.0%) |
| 20 to 24 Year Olds | 0 (0.0%) | 10 (100.0%) |
| 25 to 34 Year Olds | 0 (0.0%) | 0 (0.0%) |
| 35 Years and over | 15 (100.0%) | 0 (0.0%) |
| Total | 200 (84.0%) | 38 (16.0%) |
Educational Attainment by Field of Study in Waymart borough
Education (41 | 39.8%), science & technology (17 | 16.5%), arts & humanities (13 | 12.6%), business (9 | 8.7%), and physical & health sciences (6 | 5.8%) are the most common fields of study among 103 individuals in Waymart borough who have obtained a bachelor's degree or higher.
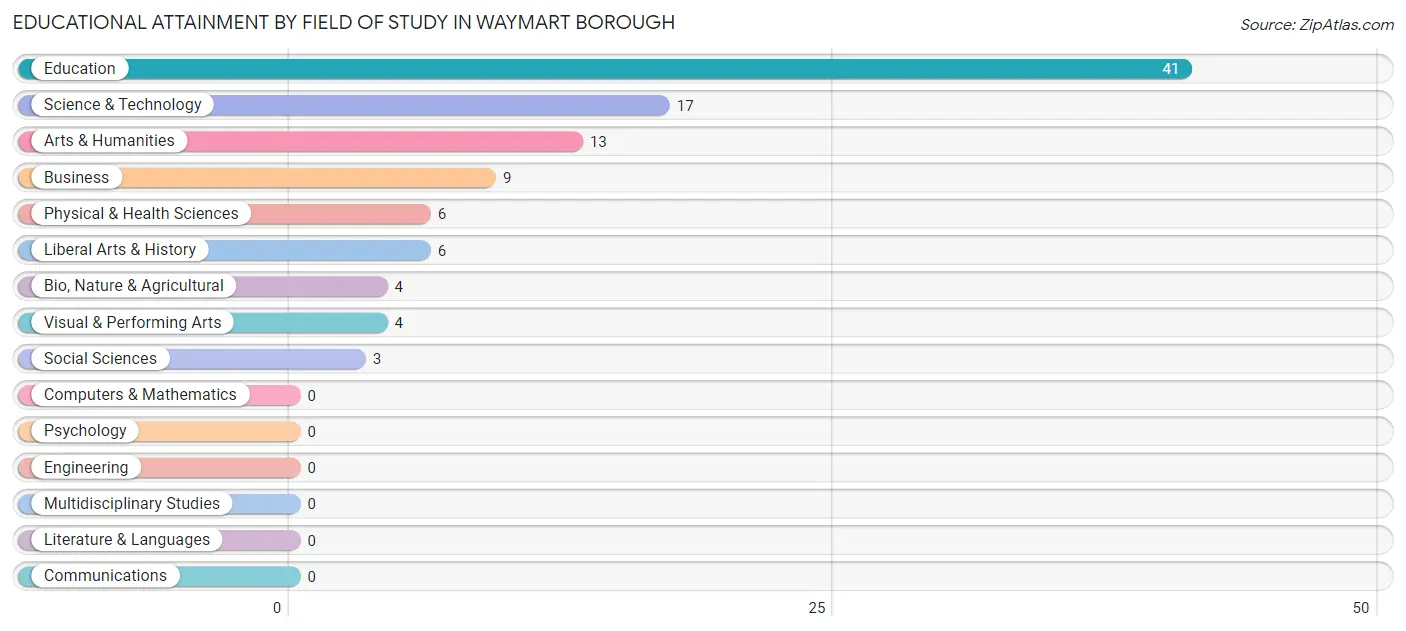
| Field of Study | # Graduates | % Graduates |
| Computers & Mathematics | 0 | 0.0% |
| Bio, Nature & Agricultural | 4 | 3.9% |
| Physical & Health Sciences | 6 | 5.8% |
| Psychology | 0 | 0.0% |
| Social Sciences | 3 | 2.9% |
| Engineering | 0 | 0.0% |
| Multidisciplinary Studies | 0 | 0.0% |
| Science & Technology | 17 | 16.5% |
| Business | 9 | 8.7% |
| Education | 41 | 39.8% |
| Literature & Languages | 0 | 0.0% |
| Liberal Arts & History | 6 | 5.8% |
| Visual & Performing Arts | 4 | 3.9% |
| Communications | 0 | 0.0% |
| Arts & Humanities | 13 | 12.6% |
| Total | 103 | 100.0% |
Transportation & Commute in Waymart borough
Vehicle Availability by Sex in Waymart borough
The most prevalent vehicle ownership categories in Waymart borough are males with 2 vehicles (69, accounting for 36.5%) and females with 2 vehicles (50, making up 30.3%).
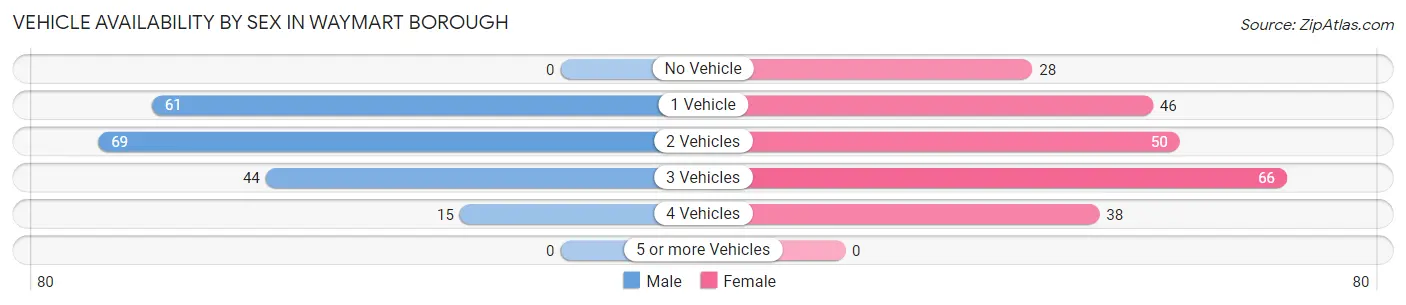
| Vehicles Available | Male | Female |
| No Vehicle | 0 (0.0%) | 28 (12.3%) |
| 1 Vehicle | 61 (32.3%) | 46 (20.2%) |
| 2 Vehicles | 69 (36.5%) | 50 (21.9%) |
| 3 Vehicles | 44 (23.3%) | 66 (28.9%) |
| 4 Vehicles | 15 (7.9%) | 38 (16.7%) |
| 5 or more Vehicles | 0 (0.0%) | 0 (0.0%) |
| Total | 189 (100.0%) | 228 (100.0%) |
Commute Time in Waymart borough
The most frequently occuring commute durations in Waymart borough are 15 to 19 minutes (74 commuters, 18.0%), 10 to 14 minutes (70 commuters, 17.0%), and 40 to 44 minutes (54 commuters, 13.1%).
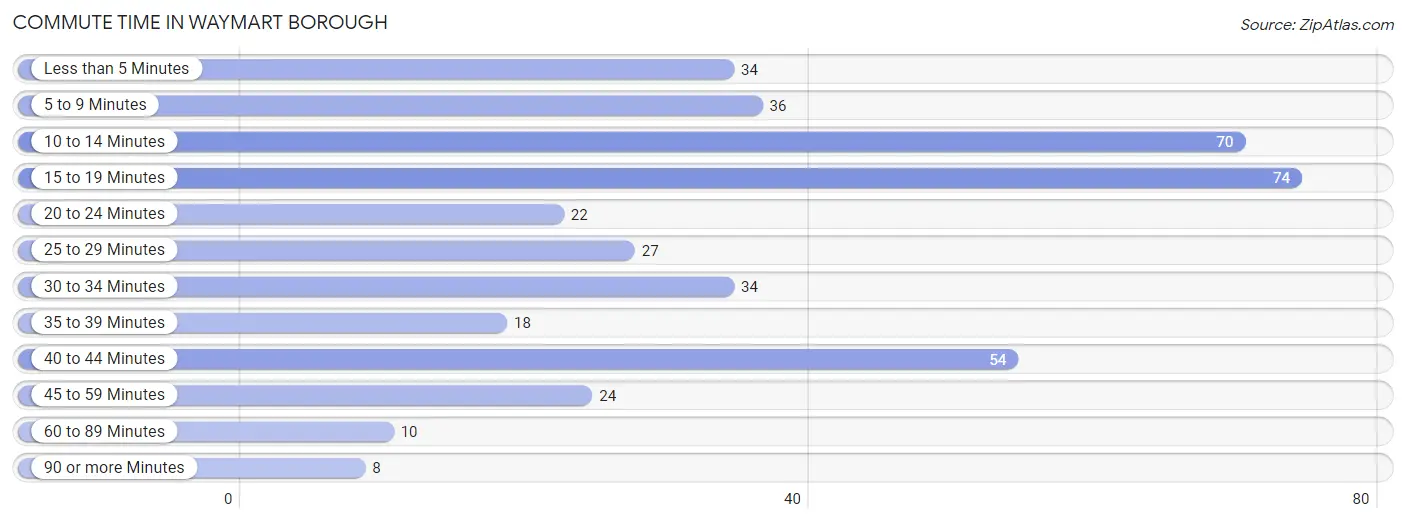
| Commute Time | # Commuters | % Commuters |
| Less than 5 Minutes | 34 | 8.3% |
| 5 to 9 Minutes | 36 | 8.8% |
| 10 to 14 Minutes | 70 | 17.0% |
| 15 to 19 Minutes | 74 | 18.0% |
| 20 to 24 Minutes | 22 | 5.3% |
| 25 to 29 Minutes | 27 | 6.6% |
| 30 to 34 Minutes | 34 | 8.3% |
| 35 to 39 Minutes | 18 | 4.4% |
| 40 to 44 Minutes | 54 | 13.1% |
| 45 to 59 Minutes | 24 | 5.8% |
| 60 to 89 Minutes | 10 | 2.4% |
| 90 or more Minutes | 8 | 1.9% |
Commute Time by Sex in Waymart borough
The most common commute times in Waymart borough are less than 5 minutes (30 commuters, 16.4%) for males and 15 to 19 minutes (57 commuters, 25.0%) for females.

| Commute Time | Male | Female |
| Less than 5 Minutes | 30 (16.4%) | 4 (1.8%) |
| 5 to 9 Minutes | 13 (7.1%) | 23 (10.1%) |
| 10 to 14 Minutes | 19 (10.4%) | 51 (22.4%) |
| 15 to 19 Minutes | 17 (9.3%) | 57 (25.0%) |
| 20 to 24 Minutes | 6 (3.3%) | 16 (7.0%) |
| 25 to 29 Minutes | 2 (1.1%) | 25 (11.0%) |
| 30 to 34 Minutes | 19 (10.4%) | 15 (6.6%) |
| 35 to 39 Minutes | 14 (7.6%) | 4 (1.8%) |
| 40 to 44 Minutes | 29 (15.9%) | 25 (11.0%) |
| 45 to 59 Minutes | 16 (8.7%) | 8 (3.5%) |
| 60 to 89 Minutes | 10 (5.5%) | 0 (0.0%) |
| 90 or more Minutes | 8 (4.4%) | 0 (0.0%) |
Time of Departure to Work by Sex in Waymart borough
The most frequent times of departure to work in Waymart borough are 6:30 AM to 6:59 AM (29, 15.9%) for males and 7:30 AM to 7:59 AM (55, 24.1%) for females.
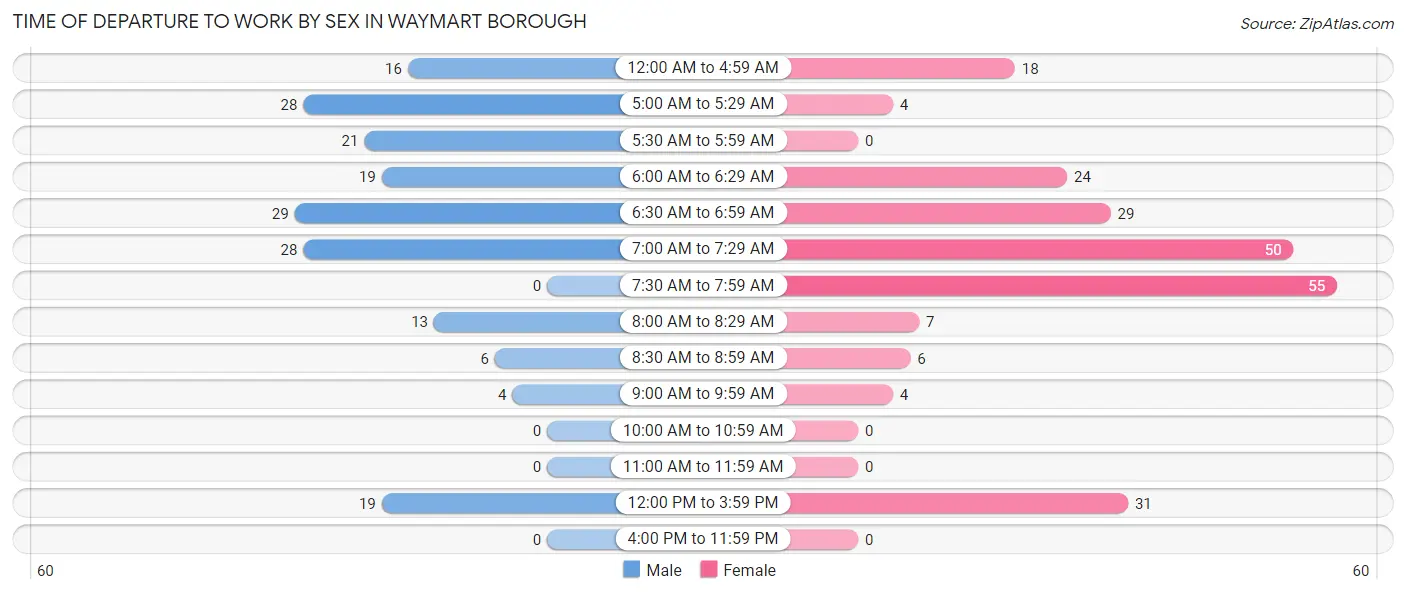
| Time of Departure | Male | Female |
| 12:00 AM to 4:59 AM | 16 (8.7%) | 18 (7.9%) |
| 5:00 AM to 5:29 AM | 28 (15.3%) | 4 (1.8%) |
| 5:30 AM to 5:59 AM | 21 (11.5%) | 0 (0.0%) |
| 6:00 AM to 6:29 AM | 19 (10.4%) | 24 (10.5%) |
| 6:30 AM to 6:59 AM | 29 (15.9%) | 29 (12.7%) |
| 7:00 AM to 7:29 AM | 28 (15.3%) | 50 (21.9%) |
| 7:30 AM to 7:59 AM | 0 (0.0%) | 55 (24.1%) |
| 8:00 AM to 8:29 AM | 13 (7.1%) | 7 (3.1%) |
| 8:30 AM to 8:59 AM | 6 (3.3%) | 6 (2.6%) |
| 9:00 AM to 9:59 AM | 4 (2.2%) | 4 (1.8%) |
| 10:00 AM to 10:59 AM | 0 (0.0%) | 0 (0.0%) |
| 11:00 AM to 11:59 AM | 0 (0.0%) | 0 (0.0%) |
| 12:00 PM to 3:59 PM | 19 (10.4%) | 31 (13.6%) |
| 4:00 PM to 11:59 PM | 0 (0.0%) | 0 (0.0%) |
| Total | 183 (100.0%) | 228 (100.0%) |
Housing Occupancy in Waymart borough
Occupancy by Ownership in Waymart borough
Of the total 434 dwellings in Waymart borough, owner-occupied units account for 241 (55.5%), while renter-occupied units make up 193 (44.5%).
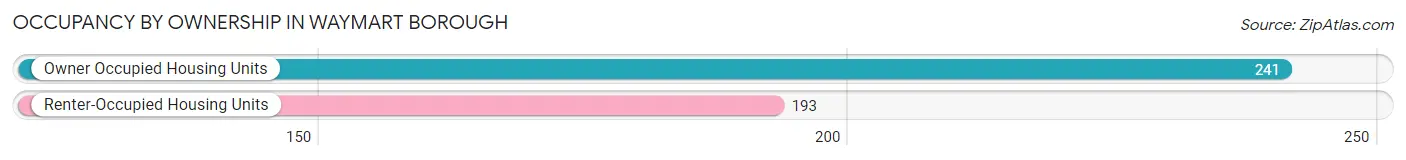
| Occupancy | # Housing Units | % Housing Units |
| Owner Occupied Housing Units | 241 | 55.5% |
| Renter-Occupied Housing Units | 193 | 44.5% |
| Total Occupied Housing Units | 434 | 100.0% |
Occupancy by Household Size in Waymart borough
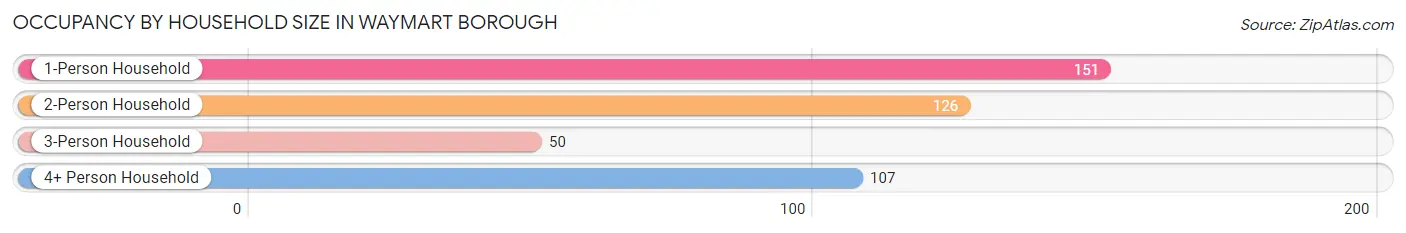
| Household Size | # Housing Units | % Housing Units |
| 1-Person Household | 151 | 34.8% |
| 2-Person Household | 126 | 29.0% |
| 3-Person Household | 50 | 11.5% |
| 4+ Person Household | 107 | 24.6% |
| Total Housing Units | 434 | 100.0% |
Occupancy by Ownership by Household Size in Waymart borough
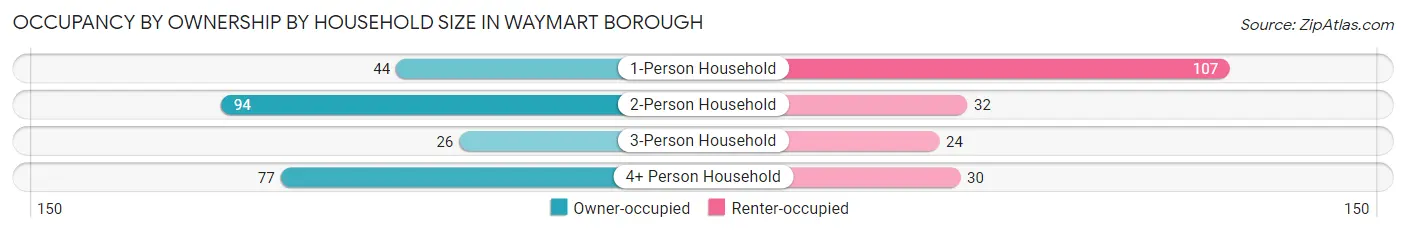
| Household Size | Owner-occupied | Renter-occupied |
| 1-Person Household | 44 (29.1%) | 107 (70.9%) |
| 2-Person Household | 94 (74.6%) | 32 (25.4%) |
| 3-Person Household | 26 (52.0%) | 24 (48.0%) |
| 4+ Person Household | 77 (72.0%) | 30 (28.0%) |
| Total Housing Units | 241 (55.5%) | 193 (44.5%) |
Occupancy by Educational Attainment in Waymart borough
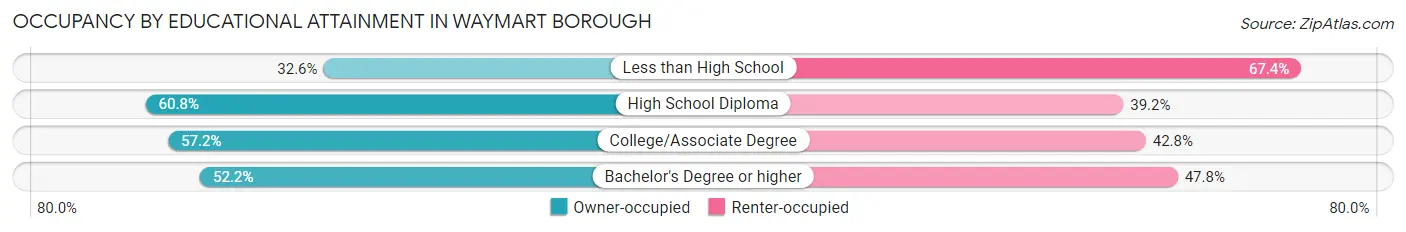
| Household Size | Owner-occupied | Renter-occupied |
| Less than High School | 15 (32.6%) | 31 (67.4%) |
| High School Diploma | 107 (60.8%) | 69 (39.2%) |
| College/Associate Degree | 95 (57.2%) | 71 (42.8%) |
| Bachelor's Degree or higher | 24 (52.2%) | 22 (47.8%) |
Occupancy by Age of Householder in Waymart borough
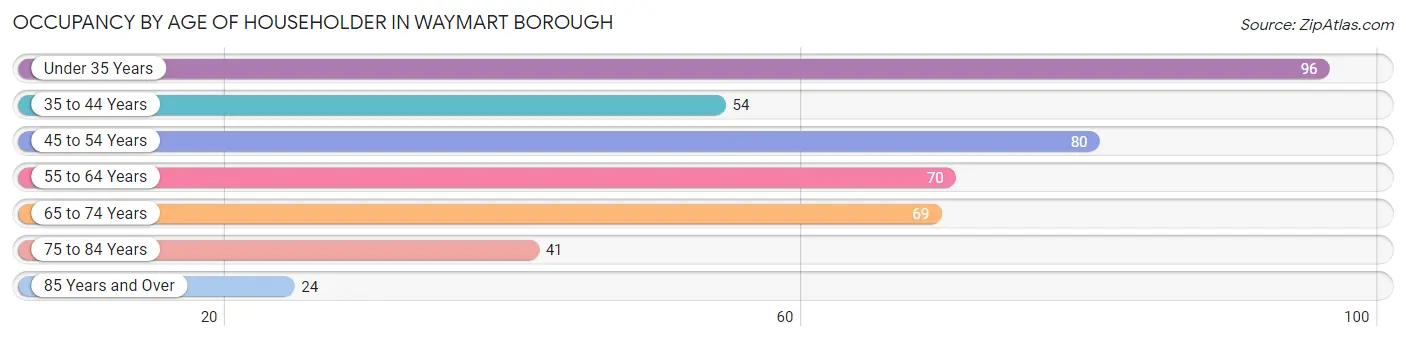
| Age Bracket | # Households | % Households |
| Under 35 Years | 96 | 22.1% |
| 35 to 44 Years | 54 | 12.4% |
| 45 to 54 Years | 80 | 18.4% |
| 55 to 64 Years | 70 | 16.1% |
| 65 to 74 Years | 69 | 15.9% |
| 75 to 84 Years | 41 | 9.5% |
| 85 Years and Over | 24 | 5.5% |
| Total | 434 | 100.0% |
Housing Finances in Waymart borough
Median Income by Occupancy in Waymart borough
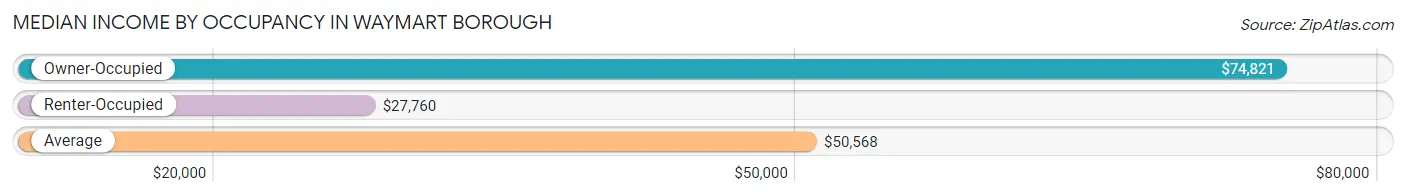
| Occupancy Type | # Households | Median Income |
| Owner-Occupied | 241 (55.5%) | $74,821 |
| Renter-Occupied | 193 (44.5%) | $27,760 |
| Average | 434 (100.0%) | $50,568 |
Occupancy by Householder Income Bracket in Waymart borough
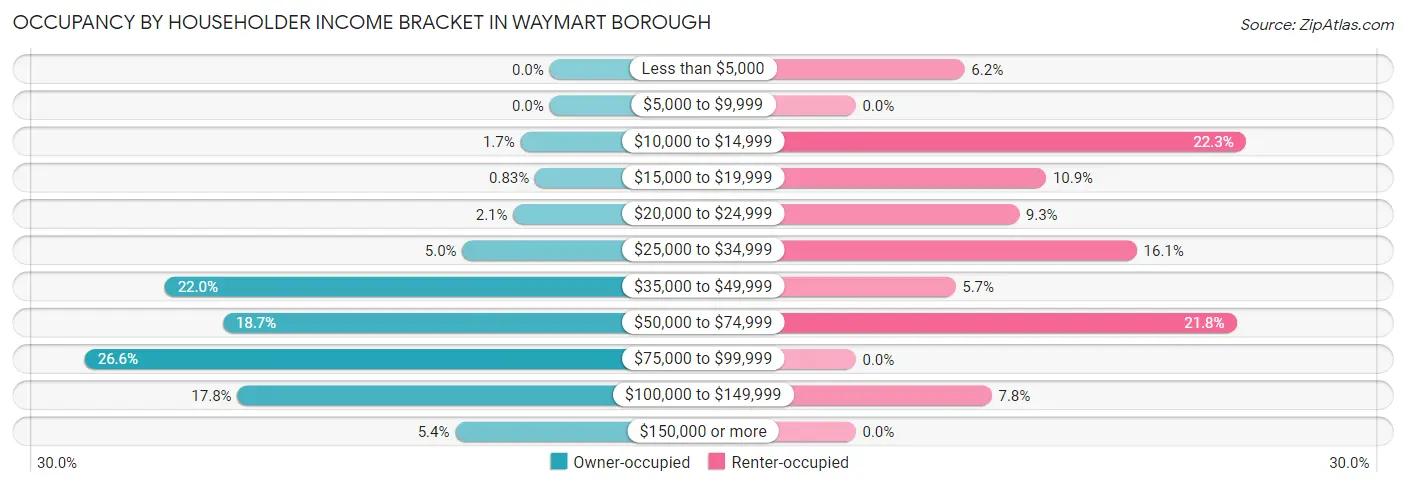
| Income Bracket | Owner-occupied | Renter-occupied |
| Less than $5,000 | 0 (0.0%) | 12 (6.2%) |
| $5,000 to $9,999 | 0 (0.0%) | 0 (0.0%) |
| $10,000 to $14,999 | 4 (1.7%) | 43 (22.3%) |
| $15,000 to $19,999 | 2 (0.8%) | 21 (10.9%) |
| $20,000 to $24,999 | 5 (2.1%) | 18 (9.3%) |
| $25,000 to $34,999 | 12 (5.0%) | 31 (16.1%) |
| $35,000 to $49,999 | 53 (22.0%) | 11 (5.7%) |
| $50,000 to $74,999 | 45 (18.7%) | 42 (21.8%) |
| $75,000 to $99,999 | 64 (26.6%) | 0 (0.0%) |
| $100,000 to $149,999 | 43 (17.8%) | 15 (7.8%) |
| $150,000 or more | 13 (5.4%) | 0 (0.0%) |
| Total | 241 (100.0%) | 193 (100.0%) |
Monthly Housing Cost Tiers in Waymart borough
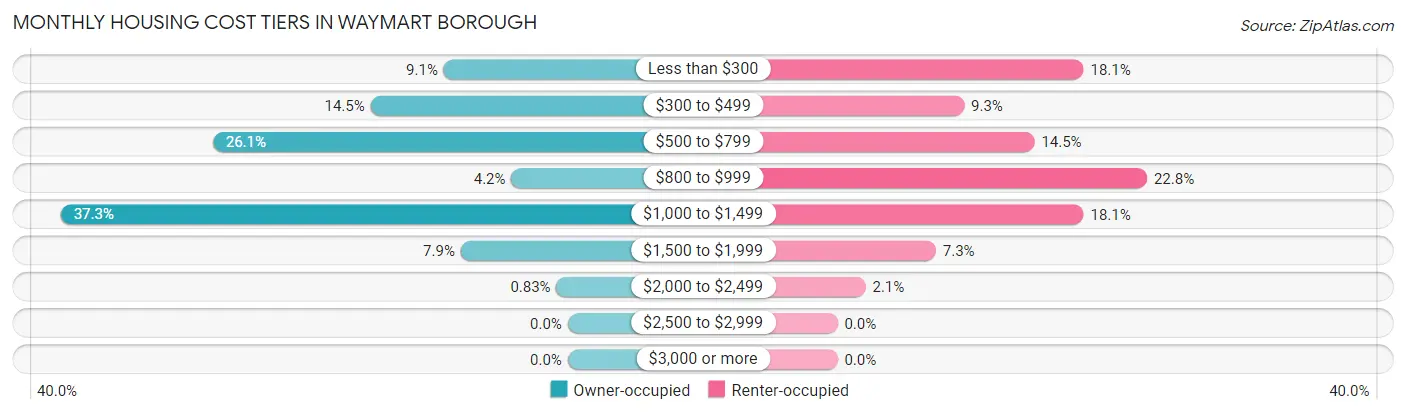
| Monthly Cost | Owner-occupied | Renter-occupied |
| Less than $300 | 22 (9.1%) | 35 (18.1%) |
| $300 to $499 | 35 (14.5%) | 18 (9.3%) |
| $500 to $799 | 63 (26.1%) | 28 (14.5%) |
| $800 to $999 | 10 (4.2%) | 44 (22.8%) |
| $1,000 to $1,499 | 90 (37.3%) | 35 (18.1%) |
| $1,500 to $1,999 | 19 (7.9%) | 14 (7.2%) |
| $2,000 to $2,499 | 2 (0.8%) | 4 (2.1%) |
| $2,500 to $2,999 | 0 (0.0%) | 0 (0.0%) |
| $3,000 or more | 0 (0.0%) | 0 (0.0%) |
| Total | 241 (100.0%) | 193 (100.0%) |
Physical Housing Characteristics in Waymart borough
Housing Structures in Waymart borough
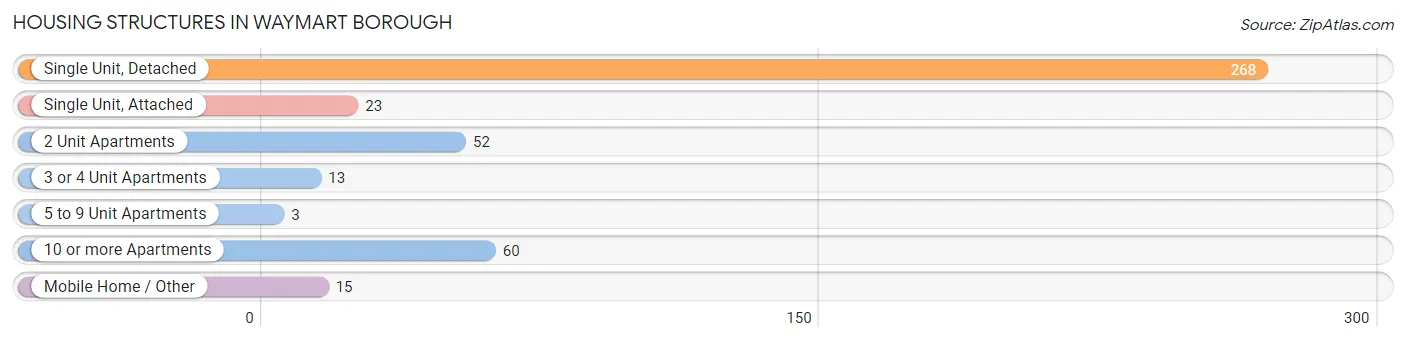
| Structure Type | # Housing Units | % Housing Units |
| Single Unit, Detached | 268 | 61.8% |
| Single Unit, Attached | 23 | 5.3% |
| 2 Unit Apartments | 52 | 12.0% |
| 3 or 4 Unit Apartments | 13 | 3.0% |
| 5 to 9 Unit Apartments | 3 | 0.7% |
| 10 or more Apartments | 60 | 13.8% |
| Mobile Home / Other | 15 | 3.5% |
| Total | 434 | 100.0% |
Housing Structures by Occupancy in Waymart borough
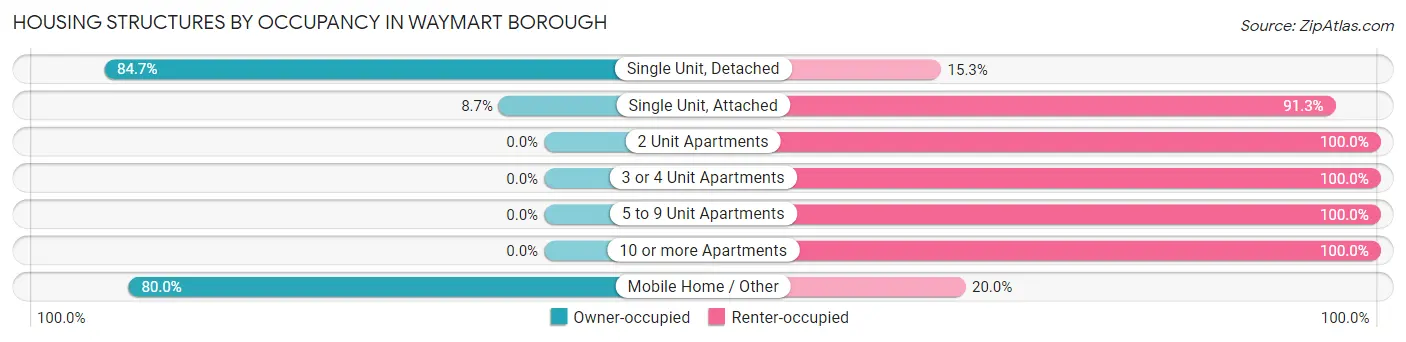
| Structure Type | Owner-occupied | Renter-occupied |
| Single Unit, Detached | 227 (84.7%) | 41 (15.3%) |
| Single Unit, Attached | 2 (8.7%) | 21 (91.3%) |
| 2 Unit Apartments | 0 (0.0%) | 52 (100.0%) |
| 3 or 4 Unit Apartments | 0 (0.0%) | 13 (100.0%) |
| 5 to 9 Unit Apartments | 0 (0.0%) | 3 (100.0%) |
| 10 or more Apartments | 0 (0.0%) | 60 (100.0%) |
| Mobile Home / Other | 12 (80.0%) | 3 (20.0%) |
| Total | 241 (55.5%) | 193 (44.5%) |
Housing Structures by Number of Rooms in Waymart borough
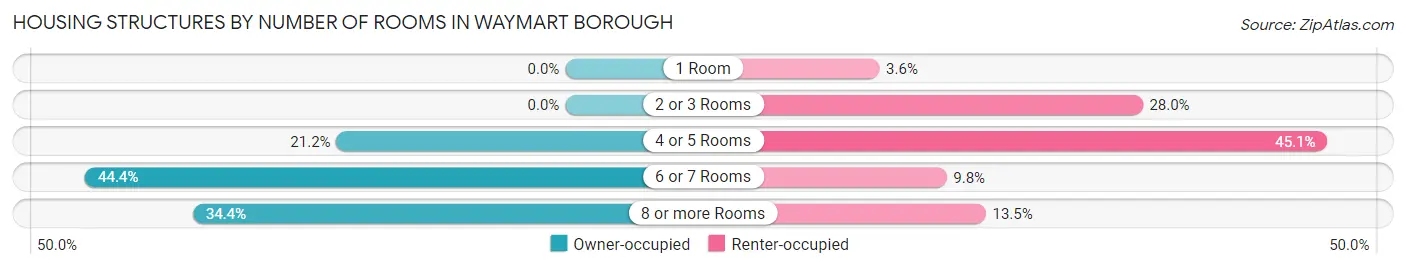
| Number of Rooms | Owner-occupied | Renter-occupied |
| 1 Room | 0 (0.0%) | 7 (3.6%) |
| 2 or 3 Rooms | 0 (0.0%) | 54 (28.0%) |
| 4 or 5 Rooms | 51 (21.2%) | 87 (45.1%) |
| 6 or 7 Rooms | 107 (44.4%) | 19 (9.8%) |
| 8 or more Rooms | 83 (34.4%) | 26 (13.5%) |
| Total | 241 (100.0%) | 193 (100.0%) |
Housing Structure by Heating Type in Waymart borough
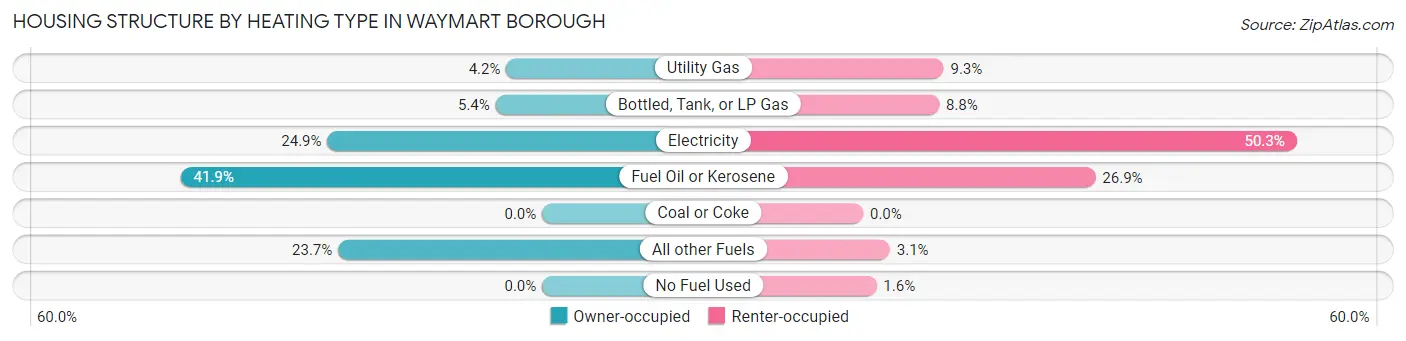
| Heating Type | Owner-occupied | Renter-occupied |
| Utility Gas | 10 (4.2%) | 18 (9.3%) |
| Bottled, Tank, or LP Gas | 13 (5.4%) | 17 (8.8%) |
| Electricity | 60 (24.9%) | 97 (50.3%) |
| Fuel Oil or Kerosene | 101 (41.9%) | 52 (26.9%) |
| Coal or Coke | 0 (0.0%) | 0 (0.0%) |
| All other Fuels | 57 (23.6%) | 6 (3.1%) |
| No Fuel Used | 0 (0.0%) | 3 (1.5%) |
| Total | 241 (100.0%) | 193 (100.0%) |
Household Vehicle Usage in Waymart borough
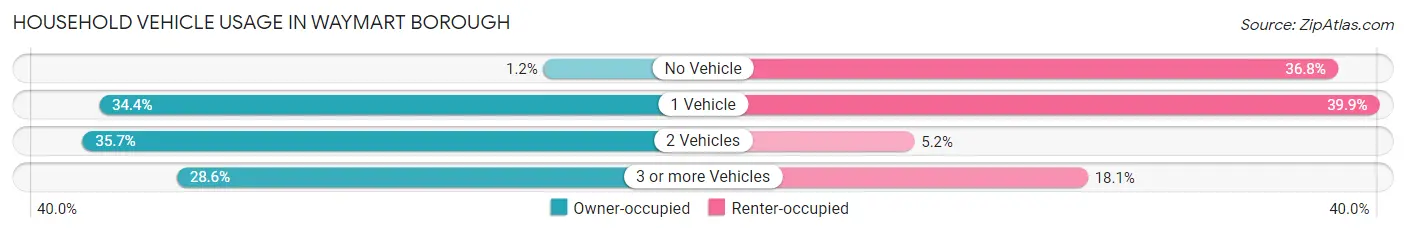
| Vehicles per Household | Owner-occupied | Renter-occupied |
| No Vehicle | 3 (1.2%) | 71 (36.8%) |
| 1 Vehicle | 83 (34.4%) | 77 (39.9%) |
| 2 Vehicles | 86 (35.7%) | 10 (5.2%) |
| 3 or more Vehicles | 69 (28.6%) | 35 (18.1%) |
| Total | 241 (100.0%) | 193 (100.0%) |
Real Estate & Mortgages in Waymart borough
Real Estate and Mortgage Overview in Waymart borough
| Characteristic | Without Mortgage | With Mortgage |
| Housing Units | 92 | 149 |
| Median Property Value | $162,500 | $185,400 |
| Median Household Income | $49,688 | $13 |
| Monthly Housing Costs | $533 | $0 |
| Real Estate Taxes | $2,033 | $0 |
Property Value by Mortgage Status in Waymart borough
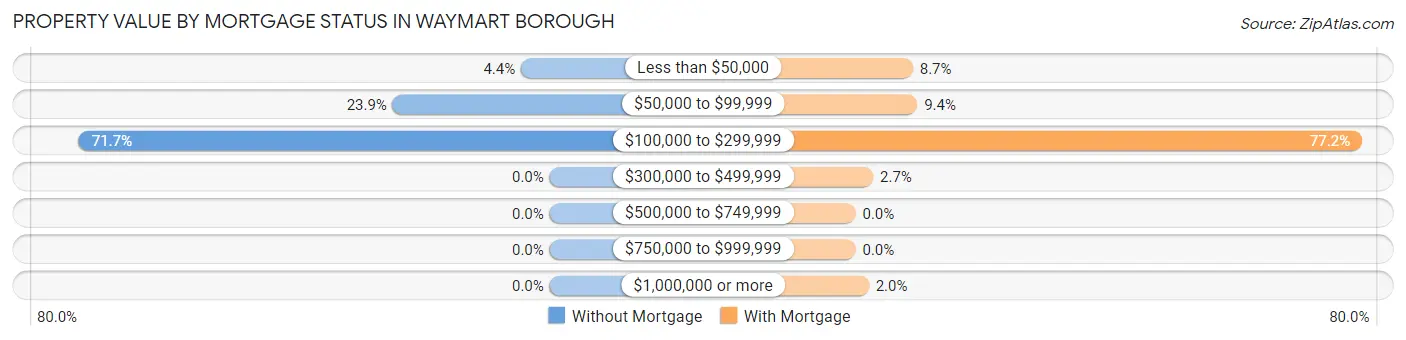
| Property Value | Without Mortgage | With Mortgage |
| Less than $50,000 | 4 (4.3%) | 13 (8.7%) |
| $50,000 to $99,999 | 22 (23.9%) | 14 (9.4%) |
| $100,000 to $299,999 | 66 (71.7%) | 115 (77.2%) |
| $300,000 to $499,999 | 0 (0.0%) | 4 (2.7%) |
| $500,000 to $749,999 | 0 (0.0%) | 0 (0.0%) |
| $750,000 to $999,999 | 0 (0.0%) | 0 (0.0%) |
| $1,000,000 or more | 0 (0.0%) | 3 (2.0%) |
| Total | 92 (100.0%) | 149 (100.0%) |
Household Income by Mortgage Status in Waymart borough
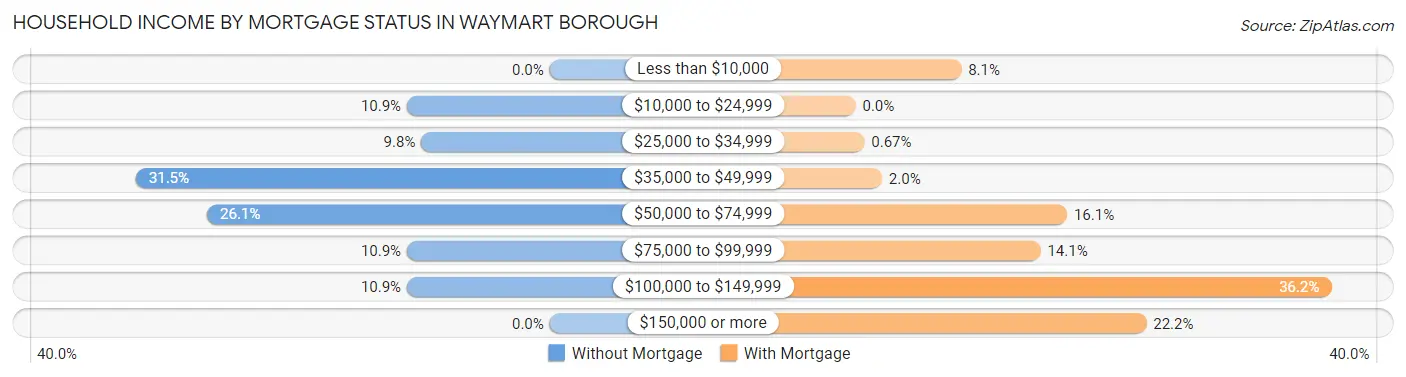
| Household Income | Without Mortgage | With Mortgage |
| Less than $10,000 | 0 (0.0%) | 12 (8.1%) |
| $10,000 to $24,999 | 10 (10.9%) | 0 (0.0%) |
| $25,000 to $34,999 | 9 (9.8%) | 1 (0.7%) |
| $35,000 to $49,999 | 29 (31.5%) | 3 (2.0%) |
| $50,000 to $74,999 | 24 (26.1%) | 24 (16.1%) |
| $75,000 to $99,999 | 10 (10.9%) | 21 (14.1%) |
| $100,000 to $149,999 | 10 (10.9%) | 54 (36.2%) |
| $150,000 or more | 0 (0.0%) | 33 (22.2%) |
| Total | 92 (100.0%) | 149 (100.0%) |
Property Value to Household Income Ratio in Waymart borough
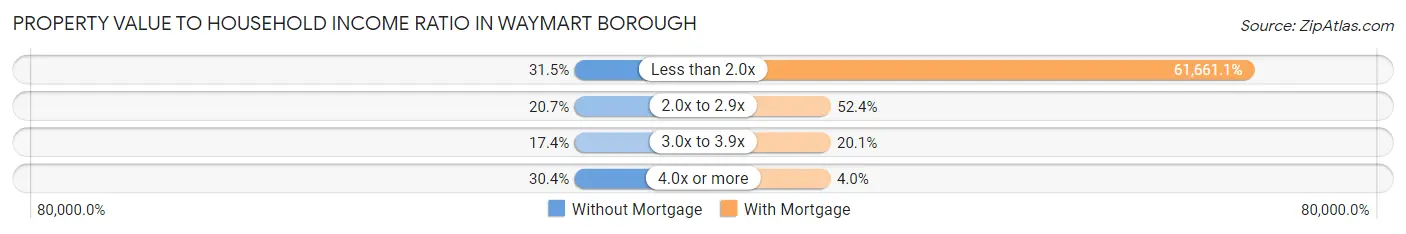
| Value-to-Income Ratio | Without Mortgage | With Mortgage |
| Less than 2.0x | 29 (31.5%) | 91,875 (61,661.1%) |
| 2.0x to 2.9x | 19 (20.6%) | 78 (52.3%) |
| 3.0x to 3.9x | 16 (17.4%) | 30 (20.1%) |
| 4.0x or more | 28 (30.4%) | 6 (4.0%) |
| Total | 92 (100.0%) | 149 (100.0%) |
Real Estate Taxes by Mortgage Status in Waymart borough
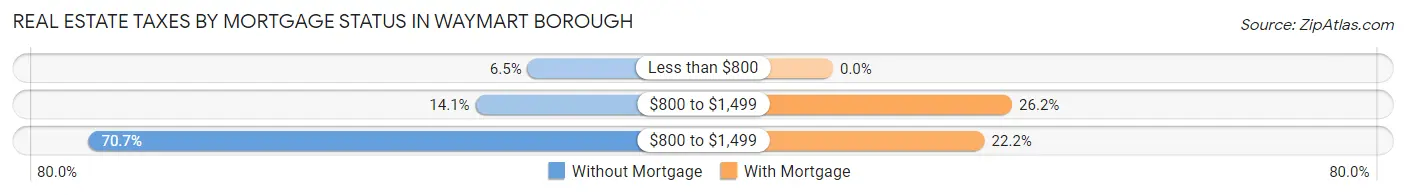
| Property Taxes | Without Mortgage | With Mortgage |
| Less than $800 | 6 (6.5%) | 0 (0.0%) |
| $800 to $1,499 | 13 (14.1%) | 39 (26.2%) |
| $800 to $1,499 | 65 (70.7%) | 33 (22.2%) |
| Total | 92 (100.0%) | 149 (100.0%) |
Health & Disability in Waymart borough
Health Insurance Coverage by Age in Waymart borough
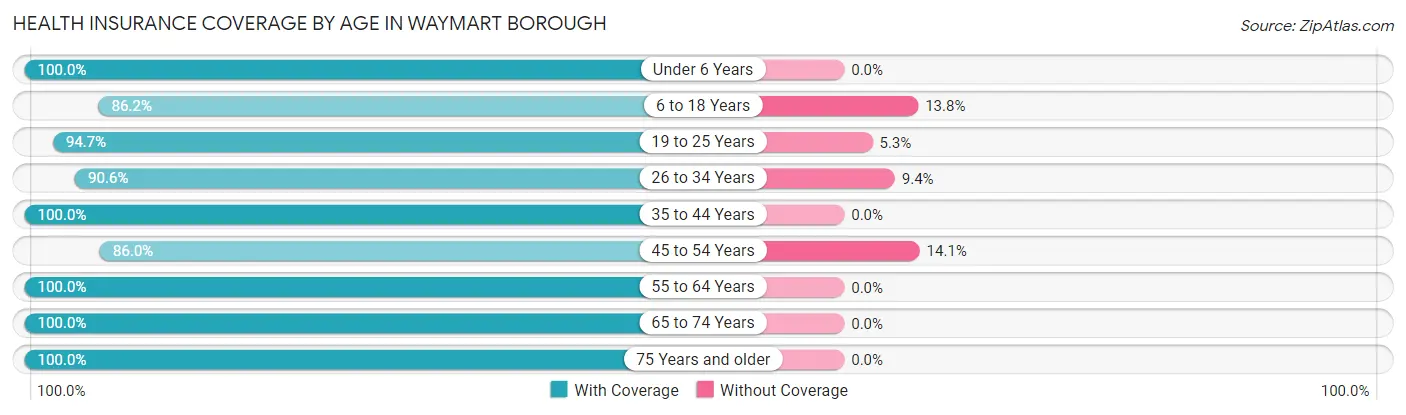
| Age Bracket | With Coverage | Without Coverage |
| Under 6 Years | 109 (100.0%) | 0 (0.0%) |
| 6 to 18 Years | 200 (86.2%) | 32 (13.8%) |
| 19 to 25 Years | 90 (94.7%) | 5 (5.3%) |
| 26 to 34 Years | 125 (90.6%) | 13 (9.4%) |
| 35 to 44 Years | 108 (100.0%) | 0 (0.0%) |
| 45 to 54 Years | 104 (86.0%) | 17 (14.1%) |
| 55 to 64 Years | 102 (100.0%) | 0 (0.0%) |
| 65 to 74 Years | 128 (100.0%) | 0 (0.0%) |
| 75 Years and older | 90 (100.0%) | 0 (0.0%) |
| Total | 1,056 (94.0%) | 67 (6.0%) |
Health Insurance Coverage by Citizenship Status in Waymart borough
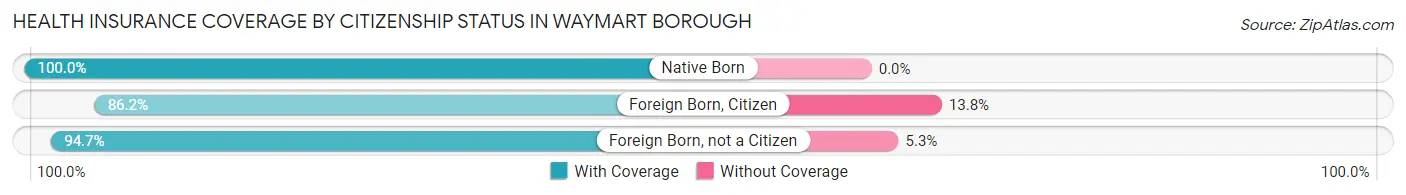
| Citizenship Status | With Coverage | Without Coverage |
| Native Born | 109 (100.0%) | 0 (0.0%) |
| Foreign Born, Citizen | 200 (86.2%) | 32 (13.8%) |
| Foreign Born, not a Citizen | 90 (94.7%) | 5 (5.3%) |
Health Insurance Coverage by Household Income in Waymart borough
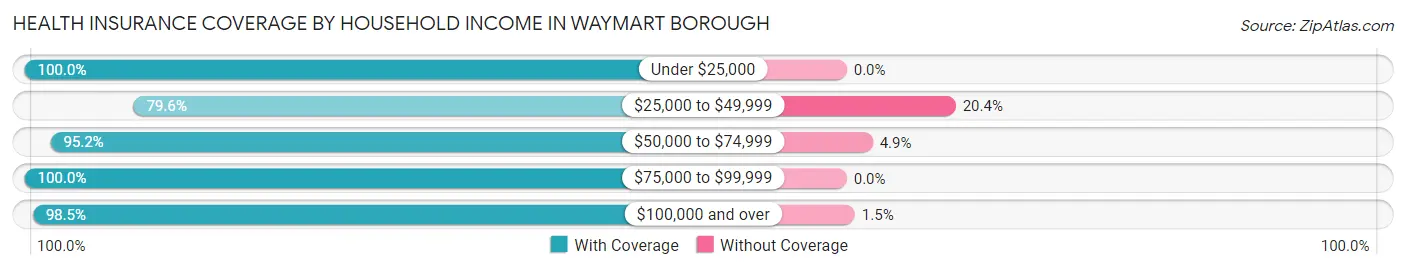
| Household Income | With Coverage | Without Coverage |
| Under $25,000 | 164 (100.0%) | 0 (0.0%) |
| $25,000 to $49,999 | 195 (79.6%) | 50 (20.4%) |
| $50,000 to $74,999 | 255 (95.2%) | 13 (4.9%) |
| $75,000 to $99,999 | 183 (100.0%) | 0 (0.0%) |
| $100,000 and over | 259 (98.5%) | 4 (1.5%) |
Public vs Private Health Insurance Coverage by Age in Waymart borough
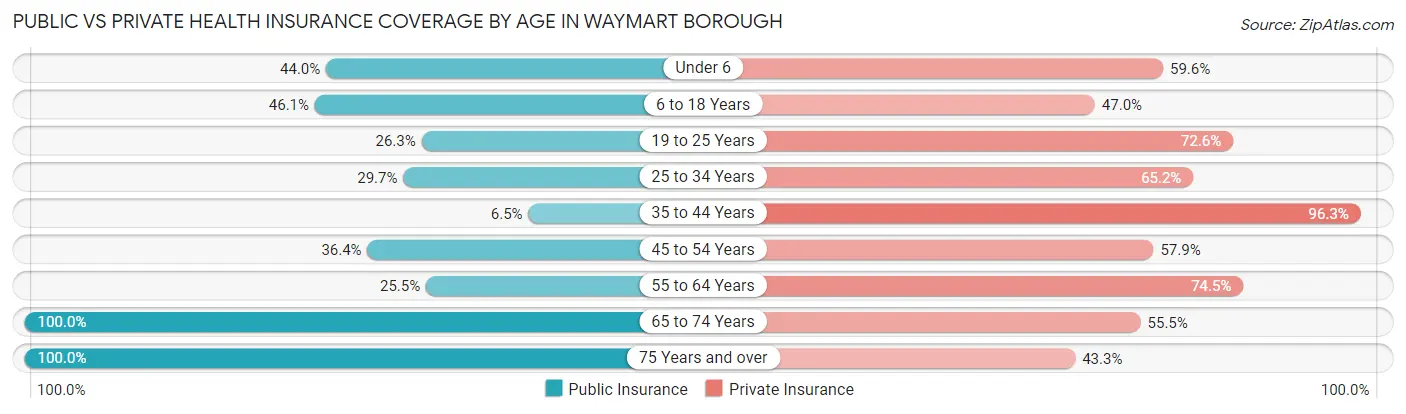
| Age Bracket | Public Insurance | Private Insurance |
| Under 6 | 48 (44.0%) | 65 (59.6%) |
| 6 to 18 Years | 107 (46.1%) | 109 (47.0%) |
| 19 to 25 Years | 25 (26.3%) | 69 (72.6%) |
| 25 to 34 Years | 41 (29.7%) | 90 (65.2%) |
| 35 to 44 Years | 7 (6.5%) | 104 (96.3%) |
| 45 to 54 Years | 44 (36.4%) | 70 (57.9%) |
| 55 to 64 Years | 26 (25.5%) | 76 (74.5%) |
| 65 to 74 Years | 128 (100.0%) | 71 (55.5%) |
| 75 Years and over | 90 (100.0%) | 39 (43.3%) |
| Total | 516 (46.0%) | 693 (61.7%) |
Disability Status by Sex by Age in Waymart borough
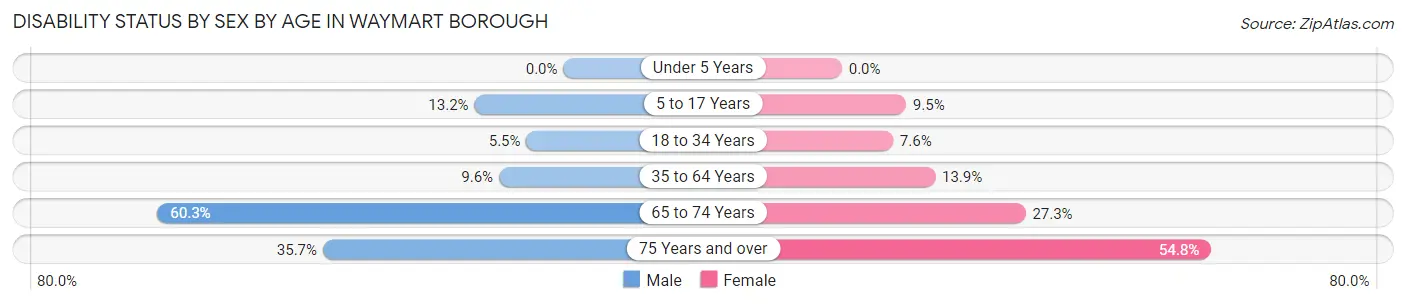
| Age Bracket | Male | Female |
| Under 5 Years | 0 (0.0%) | 0 (0.0%) |
| 5 to 17 Years | 14 (13.2%) | 12 (9.5%) |
| 18 to 34 Years | 5 (5.5%) | 11 (7.6%) |
| 35 to 64 Years | 13 (9.6%) | 27 (13.9%) |
| 65 to 74 Years | 44 (60.3%) | 15 (27.3%) |
| 75 Years and over | 10 (35.7%) | 34 (54.8%) |
Disability Class by Sex by Age in Waymart borough
Disability Class: Hearing Difficulty

| Age Bracket | Male | Female |
| Under 5 Years | 0 (0.0%) | 0 (0.0%) |
| 5 to 17 Years | 0 (0.0%) | 3 (2.4%) |
| 18 to 34 Years | 3 (3.3%) | 0 (0.0%) |
| 35 to 64 Years | 5 (3.7%) | 4 (2.1%) |
| 65 to 74 Years | 3 (4.1%) | 9 (16.4%) |
| 75 Years and over | 3 (10.7%) | 14 (22.6%) |
Disability Class: Vision Difficulty
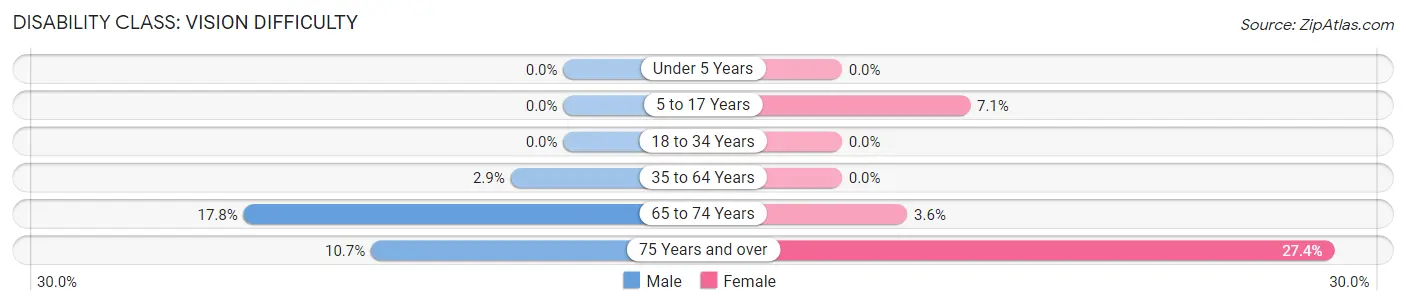
| Age Bracket | Male | Female |
| Under 5 Years | 0 (0.0%) | 0 (0.0%) |
| 5 to 17 Years | 0 (0.0%) | 9 (7.1%) |
| 18 to 34 Years | 0 (0.0%) | 0 (0.0%) |
| 35 to 64 Years | 4 (2.9%) | 0 (0.0%) |
| 65 to 74 Years | 13 (17.8%) | 2 (3.6%) |
| 75 Years and over | 3 (10.7%) | 17 (27.4%) |
Disability Class: Cognitive Difficulty
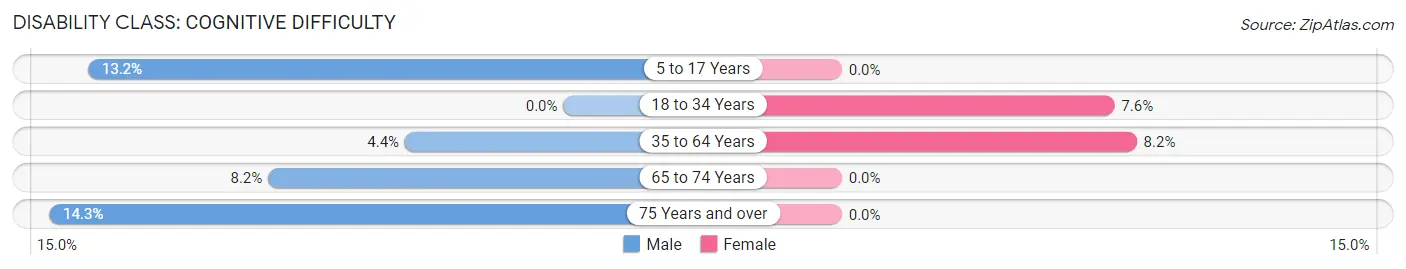
| Age Bracket | Male | Female |
| 5 to 17 Years | 14 (13.2%) | 0 (0.0%) |
| 18 to 34 Years | 0 (0.0%) | 11 (7.6%) |
| 35 to 64 Years | 6 (4.4%) | 16 (8.2%) |
| 65 to 74 Years | 6 (8.2%) | 0 (0.0%) |
| 75 Years and over | 4 (14.3%) | 0 (0.0%) |
Disability Class: Ambulatory Difficulty
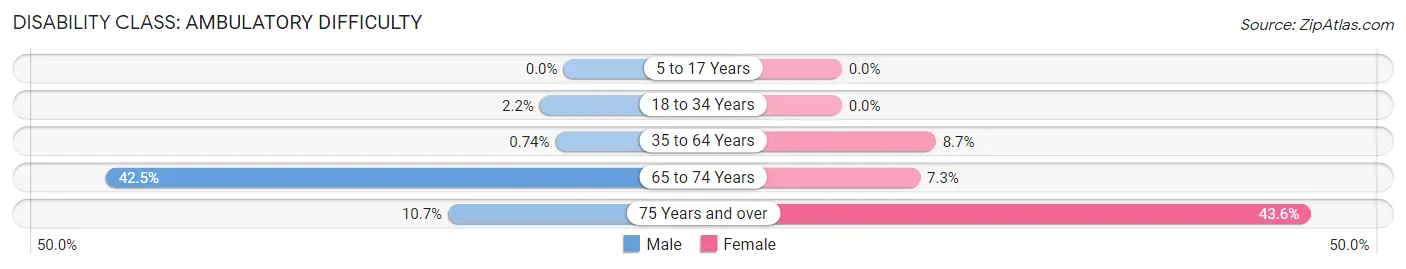
| Age Bracket | Male | Female |
| 5 to 17 Years | 0 (0.0%) | 0 (0.0%) |
| 18 to 34 Years | 2 (2.2%) | 0 (0.0%) |
| 35 to 64 Years | 1 (0.7%) | 17 (8.7%) |
| 65 to 74 Years | 31 (42.5%) | 4 (7.3%) |
| 75 Years and over | 3 (10.7%) | 27 (43.5%) |
Disability Class: Self-Care Difficulty
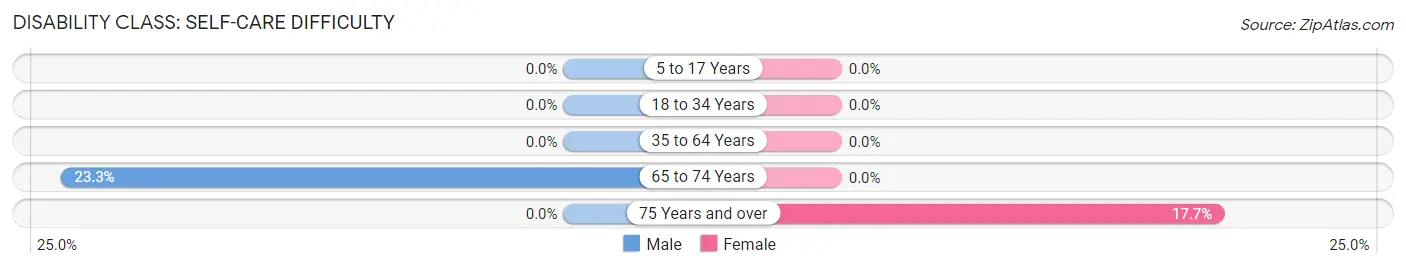
| Age Bracket | Male | Female |
| 5 to 17 Years | 0 (0.0%) | 0 (0.0%) |
| 18 to 34 Years | 0 (0.0%) | 0 (0.0%) |
| 35 to 64 Years | 0 (0.0%) | 0 (0.0%) |
| 65 to 74 Years | 17 (23.3%) | 0 (0.0%) |
| 75 Years and over | 0 (0.0%) | 11 (17.7%) |
Technology Access in Waymart borough
Computing Device Access in Waymart borough
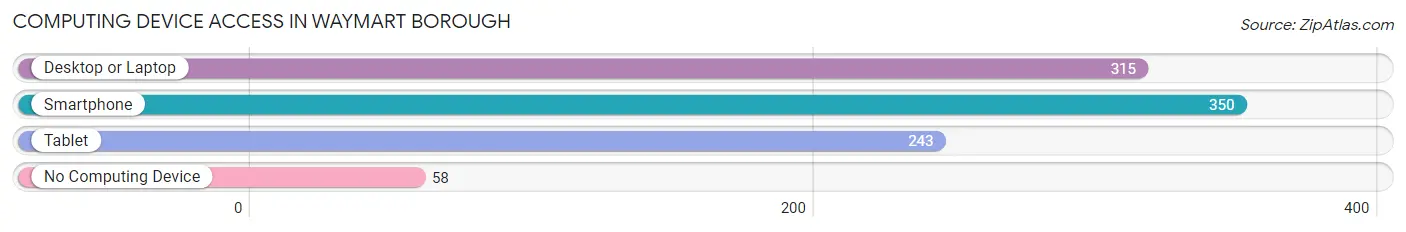
| Device Type | # Households | % Households |
| Desktop or Laptop | 315 | 72.6% |
| Smartphone | 350 | 80.6% |
| Tablet | 243 | 56.0% |
| No Computing Device | 58 | 13.4% |
| Total | 434 | 100.0% |
Internet Access in Waymart borough
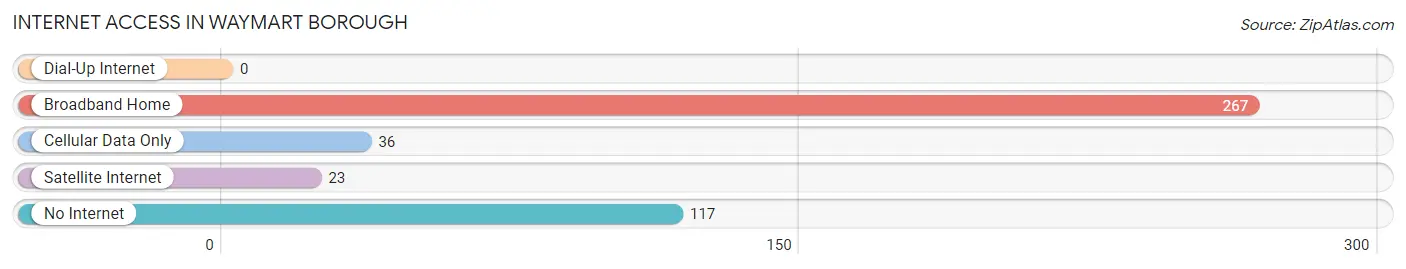
| Internet Type | # Households | % Households |
| Dial-Up Internet | 0 | 0.0% |
| Broadband Home | 267 | 61.5% |
| Cellular Data Only | 36 | 8.3% |
| Satellite Internet | 23 | 5.3% |
| No Internet | 117 | 27.0% |
| Total | 434 | 100.0% |
Waymart borough Summary
Waymart Borough is a small borough located in Wayne County, Pennsylvania. It is situated in the Pocono Mountains region of the state and is part of the Scranton–Wilkes-Barre–Hazleton Metropolitan Statistical Area. As of the 2010 census, the borough had a population of 1,072.
History
The area that is now Waymart Borough was first settled in the late 1700s by a group of German immigrants. The town was originally known as "Germantown" and was part of Salem Township. In 1845, the town was renamed Waymart after the Waymart family, who had settled in the area in the early 1800s.
In 1851, Waymart was incorporated as a borough. The town grew steadily throughout the 19th century, and by the early 20th century, it had become a popular tourist destination. The town was known for its mineral springs, which were believed to have healing properties.
Geography
Waymart Borough is located in northeastern Pennsylvania, in the Pocono Mountains region. It is situated in Wayne County, about 25 miles northeast of Scranton. The borough is bordered by Salem Township to the north, Berlin Township to the east, and Preston Township to the south and west.
The borough has a total area of 1.2 square miles, all of which is land. The terrain is mostly hilly, with elevations ranging from 1,000 to 1,500 feet above sea level. The highest point in the borough is the summit of Mount Waymart, which has an elevation of 1,521 feet.
Economy
The economy of Waymart Borough is largely based on tourism. The town is home to several resorts and hotels, as well as a variety of restaurants and shops. The town is also home to a number of small businesses, including a lumber mill, a furniture store, and a hardware store.
Demographics
As of the 2010 census, there were 1,072 people, 441 households, and 287 families residing in the borough. The population density was 890.2 people per square mile. There were 486 housing units at an average density of 405.8 per square mile.
The racial makeup of the borough was 97.7% White, 0.7% African American, 0.2% Native American, 0.2% Asian, 0.1% from other races, and 1.1% from two or more races. Hispanic or Latino of any race were 0.7% of the population.
There were 441 households, out of which 28.2% had children under the age of 18 living with them, 48.2% were married couples living together, 11.3% had a female householder with no husband present, and 34.7% were non-families. 29.2% of all households were made up of individuals, and 13.2% had someone living alone who was 65 years of age or older. The average household size was 2.43 and the average family size was 2.98.
In the borough, the population was spread out, with 24.2% under the age of 18, 6.2% from 18 to 24, 25.7% from 25 to 44, 27.2% from 45 to 64, and 16.7% who were 65 years of age or older. The median age was 40 years. For every 100 females, there were 97.2 males. For every 100 females age 18 and over, there were 94.2 males.
The median income for a household in the borough was $37,500, and the median income for a family was $45,000. Males had a median income of $31,250 versus $22,500 for females. The per capita income for the borough was $18,945. About 8.2% of families and 10.2% of the population were below the poverty line, including 14.3% of those under age 18 and 8.3% of those age 65 or over.
Common Questions
What is the Total Population of Waymart borough?
Total Population of Waymart borough is 1,226.
What is the Total Male Population of Waymart borough?
Total Male Population of Waymart borough is 495.
What is the Total Female Population of Waymart borough?
Total Female Population of Waymart borough is 731.
What is the Ratio of Males per 100 Females in Waymart borough?
There are 67.72 Males per 100 Females in Waymart borough.
What is the Ratio of Females per 100 Males in Waymart borough?
There are 147.68 Females per 100 Males in Waymart borough.
What is the Median Population Age in Waymart borough?
Median Population Age in Waymart borough is 38.0 Years.
What is the Average Family Size in Waymart borough
Average Family Size in Waymart borough is 3.4 People.
What is the Average Household Size in Waymart borough
Average Household Size in Waymart borough is 2.6 People.
What is Per Capita Income in Waymart borough?
Per Capita income in Waymart borough is $23,962.
What is the Median Family Income in Waymart borough?
Median Family Income in Waymart borough is $70,417.
What is the Median Household income in Waymart borough?
Median Household Income in Waymart borough is $50,568.
What is Income or Wage Gap in Waymart borough?
Income or Wage Gap in Waymart borough is 48.7%.
Women in Waymart borough earn 51.3 cents for every dollar earned by a man.
What is Inequality or Gini Index in Waymart borough?
Inequality or Gini Index in Waymart borough is 0.39.
How Large is the Labor Force in Waymart borough?
There are 452 People in the Labor Forcein in Waymart borough.
What is the Percentage of People in the Labor Force in Waymart borough?
48.5% of People are in the Labor Force in Waymart borough.
What is the Unemployment Rate in Waymart borough?
Unemployment Rate in Waymart borough is 6.0%.