Lima, NY
Lima Map
Lima Overview
2,243
TOTAL POPULATION
1,189
MALE POPULATION
1,054
FEMALE POPULATION
112.81
MALES / 100 FEMALES
88.65
FEMALES / 100 MALES
31.8
MEDIAN AGE
3.3
AVG FAMILY SIZE
2.5
AVG HOUSEHOLD SIZE
$31,108
PER CAPITA INCOME
$94,620
AVG FAMILY INCOME
$71,719
AVG HOUSEHOLD INCOME
40.6%
WAGE / INCOME GAP [ % ]
59.4¢/ $1
WAGE / INCOME GAP [ $ ]
0.41
INEQUALITY / GINI INDEX
1,173
LABOR FORCE [ PEOPLE ]
66.4%
PERCENT IN LABOR FORCE
2.6%
UNEMPLOYMENT RATE
Lima Zip Codes
Lima Area Codes
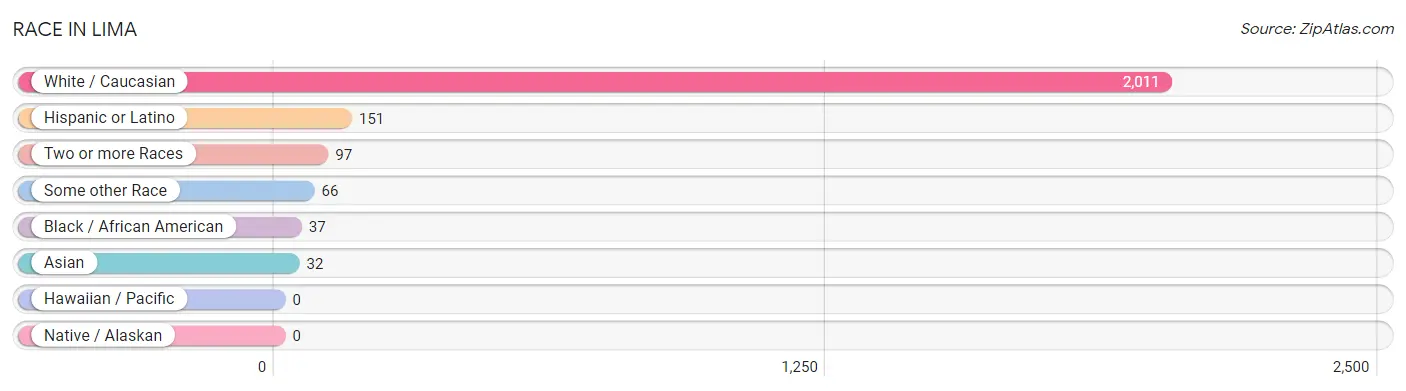
Race in Lima
The most populous races in Lima are White / Caucasian (2,011 | 89.7%), Hispanic or Latino (151 | 6.7%), and Two or more Races (97 | 4.3%).
| Race | # Population | % Population |
| Asian | 32 | 1.4% |
| Black / African American | 37 | 1.7% |
| Hawaiian / Pacific | 0 | 0.0% |
| Hispanic or Latino | 151 | 6.7% |
| Native / Alaskan | 0 | 0.0% |
| White / Caucasian | 2,011 | 89.7% |
| Two or more Races | 97 | 4.3% |
| Some other Race | 66 | 2.9% |
| Total | 2,243 | 100.0% |
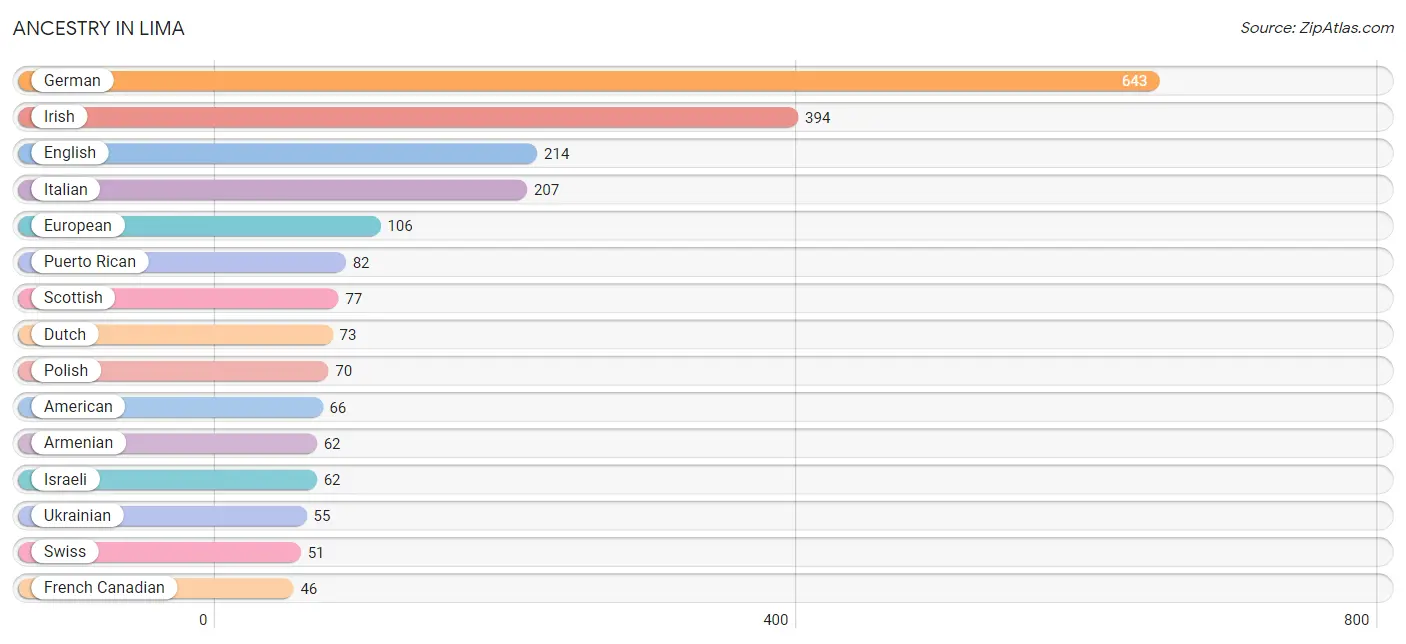
Ancestry in Lima
The most populous ancestries reported in Lima are German (643 | 28.7%), Irish (394 | 17.6%), English (214 | 9.5%), Italian (207 | 9.2%), and European (106 | 4.7%), together accounting for 69.7% of all Lima residents.
| Ancestry | # Population | % Population |
| African | 28 | 1.3% |
| American | 66 | 2.9% |
| Armenian | 62 | 2.8% |
| British | 38 | 1.7% |
| Canadian | 4 | 0.2% |
| Central American | 1 | 0.0% |
| Chippewa | 1 | 0.0% |
| Colombian | 5 | 0.2% |
| Cree | 1 | 0.0% |
| Czech | 6 | 0.3% |
| Danish | 21 | 0.9% |
| Dominican | 13 | 0.6% |
| Dutch | 73 | 3.3% |
| Eastern European | 11 | 0.5% |
| English | 214 | 9.5% |
| Estonian | 4 | 0.2% |
| European | 106 | 4.7% |
| French | 36 | 1.6% |
| French Canadian | 46 | 2.1% |
| German | 643 | 28.7% |
| Greek | 6 | 0.3% |
| Guatemalan | 1 | 0.0% |
| Hopi | 2 | 0.1% |
| Indian (Asian) | 6 | 0.3% |
| Irish | 394 | 17.6% |
| Iroquois | 3 | 0.1% |
| Israeli | 62 | 2.8% |
| Italian | 207 | 9.2% |
| Laotian | 8 | 0.4% |
| Lithuanian | 7 | 0.3% |
| Malaysian | 14 | 0.6% |
| Mexican | 10 | 0.4% |
| Paraguayan | 2 | 0.1% |
| Polish | 70 | 3.1% |
| Puerto Rican | 82 | 3.7% |
| Scandinavian | 5 | 0.2% |
| Scotch-Irish | 1 | 0.0% |
| Scottish | 77 | 3.4% |
| Sioux | 28 | 1.3% |
| South American | 27 | 1.2% |
| Subsaharan African | 28 | 1.3% |
| Swiss | 51 | 2.3% |
| Thai | 12 | 0.5% |
| Turkish | 6 | 0.3% |
| Ukrainian | 55 | 2.5% |
| Welsh | 28 | 1.3% | View All 46 Rows |
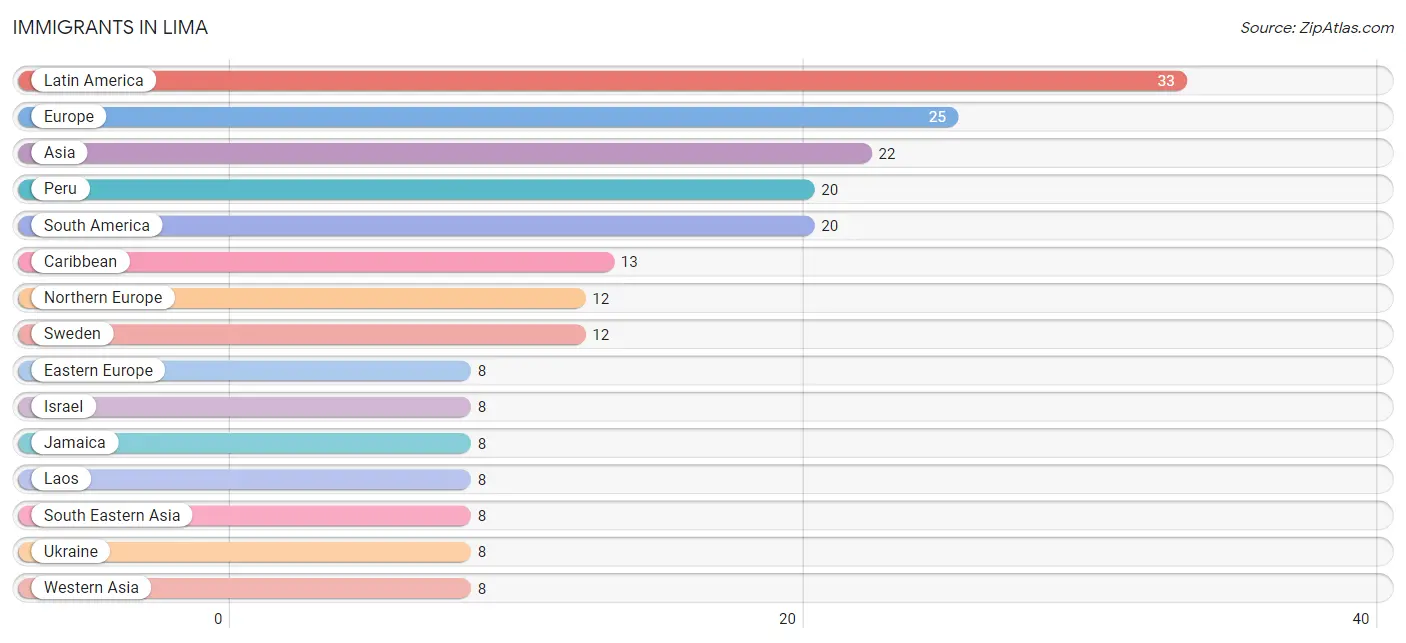
Immigrants in Lima
The most numerous immigrant groups reported in Lima came from Latin America (33 | 1.5%), Europe (25 | 1.1%), Asia (22 | 1.0%), Peru (20 | 0.9%), and South America (20 | 0.9%), together accounting for 5.3% of all Lima residents.
| Immigration Origin | # Population | % Population |
| Africa | 6 | 0.3% |
| Asia | 22 | 1.0% |
| Canada | 4 | 0.2% |
| Caribbean | 13 | 0.6% |
| China | 6 | 0.3% |
| Dominican Republic | 5 | 0.2% |
| Eastern Asia | 6 | 0.3% |
| Eastern Europe | 8 | 0.4% |
| Europe | 25 | 1.1% |
| Germany | 5 | 0.2% |
| Israel | 8 | 0.4% |
| Jamaica | 8 | 0.4% |
| Laos | 8 | 0.4% |
| Latin America | 33 | 1.5% |
| Northern Europe | 12 | 0.5% |
| Peru | 20 | 0.9% |
| South Africa | 6 | 0.3% |
| South America | 20 | 0.9% |
| South Eastern Asia | 8 | 0.4% |
| Sweden | 12 | 0.5% |
| Ukraine | 8 | 0.4% |
| Western Asia | 8 | 0.4% |
| Western Europe | 5 | 0.2% | View All 23 Rows |
Sex and Age in Lima
Sex and Age in Lima
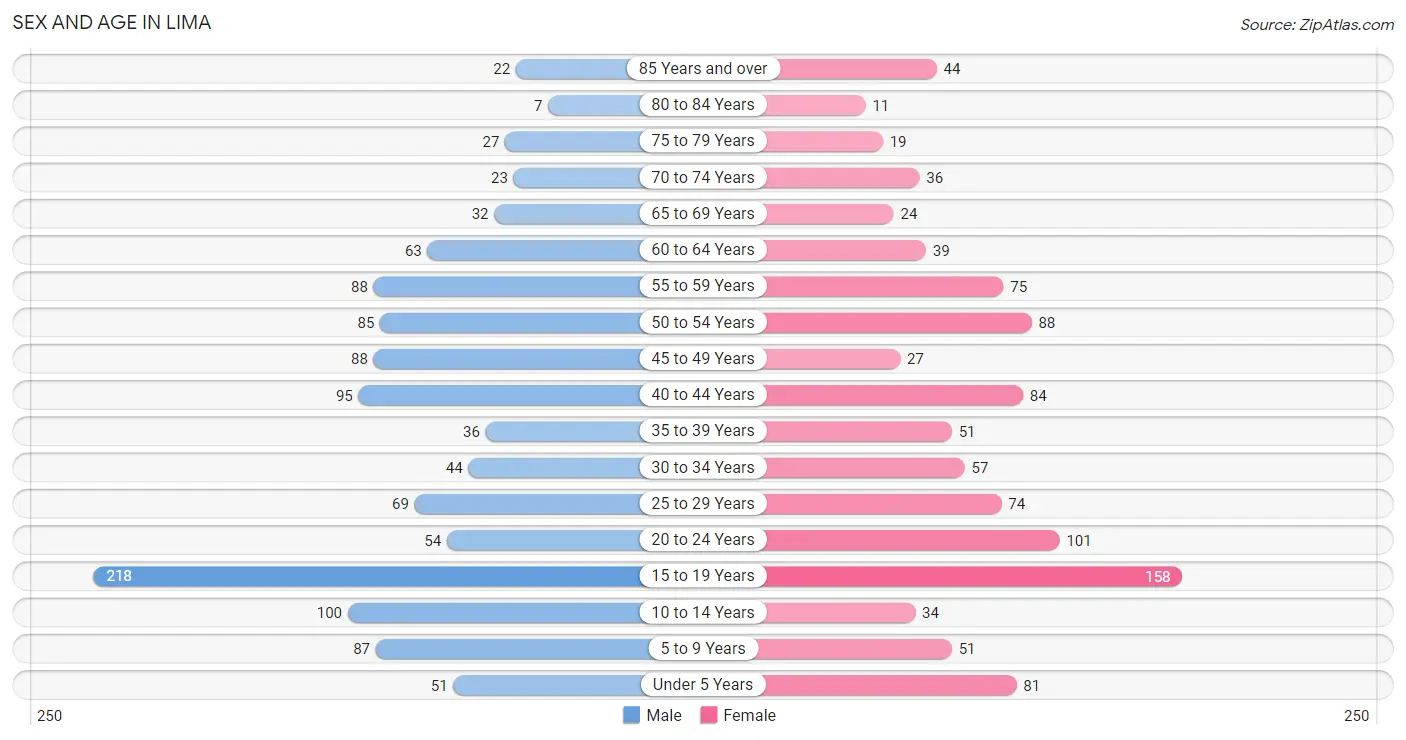
The most populous age groups in Lima are 15 to 19 Years (218 | 18.3%) for men and 15 to 19 Years (158 | 15.0%) for women.
| Age Bracket | Male | Female |
| Under 5 Years | 51 (4.3%) | 81 (7.7%) |
| 5 to 9 Years | 87 (7.3%) | 51 (4.8%) |
| 10 to 14 Years | 100 (8.4%) | 34 (3.2%) |
| 15 to 19 Years | 218 (18.3%) | 158 (15.0%) |
| 20 to 24 Years | 54 (4.5%) | 101 (9.6%) |
| 25 to 29 Years | 69 (5.8%) | 74 (7.0%) |
| 30 to 34 Years | 44 (3.7%) | 57 (5.4%) |
| 35 to 39 Years | 36 (3.0%) | 51 (4.8%) |
| 40 to 44 Years | 95 (8.0%) | 84 (8.0%) |
| 45 to 49 Years | 88 (7.4%) | 27 (2.6%) |
| 50 to 54 Years | 85 (7.1%) | 88 (8.4%) |
| 55 to 59 Years | 88 (7.4%) | 75 (7.1%) |
| 60 to 64 Years | 63 (5.3%) | 39 (3.7%) |
| 65 to 69 Years | 32 (2.7%) | 24 (2.3%) |
| 70 to 74 Years | 23 (1.9%) | 36 (3.4%) |
| 75 to 79 Years | 27 (2.3%) | 19 (1.8%) |
| 80 to 84 Years | 7 (0.6%) | 11 (1.0%) |
| 85 Years and over | 22 (1.8%) | 44 (4.2%) |
| Total | 1,189 (100.0%) | 1,054 (100.0%) |
Families and Households in Lima
Median Family Size in Lima
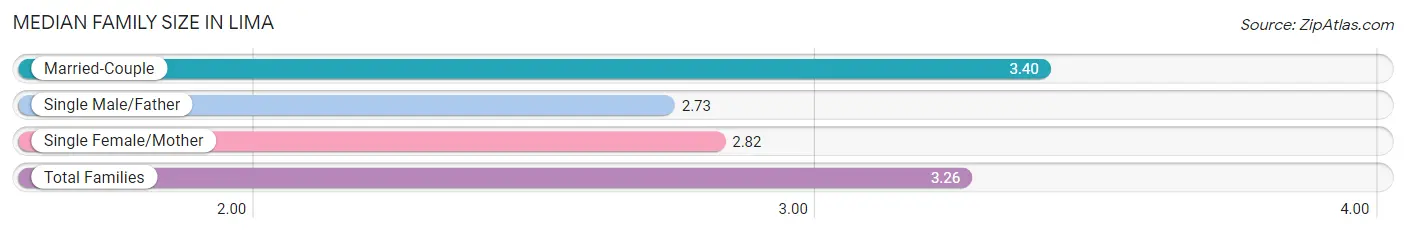
The median family size in Lima is 3.26 persons per family, with married-couple families (386 | 77.0%) accounting for the largest median family size of 3.4 persons per family. On the other hand, single male/father families (44 | 8.8%) represent the smallest median family size with 2.73 persons per family.
| Family Type | # Families | Family Size |
| Married-Couple | 386 (77.0%) | 3.40 |
| Single Male/Father | 44 (8.8%) | 2.73 |
| Single Female/Mother | 71 (14.2%) | 2.82 |
| Total Families | 501 (100.0%) | 3.26 |
Median Household Size in Lima
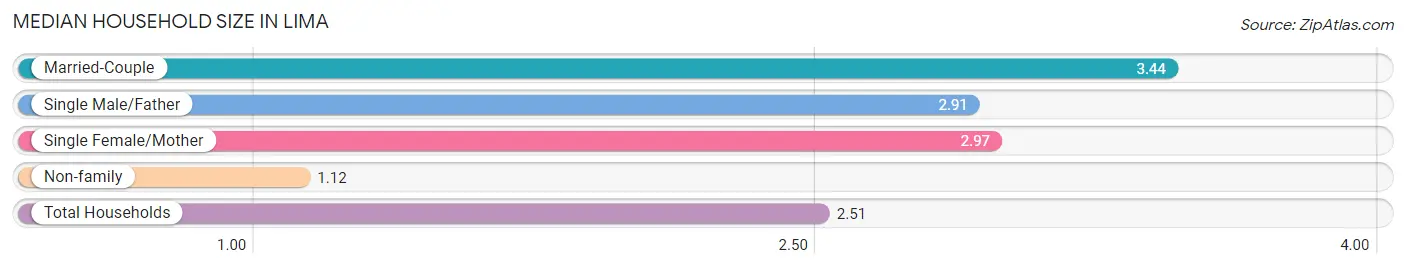
The median household size in Lima is 2.51 persons per household, with married-couple households (386 | 48.4%) accounting for the largest median household size of 3.44 persons per household. non-family households (297 | 37.2%) represent the smallest median household size with 1.12 persons per household.
| Household Type | # Households | Household Size |
| Married-Couple | 386 (48.4%) | 3.44 |
| Single Male/Father | 44 (5.5%) | 2.91 |
| Single Female/Mother | 71 (8.9%) | 2.97 |
| Non-family | 297 (37.2%) | 1.12 |
| Total Households | 798 (100.0%) | 2.51 |
Household Size by Marriage Status in Lima
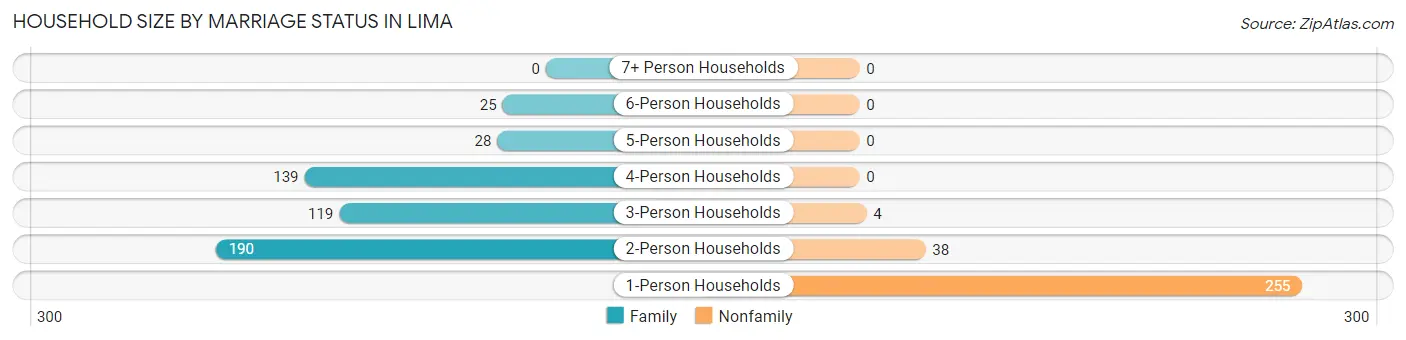
Out of a total of 798 households in Lima, 501 (62.8%) are family households, while 297 (37.2%) are nonfamily households. The most numerous type of family households are 2-person households, comprising 190, and the most common type of nonfamily households are 1-person households, comprising 255.
| Household Size | Family Households | Nonfamily Households |
| 1-Person Households | - | 255 (32.0%) |
| 2-Person Households | 190 (23.8%) | 38 (4.8%) |
| 3-Person Households | 119 (14.9%) | 4 (0.5%) |
| 4-Person Households | 139 (17.4%) | 0 (0.0%) |
| 5-Person Households | 28 (3.5%) | 0 (0.0%) |
| 6-Person Households | 25 (3.1%) | 0 (0.0%) |
| 7+ Person Households | 0 (0.0%) | 0 (0.0%) |
| Total | 501 (62.8%) | 297 (37.2%) |
Female Fertility in Lima
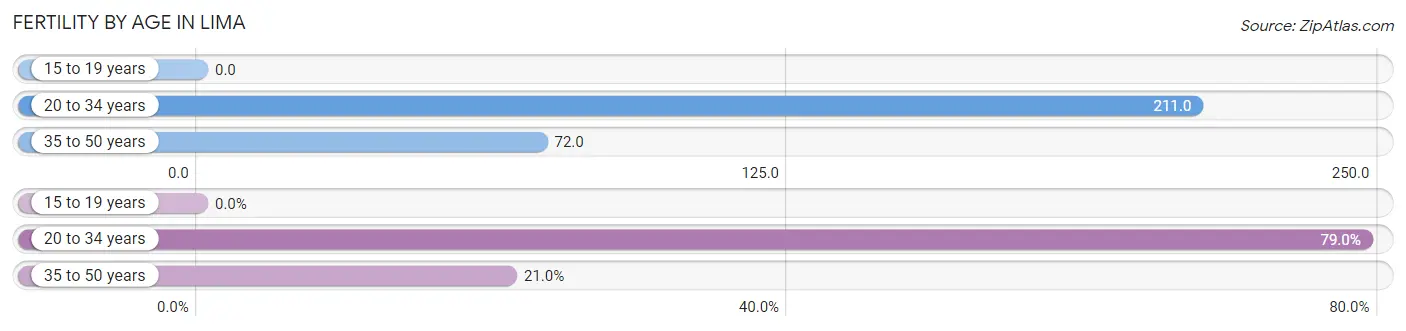
Fertility by Age in Lima
Average fertility rate in Lima is 109.0 births per 1,000 women. Women in the age bracket of 20 to 34 years have the highest fertility rate with 211.0 births per 1,000 women. Women in the age bracket of 20 to 34 years acount for 79.0% of all women with births.
| Age Bracket | Women with Births | Births / 1,000 Women |
| 15 to 19 years | 0 (0.0%) | 0.0 |
| 20 to 34 years | 49 (79.0%) | 211.0 |
| 35 to 50 years | 13 (21.0%) | 72.0 |
| Total | 62 (100.0%) | 109.0 |
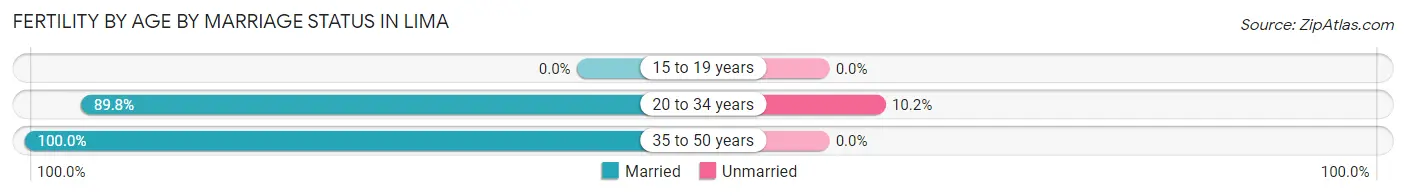
Fertility by Age by Marriage Status in Lima
91.9% of women with births (62) in Lima are married. The highest percentage of unmarried women with births falls into 20 to 34 years age bracket with 10.2% of them unmarried at the time of birth, while the lowest percentage of unmarried women with births belong to 35 to 50 years age bracket with 0.0% of them unmarried.
| Age Bracket | Married | Unmarried |
| 15 to 19 years | 0 (0.0%) | 0 (0.0%) |
| 20 to 34 years | 44 (89.8%) | 5 (10.2%) |
| 35 to 50 years | 13 (100.0%) | 0 (0.0%) |
| Total | 57 (91.9%) | 5 (8.1%) |
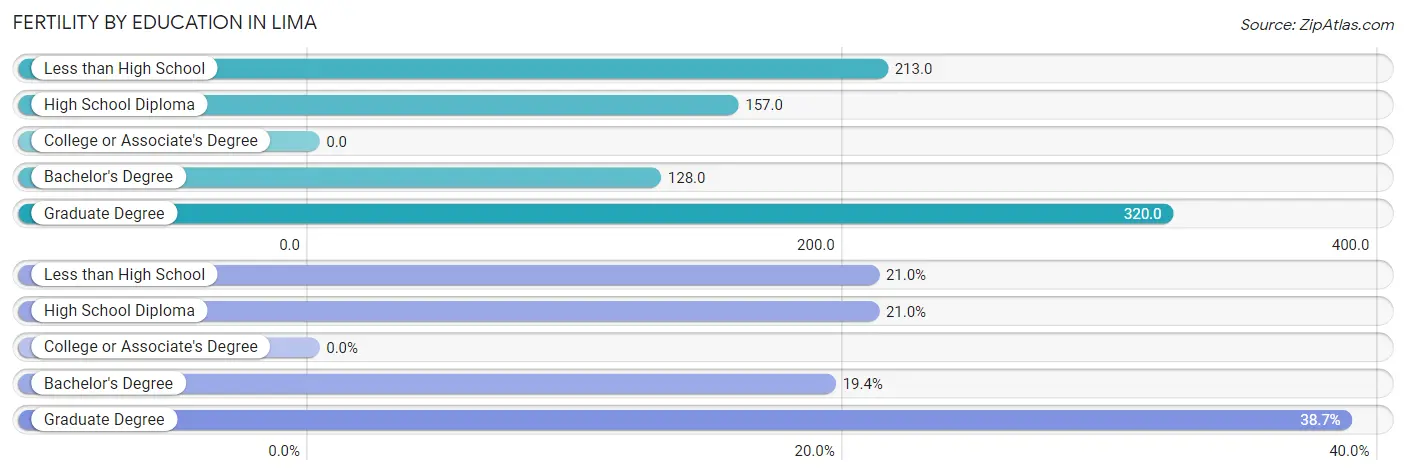
Fertility by Education in Lima
| Educational Attainment | Women with Births | Births / 1,000 Women |
| Less than High School | 13 (21.0%) | 213.0 |
| High School Diploma | 13 (21.0%) | 157.0 |
| College or Associate's Degree | 0 (0.0%) | 0.0 |
| Bachelor's Degree | 12 (19.4%) | 128.0 |
| Graduate Degree | 24 (38.7%) | 320.0 |
| Total | 62 (100.0%) | 109.0 |
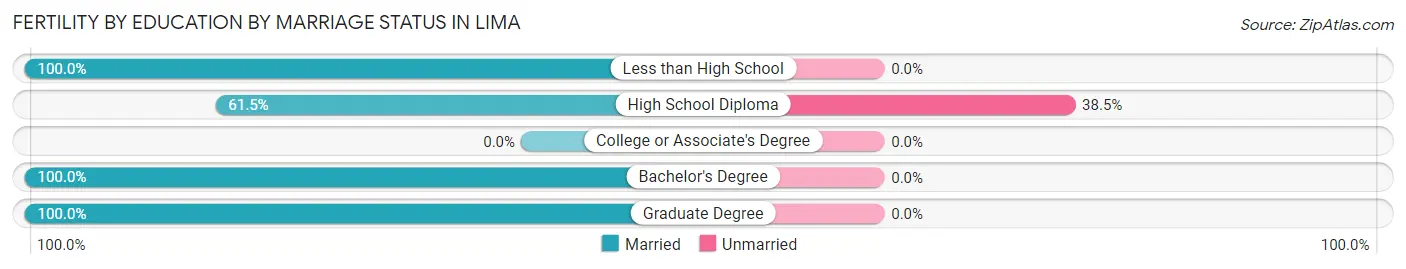
Fertility by Education by Marriage Status in Lima
8.1% of women with births in Lima are unmarried. Women with the educational attainment of less than high school are most likely to be married with 100.0% of them married at childbirth, while women with the educational attainment of high school diploma are least likely to be married with 38.5% of them unmarried at childbirth.
| Educational Attainment | Married | Unmarried |
| Less than High School | 13 (100.0%) | 0 (0.0%) |
| High School Diploma | 8 (61.5%) | 5 (38.5%) |
| College or Associate's Degree | 0 (0.0%) | 0 (0.0%) |
| Bachelor's Degree | 12 (100.0%) | 0 (0.0%) |
| Graduate Degree | 24 (100.0%) | 0 (0.0%) |
| Total | 57 (91.9%) | 5 (8.1%) |
Income in Lima
Income Overview in Lima
Per Capita Income in Lima is $31,108, while median incomes of families and households are $94,620 and $71,719 respectively.
| Characteristic | Number | Measure |
| Per Capita Income | 2,243 | $31,108 |
| Median Family Income | 501 | $94,620 |
| Mean Family Income | 501 | $103,334 |
| Median Household Income | 798 | $71,719 |
| Mean Household Income | 798 | $85,129 |
| Income Deficit | 501 | $0 |
| Wage / Income Gap (%) | 2,243 | 40.60% |
| Wage / Income Gap ($) | 2,243 | 59.40¢ per $1 |
| Gini / Inequality Index | 2,243 | 0.41 |
Earnings by Sex in Lima
Average Earnings in Lima are $38,346, $46,429 for men and $27,578 for women, a difference of 40.6%.
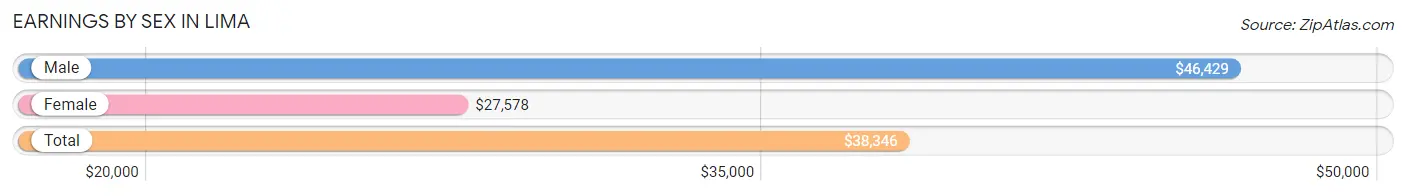
| Sex | Number | Average Earnings |
| Male | 680 (55.2%) | $46,429 |
| Female | 551 (44.8%) | $27,578 |
| Total | 1,231 (100.0%) | $38,346 |
Earnings by Sex by Income Bracket in Lima
The most common earnings brackets in Lima are $75,000 to $99,999 for men (98 | 14.4%) and $2,500 to $4,999 for women (74 | 13.4%).
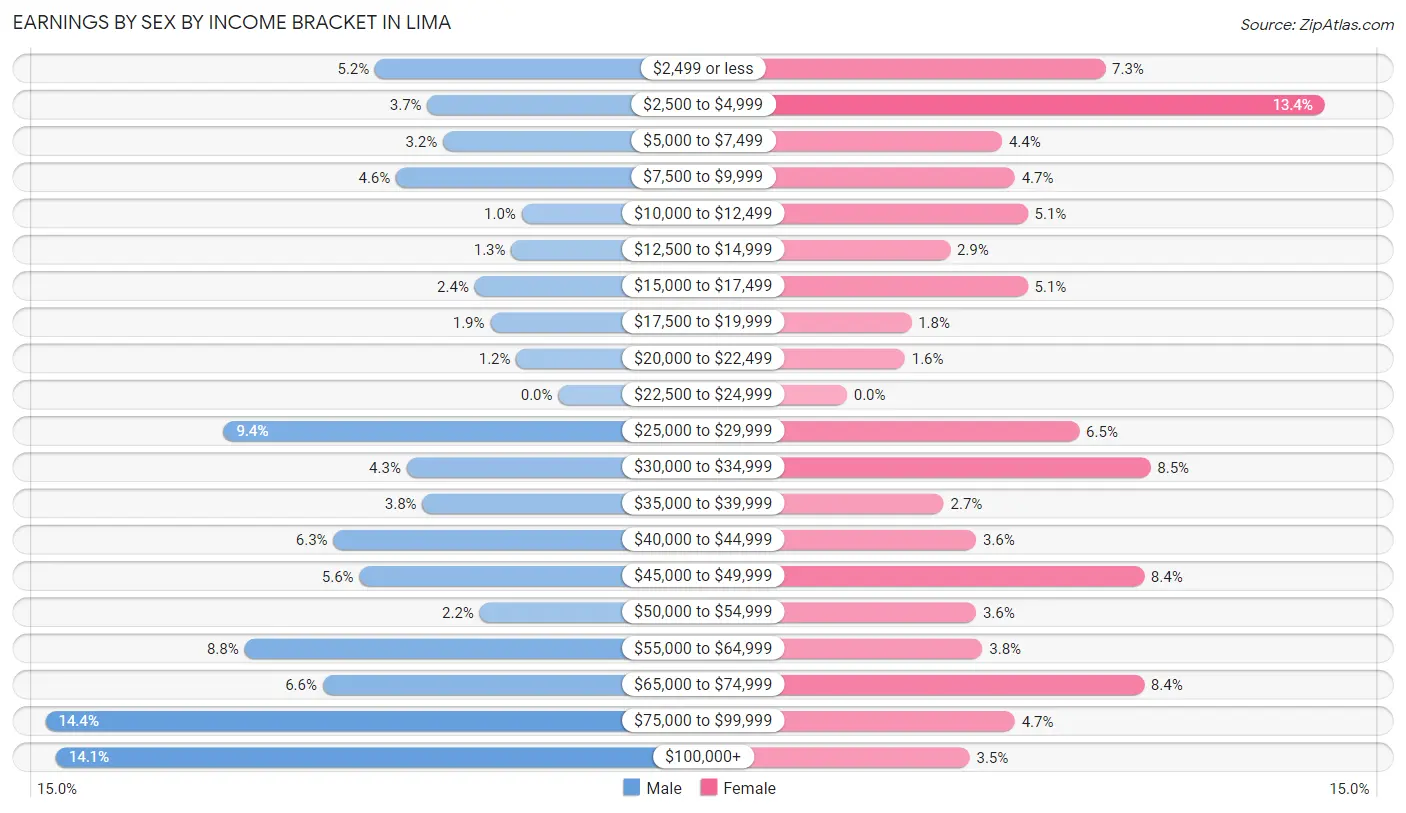
| Income | Male | Female |
| $2,499 or less | 35 (5.1%) | 40 (7.3%) |
| $2,500 to $4,999 | 25 (3.7%) | 74 (13.4%) |
| $5,000 to $7,499 | 22 (3.2%) | 24 (4.4%) |
| $7,500 to $9,999 | 31 (4.6%) | 26 (4.7%) |
| $10,000 to $12,499 | 7 (1.0%) | 28 (5.1%) |
| $12,500 to $14,999 | 9 (1.3%) | 16 (2.9%) |
| $15,000 to $17,499 | 16 (2.4%) | 28 (5.1%) |
| $17,500 to $19,999 | 13 (1.9%) | 10 (1.8%) |
| $20,000 to $22,499 | 8 (1.2%) | 9 (1.6%) |
| $22,500 to $24,999 | 0 (0.0%) | 0 (0.0%) |
| $25,000 to $29,999 | 64 (9.4%) | 36 (6.5%) |
| $30,000 to $34,999 | 29 (4.3%) | 47 (8.5%) |
| $35,000 to $39,999 | 26 (3.8%) | 15 (2.7%) |
| $40,000 to $44,999 | 43 (6.3%) | 20 (3.6%) |
| $45,000 to $49,999 | 38 (5.6%) | 46 (8.4%) |
| $50,000 to $54,999 | 15 (2.2%) | 20 (3.6%) |
| $55,000 to $64,999 | 60 (8.8%) | 21 (3.8%) |
| $65,000 to $74,999 | 45 (6.6%) | 46 (8.4%) |
| $75,000 to $99,999 | 98 (14.4%) | 26 (4.7%) |
| $100,000+ | 96 (14.1%) | 19 (3.5%) |
| Total | 680 (100.0%) | 551 (100.0%) |
Earnings by Sex by Educational Attainment in Lima
Average earnings in Lima are $57,847 for men and $37,750 for women, a difference of 34.7%. Men with an educational attainment of bachelor's degree enjoy the highest average annual earnings of $78,750, while those with college or associate's degree education earn the least with $47,000. Women with an educational attainment of graduate degree earn the most with the average annual earnings of $57,679, while those with high school diploma education have the smallest earnings of $27,500.
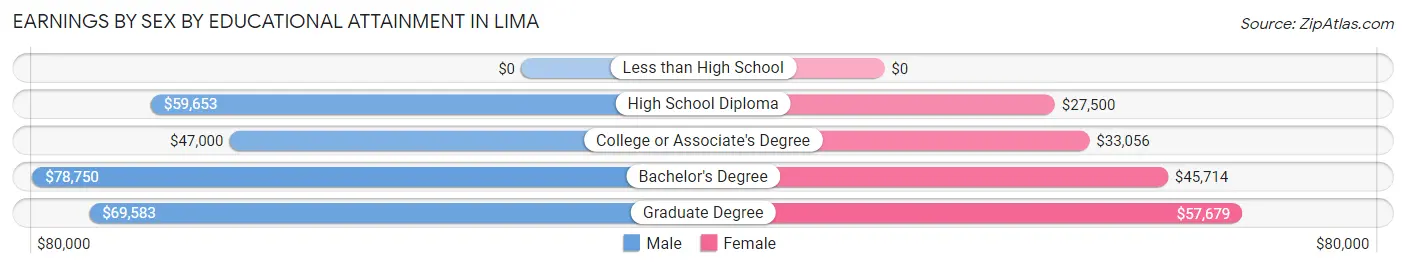
| Educational Attainment | Male Income | Female Income |
| Less than High School | - | - |
| High School Diploma | $59,653 | $27,500 |
| College or Associate's Degree | $47,000 | $33,056 |
| Bachelor's Degree | $78,750 | $45,714 |
| Graduate Degree | $69,583 | $57,679 |
| Total | $57,847 | $37,750 |
Family Income in Lima
Family Income Brackets in Lima
According to the Lima family income data, there are 140 families falling into the $75,000 to $99,999 income range, which is the most common income bracket and makes up 27.9% of all families.
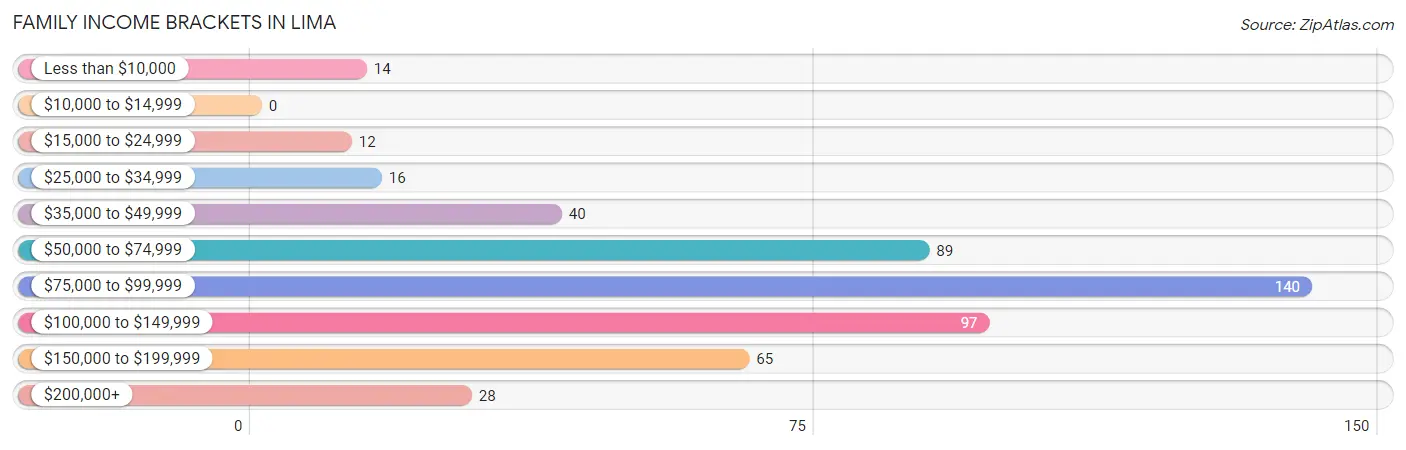
| Income Bracket | # Families | % Families |
| Less than $10,000 | 14 | 2.8% |
| $10,000 to $14,999 | 0 | 0.0% |
| $15,000 to $24,999 | 12 | 2.4% |
| $25,000 to $34,999 | 16 | 3.2% |
| $35,000 to $49,999 | 40 | 8.0% |
| $50,000 to $74,999 | 89 | 17.8% |
| $75,000 to $99,999 | 140 | 27.9% |
| $100,000 to $149,999 | 97 | 19.4% |
| $150,000 to $199,999 | 65 | 13.0% |
| $200,000+ | 28 | 5.6% |
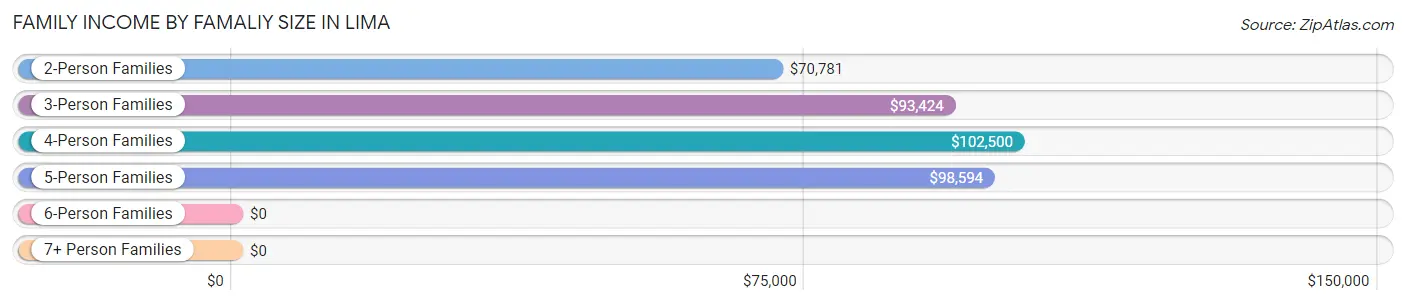
Family Income by Famaliy Size in Lima
4-person families (124 | 24.7%) account for the highest median family income in Lima with $102,500 per family, while 2-person families (201 | 40.1%) have the highest median income of $35,390 per family member.
| Income Bracket | # Families | Median Income |
| 2-Person Families | 201 (40.1%) | $70,781 |
| 3-Person Families | 123 (24.5%) | $93,424 |
| 4-Person Families | 124 (24.7%) | $102,500 |
| 5-Person Families | 37 (7.4%) | $98,594 |
| 6-Person Families | 16 (3.2%) | $0 |
| 7+ Person Families | 0 (0.0%) | $0 |
| Total | 501 (100.0%) | $94,620 |
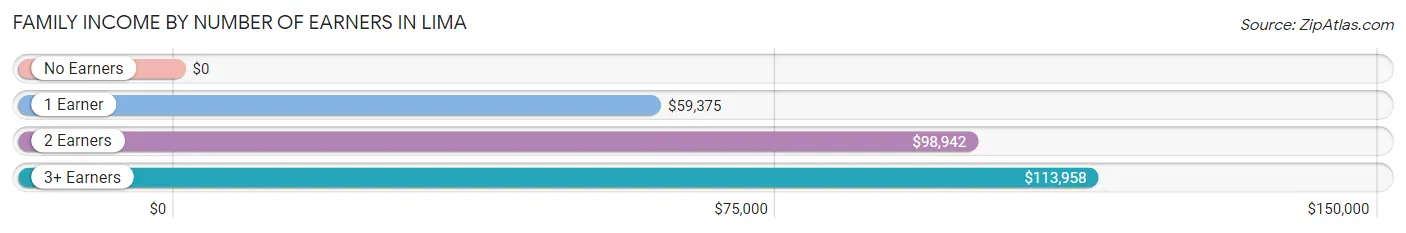
Family Income by Number of Earners in Lima
| Number of Earners | # Families | Median Income |
| No Earners | 16 (3.2%) | $0 |
| 1 Earner | 207 (41.3%) | $59,375 |
| 2 Earners | 175 (34.9%) | $98,942 |
| 3+ Earners | 103 (20.6%) | $113,958 |
| Total | 501 (100.0%) | $94,620 |
Household Income in Lima
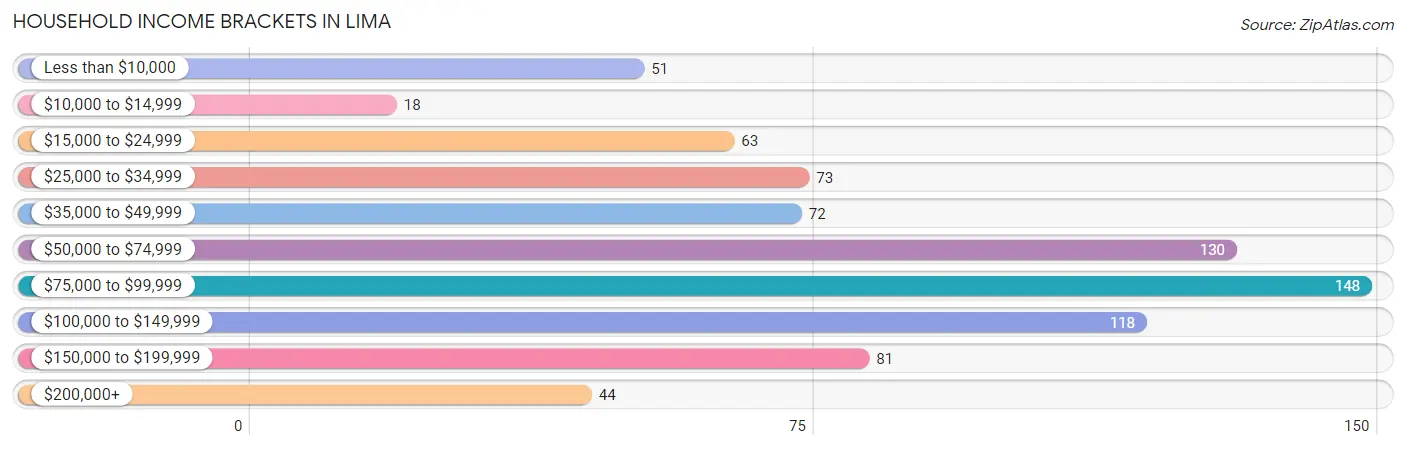
Household Income Brackets in Lima
With 148 households falling in the category, the $75,000 to $99,999 income range is the most frequent in Lima, accounting for 18.5% of all households. In contrast, only 18 households (2.3%) fall into the $10,000 to $14,999 income bracket, making it the least populous group.
| Income Bracket | # Households | % Households |
| Less than $10,000 | 51 | 6.4% |
| $10,000 to $14,999 | 18 | 2.3% |
| $15,000 to $24,999 | 63 | 7.9% |
| $25,000 to $34,999 | 73 | 9.1% |
| $35,000 to $49,999 | 72 | 9.0% |
| $50,000 to $74,999 | 130 | 16.3% |
| $75,000 to $99,999 | 148 | 18.5% |
| $100,000 to $149,999 | 118 | 14.8% |
| $150,000 to $199,999 | 81 | 10.2% |
| $200,000+ | 44 | 5.5% |
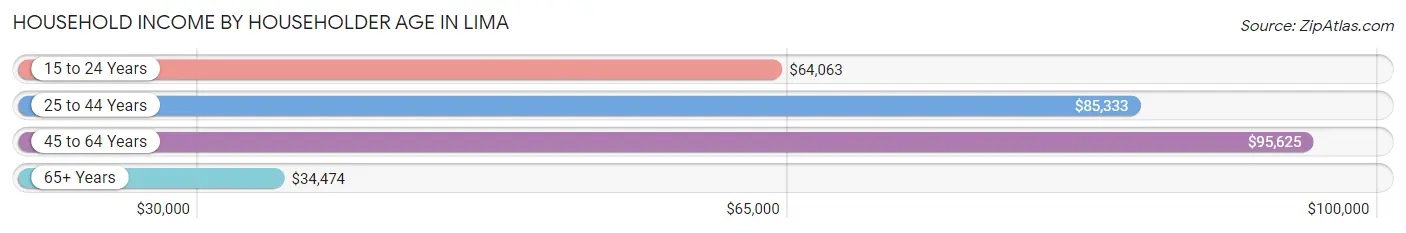
Household Income by Householder Age in Lima
The median household income in Lima is $71,719, with the highest median household income of $95,625 found in the 45 to 64 years age bracket for the primary householder. A total of 286 households (35.8%) fall into this category. Meanwhile, the 65+ years age bracket for the primary householder has the lowest median household income of $34,474, with 196 households (24.6%) in this group.
| Income Bracket | # Households | Median Income |
| 15 to 24 Years | 18 (2.3%) | $64,063 |
| 25 to 44 Years | 298 (37.3%) | $85,333 |
| 45 to 64 Years | 286 (35.8%) | $95,625 |
| 65+ Years | 196 (24.6%) | $34,474 |
| Total | 798 (100.0%) | $71,719 |
Poverty in Lima
Income Below Poverty by Sex and Age in Lima
With 3.6% poverty level for males and 10.1% for females among the residents of Lima, under 5 year old males and 12 to 14 year old females are the most vulnerable to poverty, with 7 males (13.7%) and 5 females (55.6%) in their respective age groups living below the poverty level.
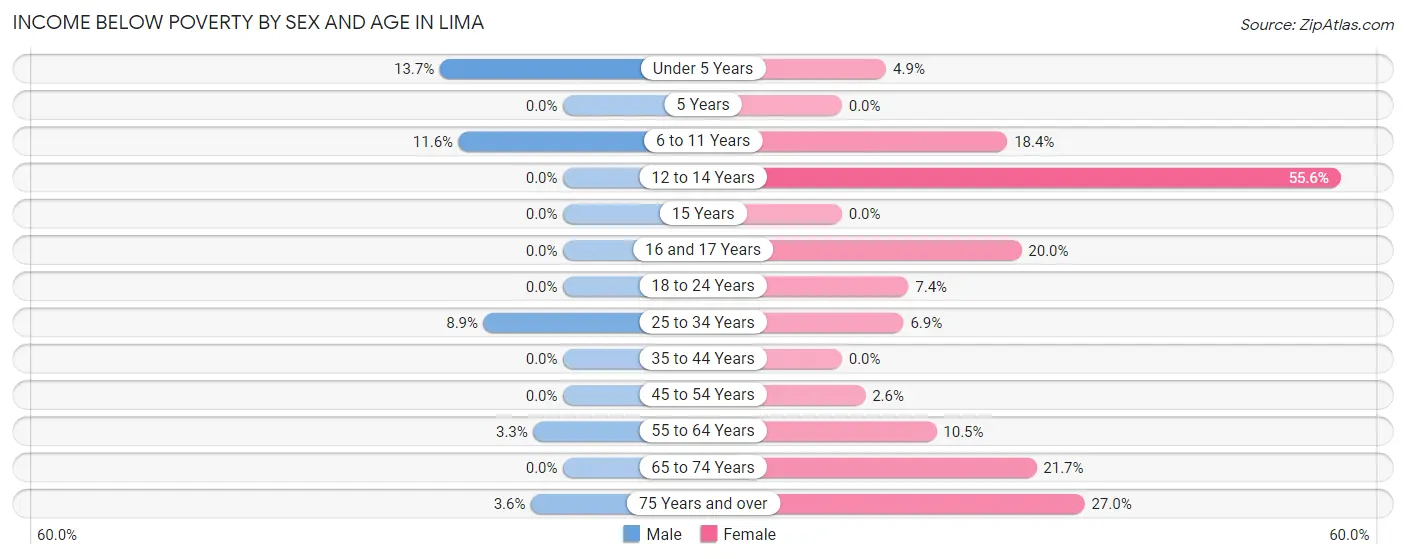
| Age Bracket | Male | Female |
| Under 5 Years | 7 (13.7%) | 4 (4.9%) |
| 5 Years | 0 (0.0%) | 0 (0.0%) |
| 6 to 11 Years | 15 (11.6%) | 14 (18.4%) |
| 12 to 14 Years | 0 (0.0%) | 5 (55.6%) |
| 15 Years | 0 (0.0%) | 0 (0.0%) |
| 16 and 17 Years | 0 (0.0%) | 7 (20.0%) |
| 18 to 24 Years | 0 (0.0%) | 6 (7.4%) |
| 25 to 34 Years | 10 (8.8%) | 9 (6.9%) |
| 35 to 44 Years | 0 (0.0%) | 0 (0.0%) |
| 45 to 54 Years | 0 (0.0%) | 3 (2.6%) |
| 55 to 64 Years | 5 (3.3%) | 12 (10.5%) |
| 65 to 74 Years | 0 (0.0%) | 13 (21.7%) |
| 75 Years and over | 2 (3.6%) | 20 (27.0%) |
| Total | 39 (3.6%) | 93 (10.1%) |
Income Above Poverty by Sex and Age in Lima
According to the poverty statistics in Lima, males aged 5 years and females aged 15 years are the age groups that are most secure financially, with 100.0% of males and 100.0% of females in these age groups living above the poverty line.
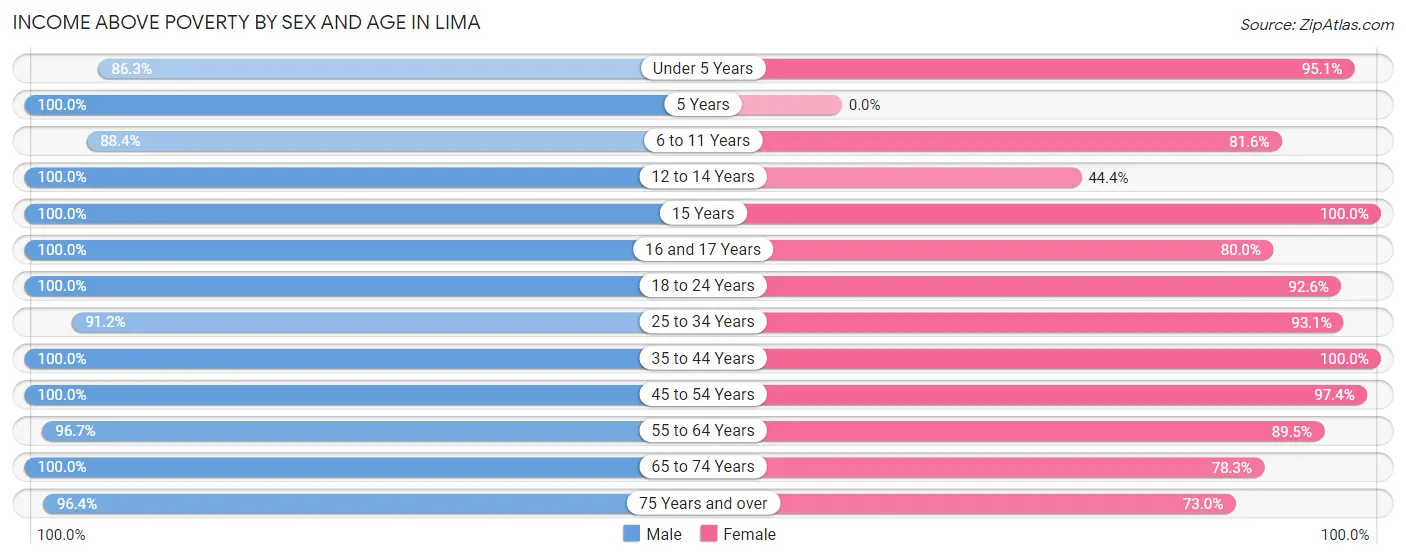
| Age Bracket | Male | Female |
| Under 5 Years | 44 (86.3%) | 77 (95.1%) |
| 5 Years | 7 (100.0%) | 0 (0.0%) |
| 6 to 11 Years | 114 (88.4%) | 62 (81.6%) |
| 12 to 14 Years | 51 (100.0%) | 4 (44.4%) |
| 15 Years | 60 (100.0%) | 13 (100.0%) |
| 16 and 17 Years | 28 (100.0%) | 28 (80.0%) |
| 18 to 24 Years | 80 (100.0%) | 75 (92.6%) |
| 25 to 34 Years | 103 (91.1%) | 122 (93.1%) |
| 35 to 44 Years | 131 (100.0%) | 135 (100.0%) |
| 45 to 54 Years | 173 (100.0%) | 112 (97.4%) |
| 55 to 64 Years | 146 (96.7%) | 102 (89.5%) |
| 65 to 74 Years | 55 (100.0%) | 47 (78.3%) |
| 75 Years and over | 54 (96.4%) | 54 (73.0%) |
| Total | 1,046 (96.4%) | 831 (89.9%) |
Income Below Poverty Among Married-Couple Families in Lima
The poverty statistics for married-couple families in Lima show that 1.0% or 4 of the total 386 families live below the poverty line. Families with 1 or 2 children have the highest poverty rate of 2.3%, comprising of 4 families. On the other hand, families with no children have the lowest poverty rate of 0.0%, which includes 0 families.
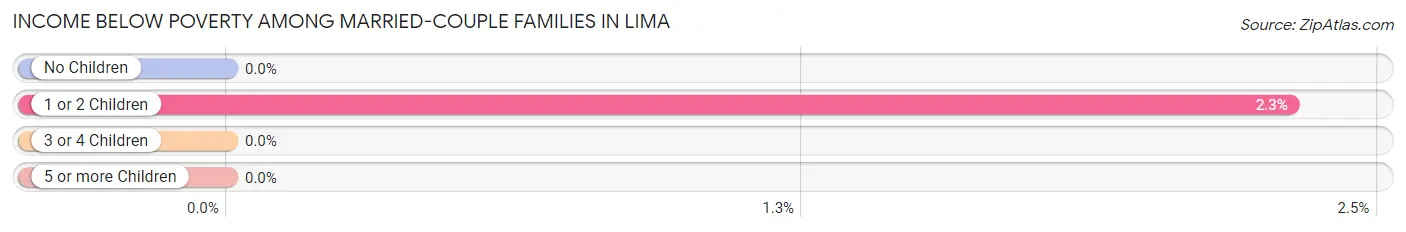
| Children | Above Poverty | Below Poverty |
| No Children | 172 (100.0%) | 0 (0.0%) |
| 1 or 2 Children | 169 (97.7%) | 4 (2.3%) |
| 3 or 4 Children | 41 (100.0%) | 0 (0.0%) |
| 5 or more Children | 0 (0.0%) | 0 (0.0%) |
| Total | 382 (99.0%) | 4 (1.0%) |
Income Below Poverty Among Single-Parent Households in Lima
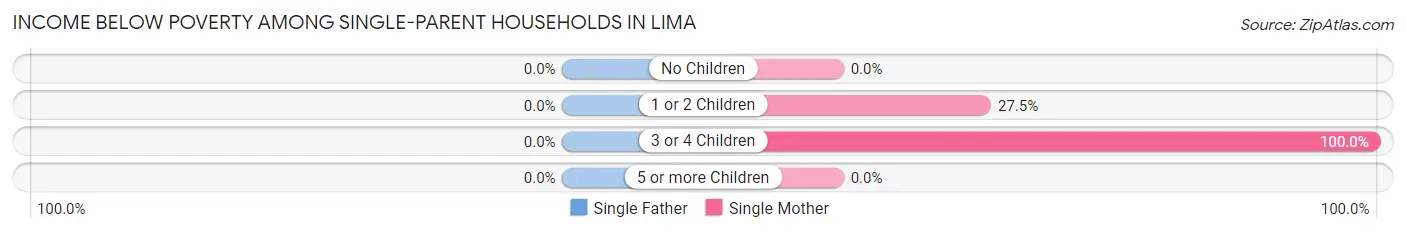
| Children | Single Father | Single Mother |
| No Children | 0 (0.0%) | 0 (0.0%) |
| 1 or 2 Children | 0 (0.0%) | 14 (27.5%) |
| 3 or 4 Children | 0 (0.0%) | 3 (100.0%) |
| 5 or more Children | 0 (0.0%) | 0 (0.0%) |
| Total | 0 (0.0%) | 17 (23.9%) |
Income Below Poverty Among Married-Couple vs Single-Parent Households in Lima
The poverty data for Lima shows that 4 of the married-couple family households (1.0%) and 17 of the single-parent households (14.8%) are living below the poverty level. Within the married-couple family households, those with 1 or 2 children have the highest poverty rate, with 4 households (2.3%) falling below the poverty line. Among the single-parent households, those with 3 or 4 children have the highest poverty rate, with 3 household (100.0%) living below poverty.
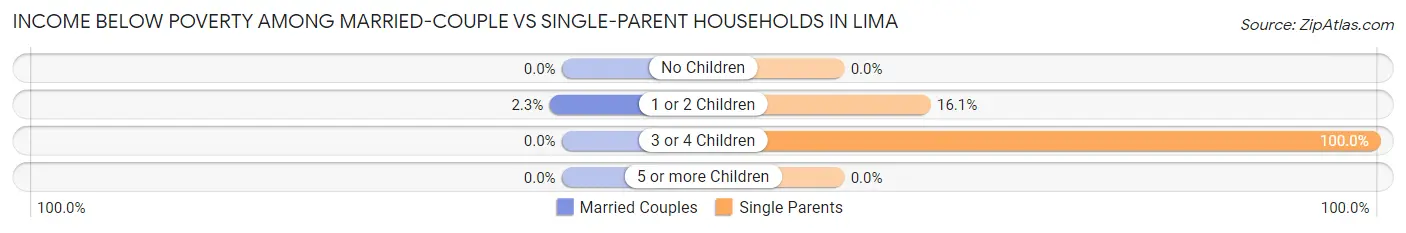
| Children | Married-Couple Families | Single-Parent Households |
| No Children | 0 (0.0%) | 0 (0.0%) |
| 1 or 2 Children | 4 (2.3%) | 14 (16.1%) |
| 3 or 4 Children | 0 (0.0%) | 3 (100.0%) |
| 5 or more Children | 0 (0.0%) | 0 (0.0%) |
| Total | 4 (1.0%) | 17 (14.8%) |
Employment Characteristics in Lima
Employment by Class of Employer in Lima
Among the 1,104 employed individuals in Lima, private company employees (697 | 63.1%), not-for-profit organizations (156 | 14.1%), and local government employees (138 | 12.5%) make up the most common classes of employment.
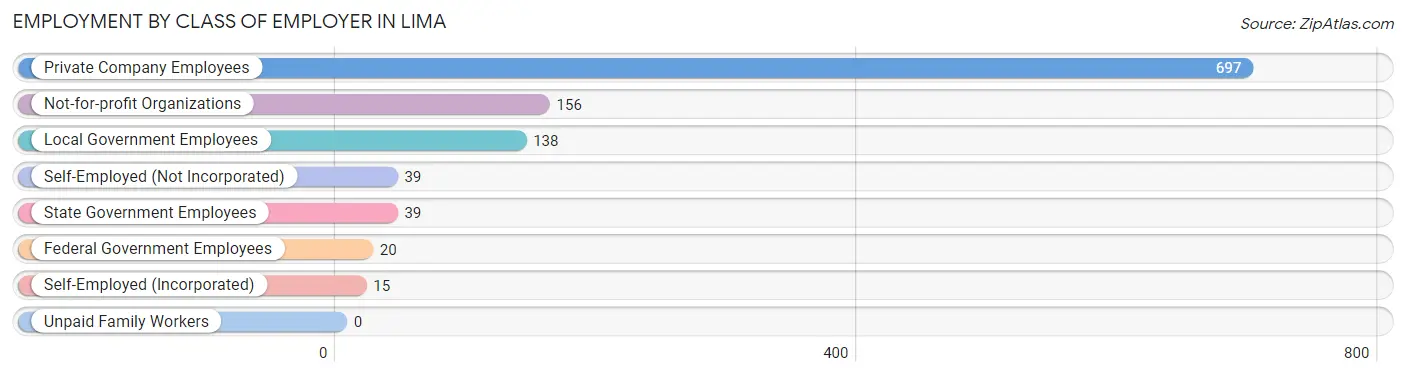
| Employer Class | # Employees | % Employees |
| Private Company Employees | 697 | 63.1% |
| Self-Employed (Incorporated) | 15 | 1.4% |
| Self-Employed (Not Incorporated) | 39 | 3.5% |
| Not-for-profit Organizations | 156 | 14.1% |
| Local Government Employees | 138 | 12.5% |
| State Government Employees | 39 | 3.5% |
| Federal Government Employees | 20 | 1.8% |
| Unpaid Family Workers | 0 | 0.0% |
| Total | 1,104 | 100.0% |
Employment Status by Age in Lima
According to the labor force statistics for Lima, out of the total population over 16 years of age (1,766), 66.4% or 1,173 individuals are in the labor force, with 2.6% or 30 of them unemployed. The age group with the highest labor force participation rate is 25 to 29 years, with 94.4% or 135 individuals in the labor force. Within the labor force, the 30 to 34 years age range has the highest percentage of unemployed individuals, with 8.7% or 8 of them being unemployed.
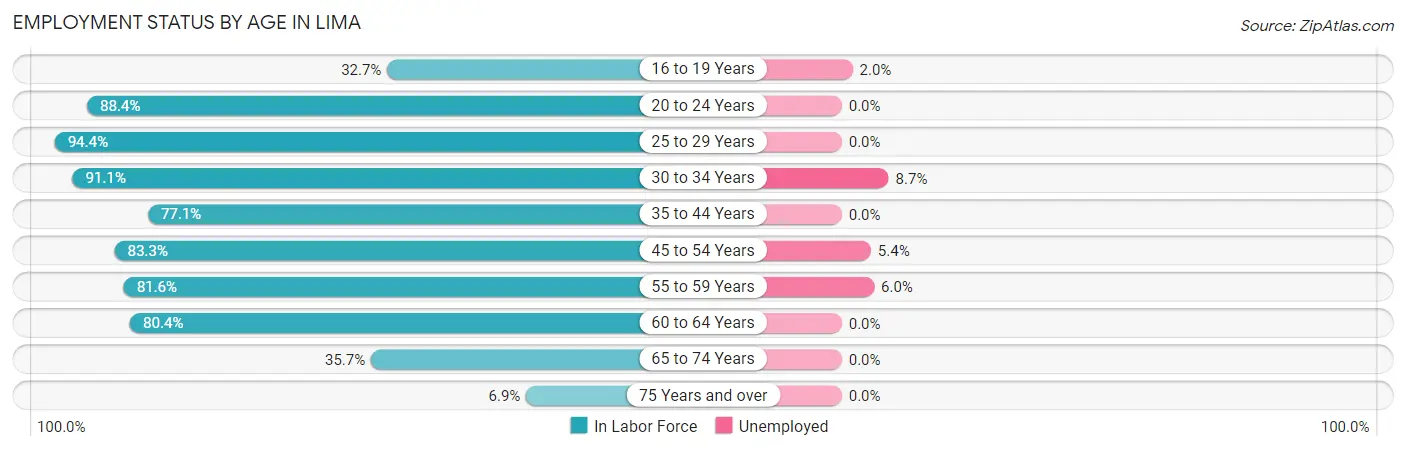
| Age Bracket | In Labor Force | Unemployed |
| 16 to 19 Years | 99 (32.7%) | 2 (2.0%) |
| 20 to 24 Years | 137 (88.4%) | 0 (0.0%) |
| 25 to 29 Years | 135 (94.4%) | 0 (0.0%) |
| 30 to 34 Years | 92 (91.1%) | 8 (8.7%) |
| 35 to 44 Years | 205 (77.1%) | 0 (0.0%) |
| 45 to 54 Years | 240 (83.3%) | 13 (5.4%) |
| 55 to 59 Years | 133 (81.6%) | 8 (6.0%) |
| 60 to 64 Years | 82 (80.4%) | 0 (0.0%) |
| 65 to 74 Years | 41 (35.7%) | 0 (0.0%) |
| 75 Years and over | 9 (6.9%) | 0 (0.0%) |
| Total | 1,173 (66.4%) | 30 (2.6%) |
Employment Status by Educational Attainment in Lima
According to labor force statistics for Lima, 83.4% of individuals (887) out of the total population between 25 and 64 years of age (1,063) are in the labor force, with 3.3% or 29 of them being unemployed. The group with the highest labor force participation rate are those with the educational attainment of bachelor's degree or higher, with 91.7% or 397 individuals in the labor force. Within the labor force, individuals with college / associate degree education have the highest percentage of unemployment, with 4.6% or 15 of them being unemployed.
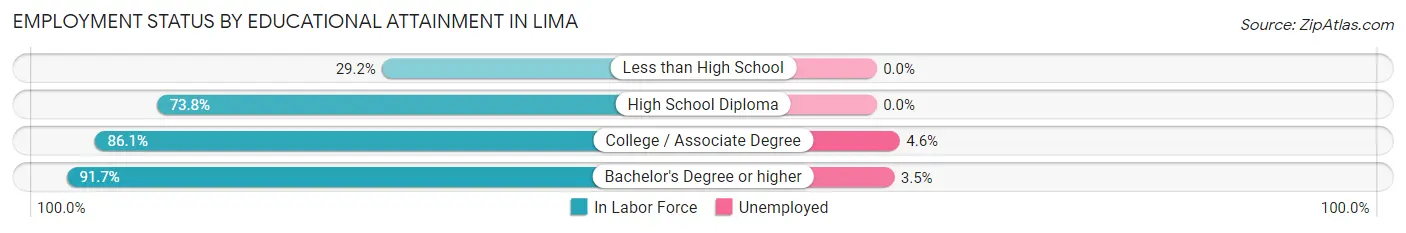
| Educational Attainment | In Labor Force | Unemployed |
| Less than High School | 14 (29.2%) | 0 (0.0%) |
| High School Diploma | 149 (73.8%) | 0 (0.0%) |
| College / Associate Degree | 327 (86.1%) | 17 (4.6%) |
| Bachelor's Degree or higher | 397 (91.7%) | 15 (3.5%) |
| Total | 887 (83.4%) | 35 (3.3%) |
Employment Occupations by Sex in Lima
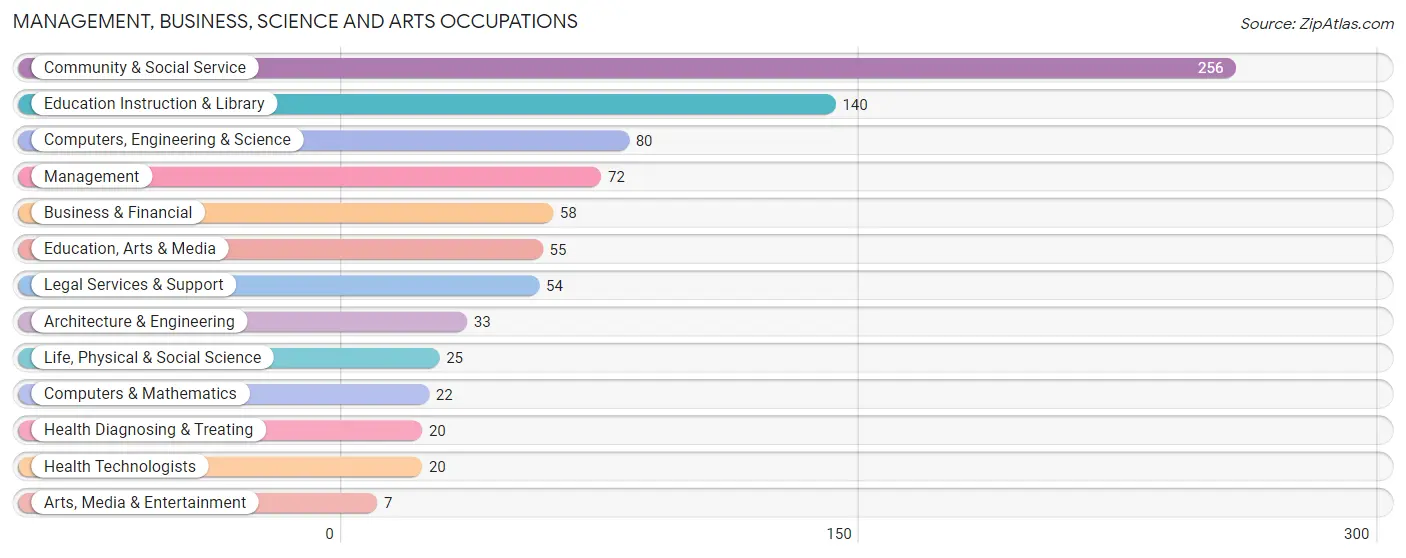
Management, Business, Science and Arts Occupations
The most common Management, Business, Science and Arts occupations in Lima are Community & Social Service (256 | 22.4%), Education Instruction & Library (140 | 12.3%), Computers, Engineering & Science (80 | 7.0%), Management (72 | 6.3%), and Business & Financial (58 | 5.1%).
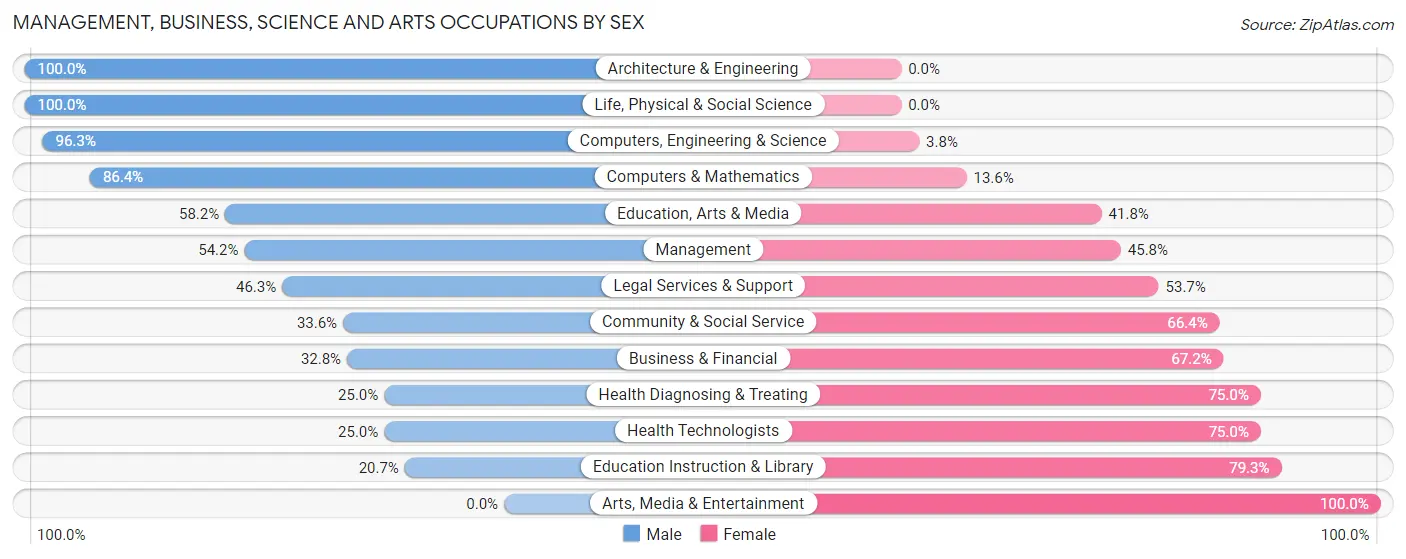
Management, Business, Science and Arts Occupations by Sex
Within the Management, Business, Science and Arts occupations in Lima, the most male-oriented occupations are Architecture & Engineering (100.0%), Life, Physical & Social Science (100.0%), and Computers, Engineering & Science (96.3%), while the most female-oriented occupations are Arts, Media & Entertainment (100.0%), Education Instruction & Library (79.3%), and Health Diagnosing & Treating (75.0%).
| Occupation | Male | Female |
| Management | 39 (54.2%) | 33 (45.8%) |
| Business & Financial | 19 (32.8%) | 39 (67.2%) |
| Computers, Engineering & Science | 77 (96.3%) | 3 (3.7%) |
| Computers & Mathematics | 19 (86.4%) | 3 (13.6%) |
| Architecture & Engineering | 33 (100.0%) | 0 (0.0%) |
| Life, Physical & Social Science | 25 (100.0%) | 0 (0.0%) |
| Community & Social Service | 86 (33.6%) | 170 (66.4%) |
| Education, Arts & Media | 32 (58.2%) | 23 (41.8%) |
| Legal Services & Support | 25 (46.3%) | 29 (53.7%) |
| Education Instruction & Library | 29 (20.7%) | 111 (79.3%) |
| Arts, Media & Entertainment | 0 (0.0%) | 7 (100.0%) |
| Health Diagnosing & Treating | 5 (25.0%) | 15 (75.0%) |
| Health Technologists | 5 (25.0%) | 15 (75.0%) |
| Total (Category) | 226 (46.5%) | 260 (53.5%) |
| Total (Overall) | 635 (55.6%) | 507 (44.4%) |
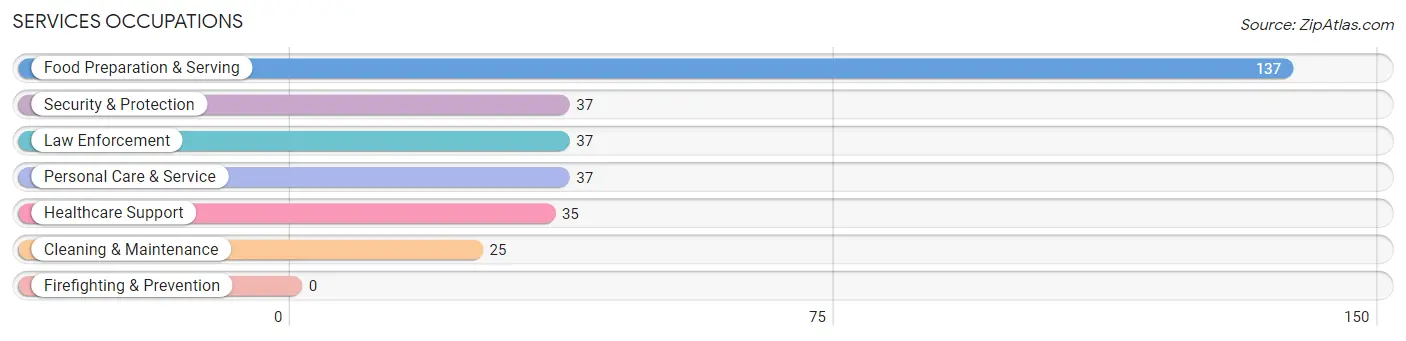
Services Occupations
The most common Services occupations in Lima are Food Preparation & Serving (137 | 12.0%), Security & Protection (37 | 3.2%), Law Enforcement (37 | 3.2%), Personal Care & Service (37 | 3.2%), and Healthcare Support (35 | 3.1%).
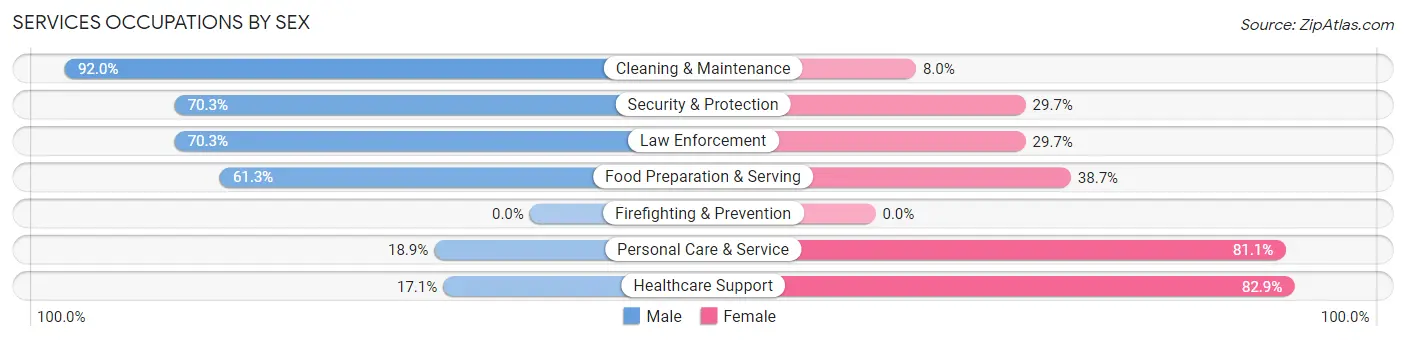
Services Occupations by Sex
Within the Services occupations in Lima, the most male-oriented occupations are Cleaning & Maintenance (92.0%), Security & Protection (70.3%), and Law Enforcement (70.3%), while the most female-oriented occupations are Healthcare Support (82.9%), Personal Care & Service (81.1%), and Food Preparation & Serving (38.7%).
| Occupation | Male | Female |
| Healthcare Support | 6 (17.1%) | 29 (82.9%) |
| Security & Protection | 26 (70.3%) | 11 (29.7%) |
| Firefighting & Prevention | 0 (0.0%) | 0 (0.0%) |
| Law Enforcement | 26 (70.3%) | 11 (29.7%) |
| Food Preparation & Serving | 84 (61.3%) | 53 (38.7%) |
| Cleaning & Maintenance | 23 (92.0%) | 2 (8.0%) |
| Personal Care & Service | 7 (18.9%) | 30 (81.1%) |
| Total (Category) | 146 (53.9%) | 125 (46.1%) |
| Total (Overall) | 635 (55.6%) | 507 (44.4%) |
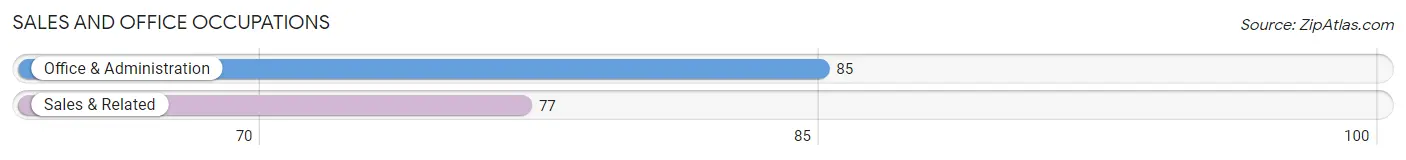
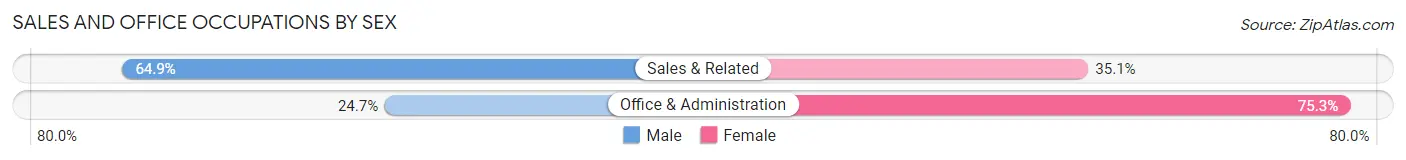
Sales and Office Occupations
The most common Sales and Office occupations in Lima are Office & Administration (85 | 7.4%), and Sales & Related (77 | 6.7%).
Sales and Office Occupations by Sex
| Occupation | Male | Female |
| Sales & Related | 50 (64.9%) | 27 (35.1%) |
| Office & Administration | 21 (24.7%) | 64 (75.3%) |
| Total (Category) | 71 (43.8%) | 91 (56.2%) |
| Total (Overall) | 635 (55.6%) | 507 (44.4%) |
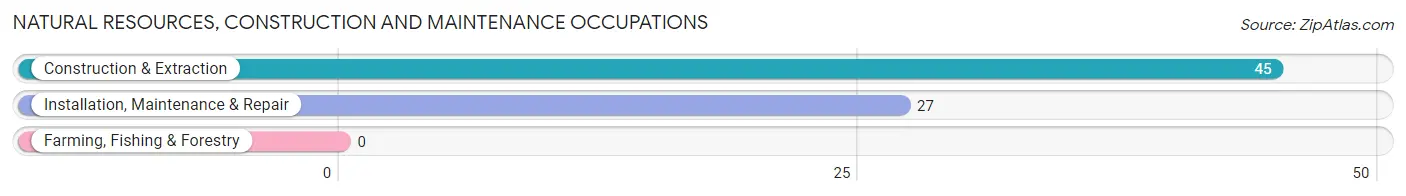
Natural Resources, Construction and Maintenance Occupations
The most common Natural Resources, Construction and Maintenance occupations in Lima are Construction & Extraction (45 | 3.9%), and Installation, Maintenance & Repair (27 | 2.4%).
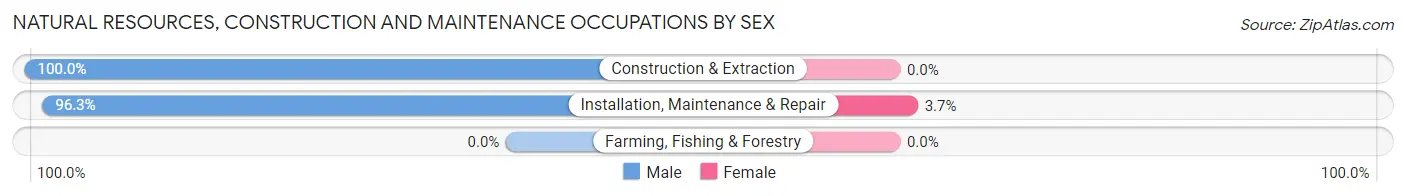
Natural Resources, Construction and Maintenance Occupations by Sex
| Occupation | Male | Female |
| Farming, Fishing & Forestry | 0 (0.0%) | 0 (0.0%) |
| Construction & Extraction | 45 (100.0%) | 0 (0.0%) |
| Installation, Maintenance & Repair | 26 (96.3%) | 1 (3.7%) |
| Total (Category) | 71 (98.6%) | 1 (1.4%) |
| Total (Overall) | 635 (55.6%) | 507 (44.4%) |
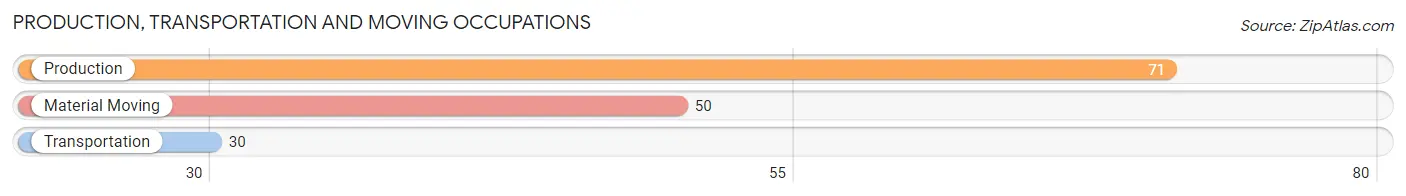
Production, Transportation and Moving Occupations
The most common Production, Transportation and Moving occupations in Lima are Production (71 | 6.2%), Material Moving (50 | 4.4%), and Transportation (30 | 2.6%).
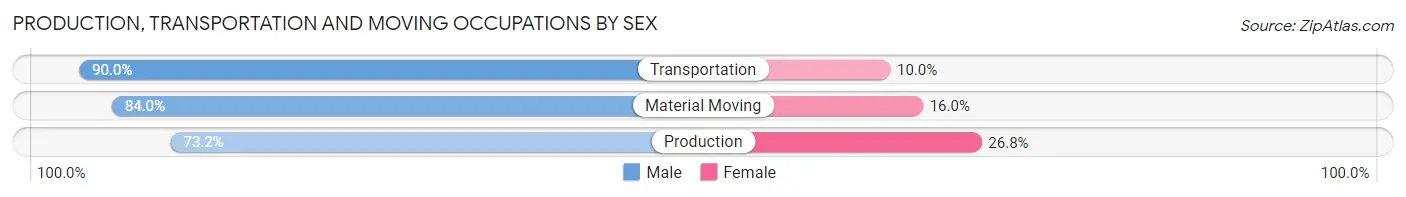
Production, Transportation and Moving Occupations by Sex
| Occupation | Male | Female |
| Production | 52 (73.2%) | 19 (26.8%) |
| Transportation | 27 (90.0%) | 3 (10.0%) |
| Material Moving | 42 (84.0%) | 8 (16.0%) |
| Total (Category) | 121 (80.1%) | 30 (19.9%) |
| Total (Overall) | 635 (55.6%) | 507 (44.4%) |
Employment Industries by Sex in Lima
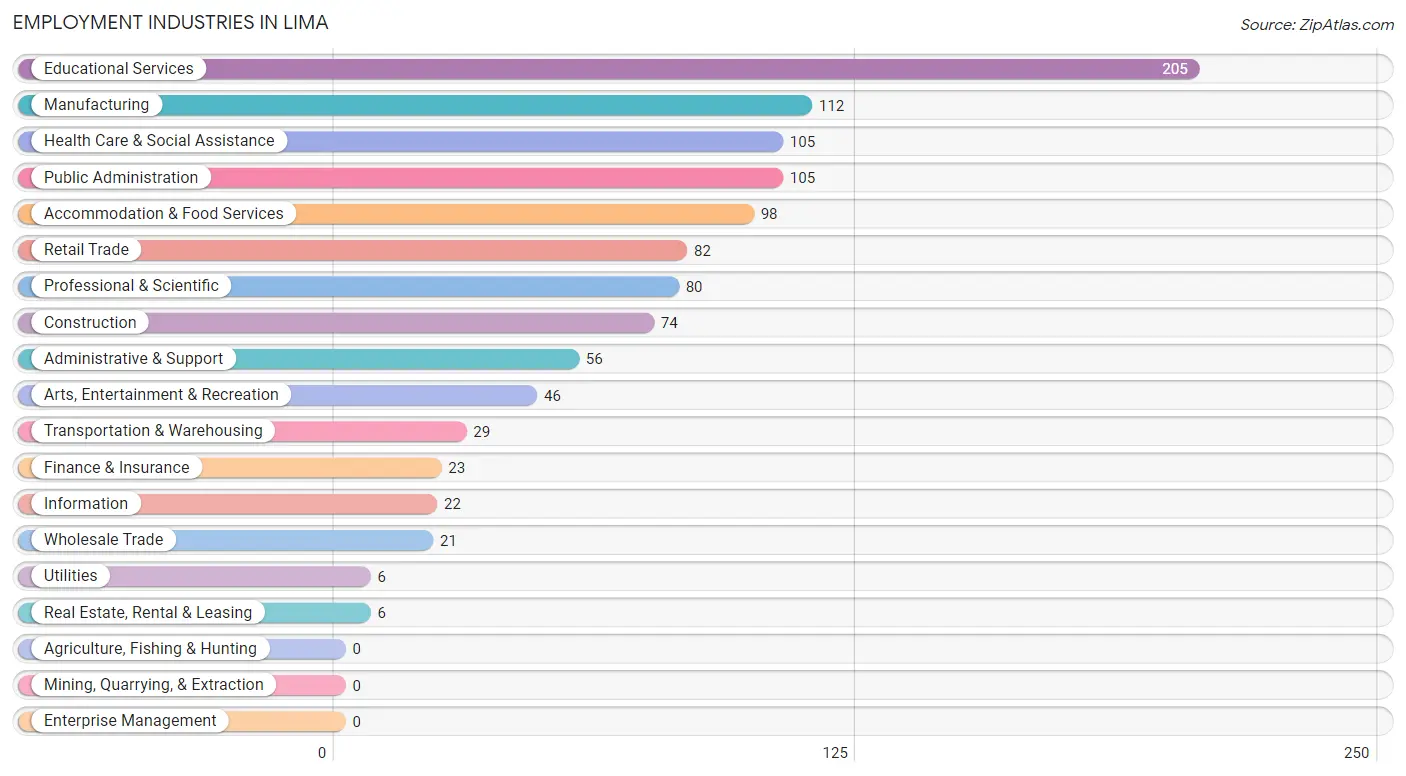
Employment Industries in Lima
The major employment industries in Lima include Educational Services (205 | 17.9%), Manufacturing (112 | 9.8%), Health Care & Social Assistance (105 | 9.2%), Public Administration (105 | 9.2%), and Accommodation & Food Services (98 | 8.6%).
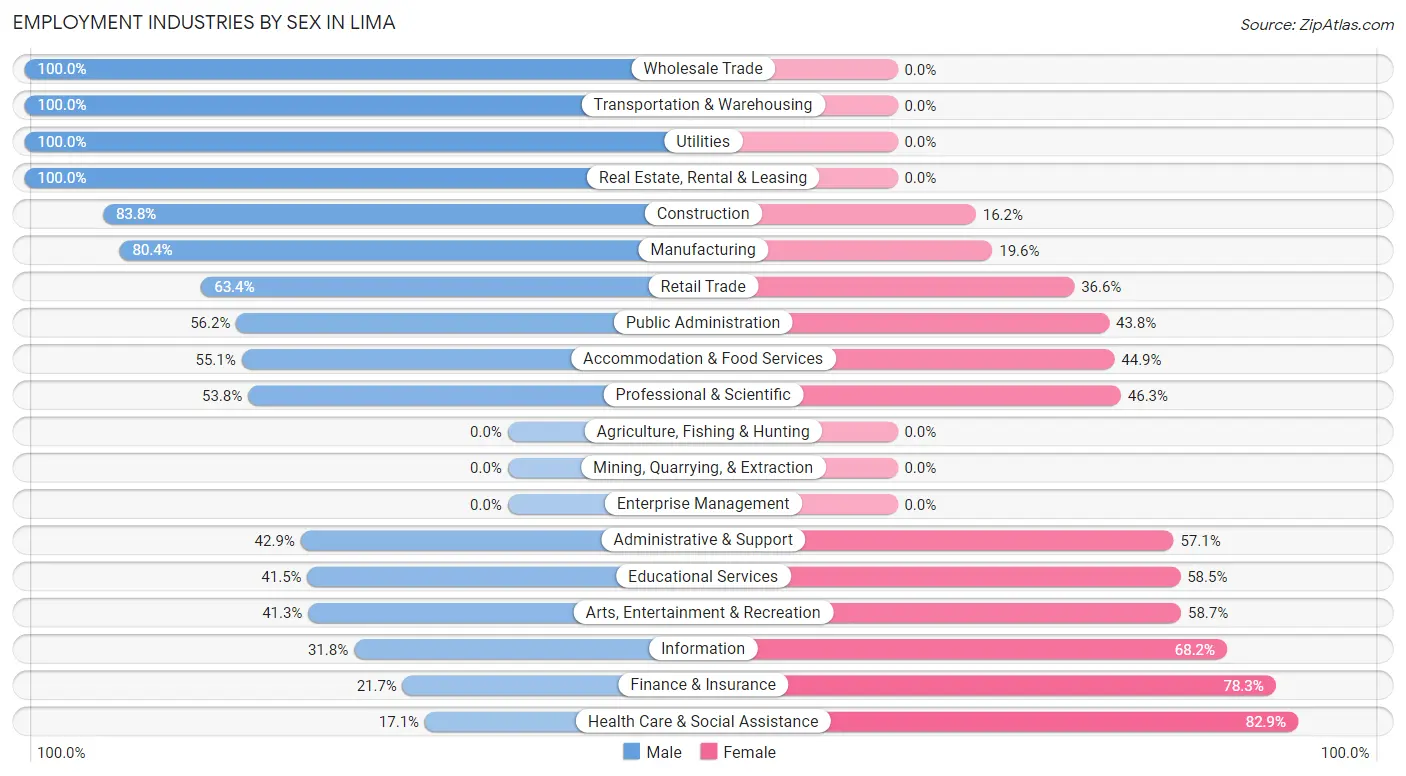
Employment Industries by Sex in Lima
The Lima industries that see more men than women are Wholesale Trade (100.0%), Transportation & Warehousing (100.0%), and Utilities (100.0%), whereas the industries that tend to have a higher number of women are Health Care & Social Assistance (82.9%), Finance & Insurance (78.3%), and Information (68.2%).
| Industry | Male | Female |
| Agriculture, Fishing & Hunting | 0 (0.0%) | 0 (0.0%) |
| Mining, Quarrying, & Extraction | 0 (0.0%) | 0 (0.0%) |
| Construction | 62 (83.8%) | 12 (16.2%) |
| Manufacturing | 90 (80.4%) | 22 (19.6%) |
| Wholesale Trade | 21 (100.0%) | 0 (0.0%) |
| Retail Trade | 52 (63.4%) | 30 (36.6%) |
| Transportation & Warehousing | 29 (100.0%) | 0 (0.0%) |
| Utilities | 6 (100.0%) | 0 (0.0%) |
| Information | 7 (31.8%) | 15 (68.2%) |
| Finance & Insurance | 5 (21.7%) | 18 (78.3%) |
| Real Estate, Rental & Leasing | 6 (100.0%) | 0 (0.0%) |
| Professional & Scientific | 43 (53.7%) | 37 (46.3%) |
| Enterprise Management | 0 (0.0%) | 0 (0.0%) |
| Administrative & Support | 24 (42.9%) | 32 (57.1%) |
| Educational Services | 85 (41.5%) | 120 (58.5%) |
| Health Care & Social Assistance | 18 (17.1%) | 87 (82.9%) |
| Arts, Entertainment & Recreation | 19 (41.3%) | 27 (58.7%) |
| Accommodation & Food Services | 54 (55.1%) | 44 (44.9%) |
| Public Administration | 59 (56.2%) | 46 (43.8%) |
| Total | 635 (55.6%) | 507 (44.4%) |
Education in Lima
School Enrollment in Lima
The most common levels of schooling among the 749 students in Lima are college / undergraduate (317 | 42.3%), high school (147 | 19.6%), and middle school (119 | 15.9%).
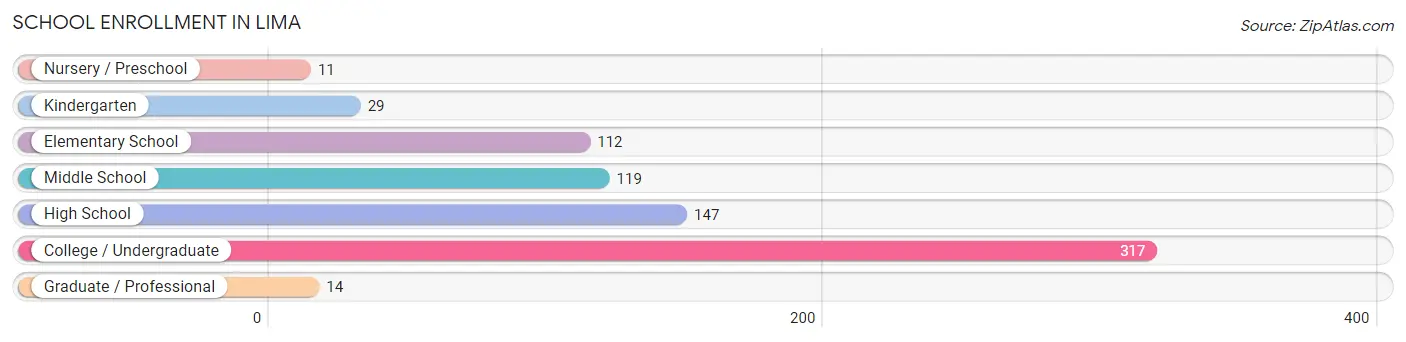
| School Level | # Students | % Students |
| Nursery / Preschool | 11 | 1.5% |
| Kindergarten | 29 | 3.9% |
| Elementary School | 112 | 14.9% |
| Middle School | 119 | 15.9% |
| High School | 147 | 19.6% |
| College / Undergraduate | 317 | 42.3% |
| Graduate / Professional | 14 | 1.9% |
| Total | 749 | 100.0% |
School Enrollment by Age by Funding Source in Lima
Out of a total of 749 students who are enrolled in schools in Lima, 191 (25.5%) attend a private institution, while the remaining 558 (74.5%) are enrolled in public schools. The age group of 25 to 34 year olds has the highest likelihood of being enrolled in private schools, with 8 (100.0% in the age bracket) enrolled. Conversely, the age group of 15 to 17 year olds has the lowest likelihood of being enrolled in a private school, with 117 (86.0% in the age bracket) attending a public institution.
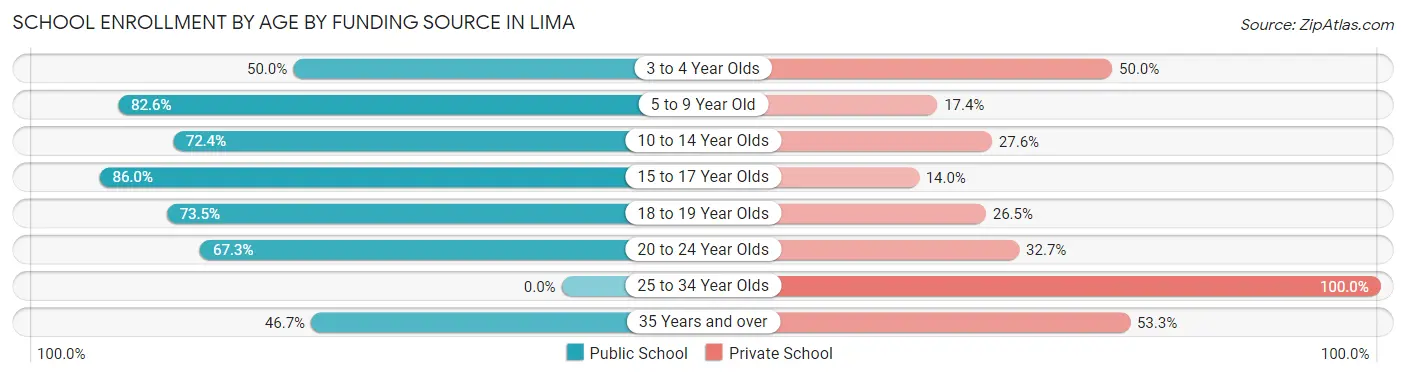
| Age Bracket | Public School | Private School |
| 3 to 4 Year Olds | 8 (50.0%) | 8 (50.0%) |
| 5 to 9 Year Old | 109 (82.6%) | 23 (17.4%) |
| 10 to 14 Year Olds | 97 (72.4%) | 37 (27.6%) |
| 15 to 17 Year Olds | 117 (86.0%) | 19 (14.0%) |
| 18 to 19 Year Olds | 150 (73.5%) | 54 (26.5%) |
| 20 to 24 Year Olds | 70 (67.3%) | 34 (32.7%) |
| 25 to 34 Year Olds | 0 (0.0%) | 8 (100.0%) |
| 35 Years and over | 7 (46.7%) | 8 (53.3%) |
| Total | 558 (74.5%) | 191 (25.5%) |
Educational Attainment by Field of Study in Lima
Business (109 | 20.0%), education (70 | 12.8%), liberal arts & history (56 | 10.3%), engineering (47 | 8.6%), and bio, nature & agricultural (46 | 8.4%) are the most common fields of study among 546 individuals in Lima who have obtained a bachelor's degree or higher.
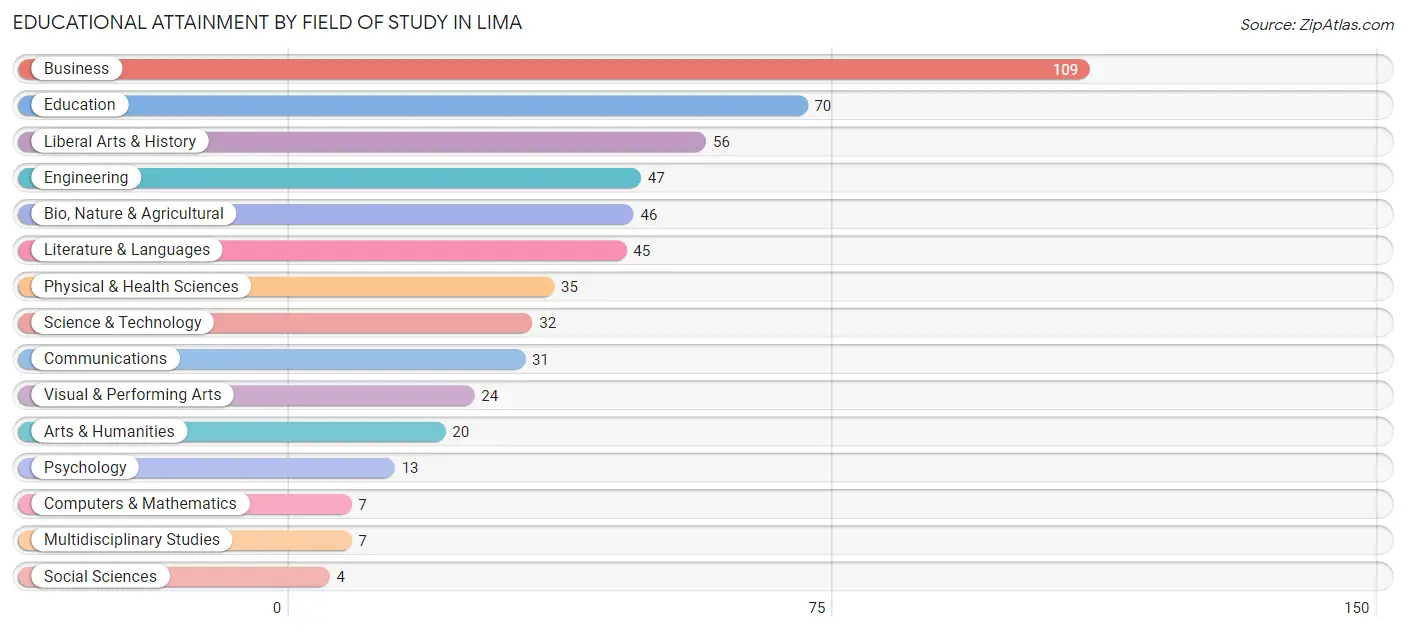
| Field of Study | # Graduates | % Graduates |
| Computers & Mathematics | 7 | 1.3% |
| Bio, Nature & Agricultural | 46 | 8.4% |
| Physical & Health Sciences | 35 | 6.4% |
| Psychology | 13 | 2.4% |
| Social Sciences | 4 | 0.7% |
| Engineering | 47 | 8.6% |
| Multidisciplinary Studies | 7 | 1.3% |
| Science & Technology | 32 | 5.9% |
| Business | 109 | 20.0% |
| Education | 70 | 12.8% |
| Literature & Languages | 45 | 8.2% |
| Liberal Arts & History | 56 | 10.3% |
| Visual & Performing Arts | 24 | 4.4% |
| Communications | 31 | 5.7% |
| Arts & Humanities | 20 | 3.7% |
| Total | 546 | 100.0% |
Transportation & Commute in Lima
Vehicle Availability by Sex in Lima
The most prevalent vehicle ownership categories in Lima are males with 2 vehicles (281, accounting for 46.7%) and females with 2 vehicles (207, making up 65.3%).
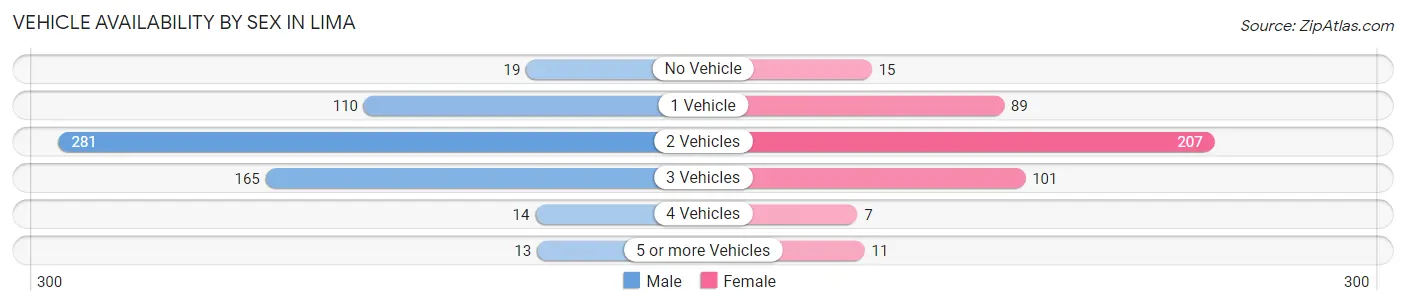
| Vehicles Available | Male | Female |
| No Vehicle | 19 (3.2%) | 15 (3.5%) |
| 1 Vehicle | 110 (18.3%) | 89 (20.7%) |
| 2 Vehicles | 281 (46.7%) | 207 (48.1%) |
| 3 Vehicles | 165 (27.4%) | 101 (23.5%) |
| 4 Vehicles | 14 (2.3%) | 7 (1.6%) |
| 5 or more Vehicles | 13 (2.2%) | 11 (2.6%) |
| Total | 602 (100.0%) | 430 (100.0%) |
Commute Time in Lima
The most frequently occuring commute durations in Lima are 30 to 34 minutes (182 commuters, 17.3%), 10 to 14 minutes (172 commuters, 16.4%), and 5 to 9 minutes (153 commuters, 14.6%).
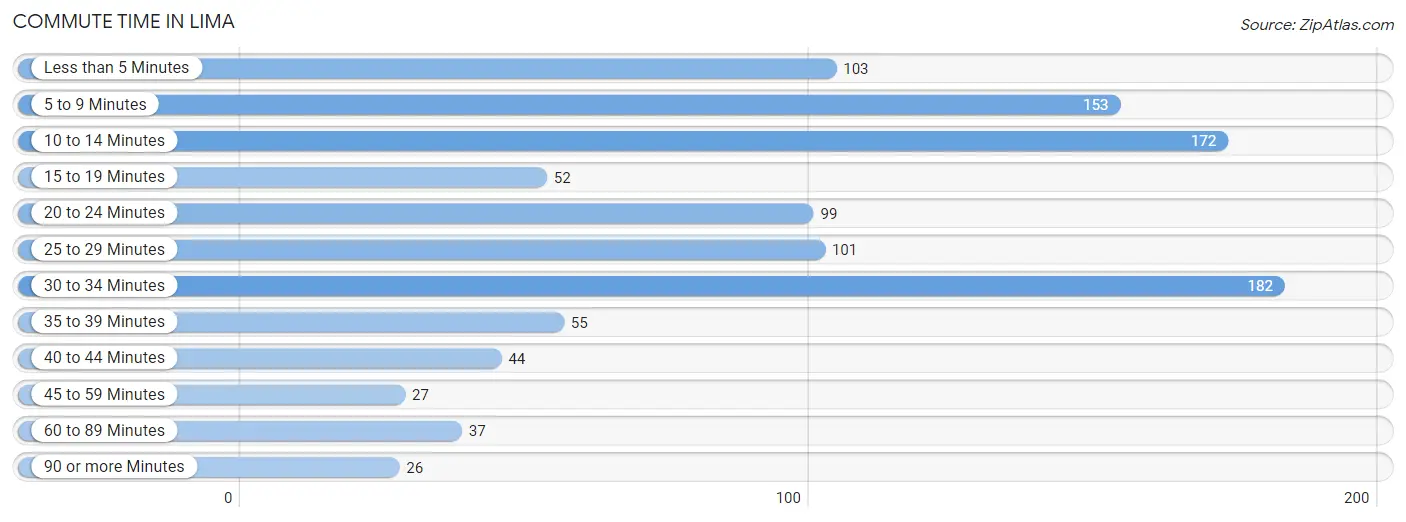
| Commute Time | # Commuters | % Commuters |
| Less than 5 Minutes | 103 | 9.8% |
| 5 to 9 Minutes | 153 | 14.6% |
| 10 to 14 Minutes | 172 | 16.4% |
| 15 to 19 Minutes | 52 | 5.0% |
| 20 to 24 Minutes | 99 | 9.4% |
| 25 to 29 Minutes | 101 | 9.6% |
| 30 to 34 Minutes | 182 | 17.3% |
| 35 to 39 Minutes | 55 | 5.2% |
| 40 to 44 Minutes | 44 | 4.2% |
| 45 to 59 Minutes | 27 | 2.6% |
| 60 to 89 Minutes | 37 | 3.5% |
| 90 or more Minutes | 26 | 2.5% |
Commute Time by Sex in Lima
The most common commute times in Lima are 10 to 14 minutes (97 commuters, 16.1%) for males and 30 to 34 minutes (114 commuters, 25.4%) for females.
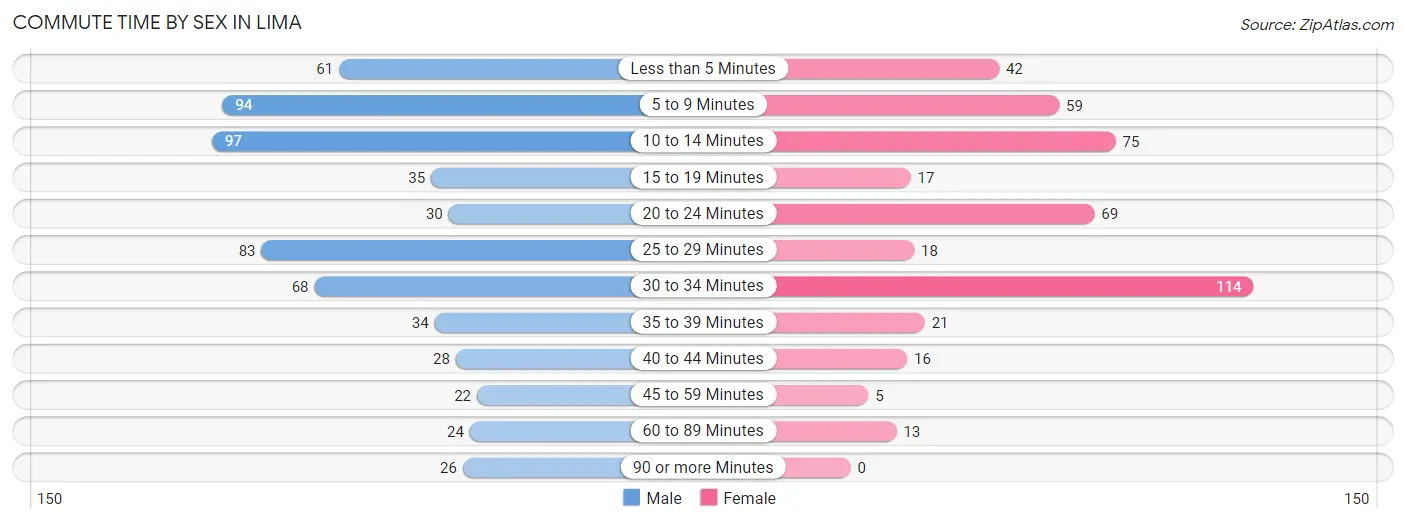
| Commute Time | Male | Female |
| Less than 5 Minutes | 61 (10.1%) | 42 (9.3%) |
| 5 to 9 Minutes | 94 (15.6%) | 59 (13.1%) |
| 10 to 14 Minutes | 97 (16.1%) | 75 (16.7%) |
| 15 to 19 Minutes | 35 (5.8%) | 17 (3.8%) |
| 20 to 24 Minutes | 30 (5.0%) | 69 (15.4%) |
| 25 to 29 Minutes | 83 (13.8%) | 18 (4.0%) |
| 30 to 34 Minutes | 68 (11.3%) | 114 (25.4%) |
| 35 to 39 Minutes | 34 (5.7%) | 21 (4.7%) |
| 40 to 44 Minutes | 28 (4.6%) | 16 (3.6%) |
| 45 to 59 Minutes | 22 (3.6%) | 5 (1.1%) |
| 60 to 89 Minutes | 24 (4.0%) | 13 (2.9%) |
| 90 or more Minutes | 26 (4.3%) | 0 (0.0%) |
Time of Departure to Work by Sex in Lima
The most frequent times of departure to work in Lima are 7:30 AM to 7:59 AM (88, 14.6%) for males and 12:00 PM to 3:59 PM (86, 19.2%) for females.
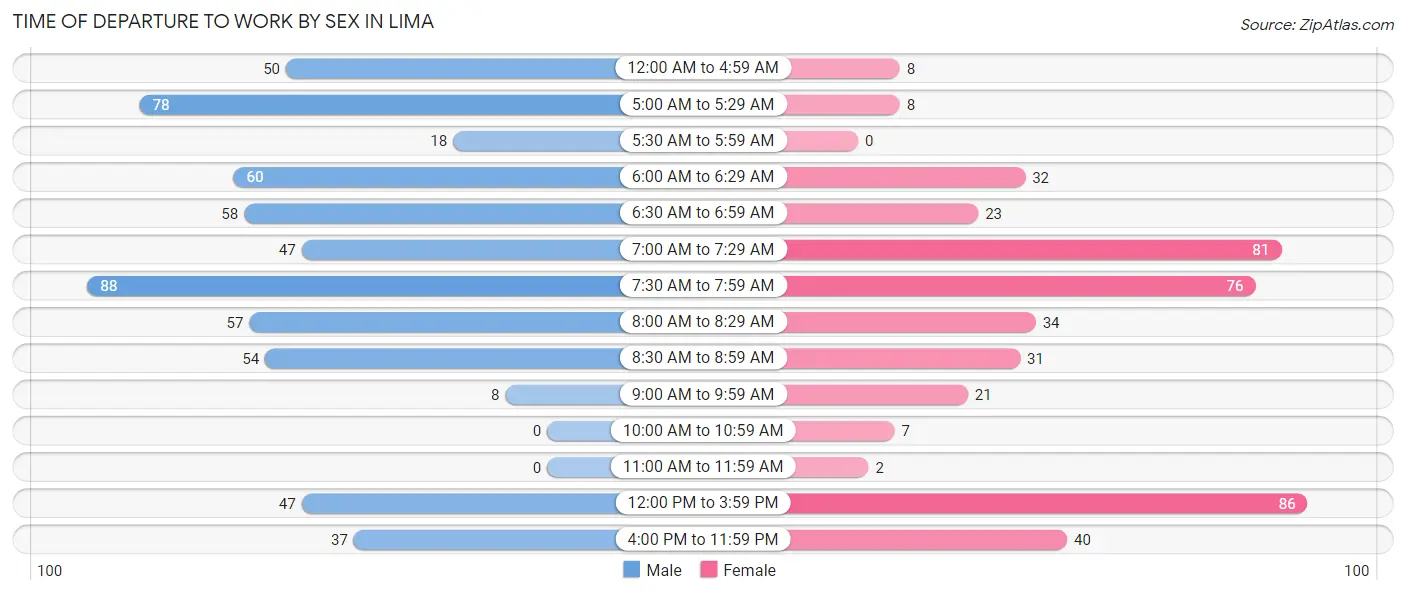
| Time of Departure | Male | Female |
| 12:00 AM to 4:59 AM | 50 (8.3%) | 8 (1.8%) |
| 5:00 AM to 5:29 AM | 78 (13.0%) | 8 (1.8%) |
| 5:30 AM to 5:59 AM | 18 (3.0%) | 0 (0.0%) |
| 6:00 AM to 6:29 AM | 60 (10.0%) | 32 (7.1%) |
| 6:30 AM to 6:59 AM | 58 (9.6%) | 23 (5.1%) |
| 7:00 AM to 7:29 AM | 47 (7.8%) | 81 (18.0%) |
| 7:30 AM to 7:59 AM | 88 (14.6%) | 76 (16.9%) |
| 8:00 AM to 8:29 AM | 57 (9.5%) | 34 (7.6%) |
| 8:30 AM to 8:59 AM | 54 (9.0%) | 31 (6.9%) |
| 9:00 AM to 9:59 AM | 8 (1.3%) | 21 (4.7%) |
| 10:00 AM to 10:59 AM | 0 (0.0%) | 7 (1.6%) |
| 11:00 AM to 11:59 AM | 0 (0.0%) | 2 (0.4%) |
| 12:00 PM to 3:59 PM | 47 (7.8%) | 86 (19.2%) |
| 4:00 PM to 11:59 PM | 37 (6.1%) | 40 (8.9%) |
| Total | 602 (100.0%) | 449 (100.0%) |
Housing Occupancy in Lima
Occupancy by Ownership in Lima
Of the total 798 dwellings in Lima, owner-occupied units account for 601 (75.3%), while renter-occupied units make up 197 (24.7%).
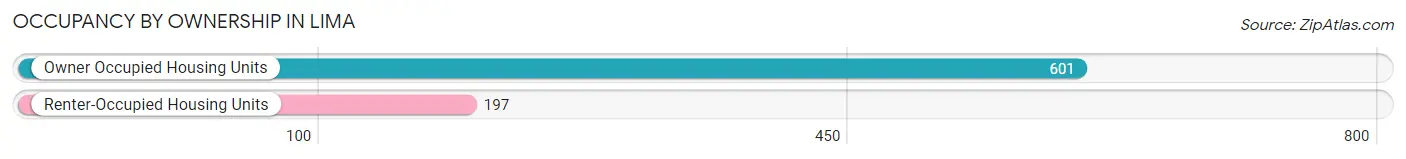
| Occupancy | # Housing Units | % Housing Units |
| Owner Occupied Housing Units | 601 | 75.3% |
| Renter-Occupied Housing Units | 197 | 24.7% |
| Total Occupied Housing Units | 798 | 100.0% |
Occupancy by Household Size in Lima
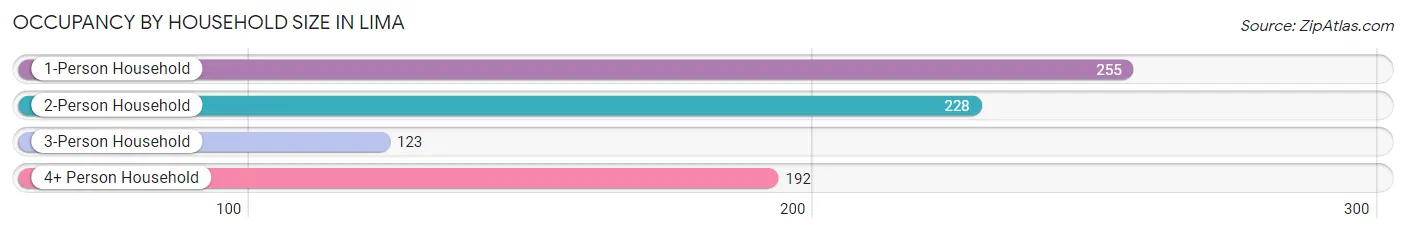
| Household Size | # Housing Units | % Housing Units |
| 1-Person Household | 255 | 32.0% |
| 2-Person Household | 228 | 28.6% |
| 3-Person Household | 123 | 15.4% |
| 4+ Person Household | 192 | 24.1% |
| Total Housing Units | 798 | 100.0% |
Occupancy by Ownership by Household Size in Lima
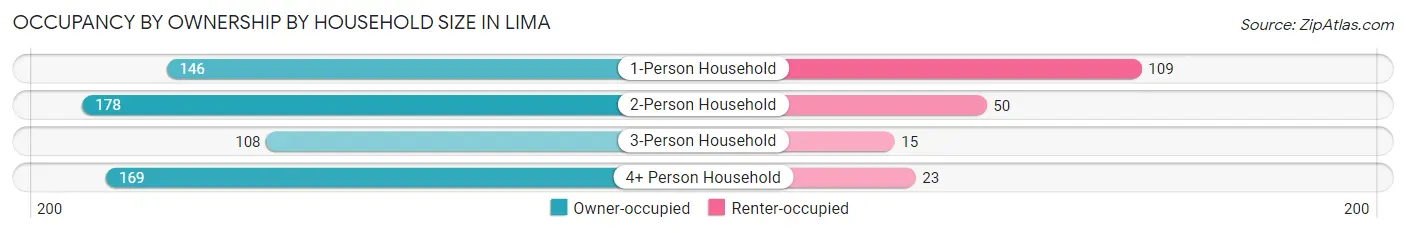
| Household Size | Owner-occupied | Renter-occupied |
| 1-Person Household | 146 (57.3%) | 109 (42.7%) |
| 2-Person Household | 178 (78.1%) | 50 (21.9%) |
| 3-Person Household | 108 (87.8%) | 15 (12.2%) |
| 4+ Person Household | 169 (88.0%) | 23 (12.0%) |
| Total Housing Units | 601 (75.3%) | 197 (24.7%) |
Occupancy by Educational Attainment in Lima
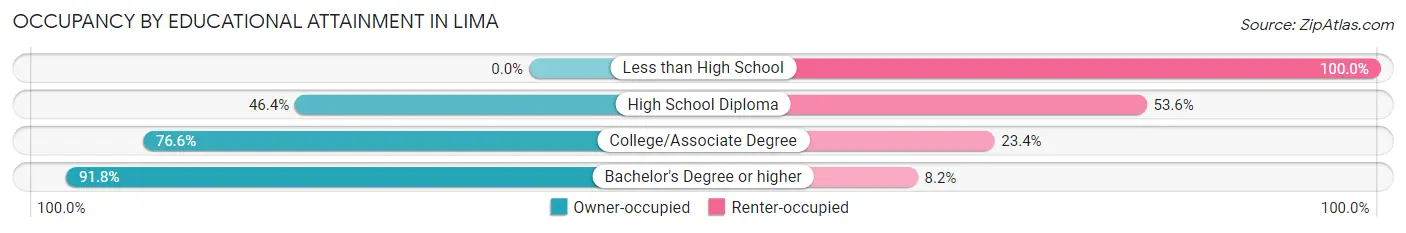
| Household Size | Owner-occupied | Renter-occupied |
| Less than High School | 0 (0.0%) | 8 (100.0%) |
| High School Diploma | 77 (46.4%) | 89 (53.6%) |
| College/Associate Degree | 245 (76.6%) | 75 (23.4%) |
| Bachelor's Degree or higher | 279 (91.8%) | 25 (8.2%) |
Occupancy by Age of Householder in Lima
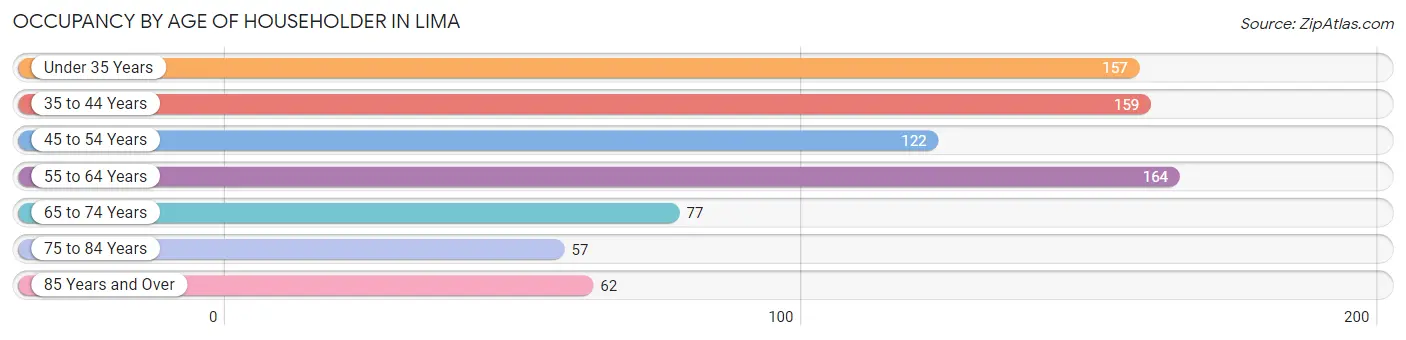
| Age Bracket | # Households | % Households |
| Under 35 Years | 157 | 19.7% |
| 35 to 44 Years | 159 | 19.9% |
| 45 to 54 Years | 122 | 15.3% |
| 55 to 64 Years | 164 | 20.5% |
| 65 to 74 Years | 77 | 9.7% |
| 75 to 84 Years | 57 | 7.1% |
| 85 Years and Over | 62 | 7.8% |
| Total | 798 | 100.0% |
Housing Finances in Lima
Median Income by Occupancy in Lima
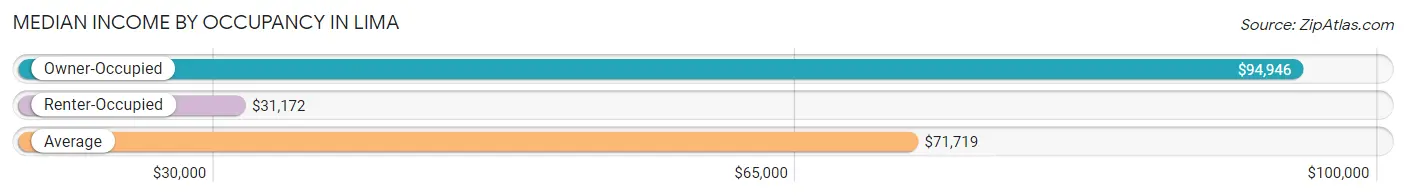
| Occupancy Type | # Households | Median Income |
| Owner-Occupied | 601 (75.3%) | $94,946 |
| Renter-Occupied | 197 (24.7%) | $31,172 |
| Average | 798 (100.0%) | $71,719 |
Occupancy by Householder Income Bracket in Lima
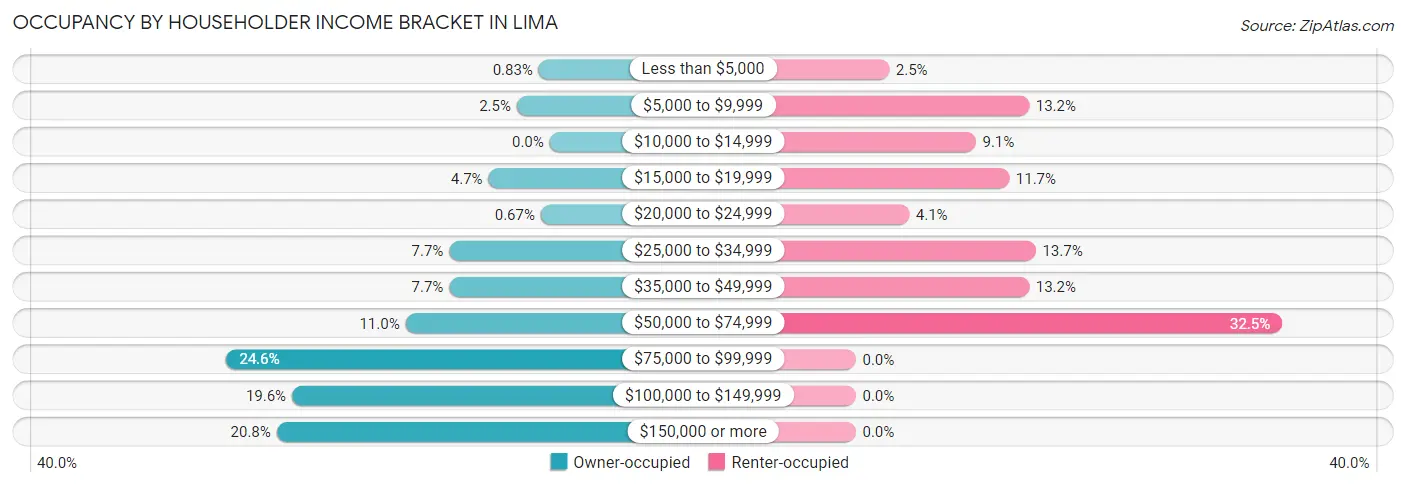
| Income Bracket | Owner-occupied | Renter-occupied |
| Less than $5,000 | 5 (0.8%) | 5 (2.5%) |
| $5,000 to $9,999 | 15 (2.5%) | 26 (13.2%) |
| $10,000 to $14,999 | 0 (0.0%) | 18 (9.1%) |
| $15,000 to $19,999 | 28 (4.7%) | 23 (11.7%) |
| $20,000 to $24,999 | 4 (0.7%) | 8 (4.1%) |
| $25,000 to $34,999 | 46 (7.6%) | 27 (13.7%) |
| $35,000 to $49,999 | 46 (7.6%) | 26 (13.2%) |
| $50,000 to $74,999 | 66 (11.0%) | 64 (32.5%) |
| $75,000 to $99,999 | 148 (24.6%) | 0 (0.0%) |
| $100,000 to $149,999 | 118 (19.6%) | 0 (0.0%) |
| $150,000 or more | 125 (20.8%) | 0 (0.0%) |
| Total | 601 (100.0%) | 197 (100.0%) |
Monthly Housing Cost Tiers in Lima
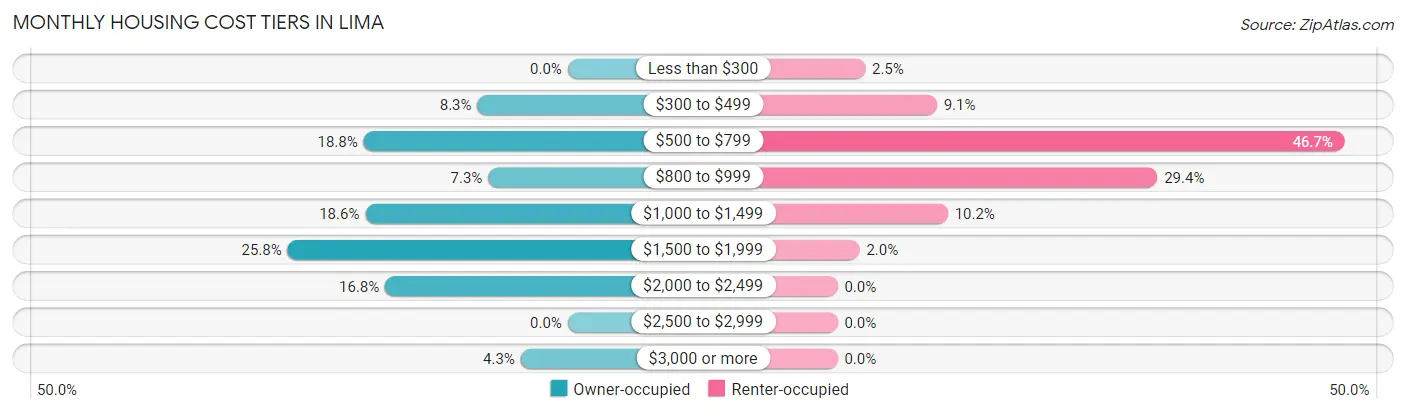
| Monthly Cost | Owner-occupied | Renter-occupied |
| Less than $300 | 0 (0.0%) | 5 (2.5%) |
| $300 to $499 | 50 (8.3%) | 18 (9.1%) |
| $500 to $799 | 113 (18.8%) | 92 (46.7%) |
| $800 to $999 | 44 (7.3%) | 58 (29.4%) |
| $1,000 to $1,499 | 112 (18.6%) | 20 (10.2%) |
| $1,500 to $1,999 | 155 (25.8%) | 4 (2.0%) |
| $2,000 to $2,499 | 101 (16.8%) | 0 (0.0%) |
| $2,500 to $2,999 | 0 (0.0%) | 0 (0.0%) |
| $3,000 or more | 26 (4.3%) | 0 (0.0%) |
| Total | 601 (100.0%) | 197 (100.0%) |
Physical Housing Characteristics in Lima
Housing Structures in Lima
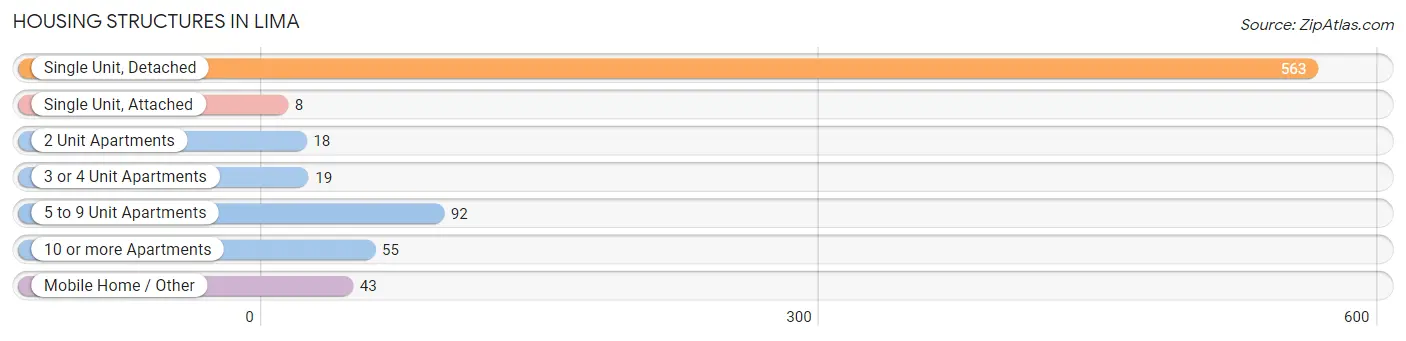
| Structure Type | # Housing Units | % Housing Units |
| Single Unit, Detached | 563 | 70.6% |
| Single Unit, Attached | 8 | 1.0% |
| 2 Unit Apartments | 18 | 2.3% |
| 3 or 4 Unit Apartments | 19 | 2.4% |
| 5 to 9 Unit Apartments | 92 | 11.5% |
| 10 or more Apartments | 55 | 6.9% |
| Mobile Home / Other | 43 | 5.4% |
| Total | 798 | 100.0% |
Housing Structures by Occupancy in Lima
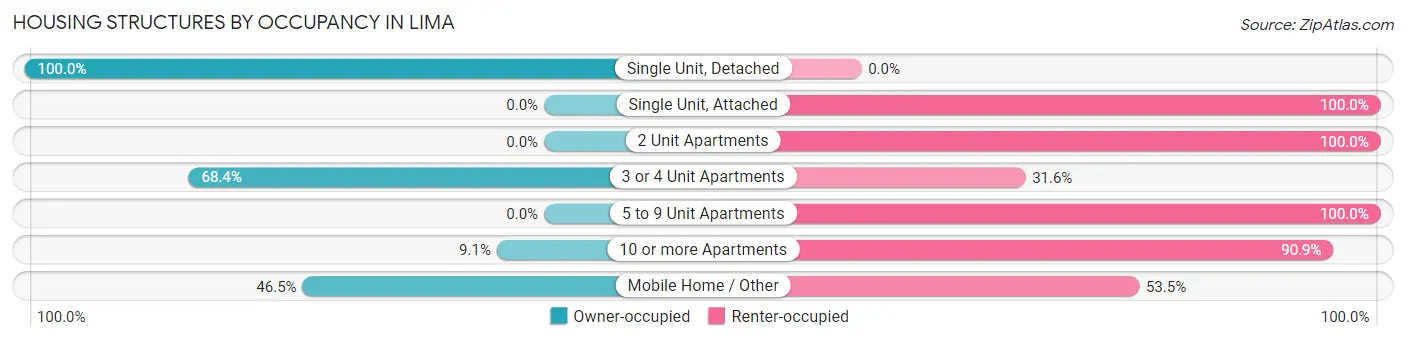
| Structure Type | Owner-occupied | Renter-occupied |
| Single Unit, Detached | 563 (100.0%) | 0 (0.0%) |
| Single Unit, Attached | 0 (0.0%) | 8 (100.0%) |
| 2 Unit Apartments | 0 (0.0%) | 18 (100.0%) |
| 3 or 4 Unit Apartments | 13 (68.4%) | 6 (31.6%) |
| 5 to 9 Unit Apartments | 0 (0.0%) | 92 (100.0%) |
| 10 or more Apartments | 5 (9.1%) | 50 (90.9%) |
| Mobile Home / Other | 20 (46.5%) | 23 (53.5%) |
| Total | 601 (75.3%) | 197 (24.7%) |
Housing Structures by Number of Rooms in Lima
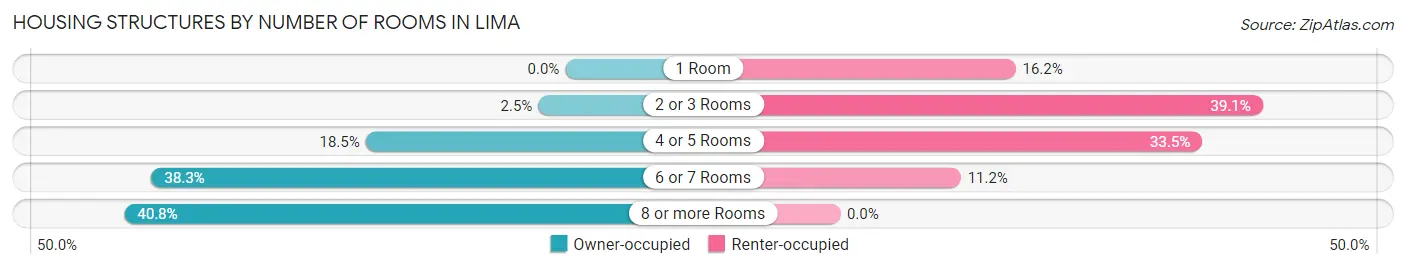
| Number of Rooms | Owner-occupied | Renter-occupied |
| 1 Room | 0 (0.0%) | 32 (16.2%) |
| 2 or 3 Rooms | 15 (2.5%) | 77 (39.1%) |
| 4 or 5 Rooms | 111 (18.5%) | 66 (33.5%) |
| 6 or 7 Rooms | 230 (38.3%) | 22 (11.2%) |
| 8 or more Rooms | 245 (40.8%) | 0 (0.0%) |
| Total | 601 (100.0%) | 197 (100.0%) |
Housing Structure by Heating Type in Lima
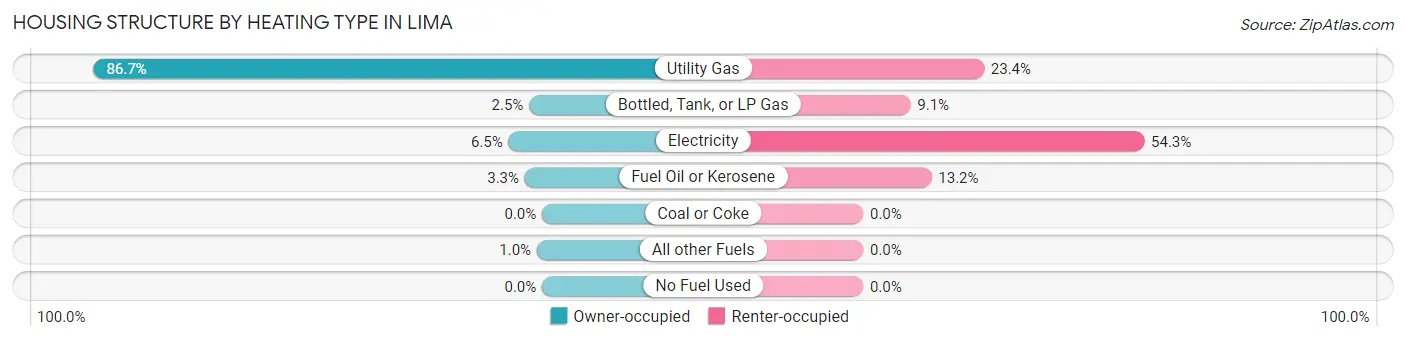
| Heating Type | Owner-occupied | Renter-occupied |
| Utility Gas | 521 (86.7%) | 46 (23.4%) |
| Bottled, Tank, or LP Gas | 15 (2.5%) | 18 (9.1%) |
| Electricity | 39 (6.5%) | 107 (54.3%) |
| Fuel Oil or Kerosene | 20 (3.3%) | 26 (13.2%) |
| Coal or Coke | 0 (0.0%) | 0 (0.0%) |
| All other Fuels | 6 (1.0%) | 0 (0.0%) |
| No Fuel Used | 0 (0.0%) | 0 (0.0%) |
| Total | 601 (100.0%) | 197 (100.0%) |
Household Vehicle Usage in Lima
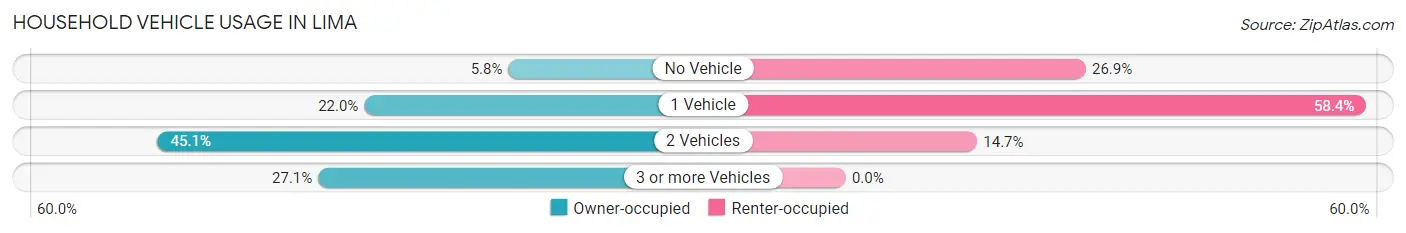
| Vehicles per Household | Owner-occupied | Renter-occupied |
| No Vehicle | 35 (5.8%) | 53 (26.9%) |
| 1 Vehicle | 132 (22.0%) | 115 (58.4%) |
| 2 Vehicles | 271 (45.1%) | 29 (14.7%) |
| 3 or more Vehicles | 163 (27.1%) | 0 (0.0%) |
| Total | 601 (100.0%) | 197 (100.0%) |
Real Estate & Mortgages in Lima
Real Estate and Mortgage Overview in Lima
| Characteristic | Without Mortgage | With Mortgage |
| Housing Units | 204 | 397 |
| Median Property Value | $156,400 | $188,900 |
| Median Household Income | $41,731 | $100 |
| Monthly Housing Costs | $665 | $26 |
| Real Estate Taxes | $3,908 | $16 |
Property Value by Mortgage Status in Lima
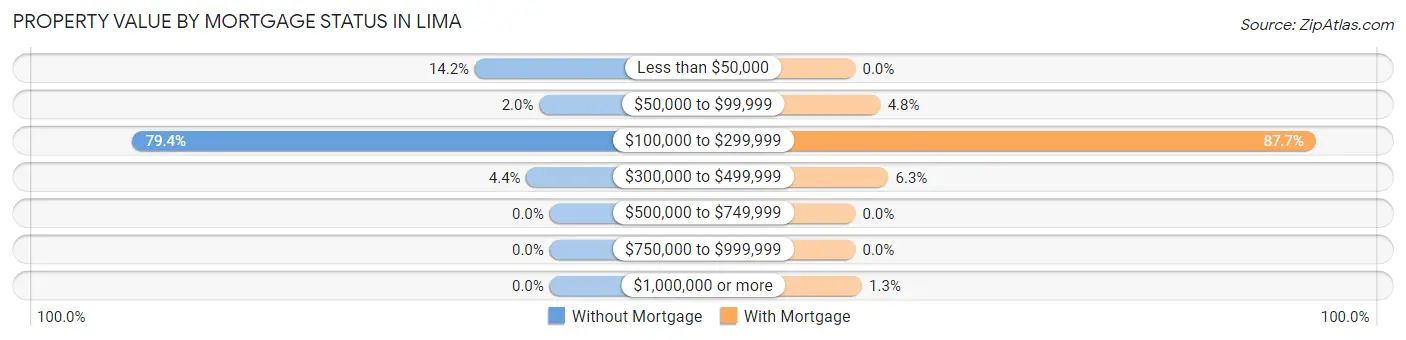
| Property Value | Without Mortgage | With Mortgage |
| Less than $50,000 | 29 (14.2%) | 0 (0.0%) |
| $50,000 to $99,999 | 4 (2.0%) | 19 (4.8%) |
| $100,000 to $299,999 | 162 (79.4%) | 348 (87.7%) |
| $300,000 to $499,999 | 9 (4.4%) | 25 (6.3%) |
| $500,000 to $749,999 | 0 (0.0%) | 0 (0.0%) |
| $750,000 to $999,999 | 0 (0.0%) | 0 (0.0%) |
| $1,000,000 or more | 0 (0.0%) | 5 (1.3%) |
| Total | 204 (100.0%) | 397 (100.0%) |
Household Income by Mortgage Status in Lima
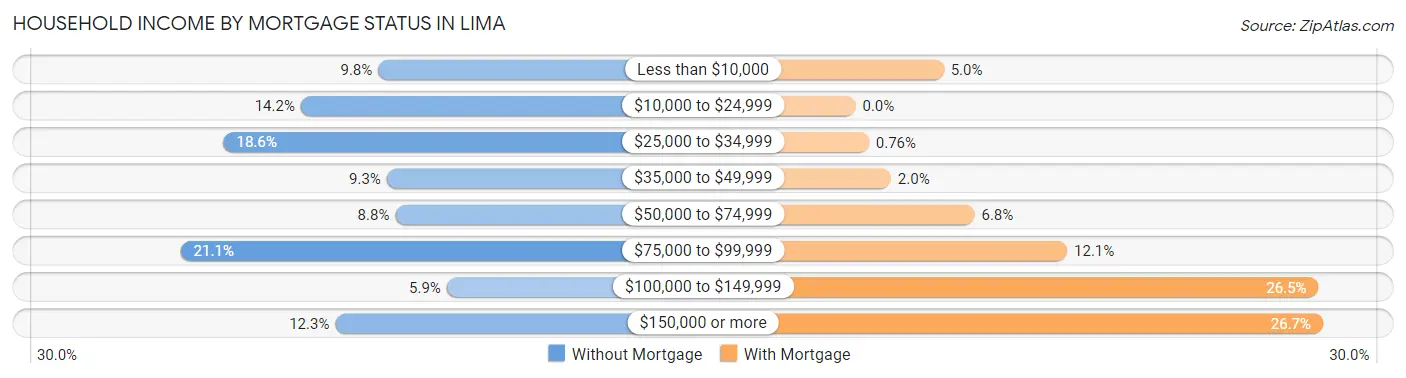
| Household Income | Without Mortgage | With Mortgage |
| Less than $10,000 | 20 (9.8%) | 20 (5.0%) |
| $10,000 to $24,999 | 29 (14.2%) | 0 (0.0%) |
| $25,000 to $34,999 | 38 (18.6%) | 3 (0.8%) |
| $35,000 to $49,999 | 19 (9.3%) | 8 (2.0%) |
| $50,000 to $74,999 | 18 (8.8%) | 27 (6.8%) |
| $75,000 to $99,999 | 43 (21.1%) | 48 (12.1%) |
| $100,000 to $149,999 | 12 (5.9%) | 105 (26.5%) |
| $150,000 or more | 25 (12.2%) | 106 (26.7%) |
| Total | 204 (100.0%) | 397 (100.0%) |
Property Value to Household Income Ratio in Lima
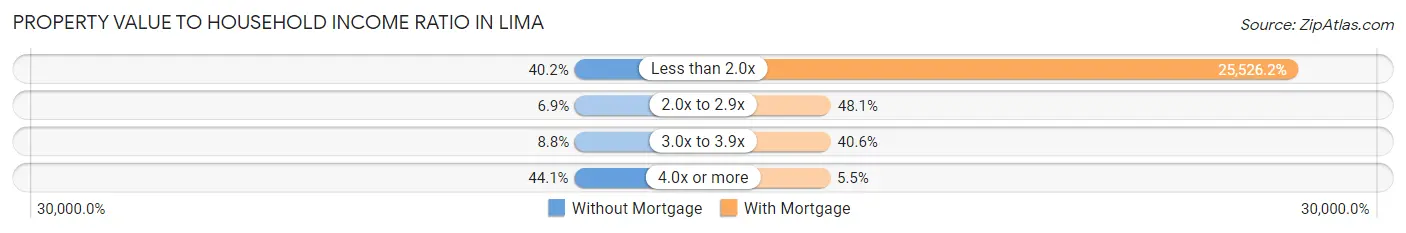
| Value-to-Income Ratio | Without Mortgage | With Mortgage |
| Less than 2.0x | 82 (40.2%) | 101,339 (25,526.2%) |
| 2.0x to 2.9x | 14 (6.9%) | 191 (48.1%) |
| 3.0x to 3.9x | 18 (8.8%) | 161 (40.6%) |
| 4.0x or more | 90 (44.1%) | 22 (5.5%) |
| Total | 204 (100.0%) | 397 (100.0%) |
Real Estate Taxes by Mortgage Status in Lima
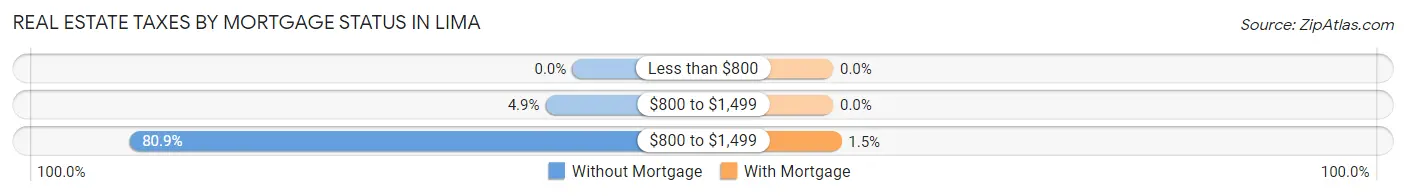
| Property Taxes | Without Mortgage | With Mortgage |
| Less than $800 | 0 (0.0%) | 0 (0.0%) |
| $800 to $1,499 | 10 (4.9%) | 0 (0.0%) |
| $800 to $1,499 | 165 (80.9%) | 6 (1.5%) |
| Total | 204 (100.0%) | 397 (100.0%) |
Health & Disability in Lima
Health Insurance Coverage by Age in Lima
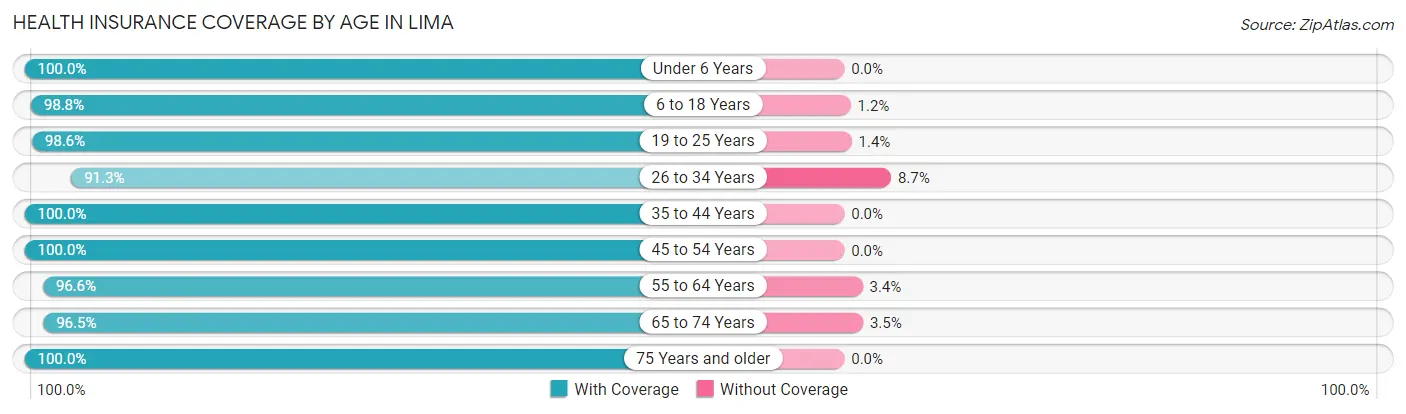
| Age Bracket | With Coverage | Without Coverage |
| Under 6 Years | 139 (100.0%) | 0 (0.0%) |
| 6 to 18 Years | 509 (98.8%) | 6 (1.2%) |
| 19 to 25 Years | 291 (98.6%) | 4 (1.4%) |
| 26 to 34 Years | 210 (91.3%) | 20 (8.7%) |
| 35 to 44 Years | 266 (100.0%) | 0 (0.0%) |
| 45 to 54 Years | 288 (100.0%) | 0 (0.0%) |
| 55 to 64 Years | 256 (96.6%) | 9 (3.4%) |
| 65 to 74 Years | 111 (96.5%) | 4 (3.5%) |
| 75 Years and older | 130 (100.0%) | 0 (0.0%) |
| Total | 2,200 (98.1%) | 43 (1.9%) |
Health Insurance Coverage by Citizenship Status in Lima
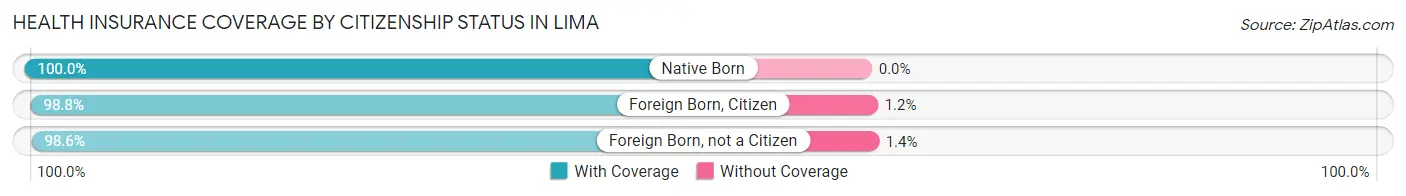
| Citizenship Status | With Coverage | Without Coverage |
| Native Born | 139 (100.0%) | 0 (0.0%) |
| Foreign Born, Citizen | 509 (98.8%) | 6 (1.2%) |
| Foreign Born, not a Citizen | 291 (98.6%) | 4 (1.4%) |
Health Insurance Coverage by Household Income in Lima
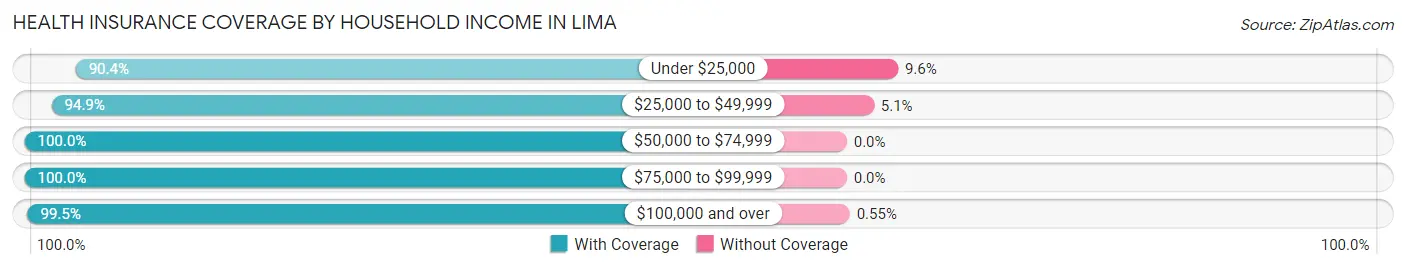
| Household Income | With Coverage | Without Coverage |
| Under $25,000 | 198 (90.4%) | 21 (9.6%) |
| $25,000 to $49,999 | 262 (94.9%) | 14 (5.1%) |
| $50,000 to $74,999 | 267 (100.0%) | 0 (0.0%) |
| $75,000 to $99,999 | 507 (100.0%) | 0 (0.0%) |
| $100,000 and over | 728 (99.5%) | 4 (0.5%) |
Public vs Private Health Insurance Coverage by Age in Lima
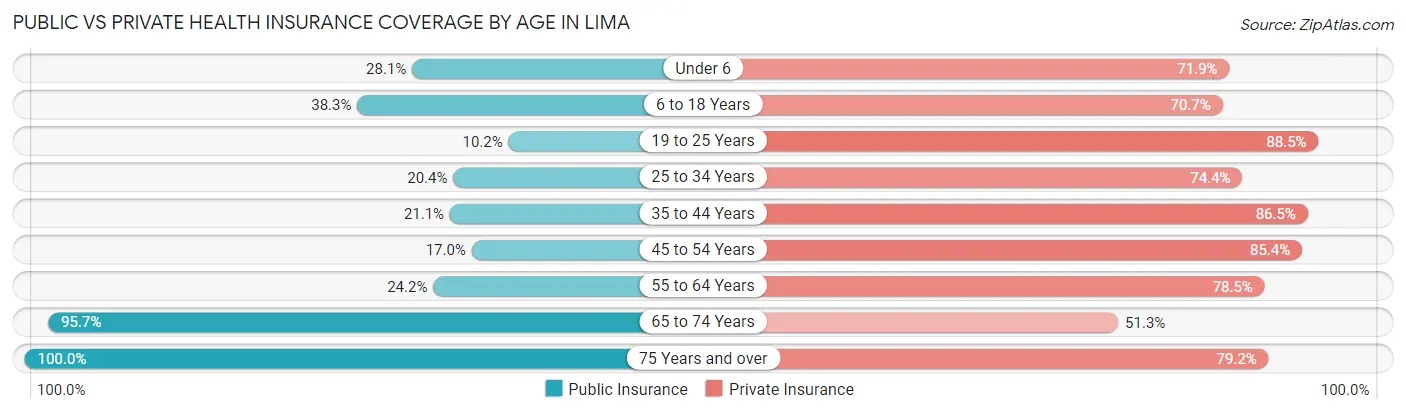
| Age Bracket | Public Insurance | Private Insurance |
| Under 6 | 39 (28.1%) | 100 (71.9%) |
| 6 to 18 Years | 197 (38.3%) | 364 (70.7%) |
| 19 to 25 Years | 30 (10.2%) | 261 (88.5%) |
| 25 to 34 Years | 47 (20.4%) | 171 (74.4%) |
| 35 to 44 Years | 56 (21.0%) | 230 (86.5%) |
| 45 to 54 Years | 49 (17.0%) | 246 (85.4%) |
| 55 to 64 Years | 64 (24.1%) | 208 (78.5%) |
| 65 to 74 Years | 110 (95.7%) | 59 (51.3%) |
| 75 Years and over | 130 (100.0%) | 103 (79.2%) |
| Total | 722 (32.2%) | 1,742 (77.7%) |
Disability Status by Sex by Age in Lima
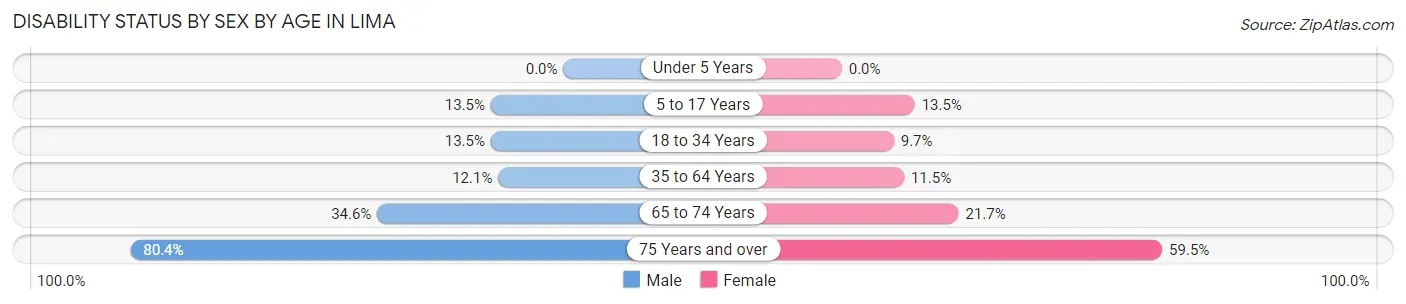
| Age Bracket | Male | Female |
| Under 5 Years | 0 (0.0%) | 0 (0.0%) |
| 5 to 17 Years | 37 (13.5%) | 18 (13.5%) |
| 18 to 34 Years | 40 (13.5%) | 33 (9.7%) |
| 35 to 64 Years | 55 (12.1%) | 42 (11.5%) |
| 65 to 74 Years | 19 (34.5%) | 13 (21.7%) |
| 75 Years and over | 45 (80.4%) | 44 (59.5%) |
Disability Class by Sex by Age in Lima
Disability Class: Hearing Difficulty
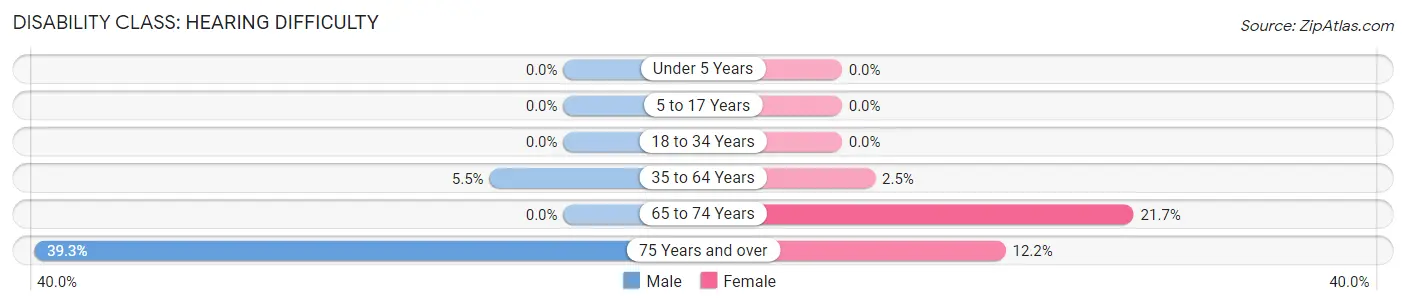
| Age Bracket | Male | Female |
| Under 5 Years | 0 (0.0%) | 0 (0.0%) |
| 5 to 17 Years | 0 (0.0%) | 0 (0.0%) |
| 18 to 34 Years | 0 (0.0%) | 0 (0.0%) |
| 35 to 64 Years | 25 (5.5%) | 9 (2.5%) |
| 65 to 74 Years | 0 (0.0%) | 13 (21.7%) |
| 75 Years and over | 22 (39.3%) | 9 (12.2%) |
Disability Class: Vision Difficulty
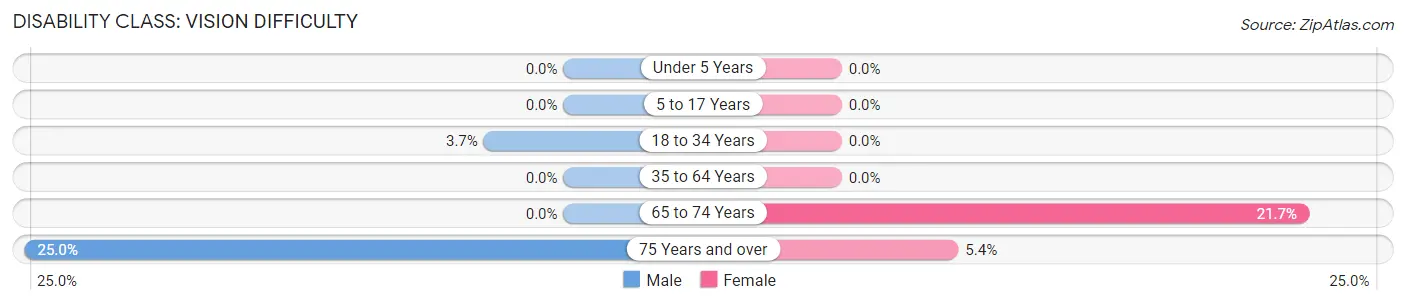
| Age Bracket | Male | Female |
| Under 5 Years | 0 (0.0%) | 0 (0.0%) |
| 5 to 17 Years | 0 (0.0%) | 0 (0.0%) |
| 18 to 34 Years | 11 (3.7%) | 0 (0.0%) |
| 35 to 64 Years | 0 (0.0%) | 0 (0.0%) |
| 65 to 74 Years | 0 (0.0%) | 13 (21.7%) |
| 75 Years and over | 14 (25.0%) | 4 (5.4%) |
Disability Class: Cognitive Difficulty
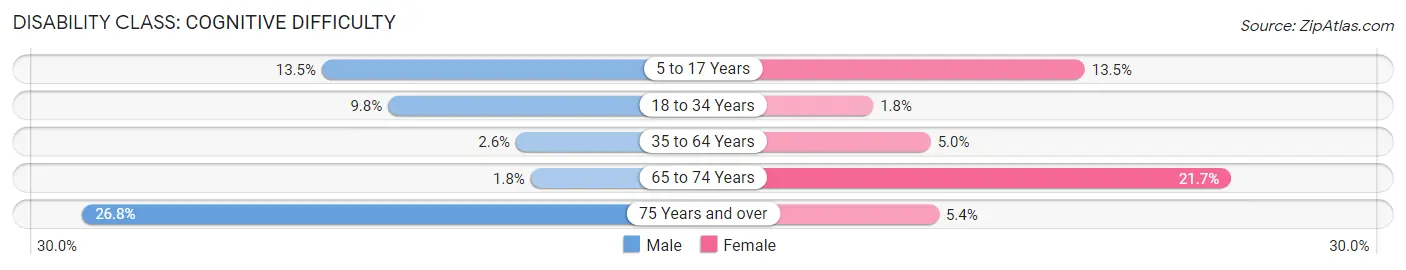
| Age Bracket | Male | Female |
| 5 to 17 Years | 37 (13.5%) | 18 (13.5%) |
| 18 to 34 Years | 29 (9.8%) | 6 (1.8%) |
| 35 to 64 Years | 12 (2.6%) | 18 (5.0%) |
| 65 to 74 Years | 1 (1.8%) | 13 (21.7%) |
| 75 Years and over | 15 (26.8%) | 4 (5.4%) |
Disability Class: Ambulatory Difficulty
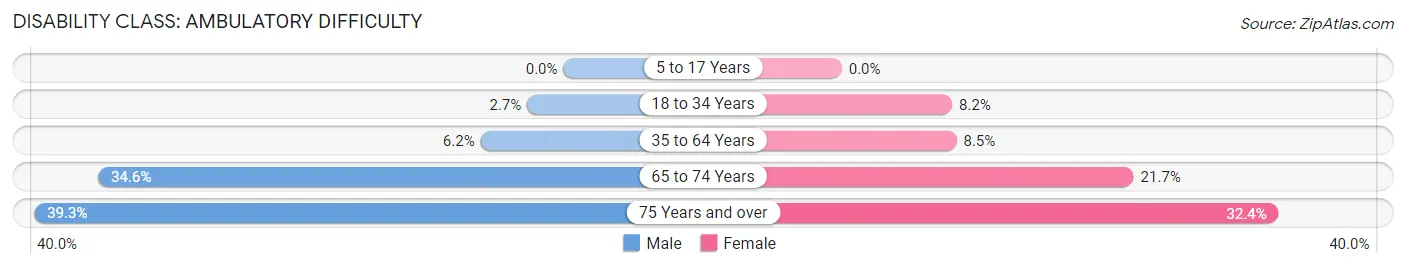
| Age Bracket | Male | Female |
| 5 to 17 Years | 0 (0.0%) | 0 (0.0%) |
| 18 to 34 Years | 8 (2.7%) | 28 (8.2%) |
| 35 to 64 Years | 28 (6.1%) | 31 (8.5%) |
| 65 to 74 Years | 19 (34.5%) | 13 (21.7%) |
| 75 Years and over | 22 (39.3%) | 24 (32.4%) |
Disability Class: Self-Care Difficulty
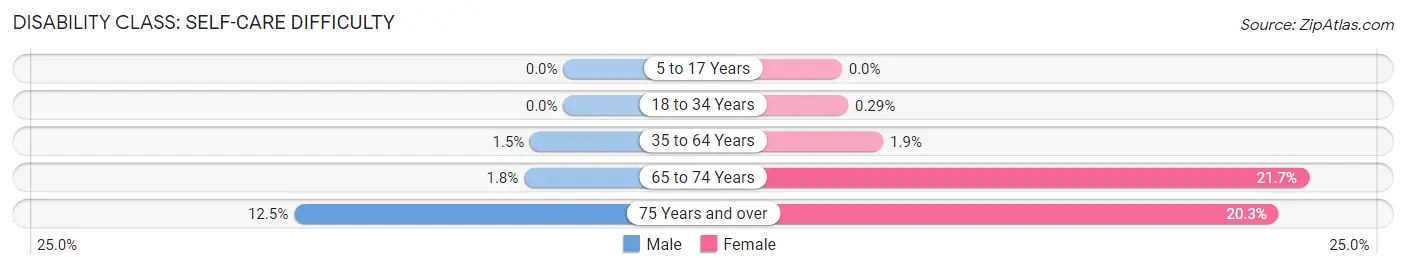
| Age Bracket | Male | Female |
| 5 to 17 Years | 0 (0.0%) | 0 (0.0%) |
| 18 to 34 Years | 0 (0.0%) | 1 (0.3%) |
| 35 to 64 Years | 7 (1.5%) | 7 (1.9%) |
| 65 to 74 Years | 1 (1.8%) | 13 (21.7%) |
| 75 Years and over | 7 (12.5%) | 15 (20.3%) |
Technology Access in Lima
Computing Device Access in Lima
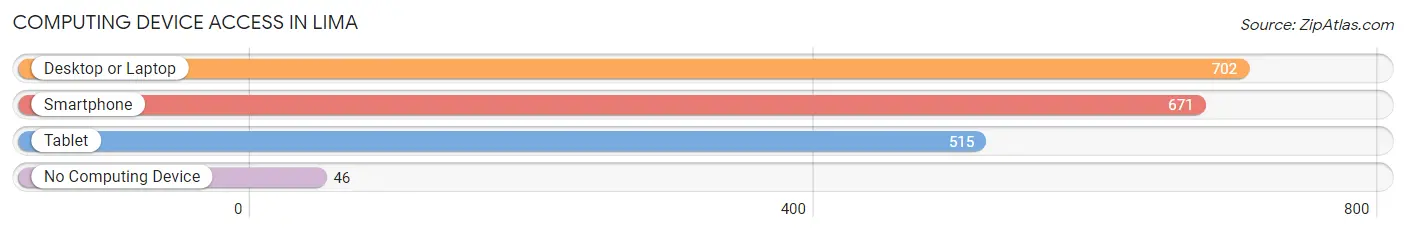
| Device Type | # Households | % Households |
| Desktop or Laptop | 702 | 88.0% |
| Smartphone | 671 | 84.1% |
| Tablet | 515 | 64.5% |
| No Computing Device | 46 | 5.8% |
| Total | 798 | 100.0% |
Internet Access in Lima
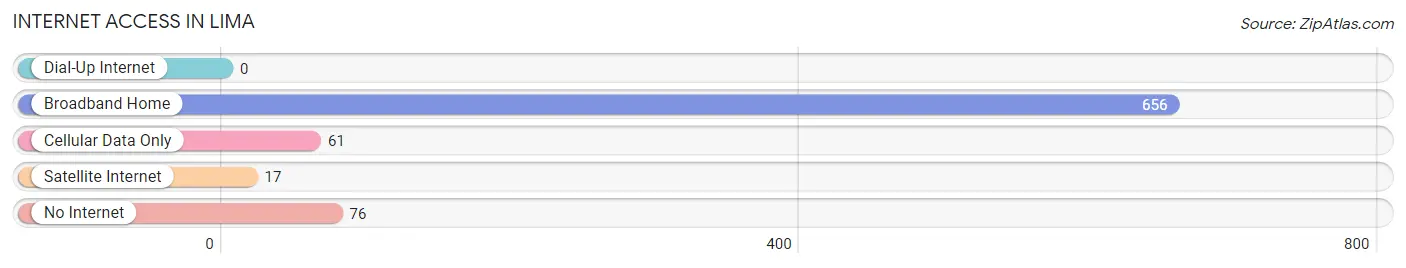
| Internet Type | # Households | % Households |
| Dial-Up Internet | 0 | 0.0% |
| Broadband Home | 656 | 82.2% |
| Cellular Data Only | 61 | 7.6% |
| Satellite Internet | 17 | 2.1% |
| No Internet | 76 | 9.5% |
| Total | 798 | 100.0% |
Lima Summary
Lima is a town located in Livingston County, New York, United States. The population was 2,890 at the 2010 census. The town is in the northwest corner of the county and is south of Rochester.
History
The area that is now Lima was first settled around 1790. The town of Lima was formed in 1808 from the town of Caledonia. The town was named after Lima, Peru, by a settler who had visited the South American country.
In 1812, the town was the site of a battle between the British and American forces during the War of 1812. The British were defeated and the town was spared from destruction.
In 1817 the first post office was established in the town
In 1820 the first school was established in the town
In 1825 the first church was established in the town
In 1826 the first newspaper was established in the town
In 1827 the first library was established in the town
In 1828 the first bank was established in the town
In 1829 the first fire company was established in the town
In 1831 the first railroad was established in the town
In 1832 the first telegraph line was established in the town
In 1833 the first telephone line was established in the town
In 1834 the first gas company was established in the town
In 1835 the first waterworks was established in the town
In 1836 the first newspaper was published in the town
In 1837 the first hotel was established in the town
In 1838 the first cemetery was established in the town
In 1839 the first fire department was established in the town
In 1840 the first public school was established in the town
In 1841 the first newspaper was published in the town
In 1842 the first bank was established in the town
In 1843 the first fire company was established in the town
In 1844 the first telegraph line was established in the town
In 1845 the first railroad was established in the town
In 1846 the first telephone line was established in the town
In 1847 the first gas company was established in the town
In 1848 the first waterworks was established in the town
In 1849 the first public school was established in the town
In 1850 the first newspaper was published in the town
In 1851 the first hotel was established in the town
In 1852 the first cemetery was established in the town
In 1853 the first fire department was established in the town
In 1854 the first public library was established in the town
In 1855 the first bank was established in the town
In 1856 the first telegraph line was established in the town
In 1857 the first railroad was established in the town
In 1858 the first telephone line was established in the town
In 1859 the first gas company was established in the town
In 1860 the first waterworks was established in the town
Geography
Lima is located in the northwest corner of Livingston County, New York. It is bordered by the towns of Geneseo to the north, Caledonia to the east, Avon to the south, and Leicester to the west.
The town is located in the Finger Lakes region of New York and is home to several small lakes, including Honeoye Lake, Canadice Lake, and Hemlock Lake.
The town is located in the Genesee Valley, which is a fertile agricultural region. The Genesee River flows through the town and is a popular destination for fishing and boating.
Economy
The economy of Lima is largely based on agriculture and tourism. The town is home to several farms, which produce a variety of crops, including corn, soybeans, wheat, and hay.
The town is also home to several wineries, which produce a variety of wines. The town is also home to several restaurants, which serve a variety of cuisines.
The town is also home to several small businesses, including retail stores, auto repair shops, and professional services.
Demographics
As of the 2010 census, there were 2,890 people, 1,093 households, and 790 families residing in the town. The population density was 97.3 people per square mile (37.6/km2). There were 1,164 housing units at an average density of 39.3 per square mile (15.2/km2). The racial makeup of the town was 97.2% White, 0.7% African American, 0.2% Native American, 0.3% Asian, 0.1% Pacific Islander, 0.4% from other races, and 1.1% from two or more races. Hispanic or Latino of any race were 1.7% of the population.
There were 1,093 households, out of which 33.2% had children under the age of 18 living with them, 57.2% were married couples living together, 10.2% had a female householder with no husband present, and 28.2% were non-families. 22.7% of all households were made up of individuals, and 9.2% had someone living alone who was 65 years of age or older. The average household size was 2.63 and the average family size was 3.09.
In the town, the population was spread out, with 25.7% under the age of 18, 6.7% from 18 to 24, 28.2% from 25 to 44, 25.3% from 45 to 64, and 14.1% who were 65 years of age or older. The median age was 38 years. For every 100 females, there were 97.2 males. For every 100 females age 18 and over, there were 94.2 males.
The median income for a household in the town was $45,000, and the median income for a family was $51,250. Males had a median income of $36,250 versus $25,000 for females. The per capita income for the town was $20,845. About 5.2% of families and 7.2% of the population were below the poverty line, including 8.3% of those under age 18 and 5.2% of those age 65 or over.
Common Questions
What is the Total Population of Lima?
Total Population of Lima is 2,243.
What is the Total Male Population of Lima?
Total Male Population of Lima is 1,189.
What is the Total Female Population of Lima?
Total Female Population of Lima is 1,054.
What is the Ratio of Males per 100 Females in Lima?
There are 112.81 Males per 100 Females in Lima.
What is the Ratio of Females per 100 Males in Lima?
There are 88.65 Females per 100 Males in Lima.
What is the Median Population Age in Lima?
Median Population Age in Lima is 31.8 Years.
What is the Average Family Size in Lima
Average Family Size in Lima is 3.3 People.
What is the Average Household Size in Lima
Average Household Size in Lima is 2.5 People.
What is Per Capita Income in Lima?
Per Capita income in Lima is $31,108.
What is the Median Family Income in Lima?
Median Family Income in Lima is $94,620.
What is the Median Household income in Lima?
Median Household Income in Lima is $71,719.
What is Income or Wage Gap in Lima?
Income or Wage Gap in Lima is 40.6%.
Women in Lima earn 59.4 cents for every dollar earned by a man.
What is Inequality or Gini Index in Lima?
Inequality or Gini Index in Lima is 0.41.
How Large is the Labor Force in Lima?
There are 1,173 People in the Labor Forcein in Lima.
What is the Percentage of People in the Labor Force in Lima?
66.4% of People are in the Labor Force in Lima.
What is the Unemployment Rate in Lima?
Unemployment Rate in Lima is 2.6%.