Hagaman, NY
Hagaman Map
Hagaman Overview
1,156
TOTAL POPULATION
545
MALE POPULATION
611
FEMALE POPULATION
89.20
MALES / 100 FEMALES
112.11
FEMALES / 100 MALES
47.7
MEDIAN AGE
2.7
AVG FAMILY SIZE
2.0
AVG HOUSEHOLD SIZE
$36,778
PER CAPITA INCOME
$78,654
AVG FAMILY INCOME
$61,250
AVG HOUSEHOLD INCOME
13.7%
WAGE / INCOME GAP [ % ]
86.3¢/ $1
WAGE / INCOME GAP [ $ ]
0.41
INEQUALITY / GINI INDEX
585
LABOR FORCE [ PEOPLE ]
58.6%
PERCENT IN LABOR FORCE
2.7%
UNEMPLOYMENT RATE
Hagaman Zip Codes
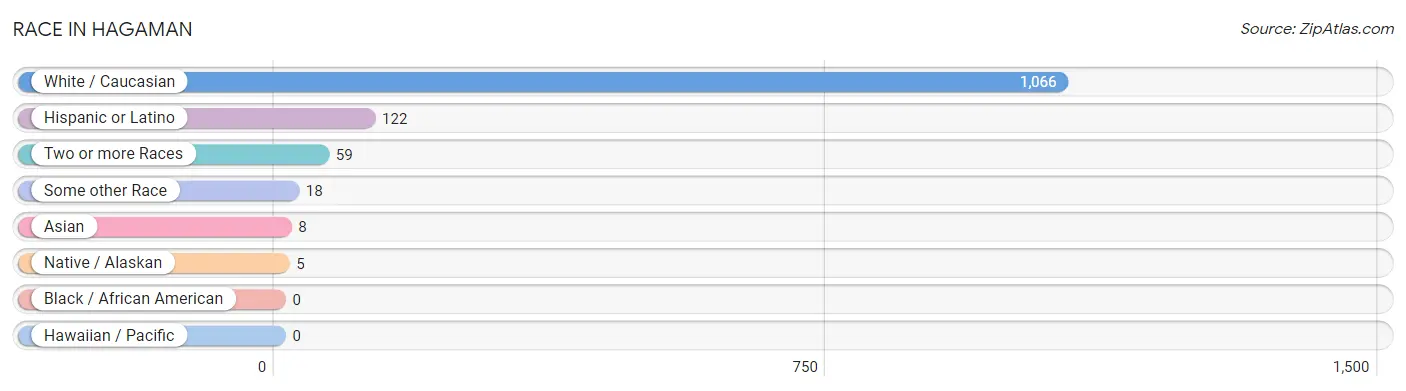
Race in Hagaman
The most populous races in Hagaman are White / Caucasian (1,066 | 92.2%), Hispanic or Latino (122 | 10.5%), and Two or more Races (59 | 5.1%).
| Race | # Population | % Population |
| Asian | 8 | 0.7% |
| Black / African American | 0 | 0.0% |
| Hawaiian / Pacific | 0 | 0.0% |
| Hispanic or Latino | 122 | 10.5% |
| Native / Alaskan | 5 | 0.4% |
| White / Caucasian | 1,066 | 92.2% |
| Two or more Races | 59 | 5.1% |
| Some other Race | 18 | 1.6% |
| Total | 1,156 | 100.0% |
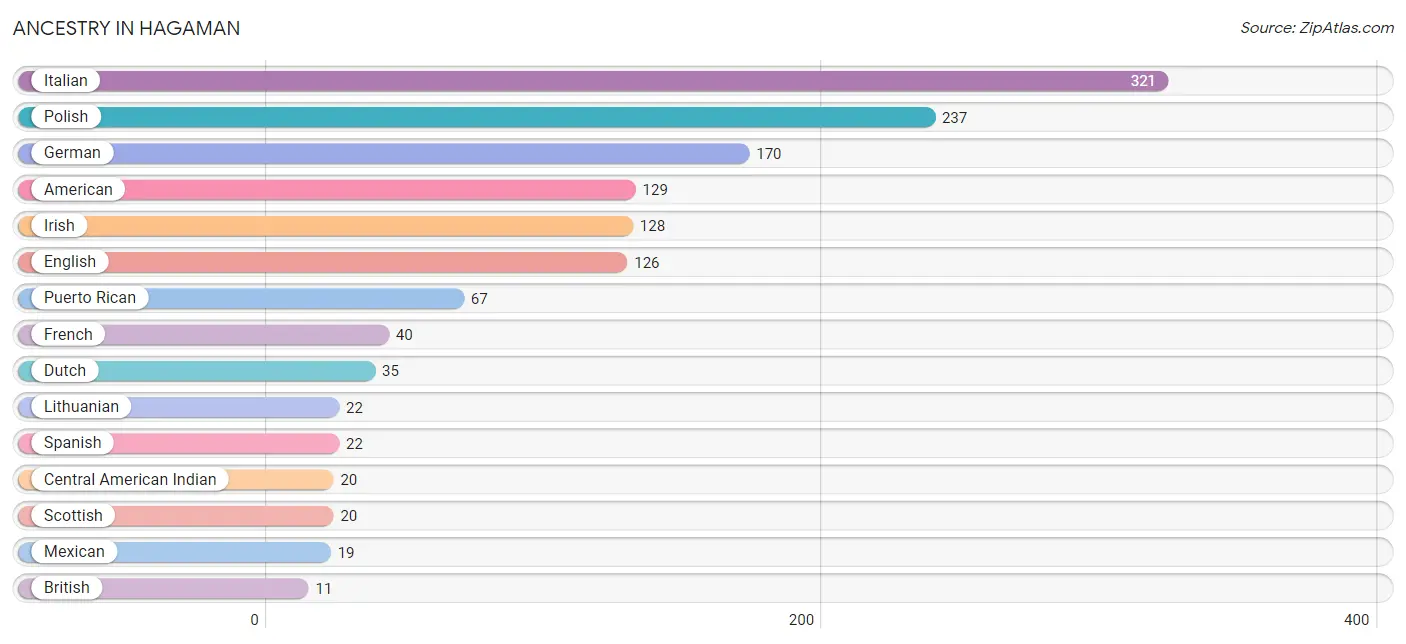
Ancestry in Hagaman
The most populous ancestries reported in Hagaman are Italian (321 | 27.8%), Polish (237 | 20.5%), German (170 | 14.7%), American (129 | 11.2%), and Irish (128 | 11.1%), together accounting for 85.2% of all Hagaman residents.
| Ancestry | # Population | % Population |
| American | 129 | 11.2% |
| Austrian | 6 | 0.5% |
| Belgian | 2 | 0.2% |
| British | 11 | 0.9% |
| Central American | 8 | 0.7% |
| Central American Indian | 20 | 1.7% |
| Cherokee | 1 | 0.1% |
| Costa Rican | 8 | 0.7% |
| Czechoslovakian | 3 | 0.3% |
| Danish | 3 | 0.3% |
| Dominican | 1 | 0.1% |
| Dutch | 35 | 3.0% |
| English | 126 | 10.9% |
| European | 8 | 0.7% |
| French | 40 | 3.5% |
| French American Indian | 2 | 0.2% |
| French Canadian | 2 | 0.2% |
| German | 170 | 14.7% |
| Hungarian | 8 | 0.7% |
| Irish | 128 | 11.1% |
| Italian | 321 | 27.8% |
| Korean | 2 | 0.2% |
| Lithuanian | 22 | 1.9% |
| Mexican | 19 | 1.6% |
| Norwegian | 5 | 0.4% |
| Polish | 237 | 20.5% |
| Puerto Rican | 67 | 5.8% |
| Romanian | 10 | 0.9% |
| Russian | 8 | 0.7% |
| Scotch-Irish | 4 | 0.4% |
| Scottish | 20 | 1.7% |
| Spaniard | 5 | 0.4% |
| Spanish | 22 | 1.9% |
| Swiss | 7 | 0.6% |
| Ukrainian | 7 | 0.6% |
| West Indian | 2 | 0.2% | View All 36 Rows |
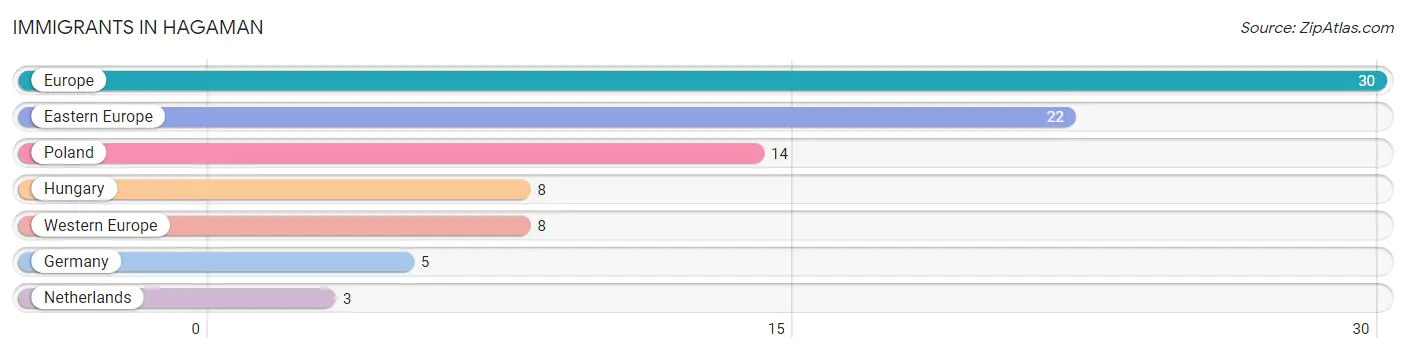
Immigrants in Hagaman
The most numerous immigrant groups reported in Hagaman came from Europe (30 | 2.6%), Eastern Europe (22 | 1.9%), Poland (14 | 1.2%), Hungary (8 | 0.7%), and Western Europe (8 | 0.7%), together accounting for 7.1% of all Hagaman residents.
| Immigration Origin | # Population | % Population |
| Eastern Europe | 22 | 1.9% |
| Europe | 30 | 2.6% |
| Germany | 5 | 0.4% |
| Hungary | 8 | 0.7% |
| Netherlands | 3 | 0.3% |
| Poland | 14 | 1.2% |
| Western Europe | 8 | 0.7% | View All 7 Rows |
Sex and Age in Hagaman
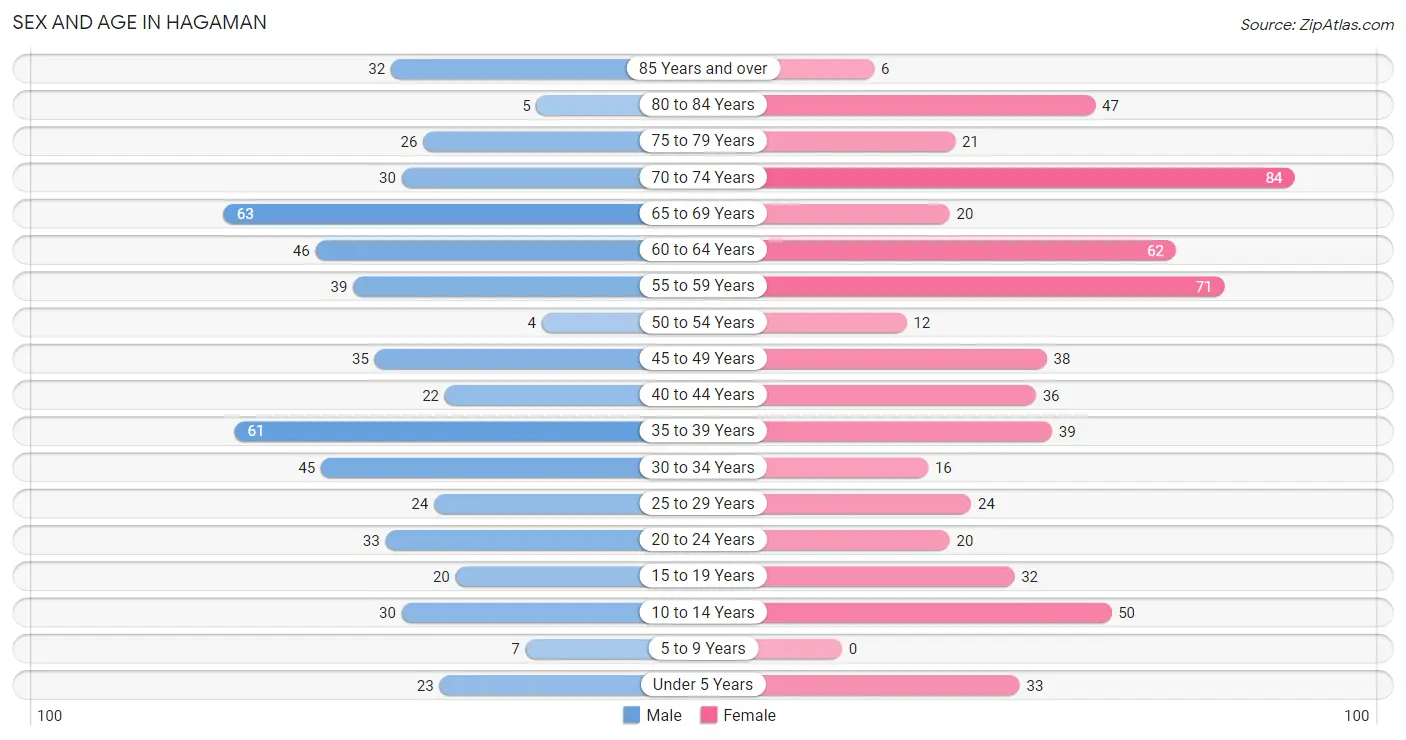
Sex and Age in Hagaman
The most populous age groups in Hagaman are 65 to 69 Years (63 | 11.6%) for men and 70 to 74 Years (84 | 13.8%) for women.
| Age Bracket | Male | Female |
| Under 5 Years | 23 (4.2%) | 33 (5.4%) |
| 5 to 9 Years | 7 (1.3%) | 0 (0.0%) |
| 10 to 14 Years | 30 (5.5%) | 50 (8.2%) |
| 15 to 19 Years | 20 (3.7%) | 32 (5.2%) |
| 20 to 24 Years | 33 (6.1%) | 20 (3.3%) |
| 25 to 29 Years | 24 (4.4%) | 24 (3.9%) |
| 30 to 34 Years | 45 (8.3%) | 16 (2.6%) |
| 35 to 39 Years | 61 (11.2%) | 39 (6.4%) |
| 40 to 44 Years | 22 (4.0%) | 36 (5.9%) |
| 45 to 49 Years | 35 (6.4%) | 38 (6.2%) |
| 50 to 54 Years | 4 (0.7%) | 12 (2.0%) |
| 55 to 59 Years | 39 (7.2%) | 71 (11.6%) |
| 60 to 64 Years | 46 (8.4%) | 62 (10.2%) |
| 65 to 69 Years | 63 (11.6%) | 20 (3.3%) |
| 70 to 74 Years | 30 (5.5%) | 84 (13.8%) |
| 75 to 79 Years | 26 (4.8%) | 21 (3.4%) |
| 80 to 84 Years | 5 (0.9%) | 47 (7.7%) |
| 85 Years and over | 32 (5.9%) | 6 (1.0%) |
| Total | 545 (100.0%) | 611 (100.0%) |
Families and Households in Hagaman
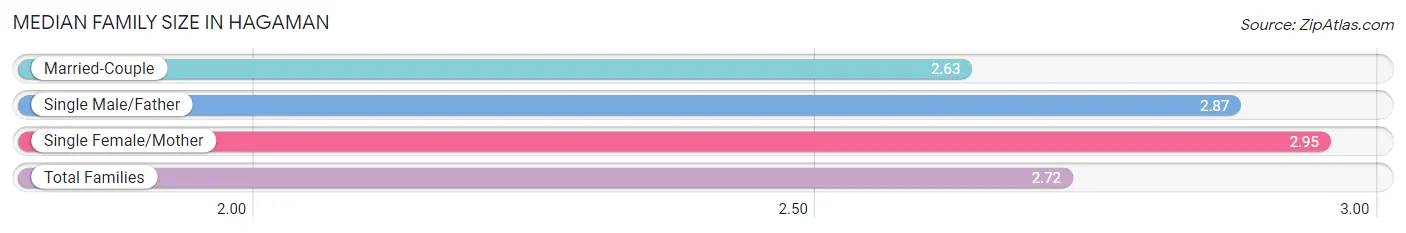
Median Family Size in Hagaman
The median family size in Hagaman is 2.72 persons per family, with single female/mother families (59 | 20.3%) accounting for the largest median family size of 2.95 persons per family. On the other hand, married-couple families (200 | 69.0%) represent the smallest median family size with 2.63 persons per family.
| Family Type | # Families | Family Size |
| Married-Couple | 200 (69.0%) | 2.63 |
| Single Male/Father | 31 (10.7%) | 2.87 |
| Single Female/Mother | 59 (20.3%) | 2.95 |
| Total Families | 290 (100.0%) | 2.72 |
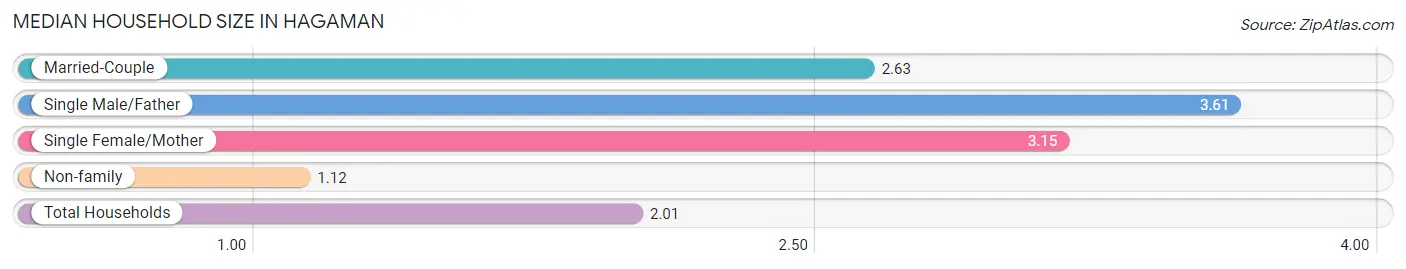
Median Household Size in Hagaman
The median household size in Hagaman is 2.01 persons per household, with single male/father households (31 | 5.5%) accounting for the largest median household size of 3.61 persons per household. non-family households (270 | 48.2%) represent the smallest median household size with 1.12 persons per household.
| Household Type | # Households | Household Size |
| Married-Couple | 200 (35.7%) | 2.63 |
| Single Male/Father | 31 (5.5%) | 3.61 |
| Single Female/Mother | 59 (10.5%) | 3.15 |
| Non-family | 270 (48.2%) | 1.12 |
| Total Households | 560 (100.0%) | 2.01 |
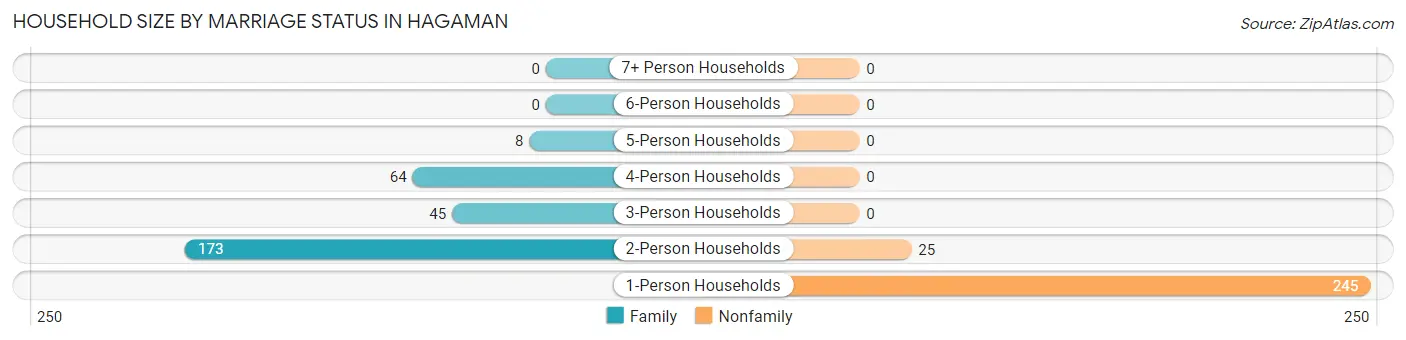
Household Size by Marriage Status in Hagaman
Out of a total of 560 households in Hagaman, 290 (51.8%) are family households, while 270 (48.2%) are nonfamily households. The most numerous type of family households are 2-person households, comprising 173, and the most common type of nonfamily households are 1-person households, comprising 245.
| Household Size | Family Households | Nonfamily Households |
| 1-Person Households | - | 245 (43.8%) |
| 2-Person Households | 173 (30.9%) | 25 (4.5%) |
| 3-Person Households | 45 (8.0%) | 0 (0.0%) |
| 4-Person Households | 64 (11.4%) | 0 (0.0%) |
| 5-Person Households | 8 (1.4%) | 0 (0.0%) |
| 6-Person Households | 0 (0.0%) | 0 (0.0%) |
| 7+ Person Households | 0 (0.0%) | 0 (0.0%) |
| Total | 290 (51.8%) | 270 (48.2%) |
Female Fertility in Hagaman
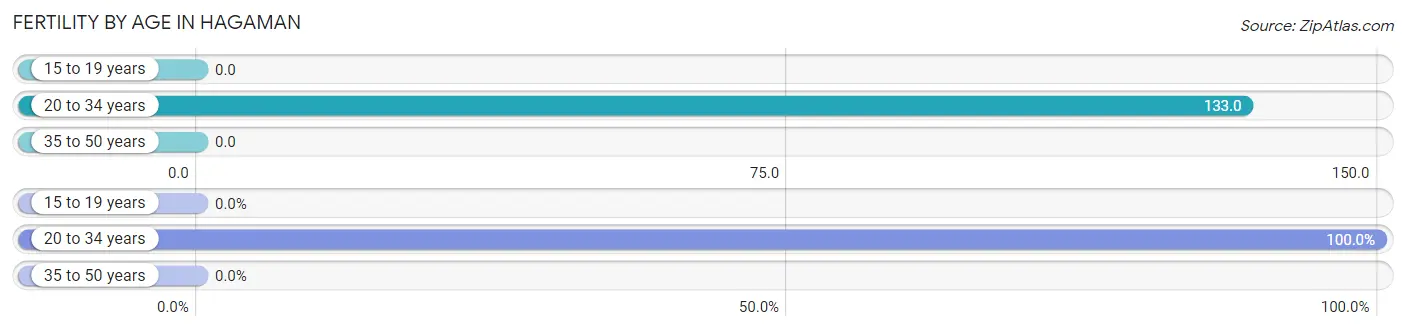
Fertility by Age in Hagaman
Average fertility rate in Hagaman is 37.0 births per 1,000 women. Women in the age bracket of 20 to 34 years have the highest fertility rate with 133.0 births per 1,000 women. Women in the age bracket of 20 to 34 years acount for 100.0% of all women with births.
| Age Bracket | Women with Births | Births / 1,000 Women |
| 15 to 19 years | 0 (0.0%) | 0.0 |
| 20 to 34 years | 8 (100.0%) | 133.0 |
| 35 to 50 years | 0 (0.0%) | 0.0 |
| Total | 8 (100.0%) | 37.0 |
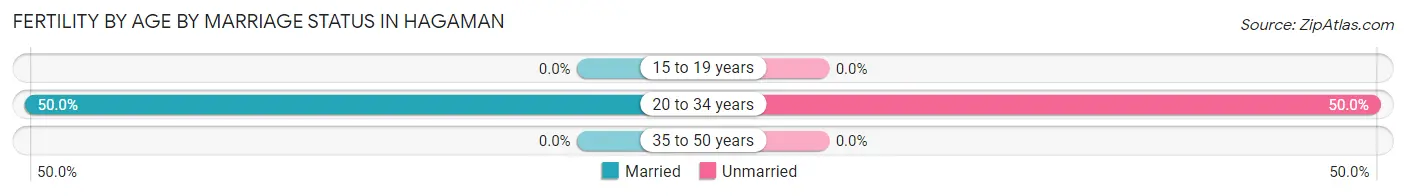
Fertility by Age by Marriage Status in Hagaman
50.0% of women with births (8) in Hagaman are married. The highest percentage of unmarried women with births falls into 20 to 34 years age bracket with 50.0% of them unmarried at the time of birth, while the lowest percentage of unmarried women with births belong to 20 to 34 years age bracket with 50.0% of them unmarried.
| Age Bracket | Married | Unmarried |
| 15 to 19 years | 0 (0.0%) | 0 (0.0%) |
| 20 to 34 years | 4 (50.0%) | 4 (50.0%) |
| 35 to 50 years | 0 (0.0%) | 0 (0.0%) |
| Total | 4 (50.0%) | 4 (50.0%) |
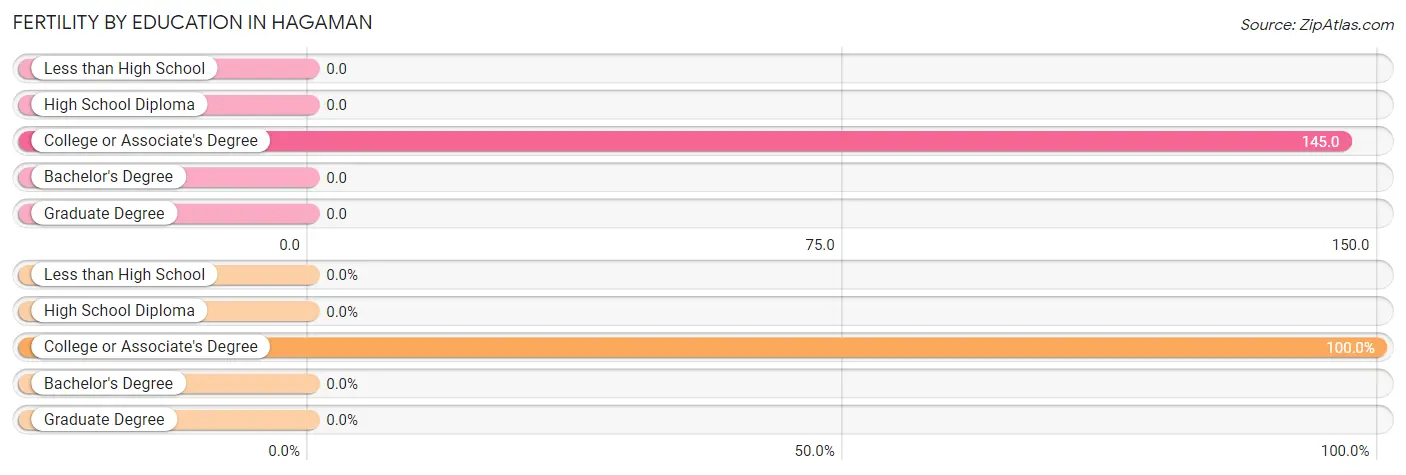
Fertility by Education in Hagaman
| Educational Attainment | Women with Births | Births / 1,000 Women |
| Less than High School | 0 (0.0%) | 0.0 |
| High School Diploma | 0 (0.0%) | 0.0 |
| College or Associate's Degree | 8 (100.0%) | 145.0 |
| Bachelor's Degree | 0 (0.0%) | 0.0 |
| Graduate Degree | 0 (0.0%) | 0.0 |
| Total | 8 (100.0%) | 37.0 |
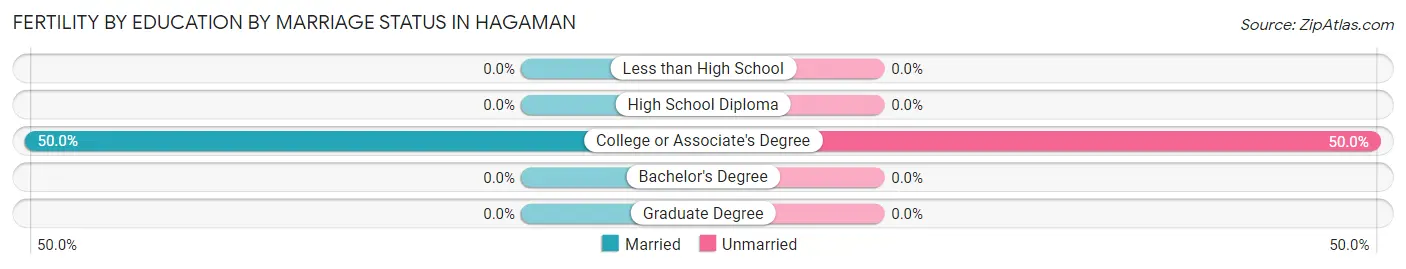
Fertility by Education by Marriage Status in Hagaman
50.0% of women with births in Hagaman are unmarried. Women with the educational attainment of college or associate's degree are most likely to be married with 50.0% of them married at childbirth, while women with the educational attainment of college or associate's degree are least likely to be married with 50.0% of them unmarried at childbirth.
| Educational Attainment | Married | Unmarried |
| Less than High School | 0 (0.0%) | 0 (0.0%) |
| High School Diploma | 0 (0.0%) | 0 (0.0%) |
| College or Associate's Degree | 4 (50.0%) | 4 (50.0%) |
| Bachelor's Degree | 0 (0.0%) | 0 (0.0%) |
| Graduate Degree | 0 (0.0%) | 0 (0.0%) |
| Total | 4 (50.0%) | 4 (50.0%) |
Income in Hagaman
Income Overview in Hagaman
Per Capita Income in Hagaman is $36,778, while median incomes of families and households are $78,654 and $61,250 respectively.
| Characteristic | Number | Measure |
| Per Capita Income | 1,156 | $36,778 |
| Median Family Income | 290 | $78,654 |
| Mean Family Income | 290 | $95,166 |
| Median Household Income | 560 | $61,250 |
| Mean Household Income | 560 | $72,934 |
| Income Deficit | 290 | $0 |
| Wage / Income Gap (%) | 1,156 | 13.70% |
| Wage / Income Gap ($) | 1,156 | 86.30¢ per $1 |
| Gini / Inequality Index | 1,156 | 0.41 |
Earnings by Sex in Hagaman
Average Earnings in Hagaman are $40,114, $35,500 for men and $41,136 for women, a difference of 13.7%.
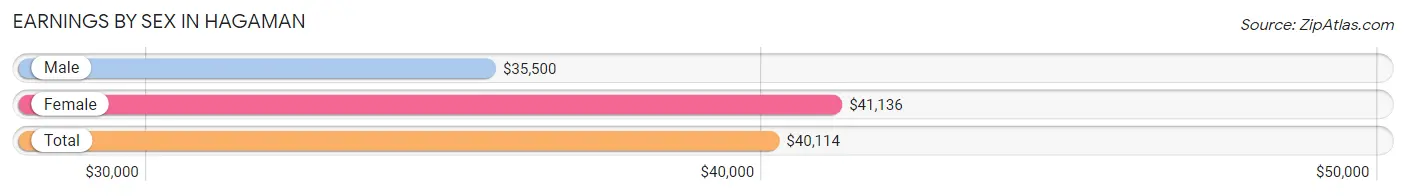
| Sex | Number | Average Earnings |
| Male | 330 (50.9%) | $35,500 |
| Female | 318 (49.1%) | $41,136 |
| Total | 648 (100.0%) | $40,114 |
Earnings by Sex by Income Bracket in Hagaman
The most common earnings brackets in Hagaman are $55,000 to $64,999 for men (56 | 17.0%) and $55,000 to $64,999 for women (41 | 12.9%).
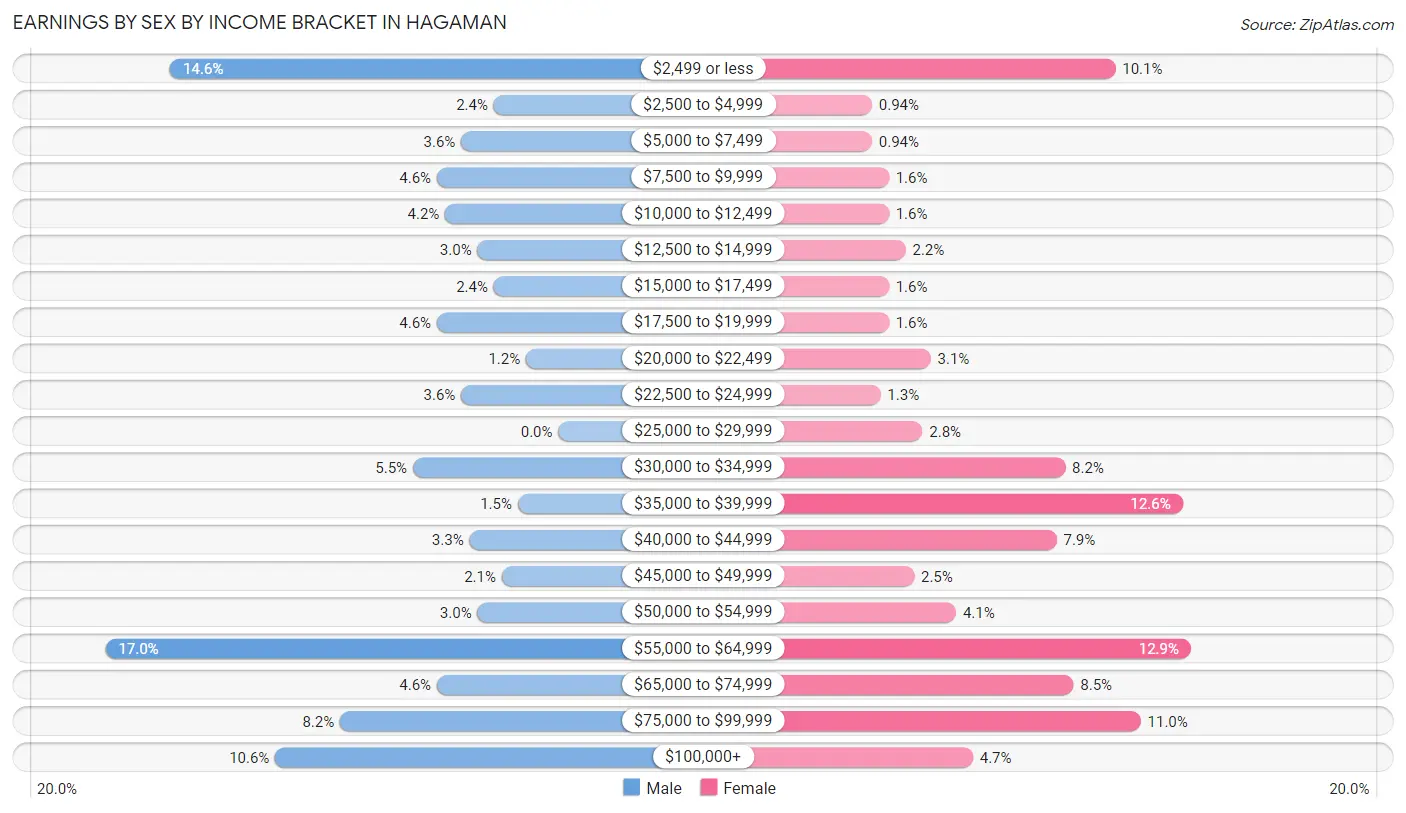
| Income | Male | Female |
| $2,499 or less | 48 (14.5%) | 32 (10.1%) |
| $2,500 to $4,999 | 8 (2.4%) | 3 (0.9%) |
| $5,000 to $7,499 | 12 (3.6%) | 3 (0.9%) |
| $7,500 to $9,999 | 15 (4.5%) | 5 (1.6%) |
| $10,000 to $12,499 | 14 (4.2%) | 5 (1.6%) |
| $12,500 to $14,999 | 10 (3.0%) | 7 (2.2%) |
| $15,000 to $17,499 | 8 (2.4%) | 5 (1.6%) |
| $17,500 to $19,999 | 15 (4.5%) | 5 (1.6%) |
| $20,000 to $22,499 | 4 (1.2%) | 10 (3.1%) |
| $22,500 to $24,999 | 12 (3.6%) | 4 (1.3%) |
| $25,000 to $29,999 | 0 (0.0%) | 9 (2.8%) |
| $30,000 to $34,999 | 18 (5.4%) | 26 (8.2%) |
| $35,000 to $39,999 | 5 (1.5%) | 40 (12.6%) |
| $40,000 to $44,999 | 11 (3.3%) | 25 (7.9%) |
| $45,000 to $49,999 | 7 (2.1%) | 8 (2.5%) |
| $50,000 to $54,999 | 10 (3.0%) | 13 (4.1%) |
| $55,000 to $64,999 | 56 (17.0%) | 41 (12.9%) |
| $65,000 to $74,999 | 15 (4.5%) | 27 (8.5%) |
| $75,000 to $99,999 | 27 (8.2%) | 35 (11.0%) |
| $100,000+ | 35 (10.6%) | 15 (4.7%) |
| Total | 330 (100.0%) | 318 (100.0%) |
Earnings by Sex by Educational Attainment in Hagaman
Average earnings in Hagaman are $51,406 for men and $44,712 for women, a difference of 13.0%. Men with an educational attainment of graduate degree enjoy the highest average annual earnings of $145,833, while those with high school diploma education earn the least with $41,591. Women with an educational attainment of bachelor's degree earn the most with the average annual earnings of $64,063, while those with less than high school education have the smallest earnings of $38,295.
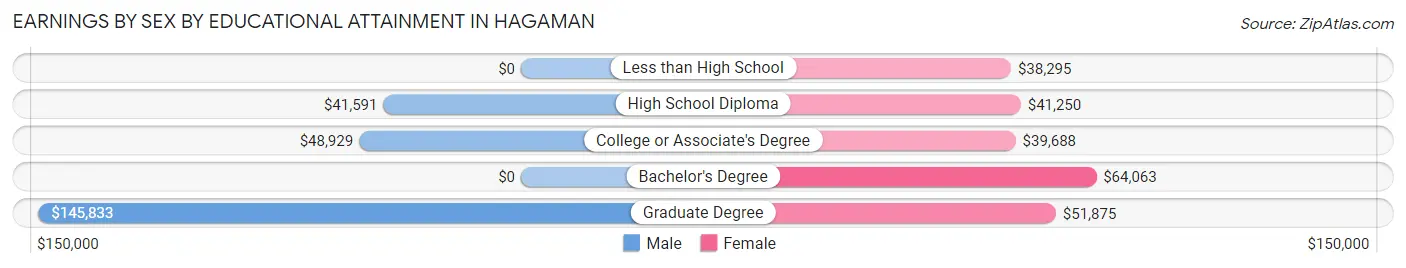
| Educational Attainment | Male Income | Female Income |
| Less than High School | - | - |
| High School Diploma | $41,591 | $41,250 |
| College or Associate's Degree | $48,929 | $39,688 |
| Bachelor's Degree | - | - |
| Graduate Degree | $145,833 | $51,875 |
| Total | $51,406 | $44,712 |
Family Income in Hagaman
Family Income Brackets in Hagaman
According to the Hagaman family income data, there are 74 families falling into the $50,000 to $74,999 income range, which is the most common income bracket and makes up 25.5% of all families.
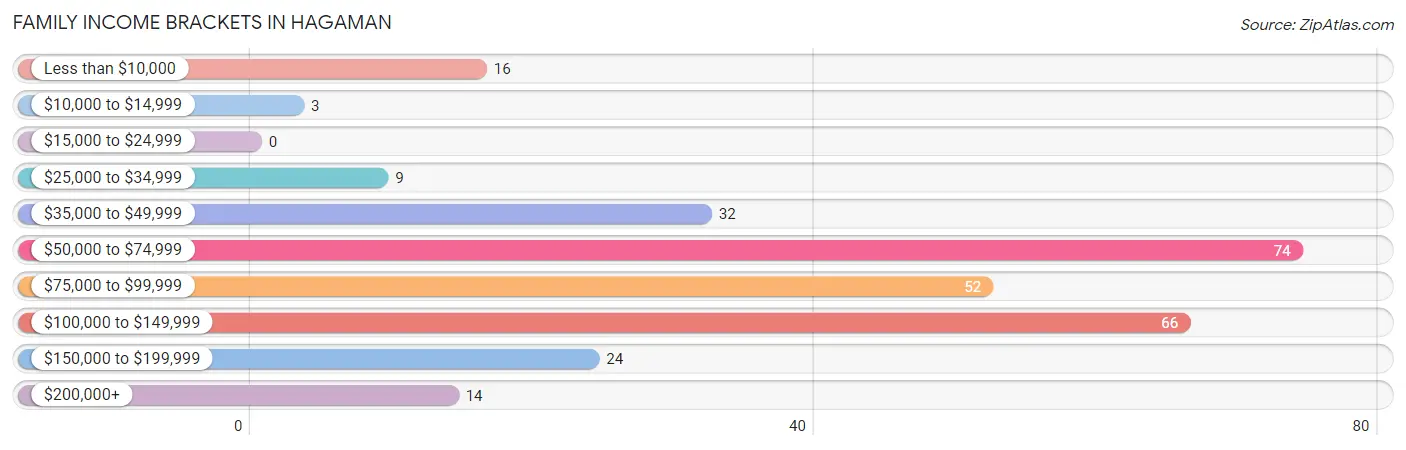
| Income Bracket | # Families | % Families |
| Less than $10,000 | 16 | 5.5% |
| $10,000 to $14,999 | 3 | 1.0% |
| $15,000 to $24,999 | 0 | 0.0% |
| $25,000 to $34,999 | 9 | 3.1% |
| $35,000 to $49,999 | 32 | 11.0% |
| $50,000 to $74,999 | 74 | 25.5% |
| $75,000 to $99,999 | 52 | 17.9% |
| $100,000 to $149,999 | 66 | 22.8% |
| $150,000 to $199,999 | 24 | 8.3% |
| $200,000+ | 14 | 4.8% |
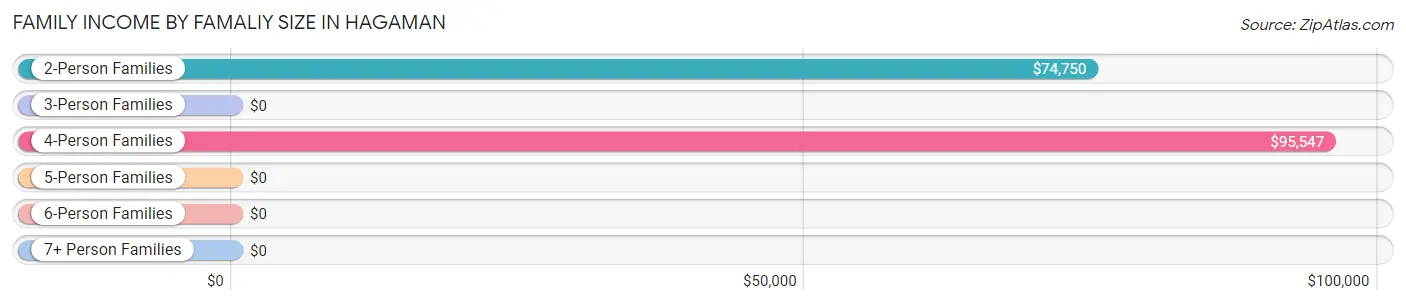
Family Income by Famaliy Size in Hagaman
4-person families (51 | 17.6%) account for the highest median family income in Hagaman with $95,547 per family, while 2-person families (189 | 65.2%) have the highest median income of $37,375 per family member.
| Income Bracket | # Families | Median Income |
| 2-Person Families | 189 (65.2%) | $74,750 |
| 3-Person Families | 42 (14.5%) | $0 |
| 4-Person Families | 51 (17.6%) | $95,547 |
| 5-Person Families | 8 (2.8%) | $0 |
| 6-Person Families | 0 (0.0%) | $0 |
| 7+ Person Families | 0 (0.0%) | $0 |
| Total | 290 (100.0%) | $78,654 |
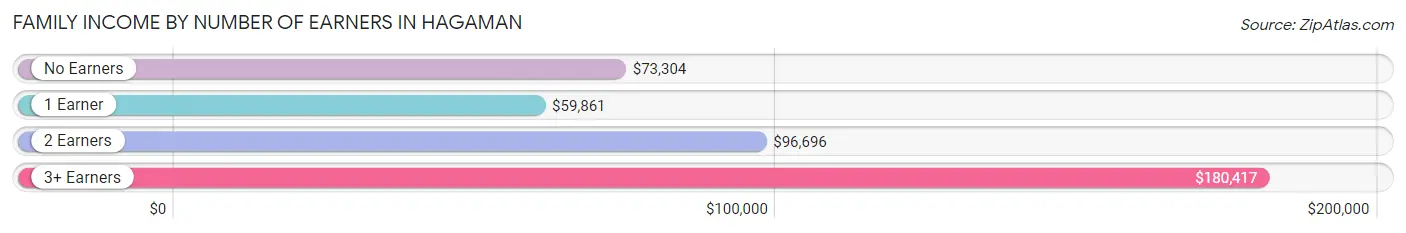
Family Income by Number of Earners in Hagaman
The median family income in Hagaman is $78,654, with families comprising 3+ earners (21) having the highest median family income of $180,417, while families with 1 earner (97) have the lowest median family income of $59,861, accounting for 7.2% and 33.5% of families, respectively.
| Number of Earners | # Families | Median Income |
| No Earners | 35 (12.1%) | $73,304 |
| 1 Earner | 97 (33.5%) | $59,861 |
| 2 Earners | 137 (47.2%) | $96,696 |
| 3+ Earners | 21 (7.2%) | $180,417 |
| Total | 290 (100.0%) | $78,654 |
Household Income in Hagaman
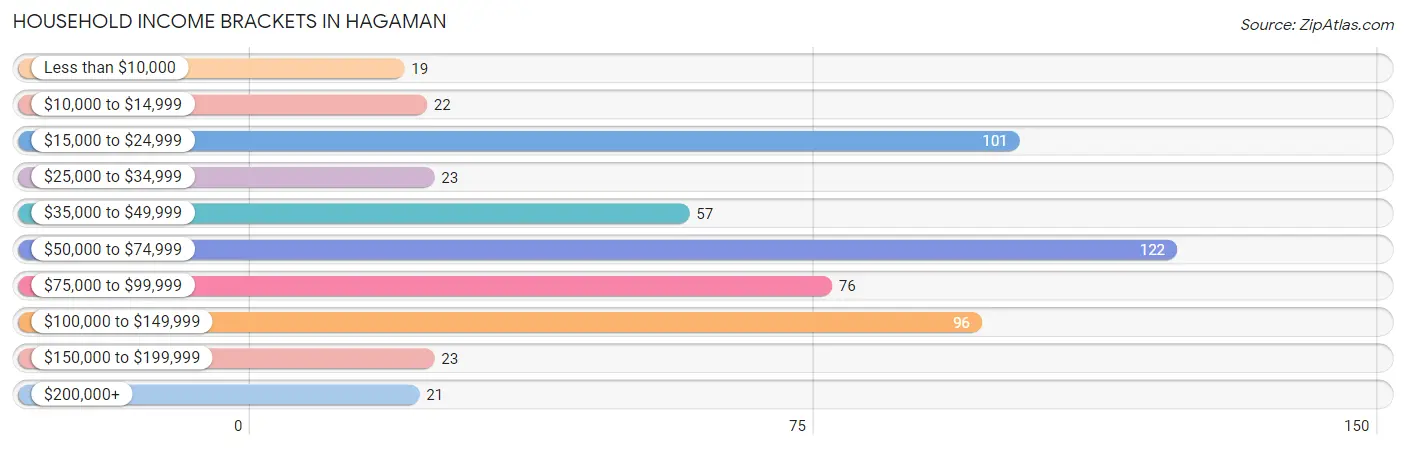
Household Income Brackets in Hagaman
With 122 households falling in the category, the $50,000 to $74,999 income range is the most frequent in Hagaman, accounting for 21.8% of all households. In contrast, only 19 households (3.4%) fall into the less than $10,000 income bracket, making it the least populous group.
| Income Bracket | # Households | % Households |
| Less than $10,000 | 19 | 3.4% |
| $10,000 to $14,999 | 22 | 3.9% |
| $15,000 to $24,999 | 101 | 18.0% |
| $25,000 to $34,999 | 23 | 4.1% |
| $35,000 to $49,999 | 57 | 10.2% |
| $50,000 to $74,999 | 122 | 21.8% |
| $75,000 to $99,999 | 76 | 13.6% |
| $100,000 to $149,999 | 96 | 17.1% |
| $150,000 to $199,999 | 23 | 4.1% |
| $200,000+ | 21 | 3.8% |
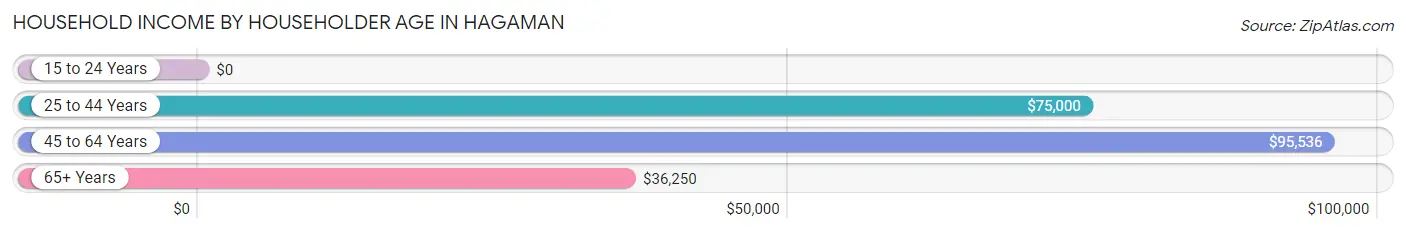
Household Income by Householder Age in Hagaman
The median household income in Hagaman is $61,250, with the highest median household income of $95,536 found in the 45 to 64 years age bracket for the primary householder. A total of 180 households (32.1%) fall into this category. Meanwhile, the 15 to 24 years age bracket for the primary householder has the lowest median household income of $0, with 5 households (0.9%) in this group.
| Income Bracket | # Households | Median Income |
| 15 to 24 Years | 5 (0.9%) | $0 |
| 25 to 44 Years | 128 (22.9%) | $75,000 |
| 45 to 64 Years | 180 (32.1%) | $95,536 |
| 65+ Years | 247 (44.1%) | $36,250 |
| Total | 560 (100.0%) | $61,250 |
Poverty in Hagaman
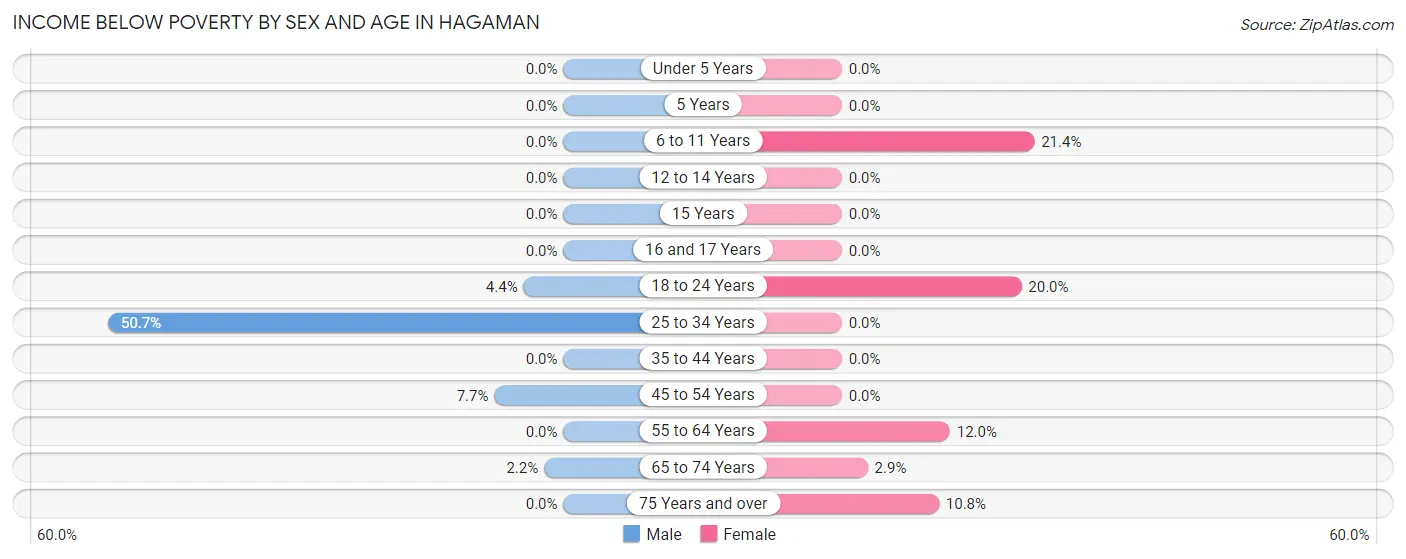
Income Below Poverty by Sex and Age in Hagaman
With 7.7% poverty level for males and 5.6% for females among the residents of Hagaman, 25 to 34 year old males and 6 to 11 year old females are the most vulnerable to poverty, with 35 males (50.7%) and 3 females (21.4%) in their respective age groups living below the poverty level.
| Age Bracket | Male | Female |
| Under 5 Years | 0 (0.0%) | 0 (0.0%) |
| 5 Years | 0 (0.0%) | 0 (0.0%) |
| 6 to 11 Years | 0 (0.0%) | 3 (21.4%) |
| 12 to 14 Years | 0 (0.0%) | 0 (0.0%) |
| 15 Years | 0 (0.0%) | 0 (0.0%) |
| 16 and 17 Years | 0 (0.0%) | 0 (0.0%) |
| 18 to 24 Years | 2 (4.4%) | 4 (20.0%) |
| 25 to 34 Years | 35 (50.7%) | 0 (0.0%) |
| 35 to 44 Years | 0 (0.0%) | 0 (0.0%) |
| 45 to 54 Years | 3 (7.7%) | 0 (0.0%) |
| 55 to 64 Years | 0 (0.0%) | 16 (12.0%) |
| 65 to 74 Years | 2 (2.1%) | 3 (2.9%) |
| 75 Years and over | 0 (0.0%) | 8 (10.8%) |
| Total | 42 (7.7%) | 34 (5.6%) |
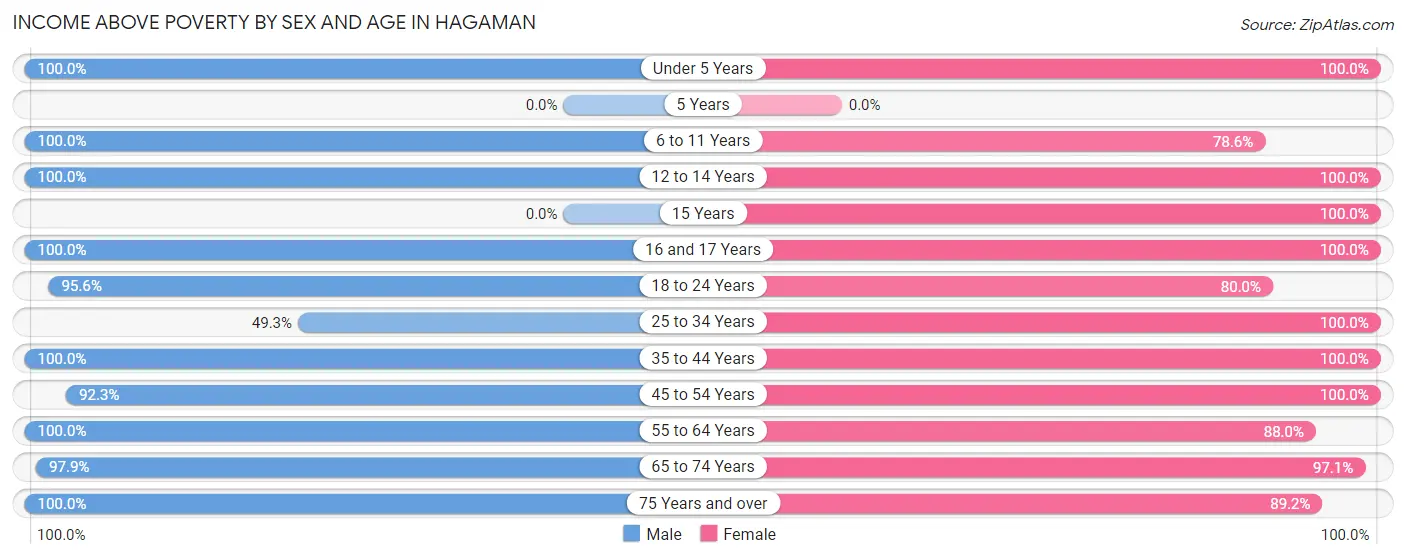
Income Above Poverty by Sex and Age in Hagaman
According to the poverty statistics in Hagaman, males aged under 5 years and females aged under 5 years are the age groups that are most secure financially, with 100.0% of males and 100.0% of females in these age groups living above the poverty line.
| Age Bracket | Male | Female |
| Under 5 Years | 23 (100.0%) | 33 (100.0%) |
| 5 Years | 0 (0.0%) | 0 (0.0%) |
| 6 to 11 Years | 7 (100.0%) | 11 (78.6%) |
| 12 to 14 Years | 30 (100.0%) | 36 (100.0%) |
| 15 Years | 0 (0.0%) | 15 (100.0%) |
| 16 and 17 Years | 8 (100.0%) | 17 (100.0%) |
| 18 to 24 Years | 43 (95.6%) | 16 (80.0%) |
| 25 to 34 Years | 34 (49.3%) | 40 (100.0%) |
| 35 to 44 Years | 83 (100.0%) | 75 (100.0%) |
| 45 to 54 Years | 36 (92.3%) | 50 (100.0%) |
| 55 to 64 Years | 85 (100.0%) | 117 (88.0%) |
| 65 to 74 Years | 91 (97.9%) | 101 (97.1%) |
| 75 Years and over | 63 (100.0%) | 66 (89.2%) |
| Total | 503 (92.3%) | 577 (94.4%) |
Income Below Poverty Among Married-Couple Families in Hagaman
| Children | Above Poverty | Below Poverty |
| No Children | 142 (100.0%) | 0 (0.0%) |
| 1 or 2 Children | 58 (100.0%) | 0 (0.0%) |
| 3 or 4 Children | 0 (0.0%) | 0 (0.0%) |
| 5 or more Children | 0 (0.0%) | 0 (0.0%) |
| Total | 200 (100.0%) | 0 (0.0%) |
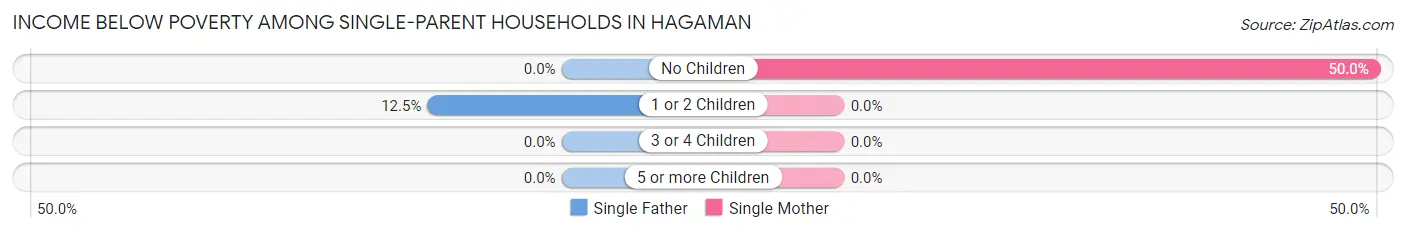
Income Below Poverty Among Single-Parent Households in Hagaman
According to the poverty data in Hagaman, 9.7% or 3 single-father households and 27.1% or 16 single-mother households are living below the poverty line. Among single-father households, those with 1 or 2 children have the highest poverty rate, with 3 households (12.5%) experiencing poverty. Likewise, among single-mother households, those with no children have the highest poverty rate, with 16 households (50.0%) falling below the poverty line.
| Children | Single Father | Single Mother |
| No Children | 0 (0.0%) | 16 (50.0%) |
| 1 or 2 Children | 3 (12.5%) | 0 (0.0%) |
| 3 or 4 Children | 0 (0.0%) | 0 (0.0%) |
| 5 or more Children | 0 (0.0%) | 0 (0.0%) |
| Total | 3 (9.7%) | 16 (27.1%) |
Income Below Poverty Among Married-Couple vs Single-Parent Households in Hagaman
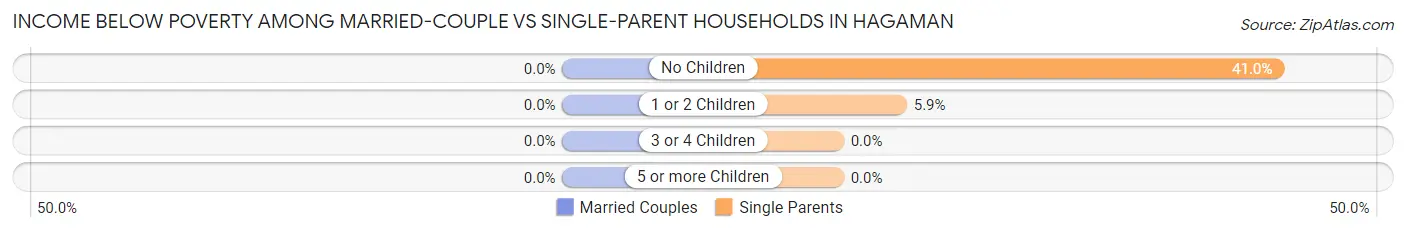
| Children | Married-Couple Families | Single-Parent Households |
| No Children | 0 (0.0%) | 16 (41.0%) |
| 1 or 2 Children | 0 (0.0%) | 3 (5.9%) |
| 3 or 4 Children | 0 (0.0%) | 0 (0.0%) |
| 5 or more Children | 0 (0.0%) | 0 (0.0%) |
| Total | 0 (0.0%) | 19 (21.1%) |
Employment Characteristics in Hagaman
Employment by Class of Employer in Hagaman
Among the 538 employed individuals in Hagaman, private company employees (319 | 59.3%), not-for-profit organizations (93 | 17.3%), and self-employed (not incorporated) (50 | 9.3%) make up the most common classes of employment.
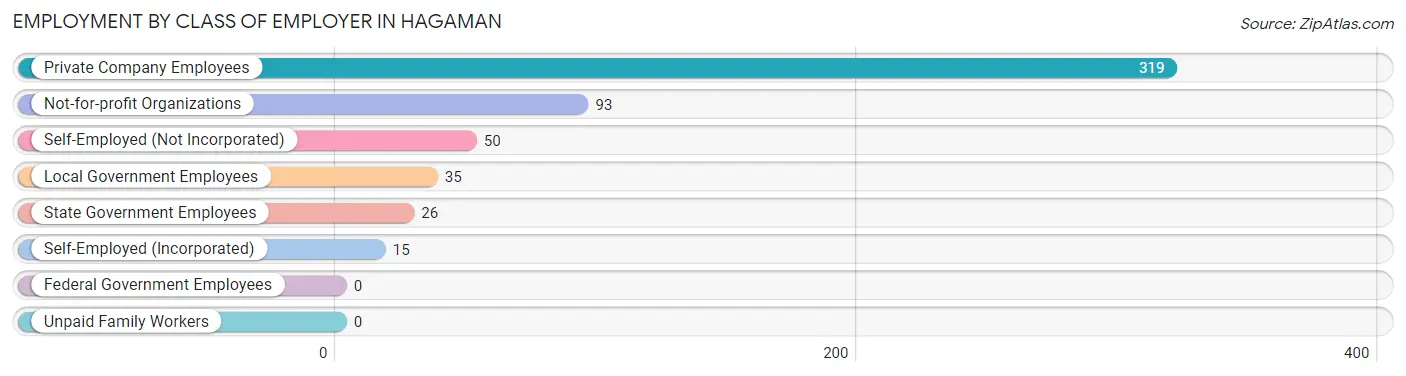
| Employer Class | # Employees | % Employees |
| Private Company Employees | 319 | 59.3% |
| Self-Employed (Incorporated) | 15 | 2.8% |
| Self-Employed (Not Incorporated) | 50 | 9.3% |
| Not-for-profit Organizations | 93 | 17.3% |
| Local Government Employees | 35 | 6.5% |
| State Government Employees | 26 | 4.8% |
| Federal Government Employees | 0 | 0.0% |
| Unpaid Family Workers | 0 | 0.0% |
| Total | 538 | 100.0% |
Employment Status by Age in Hagaman
According to the labor force statistics for Hagaman, out of the total population over 16 years of age (998), 58.6% or 585 individuals are in the labor force, with 2.7% or 16 of them unemployed. The age group with the highest labor force participation rate is 35 to 44 years, with 94.3% or 149 individuals in the labor force. Within the labor force, the 30 to 34 years age range has the highest percentage of unemployed individuals, with 23.1% or 9 of them being unemployed.
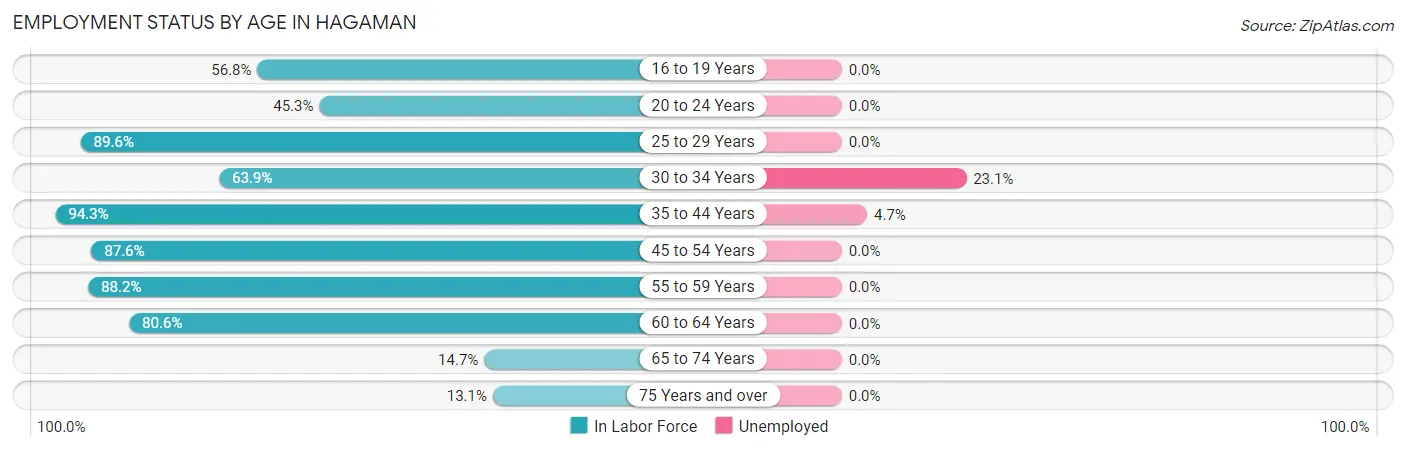
| Age Bracket | In Labor Force | Unemployed |
| 16 to 19 Years | 21 (56.8%) | 0 (0.0%) |
| 20 to 24 Years | 24 (45.3%) | 0 (0.0%) |
| 25 to 29 Years | 43 (89.6%) | 0 (0.0%) |
| 30 to 34 Years | 39 (63.9%) | 9 (23.1%) |
| 35 to 44 Years | 149 (94.3%) | 7 (4.7%) |
| 45 to 54 Years | 78 (87.6%) | 0 (0.0%) |
| 55 to 59 Years | 97 (88.2%) | 0 (0.0%) |
| 60 to 64 Years | 87 (80.6%) | 0 (0.0%) |
| 65 to 74 Years | 29 (14.7%) | 0 (0.0%) |
| 75 Years and over | 18 (13.1%) | 0 (0.0%) |
| Total | 585 (58.6%) | 16 (2.7%) |
Employment Status by Educational Attainment in Hagaman
According to labor force statistics for Hagaman, 85.9% of individuals (493) out of the total population between 25 and 64 years of age (574) are in the labor force, with 3.2% or 16 of them being unemployed. The group with the highest labor force participation rate are those with the educational attainment of bachelor's degree or higher, with 95.0% or 170 individuals in the labor force. Within the labor force, individuals with college / associate degree education have the highest percentage of unemployment, with 4.1% or 9 of them being unemployed.
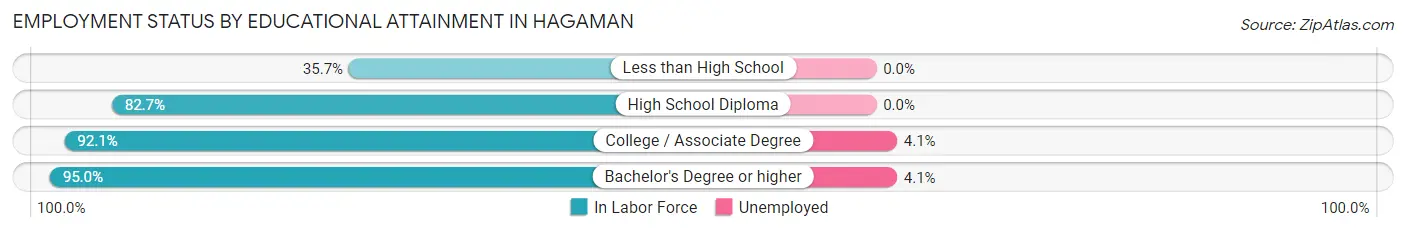
| Educational Attainment | In Labor Force | Unemployed |
| Less than High School | 20 (35.7%) | 0 (0.0%) |
| High School Diploma | 81 (82.7%) | 0 (0.0%) |
| College / Associate Degree | 222 (92.1%) | 10 (4.1%) |
| Bachelor's Degree or higher | 170 (95.0%) | 7 (4.1%) |
| Total | 493 (85.9%) | 18 (3.2%) |
Employment Occupations by Sex in Hagaman
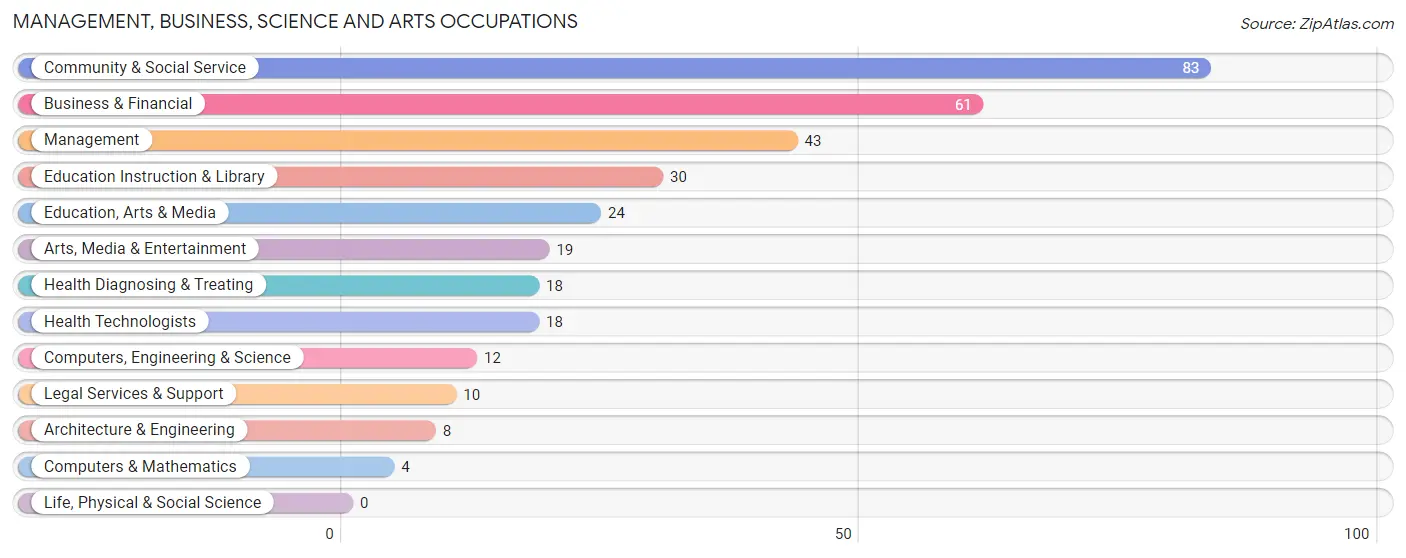
Management, Business, Science and Arts Occupations
The most common Management, Business, Science and Arts occupations in Hagaman are Community & Social Service (83 | 14.6%), Business & Financial (61 | 10.7%), Management (43 | 7.6%), Education Instruction & Library (30 | 5.3%), and Education, Arts & Media (24 | 4.2%).
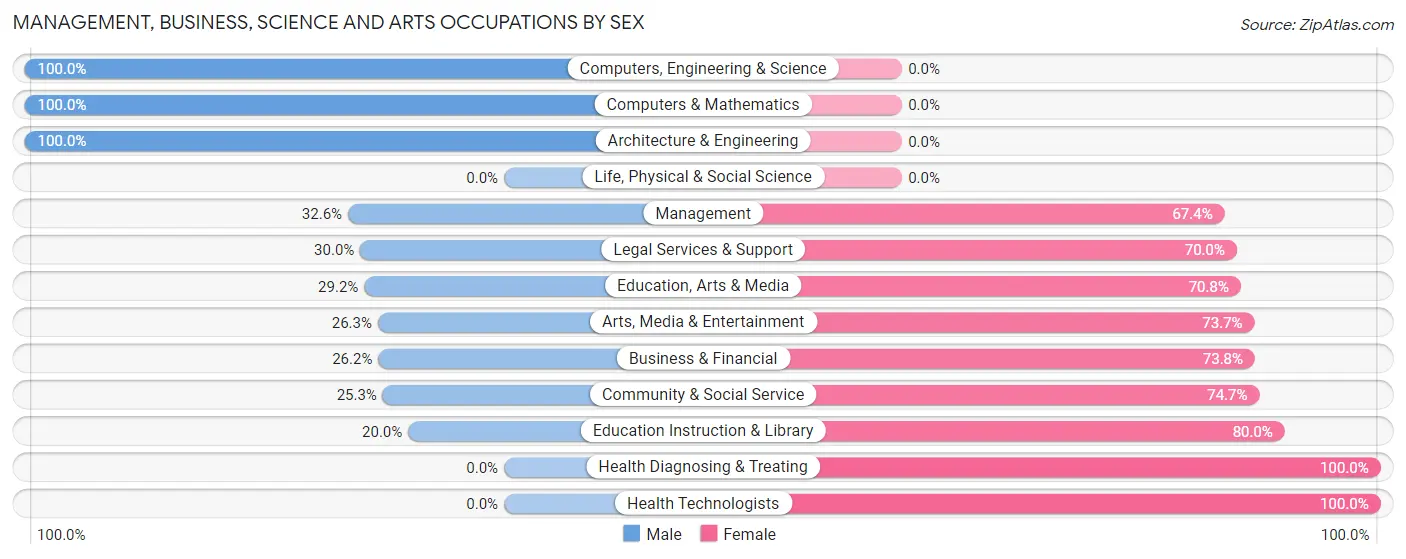
Management, Business, Science and Arts Occupations by Sex
Within the Management, Business, Science and Arts occupations in Hagaman, the most male-oriented occupations are Computers, Engineering & Science (100.0%), Computers & Mathematics (100.0%), and Architecture & Engineering (100.0%), while the most female-oriented occupations are Health Diagnosing & Treating (100.0%), Health Technologists (100.0%), and Education Instruction & Library (80.0%).
| Occupation | Male | Female |
| Management | 14 (32.6%) | 29 (67.4%) |
| Business & Financial | 16 (26.2%) | 45 (73.8%) |
| Computers, Engineering & Science | 12 (100.0%) | 0 (0.0%) |
| Computers & Mathematics | 4 (100.0%) | 0 (0.0%) |
| Architecture & Engineering | 8 (100.0%) | 0 (0.0%) |
| Life, Physical & Social Science | 0 (0.0%) | 0 (0.0%) |
| Community & Social Service | 21 (25.3%) | 62 (74.7%) |
| Education, Arts & Media | 7 (29.2%) | 17 (70.8%) |
| Legal Services & Support | 3 (30.0%) | 7 (70.0%) |
| Education Instruction & Library | 6 (20.0%) | 24 (80.0%) |
| Arts, Media & Entertainment | 5 (26.3%) | 14 (73.7%) |
| Health Diagnosing & Treating | 0 (0.0%) | 18 (100.0%) |
| Health Technologists | 0 (0.0%) | 18 (100.0%) |
| Total (Category) | 63 (29.0%) | 154 (71.0%) |
| Total (Overall) | 264 (46.4%) | 305 (53.6%) |
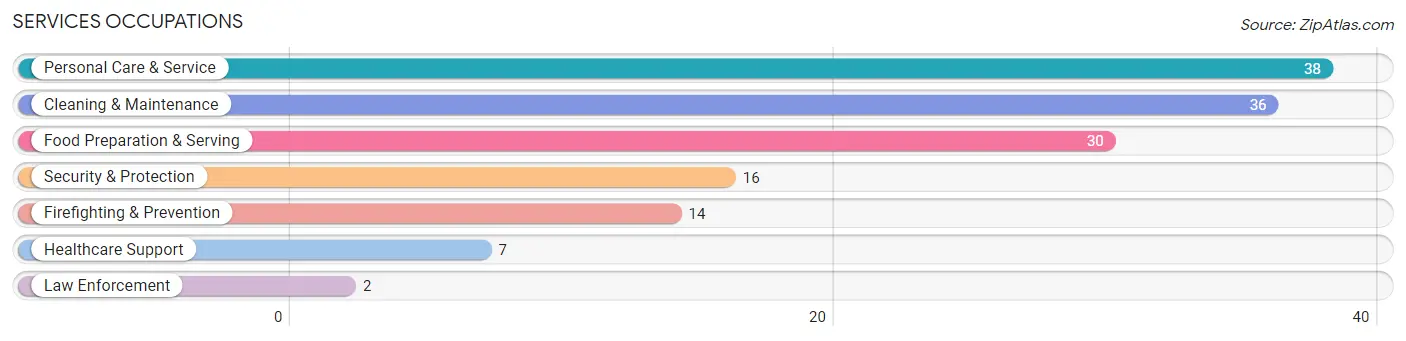
Services Occupations
The most common Services occupations in Hagaman are Personal Care & Service (38 | 6.7%), Cleaning & Maintenance (36 | 6.3%), Food Preparation & Serving (30 | 5.3%), Security & Protection (16 | 2.8%), and Firefighting & Prevention (14 | 2.5%).
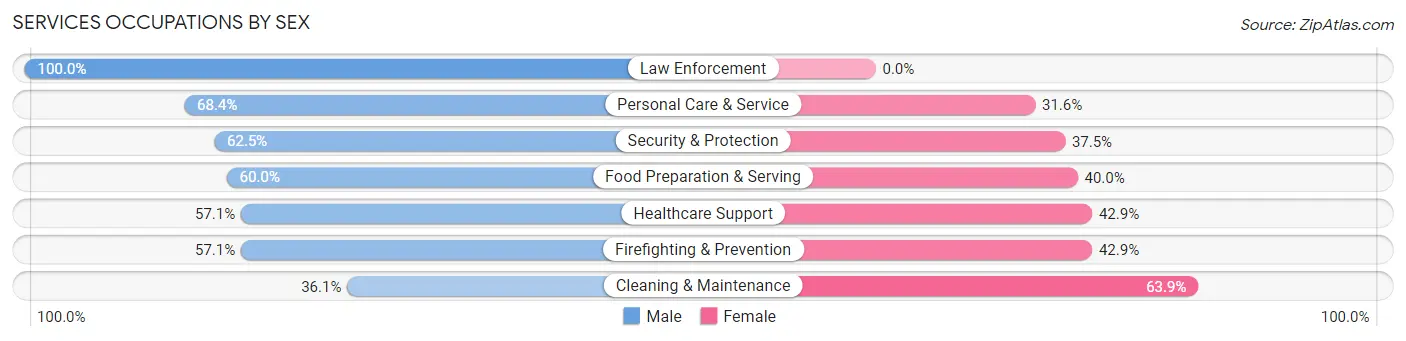
Services Occupations by Sex
Within the Services occupations in Hagaman, the most male-oriented occupations are Law Enforcement (100.0%), Personal Care & Service (68.4%), and Security & Protection (62.5%), while the most female-oriented occupations are Cleaning & Maintenance (63.9%), Healthcare Support (42.9%), and Firefighting & Prevention (42.9%).
| Occupation | Male | Female |
| Healthcare Support | 4 (57.1%) | 3 (42.9%) |
| Security & Protection | 10 (62.5%) | 6 (37.5%) |
| Firefighting & Prevention | 8 (57.1%) | 6 (42.9%) |
| Law Enforcement | 2 (100.0%) | 0 (0.0%) |
| Food Preparation & Serving | 18 (60.0%) | 12 (40.0%) |
| Cleaning & Maintenance | 13 (36.1%) | 23 (63.9%) |
| Personal Care & Service | 26 (68.4%) | 12 (31.6%) |
| Total (Category) | 71 (55.9%) | 56 (44.1%) |
| Total (Overall) | 264 (46.4%) | 305 (53.6%) |
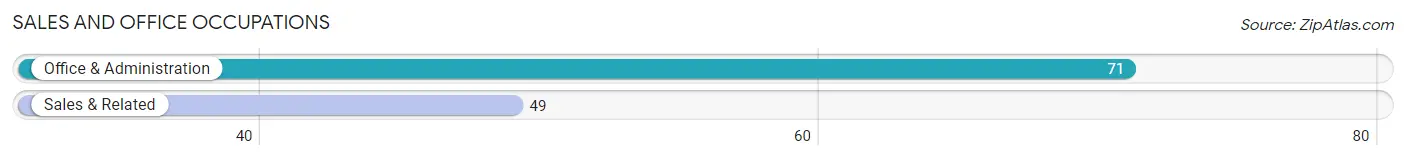
Sales and Office Occupations
The most common Sales and Office occupations in Hagaman are Office & Administration (71 | 12.5%), and Sales & Related (49 | 8.6%).
Sales and Office Occupations by Sex
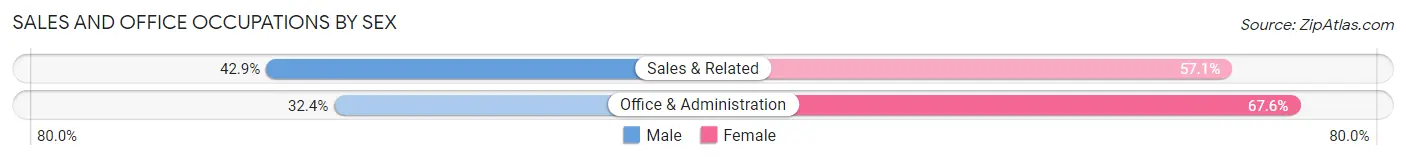
| Occupation | Male | Female |
| Sales & Related | 21 (42.9%) | 28 (57.1%) |
| Office & Administration | 23 (32.4%) | 48 (67.6%) |
| Total (Category) | 44 (36.7%) | 76 (63.3%) |
| Total (Overall) | 264 (46.4%) | 305 (53.6%) |
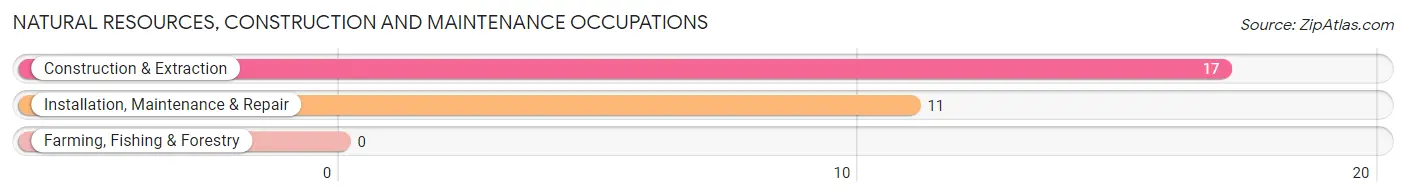
Natural Resources, Construction and Maintenance Occupations
The most common Natural Resources, Construction and Maintenance occupations in Hagaman are Construction & Extraction (17 | 3.0%), and Installation, Maintenance & Repair (11 | 1.9%).
Natural Resources, Construction and Maintenance Occupations by Sex
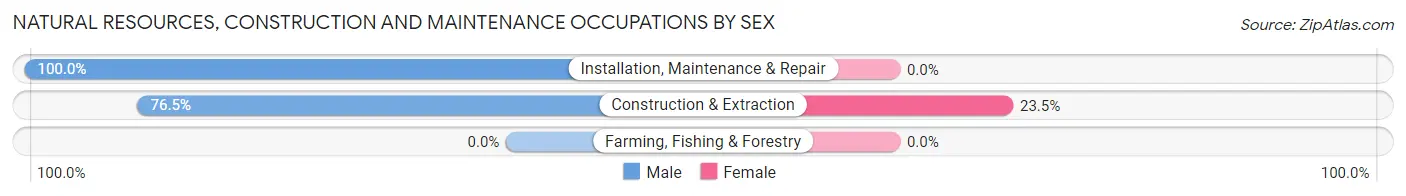
| Occupation | Male | Female |
| Farming, Fishing & Forestry | 0 (0.0%) | 0 (0.0%) |
| Construction & Extraction | 13 (76.5%) | 4 (23.5%) |
| Installation, Maintenance & Repair | 11 (100.0%) | 0 (0.0%) |
| Total (Category) | 24 (85.7%) | 4 (14.3%) |
| Total (Overall) | 264 (46.4%) | 305 (53.6%) |
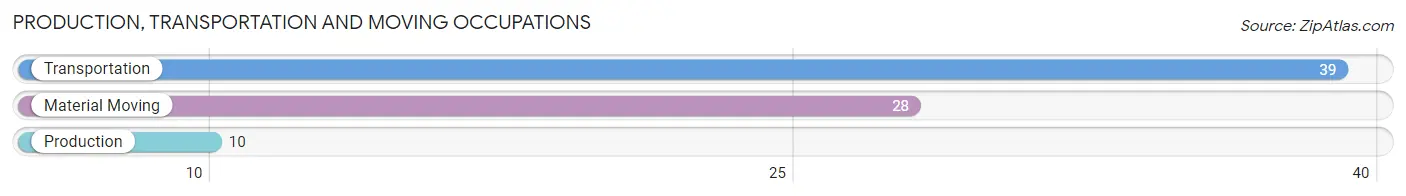
Production, Transportation and Moving Occupations
The most common Production, Transportation and Moving occupations in Hagaman are Transportation (39 | 6.9%), Material Moving (28 | 4.9%), and Production (10 | 1.8%).
Production, Transportation and Moving Occupations by Sex
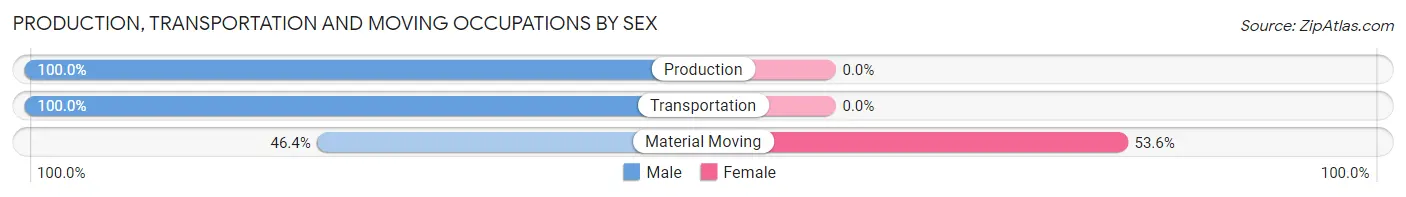
| Occupation | Male | Female |
| Production | 10 (100.0%) | 0 (0.0%) |
| Transportation | 39 (100.0%) | 0 (0.0%) |
| Material Moving | 13 (46.4%) | 15 (53.6%) |
| Total (Category) | 62 (80.5%) | 15 (19.5%) |
| Total (Overall) | 264 (46.4%) | 305 (53.6%) |
Employment Industries by Sex in Hagaman
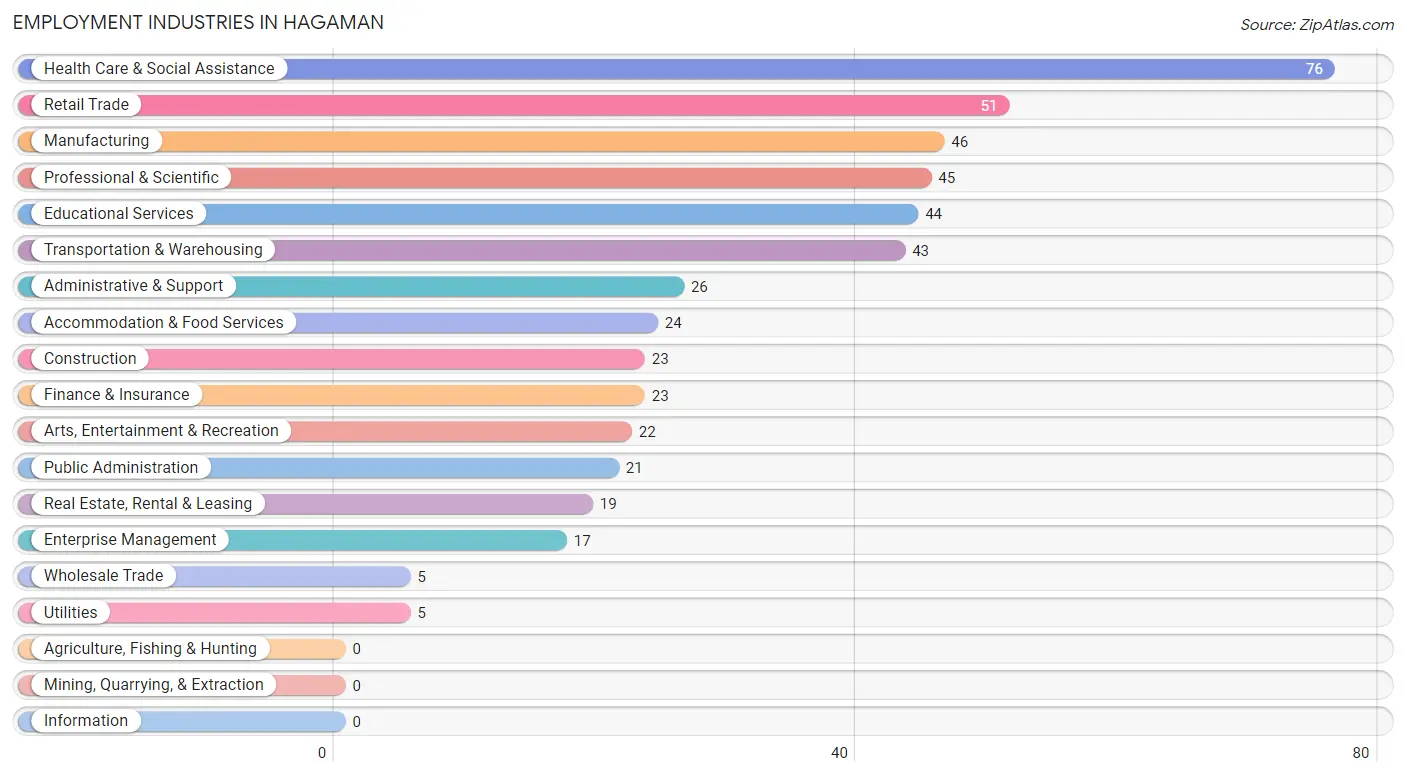
Employment Industries in Hagaman
The major employment industries in Hagaman include Health Care & Social Assistance (76 | 13.4%), Retail Trade (51 | 9.0%), Manufacturing (46 | 8.1%), Professional & Scientific (45 | 7.9%), and Educational Services (44 | 7.7%).
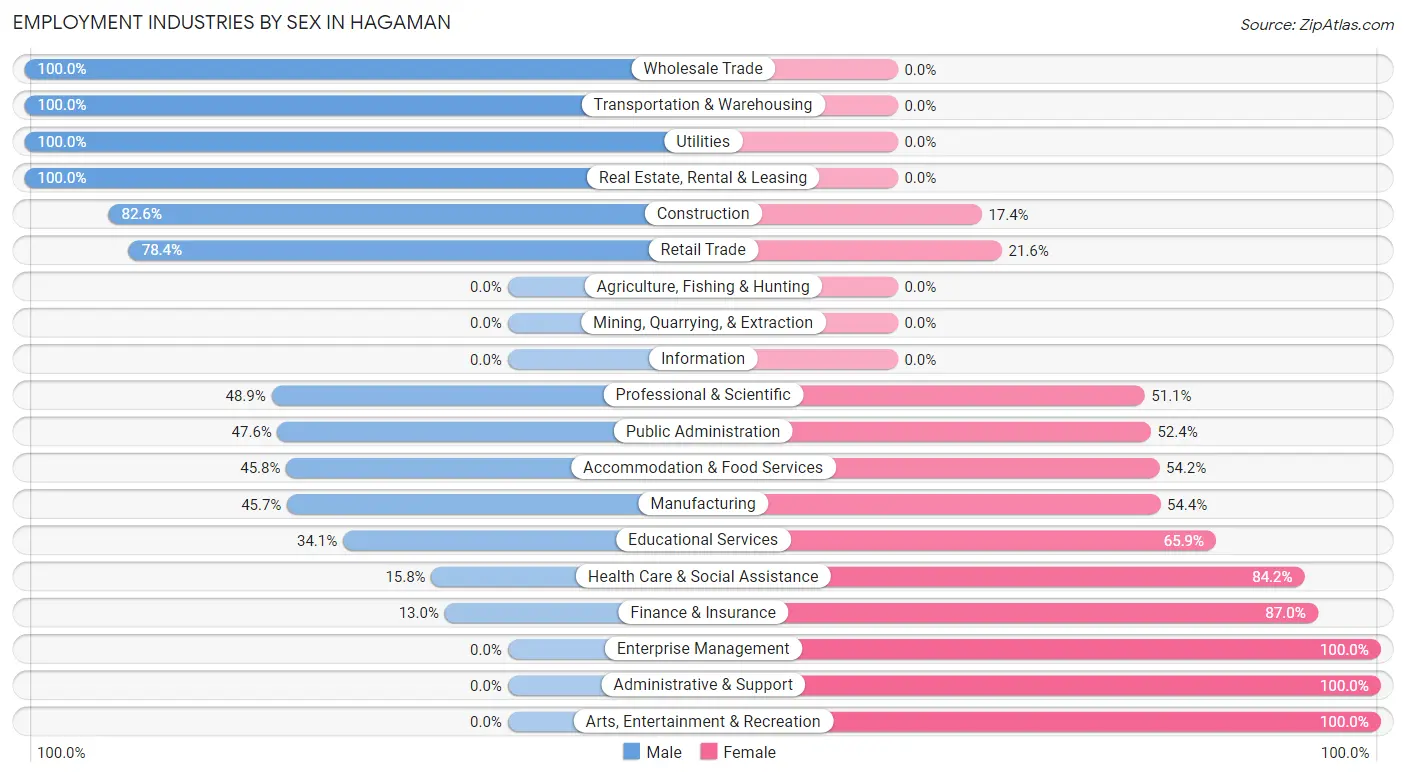
Employment Industries by Sex in Hagaman
The Hagaman industries that see more men than women are Wholesale Trade (100.0%), Transportation & Warehousing (100.0%), and Utilities (100.0%), whereas the industries that tend to have a higher number of women are Enterprise Management (100.0%), Administrative & Support (100.0%), and Arts, Entertainment & Recreation (100.0%).
| Industry | Male | Female |
| Agriculture, Fishing & Hunting | 0 (0.0%) | 0 (0.0%) |
| Mining, Quarrying, & Extraction | 0 (0.0%) | 0 (0.0%) |
| Construction | 19 (82.6%) | 4 (17.4%) |
| Manufacturing | 21 (45.7%) | 25 (54.3%) |
| Wholesale Trade | 5 (100.0%) | 0 (0.0%) |
| Retail Trade | 40 (78.4%) | 11 (21.6%) |
| Transportation & Warehousing | 43 (100.0%) | 0 (0.0%) |
| Utilities | 5 (100.0%) | 0 (0.0%) |
| Information | 0 (0.0%) | 0 (0.0%) |
| Finance & Insurance | 3 (13.0%) | 20 (87.0%) |
| Real Estate, Rental & Leasing | 19 (100.0%) | 0 (0.0%) |
| Professional & Scientific | 22 (48.9%) | 23 (51.1%) |
| Enterprise Management | 0 (0.0%) | 17 (100.0%) |
| Administrative & Support | 0 (0.0%) | 26 (100.0%) |
| Educational Services | 15 (34.1%) | 29 (65.9%) |
| Health Care & Social Assistance | 12 (15.8%) | 64 (84.2%) |
| Arts, Entertainment & Recreation | 0 (0.0%) | 22 (100.0%) |
| Accommodation & Food Services | 11 (45.8%) | 13 (54.2%) |
| Public Administration | 10 (47.6%) | 11 (52.4%) |
| Total | 264 (46.4%) | 305 (53.6%) |
Education in Hagaman
School Enrollment in Hagaman
The most common levels of schooling among the 178 students in Hagaman are high school (66 | 37.1%), middle school (56 | 31.5%), and college / undergraduate (42 | 23.6%).
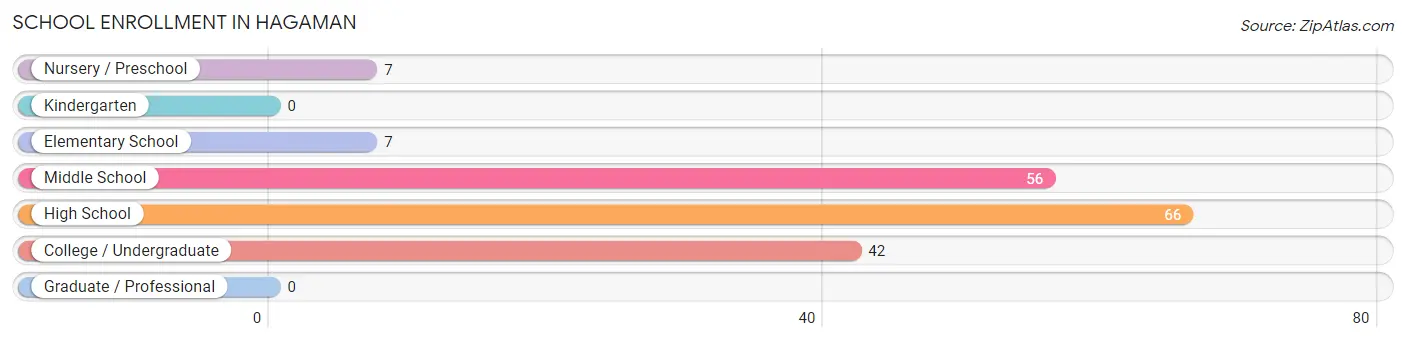
| School Level | # Students | % Students |
| Nursery / Preschool | 7 | 3.9% |
| Kindergarten | 0 | 0.0% |
| Elementary School | 7 | 3.9% |
| Middle School | 56 | 31.5% |
| High School | 66 | 37.1% |
| College / Undergraduate | 42 | 23.6% |
| Graduate / Professional | 0 | 0.0% |
| Total | 178 | 100.0% |
School Enrollment by Age by Funding Source in Hagaman
Out of a total of 178 students who are enrolled in schools in Hagaman, 13 (7.3%) attend a private institution, while the remaining 165 (92.7%) are enrolled in public schools. The age group of 3 to 4 year olds has the highest likelihood of being enrolled in private schools, with 7 (100.0% in the age bracket) enrolled. Conversely, the age group of 5 to 9 year old has the lowest likelihood of being enrolled in a private school, with 7 (100.0% in the age bracket) attending a public institution.
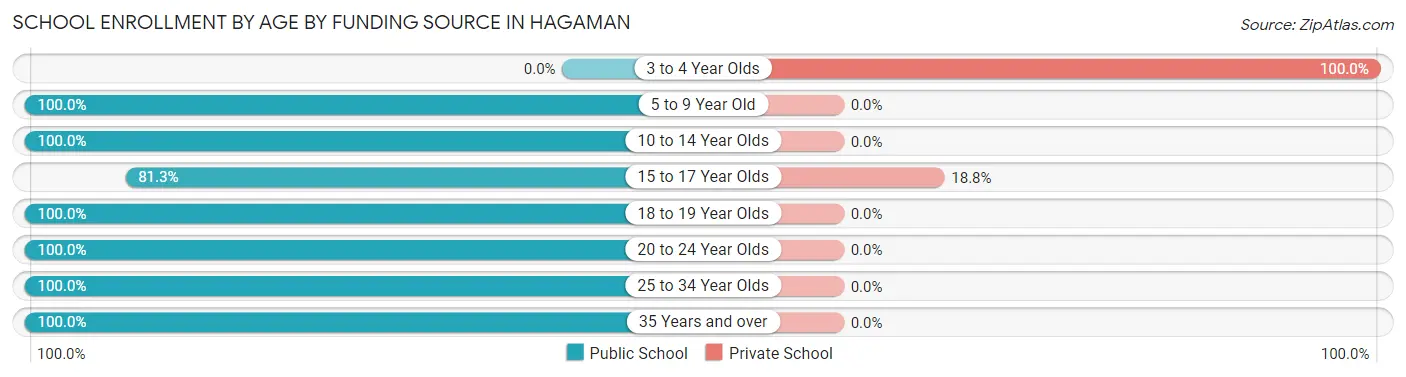
| Age Bracket | Public School | Private School |
| 3 to 4 Year Olds | 0 (0.0%) | 7 (100.0%) |
| 5 to 9 Year Old | 7 (100.0%) | 0 (0.0%) |
| 10 to 14 Year Olds | 80 (100.0%) | 0 (0.0%) |
| 15 to 17 Year Olds | 26 (81.2%) | 6 (18.8%) |
| 18 to 19 Year Olds | 10 (100.0%) | 0 (0.0%) |
| 20 to 24 Year Olds | 33 (100.0%) | 0 (0.0%) |
| 25 to 34 Year Olds | 7 (100.0%) | 0 (0.0%) |
| 35 Years and over | 2 (100.0%) | 0 (0.0%) |
| Total | 165 (92.7%) | 13 (7.3%) |
Educational Attainment by Field of Study in Hagaman
Education (51 | 18.5%), social sciences (45 | 16.3%), science & technology (37 | 13.4%), business (27 | 9.8%), and arts & humanities (26 | 9.4%) are the most common fields of study among 276 individuals in Hagaman who have obtained a bachelor's degree or higher.
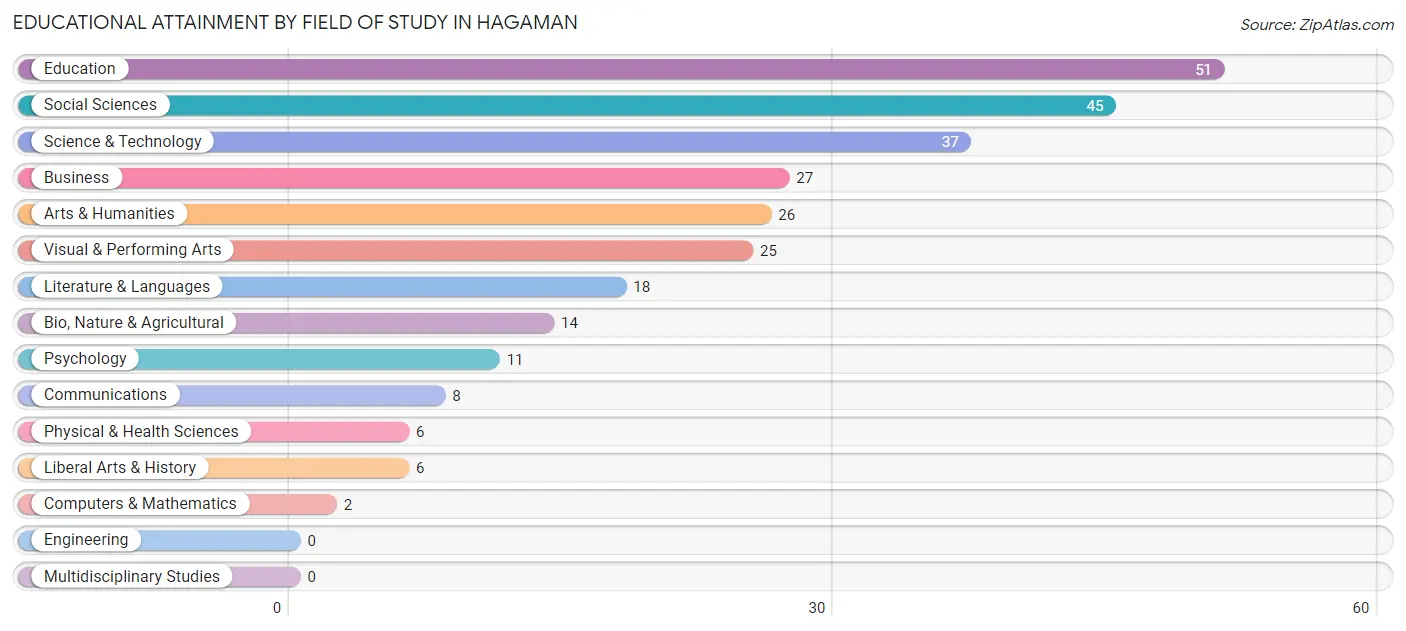
| Field of Study | # Graduates | % Graduates |
| Computers & Mathematics | 2 | 0.7% |
| Bio, Nature & Agricultural | 14 | 5.1% |
| Physical & Health Sciences | 6 | 2.2% |
| Psychology | 11 | 4.0% |
| Social Sciences | 45 | 16.3% |
| Engineering | 0 | 0.0% |
| Multidisciplinary Studies | 0 | 0.0% |
| Science & Technology | 37 | 13.4% |
| Business | 27 | 9.8% |
| Education | 51 | 18.5% |
| Literature & Languages | 18 | 6.5% |
| Liberal Arts & History | 6 | 2.2% |
| Visual & Performing Arts | 25 | 9.1% |
| Communications | 8 | 2.9% |
| Arts & Humanities | 26 | 9.4% |
| Total | 276 | 100.0% |
Transportation & Commute in Hagaman
Vehicle Availability by Sex in Hagaman
The most prevalent vehicle ownership categories in Hagaman are males with 2 vehicles (135, accounting for 53.1%) and females with 2 vehicles (153, making up 47.5%).
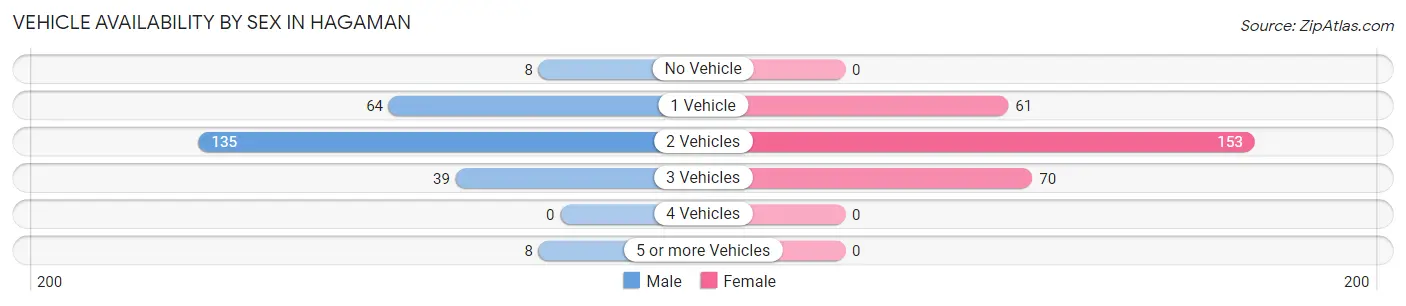
| Vehicles Available | Male | Female |
| No Vehicle | 8 (3.2%) | 0 (0.0%) |
| 1 Vehicle | 64 (25.2%) | 61 (21.5%) |
| 2 Vehicles | 135 (53.1%) | 153 (53.9%) |
| 3 Vehicles | 39 (15.3%) | 70 (24.6%) |
| 4 Vehicles | 0 (0.0%) | 0 (0.0%) |
| 5 or more Vehicles | 8 (3.2%) | 0 (0.0%) |
| Total | 254 (100.0%) | 284 (100.0%) |
Commute Time in Hagaman
The most frequently occuring commute durations in Hagaman are 5 to 9 minutes (117 commuters, 23.4%), 10 to 14 minutes (82 commuters, 16.4%), and 15 to 19 minutes (62 commuters, 12.4%).
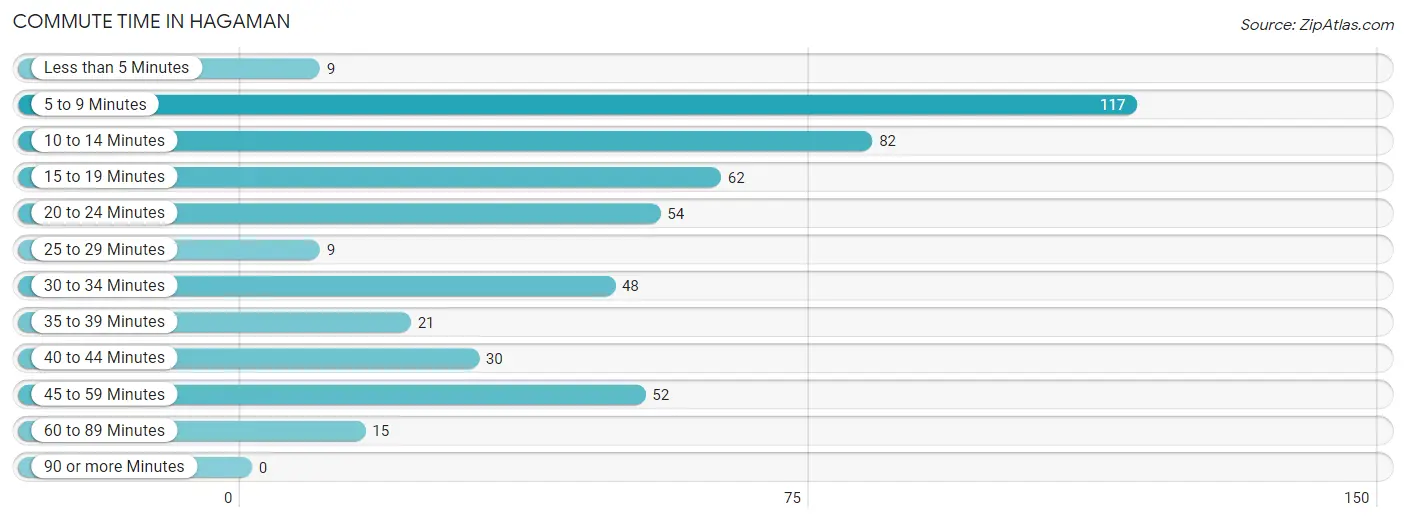
| Commute Time | # Commuters | % Commuters |
| Less than 5 Minutes | 9 | 1.8% |
| 5 to 9 Minutes | 117 | 23.4% |
| 10 to 14 Minutes | 82 | 16.4% |
| 15 to 19 Minutes | 62 | 12.4% |
| 20 to 24 Minutes | 54 | 10.8% |
| 25 to 29 Minutes | 9 | 1.8% |
| 30 to 34 Minutes | 48 | 9.6% |
| 35 to 39 Minutes | 21 | 4.2% |
| 40 to 44 Minutes | 30 | 6.0% |
| 45 to 59 Minutes | 52 | 10.4% |
| 60 to 89 Minutes | 15 | 3.0% |
| 90 or more Minutes | 0 | 0.0% |
Commute Time by Sex in Hagaman
The most common commute times in Hagaman are 5 to 9 minutes (46 commuters, 19.1%) for males and 5 to 9 minutes (71 commuters, 27.5%) for females.
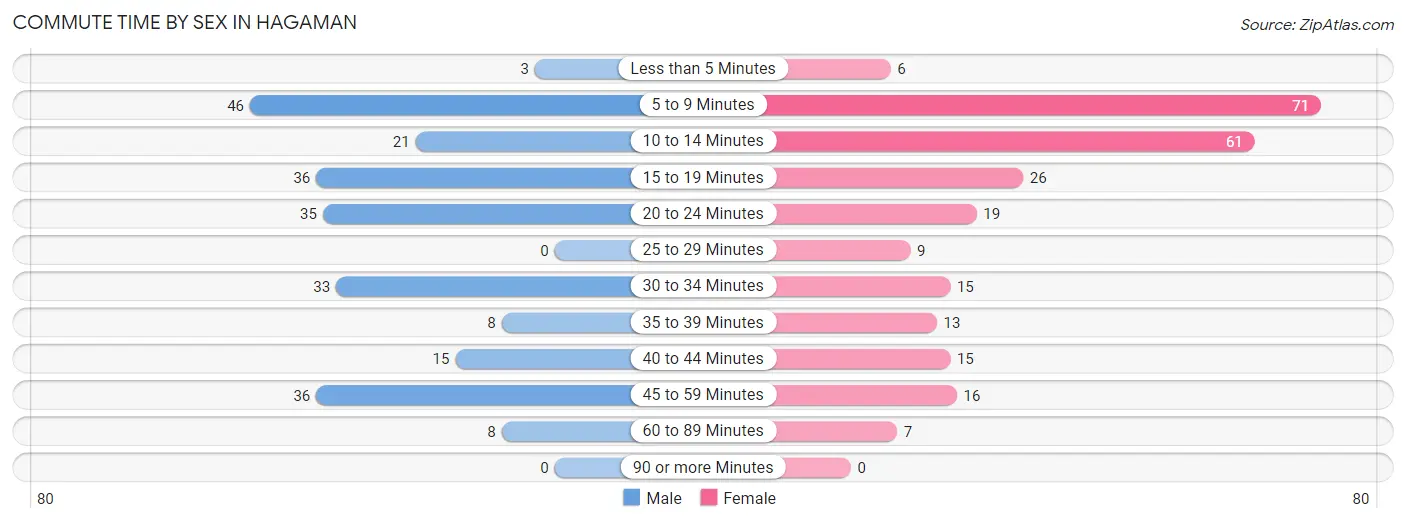
| Commute Time | Male | Female |
| Less than 5 Minutes | 3 (1.2%) | 6 (2.3%) |
| 5 to 9 Minutes | 46 (19.1%) | 71 (27.5%) |
| 10 to 14 Minutes | 21 (8.7%) | 61 (23.6%) |
| 15 to 19 Minutes | 36 (14.9%) | 26 (10.1%) |
| 20 to 24 Minutes | 35 (14.5%) | 19 (7.4%) |
| 25 to 29 Minutes | 0 (0.0%) | 9 (3.5%) |
| 30 to 34 Minutes | 33 (13.7%) | 15 (5.8%) |
| 35 to 39 Minutes | 8 (3.3%) | 13 (5.0%) |
| 40 to 44 Minutes | 15 (6.2%) | 15 (5.8%) |
| 45 to 59 Minutes | 36 (14.9%) | 16 (6.2%) |
| 60 to 89 Minutes | 8 (3.3%) | 7 (2.7%) |
| 90 or more Minutes | 0 (0.0%) | 0 (0.0%) |
Time of Departure to Work by Sex in Hagaman
The most frequent times of departure to work in Hagaman are 7:00 AM to 7:29 AM (59, 24.5%) for males and 7:00 AM to 7:29 AM (44, 17.1%) for females.
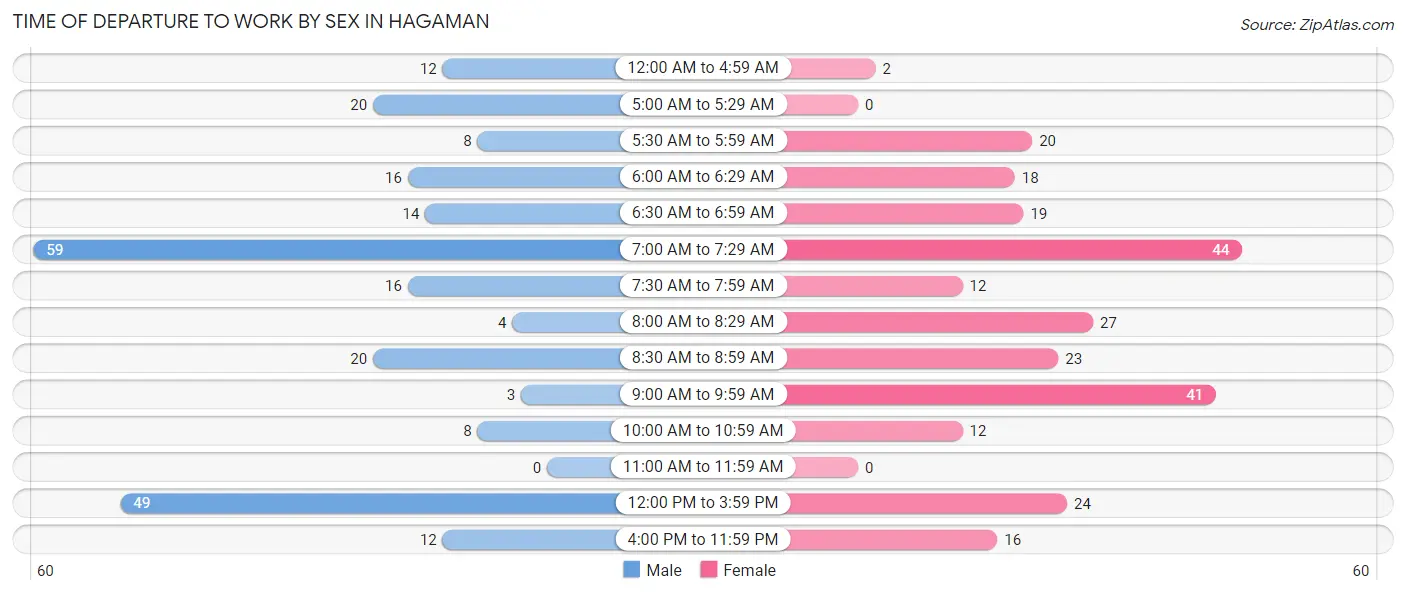
| Time of Departure | Male | Female |
| 12:00 AM to 4:59 AM | 12 (5.0%) | 2 (0.8%) |
| 5:00 AM to 5:29 AM | 20 (8.3%) | 0 (0.0%) |
| 5:30 AM to 5:59 AM | 8 (3.3%) | 20 (7.7%) |
| 6:00 AM to 6:29 AM | 16 (6.6%) | 18 (7.0%) |
| 6:30 AM to 6:59 AM | 14 (5.8%) | 19 (7.4%) |
| 7:00 AM to 7:29 AM | 59 (24.5%) | 44 (17.1%) |
| 7:30 AM to 7:59 AM | 16 (6.6%) | 12 (4.6%) |
| 8:00 AM to 8:29 AM | 4 (1.7%) | 27 (10.5%) |
| 8:30 AM to 8:59 AM | 20 (8.3%) | 23 (8.9%) |
| 9:00 AM to 9:59 AM | 3 (1.2%) | 41 (15.9%) |
| 10:00 AM to 10:59 AM | 8 (3.3%) | 12 (4.6%) |
| 11:00 AM to 11:59 AM | 0 (0.0%) | 0 (0.0%) |
| 12:00 PM to 3:59 PM | 49 (20.3%) | 24 (9.3%) |
| 4:00 PM to 11:59 PM | 12 (5.0%) | 16 (6.2%) |
| Total | 241 (100.0%) | 258 (100.0%) |
Housing Occupancy in Hagaman
Occupancy by Ownership in Hagaman
Of the total 560 dwellings in Hagaman, owner-occupied units account for 462 (82.5%), while renter-occupied units make up 98 (17.5%).
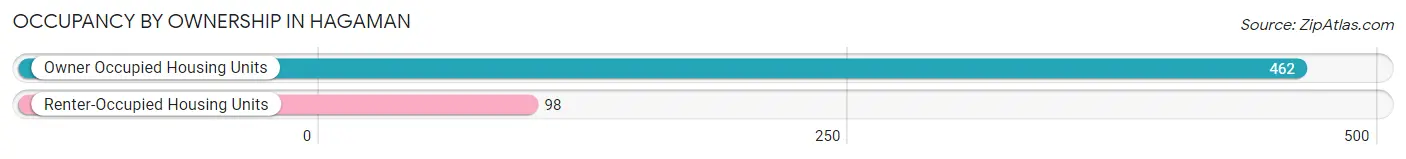
| Occupancy | # Housing Units | % Housing Units |
| Owner Occupied Housing Units | 462 | 82.5% |
| Renter-Occupied Housing Units | 98 | 17.5% |
| Total Occupied Housing Units | 560 | 100.0% |
Occupancy by Household Size in Hagaman
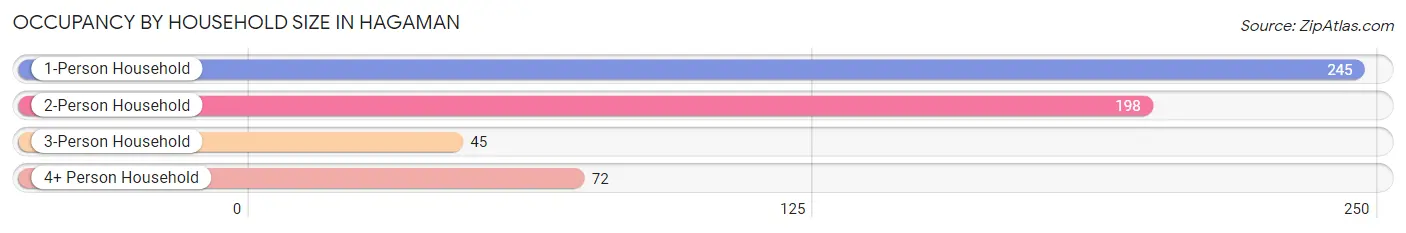
| Household Size | # Housing Units | % Housing Units |
| 1-Person Household | 245 | 43.8% |
| 2-Person Household | 198 | 35.4% |
| 3-Person Household | 45 | 8.0% |
| 4+ Person Household | 72 | 12.9% |
| Total Housing Units | 560 | 100.0% |
Occupancy by Ownership by Household Size in Hagaman
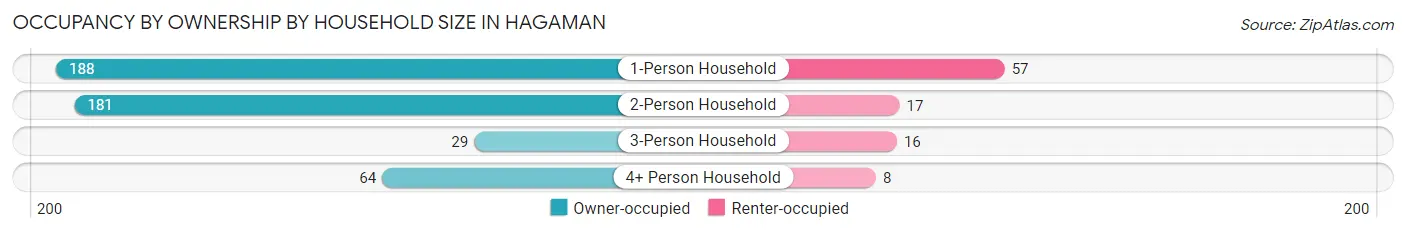
| Household Size | Owner-occupied | Renter-occupied |
| 1-Person Household | 188 (76.7%) | 57 (23.3%) |
| 2-Person Household | 181 (91.4%) | 17 (8.6%) |
| 3-Person Household | 29 (64.4%) | 16 (35.6%) |
| 4+ Person Household | 64 (88.9%) | 8 (11.1%) |
| Total Housing Units | 462 (82.5%) | 98 (17.5%) |
Occupancy by Educational Attainment in Hagaman
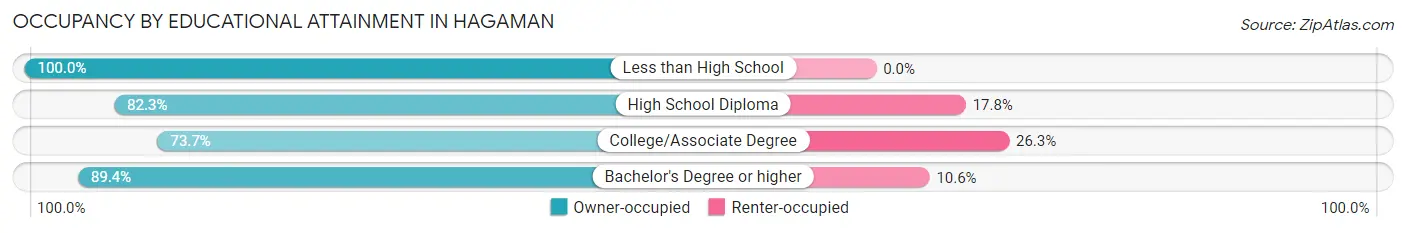
| Household Size | Owner-occupied | Renter-occupied |
| Less than High School | 25 (100.0%) | 0 (0.0%) |
| High School Diploma | 139 (82.3%) | 30 (17.7%) |
| College/Associate Degree | 137 (73.7%) | 49 (26.3%) |
| Bachelor's Degree or higher | 161 (89.4%) | 19 (10.6%) |
Occupancy by Age of Householder in Hagaman
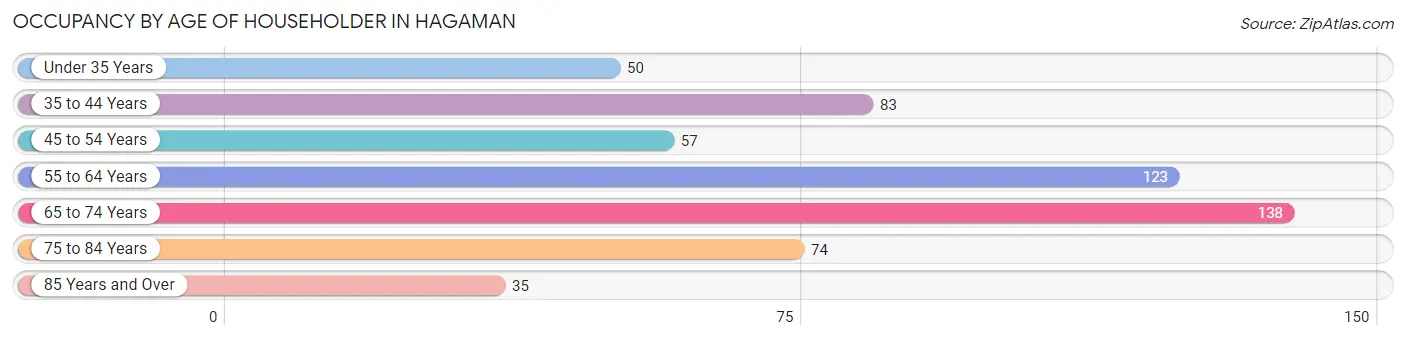
| Age Bracket | # Households | % Households |
| Under 35 Years | 50 | 8.9% |
| 35 to 44 Years | 83 | 14.8% |
| 45 to 54 Years | 57 | 10.2% |
| 55 to 64 Years | 123 | 22.0% |
| 65 to 74 Years | 138 | 24.6% |
| 75 to 84 Years | 74 | 13.2% |
| 85 Years and Over | 35 | 6.2% |
| Total | 560 | 100.0% |
Housing Finances in Hagaman
Median Income by Occupancy in Hagaman
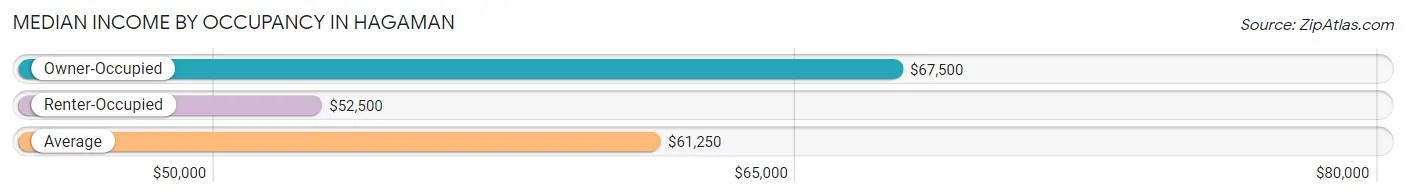
| Occupancy Type | # Households | Median Income |
| Owner-Occupied | 462 (82.5%) | $67,500 |
| Renter-Occupied | 98 (17.5%) | $52,500 |
| Average | 560 (100.0%) | $61,250 |
Occupancy by Householder Income Bracket in Hagaman
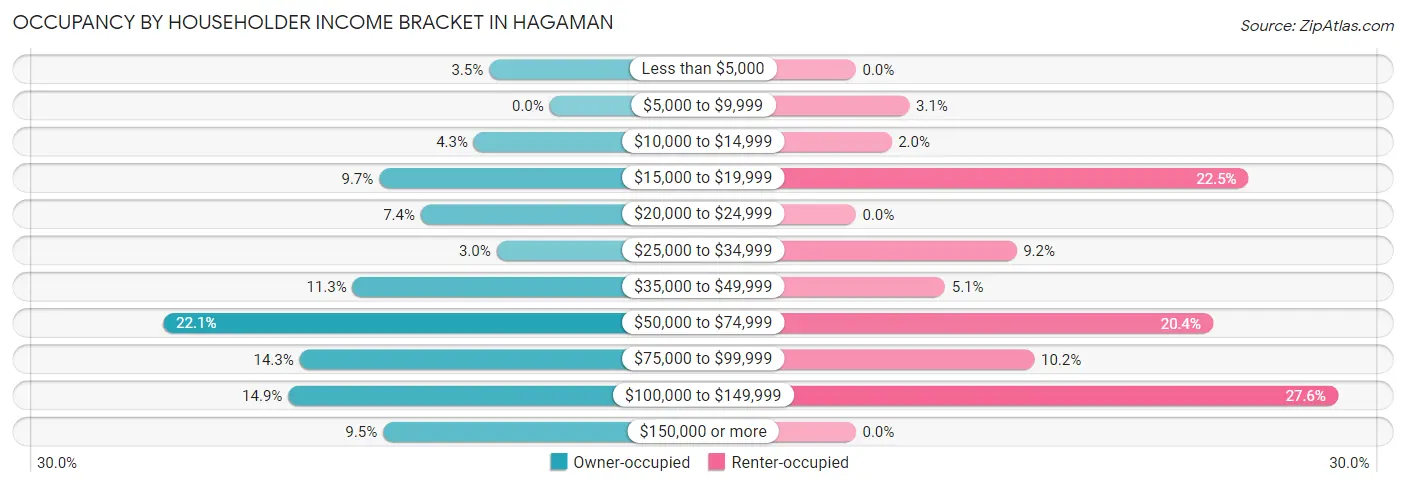
| Income Bracket | Owner-occupied | Renter-occupied |
| Less than $5,000 | 16 (3.5%) | 0 (0.0%) |
| $5,000 to $9,999 | 0 (0.0%) | 3 (3.1%) |
| $10,000 to $14,999 | 20 (4.3%) | 2 (2.0%) |
| $15,000 to $19,999 | 45 (9.7%) | 22 (22.5%) |
| $20,000 to $24,999 | 34 (7.4%) | 0 (0.0%) |
| $25,000 to $34,999 | 14 (3.0%) | 9 (9.2%) |
| $35,000 to $49,999 | 52 (11.3%) | 5 (5.1%) |
| $50,000 to $74,999 | 102 (22.1%) | 20 (20.4%) |
| $75,000 to $99,999 | 66 (14.3%) | 10 (10.2%) |
| $100,000 to $149,999 | 69 (14.9%) | 27 (27.6%) |
| $150,000 or more | 44 (9.5%) | 0 (0.0%) |
| Total | 462 (100.0%) | 98 (100.0%) |
Monthly Housing Cost Tiers in Hagaman
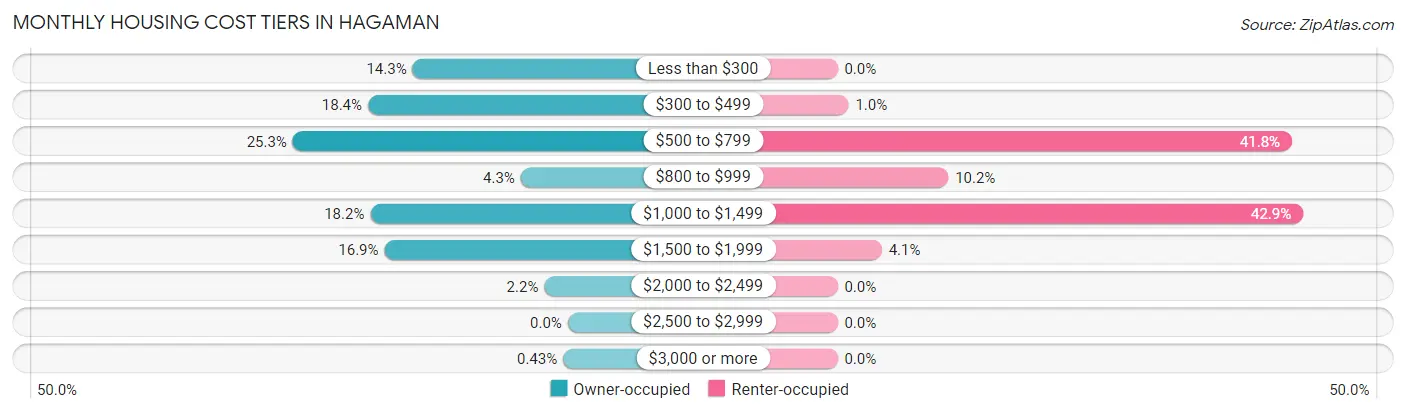
| Monthly Cost | Owner-occupied | Renter-occupied |
| Less than $300 | 66 (14.3%) | 0 (0.0%) |
| $300 to $499 | 85 (18.4%) | 1 (1.0%) |
| $500 to $799 | 117 (25.3%) | 41 (41.8%) |
| $800 to $999 | 20 (4.3%) | 10 (10.2%) |
| $1,000 to $1,499 | 84 (18.2%) | 42 (42.9%) |
| $1,500 to $1,999 | 78 (16.9%) | 4 (4.1%) |
| $2,000 to $2,499 | 10 (2.2%) | 0 (0.0%) |
| $2,500 to $2,999 | 0 (0.0%) | 0 (0.0%) |
| $3,000 or more | 2 (0.4%) | 0 (0.0%) |
| Total | 462 (100.0%) | 98 (100.0%) |
Physical Housing Characteristics in Hagaman
Housing Structures in Hagaman
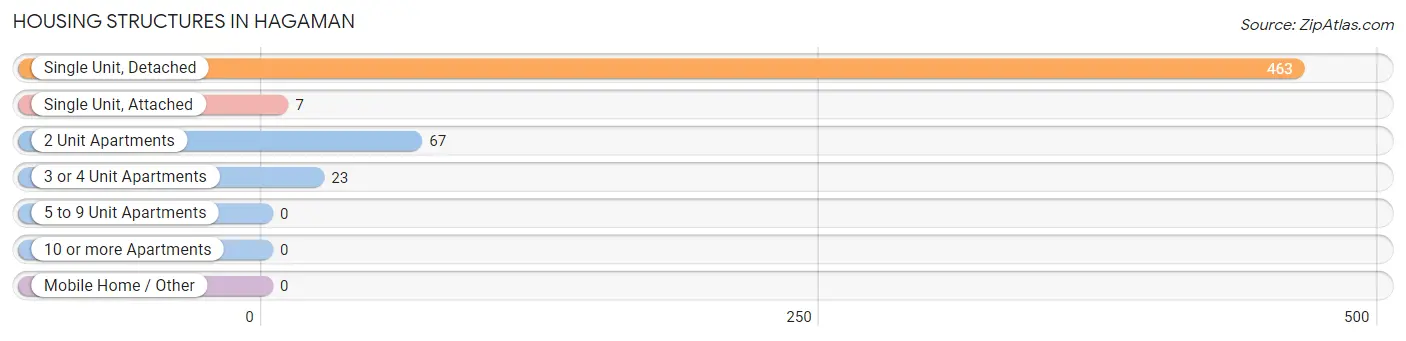
| Structure Type | # Housing Units | % Housing Units |
| Single Unit, Detached | 463 | 82.7% |
| Single Unit, Attached | 7 | 1.3% |
| 2 Unit Apartments | 67 | 12.0% |
| 3 or 4 Unit Apartments | 23 | 4.1% |
| 5 to 9 Unit Apartments | 0 | 0.0% |
| 10 or more Apartments | 0 | 0.0% |
| Mobile Home / Other | 0 | 0.0% |
| Total | 560 | 100.0% |
Housing Structures by Occupancy in Hagaman
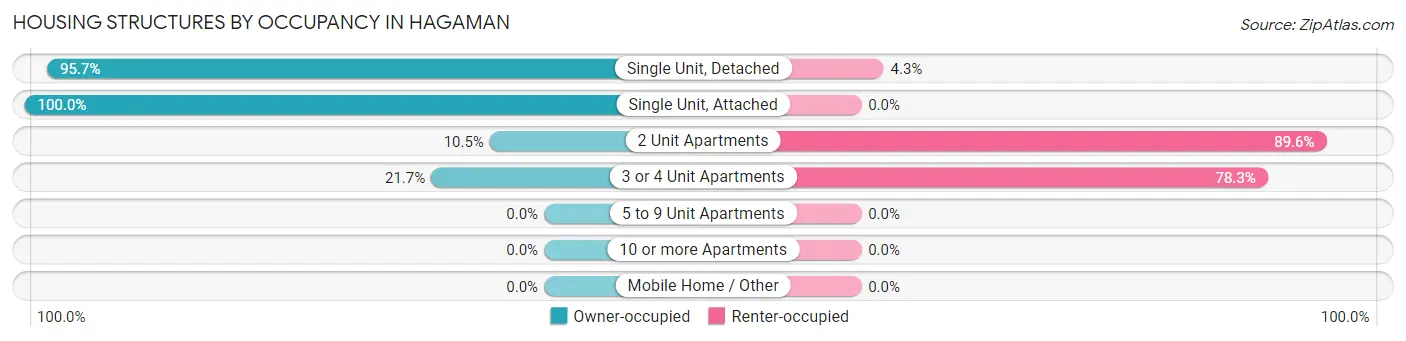
| Structure Type | Owner-occupied | Renter-occupied |
| Single Unit, Detached | 443 (95.7%) | 20 (4.3%) |
| Single Unit, Attached | 7 (100.0%) | 0 (0.0%) |
| 2 Unit Apartments | 7 (10.4%) | 60 (89.5%) |
| 3 or 4 Unit Apartments | 5 (21.7%) | 18 (78.3%) |
| 5 to 9 Unit Apartments | 0 (0.0%) | 0 (0.0%) |
| 10 or more Apartments | 0 (0.0%) | 0 (0.0%) |
| Mobile Home / Other | 0 (0.0%) | 0 (0.0%) |
| Total | 462 (82.5%) | 98 (17.5%) |
Housing Structures by Number of Rooms in Hagaman
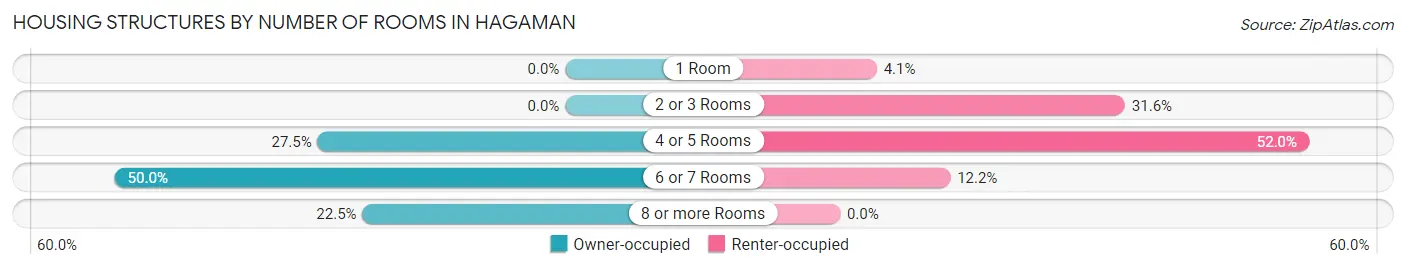
| Number of Rooms | Owner-occupied | Renter-occupied |
| 1 Room | 0 (0.0%) | 4 (4.1%) |
| 2 or 3 Rooms | 0 (0.0%) | 31 (31.6%) |
| 4 or 5 Rooms | 127 (27.5%) | 51 (52.0%) |
| 6 or 7 Rooms | 231 (50.0%) | 12 (12.2%) |
| 8 or more Rooms | 104 (22.5%) | 0 (0.0%) |
| Total | 462 (100.0%) | 98 (100.0%) |
Housing Structure by Heating Type in Hagaman
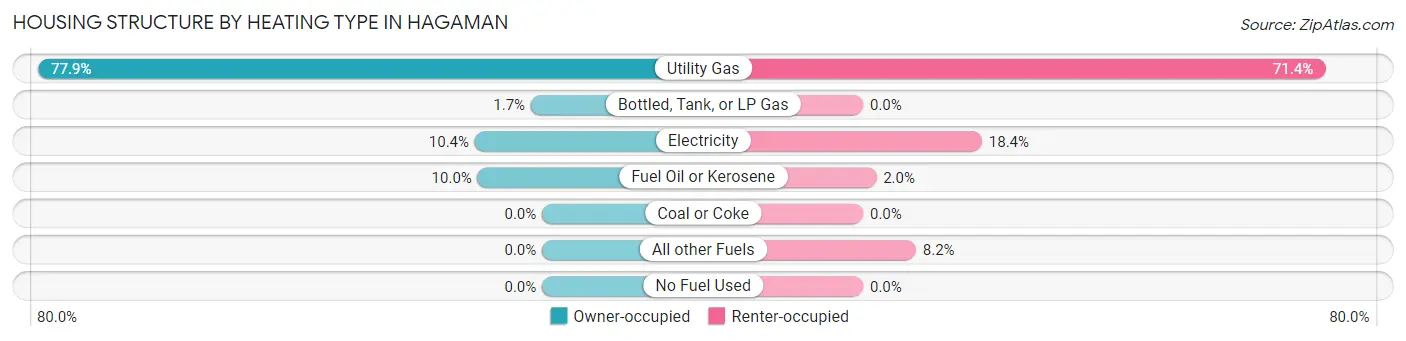
| Heating Type | Owner-occupied | Renter-occupied |
| Utility Gas | 360 (77.9%) | 70 (71.4%) |
| Bottled, Tank, or LP Gas | 8 (1.7%) | 0 (0.0%) |
| Electricity | 48 (10.4%) | 18 (18.4%) |
| Fuel Oil or Kerosene | 46 (10.0%) | 2 (2.0%) |
| Coal or Coke | 0 (0.0%) | 0 (0.0%) |
| All other Fuels | 0 (0.0%) | 8 (8.2%) |
| No Fuel Used | 0 (0.0%) | 0 (0.0%) |
| Total | 462 (100.0%) | 98 (100.0%) |
Household Vehicle Usage in Hagaman
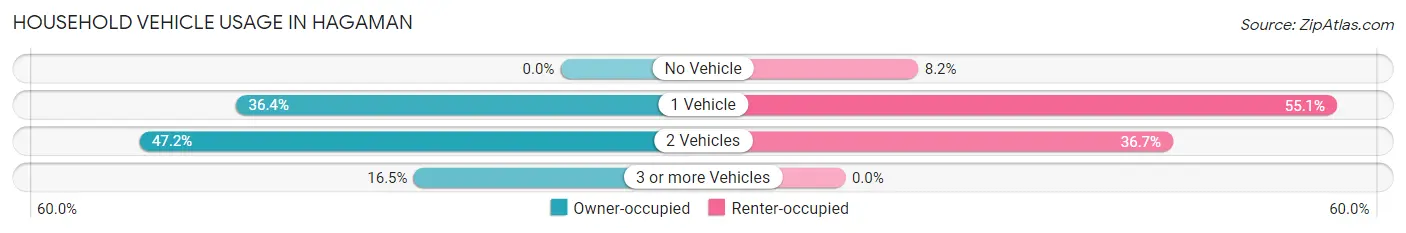
| Vehicles per Household | Owner-occupied | Renter-occupied |
| No Vehicle | 0 (0.0%) | 8 (8.2%) |
| 1 Vehicle | 168 (36.4%) | 54 (55.1%) |
| 2 Vehicles | 218 (47.2%) | 36 (36.7%) |
| 3 or more Vehicles | 76 (16.5%) | 0 (0.0%) |
| Total | 462 (100.0%) | 98 (100.0%) |
Real Estate & Mortgages in Hagaman
Real Estate and Mortgage Overview in Hagaman
| Characteristic | Without Mortgage | With Mortgage |
| Housing Units | 264 | 198 |
| Median Property Value | $170,500 | $177,500 |
| Median Household Income | $47,143 | $37 |
| Monthly Housing Costs | $473 | $2 |
| Real Estate Taxes | $2,671 | $20 |
Property Value by Mortgage Status in Hagaman
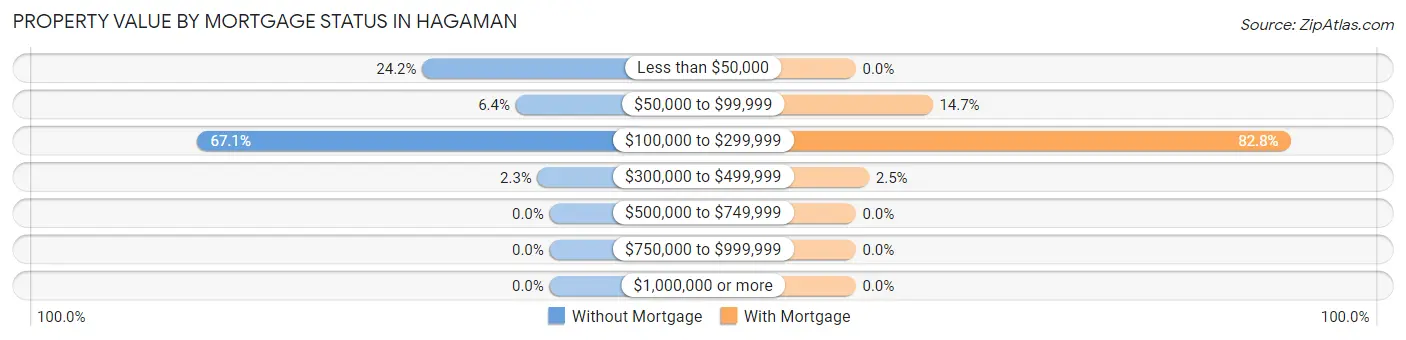
| Property Value | Without Mortgage | With Mortgage |
| Less than $50,000 | 64 (24.2%) | 0 (0.0%) |
| $50,000 to $99,999 | 17 (6.4%) | 29 (14.6%) |
| $100,000 to $299,999 | 177 (67.0%) | 164 (82.8%) |
| $300,000 to $499,999 | 6 (2.3%) | 5 (2.5%) |
| $500,000 to $749,999 | 0 (0.0%) | 0 (0.0%) |
| $750,000 to $999,999 | 0 (0.0%) | 0 (0.0%) |
| $1,000,000 or more | 0 (0.0%) | 0 (0.0%) |
| Total | 264 (100.0%) | 198 (100.0%) |
Household Income by Mortgage Status in Hagaman
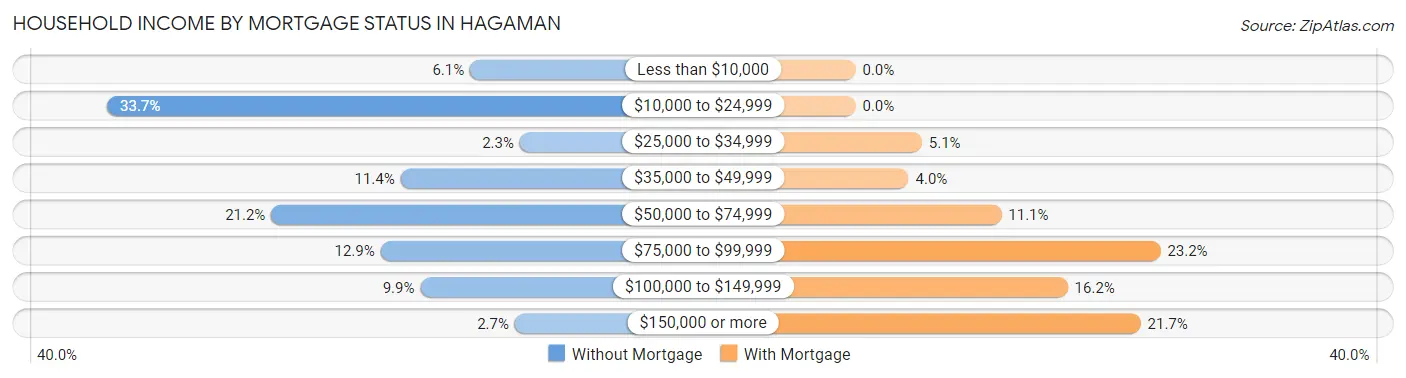
| Household Income | Without Mortgage | With Mortgage |
| Less than $10,000 | 16 (6.1%) | 0 (0.0%) |
| $10,000 to $24,999 | 89 (33.7%) | 0 (0.0%) |
| $25,000 to $34,999 | 6 (2.3%) | 10 (5.1%) |
| $35,000 to $49,999 | 30 (11.4%) | 8 (4.0%) |
| $50,000 to $74,999 | 56 (21.2%) | 22 (11.1%) |
| $75,000 to $99,999 | 34 (12.9%) | 46 (23.2%) |
| $100,000 to $149,999 | 26 (9.9%) | 32 (16.2%) |
| $150,000 or more | 7 (2.6%) | 43 (21.7%) |
| Total | 264 (100.0%) | 198 (100.0%) |
Property Value to Household Income Ratio in Hagaman
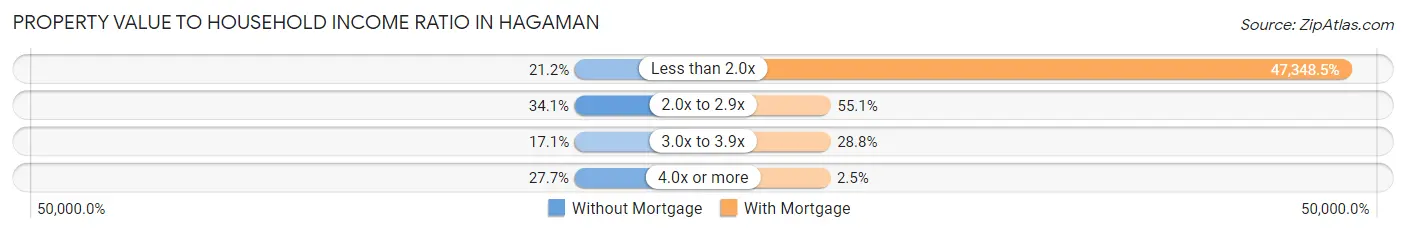
| Value-to-Income Ratio | Without Mortgage | With Mortgage |
| Less than 2.0x | 56 (21.2%) | 93,750 (47,348.5%) |
| 2.0x to 2.9x | 90 (34.1%) | 109 (55.0%) |
| 3.0x to 3.9x | 45 (17.1%) | 57 (28.8%) |
| 4.0x or more | 73 (27.7%) | 5 (2.5%) |
| Total | 264 (100.0%) | 198 (100.0%) |
Real Estate Taxes by Mortgage Status in Hagaman
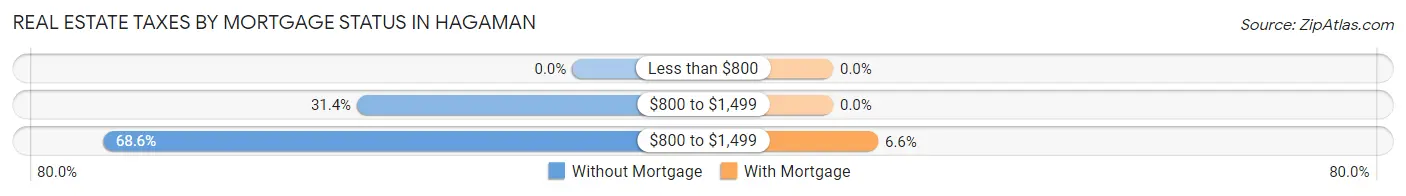
| Property Taxes | Without Mortgage | With Mortgage |
| Less than $800 | 0 (0.0%) | 0 (0.0%) |
| $800 to $1,499 | 83 (31.4%) | 0 (0.0%) |
| $800 to $1,499 | 181 (68.6%) | 13 (6.6%) |
| Total | 264 (100.0%) | 198 (100.0%) |
Health & Disability in Hagaman
Health Insurance Coverage by Age in Hagaman
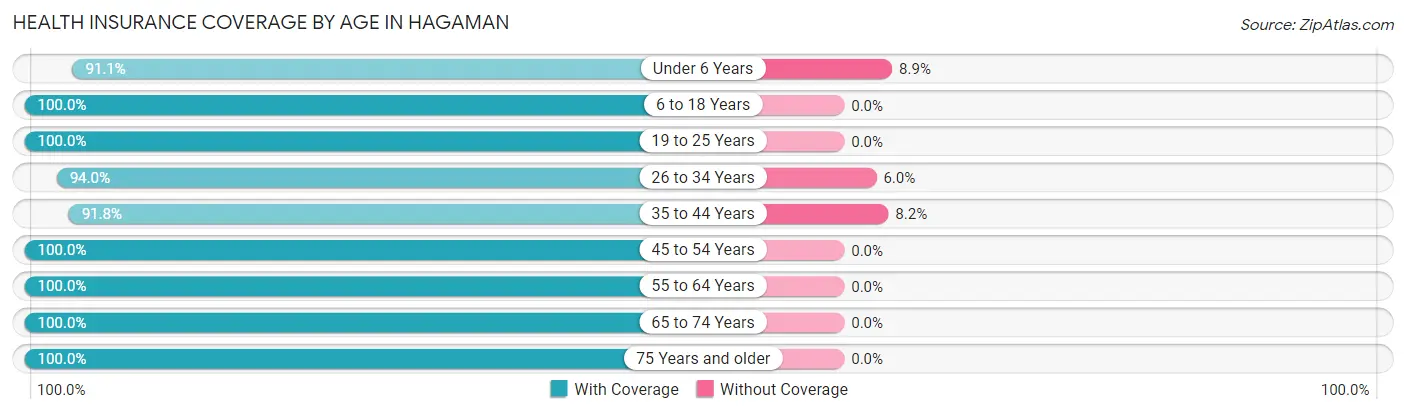
| Age Bracket | With Coverage | Without Coverage |
| Under 6 Years | 51 (91.1%) | 5 (8.9%) |
| 6 to 18 Years | 139 (100.0%) | 0 (0.0%) |
| 19 to 25 Years | 62 (100.0%) | 0 (0.0%) |
| 26 to 34 Years | 94 (94.0%) | 6 (6.0%) |
| 35 to 44 Years | 145 (91.8%) | 13 (8.2%) |
| 45 to 54 Years | 89 (100.0%) | 0 (0.0%) |
| 55 to 64 Years | 218 (100.0%) | 0 (0.0%) |
| 65 to 74 Years | 197 (100.0%) | 0 (0.0%) |
| 75 Years and older | 137 (100.0%) | 0 (0.0%) |
| Total | 1,132 (97.9%) | 24 (2.1%) |
Health Insurance Coverage by Citizenship Status in Hagaman
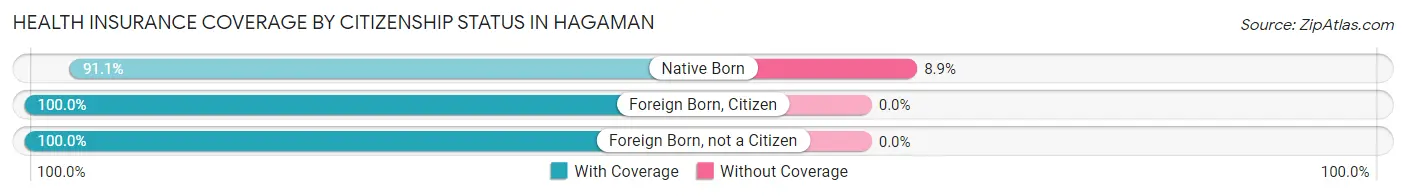
| Citizenship Status | With Coverage | Without Coverage |
| Native Born | 51 (91.1%) | 5 (8.9%) |
| Foreign Born, Citizen | 139 (100.0%) | 0 (0.0%) |
| Foreign Born, not a Citizen | 62 (100.0%) | 0 (0.0%) |
Health Insurance Coverage by Household Income in Hagaman
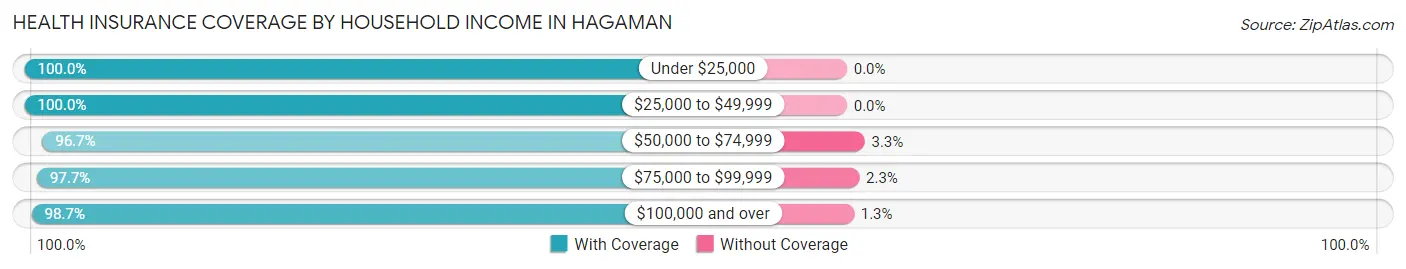
| Household Income | With Coverage | Without Coverage |
| Under $25,000 | 156 (100.0%) | 0 (0.0%) |
| $25,000 to $49,999 | 130 (100.0%) | 0 (0.0%) |
| $50,000 to $74,999 | 233 (96.7%) | 8 (3.3%) |
| $75,000 to $99,999 | 211 (97.7%) | 5 (2.3%) |
| $100,000 and over | 378 (98.7%) | 5 (1.3%) |
Public vs Private Health Insurance Coverage by Age in Hagaman
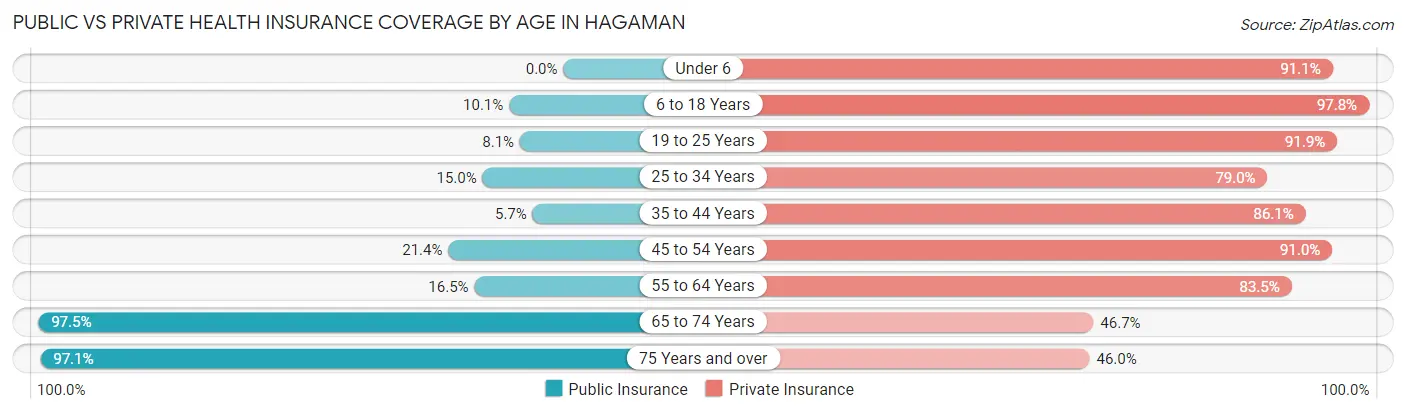
| Age Bracket | Public Insurance | Private Insurance |
| Under 6 | 0 (0.0%) | 51 (91.1%) |
| 6 to 18 Years | 14 (10.1%) | 136 (97.8%) |
| 19 to 25 Years | 5 (8.1%) | 57 (91.9%) |
| 25 to 34 Years | 15 (15.0%) | 79 (79.0%) |
| 35 to 44 Years | 9 (5.7%) | 136 (86.1%) |
| 45 to 54 Years | 19 (21.3%) | 81 (91.0%) |
| 55 to 64 Years | 36 (16.5%) | 182 (83.5%) |
| 65 to 74 Years | 192 (97.5%) | 92 (46.7%) |
| 75 Years and over | 133 (97.1%) | 63 (46.0%) |
| Total | 423 (36.6%) | 877 (75.9%) |
Disability Status by Sex by Age in Hagaman
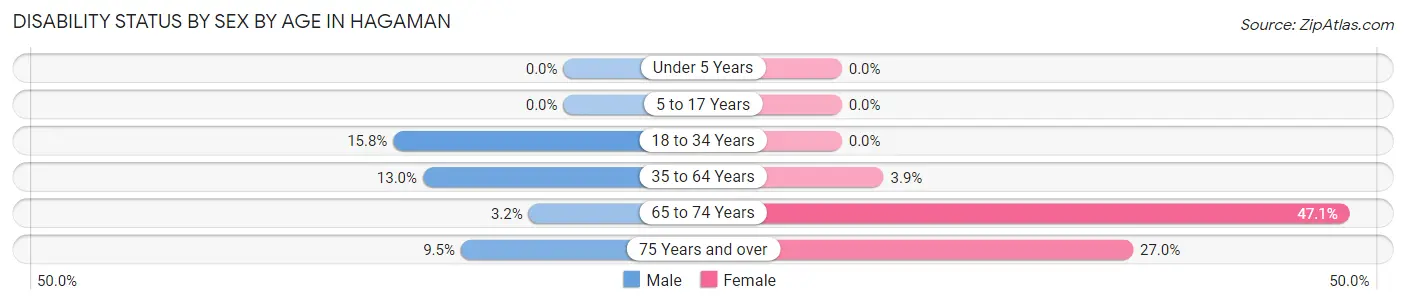
| Age Bracket | Male | Female |
| Under 5 Years | 0 (0.0%) | 0 (0.0%) |
| 5 to 17 Years | 0 (0.0%) | 0 (0.0%) |
| 18 to 34 Years | 18 (15.8%) | 0 (0.0%) |
| 35 to 64 Years | 27 (13.0%) | 10 (3.9%) |
| 65 to 74 Years | 3 (3.2%) | 49 (47.1%) |
| 75 Years and over | 6 (9.5%) | 20 (27.0%) |
Disability Class by Sex by Age in Hagaman
Disability Class: Hearing Difficulty
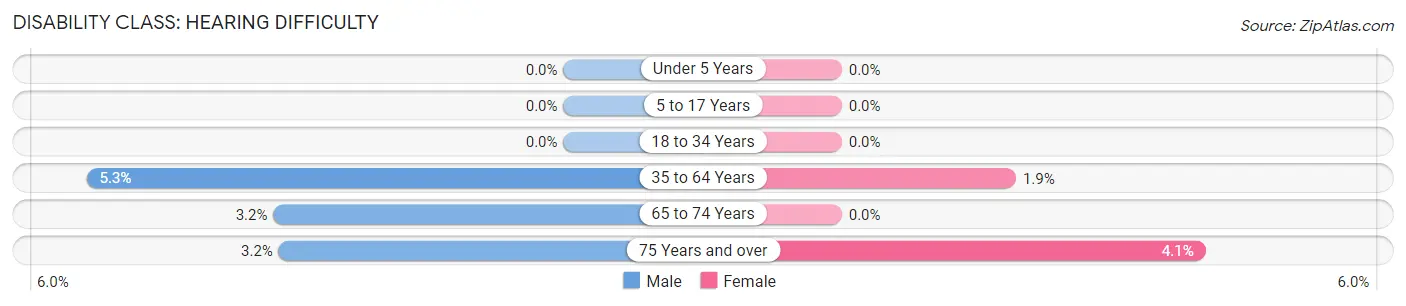
| Age Bracket | Male | Female |
| Under 5 Years | 0 (0.0%) | 0 (0.0%) |
| 5 to 17 Years | 0 (0.0%) | 0 (0.0%) |
| 18 to 34 Years | 0 (0.0%) | 0 (0.0%) |
| 35 to 64 Years | 11 (5.3%) | 5 (1.9%) |
| 65 to 74 Years | 3 (3.2%) | 0 (0.0%) |
| 75 Years and over | 2 (3.2%) | 3 (4.1%) |
Disability Class: Vision Difficulty
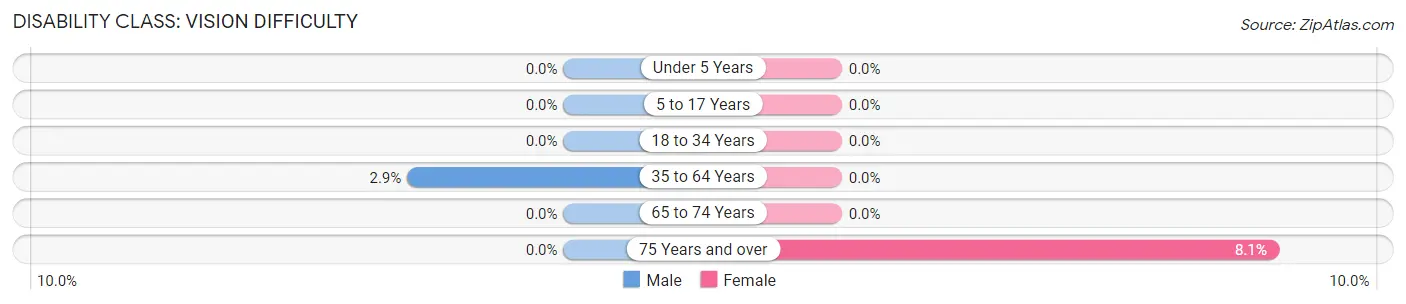
| Age Bracket | Male | Female |
| Under 5 Years | 0 (0.0%) | 0 (0.0%) |
| 5 to 17 Years | 0 (0.0%) | 0 (0.0%) |
| 18 to 34 Years | 0 (0.0%) | 0 (0.0%) |
| 35 to 64 Years | 6 (2.9%) | 0 (0.0%) |
| 65 to 74 Years | 0 (0.0%) | 0 (0.0%) |
| 75 Years and over | 0 (0.0%) | 6 (8.1%) |
Disability Class: Cognitive Difficulty
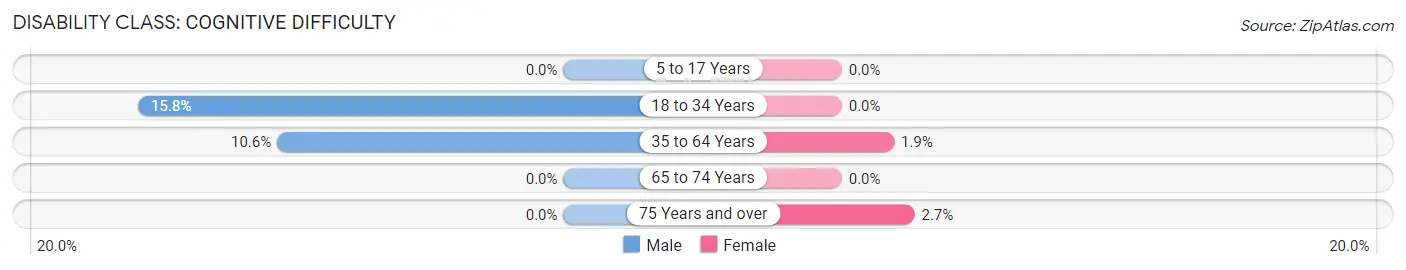
| Age Bracket | Male | Female |
| 5 to 17 Years | 0 (0.0%) | 0 (0.0%) |
| 18 to 34 Years | 18 (15.8%) | 0 (0.0%) |
| 35 to 64 Years | 22 (10.6%) | 5 (1.9%) |
| 65 to 74 Years | 0 (0.0%) | 0 (0.0%) |
| 75 Years and over | 0 (0.0%) | 2 (2.7%) |
Disability Class: Ambulatory Difficulty
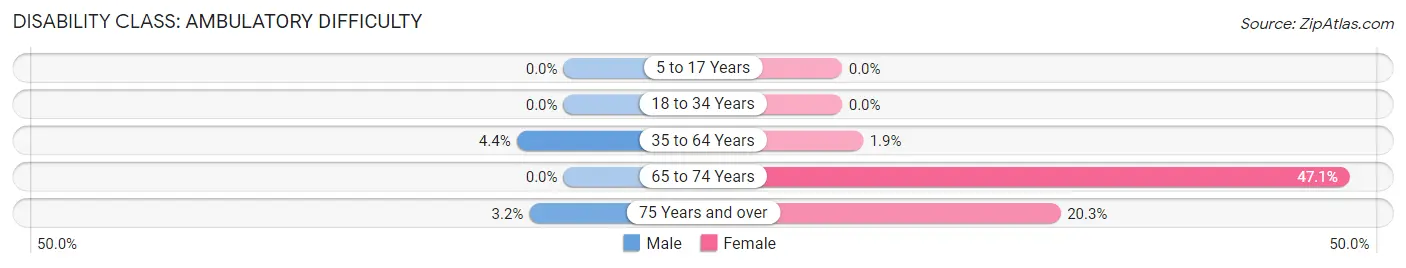
| Age Bracket | Male | Female |
| 5 to 17 Years | 0 (0.0%) | 0 (0.0%) |
| 18 to 34 Years | 0 (0.0%) | 0 (0.0%) |
| 35 to 64 Years | 9 (4.3%) | 5 (1.9%) |
| 65 to 74 Years | 0 (0.0%) | 49 (47.1%) |
| 75 Years and over | 2 (3.2%) | 15 (20.3%) |
Disability Class: Self-Care Difficulty
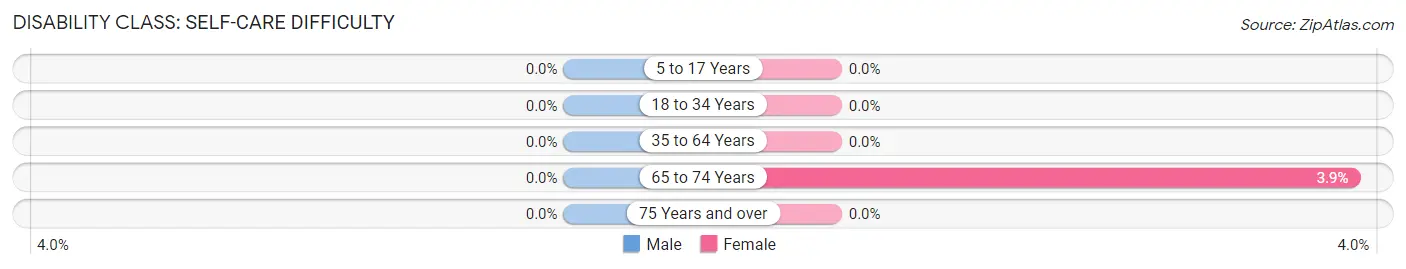
| Age Bracket | Male | Female |
| 5 to 17 Years | 0 (0.0%) | 0 (0.0%) |
| 18 to 34 Years | 0 (0.0%) | 0 (0.0%) |
| 35 to 64 Years | 0 (0.0%) | 0 (0.0%) |
| 65 to 74 Years | 0 (0.0%) | 4 (3.8%) |
| 75 Years and over | 0 (0.0%) | 0 (0.0%) |
Technology Access in Hagaman
Computing Device Access in Hagaman
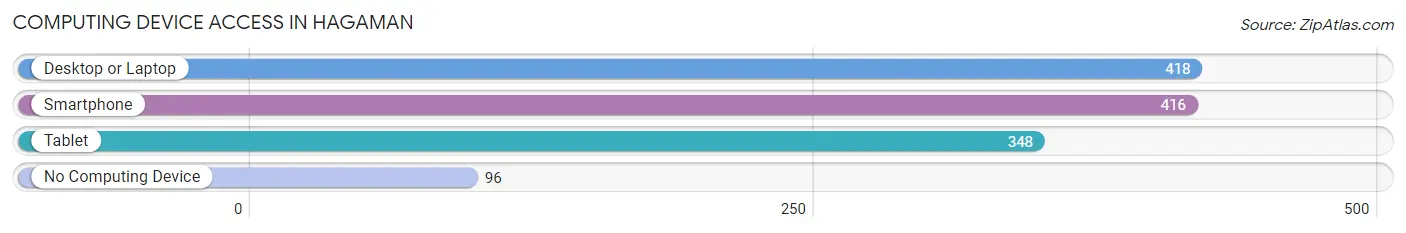
| Device Type | # Households | % Households |
| Desktop or Laptop | 418 | 74.6% |
| Smartphone | 416 | 74.3% |
| Tablet | 348 | 62.1% |
| No Computing Device | 96 | 17.1% |
| Total | 560 | 100.0% |
Internet Access in Hagaman
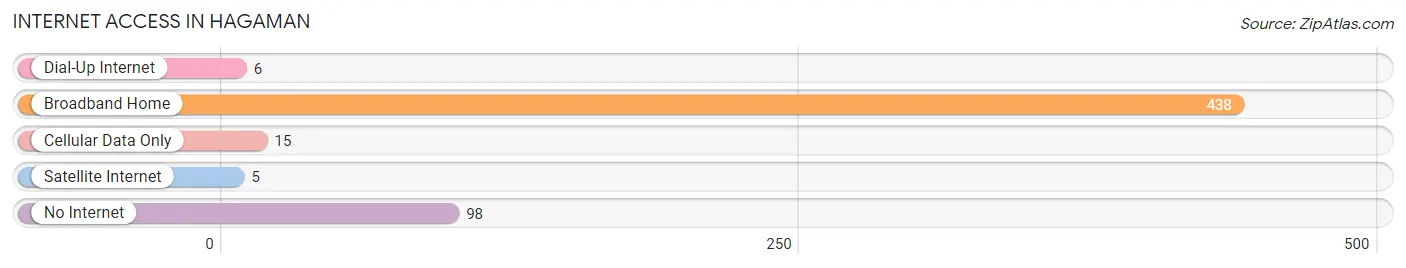
| Internet Type | # Households | % Households |
| Dial-Up Internet | 6 | 1.1% |
| Broadband Home | 438 | 78.2% |
| Cellular Data Only | 15 | 2.7% |
| Satellite Internet | 5 | 0.9% |
| No Internet | 98 | 17.5% |
| Total | 560 | 100.0% |
Hagaman Summary
Hagaman is a small hamlet located in the town of Amsterdam, in Montgomery County, New York. It is situated on the Mohawk River, about 10 miles north of the city of Amsterdam. The population of Hagaman was 1,845 in the 2010 census.
History
Hagaman was first settled in 1790 by John Hagaman, a Revolutionary War veteran. He purchased the land from the Mohawk Indians and built a sawmill and gristmill on the banks of the Mohawk River. The settlement was originally known as Hagaman’s Mills, but the name was changed to Hagaman in 1820.
In the early 19th century, Hagaman was a thriving industrial center. The mills produced lumber, flour, and other products for the local market. The village also had a blacksmith shop, a tannery, and a general store.
In the late 19th century, Hagaman began to decline as the industrial revolution shifted production to larger cities. The mills closed and the population began to decline.
Geography
Hagaman is located at 42°59'N 74°37'W (42.983, -74.619). It is situated on the Mohawk River, about 10 miles north of the city of Amsterdam. The terrain is mostly flat, with some rolling hills. The climate is humid continental, with cold winters and hot, humid summers.
Economy
Hagaman’s economy is largely based on agriculture and tourism. The town is home to several farms, which produce a variety of crops, including corn, soybeans, hay, and vegetables. The town also has several wineries and breweries, which attract tourists from all over the region.
Demographics
As of the 2010 census, there were 1,845 people, 745 households, and 486 families residing in Hagaman. The population density was 1,092.3 people per square mile (422.2/km2). The racial makeup of the town was 97.2% White, 0.7% African American, 0.2% Native American, 0.4% Asian, 0.1% Pacific Islander, 0.4% from other races, and 1.0% from two or more races. Hispanic or Latino of any race were 2.2% of the population.
The median income for a household in Hagaman was $41,250, and the median income for a family was $50,000. Males had a median income of $36,250 versus $25,000 for females. The per capita income for the town was $19,945. About 8.2% of families and 10.2% of the population were below the poverty line, including 14.2% of those under age 18 and 5.2% of those age 65 or over.
Hagaman is a small, rural community with a rich history and a strong sense of community. The town is home to several farms, wineries, and breweries, which attract tourists from all over the region. The town also has a strong agricultural base, which provides jobs and income for many of its residents.
Common Questions
What is the Total Population of Hagaman?
Total Population of Hagaman is 1,156.
What is the Total Male Population of Hagaman?
Total Male Population of Hagaman is 545.
What is the Total Female Population of Hagaman?
Total Female Population of Hagaman is 611.
What is the Ratio of Males per 100 Females in Hagaman?
There are 89.20 Males per 100 Females in Hagaman.
What is the Ratio of Females per 100 Males in Hagaman?
There are 112.11 Females per 100 Males in Hagaman.
What is the Median Population Age in Hagaman?
Median Population Age in Hagaman is 47.7 Years.
What is the Average Family Size in Hagaman
Average Family Size in Hagaman is 2.7 People.
What is the Average Household Size in Hagaman
Average Household Size in Hagaman is 2.0 People.
What is Per Capita Income in Hagaman?
Per Capita income in Hagaman is $36,778.
What is the Median Family Income in Hagaman?
Median Family Income in Hagaman is $78,654.
What is the Median Household income in Hagaman?
Median Household Income in Hagaman is $61,250.
What is Income or Wage Gap in Hagaman?
Income or Wage Gap in Hagaman is 13.7%.
Women in Hagaman earn 86.3 cents for every dollar earned by a man.
What is Inequality or Gini Index in Hagaman?
Inequality or Gini Index in Hagaman is 0.41.
How Large is the Labor Force in Hagaman?
There are 585 People in the Labor Forcein in Hagaman.
What is the Percentage of People in the Labor Force in Hagaman?
58.6% of People are in the Labor Force in Hagaman.
What is the Unemployment Rate in Hagaman?
Unemployment Rate in Hagaman is 2.7%.