Clarence, NY
Clarence Map
Clarence Overview
2,523
TOTAL POPULATION
1,234
MALE POPULATION
1,289
FEMALE POPULATION
95.73
MALES / 100 FEMALES
104.46
FEMALES / 100 MALES
59.4
MEDIAN AGE
2.5
AVG FAMILY SIZE
2.0
AVG HOUSEHOLD SIZE
$51,693
PER CAPITA INCOME
$120,365
AVG FAMILY INCOME
$80,737
AVG HOUSEHOLD INCOME
6.5%
WAGE / INCOME GAP [ % ]
93.5¢/ $1
WAGE / INCOME GAP [ $ ]
0.45
INEQUALITY / GINI INDEX
1,162
LABOR FORCE [ PEOPLE ]
52.5%
PERCENT IN LABOR FORCE
3.4%
UNEMPLOYMENT RATE
Clarence Zip Codes
Clarence Area Codes
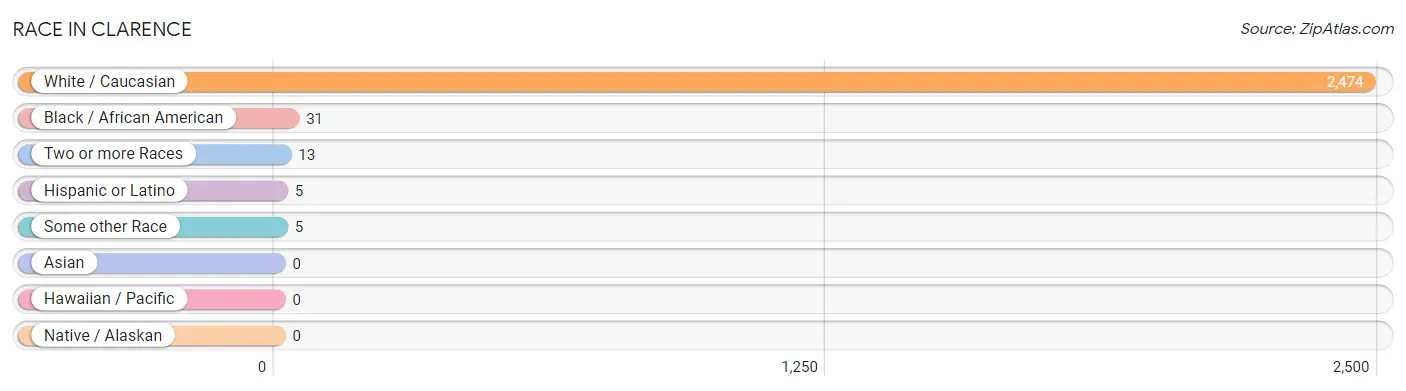
Race in Clarence
The most populous races in Clarence are White / Caucasian (2,474 | 98.1%), Black / African American (31 | 1.2%), and Two or more Races (13 | 0.5%).
| Race | # Population | % Population |
| Asian | 0 | 0.0% |
| Black / African American | 31 | 1.2% |
| Hawaiian / Pacific | 0 | 0.0% |
| Hispanic or Latino | 5 | 0.2% |
| Native / Alaskan | 0 | 0.0% |
| White / Caucasian | 2,474 | 98.1% |
| Two or more Races | 13 | 0.5% |
| Some other Race | 5 | 0.2% |
| Total | 2,523 | 100.0% |
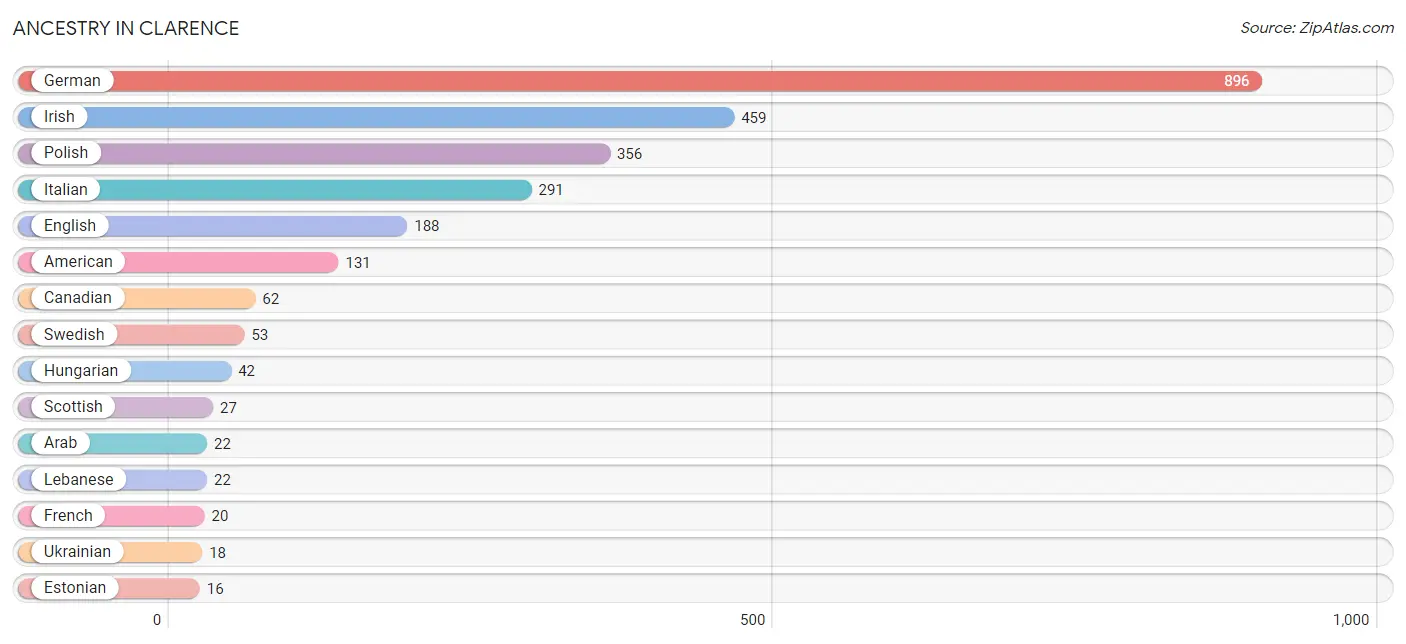
Ancestry in Clarence
The most populous ancestries reported in Clarence are German (896 | 35.5%), Irish (459 | 18.2%), Polish (356 | 14.1%), Italian (291 | 11.5%), and English (188 | 7.4%), together accounting for 86.8% of all Clarence residents.
| Ancestry | # Population | % Population |
| Alsatian | 10 | 0.4% |
| American | 131 | 5.2% |
| Arab | 22 | 0.9% |
| Armenian | 10 | 0.4% |
| British | 15 | 0.6% |
| Canadian | 62 | 2.5% |
| Czech | 14 | 0.5% |
| Dutch | 10 | 0.4% |
| Eastern European | 15 | 0.6% |
| English | 188 | 7.4% |
| Estonian | 16 | 0.6% |
| French | 20 | 0.8% |
| German | 896 | 35.5% |
| Hungarian | 42 | 1.7% |
| Irish | 459 | 18.2% |
| Italian | 291 | 11.5% |
| Korean | 13 | 0.5% |
| Lebanese | 22 | 0.9% |
| Polish | 356 | 14.1% |
| Scottish | 27 | 1.1% |
| Swedish | 53 | 2.1% |
| Ukrainian | 18 | 0.7% | View All 22 Rows |
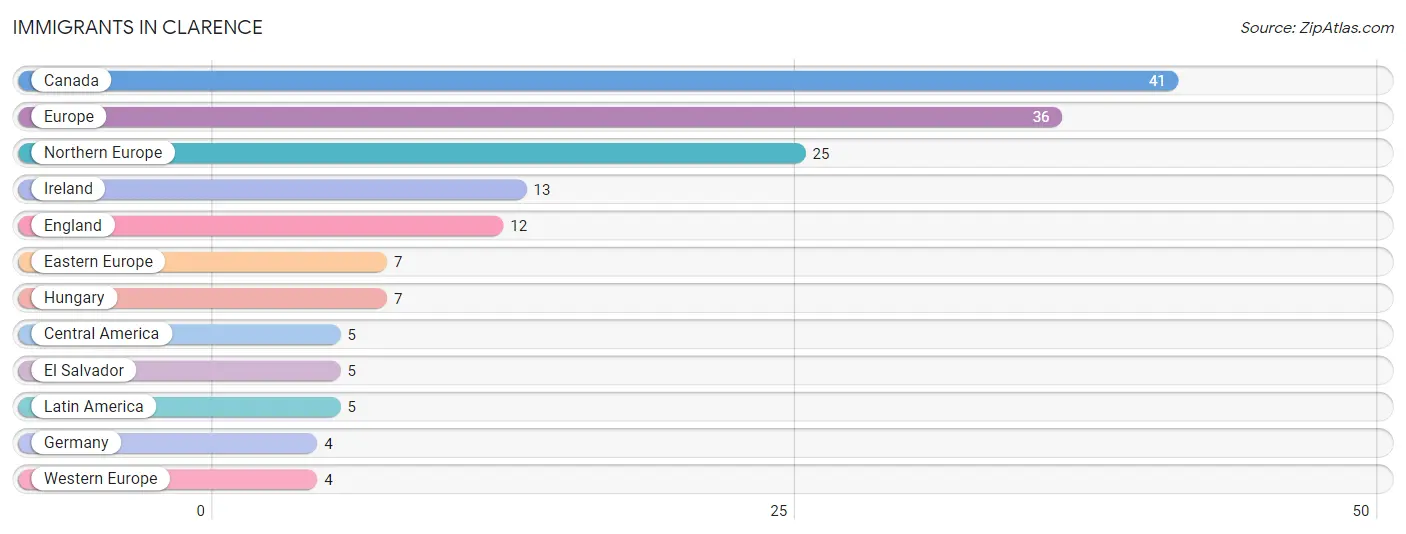
Immigrants in Clarence
The most numerous immigrant groups reported in Clarence came from Canada (41 | 1.6%), Europe (36 | 1.4%), Northern Europe (25 | 1.0%), Ireland (13 | 0.5%), and England (12 | 0.5%), together accounting for 5.1% of all Clarence residents.
| Immigration Origin | # Population | % Population |
| Canada | 41 | 1.6% |
| Central America | 5 | 0.2% |
| Eastern Europe | 7 | 0.3% |
| El Salvador | 5 | 0.2% |
| England | 12 | 0.5% |
| Europe | 36 | 1.4% |
| Germany | 4 | 0.2% |
| Hungary | 7 | 0.3% |
| Ireland | 13 | 0.5% |
| Latin America | 5 | 0.2% |
| Northern Europe | 25 | 1.0% |
| Western Europe | 4 | 0.2% | View All 12 Rows |
Sex and Age in Clarence
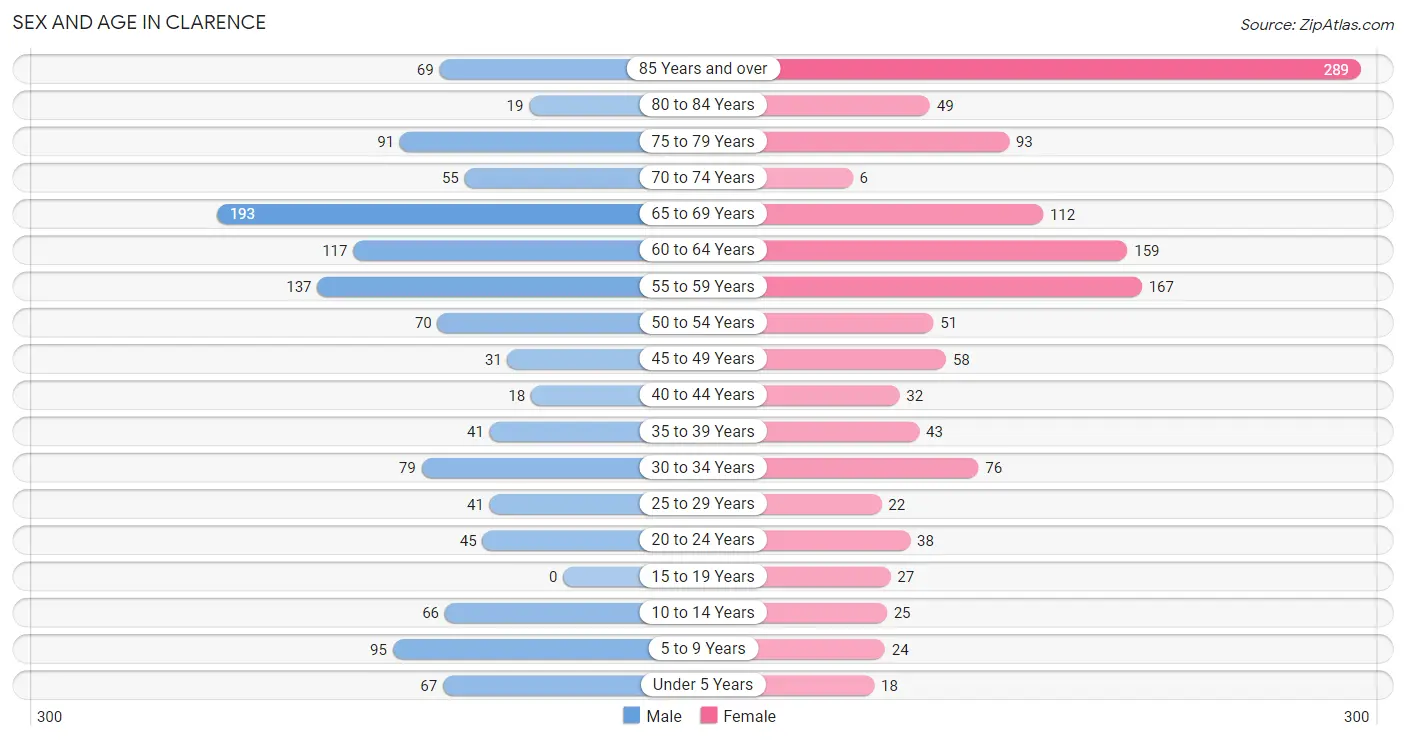
Sex and Age in Clarence
The most populous age groups in Clarence are 65 to 69 Years (193 | 15.6%) for men and 85 Years and over (289 | 22.4%) for women.
| Age Bracket | Male | Female |
| Under 5 Years | 67 (5.4%) | 18 (1.4%) |
| 5 to 9 Years | 95 (7.7%) | 24 (1.9%) |
| 10 to 14 Years | 66 (5.3%) | 25 (1.9%) |
| 15 to 19 Years | 0 (0.0%) | 27 (2.1%) |
| 20 to 24 Years | 45 (3.6%) | 38 (2.9%) |
| 25 to 29 Years | 41 (3.3%) | 22 (1.7%) |
| 30 to 34 Years | 79 (6.4%) | 76 (5.9%) |
| 35 to 39 Years | 41 (3.3%) | 43 (3.3%) |
| 40 to 44 Years | 18 (1.5%) | 32 (2.5%) |
| 45 to 49 Years | 31 (2.5%) | 58 (4.5%) |
| 50 to 54 Years | 70 (5.7%) | 51 (4.0%) |
| 55 to 59 Years | 137 (11.1%) | 167 (13.0%) |
| 60 to 64 Years | 117 (9.5%) | 159 (12.3%) |
| 65 to 69 Years | 193 (15.6%) | 112 (8.7%) |
| 70 to 74 Years | 55 (4.5%) | 6 (0.5%) |
| 75 to 79 Years | 91 (7.4%) | 93 (7.2%) |
| 80 to 84 Years | 19 (1.5%) | 49 (3.8%) |
| 85 Years and over | 69 (5.6%) | 289 (22.4%) |
| Total | 1,234 (100.0%) | 1,289 (100.0%) |
Families and Households in Clarence
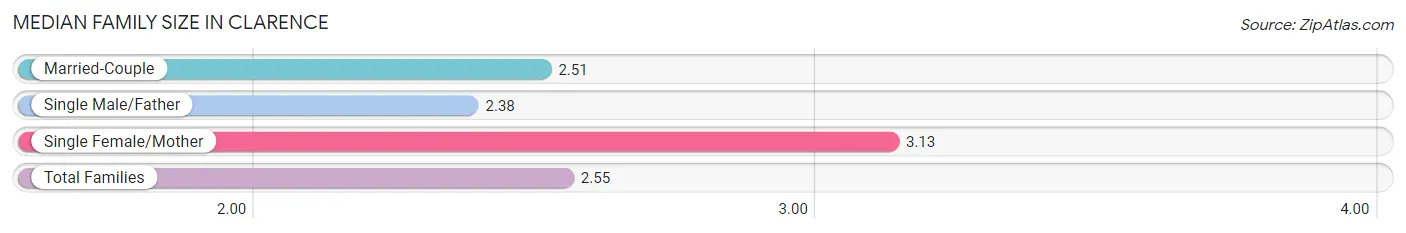
Median Family Size in Clarence
The median family size in Clarence is 2.55 persons per family, with single female/mother families (45 | 7.0%) accounting for the largest median family size of 3.13 persons per family. On the other hand, single male/father families (29 | 4.5%) represent the smallest median family size with 2.38 persons per family.
| Family Type | # Families | Family Size |
| Married-Couple | 573 (88.6%) | 2.51 |
| Single Male/Father | 29 (4.5%) | 2.38 |
| Single Female/Mother | 45 (7.0%) | 3.13 |
| Total Families | 647 (100.0%) | 2.55 |
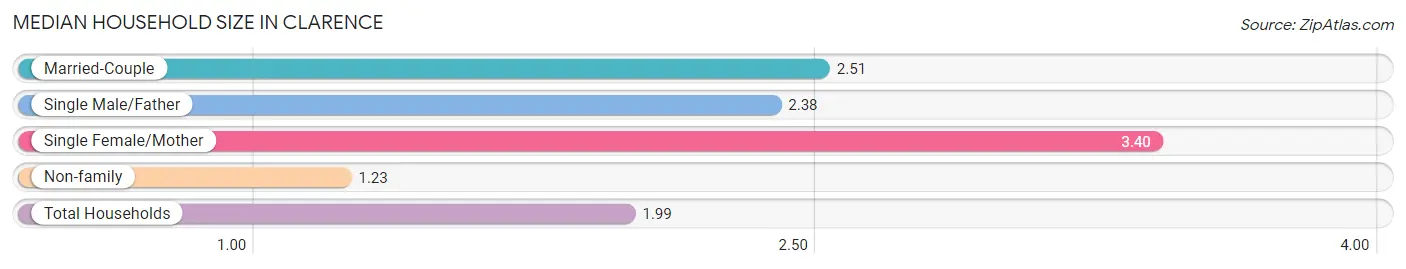
Median Household Size in Clarence
The median household size in Clarence is 1.99 persons per household, with single female/mother households (45 | 4.0%) accounting for the largest median household size of 3.4 persons per household. non-family households (492 | 43.2%) represent the smallest median household size with 1.23 persons per household.
| Household Type | # Households | Household Size |
| Married-Couple | 573 (50.3%) | 2.51 |
| Single Male/Father | 29 (2.5%) | 2.38 |
| Single Female/Mother | 45 (4.0%) | 3.40 |
| Non-family | 492 (43.2%) | 1.23 |
| Total Households | 1,139 (100.0%) | 1.99 |
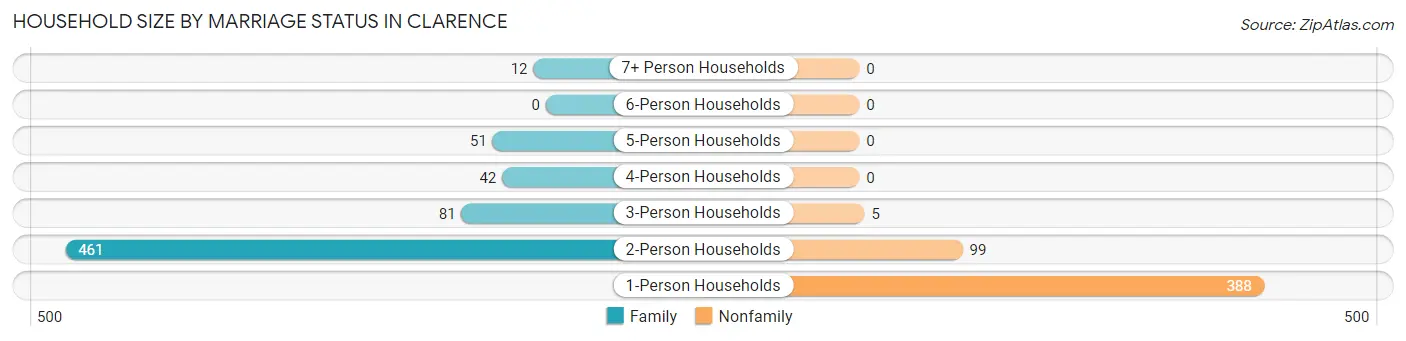
Household Size by Marriage Status in Clarence
Out of a total of 1,139 households in Clarence, 647 (56.8%) are family households, while 492 (43.2%) are nonfamily households. The most numerous type of family households are 2-person households, comprising 461, and the most common type of nonfamily households are 1-person households, comprising 388.
| Household Size | Family Households | Nonfamily Households |
| 1-Person Households | - | 388 (34.1%) |
| 2-Person Households | 461 (40.5%) | 99 (8.7%) |
| 3-Person Households | 81 (7.1%) | 5 (0.4%) |
| 4-Person Households | 42 (3.7%) | 0 (0.0%) |
| 5-Person Households | 51 (4.5%) | 0 (0.0%) |
| 6-Person Households | 0 (0.0%) | 0 (0.0%) |
| 7+ Person Households | 12 (1.1%) | 0 (0.0%) |
| Total | 647 (56.8%) | 492 (43.2%) |
Female Fertility in Clarence
Fertility by Age in Clarence
| Age Bracket | Women with Births | Births / 1,000 Women |
| 15 to 19 years | 0 (0.0%) | 0.0 |
| 20 to 34 years | 0 (0.0%) | 0.0 |
| 35 to 50 years | 0 (0.0%) | 0.0 |
| Total | 0 (0.0%) | 0.0 |
Fertility by Age by Marriage Status in Clarence
| Age Bracket | Married | Unmarried |
| 15 to 19 years | 0 (0.0%) | 0 (0.0%) |
| 20 to 34 years | 0 (0.0%) | 0 (0.0%) |
| 35 to 50 years | 0 (0.0%) | 0 (0.0%) |
| Total | 0 (0.0%) | 0 (0.0%) |
Fertility by Education in Clarence
| Educational Attainment | Women with Births | Births / 1,000 Women |
| Less than High School | 0 (0.0%) | 0.0 |
| High School Diploma | 0 (0.0%) | 0.0 |
| College or Associate's Degree | 0 (0.0%) | 0.0 |
| Bachelor's Degree | 0 (0.0%) | 0.0 |
| Graduate Degree | 0 (0.0%) | 0.0 |
| Total | 0 (0.0%) | 0.0 |
Fertility by Education by Marriage Status in Clarence
| Educational Attainment | Married | Unmarried |
| Less than High School | 0 (0.0%) | 0 (0.0%) |
| High School Diploma | 0 (0.0%) | 0 (0.0%) |
| College or Associate's Degree | 0 (0.0%) | 0 (0.0%) |
| Bachelor's Degree | 0 (0.0%) | 0 (0.0%) |
| Graduate Degree | 0 (0.0%) | 0 (0.0%) |
| Total | 0 (0.0%) | 0 (0.0%) |
Income in Clarence
Income Overview in Clarence
Per Capita Income in Clarence is $51,693, while median incomes of families and households are $120,365 and $80,737 respectively.
| Characteristic | Number | Measure |
| Per Capita Income | 2,523 | $51,693 |
| Median Family Income | 647 | $120,365 |
| Mean Family Income | 647 | $138,502 |
| Median Household Income | 1,139 | $80,737 |
| Mean Household Income | 1,139 | $107,330 |
| Income Deficit | 647 | $0 |
| Wage / Income Gap (%) | 2,523 | 6.45% |
| Wage / Income Gap ($) | 2,523 | 93.55¢ per $1 |
| Gini / Inequality Index | 2,523 | 0.45 |
Earnings by Sex in Clarence
Average Earnings in Clarence are $59,177, $59,817 for men and $55,956 for women, a difference of 6.5%.
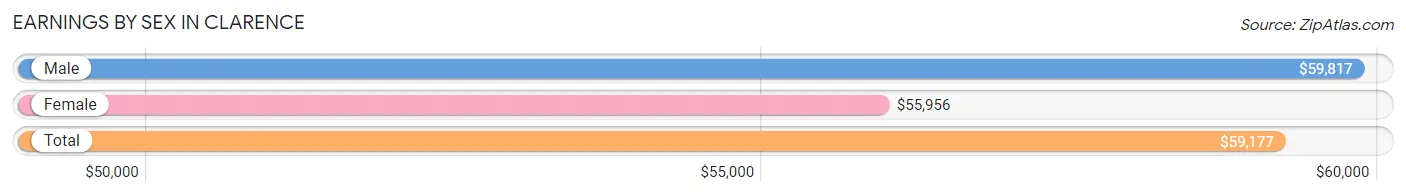
| Sex | Number | Average Earnings |
| Male | 612 (49.7%) | $59,817 |
| Female | 619 (50.3%) | $55,956 |
| Total | 1,231 (100.0%) | $59,177 |
Earnings by Sex by Income Bracket in Clarence
The most common earnings brackets in Clarence are $100,000+ for men (140 | 22.9%) and $75,000 to $99,999 for women (201 | 32.5%).
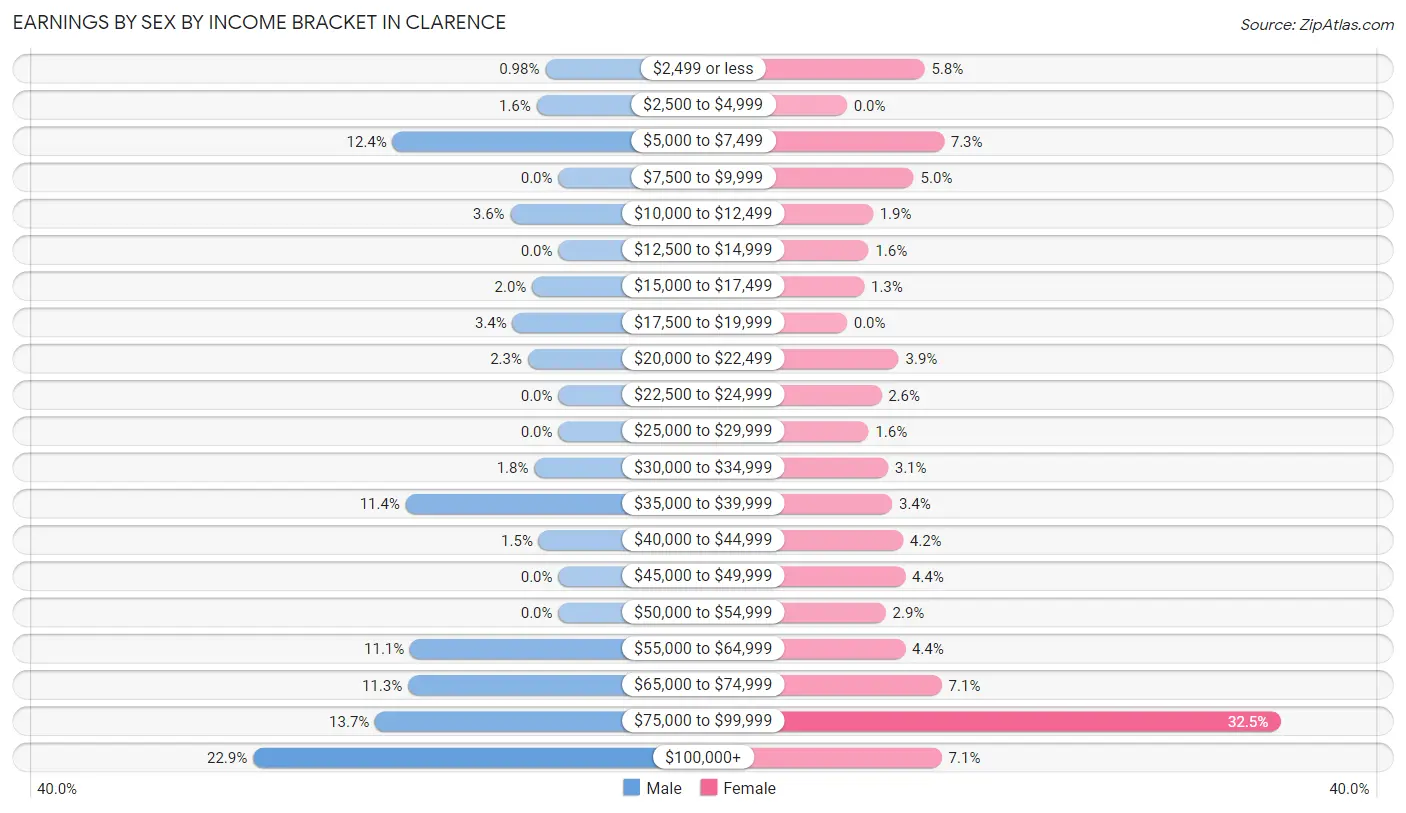
| Income | Male | Female |
| $2,499 or less | 6 (1.0%) | 36 (5.8%) |
| $2,500 to $4,999 | 10 (1.6%) | 0 (0.0%) |
| $5,000 to $7,499 | 76 (12.4%) | 45 (7.3%) |
| $7,500 to $9,999 | 0 (0.0%) | 31 (5.0%) |
| $10,000 to $12,499 | 22 (3.6%) | 12 (1.9%) |
| $12,500 to $14,999 | 0 (0.0%) | 10 (1.6%) |
| $15,000 to $17,499 | 12 (2.0%) | 8 (1.3%) |
| $17,500 to $19,999 | 21 (3.4%) | 0 (0.0%) |
| $20,000 to $22,499 | 14 (2.3%) | 24 (3.9%) |
| $22,500 to $24,999 | 0 (0.0%) | 16 (2.6%) |
| $25,000 to $29,999 | 0 (0.0%) | 10 (1.6%) |
| $30,000 to $34,999 | 11 (1.8%) | 19 (3.1%) |
| $35,000 to $39,999 | 70 (11.4%) | 21 (3.4%) |
| $40,000 to $44,999 | 9 (1.5%) | 26 (4.2%) |
| $45,000 to $49,999 | 0 (0.0%) | 27 (4.4%) |
| $50,000 to $54,999 | 0 (0.0%) | 18 (2.9%) |
| $55,000 to $64,999 | 68 (11.1%) | 27 (4.4%) |
| $65,000 to $74,999 | 69 (11.3%) | 44 (7.1%) |
| $75,000 to $99,999 | 84 (13.7%) | 201 (32.5%) |
| $100,000+ | 140 (22.9%) | 44 (7.1%) |
| Total | 612 (100.0%) | 619 (100.0%) |
Earnings by Sex by Educational Attainment in Clarence
Average earnings in Clarence are $62,875 for men and $66,250 for women, a difference of 5.1%. Men with an educational attainment of graduate degree enjoy the highest average annual earnings of $121,944, while those with college or associate's degree education earn the least with $48,750. Women with an educational attainment of bachelor's degree earn the most with the average annual earnings of $75,179, while those with college or associate's degree education have the smallest earnings of $56,691.
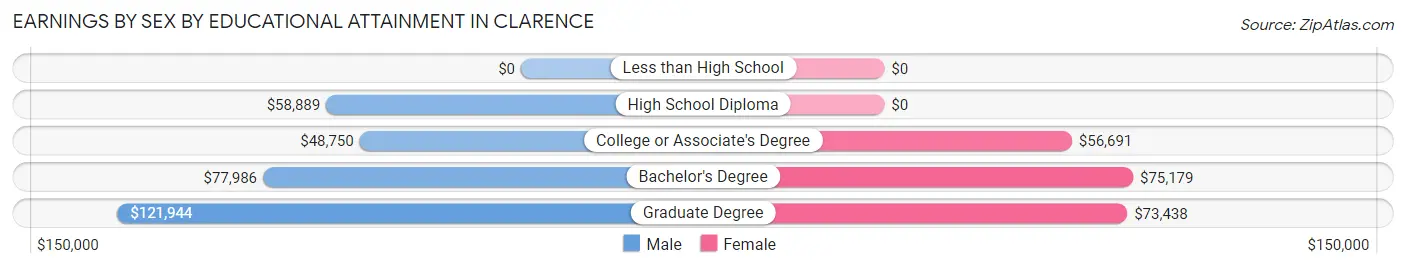
| Educational Attainment | Male Income | Female Income |
| Less than High School | - | - |
| High School Diploma | $58,889 | $0 |
| College or Associate's Degree | $48,750 | $56,691 |
| Bachelor's Degree | $77,986 | $75,179 |
| Graduate Degree | $121,944 | $73,438 |
| Total | $62,875 | $66,250 |
Family Income in Clarence
Family Income Brackets in Clarence
According to the Clarence family income data, there are 177 families falling into the $150,000 to $199,999 income range, which is the most common income bracket and makes up 27.4% of all families.
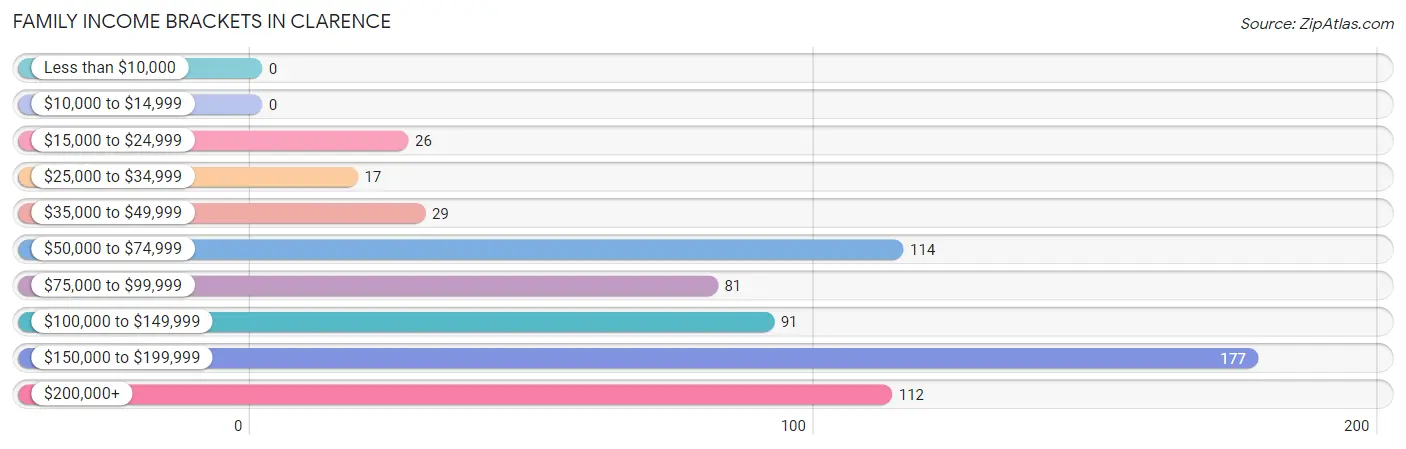
| Income Bracket | # Families | % Families |
| Less than $10,000 | 0 | 0.0% |
| $10,000 to $14,999 | 0 | 0.0% |
| $15,000 to $24,999 | 26 | 4.0% |
| $25,000 to $34,999 | 17 | 2.6% |
| $35,000 to $49,999 | 29 | 4.5% |
| $50,000 to $74,999 | 114 | 17.6% |
| $75,000 to $99,999 | 81 | 12.5% |
| $100,000 to $149,999 | 91 | 14.1% |
| $150,000 to $199,999 | 177 | 27.4% |
| $200,000+ | 112 | 17.3% |
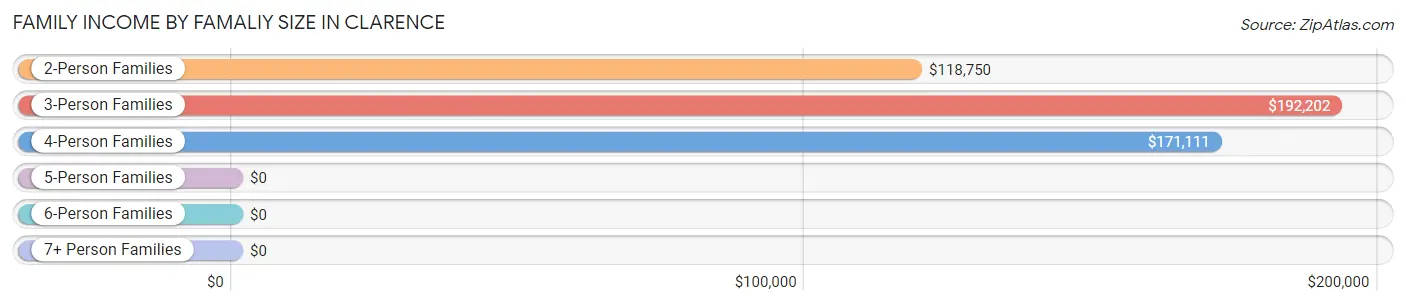
Family Income by Famaliy Size in Clarence
3-person families (81 | 12.5%) account for the highest median family income in Clarence with $192,202 per family, while 3-person families (81 | 12.5%) have the highest median income of $64,067 per family member.
| Income Bracket | # Families | Median Income |
| 2-Person Families | 461 (71.3%) | $118,750 |
| 3-Person Families | 81 (12.5%) | $192,202 |
| 4-Person Families | 42 (6.5%) | $171,111 |
| 5-Person Families | 51 (7.9%) | $0 |
| 6-Person Families | 12 (1.8%) | $0 |
| 7+ Person Families | 0 (0.0%) | $0 |
| Total | 647 (100.0%) | $120,365 |
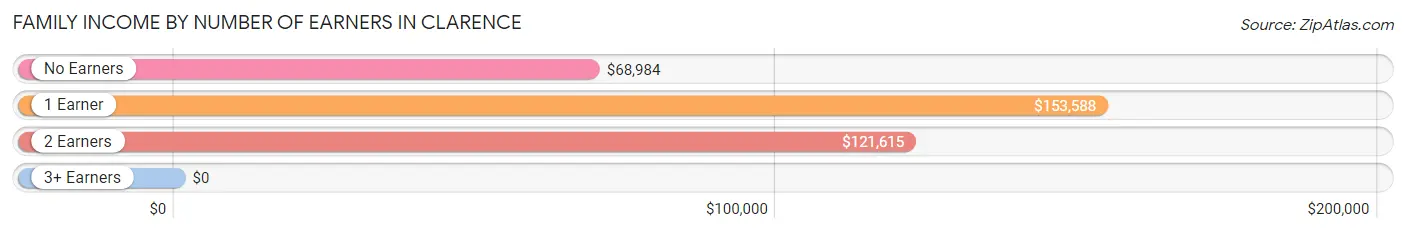
Family Income by Number of Earners in Clarence
| Number of Earners | # Families | Median Income |
| No Earners | 129 (19.9%) | $68,984 |
| 1 Earner | 221 (34.2%) | $153,588 |
| 2 Earners | 239 (36.9%) | $121,615 |
| 3+ Earners | 58 (9.0%) | $0 |
| Total | 647 (100.0%) | $120,365 |
Household Income in Clarence
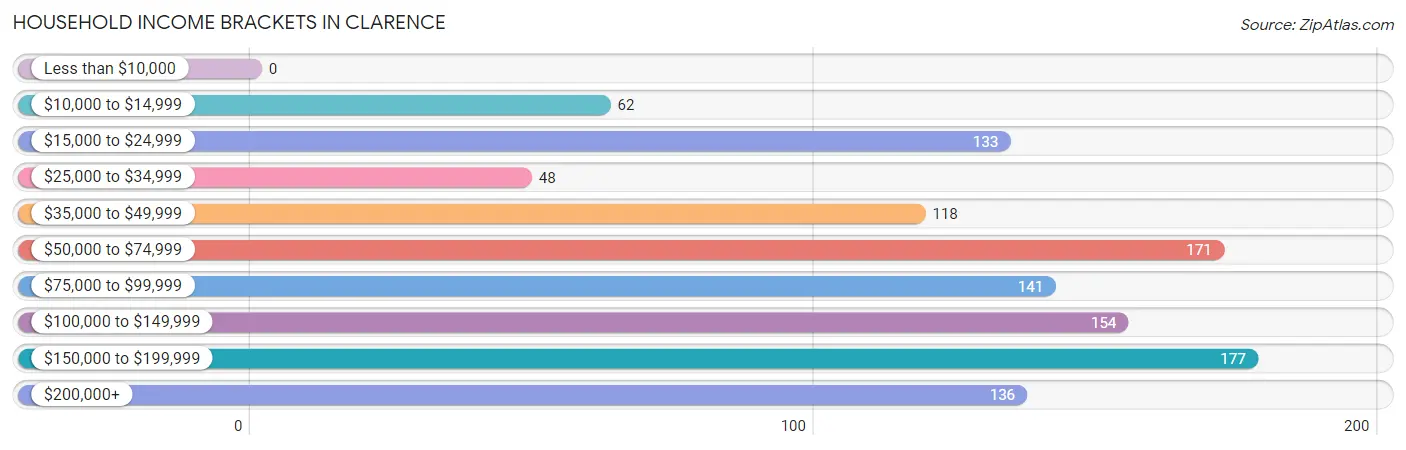
Household Income Brackets in Clarence
With 177 households falling in the category, the $150,000 to $199,999 income range is the most frequent in Clarence, accounting for 15.5% of all households.
| Income Bracket | # Households | % Households |
| Less than $10,000 | 0 | 0.0% |
| $10,000 to $14,999 | 62 | 5.4% |
| $15,000 to $24,999 | 133 | 11.7% |
| $25,000 to $34,999 | 48 | 4.2% |
| $35,000 to $49,999 | 118 | 10.4% |
| $50,000 to $74,999 | 171 | 15.0% |
| $75,000 to $99,999 | 141 | 12.4% |
| $100,000 to $149,999 | 154 | 13.5% |
| $150,000 to $199,999 | 177 | 15.5% |
| $200,000+ | 136 | 11.9% |
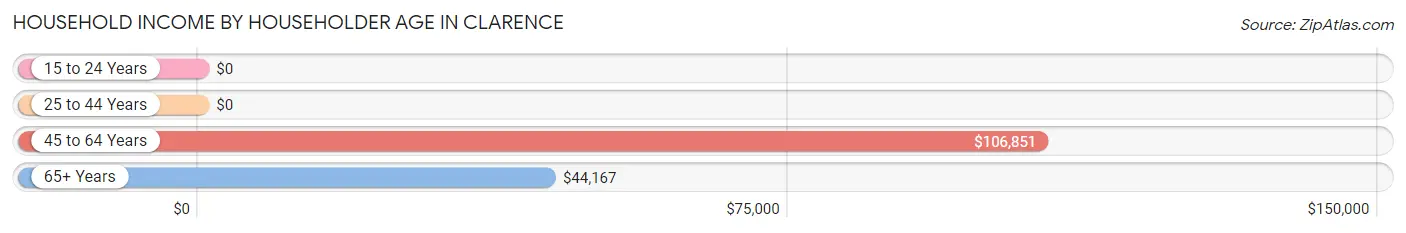
Household Income by Householder Age in Clarence
The median household income in Clarence is $80,737, with the highest median household income of $106,851 found in the 45 to 64 years age bracket for the primary householder. A total of 493 households (43.3%) fall into this category. Meanwhile, the 15 to 24 years age bracket for the primary householder has the lowest median household income of $0, with 24 households (2.1%) in this group.
| Income Bracket | # Households | Median Income |
| 15 to 24 Years | 24 (2.1%) | $0 |
| 25 to 44 Years | 158 (13.9%) | $0 |
| 45 to 64 Years | 493 (43.3%) | $106,851 |
| 65+ Years | 464 (40.7%) | $44,167 |
| Total | 1,139 (100.0%) | $80,737 |
Poverty in Clarence
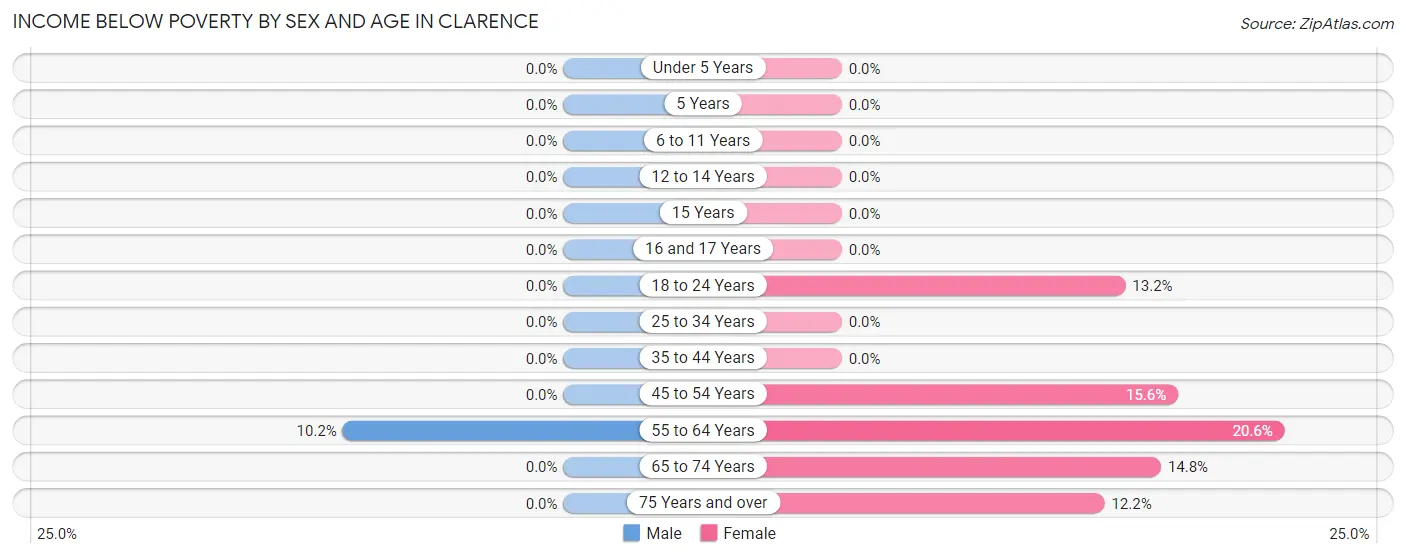
Income Below Poverty by Sex and Age in Clarence
With 2.2% poverty level for males and 12.4% for females among the residents of Clarence, 55 to 64 year old males and 55 to 64 year old females are the most vulnerable to poverty, with 26 males (10.2%) and 67 females (20.5%) in their respective age groups living below the poverty level.
| Age Bracket | Male | Female |
| Under 5 Years | 0 (0.0%) | 0 (0.0%) |
| 5 Years | 0 (0.0%) | 0 (0.0%) |
| 6 to 11 Years | 0 (0.0%) | 0 (0.0%) |
| 12 to 14 Years | 0 (0.0%) | 0 (0.0%) |
| 15 Years | 0 (0.0%) | 0 (0.0%) |
| 16 and 17 Years | 0 (0.0%) | 0 (0.0%) |
| 18 to 24 Years | 0 (0.0%) | 5 (13.2%) |
| 25 to 34 Years | 0 (0.0%) | 0 (0.0%) |
| 35 to 44 Years | 0 (0.0%) | 0 (0.0%) |
| 45 to 54 Years | 0 (0.0%) | 17 (15.6%) |
| 55 to 64 Years | 26 (10.2%) | 67 (20.5%) |
| 65 to 74 Years | 0 (0.0%) | 16 (14.8%) |
| 75 Years and over | 0 (0.0%) | 34 (12.2%) |
| Total | 26 (2.2%) | 139 (12.4%) |
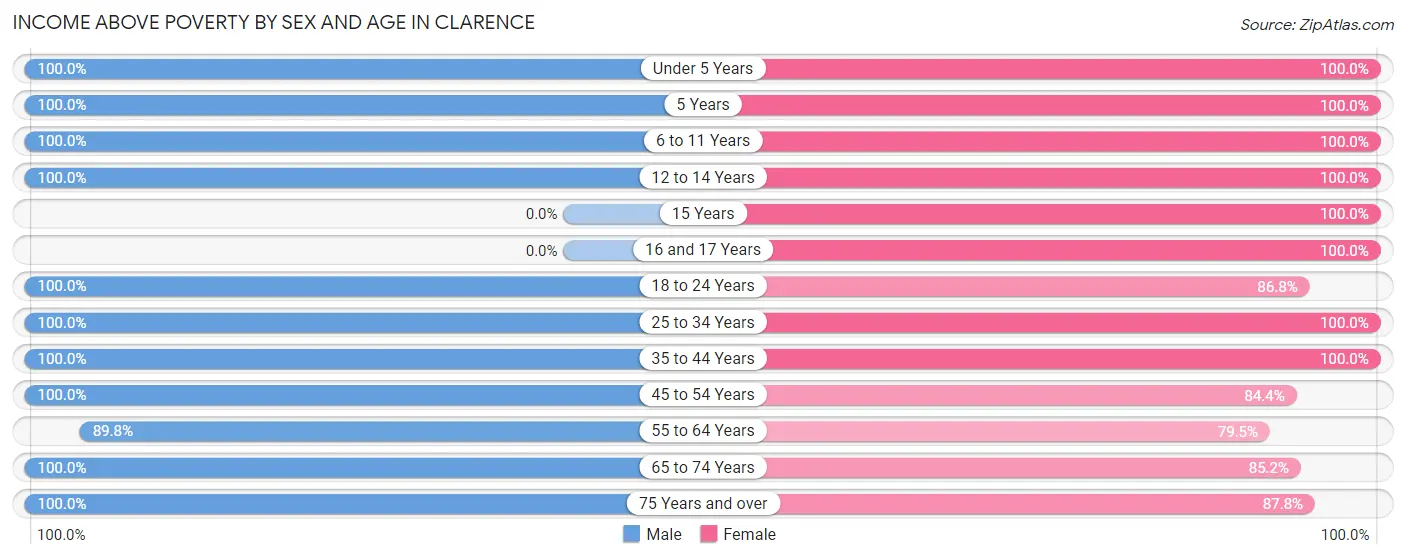
Income Above Poverty by Sex and Age in Clarence
According to the poverty statistics in Clarence, males aged under 5 years and females aged under 5 years are the age groups that are most secure financially, with 100.0% of males and 100.0% of females in these age groups living above the poverty line.
| Age Bracket | Male | Female |
| Under 5 Years | 67 (100.0%) | 18 (100.0%) |
| 5 Years | 50 (100.0%) | 17 (100.0%) |
| 6 to 11 Years | 75 (100.0%) | 12 (100.0%) |
| 12 to 14 Years | 36 (100.0%) | 13 (100.0%) |
| 15 Years | 0 (0.0%) | 14 (100.0%) |
| 16 and 17 Years | 0 (0.0%) | 13 (100.0%) |
| 18 to 24 Years | 45 (100.0%) | 33 (86.8%) |
| 25 to 34 Years | 120 (100.0%) | 98 (100.0%) |
| 35 to 44 Years | 59 (100.0%) | 75 (100.0%) |
| 45 to 54 Years | 91 (100.0%) | 92 (84.4%) |
| 55 to 64 Years | 228 (89.8%) | 259 (79.4%) |
| 65 to 74 Years | 242 (100.0%) | 92 (85.2%) |
| 75 Years and over | 163 (100.0%) | 245 (87.8%) |
| Total | 1,176 (97.8%) | 981 (87.6%) |
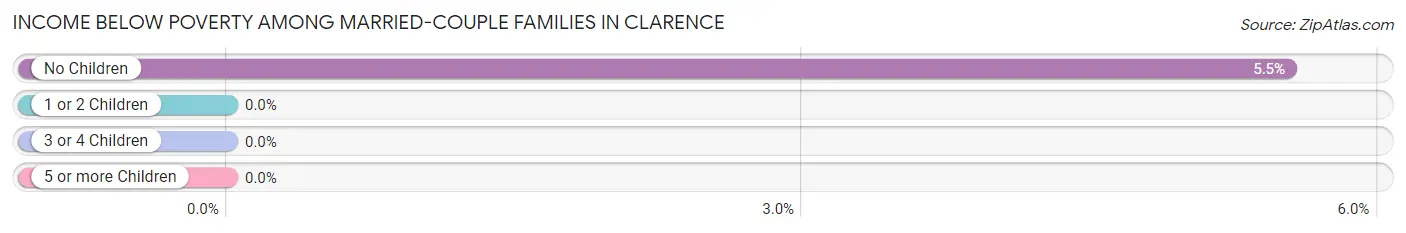
Income Below Poverty Among Married-Couple Families in Clarence
The poverty statistics for married-couple families in Clarence show that 4.5% or 26 of the total 573 families live below the poverty line. Families with no children have the highest poverty rate of 5.5%, comprising of 26 families. On the other hand, families with 1 or 2 children have the lowest poverty rate of 0.0%, which includes 0 families.
| Children | Above Poverty | Below Poverty |
| No Children | 444 (94.5%) | 26 (5.5%) |
| 1 or 2 Children | 52 (100.0%) | 0 (0.0%) |
| 3 or 4 Children | 51 (100.0%) | 0 (0.0%) |
| 5 or more Children | 0 (0.0%) | 0 (0.0%) |
| Total | 547 (95.5%) | 26 (4.5%) |
Income Below Poverty Among Single-Parent Households in Clarence
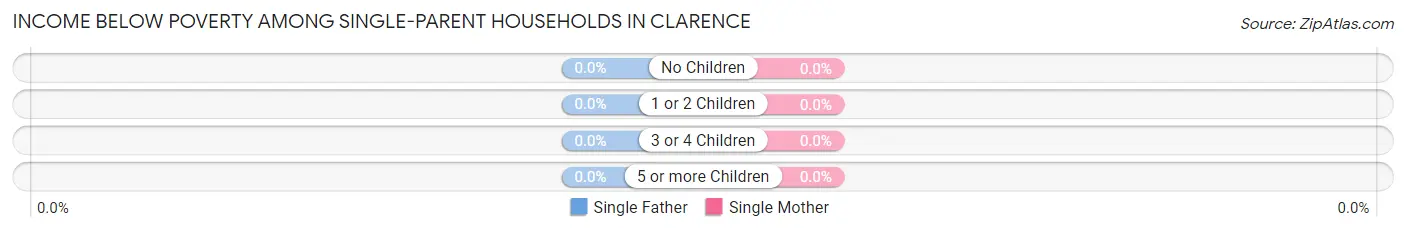
| Children | Single Father | Single Mother |
| No Children | 0 (0.0%) | 0 (0.0%) |
| 1 or 2 Children | 0 (0.0%) | 0 (0.0%) |
| 3 or 4 Children | 0 (0.0%) | 0 (0.0%) |
| 5 or more Children | 0 (0.0%) | 0 (0.0%) |
| Total | 0 (0.0%) | 0 (0.0%) |
Income Below Poverty Among Married-Couple vs Single-Parent Households in Clarence
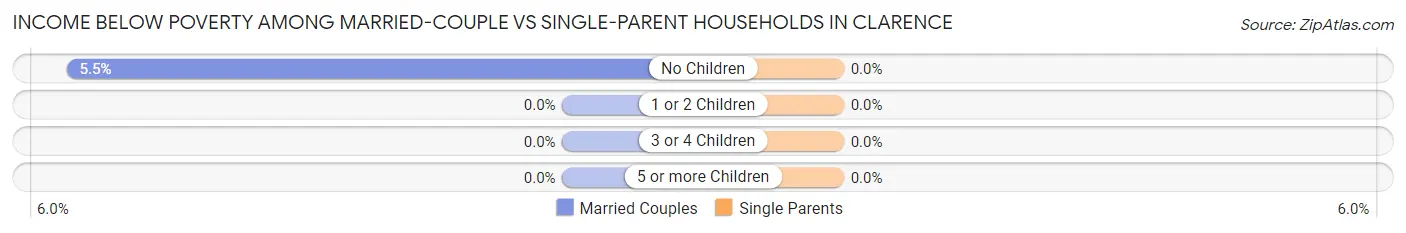
| Children | Married-Couple Families | Single-Parent Households |
| No Children | 26 (5.5%) | 0 (0.0%) |
| 1 or 2 Children | 0 (0.0%) | 0 (0.0%) |
| 3 or 4 Children | 0 (0.0%) | 0 (0.0%) |
| 5 or more Children | 0 (0.0%) | 0 (0.0%) |
| Total | 26 (4.5%) | 0 (0.0%) |
Employment Characteristics in Clarence
Employment by Class of Employer in Clarence
Among the 1,124 employed individuals in Clarence, private company employees (706 | 62.8%), state government employees (98 | 8.7%), and self-employed (not incorporated) (90 | 8.0%) make up the most common classes of employment.
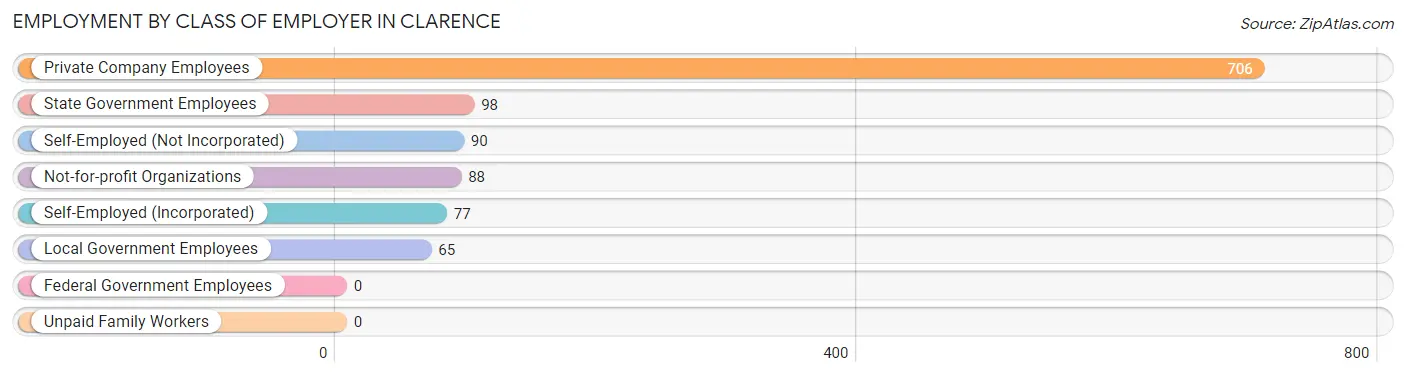
| Employer Class | # Employees | % Employees |
| Private Company Employees | 706 | 62.8% |
| Self-Employed (Incorporated) | 77 | 6.9% |
| Self-Employed (Not Incorporated) | 90 | 8.0% |
| Not-for-profit Organizations | 88 | 7.8% |
| Local Government Employees | 65 | 5.8% |
| State Government Employees | 98 | 8.7% |
| Federal Government Employees | 0 | 0.0% |
| Unpaid Family Workers | 0 | 0.0% |
| Total | 1,124 | 100.0% |
Employment Status by Age in Clarence
According to the labor force statistics for Clarence, out of the total population over 16 years of age (2,214), 52.5% or 1,162 individuals are in the labor force, with 3.4% or 40 of them unemployed. The age group with the highest labor force participation rate is 16 to 19 years, with 100.0% or 13 individuals in the labor force. Within the labor force, the 20 to 24 years age range has the highest percentage of unemployed individuals, with 32.9% or 24 of them being unemployed.
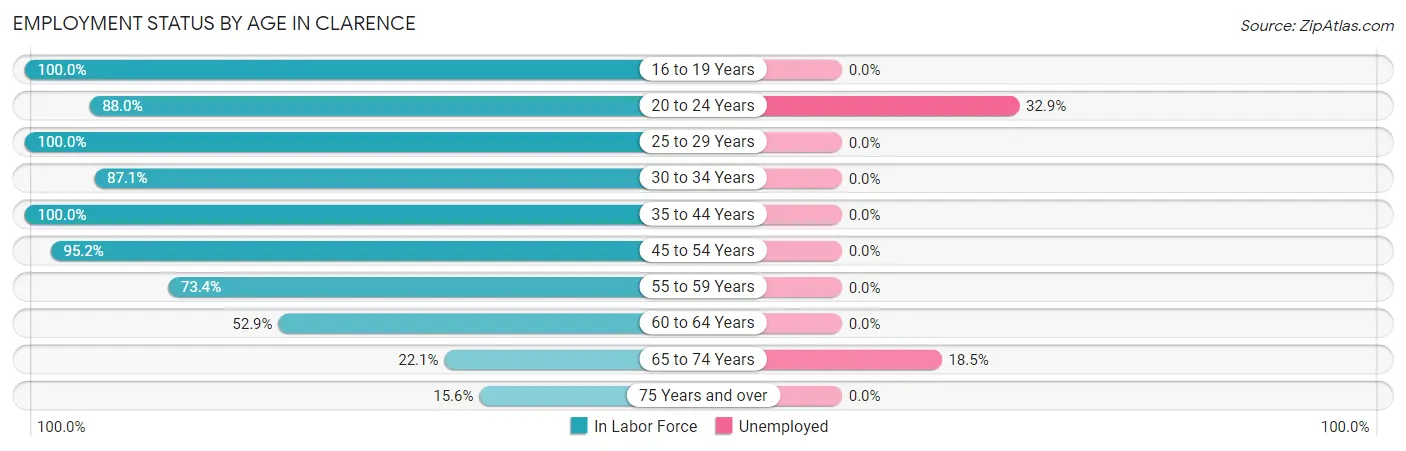
| Age Bracket | In Labor Force | Unemployed |
| 16 to 19 Years | 13 (100.0%) | 0 (0.0%) |
| 20 to 24 Years | 73 (88.0%) | 24 (32.9%) |
| 25 to 29 Years | 63 (100.0%) | 0 (0.0%) |
| 30 to 34 Years | 135 (87.1%) | 0 (0.0%) |
| 35 to 44 Years | 134 (100.0%) | 0 (0.0%) |
| 45 to 54 Years | 200 (95.2%) | 0 (0.0%) |
| 55 to 59 Years | 223 (73.4%) | 0 (0.0%) |
| 60 to 64 Years | 146 (52.9%) | 0 (0.0%) |
| 65 to 74 Years | 81 (22.1%) | 15 (18.5%) |
| 75 Years and over | 95 (15.6%) | 0 (0.0%) |
| Total | 1,162 (52.5%) | 40 (3.4%) |
Employment Status by Educational Attainment in Clarence
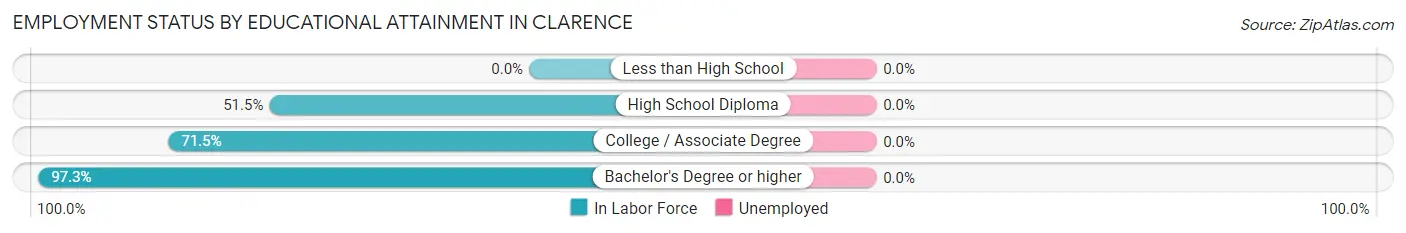
| Educational Attainment | In Labor Force | Unemployed |
| Less than High School | 0 (0.0%) | 0 (0.0%) |
| High School Diploma | 120 (51.5%) | 0 (0.0%) |
| College / Associate Degree | 274 (71.5%) | 0 (0.0%) |
| Bachelor's Degree or higher | 507 (97.3%) | 0 (0.0%) |
| Total | 901 (78.9%) | 0 (0.0%) |
Employment Occupations by Sex in Clarence
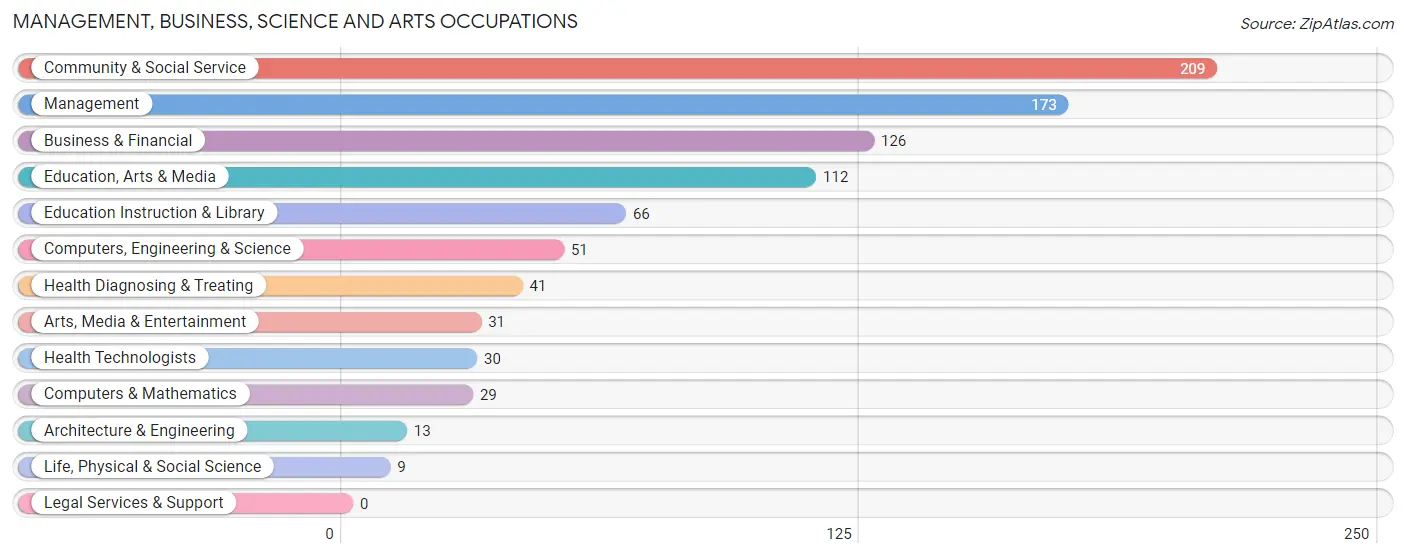
Management, Business, Science and Arts Occupations
The most common Management, Business, Science and Arts occupations in Clarence are Community & Social Service (209 | 18.6%), Management (173 | 15.4%), Business & Financial (126 | 11.2%), Education, Arts & Media (112 | 10.0%), and Education Instruction & Library (66 | 5.9%).
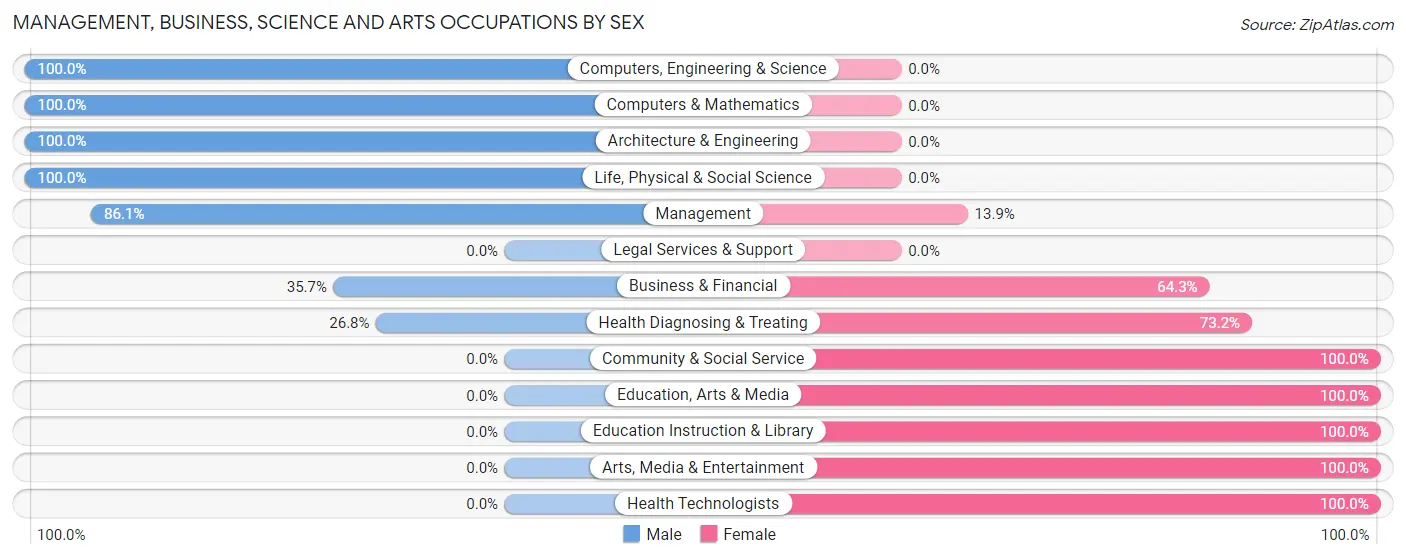
Management, Business, Science and Arts Occupations by Sex
Within the Management, Business, Science and Arts occupations in Clarence, the most male-oriented occupations are Computers, Engineering & Science (100.0%), Computers & Mathematics (100.0%), and Architecture & Engineering (100.0%), while the most female-oriented occupations are Community & Social Service (100.0%), Education, Arts & Media (100.0%), and Education Instruction & Library (100.0%).
| Occupation | Male | Female |
| Management | 149 (86.1%) | 24 (13.9%) |
| Business & Financial | 45 (35.7%) | 81 (64.3%) |
| Computers, Engineering & Science | 51 (100.0%) | 0 (0.0%) |
| Computers & Mathematics | 29 (100.0%) | 0 (0.0%) |
| Architecture & Engineering | 13 (100.0%) | 0 (0.0%) |
| Life, Physical & Social Science | 9 (100.0%) | 0 (0.0%) |
| Community & Social Service | 0 (0.0%) | 209 (100.0%) |
| Education, Arts & Media | 0 (0.0%) | 112 (100.0%) |
| Legal Services & Support | 0 (0.0%) | 0 (0.0%) |
| Education Instruction & Library | 0 (0.0%) | 66 (100.0%) |
| Arts, Media & Entertainment | 0 (0.0%) | 31 (100.0%) |
| Health Diagnosing & Treating | 11 (26.8%) | 30 (73.2%) |
| Health Technologists | 0 (0.0%) | 30 (100.0%) |
| Total (Category) | 256 (42.7%) | 344 (57.3%) |
| Total (Overall) | 560 (49.8%) | 564 (50.2%) |
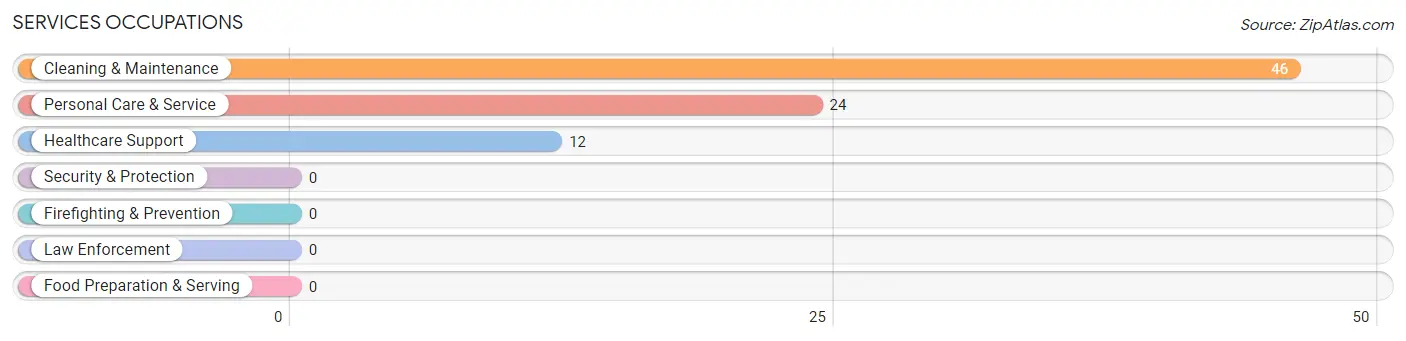
Services Occupations
The most common Services occupations in Clarence are Cleaning & Maintenance (46 | 4.1%), Personal Care & Service (24 | 2.1%), and Healthcare Support (12 | 1.1%).
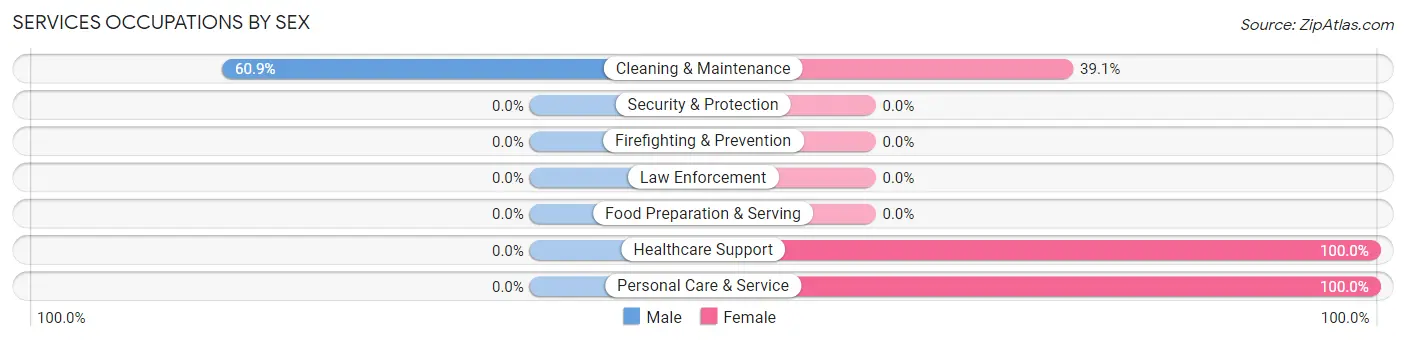
Services Occupations by Sex
| Occupation | Male | Female |
| Healthcare Support | 0 (0.0%) | 12 (100.0%) |
| Security & Protection | 0 (0.0%) | 0 (0.0%) |
| Firefighting & Prevention | 0 (0.0%) | 0 (0.0%) |
| Law Enforcement | 0 (0.0%) | 0 (0.0%) |
| Food Preparation & Serving | 0 (0.0%) | 0 (0.0%) |
| Cleaning & Maintenance | 28 (60.9%) | 18 (39.1%) |
| Personal Care & Service | 0 (0.0%) | 24 (100.0%) |
| Total (Category) | 28 (34.2%) | 54 (65.8%) |
| Total (Overall) | 560 (49.8%) | 564 (50.2%) |
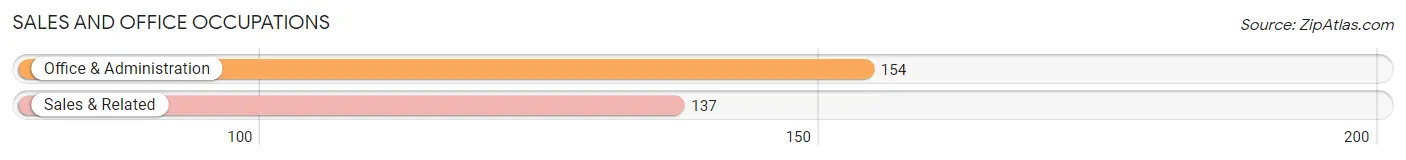
Sales and Office Occupations
The most common Sales and Office occupations in Clarence are Office & Administration (154 | 13.7%), and Sales & Related (137 | 12.2%).
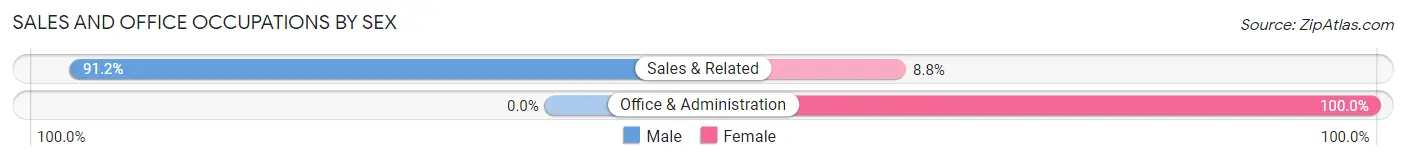
Sales and Office Occupations by Sex
| Occupation | Male | Female |
| Sales & Related | 125 (91.2%) | 12 (8.8%) |
| Office & Administration | 0 (0.0%) | 154 (100.0%) |
| Total (Category) | 125 (43.0%) | 166 (57.0%) |
| Total (Overall) | 560 (49.8%) | 564 (50.2%) |
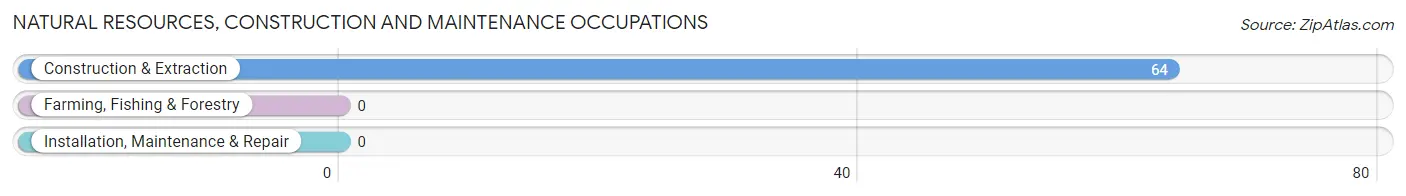
Natural Resources, Construction and Maintenance Occupations
The most common Natural Resources, Construction and Maintenance occupations in Clarence are , and Construction & Extraction (64 | 5.7%).
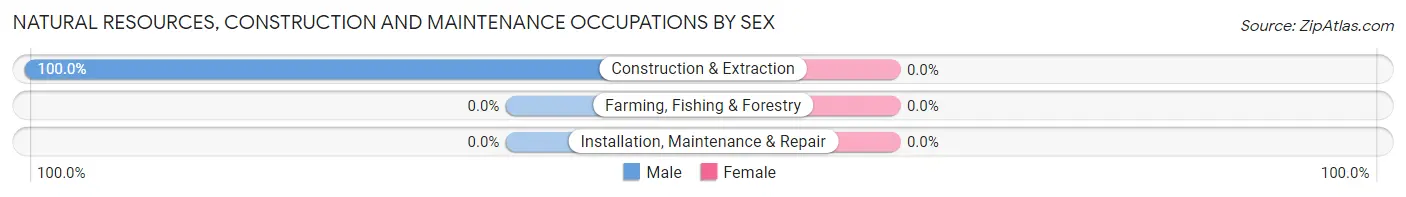
Natural Resources, Construction and Maintenance Occupations by Sex
| Occupation | Male | Female |
| Farming, Fishing & Forestry | 0 (0.0%) | 0 (0.0%) |
| Construction & Extraction | 64 (100.0%) | 0 (0.0%) |
| Installation, Maintenance & Repair | 0 (0.0%) | 0 (0.0%) |
| Total (Category) | 64 (100.0%) | 0 (0.0%) |
| Total (Overall) | 560 (49.8%) | 564 (50.2%) |
Production, Transportation and Moving Occupations
The most common Production, Transportation and Moving occupations in Clarence are Transportation (72 | 6.4%), and Production (15 | 1.3%).
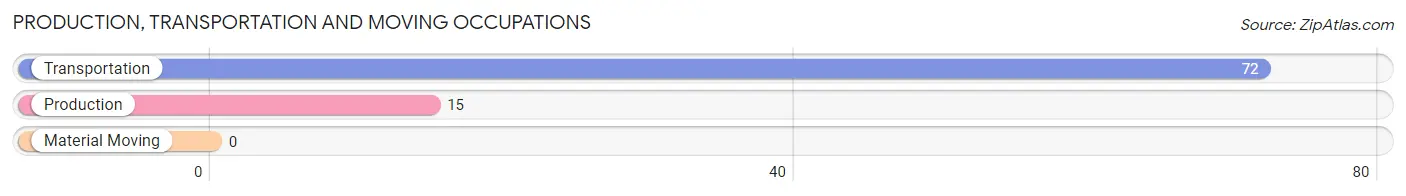
Production, Transportation and Moving Occupations by Sex
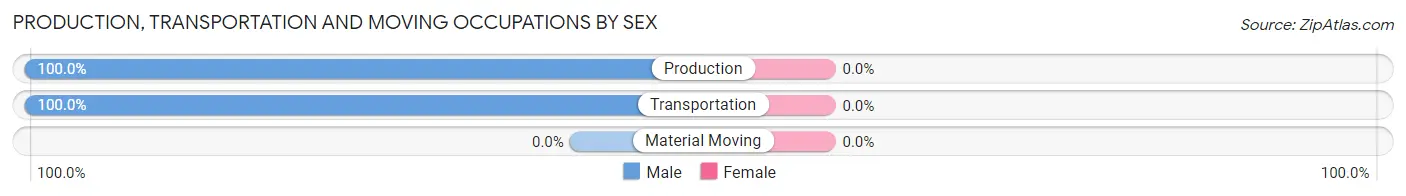
| Occupation | Male | Female |
| Production | 15 (100.0%) | 0 (0.0%) |
| Transportation | 72 (100.0%) | 0 (0.0%) |
| Material Moving | 0 (0.0%) | 0 (0.0%) |
| Total (Category) | 87 (100.0%) | 0 (0.0%) |
| Total (Overall) | 560 (49.8%) | 564 (50.2%) |
Employment Industries by Sex in Clarence
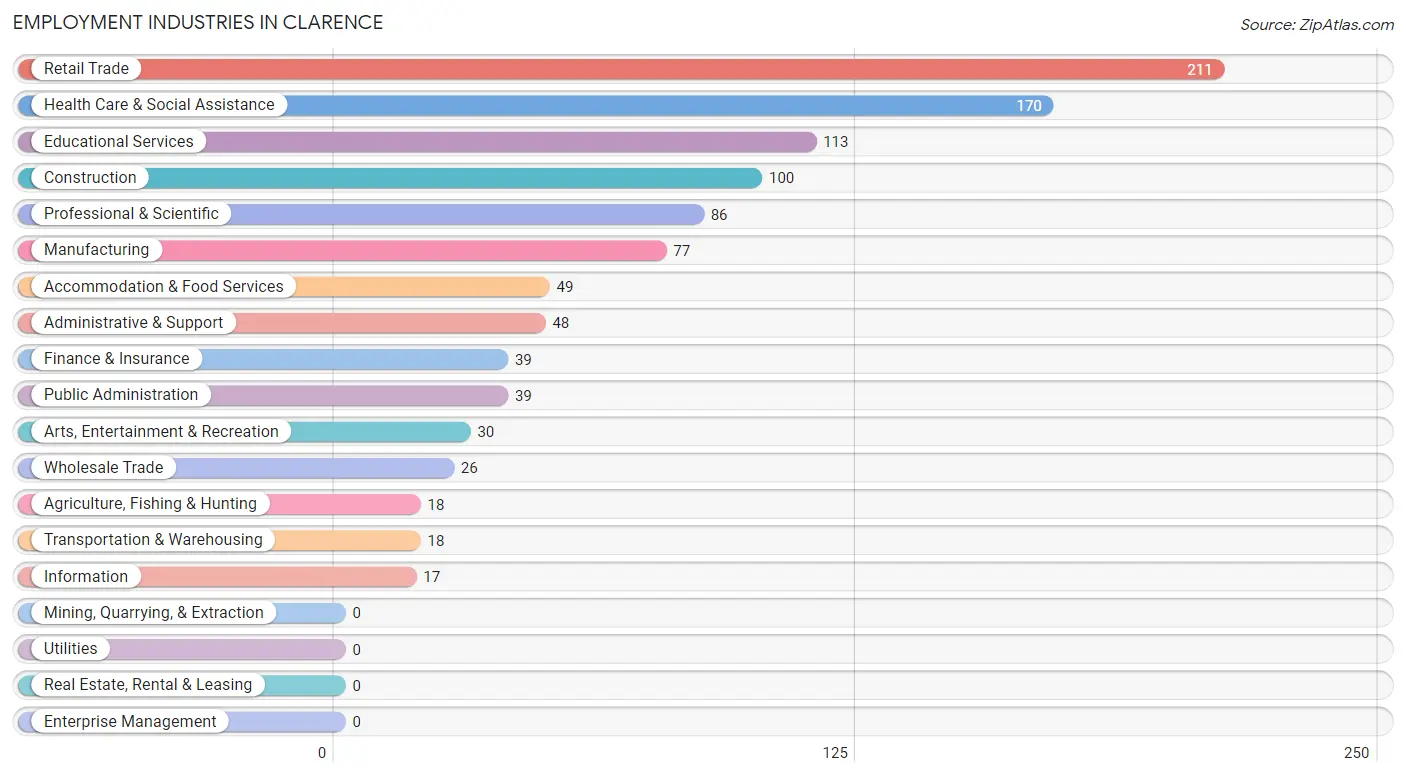
Employment Industries in Clarence
The major employment industries in Clarence include Retail Trade (211 | 18.8%), Health Care & Social Assistance (170 | 15.1%), Educational Services (113 | 10.1%), Construction (100 | 8.9%), and Professional & Scientific (86 | 7.6%).
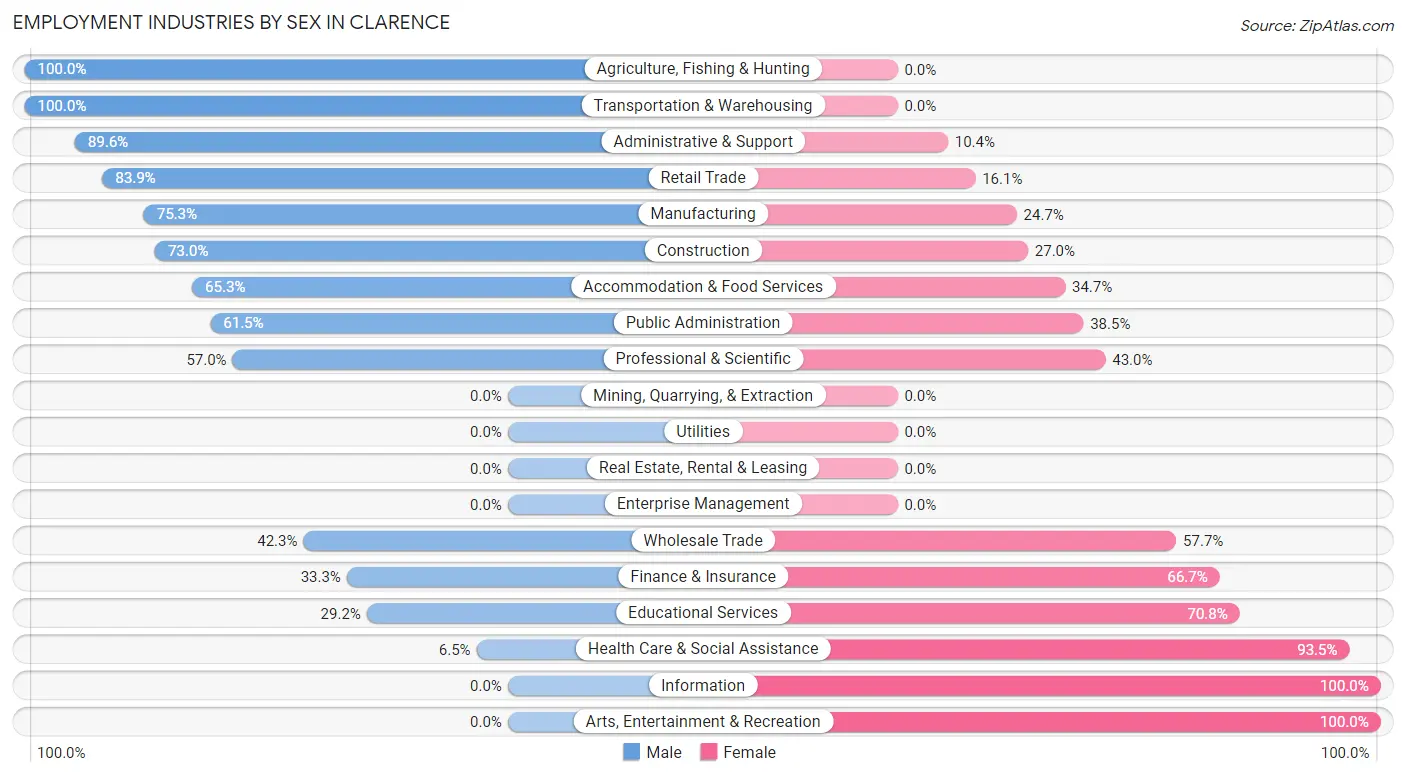
Employment Industries by Sex in Clarence
The Clarence industries that see more men than women are Agriculture, Fishing & Hunting (100.0%), Transportation & Warehousing (100.0%), and Administrative & Support (89.6%), whereas the industries that tend to have a higher number of women are Information (100.0%), Arts, Entertainment & Recreation (100.0%), and Health Care & Social Assistance (93.5%).
| Industry | Male | Female |
| Agriculture, Fishing & Hunting | 18 (100.0%) | 0 (0.0%) |
| Mining, Quarrying, & Extraction | 0 (0.0%) | 0 (0.0%) |
| Construction | 73 (73.0%) | 27 (27.0%) |
| Manufacturing | 58 (75.3%) | 19 (24.7%) |
| Wholesale Trade | 11 (42.3%) | 15 (57.7%) |
| Retail Trade | 177 (83.9%) | 34 (16.1%) |
| Transportation & Warehousing | 18 (100.0%) | 0 (0.0%) |
| Utilities | 0 (0.0%) | 0 (0.0%) |
| Information | 0 (0.0%) | 17 (100.0%) |
| Finance & Insurance | 13 (33.3%) | 26 (66.7%) |
| Real Estate, Rental & Leasing | 0 (0.0%) | 0 (0.0%) |
| Professional & Scientific | 49 (57.0%) | 37 (43.0%) |
| Enterprise Management | 0 (0.0%) | 0 (0.0%) |
| Administrative & Support | 43 (89.6%) | 5 (10.4%) |
| Educational Services | 33 (29.2%) | 80 (70.8%) |
| Health Care & Social Assistance | 11 (6.5%) | 159 (93.5%) |
| Arts, Entertainment & Recreation | 0 (0.0%) | 30 (100.0%) |
| Accommodation & Food Services | 32 (65.3%) | 17 (34.7%) |
| Public Administration | 24 (61.5%) | 15 (38.5%) |
| Total | 560 (49.8%) | 564 (50.2%) |
Education in Clarence
School Enrollment in Clarence
The most common levels of schooling among the 287 students in Clarence are middle school (79 | 27.5%), elementary school (52 | 18.1%), and high school (39 | 13.6%).
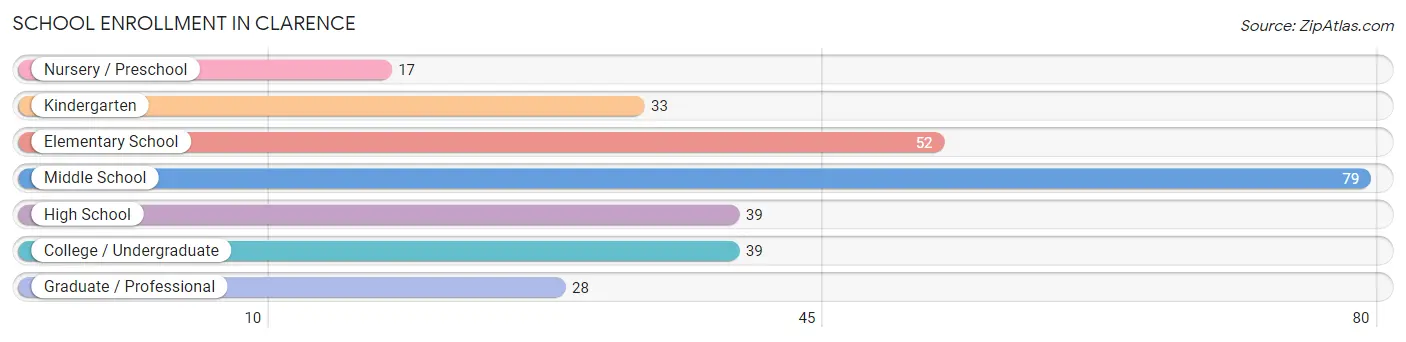
| School Level | # Students | % Students |
| Nursery / Preschool | 17 | 5.9% |
| Kindergarten | 33 | 11.5% |
| Elementary School | 52 | 18.1% |
| Middle School | 79 | 27.5% |
| High School | 39 | 13.6% |
| College / Undergraduate | 39 | 13.6% |
| Graduate / Professional | 28 | 9.8% |
| Total | 287 | 100.0% |
School Enrollment by Age by Funding Source in Clarence
Out of a total of 287 students who are enrolled in schools in Clarence, 61 (21.3%) attend a private institution, while the remaining 226 (78.7%) are enrolled in public schools. The age group of 25 to 34 year olds has the highest likelihood of being enrolled in private schools, with 18 (64.3% in the age bracket) enrolled. Conversely, the age group of 10 to 14 year olds has the lowest likelihood of being enrolled in a private school, with 91 (100.0% in the age bracket) attending a public institution.
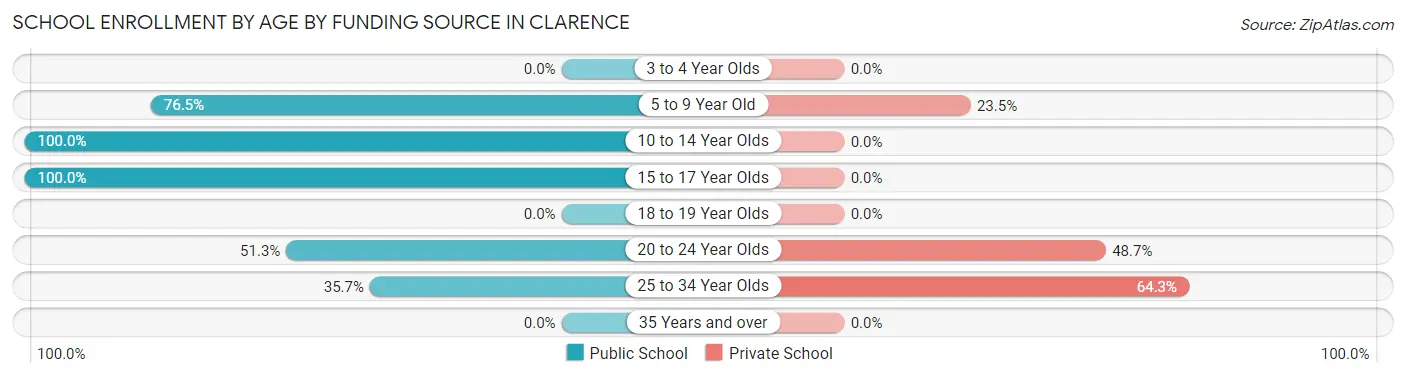
| Age Bracket | Public School | Private School |
| 3 to 4 Year Olds | 0 (0.0%) | 0 (0.0%) |
| 5 to 9 Year Old | 78 (76.5%) | 24 (23.5%) |
| 10 to 14 Year Olds | 91 (100.0%) | 0 (0.0%) |
| 15 to 17 Year Olds | 27 (100.0%) | 0 (0.0%) |
| 18 to 19 Year Olds | 0 (0.0%) | 0 (0.0%) |
| 20 to 24 Year Olds | 20 (51.3%) | 19 (48.7%) |
| 25 to 34 Year Olds | 10 (35.7%) | 18 (64.3%) |
| 35 Years and over | 0 (0.0%) | 0 (0.0%) |
| Total | 226 (78.7%) | 61 (21.3%) |
Educational Attainment by Field of Study in Clarence
Business (294 | 30.2%), education (150 | 15.4%), science & technology (139 | 14.3%), communications (97 | 10.0%), and computers & mathematics (57 | 5.9%) are the most common fields of study among 973 individuals in Clarence who have obtained a bachelor's degree or higher.
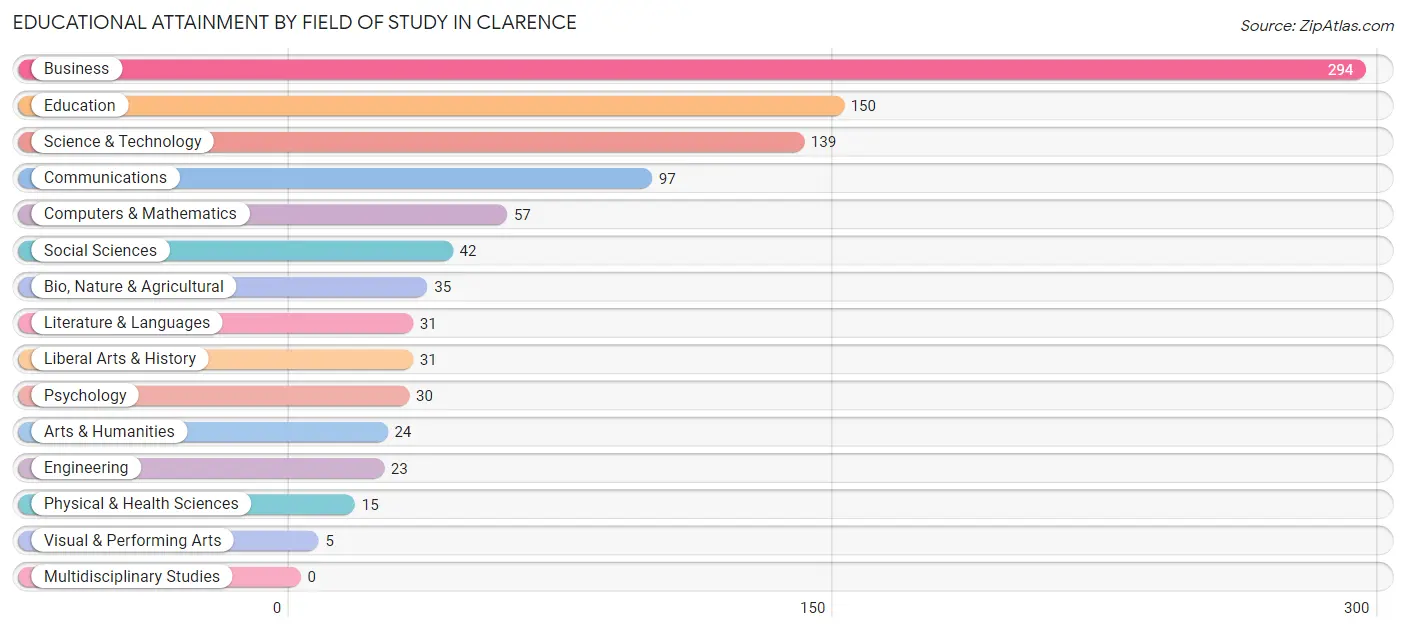
| Field of Study | # Graduates | % Graduates |
| Computers & Mathematics | 57 | 5.9% |
| Bio, Nature & Agricultural | 35 | 3.6% |
| Physical & Health Sciences | 15 | 1.5% |
| Psychology | 30 | 3.1% |
| Social Sciences | 42 | 4.3% |
| Engineering | 23 | 2.4% |
| Multidisciplinary Studies | 0 | 0.0% |
| Science & Technology | 139 | 14.3% |
| Business | 294 | 30.2% |
| Education | 150 | 15.4% |
| Literature & Languages | 31 | 3.2% |
| Liberal Arts & History | 31 | 3.2% |
| Visual & Performing Arts | 5 | 0.5% |
| Communications | 97 | 10.0% |
| Arts & Humanities | 24 | 2.5% |
| Total | 973 | 100.0% |
Transportation & Commute in Clarence
Vehicle Availability by Sex in Clarence
The most prevalent vehicle ownership categories in Clarence are males with 2 vehicles (307, accounting for 54.8%) and females with 2 vehicles (379, making up 54.4%).
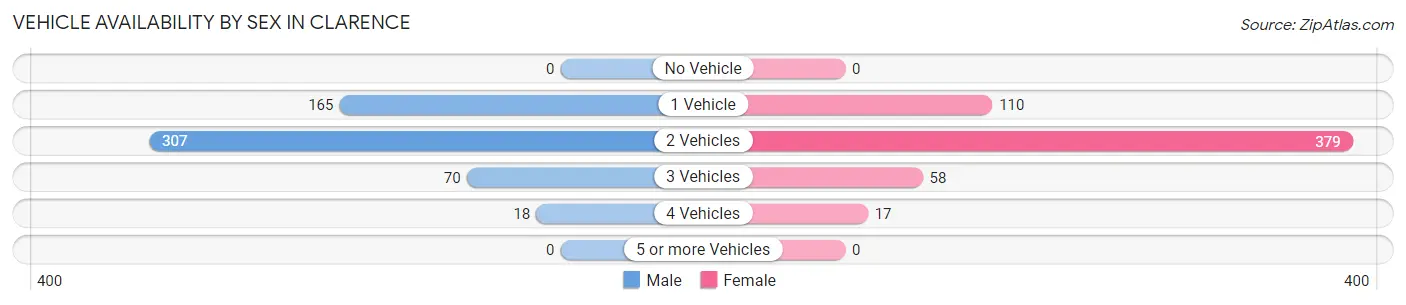
| Vehicles Available | Male | Female |
| No Vehicle | 0 (0.0%) | 0 (0.0%) |
| 1 Vehicle | 165 (29.5%) | 110 (19.5%) |
| 2 Vehicles | 307 (54.8%) | 379 (67.2%) |
| 3 Vehicles | 70 (12.5%) | 58 (10.3%) |
| 4 Vehicles | 18 (3.2%) | 17 (3.0%) |
| 5 or more Vehicles | 0 (0.0%) | 0 (0.0%) |
| Total | 560 (100.0%) | 564 (100.0%) |
Commute Time in Clarence
The most frequently occuring commute durations in Clarence are 30 to 34 minutes (190 commuters, 20.8%), 10 to 14 minutes (152 commuters, 16.7%), and 20 to 24 minutes (144 commuters, 15.8%).
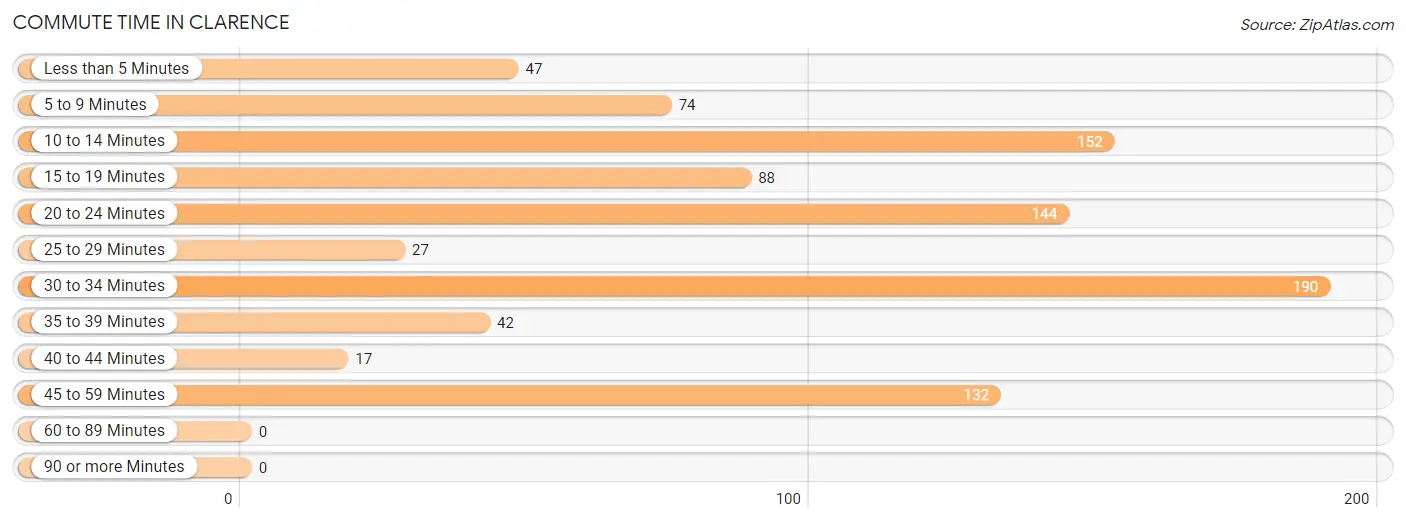
| Commute Time | # Commuters | % Commuters |
| Less than 5 Minutes | 47 | 5.1% |
| 5 to 9 Minutes | 74 | 8.1% |
| 10 to 14 Minutes | 152 | 16.7% |
| 15 to 19 Minutes | 88 | 9.6% |
| 20 to 24 Minutes | 144 | 15.8% |
| 25 to 29 Minutes | 27 | 3.0% |
| 30 to 34 Minutes | 190 | 20.8% |
| 35 to 39 Minutes | 42 | 4.6% |
| 40 to 44 Minutes | 17 | 1.9% |
| 45 to 59 Minutes | 132 | 14.5% |
| 60 to 89 Minutes | 0 | 0.0% |
| 90 or more Minutes | 0 | 0.0% |
Commute Time by Sex in Clarence
The most common commute times in Clarence are 30 to 34 minutes (122 commuters, 23.5%) for males and 30 to 34 minutes (68 commuters, 17.2%) for females.
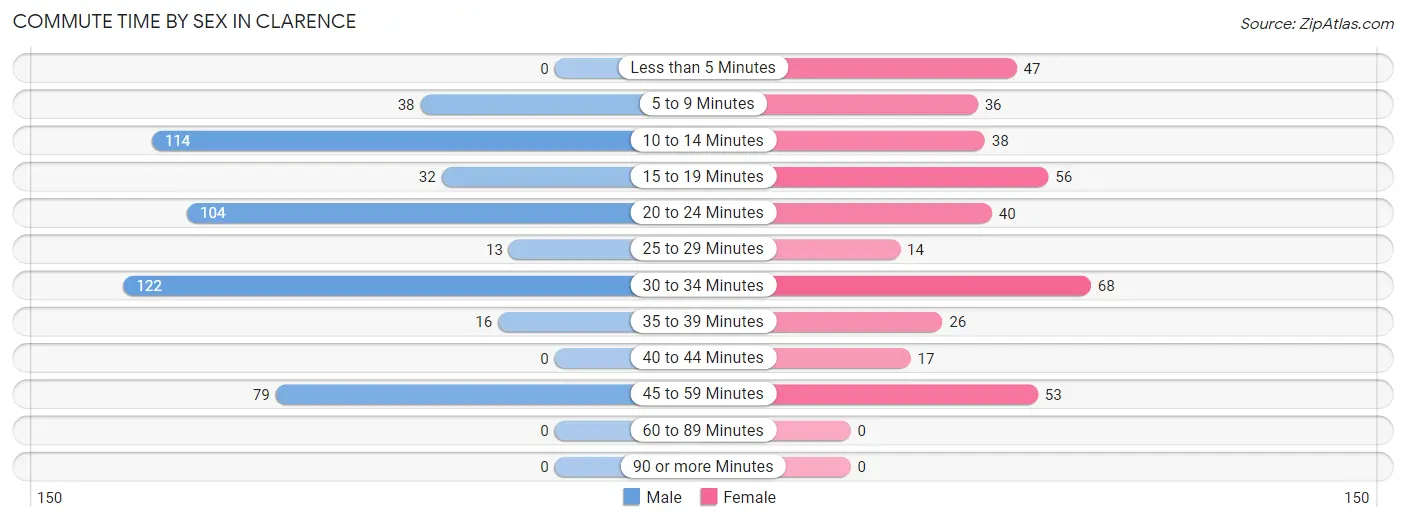
| Commute Time | Male | Female |
| Less than 5 Minutes | 0 (0.0%) | 47 (11.9%) |
| 5 to 9 Minutes | 38 (7.3%) | 36 (9.1%) |
| 10 to 14 Minutes | 114 (22.0%) | 38 (9.6%) |
| 15 to 19 Minutes | 32 (6.2%) | 56 (14.2%) |
| 20 to 24 Minutes | 104 (20.1%) | 40 (10.1%) |
| 25 to 29 Minutes | 13 (2.5%) | 14 (3.5%) |
| 30 to 34 Minutes | 122 (23.5%) | 68 (17.2%) |
| 35 to 39 Minutes | 16 (3.1%) | 26 (6.6%) |
| 40 to 44 Minutes | 0 (0.0%) | 17 (4.3%) |
| 45 to 59 Minutes | 79 (15.2%) | 53 (13.4%) |
| 60 to 89 Minutes | 0 (0.0%) | 0 (0.0%) |
| 90 or more Minutes | 0 (0.0%) | 0 (0.0%) |
Time of Departure to Work by Sex in Clarence
The most frequent times of departure to work in Clarence are 7:30 AM to 7:59 AM (131, 25.3%) for males and 8:00 AM to 8:29 AM (105, 26.6%) for females.
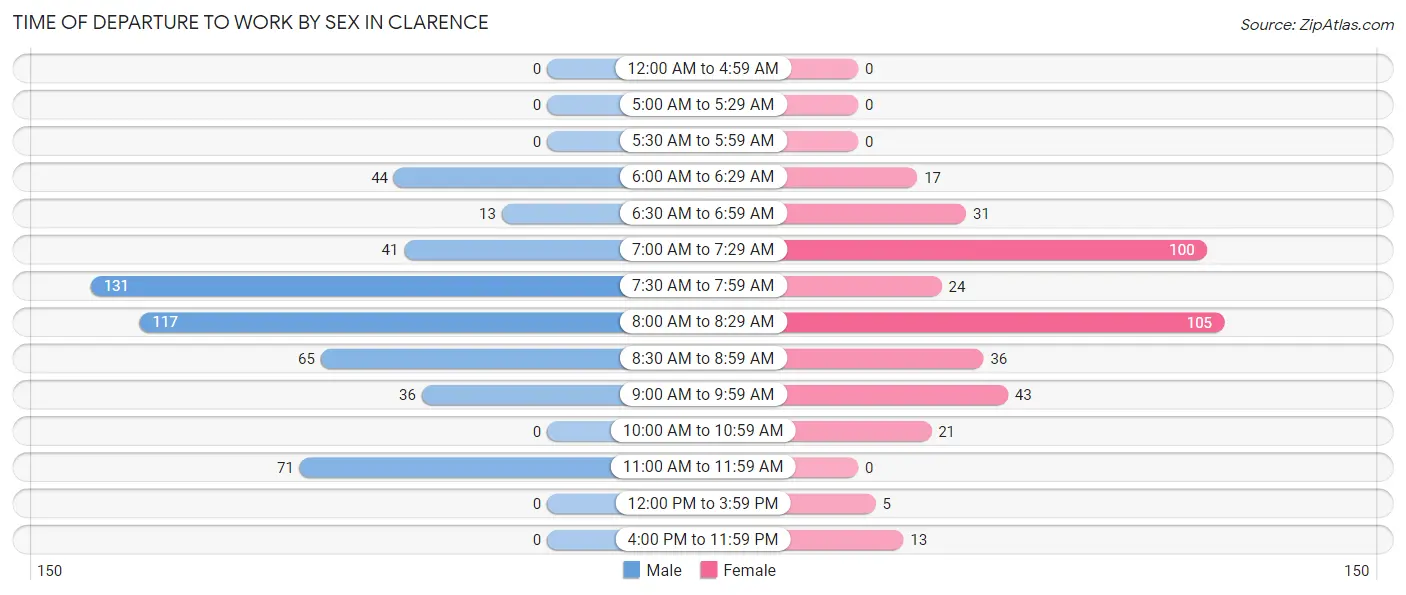
| Time of Departure | Male | Female |
| 12:00 AM to 4:59 AM | 0 (0.0%) | 0 (0.0%) |
| 5:00 AM to 5:29 AM | 0 (0.0%) | 0 (0.0%) |
| 5:30 AM to 5:59 AM | 0 (0.0%) | 0 (0.0%) |
| 6:00 AM to 6:29 AM | 44 (8.5%) | 17 (4.3%) |
| 6:30 AM to 6:59 AM | 13 (2.5%) | 31 (7.9%) |
| 7:00 AM to 7:29 AM | 41 (7.9%) | 100 (25.3%) |
| 7:30 AM to 7:59 AM | 131 (25.3%) | 24 (6.1%) |
| 8:00 AM to 8:29 AM | 117 (22.6%) | 105 (26.6%) |
| 8:30 AM to 8:59 AM | 65 (12.6%) | 36 (9.1%) |
| 9:00 AM to 9:59 AM | 36 (7.0%) | 43 (10.9%) |
| 10:00 AM to 10:59 AM | 0 (0.0%) | 21 (5.3%) |
| 11:00 AM to 11:59 AM | 71 (13.7%) | 0 (0.0%) |
| 12:00 PM to 3:59 PM | 0 (0.0%) | 5 (1.3%) |
| 4:00 PM to 11:59 PM | 0 (0.0%) | 13 (3.3%) |
| Total | 518 (100.0%) | 395 (100.0%) |
Housing Occupancy in Clarence
Occupancy by Ownership in Clarence
Of the total 1,139 dwellings in Clarence, owner-occupied units account for 736 (64.6%), while renter-occupied units make up 403 (35.4%).
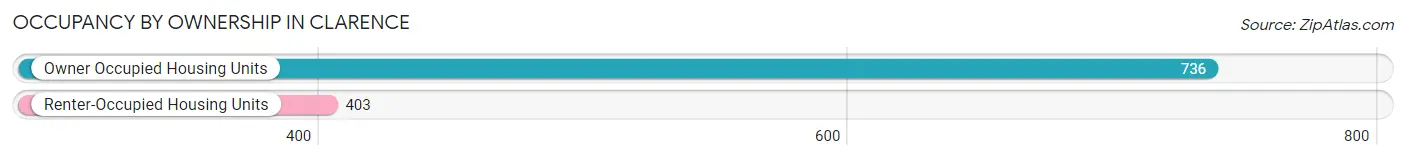
| Occupancy | # Housing Units | % Housing Units |
| Owner Occupied Housing Units | 736 | 64.6% |
| Renter-Occupied Housing Units | 403 | 35.4% |
| Total Occupied Housing Units | 1,139 | 100.0% |
Occupancy by Household Size in Clarence
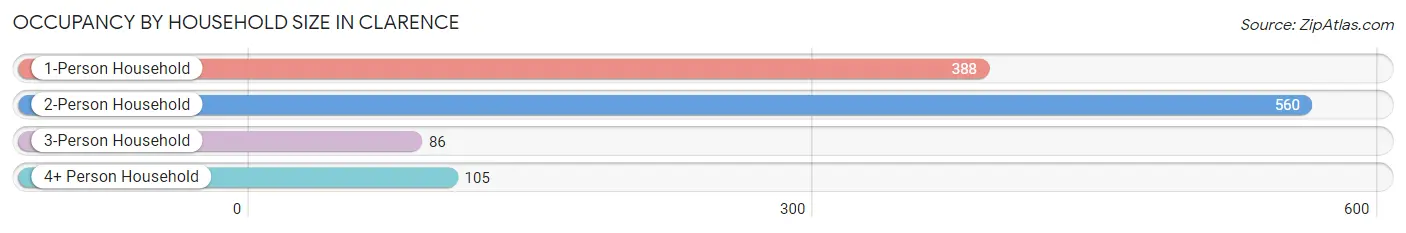
| Household Size | # Housing Units | % Housing Units |
| 1-Person Household | 388 | 34.1% |
| 2-Person Household | 560 | 49.2% |
| 3-Person Household | 86 | 7.5% |
| 4+ Person Household | 105 | 9.2% |
| Total Housing Units | 1,139 | 100.0% |
Occupancy by Ownership by Household Size in Clarence
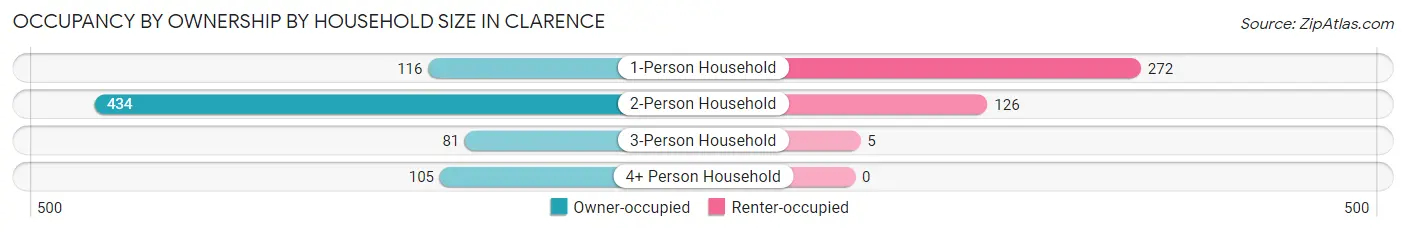
| Household Size | Owner-occupied | Renter-occupied |
| 1-Person Household | 116 (29.9%) | 272 (70.1%) |
| 2-Person Household | 434 (77.5%) | 126 (22.5%) |
| 3-Person Household | 81 (94.2%) | 5 (5.8%) |
| 4+ Person Household | 105 (100.0%) | 0 (0.0%) |
| Total Housing Units | 736 (64.6%) | 403 (35.4%) |
Occupancy by Educational Attainment in Clarence
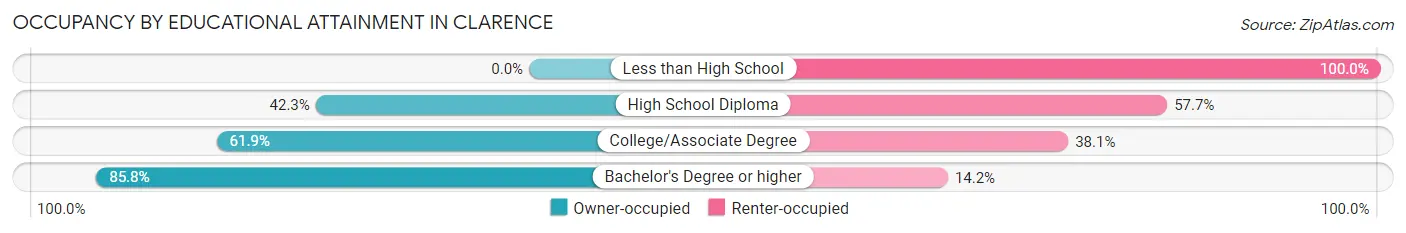
| Household Size | Owner-occupied | Renter-occupied |
| Less than High School | 0 (0.0%) | 35 (100.0%) |
| High School Diploma | 140 (42.3%) | 191 (57.7%) |
| College/Associate Degree | 174 (61.9%) | 107 (38.1%) |
| Bachelor's Degree or higher | 422 (85.8%) | 70 (14.2%) |
Occupancy by Age of Householder in Clarence
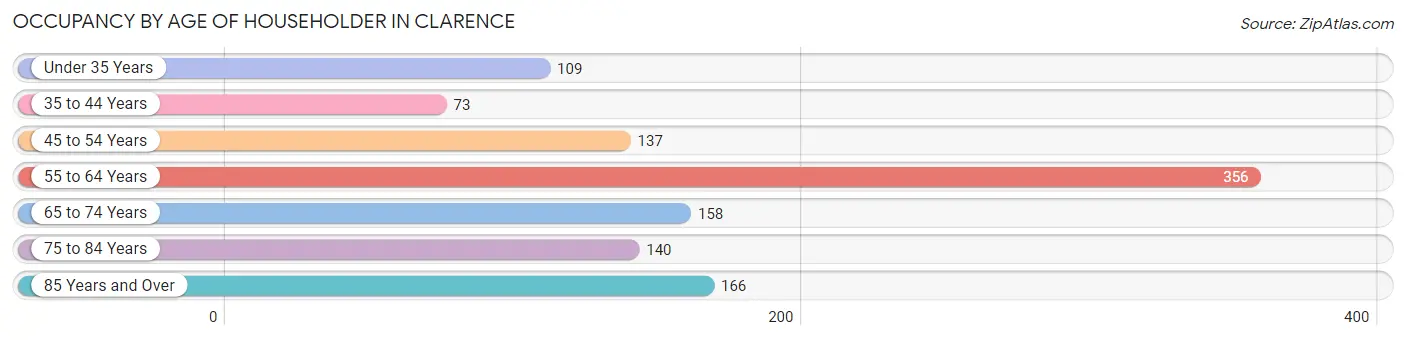
| Age Bracket | # Households | % Households |
| Under 35 Years | 109 | 9.6% |
| 35 to 44 Years | 73 | 6.4% |
| 45 to 54 Years | 137 | 12.0% |
| 55 to 64 Years | 356 | 31.3% |
| 65 to 74 Years | 158 | 13.9% |
| 75 to 84 Years | 140 | 12.3% |
| 85 Years and Over | 166 | 14.6% |
| Total | 1,139 | 100.0% |
Housing Finances in Clarence
Median Income by Occupancy in Clarence
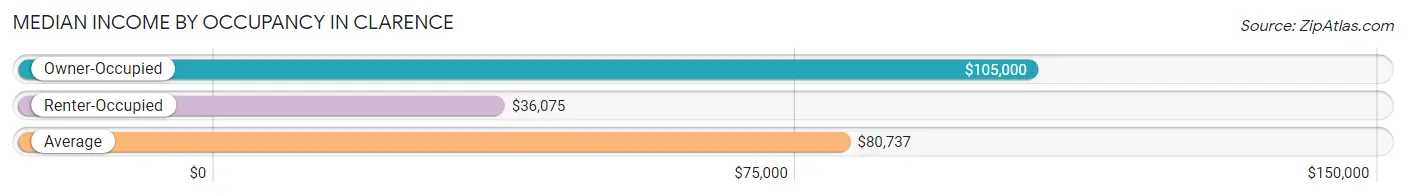
| Occupancy Type | # Households | Median Income |
| Owner-Occupied | 736 (64.6%) | $105,000 |
| Renter-Occupied | 403 (35.4%) | $36,075 |
| Average | 1,139 (100.0%) | $80,737 |
Occupancy by Householder Income Bracket in Clarence
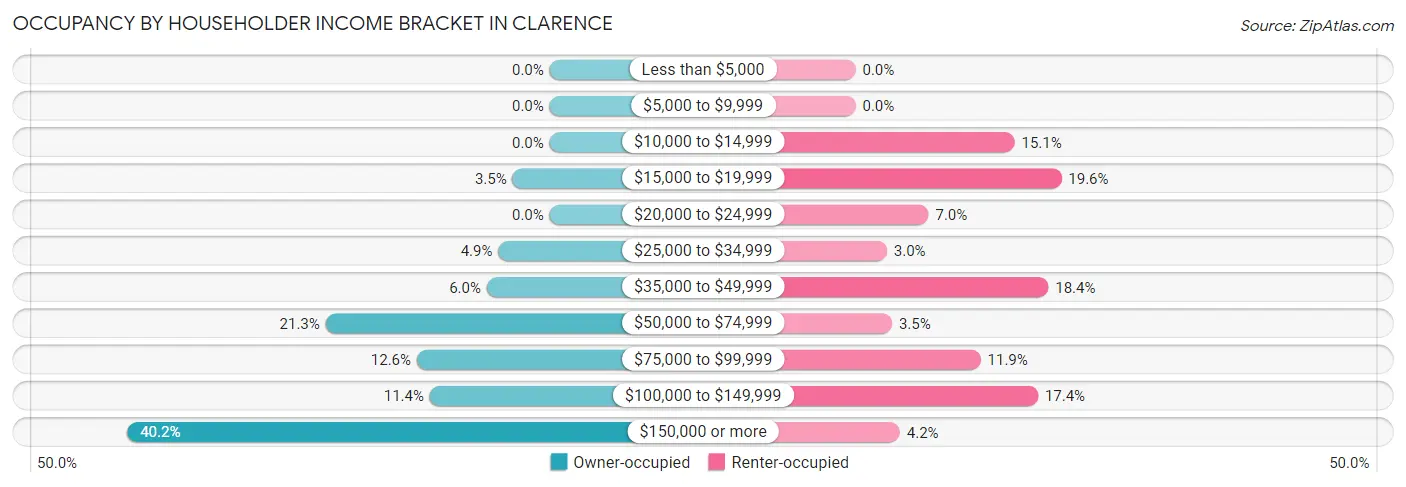
| Income Bracket | Owner-occupied | Renter-occupied |
| Less than $5,000 | 0 (0.0%) | 0 (0.0%) |
| $5,000 to $9,999 | 0 (0.0%) | 0 (0.0%) |
| $10,000 to $14,999 | 0 (0.0%) | 61 (15.1%) |
| $15,000 to $19,999 | 26 (3.5%) | 79 (19.6%) |
| $20,000 to $24,999 | 0 (0.0%) | 28 (7.0%) |
| $25,000 to $34,999 | 36 (4.9%) | 12 (3.0%) |
| $35,000 to $49,999 | 44 (6.0%) | 74 (18.4%) |
| $50,000 to $74,999 | 157 (21.3%) | 14 (3.5%) |
| $75,000 to $99,999 | 93 (12.6%) | 48 (11.9%) |
| $100,000 to $149,999 | 84 (11.4%) | 70 (17.4%) |
| $150,000 or more | 296 (40.2%) | 17 (4.2%) |
| Total | 736 (100.0%) | 403 (100.0%) |
Monthly Housing Cost Tiers in Clarence
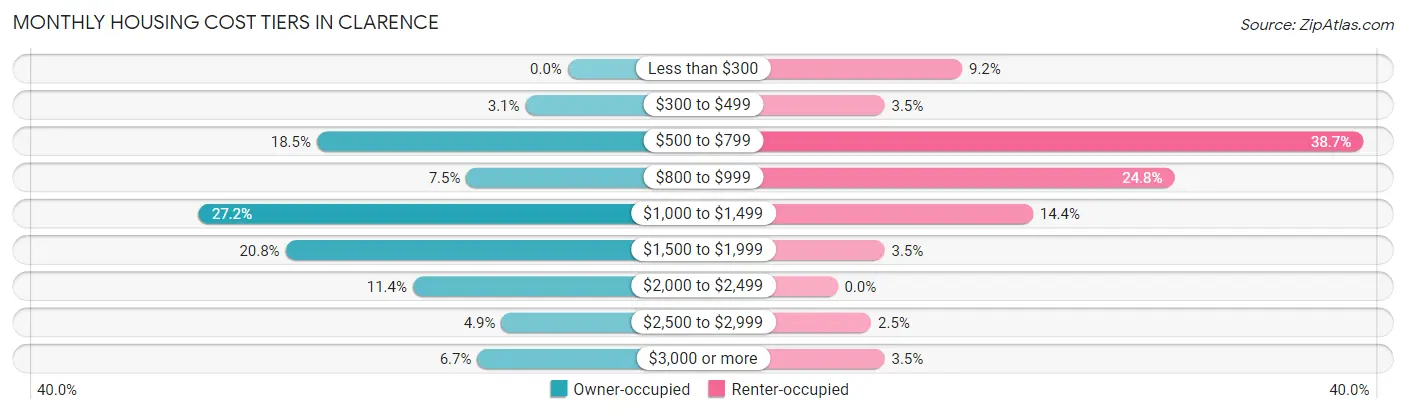
| Monthly Cost | Owner-occupied | Renter-occupied |
| Less than $300 | 0 (0.0%) | 37 (9.2%) |
| $300 to $499 | 23 (3.1%) | 14 (3.5%) |
| $500 to $799 | 136 (18.5%) | 156 (38.7%) |
| $800 to $999 | 55 (7.5%) | 100 (24.8%) |
| $1,000 to $1,499 | 200 (27.2%) | 58 (14.4%) |
| $1,500 to $1,999 | 153 (20.8%) | 14 (3.5%) |
| $2,000 to $2,499 | 84 (11.4%) | 0 (0.0%) |
| $2,500 to $2,999 | 36 (4.9%) | 10 (2.5%) |
| $3,000 or more | 49 (6.7%) | 14 (3.5%) |
| Total | 736 (100.0%) | 403 (100.0%) |
Physical Housing Characteristics in Clarence
Housing Structures in Clarence
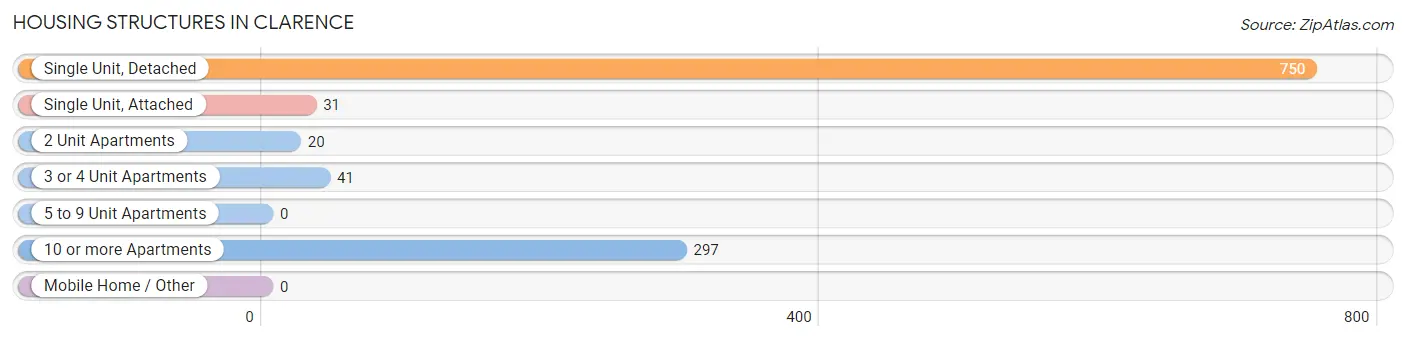
| Structure Type | # Housing Units | % Housing Units |
| Single Unit, Detached | 750 | 65.8% |
| Single Unit, Attached | 31 | 2.7% |
| 2 Unit Apartments | 20 | 1.8% |
| 3 or 4 Unit Apartments | 41 | 3.6% |
| 5 to 9 Unit Apartments | 0 | 0.0% |
| 10 or more Apartments | 297 | 26.1% |
| Mobile Home / Other | 0 | 0.0% |
| Total | 1,139 | 100.0% |
Housing Structures by Occupancy in Clarence
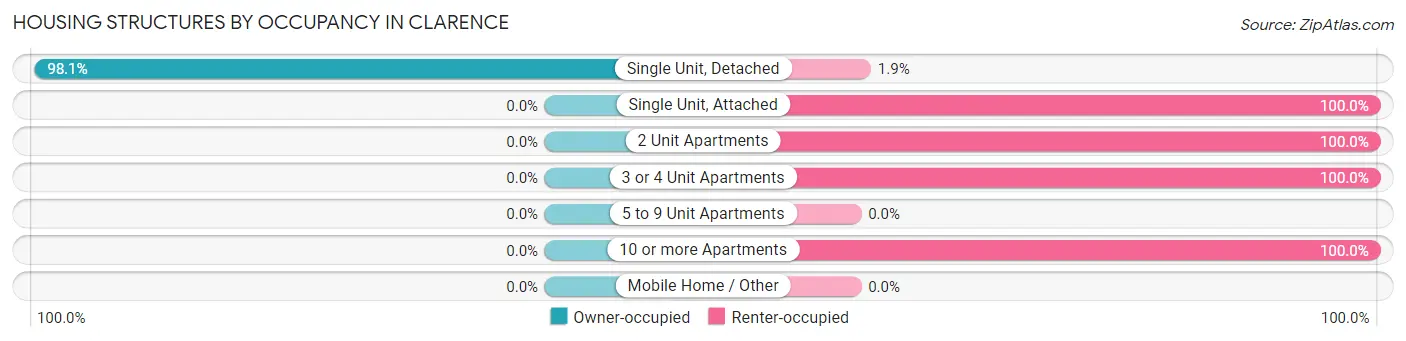
| Structure Type | Owner-occupied | Renter-occupied |
| Single Unit, Detached | 736 (98.1%) | 14 (1.9%) |
| Single Unit, Attached | 0 (0.0%) | 31 (100.0%) |
| 2 Unit Apartments | 0 (0.0%) | 20 (100.0%) |
| 3 or 4 Unit Apartments | 0 (0.0%) | 41 (100.0%) |
| 5 to 9 Unit Apartments | 0 (0.0%) | 0 (0.0%) |
| 10 or more Apartments | 0 (0.0%) | 297 (100.0%) |
| Mobile Home / Other | 0 (0.0%) | 0 (0.0%) |
| Total | 736 (64.6%) | 403 (35.4%) |
Housing Structures by Number of Rooms in Clarence
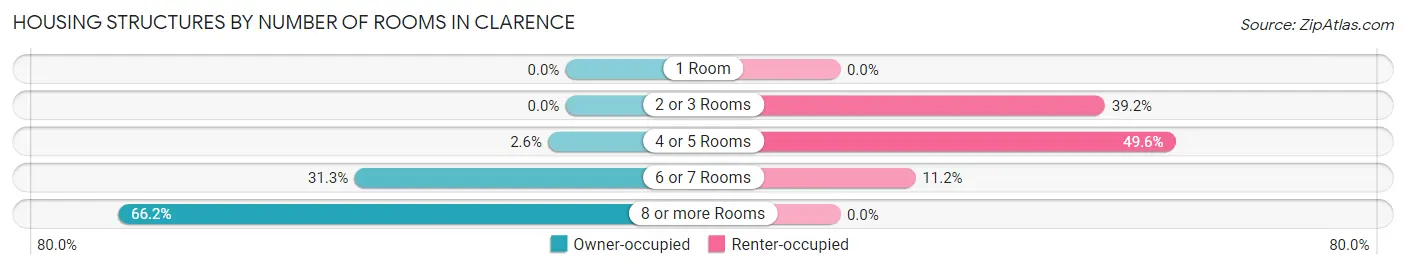
| Number of Rooms | Owner-occupied | Renter-occupied |
| 1 Room | 0 (0.0%) | 0 (0.0%) |
| 2 or 3 Rooms | 0 (0.0%) | 158 (39.2%) |
| 4 or 5 Rooms | 19 (2.6%) | 200 (49.6%) |
| 6 or 7 Rooms | 230 (31.2%) | 45 (11.2%) |
| 8 or more Rooms | 487 (66.2%) | 0 (0.0%) |
| Total | 736 (100.0%) | 403 (100.0%) |
Housing Structure by Heating Type in Clarence
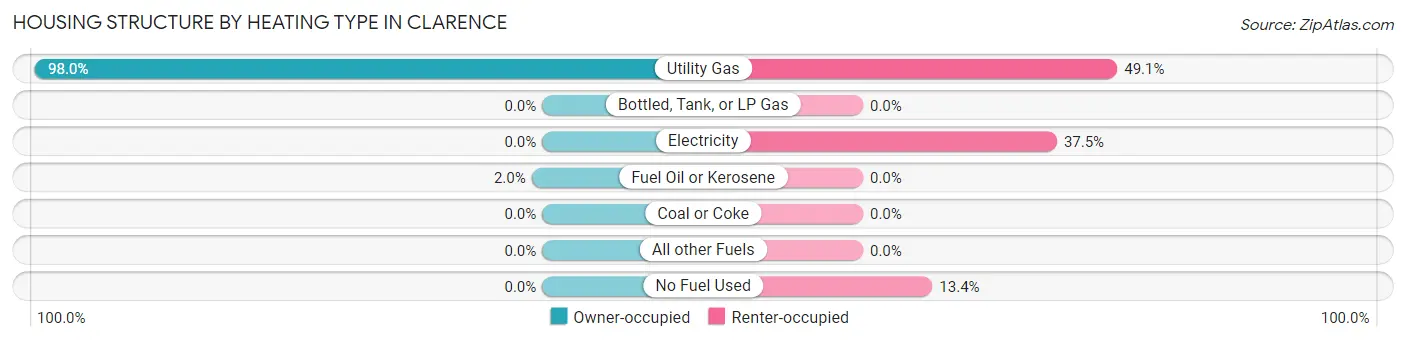
| Heating Type | Owner-occupied | Renter-occupied |
| Utility Gas | 721 (98.0%) | 198 (49.1%) |
| Bottled, Tank, or LP Gas | 0 (0.0%) | 0 (0.0%) |
| Electricity | 0 (0.0%) | 151 (37.5%) |
| Fuel Oil or Kerosene | 15 (2.0%) | 0 (0.0%) |
| Coal or Coke | 0 (0.0%) | 0 (0.0%) |
| All other Fuels | 0 (0.0%) | 0 (0.0%) |
| No Fuel Used | 0 (0.0%) | 54 (13.4%) |
| Total | 736 (100.0%) | 403 (100.0%) |
Household Vehicle Usage in Clarence
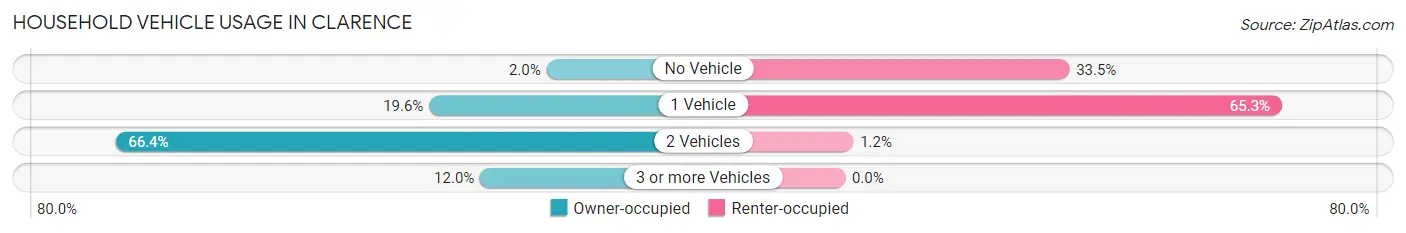
| Vehicles per Household | Owner-occupied | Renter-occupied |
| No Vehicle | 15 (2.0%) | 135 (33.5%) |
| 1 Vehicle | 144 (19.6%) | 263 (65.3%) |
| 2 Vehicles | 489 (66.4%) | 5 (1.2%) |
| 3 or more Vehicles | 88 (12.0%) | 0 (0.0%) |
| Total | 736 (100.0%) | 403 (100.0%) |
Real Estate & Mortgages in Clarence
Real Estate and Mortgage Overview in Clarence
| Characteristic | Without Mortgage | With Mortgage |
| Housing Units | 267 | 469 |
| Median Property Value | $292,400 | $285,900 |
| Median Household Income | $67,784 | $248 |
| Monthly Housing Costs | $730 | $49 |
| Real Estate Taxes | $5,645 | $0 |
Property Value by Mortgage Status in Clarence
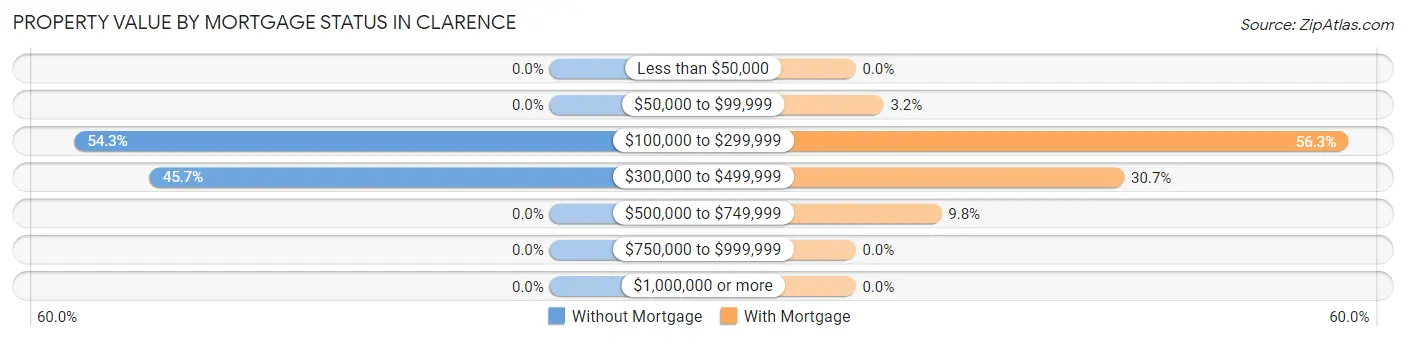
| Property Value | Without Mortgage | With Mortgage |
| Less than $50,000 | 0 (0.0%) | 0 (0.0%) |
| $50,000 to $99,999 | 0 (0.0%) | 15 (3.2%) |
| $100,000 to $299,999 | 145 (54.3%) | 264 (56.3%) |
| $300,000 to $499,999 | 122 (45.7%) | 144 (30.7%) |
| $500,000 to $749,999 | 0 (0.0%) | 46 (9.8%) |
| $750,000 to $999,999 | 0 (0.0%) | 0 (0.0%) |
| $1,000,000 or more | 0 (0.0%) | 0 (0.0%) |
| Total | 267 (100.0%) | 469 (100.0%) |
Household Income by Mortgage Status in Clarence
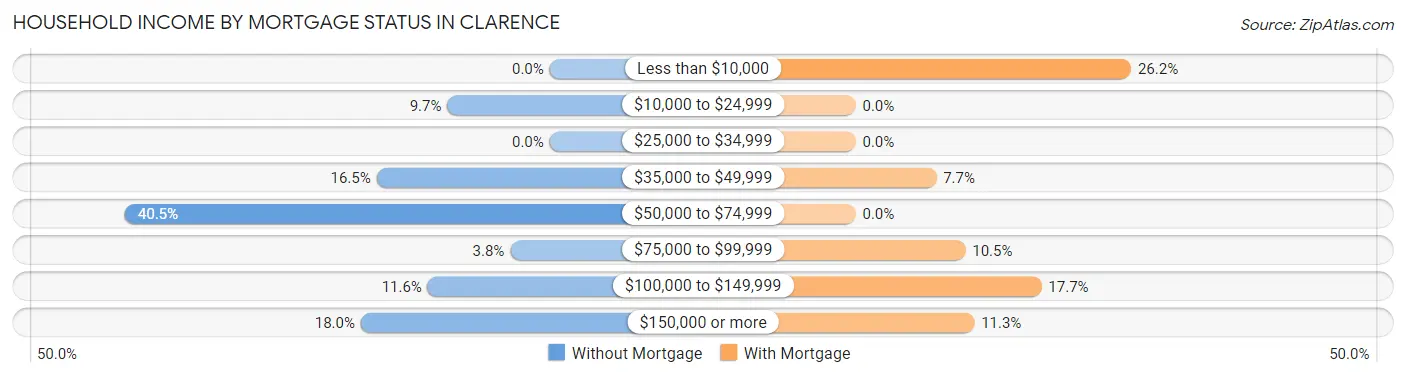
| Household Income | Without Mortgage | With Mortgage |
| Less than $10,000 | 0 (0.0%) | 123 (26.2%) |
| $10,000 to $24,999 | 26 (9.7%) | 0 (0.0%) |
| $25,000 to $34,999 | 0 (0.0%) | 0 (0.0%) |
| $35,000 to $49,999 | 44 (16.5%) | 36 (7.7%) |
| $50,000 to $74,999 | 108 (40.5%) | 0 (0.0%) |
| $75,000 to $99,999 | 10 (3.7%) | 49 (10.4%) |
| $100,000 to $149,999 | 31 (11.6%) | 83 (17.7%) |
| $150,000 or more | 48 (18.0%) | 53 (11.3%) |
| Total | 267 (100.0%) | 469 (100.0%) |
Property Value to Household Income Ratio in Clarence
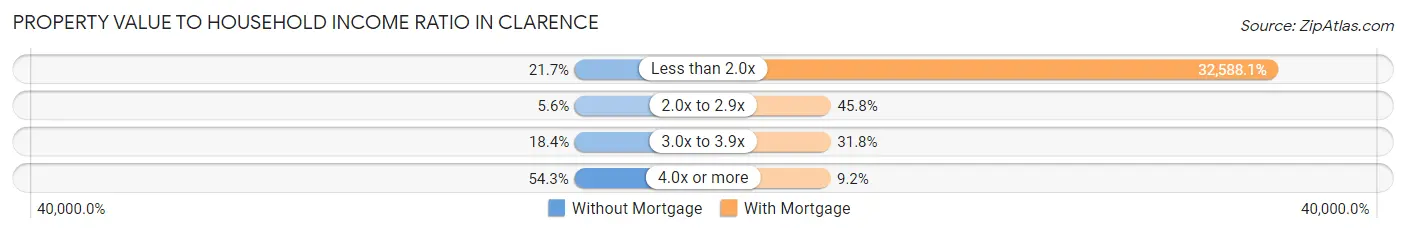
| Value-to-Income Ratio | Without Mortgage | With Mortgage |
| Less than 2.0x | 58 (21.7%) | 152,838 (32,588.1%) |
| 2.0x to 2.9x | 15 (5.6%) | 215 (45.8%) |
| 3.0x to 3.9x | 49 (18.3%) | 149 (31.8%) |
| 4.0x or more | 145 (54.3%) | 43 (9.2%) |
| Total | 267 (100.0%) | 469 (100.0%) |
Real Estate Taxes by Mortgage Status in Clarence
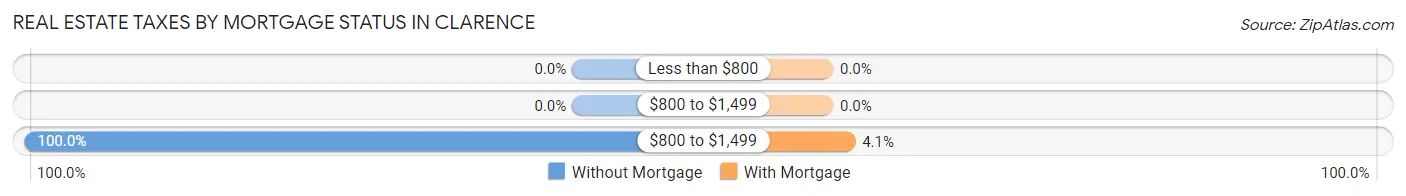
| Property Taxes | Without Mortgage | With Mortgage |
| Less than $800 | 0 (0.0%) | 0 (0.0%) |
| $800 to $1,499 | 0 (0.0%) | 0 (0.0%) |
| $800 to $1,499 | 267 (100.0%) | 19 (4.1%) |
| Total | 267 (100.0%) | 469 (100.0%) |
Health & Disability in Clarence
Health Insurance Coverage by Age in Clarence
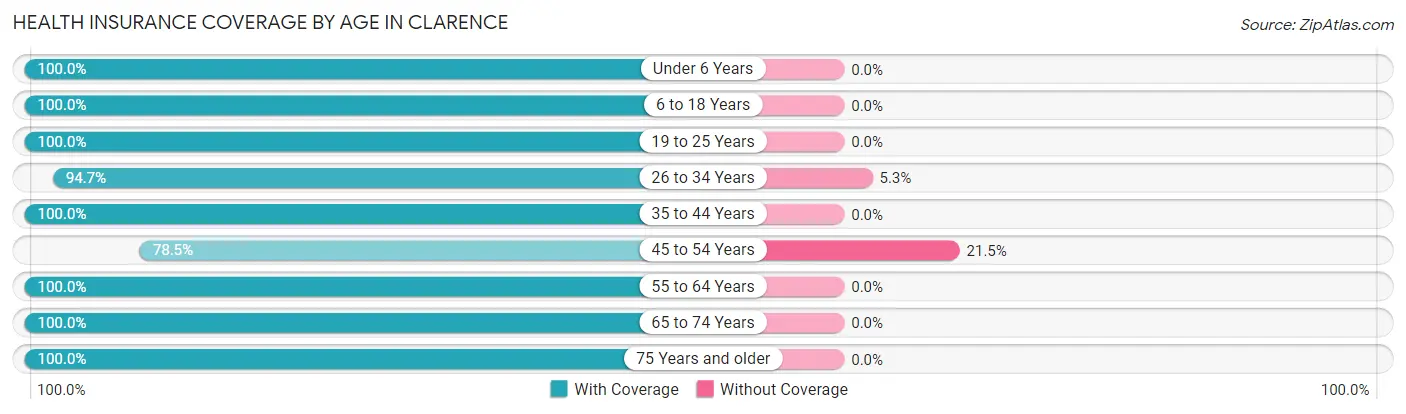
| Age Bracket | With Coverage | Without Coverage |
| Under 6 Years | 152 (100.0%) | 0 (0.0%) |
| 6 to 18 Years | 170 (100.0%) | 0 (0.0%) |
| 19 to 25 Years | 92 (100.0%) | 0 (0.0%) |
| 26 to 34 Years | 198 (94.7%) | 11 (5.3%) |
| 35 to 44 Years | 134 (100.0%) | 0 (0.0%) |
| 45 to 54 Years | 157 (78.5%) | 43 (21.5%) |
| 55 to 64 Years | 580 (100.0%) | 0 (0.0%) |
| 65 to 74 Years | 350 (100.0%) | 0 (0.0%) |
| 75 Years and older | 442 (100.0%) | 0 (0.0%) |
| Total | 2,275 (97.7%) | 54 (2.3%) |
Health Insurance Coverage by Citizenship Status in Clarence
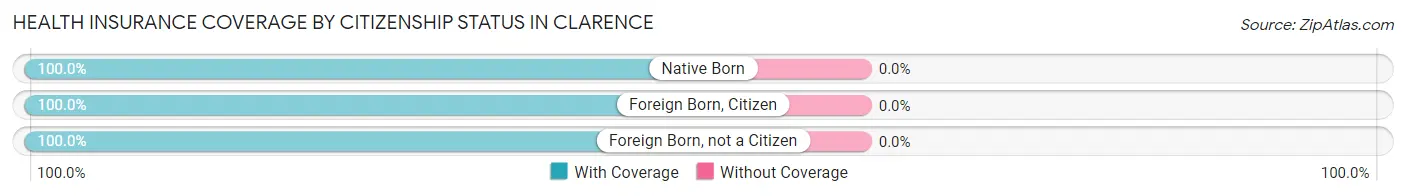
| Citizenship Status | With Coverage | Without Coverage |
| Native Born | 152 (100.0%) | 0 (0.0%) |
| Foreign Born, Citizen | 170 (100.0%) | 0 (0.0%) |
| Foreign Born, not a Citizen | 92 (100.0%) | 0 (0.0%) |
Health Insurance Coverage by Household Income in Clarence
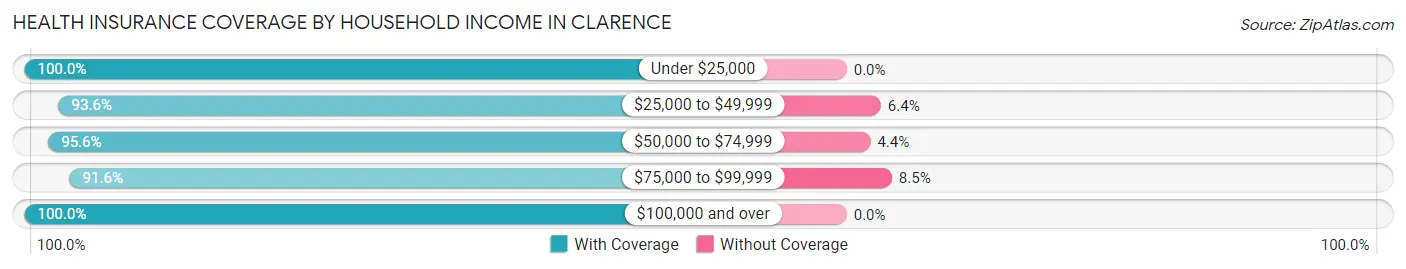
| Household Income | With Coverage | Without Coverage |
| Under $25,000 | 218 (100.0%) | 0 (0.0%) |
| $25,000 to $49,999 | 205 (93.6%) | 14 (6.4%) |
| $50,000 to $74,999 | 344 (95.6%) | 16 (4.4%) |
| $75,000 to $99,999 | 260 (91.5%) | 24 (8.5%) |
| $100,000 and over | 1,185 (100.0%) | 0 (0.0%) |
Public vs Private Health Insurance Coverage by Age in Clarence

| Age Bracket | Public Insurance | Private Insurance |
| Under 6 | 0 (0.0%) | 152 (100.0%) |
| 6 to 18 Years | 34 (20.0%) | 163 (95.9%) |
| 19 to 25 Years | 31 (33.7%) | 61 (66.3%) |
| 25 to 34 Years | 31 (14.8%) | 167 (79.9%) |
| 35 to 44 Years | 0 (0.0%) | 134 (100.0%) |
| 45 to 54 Years | 29 (14.5%) | 128 (64.0%) |
| 55 to 64 Years | 116 (20.0%) | 480 (82.8%) |
| 65 to 74 Years | 350 (100.0%) | 278 (79.4%) |
| 75 Years and over | 430 (97.3%) | 308 (69.7%) |
| Total | 1,021 (43.8%) | 1,871 (80.3%) |
Disability Status by Sex by Age in Clarence
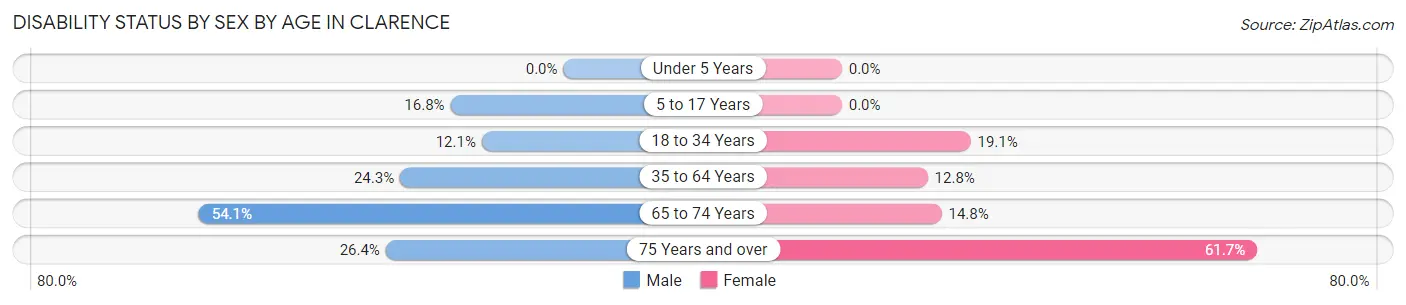
| Age Bracket | Male | Female |
| Under 5 Years | 0 (0.0%) | 0 (0.0%) |
| 5 to 17 Years | 27 (16.8%) | 0 (0.0%) |
| 18 to 34 Years | 20 (12.1%) | 26 (19.1%) |
| 35 to 64 Years | 98 (24.3%) | 65 (12.8%) |
| 65 to 74 Years | 131 (54.1%) | 16 (14.8%) |
| 75 Years and over | 43 (26.4%) | 172 (61.7%) |
Disability Class by Sex by Age in Clarence
Disability Class: Hearing Difficulty
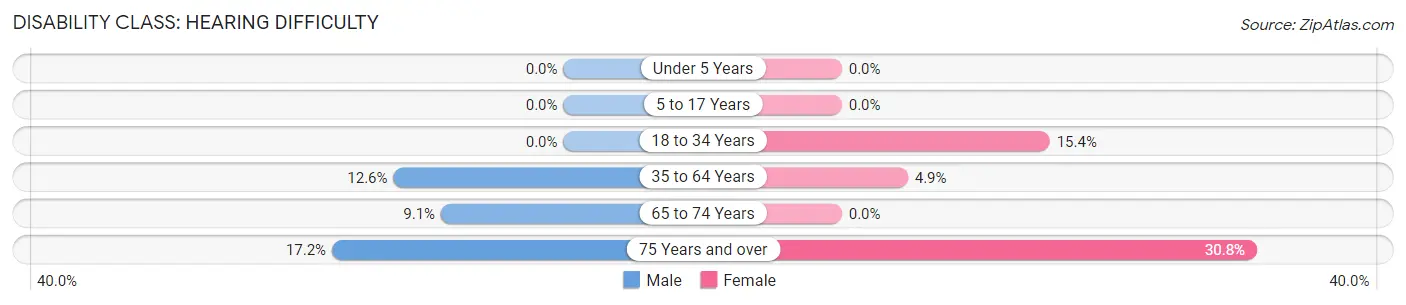
| Age Bracket | Male | Female |
| Under 5 Years | 0 (0.0%) | 0 (0.0%) |
| 5 to 17 Years | 0 (0.0%) | 0 (0.0%) |
| 18 to 34 Years | 0 (0.0%) | 21 (15.4%) |
| 35 to 64 Years | 51 (12.6%) | 25 (4.9%) |
| 65 to 74 Years | 22 (9.1%) | 0 (0.0%) |
| 75 Years and over | 28 (17.2%) | 86 (30.8%) |
Disability Class: Vision Difficulty
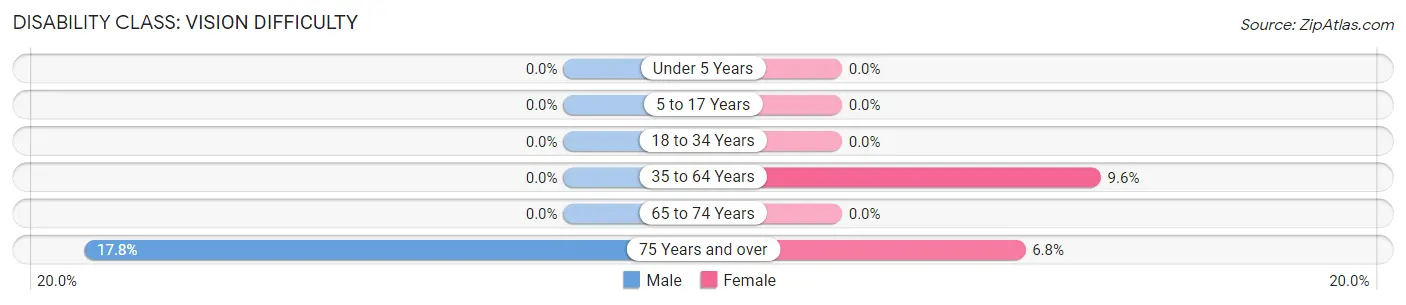
| Age Bracket | Male | Female |
| Under 5 Years | 0 (0.0%) | 0 (0.0%) |
| 5 to 17 Years | 0 (0.0%) | 0 (0.0%) |
| 18 to 34 Years | 0 (0.0%) | 0 (0.0%) |
| 35 to 64 Years | 0 (0.0%) | 49 (9.6%) |
| 65 to 74 Years | 0 (0.0%) | 0 (0.0%) |
| 75 Years and over | 29 (17.8%) | 19 (6.8%) |
Disability Class: Cognitive Difficulty
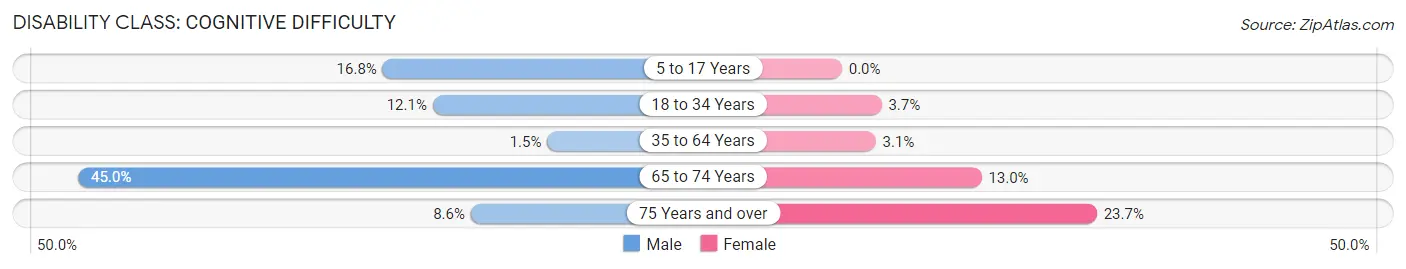
| Age Bracket | Male | Female |
| 5 to 17 Years | 27 (16.8%) | 0 (0.0%) |
| 18 to 34 Years | 20 (12.1%) | 5 (3.7%) |
| 35 to 64 Years | 6 (1.5%) | 16 (3.1%) |
| 65 to 74 Years | 109 (45.0%) | 14 (13.0%) |
| 75 Years and over | 14 (8.6%) | 66 (23.7%) |
Disability Class: Ambulatory Difficulty
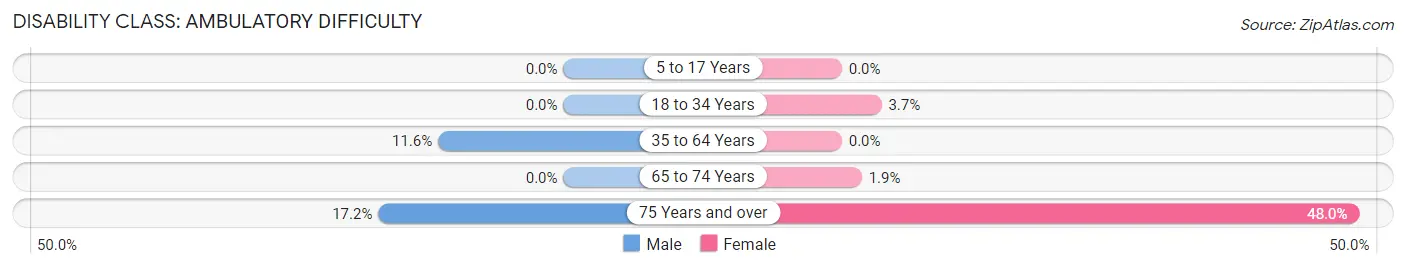
| Age Bracket | Male | Female |
| 5 to 17 Years | 0 (0.0%) | 0 (0.0%) |
| 18 to 34 Years | 0 (0.0%) | 5 (3.7%) |
| 35 to 64 Years | 47 (11.6%) | 0 (0.0%) |
| 65 to 74 Years | 0 (0.0%) | 2 (1.8%) |
| 75 Years and over | 28 (17.2%) | 134 (48.0%) |
Disability Class: Self-Care Difficulty
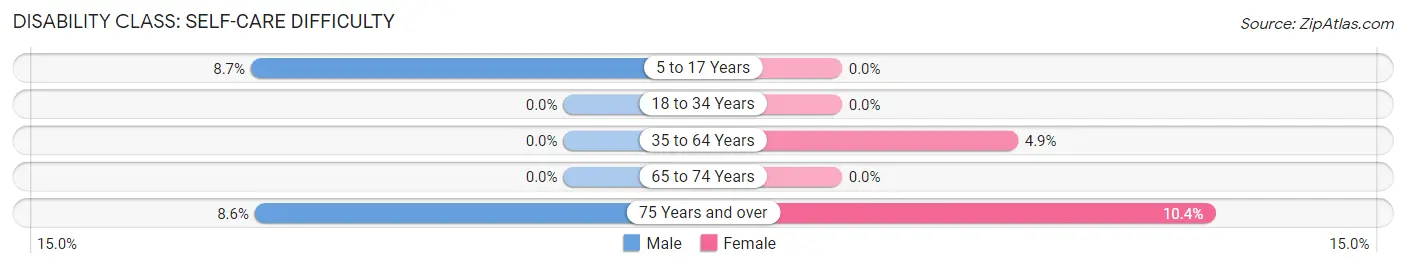
| Age Bracket | Male | Female |
| 5 to 17 Years | 14 (8.7%) | 0 (0.0%) |
| 18 to 34 Years | 0 (0.0%) | 0 (0.0%) |
| 35 to 64 Years | 0 (0.0%) | 25 (4.9%) |
| 65 to 74 Years | 0 (0.0%) | 0 (0.0%) |
| 75 Years and over | 14 (8.6%) | 29 (10.4%) |
Technology Access in Clarence
Computing Device Access in Clarence
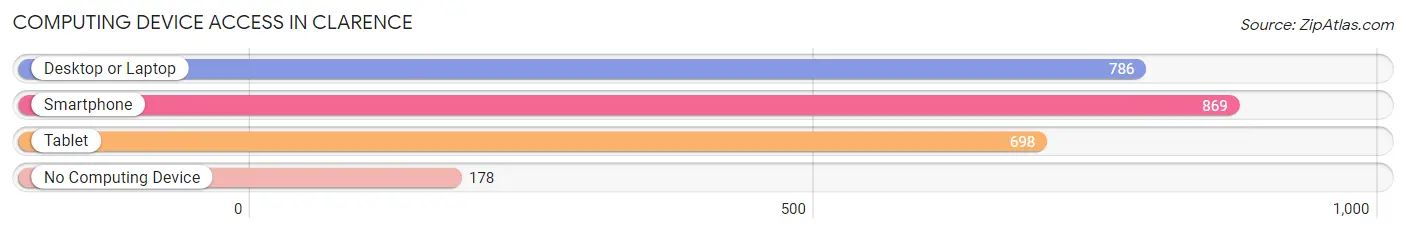
| Device Type | # Households | % Households |
| Desktop or Laptop | 786 | 69.0% |
| Smartphone | 869 | 76.3% |
| Tablet | 698 | 61.3% |
| No Computing Device | 178 | 15.6% |
| Total | 1,139 | 100.0% |
Internet Access in Clarence
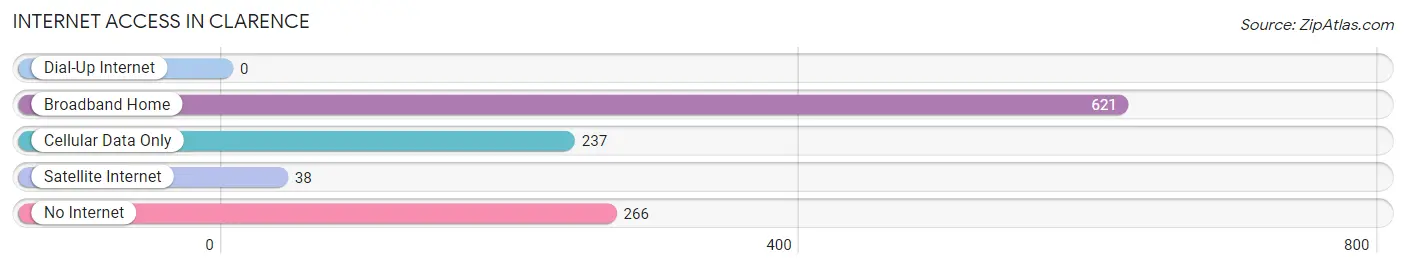
| Internet Type | # Households | % Households |
| Dial-Up Internet | 0 | 0.0% |
| Broadband Home | 621 | 54.5% |
| Cellular Data Only | 237 | 20.8% |
| Satellite Internet | 38 | 3.3% |
| No Internet | 266 | 23.4% |
| Total | 1,139 | 100.0% |
Clarence Summary
Clarence is a town located in the northern part of Erie County, New York, United States. It is situated just east of the city of Buffalo and is part of the Buffalo-Niagara Falls metropolitan area. As of the 2010 census, the town had a total population of 30,673.
History
The area that is now Clarence was first settled in 1804 by a group of settlers from Connecticut. The town was originally known as "Willink," after the prominent Willink family who owned much of the land in the area. In 1808, the town was renamed "Clarence" in honor of Prince William, Duke of Clarence, who later became King William IV of the United Kingdom.
The town of Clarence was officially established in 1817. In the early 19th century, the town was largely agricultural, with many farms and orchards. In the late 19th century, the town began to develop into a residential suburb of Buffalo. The town experienced rapid growth in the 1950s and 1960s, as many people moved to the area from the city of Buffalo.
Geography
Clarence is located in the northern part of Erie County, New York. It is bordered to the north by the town of Amherst, to the east by the town of Newstead, to the south by the town of Lancaster, and to the west by the city of Buffalo.
The town has a total area of 33.2 square miles, of which 32.9 square miles is land and 0.3 square miles is water. The town is located in the Great Lakes region and is part of the Niagara River watershed.
Economy
The economy of Clarence is largely based on retail, services, and manufacturing. The town is home to several large retail stores, including Walmart, Target, and Home Depot. The town is also home to several manufacturing companies, including Moog, a manufacturer of aerospace and defense products, and New Era Cap Company, a manufacturer of baseball caps.
The town is also home to several corporate headquarters, including M&T Bank, a regional bank, and Rich Products Corporation, a food products company.
Demographics
As of the 2010 census, there were 30,673 people, 11,845 households, and 8,717 families residing in the town. The population density was 930.3 people per square mile. There were 12,541 housing units at an average density of 381.2 per square mile.
The racial makeup of the town was 92.2% White, 3.3% African American, 0.2% Native American, 2.2% Asian, 0.7% from other races, and 1.4% from two or more races. Hispanic or Latino of any race were 3.2% of the population.
There were 11,845 households, out of which 33.2% had children under the age of 18 living with them, 61.2% were married couples living together, 8.7% had a female householder with no husband present, and 26.7% were non-families. 22.2% of all households were made up of individuals, and 10.2% had someone living alone who was 65 years of age or older. The average household size was 2.56 and the average family size was 3.02.
In the town, the population was spread out, with 24.7% under the age of 18, 6.2% from 18 to 24, 27.2% from 25 to 44, 27.2% from 45 to 64, and 14.7% who were 65 years of age or older. The median age was 40 years. For every 100 females, there were 94.2 males. For every 100 females age 18 and over, there were 91.2 males.
The median income for a household in the town was $71,945, and the median income for a family was $83,945. Males had a median income of $60,945 versus $41,945 for females. The per capita income for the town was $32,945. About 2.7% of families and 4.2% of the population were below the poverty line, including 4.7% of those under age 18 and 4.2% of those age 65 or over.
Common Questions
What is the Total Population of Clarence?
Total Population of Clarence is 2,523.
What is the Total Male Population of Clarence?
Total Male Population of Clarence is 1,234.
What is the Total Female Population of Clarence?
Total Female Population of Clarence is 1,289.
What is the Ratio of Males per 100 Females in Clarence?
There are 95.73 Males per 100 Females in Clarence.
What is the Ratio of Females per 100 Males in Clarence?
There are 104.46 Females per 100 Males in Clarence.
What is the Median Population Age in Clarence?
Median Population Age in Clarence is 59.4 Years.
What is the Average Family Size in Clarence
Average Family Size in Clarence is 2.5 People.
What is the Average Household Size in Clarence
Average Household Size in Clarence is 2.0 People.
What is Per Capita Income in Clarence?
Per Capita income in Clarence is $51,693.
What is the Median Family Income in Clarence?
Median Family Income in Clarence is $120,365.
What is the Median Household income in Clarence?
Median Household Income in Clarence is $80,737.
What is Income or Wage Gap in Clarence?
Income or Wage Gap in Clarence is 6.5%.
Women in Clarence earn 93.5 cents for every dollar earned by a man.
What is Inequality or Gini Index in Clarence?
Inequality or Gini Index in Clarence is 0.45.
How Large is the Labor Force in Clarence?
There are 1,162 People in the Labor Forcein in Clarence.
What is the Percentage of People in the Labor Force in Clarence?
52.5% of People are in the Labor Force in Clarence.
What is the Unemployment Rate in Clarence?
Unemployment Rate in Clarence is 3.4%.