Cities with the Largest Subsaharan African Community in New Jersey
RELATED REPORTS & OPTIONS
Subsaharan African
New Jersey
Compare Cities
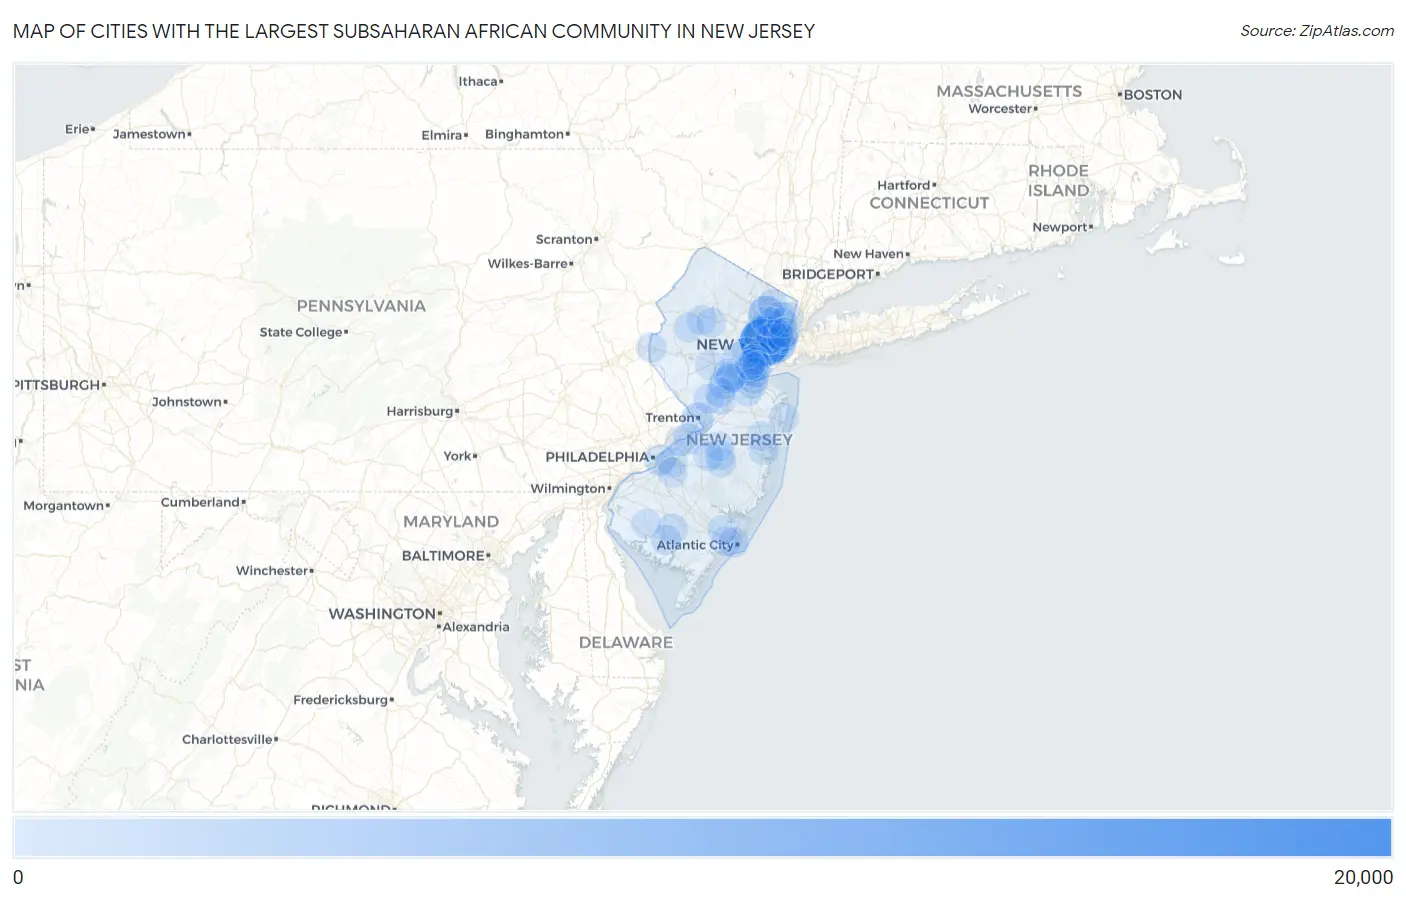
Map of Cities with the Largest Subsaharan African Community in New Jersey
0
20,000
Cities with the Largest Subsaharan African Community in New Jersey
| City | Subsaharan African | vs State | vs National | |
| 1. | Newark | 19,879 | 129,051(15.40%)#1 | 4,023,199(0.49%)#20 |
| 2. | Jersey City | 6,611 | 129,051(5.12%)#2 | 4,023,199(0.16%)#71 |
| 3. | Paterson | 6,042 | 129,051(4.68%)#3 | 4,023,199(0.15%)#80 |
| 4. | East Orange | 4,762 | 129,051(3.69%)#4 | 4,023,199(0.12%)#101 |
| 5. | Trenton | 2,414 | 129,051(1.87%)#5 | 4,023,199(0.06%)#247 |
| 6. | Elizabeth | 2,220 | 129,051(1.72%)#6 | 4,023,199(0.06%)#267 |
| 7. | Sicklerville | 1,765 | 129,051(1.37%)#7 | 4,023,199(0.04%)#349 |
| 8. | Sayreville Borough | 1,526 | 129,051(1.18%)#8 | 4,023,199(0.04%)#401 |
| 9. | Hackensack | 1,481 | 129,051(1.15%)#9 | 4,023,199(0.04%)#415 |
| 10. | Camden | 1,310 | 129,051(1.02%)#10 | 4,023,199(0.03%)#471 |
| 11. | Vauxhall | 1,084 | 129,051(0.84%)#11 | 4,023,199(0.03%)#546 |
| 12. | Plainfield | 1,028 | 129,051(0.80%)#12 | 4,023,199(0.03%)#577 |
| 13. | Linden | 978 | 129,051(0.76%)#13 | 4,023,199(0.02%)#604 |
| 14. | Bayonne | 815 | 129,051(0.63%)#14 | 4,023,199(0.02%)#705 |
| 15. | Vineland | 796 | 129,051(0.62%)#15 | 4,023,199(0.02%)#719 |
| 16. | Union City | 788 | 129,051(0.61%)#16 | 4,023,199(0.02%)#730 |
| 17. | North Plainfield Borough | 736 | 129,051(0.57%)#17 | 4,023,199(0.02%)#776 |
| 18. | Franklin Park | 673 | 129,051(0.52%)#18 | 4,023,199(0.02%)#840 |
| 19. | Roselle Borough | 650 | 129,051(0.50%)#19 | 4,023,199(0.02%)#871 |
| 20. | Fords | 624 | 129,051(0.48%)#20 | 4,023,199(0.02%)#907 |
| 21. | Carteret Borough | 592 | 129,051(0.46%)#21 | 4,023,199(0.01%)#953 |
| 22. | Somerset | 575 | 129,051(0.45%)#22 | 4,023,199(0.01%)#977 |
| 23. | Old Bridge | 551 | 129,051(0.43%)#23 | 4,023,199(0.01%)#1,008 |
| 24. | Parsippany | 546 | 129,051(0.42%)#24 | 4,023,199(0.01%)#1,015 |
| 25. | Harrison | 519 | 129,051(0.40%)#25 | 4,023,199(0.01%)#1,056 |
| 26. | Burlington | 519 | 129,051(0.40%)#26 | 4,023,199(0.01%)#1,058 |
| 27. | Englewood | 483 | 129,051(0.37%)#27 | 4,023,199(0.01%)#1,116 |
| 28. | Millville | 482 | 129,051(0.37%)#28 | 4,023,199(0.01%)#1,119 |
| 29. | Secaucus | 469 | 129,051(0.36%)#29 | 4,023,199(0.01%)#1,150 |
| 30. | Woodbridge | 451 | 129,051(0.35%)#30 | 4,023,199(0.01%)#1,184 |
| 31. | Lindenwold Borough | 449 | 129,051(0.35%)#31 | 4,023,199(0.01%)#1,190 |
| 32. | Phillipsburg | 427 | 129,051(0.33%)#32 | 4,023,199(0.01%)#1,245 |
| 33. | Edgewater Borough | 410 | 129,051(0.32%)#33 | 4,023,199(0.01%)#1,272 |
| 34. | Princeton | 402 | 129,051(0.31%)#34 | 4,023,199(0.01%)#1,293 |
| 35. | Pleasantville | 395 | 129,051(0.31%)#35 | 4,023,199(0.01%)#1,315 |
| 36. | New Brunswick | 382 | 129,051(0.30%)#36 | 4,023,199(0.01%)#1,350 |
| 37. | Lodi Borough | 365 | 129,051(0.28%)#37 | 4,023,199(0.01%)#1,387 |
| 38. | Woodland Park Borough | 351 | 129,051(0.27%)#38 | 4,023,199(0.01%)#1,418 |
| 39. | Kearny | 349 | 129,051(0.27%)#39 | 4,023,199(0.01%)#1,422 |
| 40. | Hoboken | 335 | 129,051(0.26%)#40 | 4,023,199(0.01%)#1,469 |
| 41. | Toms River | 328 | 129,051(0.25%)#41 | 4,023,199(0.01%)#1,487 |
| 42. | Cliffside Park Borough | 326 | 129,051(0.25%)#42 | 4,023,199(0.01%)#1,502 |
| 43. | Avenel | 323 | 129,051(0.25%)#43 | 4,023,199(0.01%)#1,513 |
| 44. | Madison Park | 319 | 129,051(0.25%)#44 | 4,023,199(0.01%)#1,523 |
| 45. | Glassboro Borough | 305 | 129,051(0.24%)#45 | 4,023,199(0.01%)#1,563 |
| 46. | Bergenfield Borough | 302 | 129,051(0.23%)#46 | 4,023,199(0.01%)#1,574 |
| 47. | Passaic | 296 | 129,051(0.23%)#47 | 4,023,199(0.01%)#1,590 |
| 48. | Fair Lawn Borough | 293 | 129,051(0.23%)#48 | 4,023,199(0.01%)#1,598 |
| 49. | Atlantic City | 286 | 129,051(0.22%)#49 | 4,023,199(0.01%)#1,623 |
| 50. | Collingswood Borough | 278 | 129,051(0.22%)#50 | 4,023,199(0.01%)#1,654 |
| 51. | Kingston Estates | 260 | 129,051(0.20%)#51 | 4,023,199(0.01%)#1,729 |
| 52. | Hillsborough | 259 | 129,051(0.20%)#52 | 4,023,199(0.01%)#1,732 |
| 53. | Clifton | 256 | 129,051(0.20%)#53 | 4,023,199(0.01%)#1,746 |
| 54. | Princeton Meadows | 243 | 129,051(0.19%)#54 | 4,023,199(0.01%)#1,806 |
| 55. | South Amboy | 239 | 129,051(0.19%)#55 | 4,023,199(0.01%)#1,823 |
| 56. | Lake Hopatcong | 237 | 129,051(0.18%)#56 | 4,023,199(0.01%)#1,835 |
| 57. | East Franklin | 237 | 129,051(0.18%)#57 | 4,023,199(0.01%)#1,836 |
| 58. | Hightstown Borough | 231 | 129,051(0.18%)#58 | 4,023,199(0.01%)#1,866 |
| 59. | Budd Lake | 229 | 129,051(0.18%)#59 | 4,023,199(0.01%)#1,878 |
| 60. | Ringwood Borough | 227 | 129,051(0.18%)#60 | 4,023,199(0.01%)#1,892 |
| 61. | Perth Amboy | 223 | 129,051(0.17%)#61 | 4,023,199(0.01%)#1,911 |
| 62. | Ridgefield Park | 223 | 129,051(0.17%)#62 | 4,023,199(0.01%)#1,914 |
| 63. | Lakewood | 221 | 129,051(0.17%)#63 | 4,023,199(0.01%)#1,928 |
| 64. | Dumont Borough | 221 | 129,051(0.17%)#64 | 4,023,199(0.01%)#1,932 |
| 65. | Voorhees | 214 | 129,051(0.17%)#65 | 4,023,199(0.01%)#1,970 |
| 66. | South Plainfield Borough | 213 | 129,051(0.17%)#66 | 4,023,199(0.01%)#1,973 |
| 67. | Heathcote | 211 | 129,051(0.16%)#67 | 4,023,199(0.01%)#1,995 |
| 68. | Westfield | 202 | 129,051(0.16%)#68 | 4,023,199(0.01%)#2,042 |
| 69. | Watsessing | 194 | 129,051(0.15%)#69 | 4,023,199(0.00%)#2,100 |
| 70. | Florham Park Borough | 192 | 129,051(0.15%)#70 | 4,023,199(0.00%)#2,118 |
| 71. | Wallington Borough | 192 | 129,051(0.15%)#71 | 4,023,199(0.00%)#2,119 |
| 72. | Raritan Borough | 185 | 129,051(0.14%)#72 | 4,023,199(0.00%)#2,162 |
| 73. | Ridgewood | 184 | 129,051(0.14%)#73 | 4,023,199(0.00%)#2,169 |
| 74. | Beattystown | 175 | 129,051(0.14%)#74 | 4,023,199(0.00%)#2,243 |
| 75. | Rahway | 172 | 129,051(0.13%)#75 | 4,023,199(0.00%)#2,266 |
| 76. | Asbury Park | 171 | 129,051(0.13%)#76 | 4,023,199(0.00%)#2,277 |
| 77. | Seabrook Farms | 169 | 129,051(0.13%)#77 | 4,023,199(0.00%)#2,290 |
| 78. | New Milford Borough | 165 | 129,051(0.13%)#78 | 4,023,199(0.00%)#2,319 |
| 79. | Echelon | 163 | 129,051(0.13%)#79 | 4,023,199(0.00%)#2,333 |
| 80. | Tenafly Borough | 155 | 129,051(0.12%)#80 | 4,023,199(0.00%)#2,414 |
| 81. | Browns Mills | 153 | 129,051(0.12%)#81 | 4,023,199(0.00%)#2,432 |
| 82. | Presidential Lakes Estates | 153 | 129,051(0.12%)#82 | 4,023,199(0.00%)#2,434 |
| 83. | West New York | 152 | 129,051(0.12%)#83 | 4,023,199(0.00%)#2,436 |
| 84. | Beverly | 150 | 129,051(0.12%)#84 | 4,023,199(0.00%)#2,470 |
| 85. | Forsgate | 147 | 129,051(0.11%)#85 | 4,023,199(0.00%)#2,497 |
| 86. | Berlin Borough | 146 | 129,051(0.11%)#86 | 4,023,199(0.00%)#2,501 |
| 87. | Eatontown Borough | 143 | 129,051(0.11%)#87 | 4,023,199(0.00%)#2,534 |
| 88. | Succasunna | 140 | 129,051(0.11%)#88 | 4,023,199(0.00%)#2,564 |
| 89. | Bloomingdale Borough | 137 | 129,051(0.11%)#89 | 4,023,199(0.00%)#2,598 |
| 90. | Mcguire Afb | 137 | 129,051(0.11%)#90 | 4,023,199(0.00%)#2,600 |
| 91. | Port Reading | 137 | 129,051(0.11%)#91 | 4,023,199(0.00%)#2,602 |
| 92. | Iselin | 135 | 129,051(0.10%)#92 | 4,023,199(0.00%)#2,616 |
| 93. | Clementon Borough | 134 | 129,051(0.10%)#93 | 4,023,199(0.00%)#2,636 |
| 94. | Landing | 131 | 129,051(0.10%)#94 | 4,023,199(0.00%)#2,666 |
| 95. | Spotswood Borough | 130 | 129,051(0.10%)#95 | 4,023,199(0.00%)#2,681 |
| 96. | Pemberton Heights | 130 | 129,051(0.10%)#96 | 4,023,199(0.00%)#2,686 |
| 97. | Westwood Borough | 128 | 129,051(0.10%)#97 | 4,023,199(0.00%)#2,705 |
| 98. | Bradley Gardens | 125 | 129,051(0.10%)#98 | 4,023,199(0.00%)#2,739 |
| 99. | Pomona | 124 | 129,051(0.10%)#99 | 4,023,199(0.00%)#2,755 |
| 100. | Hopatcong Borough | 121 | 129,051(0.09%)#100 | 4,023,199(0.00%)#2,789 |
Common Questions
What are the Top 10 Cities with the Largest Subsaharan African Community in New Jersey?
Top 10 Cities with the Largest Subsaharan African Community in New Jersey are:
#1
19,879
#2
6,611
#3
6,042
#4
4,762
#5
2,414
#6
2,220
#7
1,481
#8
1,310
#9
1,028
#10
978
What city has the Largest Subsaharan African Community in New Jersey?
Newark has the Largest Subsaharan African Community in New Jersey with 19,879.
What is the Total Subsaharan African Population in the State of New Jersey?
Total Subsaharan African Population in New Jersey is 129,051.
What is the Total Subsaharan African Population in the United States?
Total Subsaharan African Population in the United States is 4,023,199.