Cities with the Lowest Percentage of Single Mothers in New Jersey
RELATED REPORTS & OPTIONS
Fewest Single Mothers
New Jersey
Compare Cities
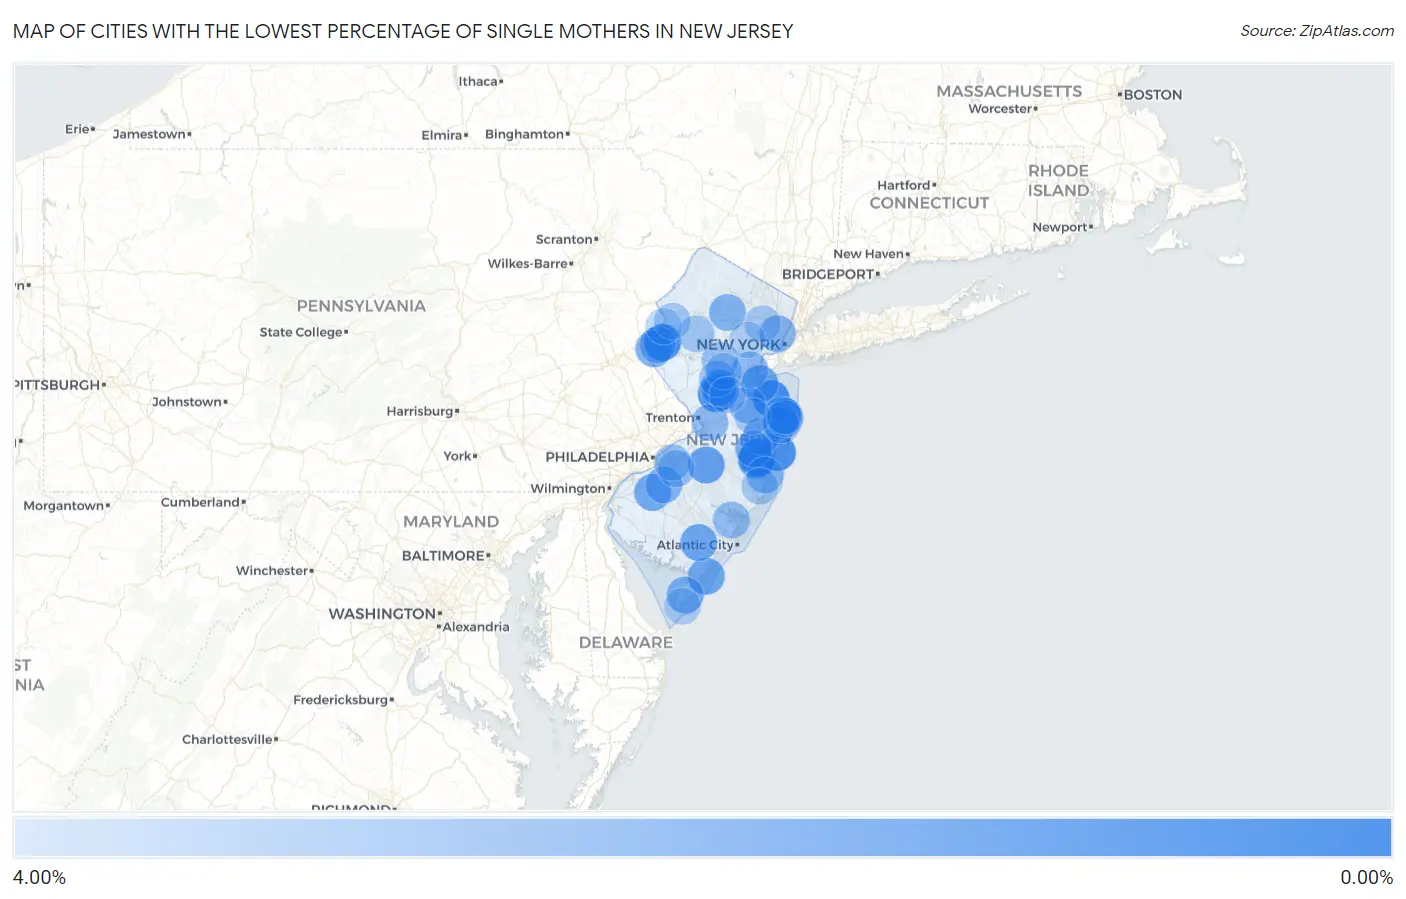
Map of Cities with the Lowest Percentage of Single Mothers in New Jersey
4.00%
0.00%
Cities with the Lowest Percentage of Single Mothers in New Jersey
| City | % Single Mothers | vs State | vs National | |
| 1. | Holiday City South | 0.39% | 10.10%(-9.71)#1 | 11.49%(-11.1)#14 |
| 2. | New Village | 0.59% | 10.10%(-9.51)#2 | 11.49%(-10.9)#51 |
| 3. | Harvey Cedars Borough | 0.65% | 10.10%(-9.45)#3 | 11.49%(-10.8)#69 |
| 4. | Oceanport Borough | 0.66% | 10.10%(-9.44)#4 | 11.49%(-10.8)#74 |
| 5. | Lincroft | 0.69% | 10.10%(-9.41)#5 | 11.49%(-10.8)#86 |
| 6. | Wanamassa | 0.71% | 10.10%(-9.40)#6 | 11.49%(-10.8)#93 |
| 7. | Woodcliff Lake Borough | 0.80% | 10.10%(-9.31)#7 | 11.49%(-10.7)#130 |
| 8. | Franklin Lakes Borough | 0.80% | 10.10%(-9.31)#8 | 11.49%(-10.7)#131 |
| 9. | Dover Beaches North | 0.93% | 10.10%(-9.17)#9 | 11.49%(-10.6)#173 |
| 10. | Kingston | 0.95% | 10.10%(-9.15)#10 | 11.49%(-10.5)#180 |
| 11. | Allendale Borough | 0.95% | 10.10%(-9.15)#11 | 11.49%(-10.5)#182 |
| 12. | Avalon Borough | 1.17% | 10.10%(-8.93)#12 | 11.49%(-10.3)#302 |
| 13. | Wood Ridge Borough | 1.35% | 10.10%(-8.75)#13 | 11.49%(-10.1)#418 |
| 14. | Midland Park Borough | 1.35% | 10.10%(-8.75)#14 | 11.49%(-10.1)#424 |
| 15. | Stone Harbor Borough | 1.38% | 10.10%(-8.72)#15 | 11.49%(-10.1)#445 |
| 16. | Roosevelt Borough | 1.46% | 10.10%(-8.64)#16 | 11.49%(-10.0)#488 |
| 17. | Highlands Borough | 1.48% | 10.10%(-8.62)#17 | 11.49%(-10.0)#498 |
| 18. | Riverton Borough | 1.51% | 10.10%(-8.59)#18 | 11.49%(-9.98)#528 |
| 19. | Leisuretowne | 1.52% | 10.10%(-8.59)#19 | 11.49%(-9.97)#535 |
| 20. | Ship Bottom Borough | 1.53% | 10.10%(-8.57)#20 | 11.49%(-9.96)#543 |
| 21. | Beach Haven Borough | 1.54% | 10.10%(-8.56)#21 | 11.49%(-9.94)#556 |
| 22. | Mickleton | 1.55% | 10.10%(-8.55)#22 | 11.49%(-9.94)#561 |
| 23. | Heathcote | 1.59% | 10.10%(-8.51)#23 | 11.49%(-9.90)#590 |
| 24. | Bay Head Borough | 1.62% | 10.10%(-8.48)#24 | 11.49%(-9.86)#622 |
| 25. | Holiday Heights | 1.65% | 10.10%(-8.46)#25 | 11.49%(-9.84)#641 |
| 26. | Sea Isle City | 1.66% | 10.10%(-8.44)#26 | 11.49%(-9.83)#649 |
| 27. | Hightstown Borough | 1.67% | 10.10%(-8.43)#27 | 11.49%(-9.82)#659 |
| 28. | Medford Lakes Borough | 1.67% | 10.10%(-8.43)#28 | 11.49%(-9.81)#661 |
| 29. | Cliffwood Beach | 1.70% | 10.10%(-8.40)#29 | 11.49%(-9.78)#690 |
| 30. | Estell Manor | 1.72% | 10.10%(-8.39)#30 | 11.49%(-9.77)#703 |
| 31. | South Dennis | 1.76% | 10.10%(-8.35)#31 | 11.49%(-9.73)#739 |
| 32. | Richwood | 1.82% | 10.10%(-8.29)#32 | 11.49%(-9.67)#777 |
| 33. | Carlstadt Borough | 1.82% | 10.10%(-8.28)#33 | 11.49%(-9.67)#785 |
| 34. | Lakewood | 1.90% | 10.10%(-8.20)#34 | 11.49%(-9.59)#831 |
| 35. | Lyons | 1.92% | 10.10%(-8.19)#35 | 11.49%(-9.57)#841 |
| 36. | North Haledon Borough | 1.98% | 10.10%(-8.12)#36 | 11.49%(-9.51)#910 |
| 37. | Leisure Village West | 1.98% | 10.10%(-8.12)#37 | 11.49%(-9.50)#911 |
| 38. | Packanack Lake | 2.00% | 10.10%(-8.10)#38 | 11.49%(-9.48)#936 |
| 39. | Upper Pohatcong | 2.06% | 10.10%(-8.04)#39 | 11.49%(-9.43)#987 |
| 40. | Rio Grande | 2.07% | 10.10%(-8.03)#40 | 11.49%(-9.42)#999 |
| 41. | Essex Fells Borough | 2.11% | 10.10%(-7.99)#41 | 11.49%(-9.38)#1,029 |
| 42. | Hillsdale Borough | 2.14% | 10.10%(-7.97)#42 | 11.49%(-9.35)#1,058 |
| 43. | Raritan Borough | 2.19% | 10.10%(-7.91)#43 | 11.49%(-9.29)#1,096 |
| 44. | White Meadow Lake | 2.20% | 10.10%(-7.91)#44 | 11.49%(-9.29)#1,097 |
| 45. | Peapack And Gladstone Borough | 2.21% | 10.10%(-7.89)#45 | 11.49%(-9.28)#1,112 |
| 46. | Turnersville | 2.24% | 10.10%(-7.86)#46 | 11.49%(-9.25)#1,135 |
| 47. | Secaucus | 2.26% | 10.10%(-7.84)#47 | 11.49%(-9.23)#1,158 |
| 48. | Shark River Hills | 2.27% | 10.10%(-7.83)#48 | 11.49%(-9.22)#1,163 |
| 49. | Palermo | 2.27% | 10.10%(-7.83)#49 | 11.49%(-9.21)#1,166 |
| 50. | Yorketown | 2.30% | 10.10%(-7.80)#50 | 11.49%(-9.19)#1,202 |
| 51. | Mantoloking Borough | 2.31% | 10.10%(-7.80)#51 | 11.49%(-9.18)#1,206 |
| 52. | Fords | 2.35% | 10.10%(-7.76)#52 | 11.49%(-9.14)#1,246 |
| 53. | Upper Stewartsville | 2.35% | 10.10%(-7.75)#53 | 11.49%(-9.13)#1,253 |
| 54. | Hewitt | 2.37% | 10.10%(-7.73)#54 | 11.49%(-9.12)#1,263 |
| 55. | Pompton Plains | 2.41% | 10.10%(-7.70)#55 | 11.49%(-9.08)#1,299 |
| 56. | Forked River | 2.42% | 10.10%(-7.69)#56 | 11.49%(-9.07)#1,311 |
| 57. | Yardville | 2.46% | 10.10%(-7.65)#57 | 11.49%(-9.03)#1,348 |
| 58. | Seaville | 2.53% | 10.10%(-7.58)#58 | 11.49%(-8.96)#1,412 |
| 59. | Springdale | 2.57% | 10.10%(-7.53)#59 | 11.49%(-8.92)#1,455 |
| 60. | Port Republic | 2.58% | 10.10%(-7.53)#60 | 11.49%(-8.91)#1,466 |
| 61. | West Belmar | 2.59% | 10.10%(-7.52)#61 | 11.49%(-8.90)#1,474 |
| 62. | Haworth Borough | 2.60% | 10.10%(-7.51)#62 | 11.49%(-8.89)#1,477 |
| 63. | Germania | 2.60% | 10.10%(-7.50)#63 | 11.49%(-8.89)#1,490 |
| 64. | Ocean Grove | 2.62% | 10.10%(-7.49)#64 | 11.49%(-8.87)#1,499 |
| 65. | Kendall Park | 2.66% | 10.10%(-7.45)#65 | 11.49%(-8.83)#1,536 |
| 66. | Ten Mile Run | 2.66% | 10.10%(-7.45)#66 | 11.49%(-8.83)#1,539 |
| 67. | Pine Brook | 2.67% | 10.10%(-7.43)#67 | 11.49%(-8.81)#1,552 |
| 68. | Kingston Estates | 2.72% | 10.10%(-7.38)#68 | 11.49%(-8.77)#1,602 |
| 69. | Martinsville | 2.72% | 10.10%(-7.38)#69 | 11.49%(-8.77)#1,603 |
| 70. | Blackwells Mills | 2.75% | 10.10%(-7.36)#70 | 11.49%(-8.74)#1,625 |
| 71. | Cedar Knolls | 2.76% | 10.10%(-7.34)#71 | 11.49%(-8.72)#1,644 |
| 72. | Cresskill Borough | 2.77% | 10.10%(-7.33)#72 | 11.49%(-8.72)#1,655 |
| 73. | Norwood Borough | 2.78% | 10.10%(-7.33)#73 | 11.49%(-8.71)#1,656 |
| 74. | Little Silver Borough | 2.83% | 10.10%(-7.27)#74 | 11.49%(-8.66)#1,734 |
| 75. | Old Tappan Borough | 2.88% | 10.10%(-7.23)#75 | 11.49%(-8.61)#1,778 |
| 76. | Chester Borough | 2.88% | 10.10%(-7.23)#76 | 11.49%(-8.61)#1,781 |
| 77. | Laurel Springs Borough | 2.88% | 10.10%(-7.22)#77 | 11.49%(-8.60)#1,787 |
| 78. | Long Valley | 2.89% | 10.10%(-7.21)#78 | 11.49%(-8.59)#1,798 |
| 79. | Clementon Borough | 2.92% | 10.10%(-7.19)#79 | 11.49%(-8.57)#1,827 |
| 80. | Chatham Borough | 2.96% | 10.10%(-7.14)#80 | 11.49%(-8.53)#1,881 |
| 81. | Barnegat | 2.98% | 10.10%(-7.13)#81 | 11.49%(-8.51)#1,896 |
| 82. | Mountain Lake | 2.99% | 10.10%(-7.11)#82 | 11.49%(-8.49)#1,907 |
| 83. | Upper Montclair | 3.03% | 10.10%(-7.07)#83 | 11.49%(-8.46)#1,935 |
| 84. | Surf City Borough | 3.07% | 10.10%(-7.03)#84 | 11.49%(-8.42)#1,979 |
| 85. | Northvale Borough | 3.07% | 10.10%(-7.03)#85 | 11.49%(-8.41)#1,980 |
| 86. | Franklin Center | 3.10% | 10.10%(-7.01)#86 | 11.49%(-8.39)#2,005 |
| 87. | Mountain Lakes Borough | 3.12% | 10.10%(-6.98)#87 | 11.49%(-8.37)#2,020 |
| 88. | West Freehold | 3.19% | 10.10%(-6.92)#88 | 11.49%(-8.30)#2,089 |
| 89. | Cape May | 3.22% | 10.10%(-6.89)#89 | 11.49%(-8.27)#2,113 |
| 90. | Demarest Borough | 3.24% | 10.10%(-6.87)#90 | 11.49%(-8.25)#2,147 |
| 91. | Wenonah Borough | 3.26% | 10.10%(-6.85)#91 | 11.49%(-8.23)#2,162 |
| 92. | Short Hills | 3.27% | 10.10%(-6.83)#92 | 11.49%(-8.21)#2,180 |
| 93. | Troy Hills | 3.28% | 10.10%(-6.82)#93 | 11.49%(-8.21)#2,191 |
| 94. | Parsippany | 3.29% | 10.10%(-6.82)#94 | 11.49%(-8.20)#2,197 |
| 95. | Dayton | 3.31% | 10.10%(-6.79)#95 | 11.49%(-8.18)#2,211 |
| 96. | Belvidere | 3.32% | 10.10%(-6.78)#96 | 11.49%(-8.16)#2,223 |
| 97. | Saddle River Borough | 3.36% | 10.10%(-6.75)#97 | 11.49%(-8.13)#2,265 |
| 98. | Oradell Borough | 3.38% | 10.10%(-6.72)#98 | 11.49%(-8.10)#2,282 |
| 99. | Loch Arbour | 3.39% | 10.10%(-6.71)#99 | 11.49%(-8.10)#2,289 |
| 100. | Milltown Borough | 3.40% | 10.10%(-6.71)#100 | 11.49%(-8.09)#2,295 |
Common Questions
What are the Top 10 Cities with the Lowest Percentage of Single Mothers in New Jersey?
Top 10 Cities with the Lowest Percentage of Single Mothers in New Jersey are:
#1
0.39%
#2
0.59%
#3
0.69%
#4
0.71%
#5
0.93%
#6
0.95%
#7
1.52%
#8
1.59%
#9
1.65%
#10
1.66%
What city has the Lowest Percentage of Single Mothers in New Jersey?
Holiday City South has the Lowest Percentage of Single Mothers in New Jersey with 0.39%.
What is the Percentage of Single Mothers in the State of New Jersey?
Percentage of Single Mothers in New Jersey is 10.10%.
What is the Percentage of Single Mothers in the United States?
Percentage of Single Mothers in the United States is 11.49%.