Cities with the Highest Median Property Prices in New Jersey
RELATED REPORTS & OPTIONS
Highest Property Prices
New Jersey
Compare Cities
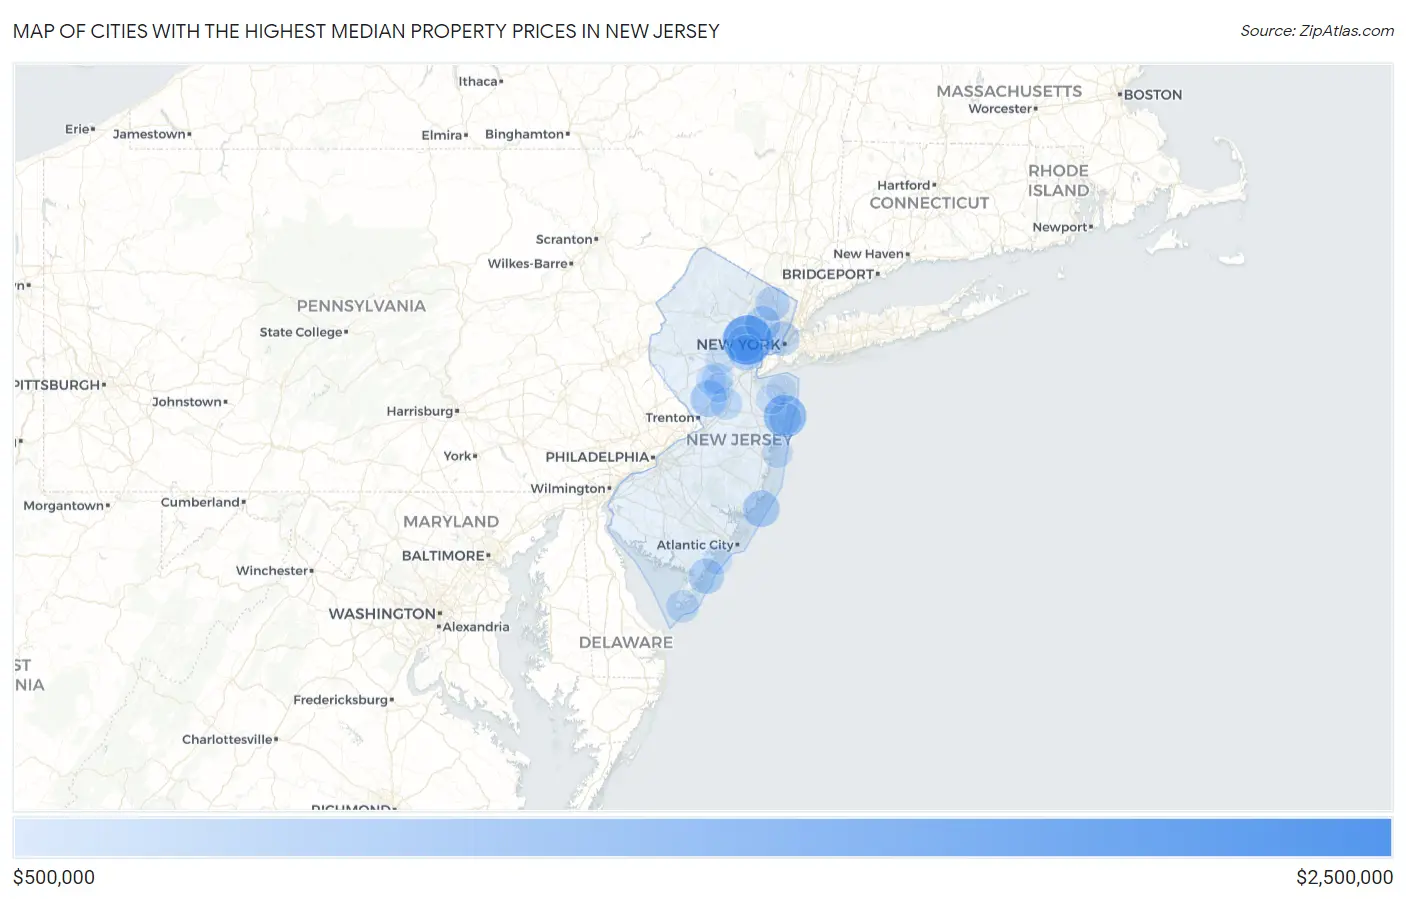
Map of Cities with the Highest Median Property Prices in New Jersey
$0
$2,500,000
Cities with the Highest Median Property Prices in New Jersey
| City | Avg Property Price | vs State | vs National | |
| 1. | Spring Lake Borough | $2,000,001 | $401,838(+1.60m)#1 | $281,181(+1.72m)#39 |
| 2. | Alpine Borough | $2,000,001 | $401,838(+1.60m)#2 | $281,181(+1.72m)#49 |
| 3. | Rockleigh Borough | $2,000,001 | $401,838(+1.60m)#3 | $281,181(+1.72m)#61 |
| 4. | Mantoloking Borough | $2,000,001 | $401,838(+1.60m)#4 | $281,181(+1.72m)#65 |
| 5. | Sea Girt Borough | $1,938,562 | $401,838(+1.54m)#5 | $281,181(+1.66m)#87 |
| 6. | Saddle River Borough | $1,921,264 | $401,838(+1.52m)#6 | $281,181(+1.64m)#91 |
| 7. | New Vernon | $1,817,944 | $401,838(+1.42m)#7 | $281,181(+1.54m)#114 |
| 8. | Stone Harbor Borough | $1,775,595 | $401,838(+1.37m)#8 | $281,181(+1.49m)#118 |
| 9. | Avalon Borough | $1,666,209 | $401,838(+1.26m)#9 | $281,181(+1.39m)#144 |
| 10. | Bay Head Borough | $1,605,296 | $401,838(+1.20m)#10 | $281,181(+1.32m)#164 |
| 11. | Short Hills | $1,569,216 | $401,838(+1.17m)#11 | $281,181(+1.29m)#178 |
| 12. | Deal Borough | $1,552,147 | $401,838(+1.15m)#12 | $281,181(+1.27m)#184 |
| 13. | Rumson Borough | $1,519,971 | $401,838(+1.12m)#13 | $281,181(+1.24m)#190 |
| 14. | Allenhurst Borough | $1,299,536 | $401,838(+898k)#14 | $281,181(+1.02m)#273 |
| 15. | Loch Arbour | $1,239,600 | $401,838(+838k)#15 | $281,181(+958k)#297 |
| 16. | Englewood Cliffs Borough | $1,230,049 | $401,838(+828k)#16 | $281,181(+949k)#300 |
| 17. | Avon By The Sea Borough | $1,174,646 | $401,838(+773k)#17 | $281,181(+893k)#337 |
| 18. | Harvey Cedars Borough | $1,147,110 | $401,838(+745k)#18 | $281,181(+866k)#355 |
| 19. | Franklin Lakes Borough | $1,139,241 | $401,838(+737k)#19 | $281,181(+858k)#361 |
| 20. | Beach Haven Borough | $1,122,552 | $401,838(+721k)#20 | $281,181(+841k)#375 |
| 21. | Llewellyn Park | $1,062,200 | $401,838(+660k)#21 | $281,181(+781k)#424 |
| 22. | Upper Saddle River Borough | $1,025,348 | $401,838(+624k)#22 | $281,181(+744k)#463 |
| 23. | Barnegat Light Borough | $1,010,092 | $401,838(+608k)#23 | $281,181(+729k)#480 |
| 24. | Longport Borough | $1,000,884 | $401,838(+599k)#24 | $281,181(+720k)#488 |
| 25. | Liberty Corner | $997,131 | $401,838(+595k)#25 | $281,181(+716k)#490 |
| 26. | Demarest Borough | $994,077 | $401,838(+592k)#26 | $281,181(+713k)#497 |
| 27. | Cape May Point Borough | $984,521 | $401,838(+583k)#27 | $281,181(+703k)#510 |
| 28. | Princeton | $960,730 | $401,838(+559k)#28 | $281,181(+680k)#537 |
| 29. | North Beach Haven | $960,721 | $401,838(+559k)#29 | $281,181(+680k)#538 |
| 30. | Chatham Borough | $955,286 | $401,838(+553k)#30 | $281,181(+674k)#545 |
| 31. | Tenafly Borough | $951,162 | $401,838(+549k)#31 | $281,181(+670k)#554 |
| 32. | Ho Ho Kus Borough | $946,344 | $401,838(+545k)#32 | $281,181(+665k)#563 |
| 33. | Old Tappan Borough | $935,133 | $401,838(+533k)#33 | $281,181(+654k)#578 |
| 34. | Essex Fells Borough | $934,332 | $401,838(+532k)#34 | $281,181(+653k)#579 |
| 35. | Lavallette Borough | $924,924 | $401,838(+523k)#35 | $281,181(+644k)#593 |
| 36. | Monmouth Beach Borough | $913,966 | $401,838(+512k)#36 | $281,181(+633k)#609 |
| 37. | Summit | $909,474 | $401,838(+508k)#37 | $281,181(+628k)#620 |
| 38. | Fair Haven Borough | $905,510 | $401,838(+504k)#38 | $281,181(+624k)#625 |
| 39. | Upper Montclair | $902,941 | $401,838(+501k)#39 | $281,181(+622k)#633 |
| 40. | Sea Isle City | $900,929 | $401,838(+499k)#40 | $281,181(+620k)#634 |
| 41. | Lyons | $896,188 | $401,838(+494k)#41 | $281,181(+615k)#646 |
| 42. | Westfield | $893,254 | $401,838(+491k)#42 | $281,181(+612k)#650 |
| 43. | Woodcliff Lake Borough | $891,362 | $401,838(+490k)#43 | $281,181(+610k)#652 |
| 44. | North Caldwell Borough | $890,934 | $401,838(+489k)#44 | $281,181(+610k)#654 |
| 45. | Surf City Borough | $884,403 | $401,838(+483k)#45 | $281,181(+603k)#661 |
| 46. | Brookside | $877,671 | $401,838(+476k)#46 | $281,181(+596k)#671 |
| 47. | Mountain Lakes Borough | $868,421 | $401,838(+467k)#47 | $281,181(+587k)#696 |
| 48. | Manasquan Borough | $865,894 | $401,838(+464k)#48 | $281,181(+585k)#701 |
| 49. | Ridgewood | $858,112 | $401,838(+456k)#49 | $281,181(+577k)#717 |
| 50. | Hoboken | $855,392 | $401,838(+454k)#50 | $281,181(+574k)#724 |
| 51. | Ship Bottom Borough | $846,790 | $401,838(+445k)#51 | $281,181(+566k)#742 |
| 52. | Bradley Beach Borough | $842,611 | $401,838(+441k)#52 | $281,181(+561k)#752 |
| 53. | Madison Borough | $842,585 | $401,838(+441k)#53 | $281,181(+561k)#753 |
| 54. | Peapack And Gladstone Borough | $828,349 | $401,838(+427k)#54 | $281,181(+547k)#790 |
| 55. | Little Silver Borough | $816,474 | $401,838(+415k)#55 | $281,181(+535k)#812 |
| 56. | Interlaken Borough | $816,097 | $401,838(+414k)#56 | $281,181(+535k)#813 |
| 57. | Basking Ridge | $813,256 | $401,838(+411k)#57 | $281,181(+532k)#819 |
| 58. | Bedminster | $802,097 | $401,838(+400k)#58 | $281,181(+521k)#849 |
| 59. | Watchung Borough | $800,229 | $401,838(+398k)#59 | $281,181(+519k)#855 |
| 60. | Seaside Park Borough | $792,282 | $401,838(+390k)#60 | $281,181(+511k)#878 |
| 61. | Ocean Grove | $789,121 | $401,838(+387k)#61 | $281,181(+508k)#890 |
| 62. | Sea Bright Borough | $787,102 | $401,838(+385k)#62 | $281,181(+506k)#894 |
| 63. | Haworth Borough | $783,843 | $401,838(+382k)#63 | $281,181(+503k)#899 |
| 64. | Glen Rock Borough | $783,474 | $401,838(+382k)#64 | $281,181(+502k)#901 |
| 65. | Closter Borough | $777,391 | $401,838(+376k)#65 | $281,181(+496k)#918 |
| 66. | Cape May | $773,008 | $401,838(+371k)#66 | $281,181(+492k)#928 |
| 67. | Brielle Borough | $768,336 | $401,838(+366k)#67 | $281,181(+487k)#948 |
| 68. | Mendham Borough | $758,325 | $401,838(+356k)#68 | $281,181(+477k)#971 |
| 69. | Far Hills Borough | $756,166 | $401,838(+354k)#69 | $281,181(+475k)#978 |
| 70. | Cranbury | $750,254 | $401,838(+348k)#70 | $281,181(+469k)#989 |
| 71. | Edgewater Borough | $746,674 | $401,838(+345k)#71 | $281,181(+465k)#994 |
| 72. | Point Pleasant Beach Borough | $745,536 | $401,838(+344k)#72 | $281,181(+464k)#1,002 |
| 73. | Allendale Borough | $742,143 | $401,838(+340k)#73 | $281,181(+461k)#1,014 |
| 74. | Cresskill Borough | $738,122 | $401,838(+336k)#74 | $281,181(+457k)#1,020 |
| 75. | Millington | $735,303 | $401,838(+333k)#75 | $281,181(+454k)#1,029 |
| 76. | Mountainside Borough | $732,367 | $401,838(+331k)#76 | $281,181(+451k)#1,039 |
| 77. | Bernardsville Borough | $724,599 | $401,838(+323k)#77 | $281,181(+443k)#1,066 |
| 78. | Belmar Borough | $714,025 | $401,838(+312k)#78 | $281,181(+433k)#1,103 |
| 79. | Florham Park Borough | $709,264 | $401,838(+307k)#79 | $281,181(+428k)#1,119 |
| 80. | Glen Ridge Borough | $702,335 | $401,838(+300k)#80 | $281,181(+421k)#1,152 |
| 81. | New Providence Borough | $700,818 | $401,838(+299k)#81 | $281,181(+420k)#1,158 |
| 82. | Shrewsbury Borough | $699,386 | $401,838(+298k)#82 | $281,181(+418k)#1,164 |
| 83. | Blackwells Mills | $695,302 | $401,838(+293k)#83 | $281,181(+414k)#1,181 |
| 84. | Pine Brook | $692,838 | $401,838(+291k)#84 | $281,181(+412k)#1,192 |
| 85. | Oradell Borough | $692,238 | $401,838(+290k)#85 | $281,181(+411k)#1,196 |
| 86. | Dover Beaches North | $691,530 | $401,838(+290k)#86 | $281,181(+410k)#1,199 |
| 87. | Paramus Borough | $690,942 | $401,838(+289k)#87 | $281,181(+410k)#1,202 |
| 88. | Kinnelon Borough | $689,061 | $401,838(+287k)#88 | $281,181(+408k)#1,209 |
| 89. | Harrington Park Borough | $686,826 | $401,838(+285k)#89 | $281,181(+406k)#1,219 |
| 90. | Montvale Borough | $675,429 | $401,838(+274k)#90 | $281,181(+394k)#1,261 |
| 91. | Lincroft | $673,816 | $401,838(+272k)#91 | $281,181(+393k)#1,265 |
| 92. | Palisades Park Borough | $673,773 | $401,838(+272k)#92 | $281,181(+393k)#1,266 |
| 93. | Belle Mead | $672,886 | $401,838(+271k)#93 | $281,181(+392k)#1,270 |
| 94. | Park Ridge Borough | $663,383 | $401,838(+262k)#94 | $281,181(+382k)#1,320 |
| 95. | Martinsville | $662,378 | $401,838(+261k)#95 | $281,181(+381k)#1,328 |
| 96. | Ocean City | $659,541 | $401,838(+258k)#96 | $281,181(+378k)#1,347 |
| 97. | Ramsey Borough | $658,749 | $401,838(+257k)#97 | $281,181(+378k)#1,350 |
| 98. | Cream Ridge | $656,200 | $401,838(+254k)#98 | $281,181(+375k)#1,361 |
| 99. | Navesink | $655,806 | $401,838(+254k)#99 | $281,181(+375k)#1,365 |
| 100. | Ten Mile Run | $655,463 | $401,838(+254k)#100 | $281,181(+374k)#1,370 |
Common Questions
What are the Top 10 Cities with the Highest Median Property Prices in New Jersey?
Top 10 Cities with the Highest Median Property Prices in New Jersey are:
#1
$1,569,216
#2
$1,239,600
#3
$960,730
#4
$960,721
#5
$909,474
#6
$902,941
#7
$900,929
#8
$893,254
#9
$858,112
#10
$855,392
What city has the Highest Median Property Prices in New Jersey?
Short Hills has the Highest Median Property Prices in New Jersey with $1,569,216.
What is the Median Property Prices in the State of New Jersey?
Median Property Prices in New Jersey is $401,838.
What is the Median Property Prices in the United States?
Median Property Prices in the United States is $281,181.