Kenilworth borough, NJ
Kenilworth borough Overview
8,345
TOTAL POPULATION
3,743
MALE POPULATION
4,602
FEMALE POPULATION
81.33
MALES / 100 FEMALES
122.95
FEMALES / 100 MALES
37.0
MEDIAN AGE
3.4
AVG FAMILY SIZE
3.0
AVG HOUSEHOLD SIZE
$49,611
PER CAPITA INCOME
$116,618
AVG FAMILY INCOME
$97,600
AVG HOUSEHOLD INCOME
1.4%
WAGE / INCOME GAP [ % ]
98.6¢/ $1
WAGE / INCOME GAP [ $ ]
0.51
INEQUALITY / GINI INDEX
4,500
LABOR FORCE [ PEOPLE ]
72.8%
PERCENT IN LABOR FORCE
8.4%
UNEMPLOYMENT RATE
Race in Kenilworth borough
The most populous races in Kenilworth borough are White / Caucasian (5,319 | 63.7%), Hispanic or Latino (2,487 | 29.8%), and Two or more Races (1,227 | 14.7%).
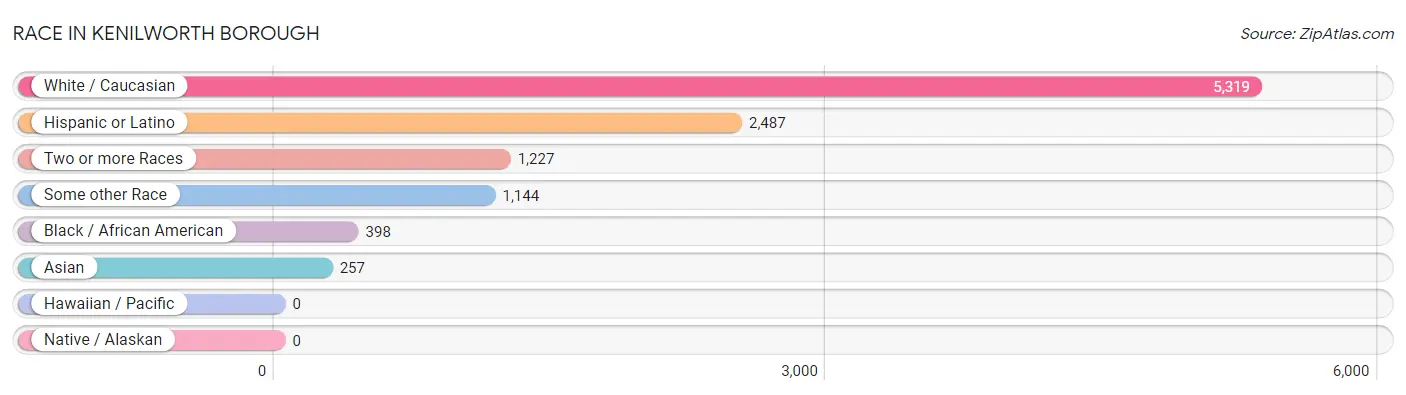
| Race | # Population | % Population |
| Asian | 257 | 3.1% |
| Black / African American | 398 | 4.8% |
| Hawaiian / Pacific | 0 | 0.0% |
| Hispanic or Latino | 2,487 | 29.8% |
| Native / Alaskan | 0 | 0.0% |
| White / Caucasian | 5,319 | 63.7% |
| Two or more Races | 1,227 | 14.7% |
| Some other Race | 1,144 | 13.7% |
| Total | 8,345 | 100.0% |
Ancestry in Kenilworth borough
The most populous ancestries reported in Kenilworth borough are Italian (1,475 | 17.7%), Portuguese (733 | 8.8%), Puerto Rican (661 | 7.9%), American (636 | 7.6%), and Polish (616 | 7.4%), together accounting for 49.4% of all Kenilworth borough residents.
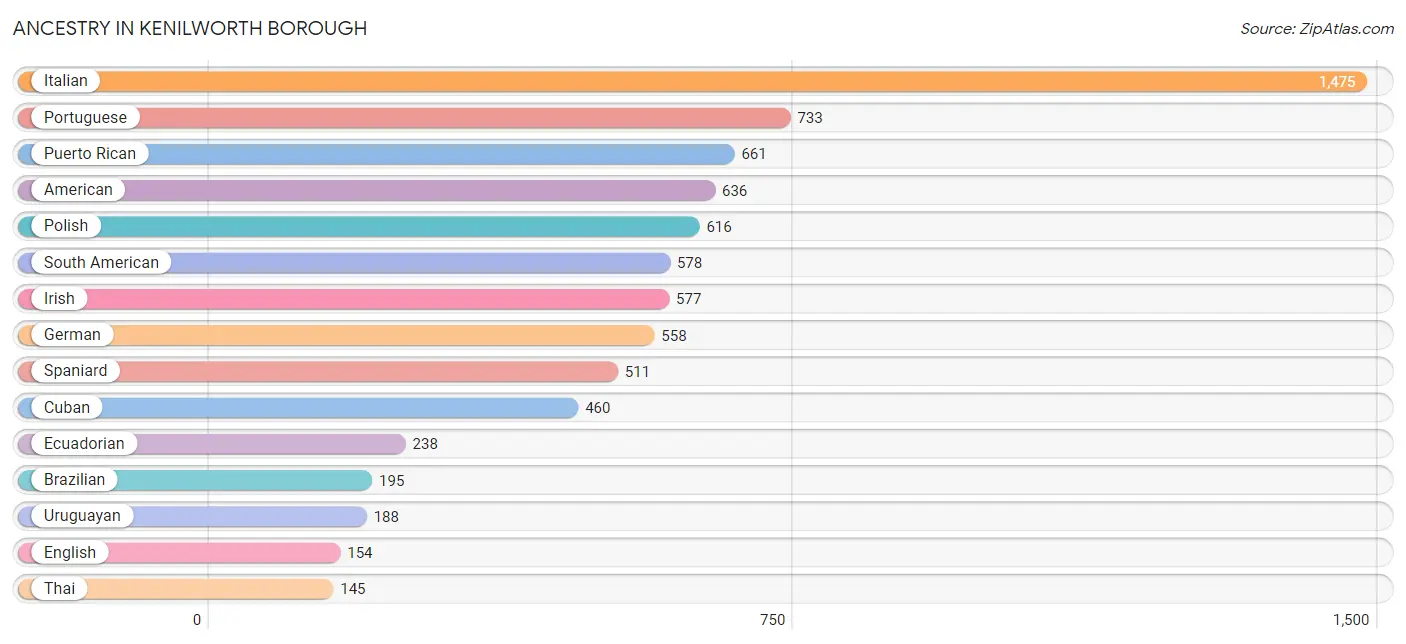
| Ancestry | # Population | % Population |
| American | 636 | 7.6% |
| Arab | 138 | 1.7% |
| Argentinean | 38 | 0.5% |
| Brazilian | 195 | 2.3% |
| Burmese | 41 | 0.5% |
| Central American | 52 | 0.6% |
| Colombian | 92 | 1.1% |
| Costa Rican | 52 | 0.6% |
| Cuban | 460 | 5.5% |
| Czech | 18 | 0.2% |
| Czechoslovakian | 15 | 0.2% |
| Dominican | 104 | 1.3% |
| Dutch | 8 | 0.1% |
| Ecuadorian | 238 | 2.9% |
| Egyptian | 25 | 0.3% |
| English | 154 | 1.8% |
| European | 42 | 0.5% |
| French | 79 | 0.9% |
| German | 558 | 6.7% |
| Greek | 93 | 1.1% |
| Hungarian | 100 | 1.2% |
| Irish | 577 | 6.9% |
| Italian | 1,475 | 17.7% |
| Japanese | 64 | 0.8% |
| Jordanian | 113 | 1.3% |
| Korean | 58 | 0.7% |
| Lithuanian | 44 | 0.5% |
| Mexican | 121 | 1.5% |
| Pakistani | 13 | 0.2% |
| Peruvian | 22 | 0.3% |
| Polish | 616 | 7.4% |
| Portuguese | 733 | 8.8% |
| Puerto Rican | 661 | 7.9% |
| Russian | 61 | 0.7% |
| Scandinavian | 11 | 0.1% |
| Scotch-Irish | 13 | 0.2% |
| Scottish | 18 | 0.2% |
| South American | 578 | 6.9% |
| Spaniard | 511 | 6.1% |
| Thai | 145 | 1.7% |
| Ukrainian | 98 | 1.2% |
| Uruguayan | 188 | 2.2% | View All 42 Rows |
Immigrants in Kenilworth borough
The most numerous immigrant groups reported in Kenilworth borough came from Europe (630 | 7.5%), Latin America (597 | 7.1%), Southern Europe (270 | 3.2%), Caribbean (240 | 2.9%), and Eastern Europe (240 | 2.9%), together accounting for 23.7% of all Kenilworth borough residents.
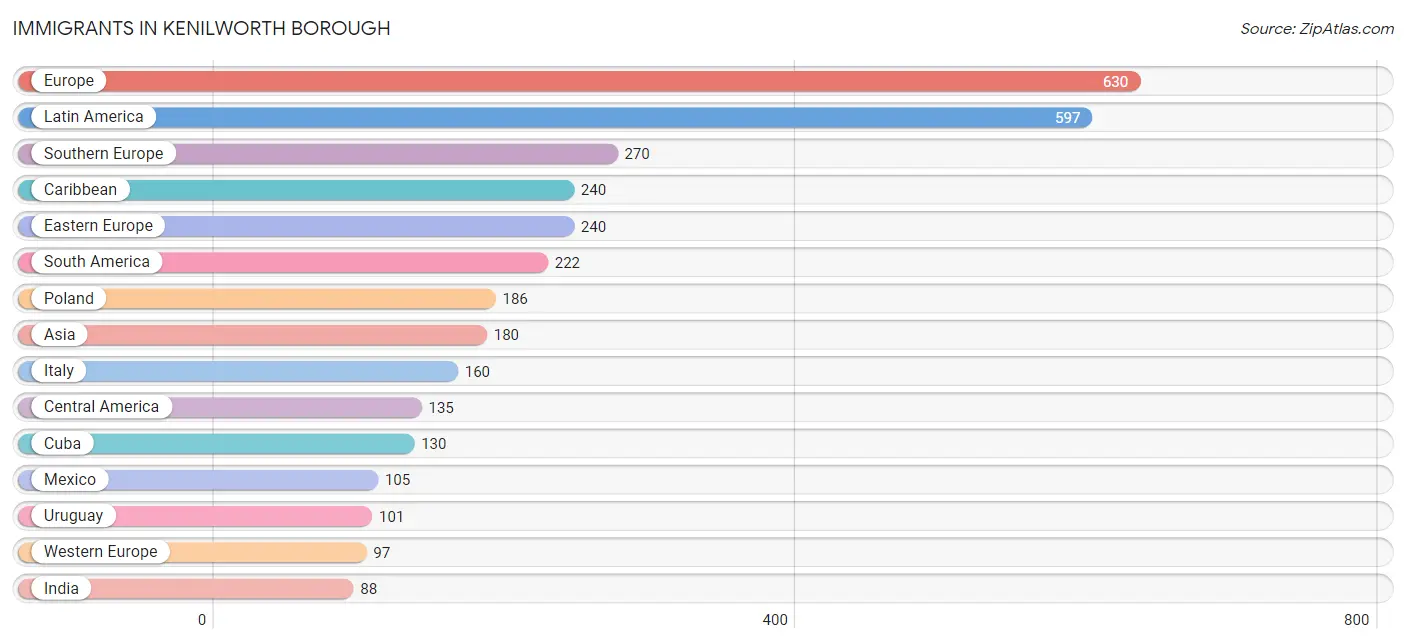
| Immigration Origin | # Population | % Population |
| Africa | 22 | 0.3% |
| Argentina | 20 | 0.2% |
| Asia | 180 | 2.2% |
| Caribbean | 240 | 2.9% |
| Central America | 135 | 1.6% |
| Colombia | 37 | 0.4% |
| Costa Rica | 30 | 0.4% |
| Cuba | 130 | 1.6% |
| Dominican Republic | 61 | 0.7% |
| Eastern Asia | 41 | 0.5% |
| Eastern Europe | 240 | 2.9% |
| Ecuador | 42 | 0.5% |
| Egypt | 11 | 0.1% |
| England | 10 | 0.1% |
| Europe | 630 | 7.5% |
| France | 68 | 0.8% |
| Germany | 29 | 0.4% |
| Haiti | 49 | 0.6% |
| India | 88 | 1.1% |
| Italy | 160 | 1.9% |
| Korea | 41 | 0.5% |
| Latin America | 597 | 7.1% |
| Mexico | 105 | 1.3% |
| Middle Africa | 11 | 0.1% |
| Northern Africa | 11 | 0.1% |
| Northern Europe | 23 | 0.3% |
| Peru | 22 | 0.3% |
| Philippines | 38 | 0.5% |
| Poland | 186 | 2.2% |
| Portugal | 37 | 0.4% |
| South America | 222 | 2.7% |
| South Central Asia | 88 | 1.1% |
| South Eastern Asia | 51 | 0.6% |
| Southern Europe | 270 | 3.2% |
| Spain | 73 | 0.9% |
| Thailand | 13 | 0.2% |
| Ukraine | 54 | 0.6% |
| Uruguay | 101 | 1.2% |
| Western Europe | 97 | 1.2% | View All 39 Rows |
Sex and Age in Kenilworth borough
Sex and Age in Kenilworth borough
The most populous age groups in Kenilworth borough are 10 to 14 Years (577 | 15.4%) for men and 10 to 14 Years (642 | 14.0%) for women.
| Age Bracket | Male | Female |
| Under 5 Years | 94 (2.5%) | 228 (5.0%) |
| 5 to 9 Years | 136 (3.6%) | 471 (10.2%) |
| 10 to 14 Years | 577 (15.4%) | 642 (14.0%) |
| 15 to 19 Years | 181 (4.8%) | 115 (2.5%) |
| 20 to 24 Years | 286 (7.6%) | 82 (1.8%) |
| 25 to 29 Years | 330 (8.8%) | 238 (5.2%) |
| 30 to 34 Years | 209 (5.6%) | 364 (7.9%) |
| 35 to 39 Years | 205 (5.5%) | 362 (7.9%) |
| 40 to 44 Years | 235 (6.3%) | 165 (3.6%) |
| 45 to 49 Years | 286 (7.6%) | 386 (8.4%) |
| 50 to 54 Years | 239 (6.4%) | 238 (5.2%) |
| 55 to 59 Years | 220 (5.9%) | 454 (9.9%) |
| 60 to 64 Years | 203 (5.4%) | 186 (4.0%) |
| 65 to 69 Years | 210 (5.6%) | 205 (4.4%) |
| 70 to 74 Years | 176 (4.7%) | 213 (4.6%) |
| 75 to 79 Years | 30 (0.8%) | 45 (1.0%) |
| 80 to 84 Years | 81 (2.2%) | 145 (3.2%) |
| 85 Years and over | 45 (1.2%) | 63 (1.4%) |
| Total | 3,743 (100.0%) | 4,602 (100.0%) |
Families and Households in Kenilworth borough
Median Family Size in Kenilworth borough
The median family size in Kenilworth borough is 3.39 persons per family, with married-couple families (1,375 | 62.3%) accounting for the largest median family size of 3.63 persons per family. On the other hand, single male/father families (168 | 7.6%) represent the smallest median family size with 2.78 persons per family.
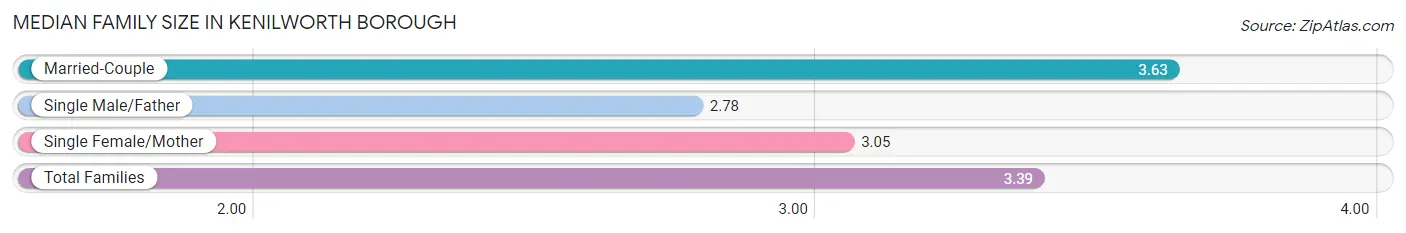
| Family Type | # Families | Family Size |
| Married-Couple | 1,375 (62.3%) | 3.63 |
| Single Male/Father | 168 (7.6%) | 2.78 |
| Single Female/Mother | 665 (30.1%) | 3.05 |
| Total Families | 2,208 (100.0%) | 3.39 |
Median Household Size in Kenilworth borough
The median household size in Kenilworth borough is 2.98 persons per household, with married-couple households (1,375 | 49.1%) accounting for the largest median household size of 3.66 persons per household. non-family households (594 | 21.2%) represent the smallest median household size with 1.15 persons per household.
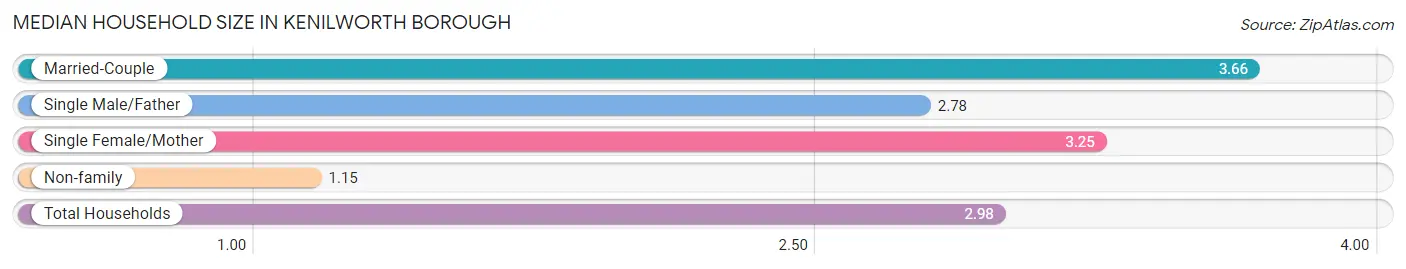
| Household Type | # Households | Household Size |
| Married-Couple | 1,375 (49.1%) | 3.66 |
| Single Male/Father | 168 (6.0%) | 2.78 |
| Single Female/Mother | 665 (23.7%) | 3.25 |
| Non-family | 594 (21.2%) | 1.15 |
| Total Households | 2,802 (100.0%) | 2.98 |
Household Size by Marriage Status in Kenilworth borough
Out of a total of 2,802 households in Kenilworth borough, 2,208 (78.8%) are family households, while 594 (21.2%) are nonfamily households. The most numerous type of family households are 2-person households, comprising 915, and the most common type of nonfamily households are 1-person households, comprising 502.

| Household Size | Family Households | Nonfamily Households |
| 1-Person Households | - | 502 (17.9%) |
| 2-Person Households | 915 (32.7%) | 92 (3.3%) |
| 3-Person Households | 448 (16.0%) | 0 (0.0%) |
| 4-Person Households | 498 (17.8%) | 0 (0.0%) |
| 5-Person Households | 176 (6.3%) | 0 (0.0%) |
| 6-Person Households | 68 (2.4%) | 0 (0.0%) |
| 7+ Person Households | 103 (3.7%) | 0 (0.0%) |
| Total | 2,208 (78.8%) | 594 (21.2%) |
Female Fertility in Kenilworth borough
Fertility by Age in Kenilworth borough
Average fertility rate in Kenilworth borough is 45.0 births per 1,000 women. Women in the age bracket of 35 to 50 years have the highest fertility rate with 68.0 births per 1,000 women. Women in the age bracket of 35 to 50 years acount for 84.2% of all women with births.
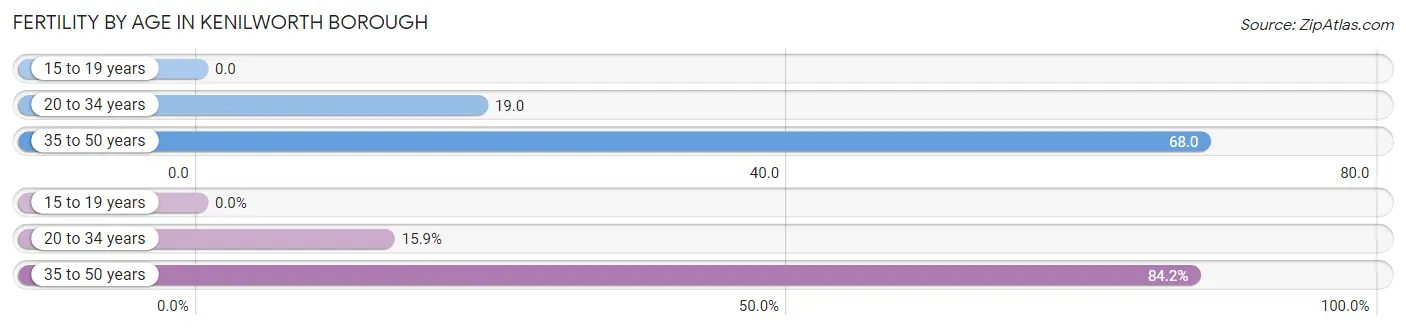
| Age Bracket | Women with Births | Births / 1,000 Women |
| 15 to 19 years | 0 (0.0%) | 0.0 |
| 20 to 34 years | 13 (15.9%) | 19.0 |
| 35 to 50 years | 69 (84.2%) | 68.0 |
| Total | 82 (100.0%) | 45.0 |
Fertility by Age by Marriage Status in Kenilworth borough
40.2% of women with births (82) in Kenilworth borough are married. The highest percentage of unmarried women with births falls into 35 to 50 years age bracket with 71.0% of them unmarried at the time of birth, while the lowest percentage of unmarried women with births belong to 20 to 34 years age bracket with 0.0% of them unmarried.
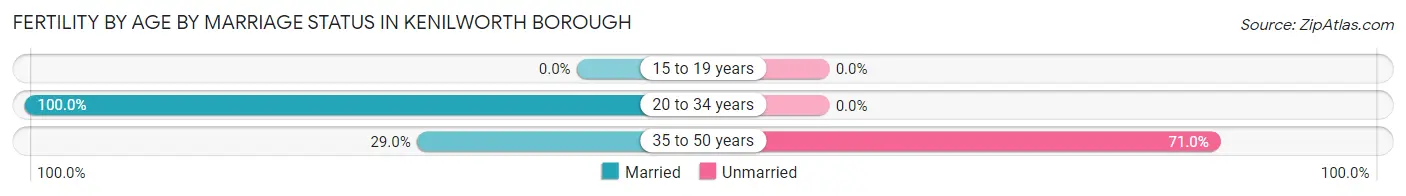
| Age Bracket | Married | Unmarried |
| 15 to 19 years | 0 (0.0%) | 0 (0.0%) |
| 20 to 34 years | 13 (100.0%) | 0 (0.0%) |
| 35 to 50 years | 20 (29.0%) | 49 (71.0%) |
| Total | 33 (40.2%) | 49 (59.8%) |
Fertility by Education in Kenilworth borough
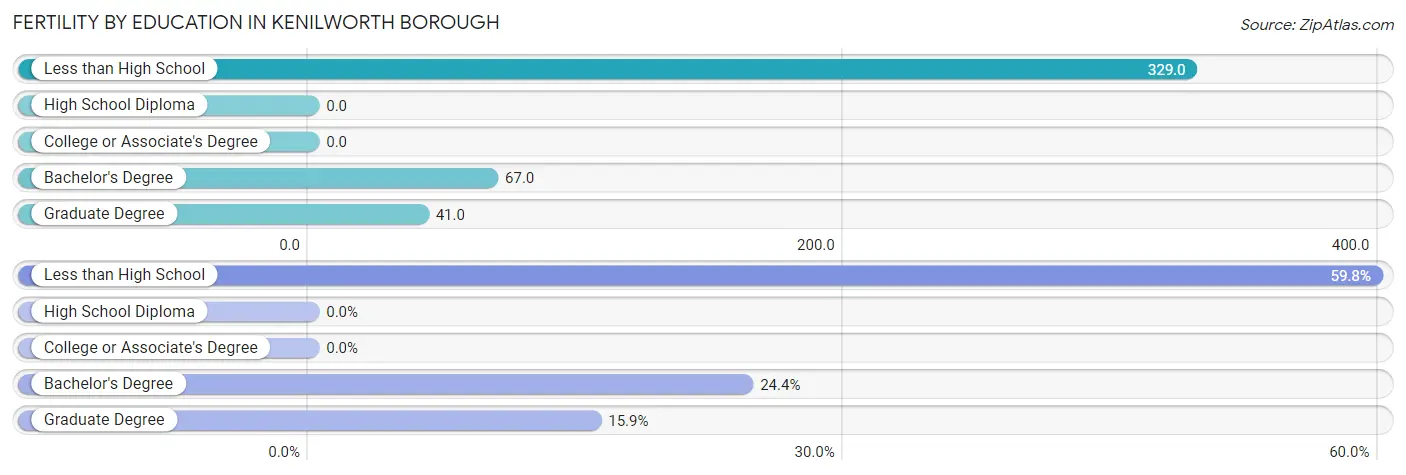
| Educational Attainment | Women with Births | Births / 1,000 Women |
| Less than High School | 49 (59.8%) | 329.0 |
| High School Diploma | 0 (0.0%) | 0.0 |
| College or Associate's Degree | 0 (0.0%) | 0.0 |
| Bachelor's Degree | 20 (24.4%) | 67.0 |
| Graduate Degree | 13 (15.9%) | 41.0 |
| Total | 82 (100.0%) | 45.0 |
Fertility by Education by Marriage Status in Kenilworth borough
59.8% of women with births in Kenilworth borough are unmarried. Women with the educational attainment of bachelor's degree are most likely to be married with 100.0% of them married at childbirth, while women with the educational attainment of less than high school are least likely to be married with 100.0% of them unmarried at childbirth.
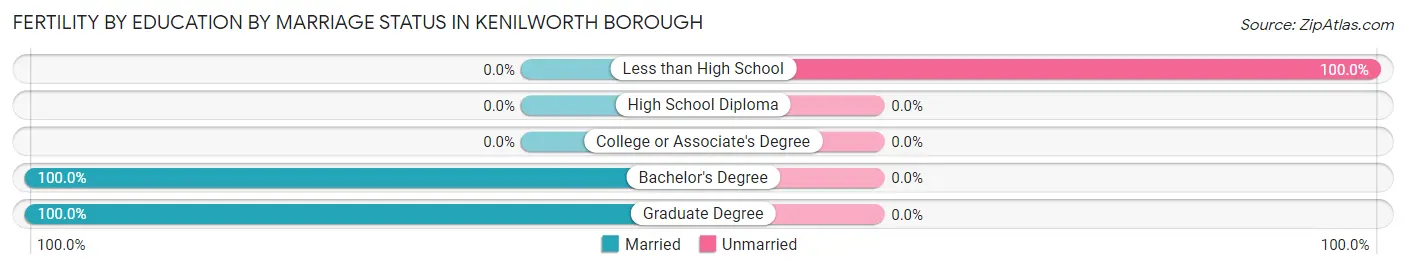
| Educational Attainment | Married | Unmarried |
| Less than High School | 0 (0.0%) | 49 (100.0%) |
| High School Diploma | 0 (0.0%) | 0 (0.0%) |
| College or Associate's Degree | 0 (0.0%) | 0 (0.0%) |
| Bachelor's Degree | 20 (100.0%) | 0 (0.0%) |
| Graduate Degree | 13 (100.0%) | 0 (0.0%) |
| Total | 33 (40.2%) | 49 (59.8%) |
Income in Kenilworth borough
Income Overview in Kenilworth borough
Per Capita Income in Kenilworth borough is $49,611, while median incomes of families and households are $116,618 and $97,600 respectively.
| Characteristic | Number | Measure |
| Per Capita Income | 8,345 | $49,611 |
| Median Family Income | 2,208 | $116,618 |
| Mean Family Income | 2,208 | $159,821 |
| Median Household Income | 2,802 | $97,600 |
| Mean Household Income | 2,802 | $143,705 |
| Income Deficit | 2,208 | $0 |
| Wage / Income Gap (%) | 8,345 | 1.36% |
| Wage / Income Gap ($) | 8,345 | 98.64¢ per $1 |
| Gini / Inequality Index | 8,345 | 0.51 |
Earnings by Sex in Kenilworth borough
Average Earnings in Kenilworth borough are $44,955, $44,621 for men and $45,234 for women, a difference of 1.4%.
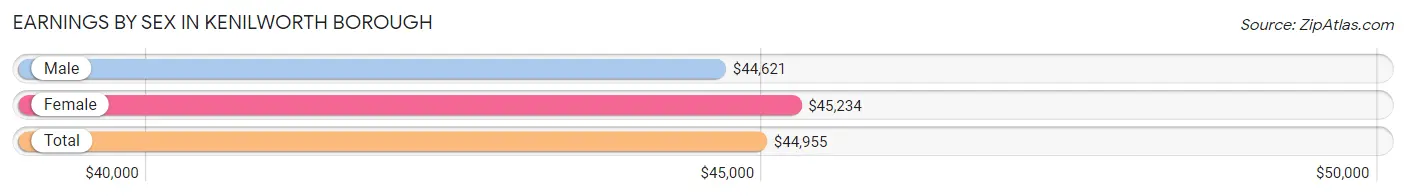
| Sex | Number | Average Earnings |
| Male | 2,395 (52.2%) | $44,621 |
| Female | 2,197 (47.8%) | $45,234 |
| Total | 4,592 (100.0%) | $44,955 |
Earnings by Sex by Income Bracket in Kenilworth borough
The most common earnings brackets in Kenilworth borough are $75,000 to $99,999 for men (441 | 18.4%) and $100,000+ for women (433 | 19.7%).
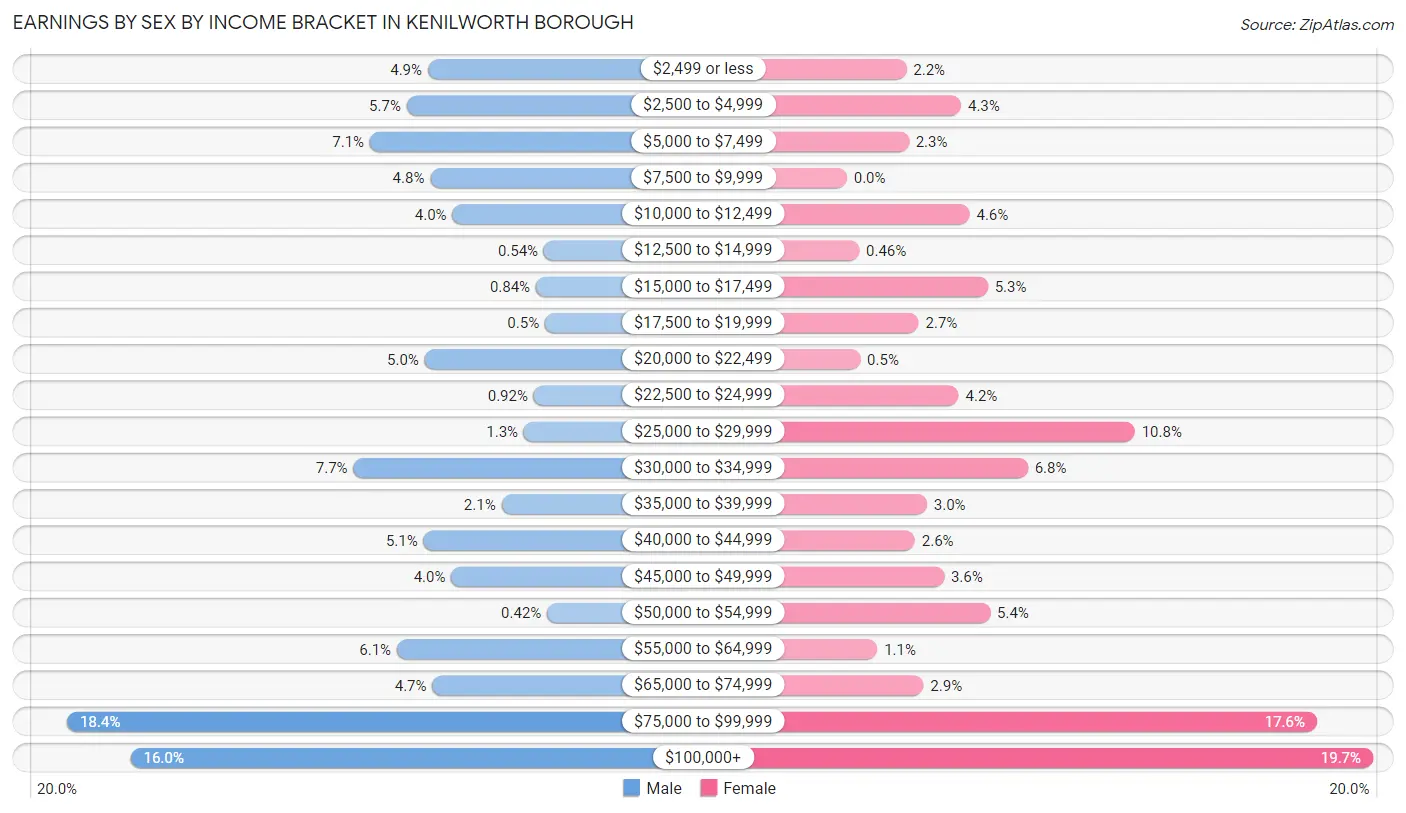
| Income | Male | Female |
| $2,499 or less | 117 (4.9%) | 49 (2.2%) |
| $2,500 to $4,999 | 136 (5.7%) | 94 (4.3%) |
| $5,000 to $7,499 | 169 (7.1%) | 51 (2.3%) |
| $7,500 to $9,999 | 115 (4.8%) | 0 (0.0%) |
| $10,000 to $12,499 | 95 (4.0%) | 101 (4.6%) |
| $12,500 to $14,999 | 13 (0.5%) | 10 (0.5%) |
| $15,000 to $17,499 | 20 (0.8%) | 116 (5.3%) |
| $17,500 to $19,999 | 12 (0.5%) | 59 (2.7%) |
| $20,000 to $22,499 | 120 (5.0%) | 11 (0.5%) |
| $22,500 to $24,999 | 22 (0.9%) | 92 (4.2%) |
| $25,000 to $29,999 | 31 (1.3%) | 237 (10.8%) |
| $30,000 to $34,999 | 184 (7.7%) | 149 (6.8%) |
| $35,000 to $39,999 | 51 (2.1%) | 66 (3.0%) |
| $40,000 to $44,999 | 121 (5.1%) | 56 (2.5%) |
| $45,000 to $49,999 | 96 (4.0%) | 80 (3.6%) |
| $50,000 to $54,999 | 10 (0.4%) | 118 (5.4%) |
| $55,000 to $64,999 | 145 (6.0%) | 25 (1.1%) |
| $65,000 to $74,999 | 113 (4.7%) | 63 (2.9%) |
| $75,000 to $99,999 | 441 (18.4%) | 387 (17.6%) |
| $100,000+ | 384 (16.0%) | 433 (19.7%) |
| Total | 2,395 (100.0%) | 2,197 (100.0%) |
Earnings by Sex by Educational Attainment in Kenilworth borough
Average earnings in Kenilworth borough are $60,000 for men and $50,084 for women, a difference of 16.5%. Men with an educational attainment of graduate degree enjoy the highest average annual earnings of $74,038, while those with college or associate's degree education earn the least with $45,846. Women with an educational attainment of graduate degree earn the most with the average annual earnings of $111,298, while those with college or associate's degree education have the smallest earnings of $40,960.
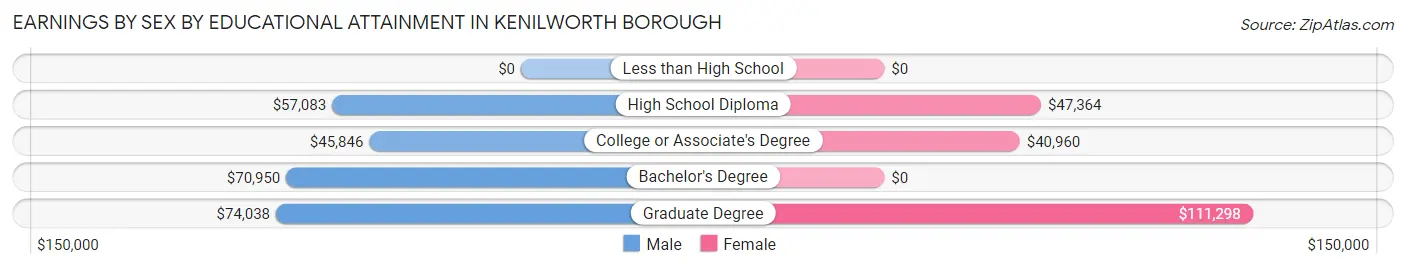
| Educational Attainment | Male Income | Female Income |
| Less than High School | - | - |
| High School Diploma | $57,083 | $47,364 |
| College or Associate's Degree | $45,846 | $40,960 |
| Bachelor's Degree | $70,950 | $0 |
| Graduate Degree | $74,038 | $111,298 |
| Total | $60,000 | $50,084 |
Family Income in Kenilworth borough
Family Income Brackets in Kenilworth borough
According to the Kenilworth borough family income data, there are 428 families falling into the $100,000 to $149,999 income range, which is the most common income bracket and makes up 19.4% of all families. Conversely, the less than $10,000 income bracket is the least frequent group with only 71 families (3.2%) belonging to this category.
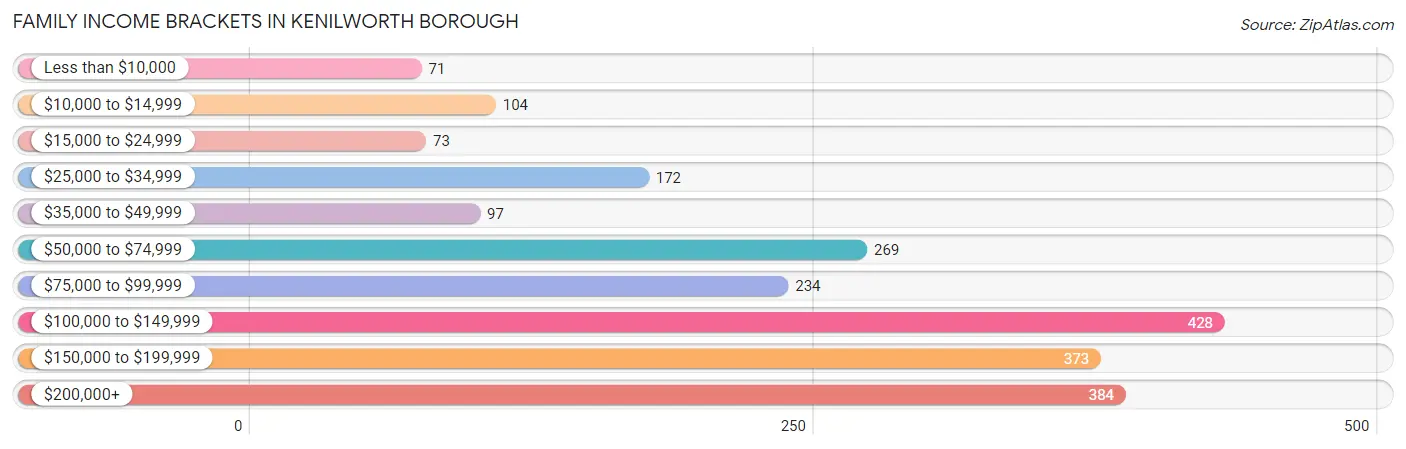
| Income Bracket | # Families | % Families |
| Less than $10,000 | 71 | 3.2% |
| $10,000 to $14,999 | 104 | 4.7% |
| $15,000 to $24,999 | 73 | 3.3% |
| $25,000 to $34,999 | 172 | 7.8% |
| $35,000 to $49,999 | 97 | 4.4% |
| $50,000 to $74,999 | 269 | 12.2% |
| $75,000 to $99,999 | 234 | 10.6% |
| $100,000 to $149,999 | 428 | 19.4% |
| $150,000 to $199,999 | 373 | 16.9% |
| $200,000+ | 384 | 17.4% |
Family Income by Famaliy Size in Kenilworth borough
5-person families (187 | 8.5%) account for the highest median family income in Kenilworth borough with $157,813 per family, while 2-person families (915 | 41.4%) have the highest median income of $44,044 per family member.
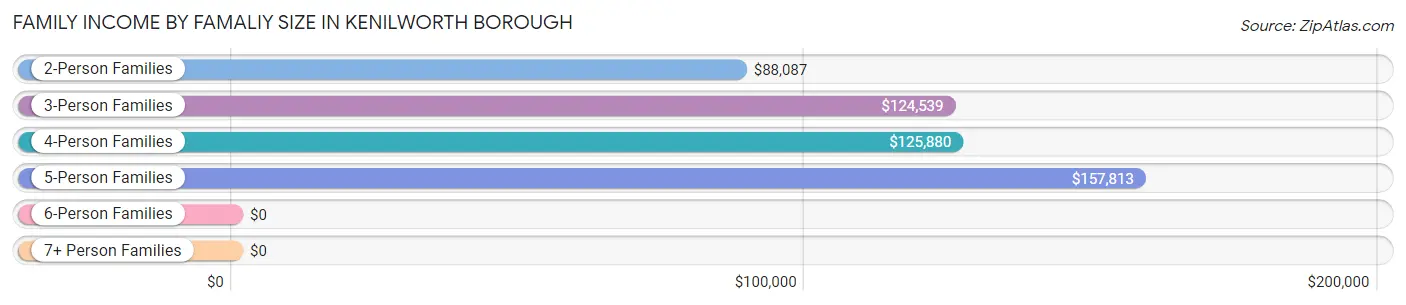
| Income Bracket | # Families | Median Income |
| 2-Person Families | 915 (41.4%) | $88,087 |
| 3-Person Families | 558 (25.3%) | $124,539 |
| 4-Person Families | 388 (17.6%) | $125,880 |
| 5-Person Families | 187 (8.5%) | $157,813 |
| 6-Person Families | 117 (5.3%) | $0 |
| 7+ Person Families | 43 (1.9%) | $0 |
| Total | 2,208 (100.0%) | $116,618 |
Family Income by Number of Earners in Kenilworth borough
The median family income in Kenilworth borough is $116,618, with families comprising 3+ earners (267) having the highest median family income of $155,639, while families with no earners (189) have the lowest median family income of $70,875, accounting for 12.1% and 8.6% of families, respectively.
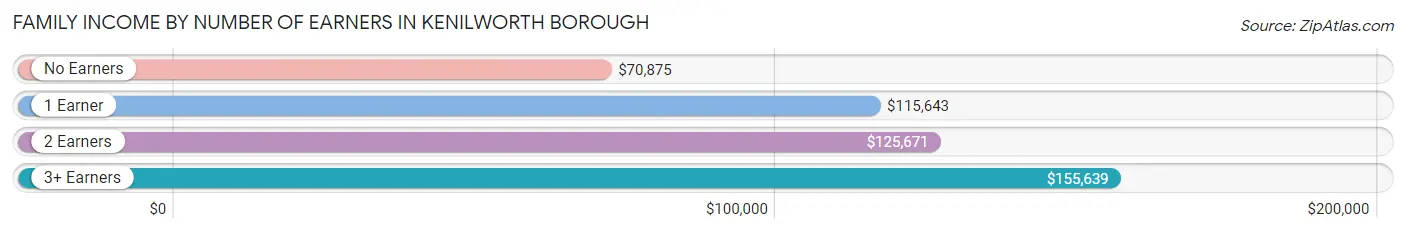
| Number of Earners | # Families | Median Income |
| No Earners | 189 (8.6%) | $70,875 |
| 1 Earner | 607 (27.5%) | $115,643 |
| 2 Earners | 1,145 (51.9%) | $125,671 |
| 3+ Earners | 267 (12.1%) | $155,639 |
| Total | 2,208 (100.0%) | $116,618 |
Household Income in Kenilworth borough
Household Income Brackets in Kenilworth borough
With 569 households falling in the category, the $100,000 to $149,999 income range is the most frequent in Kenilworth borough, accounting for 20.3% of all households. In contrast, only 70 households (2.5%) fall into the less than $10,000 income bracket, making it the least populous group.
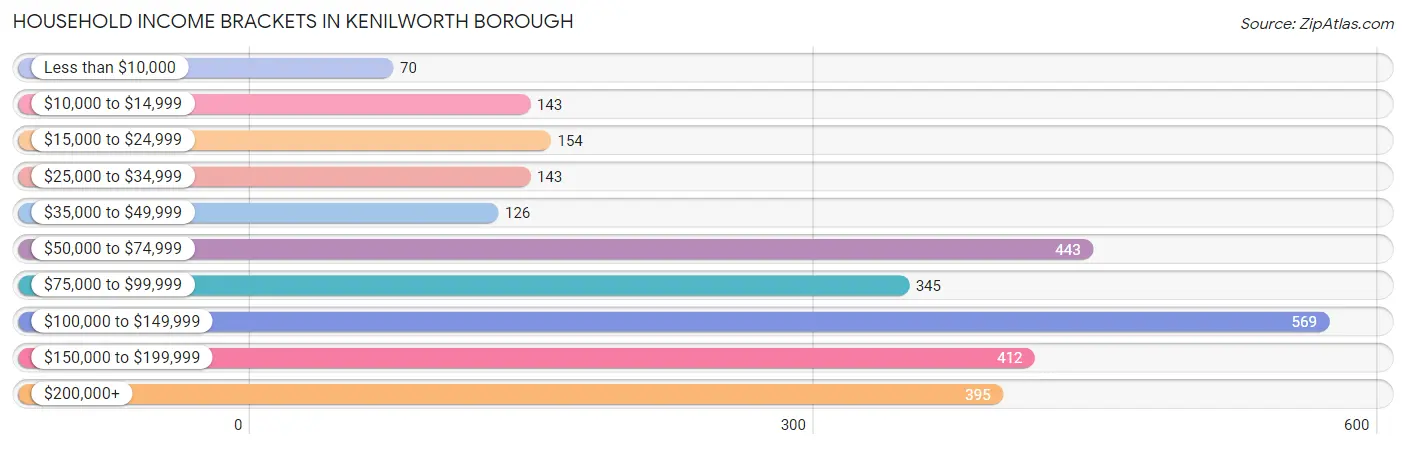
| Income Bracket | # Households | % Households |
| Less than $10,000 | 70 | 2.5% |
| $10,000 to $14,999 | 143 | 5.1% |
| $15,000 to $24,999 | 154 | 5.5% |
| $25,000 to $34,999 | 143 | 5.1% |
| $35,000 to $49,999 | 126 | 4.5% |
| $50,000 to $74,999 | 443 | 15.8% |
| $75,000 to $99,999 | 345 | 12.3% |
| $100,000 to $149,999 | 569 | 20.3% |
| $150,000 to $199,999 | 412 | 14.7% |
| $200,000+ | 395 | 14.1% |
Household Income by Householder Age in Kenilworth borough
The median household income in Kenilworth borough is $97,600, with the highest median household income of $126,528 found in the 45 to 64 years age bracket for the primary householder. A total of 1,214 households (43.3%) fall into this category. Meanwhile, the 15 to 24 years age bracket for the primary householder has the lowest median household income of $0, with 41 households (1.5%) in this group.
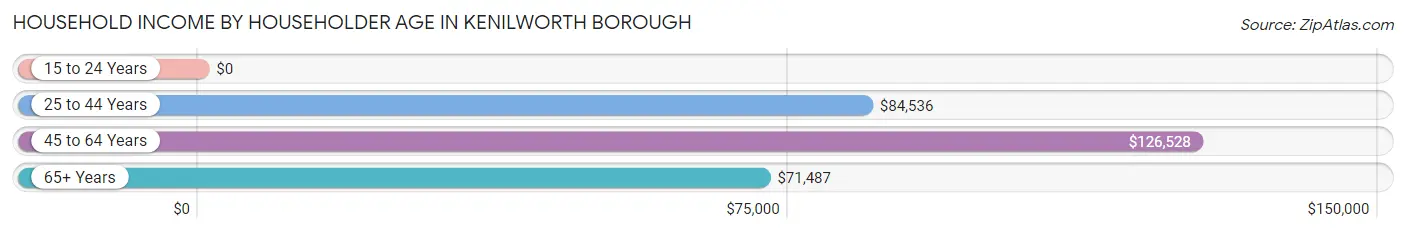
| Income Bracket | # Households | Median Income |
| 15 to 24 Years | 41 (1.5%) | $0 |
| 25 to 44 Years | 875 (31.2%) | $84,536 |
| 45 to 64 Years | 1,214 (43.3%) | $126,528 |
| 65+ Years | 672 (24.0%) | $71,487 |
| Total | 2,802 (100.0%) | $97,600 |
Poverty in Kenilworth borough
Income Below Poverty by Sex and Age in Kenilworth borough
With 7.4% poverty level for males and 8.5% for females among the residents of Kenilworth borough, 45 to 54 year old males and under 5 year old females are the most vulnerable to poverty, with 115 males (21.9%) and 119 females (52.2%) in their respective age groups living below the poverty level.
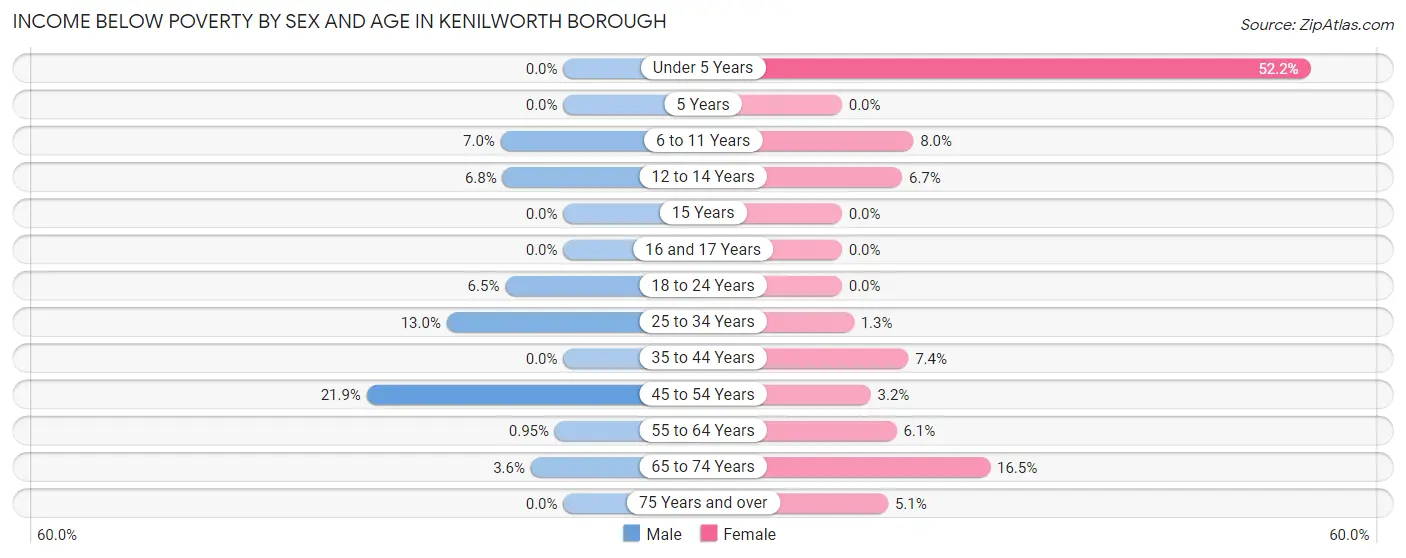
| Age Bracket | Male | Female |
| Under 5 Years | 0 (0.0%) | 119 (52.2%) |
| 5 Years | 0 (0.0%) | 0 (0.0%) |
| 6 to 11 Years | 24 (7.0%) | 63 (8.0%) |
| 12 to 14 Years | 22 (6.8%) | 21 (6.7%) |
| 15 Years | 0 (0.0%) | 0 (0.0%) |
| 16 and 17 Years | 0 (0.0%) | 0 (0.0%) |
| 18 to 24 Years | 27 (6.5%) | 0 (0.0%) |
| 25 to 34 Years | 70 (13.0%) | 8 (1.3%) |
| 35 to 44 Years | 0 (0.0%) | 39 (7.4%) |
| 45 to 54 Years | 115 (21.9%) | 20 (3.2%) |
| 55 to 64 Years | 4 (0.9%) | 39 (6.1%) |
| 65 to 74 Years | 14 (3.6%) | 69 (16.5%) |
| 75 Years and over | 0 (0.0%) | 13 (5.1%) |
| Total | 276 (7.4%) | 391 (8.5%) |
Income Above Poverty by Sex and Age in Kenilworth borough
According to the poverty statistics in Kenilworth borough, males aged under 5 years and females aged 16 and 17 years are the age groups that are most secure financially, with 100.0% of males and 100.0% of females in these age groups living above the poverty line.
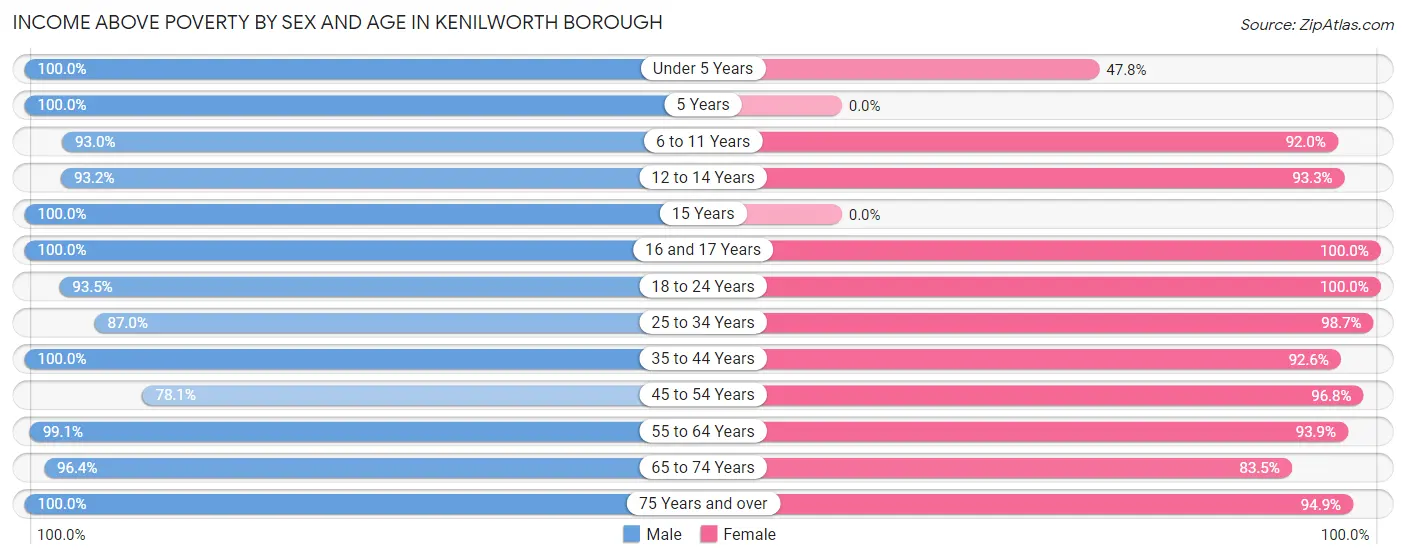
| Age Bracket | Male | Female |
| Under 5 Years | 94 (100.0%) | 109 (47.8%) |
| 5 Years | 44 (100.0%) | 0 (0.0%) |
| 6 to 11 Years | 320 (93.0%) | 728 (92.0%) |
| 12 to 14 Years | 303 (93.2%) | 292 (93.3%) |
| 15 Years | 16 (100.0%) | 0 (0.0%) |
| 16 and 17 Years | 34 (100.0%) | 35 (100.0%) |
| 18 to 24 Years | 390 (93.5%) | 162 (100.0%) |
| 25 to 34 Years | 469 (87.0%) | 594 (98.7%) |
| 35 to 44 Years | 440 (100.0%) | 488 (92.6%) |
| 45 to 54 Years | 410 (78.1%) | 604 (96.8%) |
| 55 to 64 Years | 419 (99.1%) | 601 (93.9%) |
| 65 to 74 Years | 372 (96.4%) | 349 (83.5%) |
| 75 Years and over | 156 (100.0%) | 240 (94.9%) |
| Total | 3,467 (92.6%) | 4,202 (91.5%) |
Income Below Poverty Among Married-Couple Families in Kenilworth borough
The poverty statistics for married-couple families in Kenilworth borough show that 4.6% or 64 of the total 1,375 families live below the poverty line. Families with no children have the highest poverty rate of 9.4%, comprising of 64 families. On the other hand, families with 1 or 2 children have the lowest poverty rate of 0.0%, which includes 0 families.
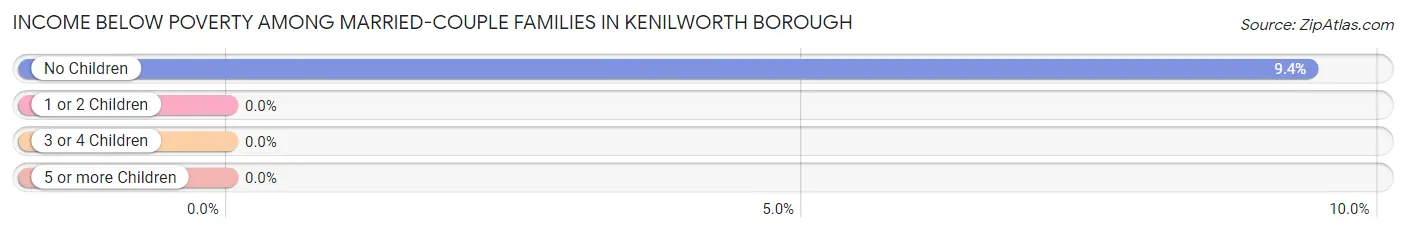
| Children | Above Poverty | Below Poverty |
| No Children | 617 (90.6%) | 64 (9.4%) |
| 1 or 2 Children | 608 (100.0%) | 0 (0.0%) |
| 3 or 4 Children | 86 (100.0%) | 0 (0.0%) |
| 5 or more Children | 0 (0.0%) | 0 (0.0%) |
| Total | 1,311 (95.4%) | 64 (4.6%) |
Income Below Poverty Among Single-Parent Households in Kenilworth borough
According to the poverty data in Kenilworth borough, 41.7% or 70 single-father households and 6.2% or 41 single-mother households are living below the poverty line. Among single-father households, those with 1 or 2 children have the highest poverty rate, with 70 households (100.0%) experiencing poverty. Likewise, among single-mother households, those with 1 or 2 children have the highest poverty rate, with 41 households (16.5%) falling below the poverty line.
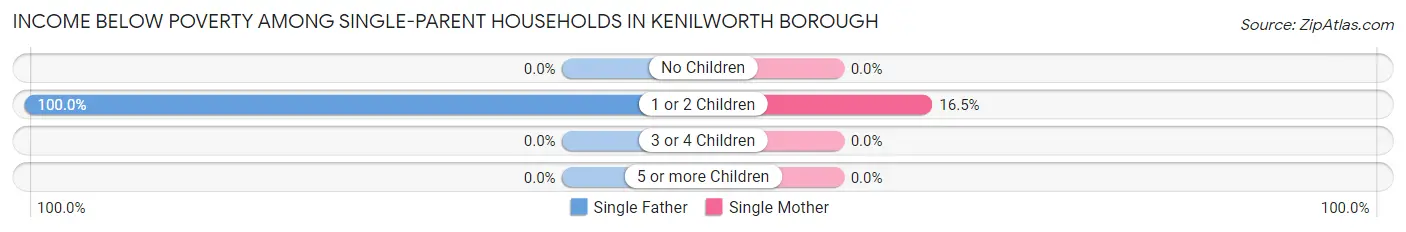
| Children | Single Father | Single Mother |
| No Children | 0 (0.0%) | 0 (0.0%) |
| 1 or 2 Children | 70 (100.0%) | 41 (16.5%) |
| 3 or 4 Children | 0 (0.0%) | 0 (0.0%) |
| 5 or more Children | 0 (0.0%) | 0 (0.0%) |
| Total | 70 (41.7%) | 41 (6.2%) |
Income Below Poverty Among Married-Couple vs Single-Parent Households in Kenilworth borough
The poverty data for Kenilworth borough shows that 64 of the married-couple family households (4.6%) and 111 of the single-parent households (13.3%) are living below the poverty level. Within the married-couple family households, those with no children have the highest poverty rate, with 64 households (9.4%) falling below the poverty line. Among the single-parent households, those with 1 or 2 children have the highest poverty rate, with 111 household (34.9%) living below poverty.
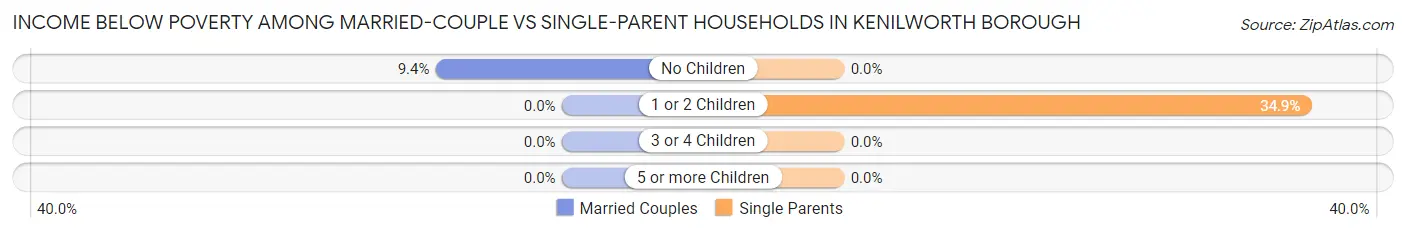
| Children | Married-Couple Families | Single-Parent Households |
| No Children | 64 (9.4%) | 0 (0.0%) |
| 1 or 2 Children | 0 (0.0%) | 111 (34.9%) |
| 3 or 4 Children | 0 (0.0%) | 0 (0.0%) |
| 5 or more Children | 0 (0.0%) | 0 (0.0%) |
| Total | 64 (4.6%) | 111 (13.3%) |
Employment Characteristics in Kenilworth borough
Employment by Class of Employer in Kenilworth borough
Among the 4,048 employed individuals in Kenilworth borough, private company employees (3,000 | 74.1%), local government employees (361 | 8.9%), and not-for-profit organizations (333 | 8.2%) make up the most common classes of employment.
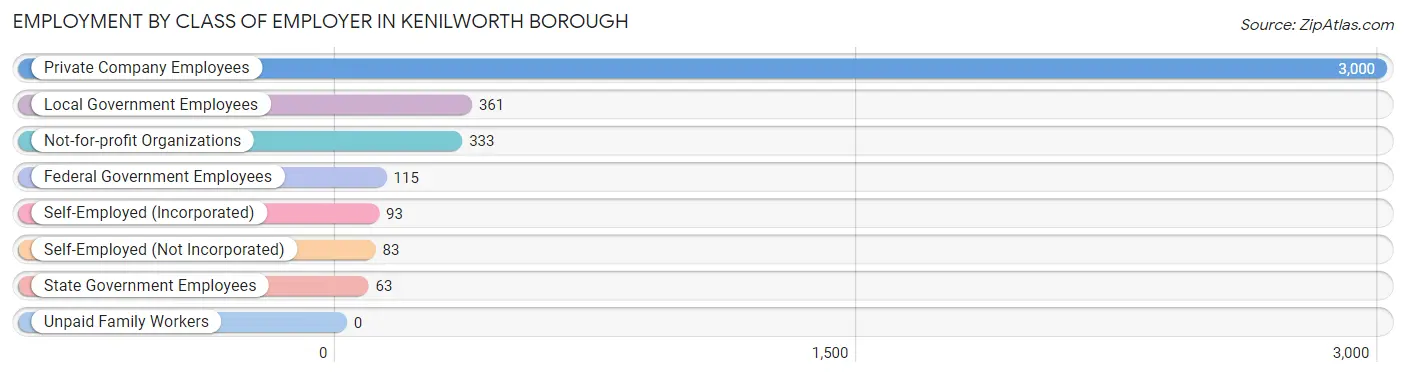
| Employer Class | # Employees | % Employees |
| Private Company Employees | 3,000 | 74.1% |
| Self-Employed (Incorporated) | 93 | 2.3% |
| Self-Employed (Not Incorporated) | 83 | 2.1% |
| Not-for-profit Organizations | 333 | 8.2% |
| Local Government Employees | 361 | 8.9% |
| State Government Employees | 63 | 1.6% |
| Federal Government Employees | 115 | 2.8% |
| Unpaid Family Workers | 0 | 0.0% |
| Total | 4,048 | 100.0% |
Employment Status by Age in Kenilworth borough
According to the labor force statistics for Kenilworth borough, out of the total population over 16 years of age (6,181), 72.8% or 4,500 individuals are in the labor force, with 8.4% or 378 of them unemployed. The age group with the highest labor force participation rate is 30 to 34 years, with 95.3% or 546 individuals in the labor force. Within the labor force, the 35 to 44 years age range has the highest percentage of unemployed individuals, with 20.3% or 185 of them being unemployed.
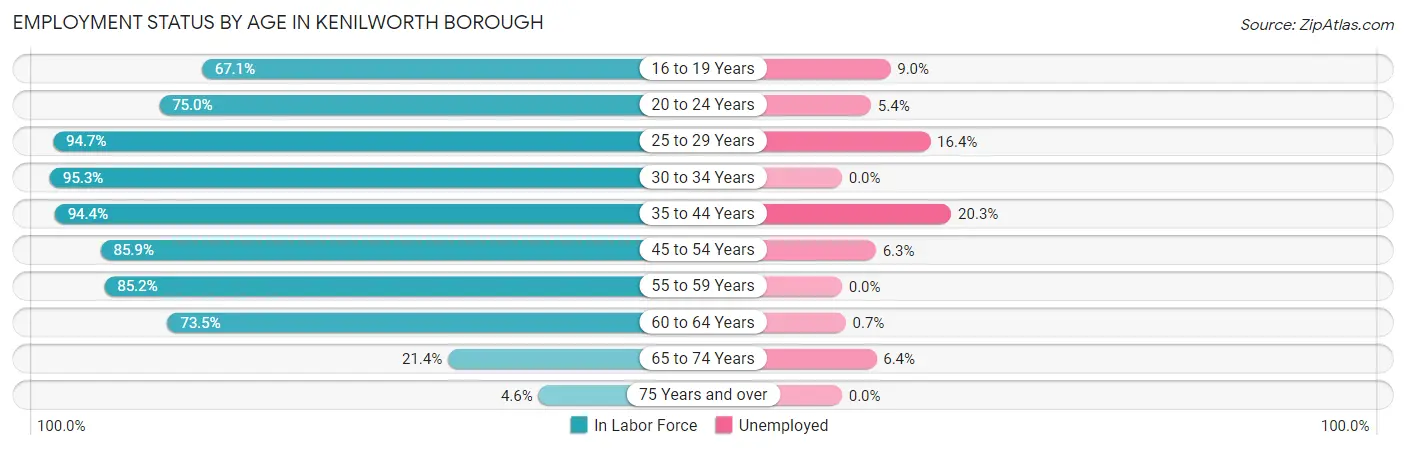
| Age Bracket | In Labor Force | Unemployed |
| 16 to 19 Years | 188 (67.1%) | 17 (9.0%) |
| 20 to 24 Years | 276 (75.0%) | 15 (5.4%) |
| 25 to 29 Years | 538 (94.7%) | 88 (16.4%) |
| 30 to 34 Years | 546 (95.3%) | 0 (0.0%) |
| 35 to 44 Years | 913 (94.4%) | 185 (20.3%) |
| 45 to 54 Years | 987 (85.9%) | 62 (6.3%) |
| 55 to 59 Years | 574 (85.2%) | 0 (0.0%) |
| 60 to 64 Years | 286 (73.5%) | 2 (0.7%) |
| 65 to 74 Years | 172 (21.4%) | 11 (6.4%) |
| 75 Years and over | 19 (4.6%) | 0 (0.0%) |
| Total | 4,500 (72.8%) | 378 (8.4%) |
Employment Status by Educational Attainment in Kenilworth borough
According to labor force statistics for Kenilworth borough, 89.0% of individuals (3,845) out of the total population between 25 and 64 years of age (4,320) are in the labor force, with 8.8% or 338 of them being unemployed. The group with the highest labor force participation rate are those with the educational attainment of high school diploma, with 90.3% or 874 individuals in the labor force. Within the labor force, individuals with bachelor's degree or higher education have the highest percentage of unemployment, with 12.5% or 156 of them being unemployed.
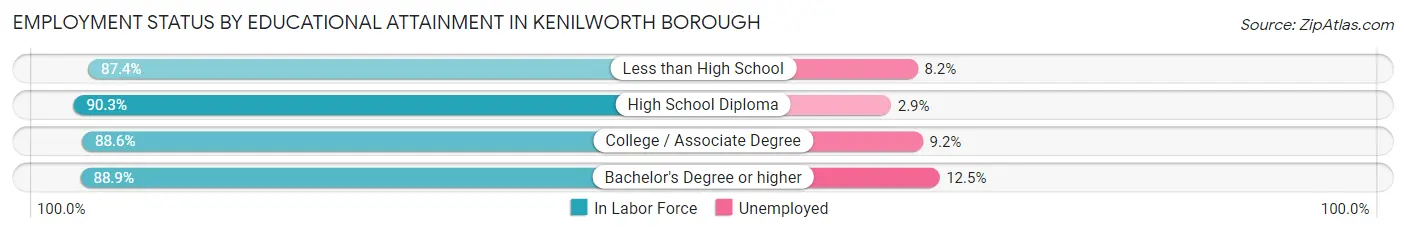
| Educational Attainment | In Labor Force | Unemployed |
| Less than High School | 243 (87.4%) | 23 (8.2%) |
| High School Diploma | 874 (90.3%) | 28 (2.9%) |
| College / Associate Degree | 1,483 (88.6%) | 154 (9.2%) |
| Bachelor's Degree or higher | 1,245 (88.9%) | 175 (12.5%) |
| Total | 3,845 (89.0%) | 380 (8.8%) |
Employment Occupations by Sex in Kenilworth borough
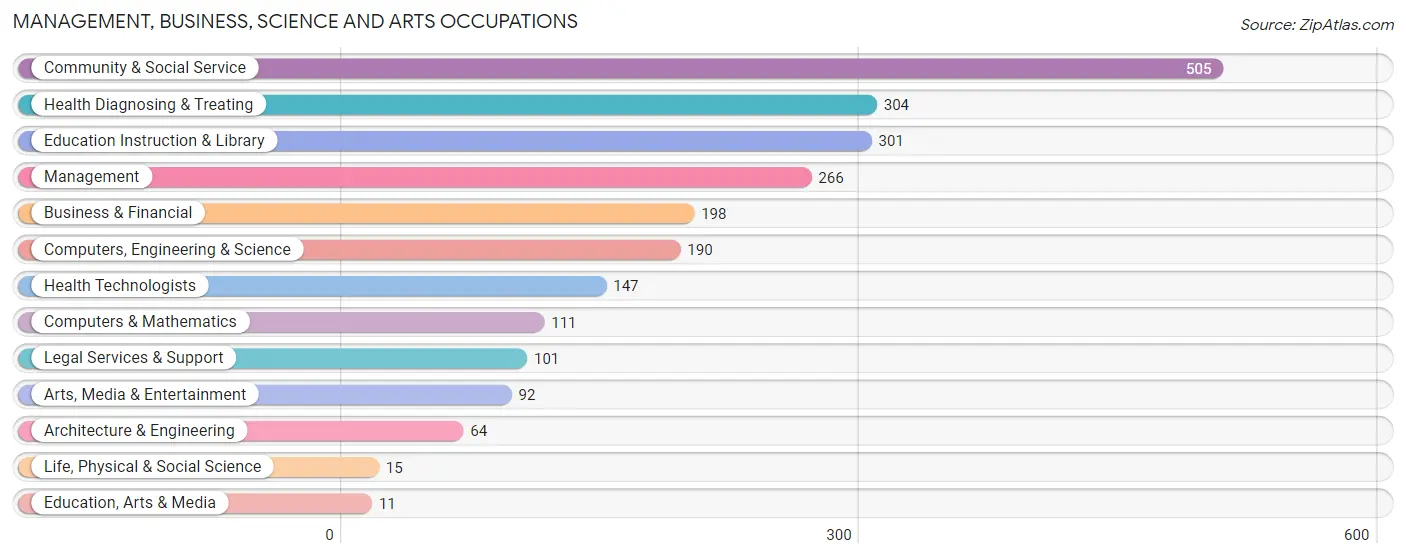
Management, Business, Science and Arts Occupations
The most common Management, Business, Science and Arts occupations in Kenilworth borough are Community & Social Service (505 | 12.3%), Health Diagnosing & Treating (304 | 7.4%), Education Instruction & Library (301 | 7.3%), Management (266 | 6.5%), and Business & Financial (198 | 4.8%).
Management, Business, Science and Arts Occupations by Sex
Within the Management, Business, Science and Arts occupations in Kenilworth borough, the most male-oriented occupations are Education, Arts & Media (100.0%), Computers & Mathematics (87.4%), and Arts, Media & Entertainment (63.0%), while the most female-oriented occupations are Architecture & Engineering (100.0%), Life, Physical & Social Science (100.0%), and Health Technologists (91.2%).
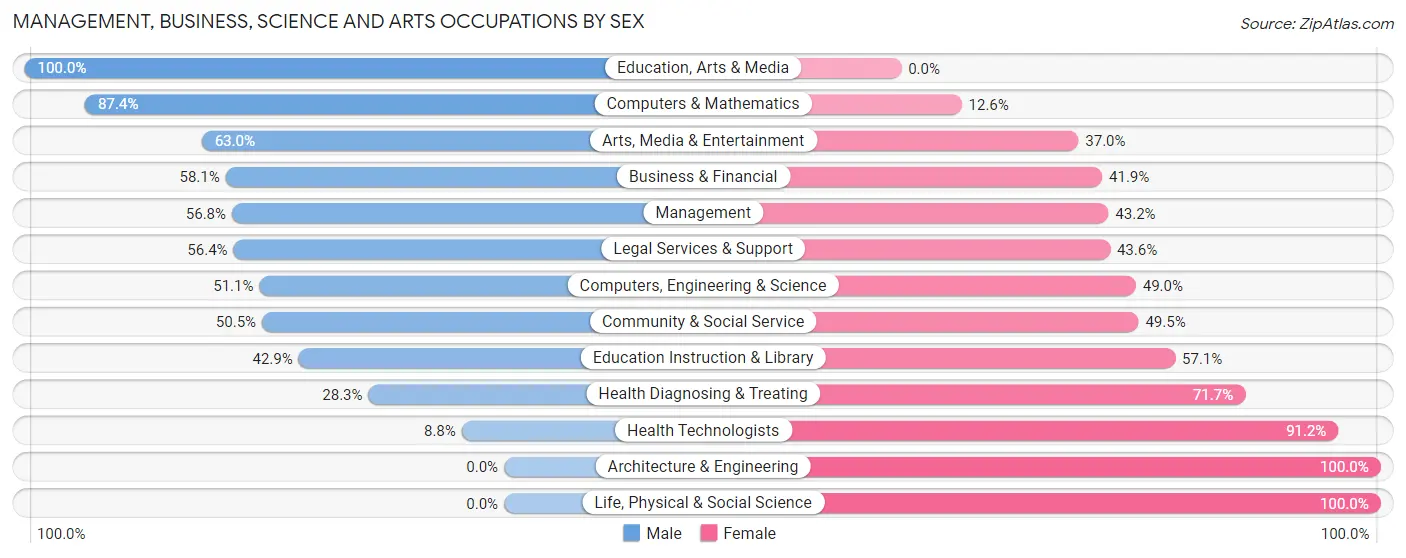
| Occupation | Male | Female |
| Management | 151 (56.8%) | 115 (43.2%) |
| Business & Financial | 115 (58.1%) | 83 (41.9%) |
| Computers, Engineering & Science | 97 (51.0%) | 93 (48.9%) |
| Computers & Mathematics | 97 (87.4%) | 14 (12.6%) |
| Architecture & Engineering | 0 (0.0%) | 64 (100.0%) |
| Life, Physical & Social Science | 0 (0.0%) | 15 (100.0%) |
| Community & Social Service | 255 (50.5%) | 250 (49.5%) |
| Education, Arts & Media | 11 (100.0%) | 0 (0.0%) |
| Legal Services & Support | 57 (56.4%) | 44 (43.6%) |
| Education Instruction & Library | 129 (42.9%) | 172 (57.1%) |
| Arts, Media & Entertainment | 58 (63.0%) | 34 (37.0%) |
| Health Diagnosing & Treating | 86 (28.3%) | 218 (71.7%) |
| Health Technologists | 13 (8.8%) | 134 (91.2%) |
| Total (Category) | 704 (48.1%) | 759 (51.9%) |
| Total (Overall) | 2,220 (53.9%) | 1,899 (46.1%) |
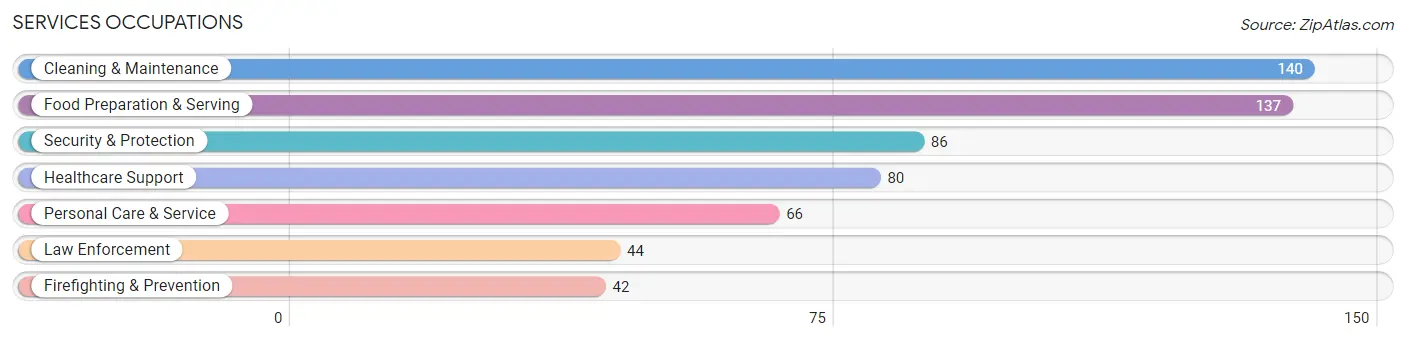
Services Occupations
The most common Services occupations in Kenilworth borough are Cleaning & Maintenance (140 | 3.4%), Food Preparation & Serving (137 | 3.3%), Security & Protection (86 | 2.1%), Healthcare Support (80 | 1.9%), and Personal Care & Service (66 | 1.6%).
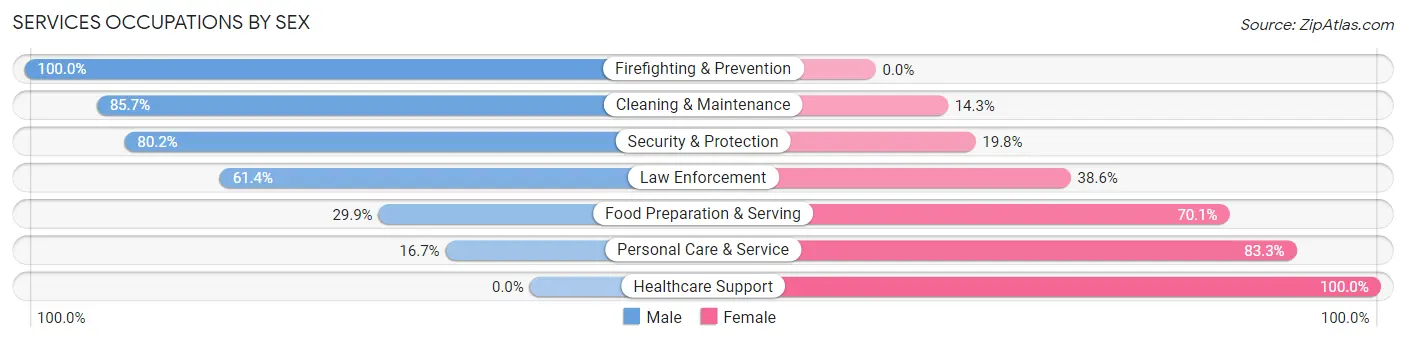
Services Occupations by Sex
Within the Services occupations in Kenilworth borough, the most male-oriented occupations are Firefighting & Prevention (100.0%), Cleaning & Maintenance (85.7%), and Security & Protection (80.2%), while the most female-oriented occupations are Healthcare Support (100.0%), Personal Care & Service (83.3%), and Food Preparation & Serving (70.1%).
| Occupation | Male | Female |
| Healthcare Support | 0 (0.0%) | 80 (100.0%) |
| Security & Protection | 69 (80.2%) | 17 (19.8%) |
| Firefighting & Prevention | 42 (100.0%) | 0 (0.0%) |
| Law Enforcement | 27 (61.4%) | 17 (38.6%) |
| Food Preparation & Serving | 41 (29.9%) | 96 (70.1%) |
| Cleaning & Maintenance | 120 (85.7%) | 20 (14.3%) |
| Personal Care & Service | 11 (16.7%) | 55 (83.3%) |
| Total (Category) | 241 (47.3%) | 268 (52.6%) |
| Total (Overall) | 2,220 (53.9%) | 1,899 (46.1%) |
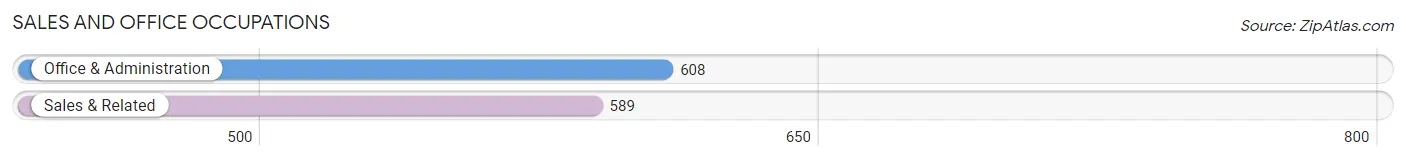
Sales and Office Occupations
The most common Sales and Office occupations in Kenilworth borough are Office & Administration (608 | 14.8%), and Sales & Related (589 | 14.3%).
Sales and Office Occupations by Sex
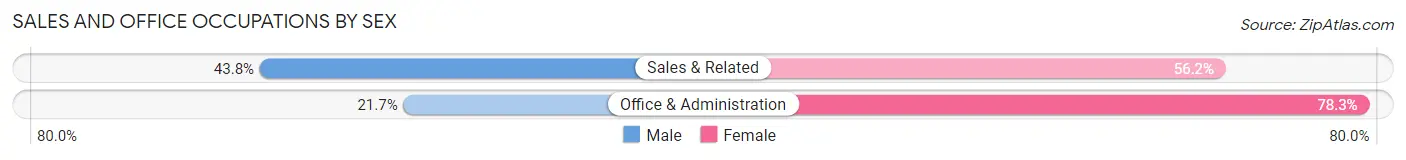
| Occupation | Male | Female |
| Sales & Related | 258 (43.8%) | 331 (56.2%) |
| Office & Administration | 132 (21.7%) | 476 (78.3%) |
| Total (Category) | 390 (32.6%) | 807 (67.4%) |
| Total (Overall) | 2,220 (53.9%) | 1,899 (46.1%) |
Natural Resources, Construction and Maintenance Occupations
The most common Natural Resources, Construction and Maintenance occupations in Kenilworth borough are Construction & Extraction (356 | 8.6%), and Installation, Maintenance & Repair (121 | 2.9%).
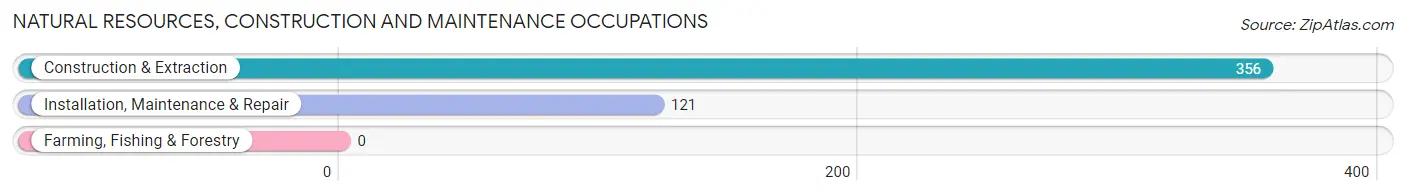
Natural Resources, Construction and Maintenance Occupations by Sex
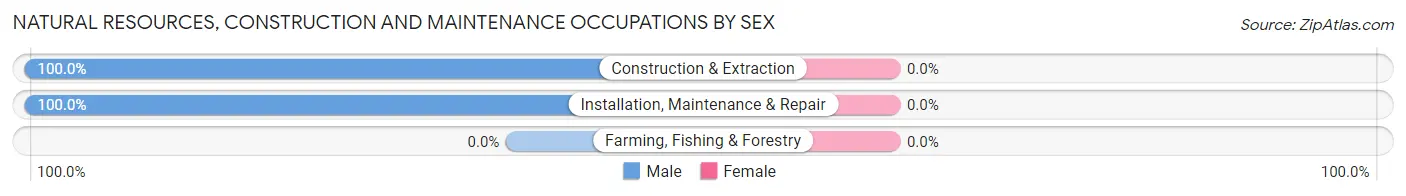
| Occupation | Male | Female |
| Farming, Fishing & Forestry | 0 (0.0%) | 0 (0.0%) |
| Construction & Extraction | 356 (100.0%) | 0 (0.0%) |
| Installation, Maintenance & Repair | 121 (100.0%) | 0 (0.0%) |
| Total (Category) | 477 (100.0%) | 0 (0.0%) |
| Total (Overall) | 2,220 (53.9%) | 1,899 (46.1%) |
Production, Transportation and Moving Occupations
The most common Production, Transportation and Moving occupations in Kenilworth borough are Production (219 | 5.3%), Material Moving (187 | 4.5%), and Transportation (67 | 1.6%).
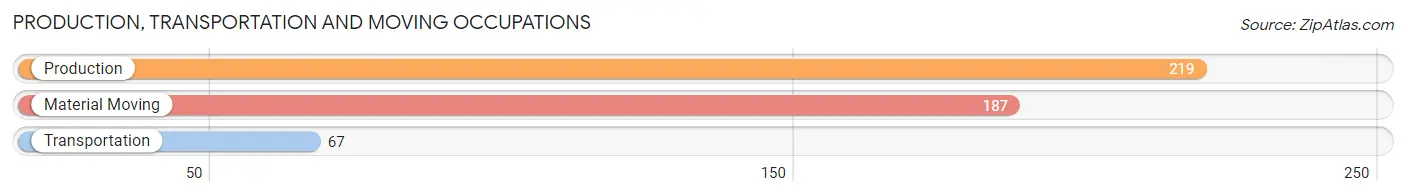
Production, Transportation and Moving Occupations by Sex
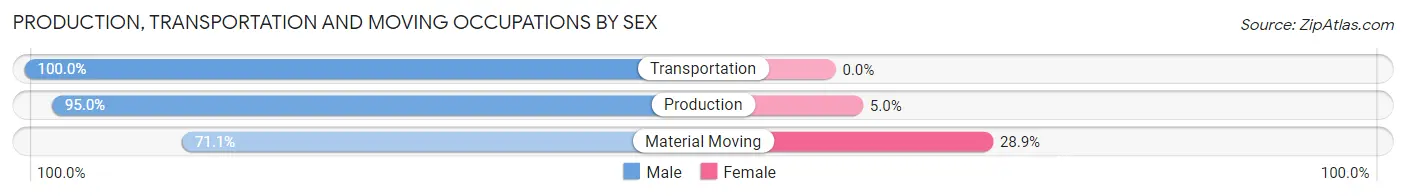
| Occupation | Male | Female |
| Production | 208 (95.0%) | 11 (5.0%) |
| Transportation | 67 (100.0%) | 0 (0.0%) |
| Material Moving | 133 (71.1%) | 54 (28.9%) |
| Total (Category) | 408 (86.3%) | 65 (13.7%) |
| Total (Overall) | 2,220 (53.9%) | 1,899 (46.1%) |
Employment Industries by Sex in Kenilworth borough
Employment Industries in Kenilworth borough
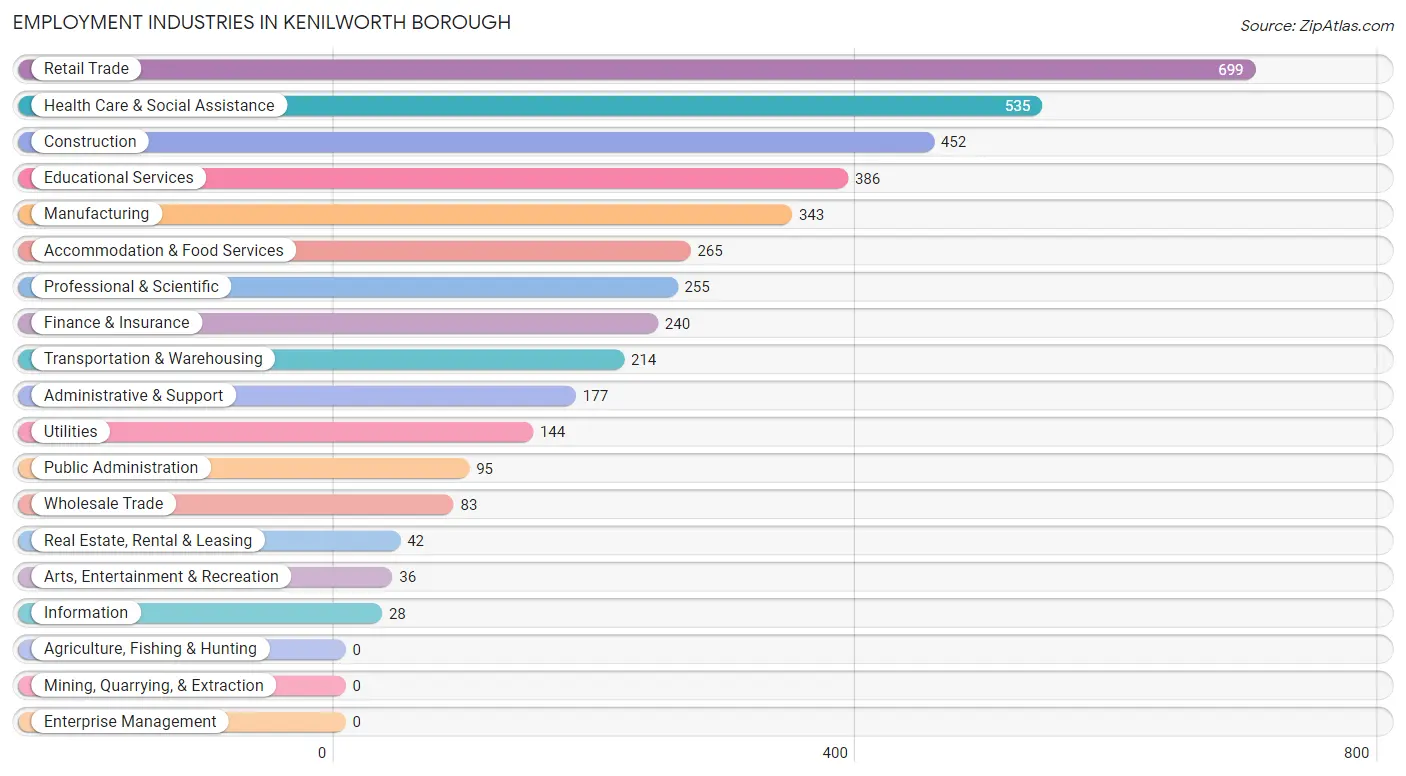
The major employment industries in Kenilworth borough include Retail Trade (699 | 17.0%), Health Care & Social Assistance (535 | 13.0%), Construction (452 | 11.0%), Educational Services (386 | 9.4%), and Manufacturing (343 | 8.3%).
Employment Industries by Sex in Kenilworth borough
The Kenilworth borough industries that see more men than women are Utilities (91.0%), Administrative & Support (88.7%), and Wholesale Trade (80.7%), whereas the industries that tend to have a higher number of women are Arts, Entertainment & Recreation (100.0%), Health Care & Social Assistance (78.3%), and Professional & Scientific (77.6%).
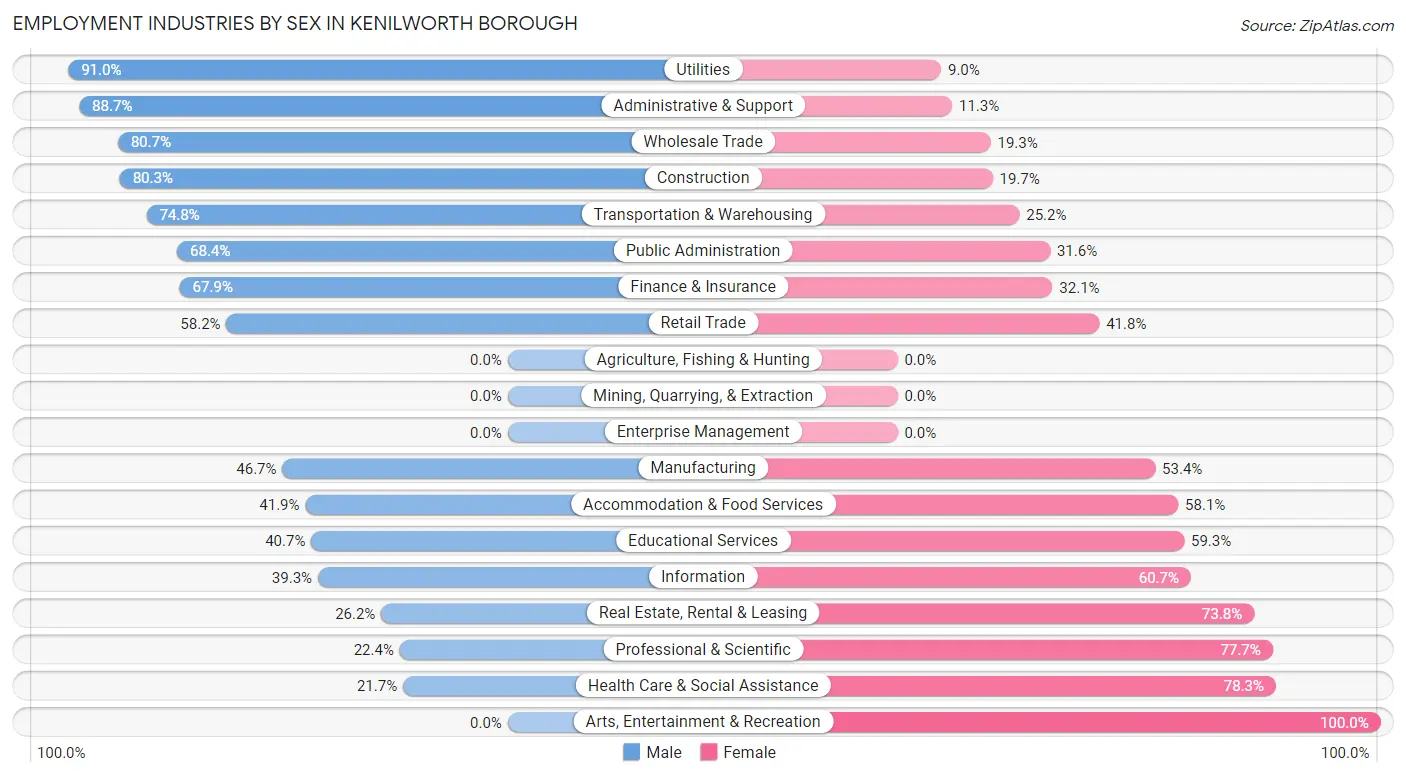
| Industry | Male | Female |
| Agriculture, Fishing & Hunting | 0 (0.0%) | 0 (0.0%) |
| Mining, Quarrying, & Extraction | 0 (0.0%) | 0 (0.0%) |
| Construction | 363 (80.3%) | 89 (19.7%) |
| Manufacturing | 160 (46.7%) | 183 (53.3%) |
| Wholesale Trade | 67 (80.7%) | 16 (19.3%) |
| Retail Trade | 407 (58.2%) | 292 (41.8%) |
| Transportation & Warehousing | 160 (74.8%) | 54 (25.2%) |
| Utilities | 131 (91.0%) | 13 (9.0%) |
| Information | 11 (39.3%) | 17 (60.7%) |
| Finance & Insurance | 163 (67.9%) | 77 (32.1%) |
| Real Estate, Rental & Leasing | 11 (26.2%) | 31 (73.8%) |
| Professional & Scientific | 57 (22.4%) | 198 (77.6%) |
| Enterprise Management | 0 (0.0%) | 0 (0.0%) |
| Administrative & Support | 157 (88.7%) | 20 (11.3%) |
| Educational Services | 157 (40.7%) | 229 (59.3%) |
| Health Care & Social Assistance | 116 (21.7%) | 419 (78.3%) |
| Arts, Entertainment & Recreation | 0 (0.0%) | 36 (100.0%) |
| Accommodation & Food Services | 111 (41.9%) | 154 (58.1%) |
| Public Administration | 65 (68.4%) | 30 (31.6%) |
| Total | 2,220 (53.9%) | 1,899 (46.1%) |
Education in Kenilworth borough
School Enrollment in Kenilworth borough
The most common levels of schooling among the 2,482 students in Kenilworth borough are middle school (778 | 31.4%), elementary school (638 | 25.7%), and high school (386 | 15.5%).
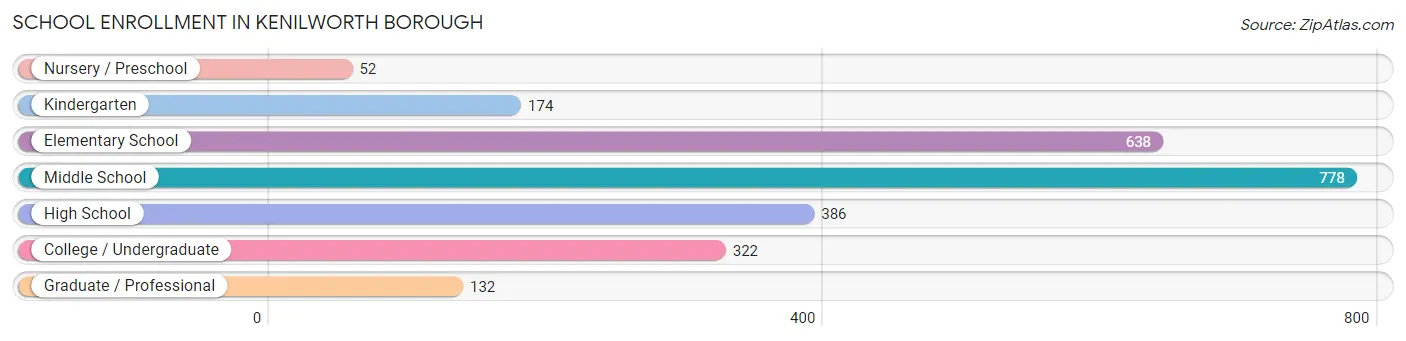
| School Level | # Students | % Students |
| Nursery / Preschool | 52 | 2.1% |
| Kindergarten | 174 | 7.0% |
| Elementary School | 638 | 25.7% |
| Middle School | 778 | 31.4% |
| High School | 386 | 15.5% |
| College / Undergraduate | 322 | 13.0% |
| Graduate / Professional | 132 | 5.3% |
| Total | 2,482 | 100.0% |
School Enrollment by Age by Funding Source in Kenilworth borough
Out of a total of 2,482 students who are enrolled in schools in Kenilworth borough, 491 (19.8%) attend a private institution, while the remaining 1,991 (80.2%) are enrolled in public schools. The age group of 35 years and over has the highest likelihood of being enrolled in private schools, with 54 (87.1% in the age bracket) enrolled. Conversely, the age group of 25 to 34 year olds has the lowest likelihood of being enrolled in a private school, with 105 (100.0% in the age bracket) attending a public institution.
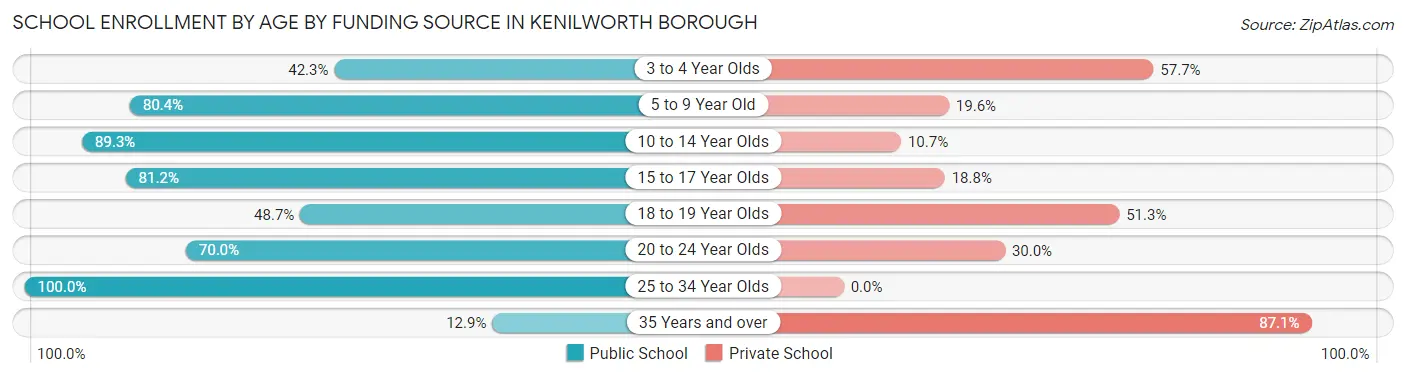
| Age Bracket | Public School | Private School |
| 3 to 4 Year Olds | 22 (42.3%) | 30 (57.7%) |
| 5 to 9 Year Old | 488 (80.4%) | 119 (19.6%) |
| 10 to 14 Year Olds | 1,070 (89.3%) | 128 (10.7%) |
| 15 to 17 Year Olds | 69 (81.2%) | 16 (18.8%) |
| 18 to 19 Year Olds | 73 (48.7%) | 77 (51.3%) |
| 20 to 24 Year Olds | 156 (70.0%) | 67 (30.0%) |
| 25 to 34 Year Olds | 105 (100.0%) | 0 (0.0%) |
| 35 Years and over | 8 (12.9%) | 54 (87.1%) |
| Total | 1,991 (80.2%) | 491 (19.8%) |
Educational Attainment by Field of Study in Kenilworth borough
Business (417 | 24.8%), education (337 | 20.0%), science & technology (186 | 11.1%), arts & humanities (163 | 9.7%), and liberal arts & history (111 | 6.6%) are the most common fields of study among 1,683 individuals in Kenilworth borough who have obtained a bachelor's degree or higher.
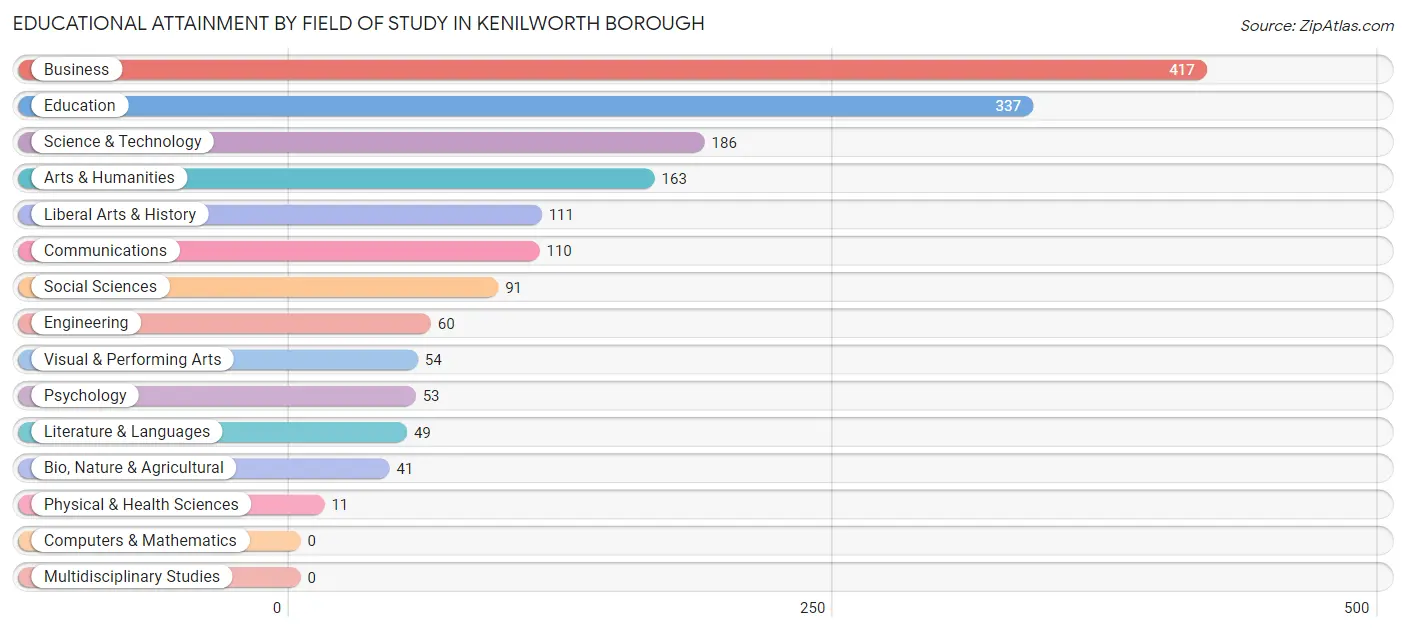
| Field of Study | # Graduates | % Graduates |
| Computers & Mathematics | 0 | 0.0% |
| Bio, Nature & Agricultural | 41 | 2.4% |
| Physical & Health Sciences | 11 | 0.6% |
| Psychology | 53 | 3.2% |
| Social Sciences | 91 | 5.4% |
| Engineering | 60 | 3.6% |
| Multidisciplinary Studies | 0 | 0.0% |
| Science & Technology | 186 | 11.1% |
| Business | 417 | 24.8% |
| Education | 337 | 20.0% |
| Literature & Languages | 49 | 2.9% |
| Liberal Arts & History | 111 | 6.6% |
| Visual & Performing Arts | 54 | 3.2% |
| Communications | 110 | 6.5% |
| Arts & Humanities | 163 | 9.7% |
| Total | 1,683 | 100.0% |
Transportation & Commute in Kenilworth borough
Vehicle Availability by Sex in Kenilworth borough
The most prevalent vehicle ownership categories in Kenilworth borough are males with 2 vehicles (1,015, accounting for 45.7%) and females with 2 vehicles (951, making up 55.5%).
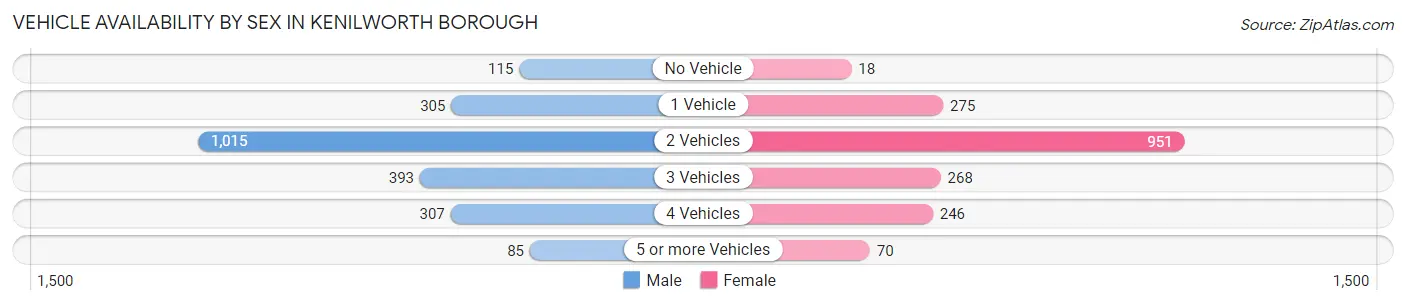
| Vehicles Available | Male | Female |
| No Vehicle | 115 (5.2%) | 18 (1.0%) |
| 1 Vehicle | 305 (13.7%) | 275 (15.0%) |
| 2 Vehicles | 1,015 (45.7%) | 951 (52.0%) |
| 3 Vehicles | 393 (17.7%) | 268 (14.7%) |
| 4 Vehicles | 307 (13.8%) | 246 (13.5%) |
| 5 or more Vehicles | 85 (3.8%) | 70 (3.8%) |
| Total | 2,220 (100.0%) | 1,828 (100.0%) |
Commute Time in Kenilworth borough
The most frequently occuring commute durations in Kenilworth borough are 5 to 9 minutes (647 commuters, 16.8%), 15 to 19 minutes (580 commuters, 15.0%), and 30 to 34 minutes (533 commuters, 13.8%).
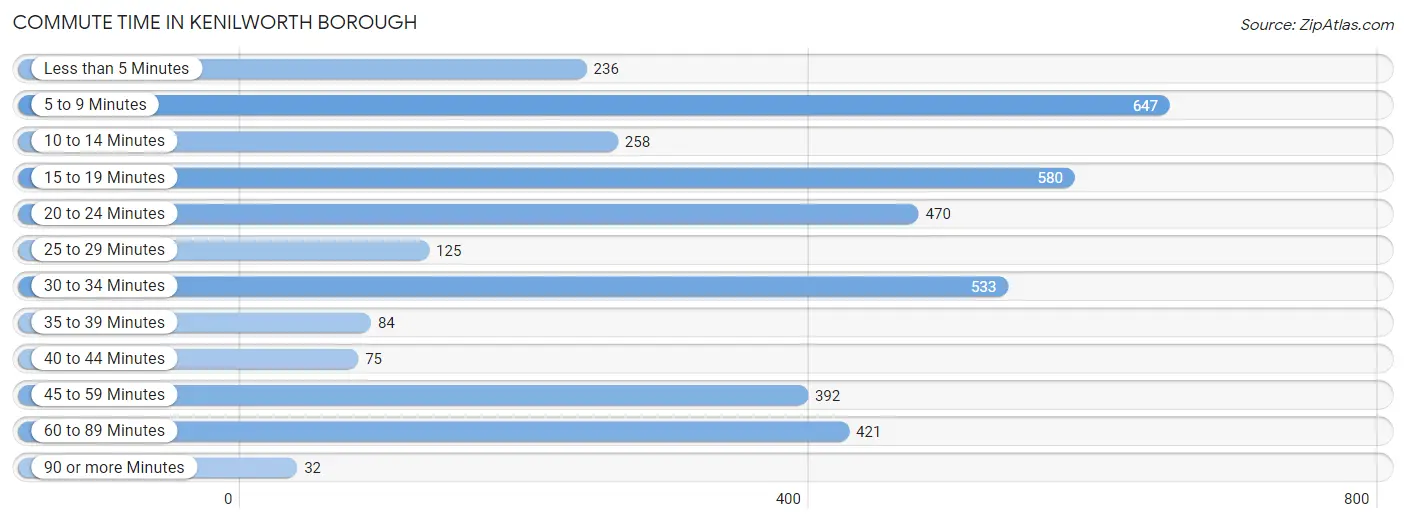
| Commute Time | # Commuters | % Commuters |
| Less than 5 Minutes | 236 | 6.1% |
| 5 to 9 Minutes | 647 | 16.8% |
| 10 to 14 Minutes | 258 | 6.7% |
| 15 to 19 Minutes | 580 | 15.0% |
| 20 to 24 Minutes | 470 | 12.2% |
| 25 to 29 Minutes | 125 | 3.2% |
| 30 to 34 Minutes | 533 | 13.8% |
| 35 to 39 Minutes | 84 | 2.2% |
| 40 to 44 Minutes | 75 | 1.9% |
| 45 to 59 Minutes | 392 | 10.2% |
| 60 to 89 Minutes | 421 | 10.9% |
| 90 or more Minutes | 32 | 0.8% |
Commute Time by Sex in Kenilworth borough
The most common commute times in Kenilworth borough are 20 to 24 minutes (391 commuters, 18.6%) for males and 5 to 9 minutes (444 commuters, 25.3%) for females.
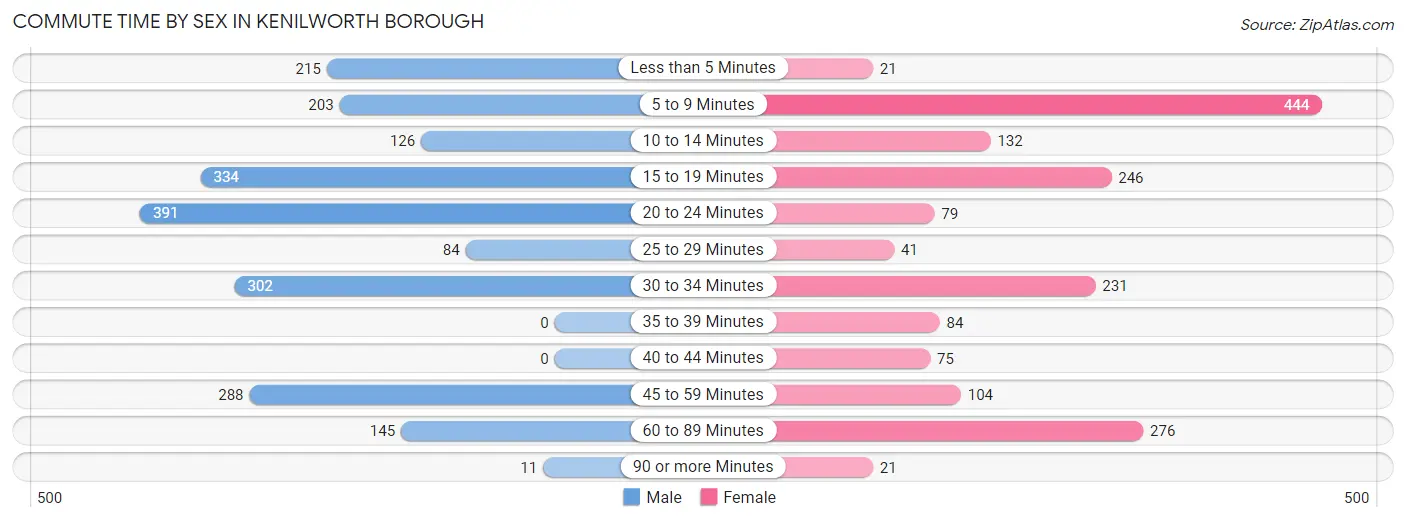
| Commute Time | Male | Female |
| Less than 5 Minutes | 215 (10.2%) | 21 (1.2%) |
| 5 to 9 Minutes | 203 (9.7%) | 444 (25.3%) |
| 10 to 14 Minutes | 126 (6.0%) | 132 (7.5%) |
| 15 to 19 Minutes | 334 (15.9%) | 246 (14.0%) |
| 20 to 24 Minutes | 391 (18.6%) | 79 (4.5%) |
| 25 to 29 Minutes | 84 (4.0%) | 41 (2.3%) |
| 30 to 34 Minutes | 302 (14.4%) | 231 (13.2%) |
| 35 to 39 Minutes | 0 (0.0%) | 84 (4.8%) |
| 40 to 44 Minutes | 0 (0.0%) | 75 (4.3%) |
| 45 to 59 Minutes | 288 (13.7%) | 104 (5.9%) |
| 60 to 89 Minutes | 145 (6.9%) | 276 (15.7%) |
| 90 or more Minutes | 11 (0.5%) | 21 (1.2%) |
Time of Departure to Work by Sex in Kenilworth borough
The most frequent times of departure to work in Kenilworth borough are 7:00 AM to 7:29 AM (427, 20.3%) for males and 7:00 AM to 7:29 AM (377, 21.5%) for females.
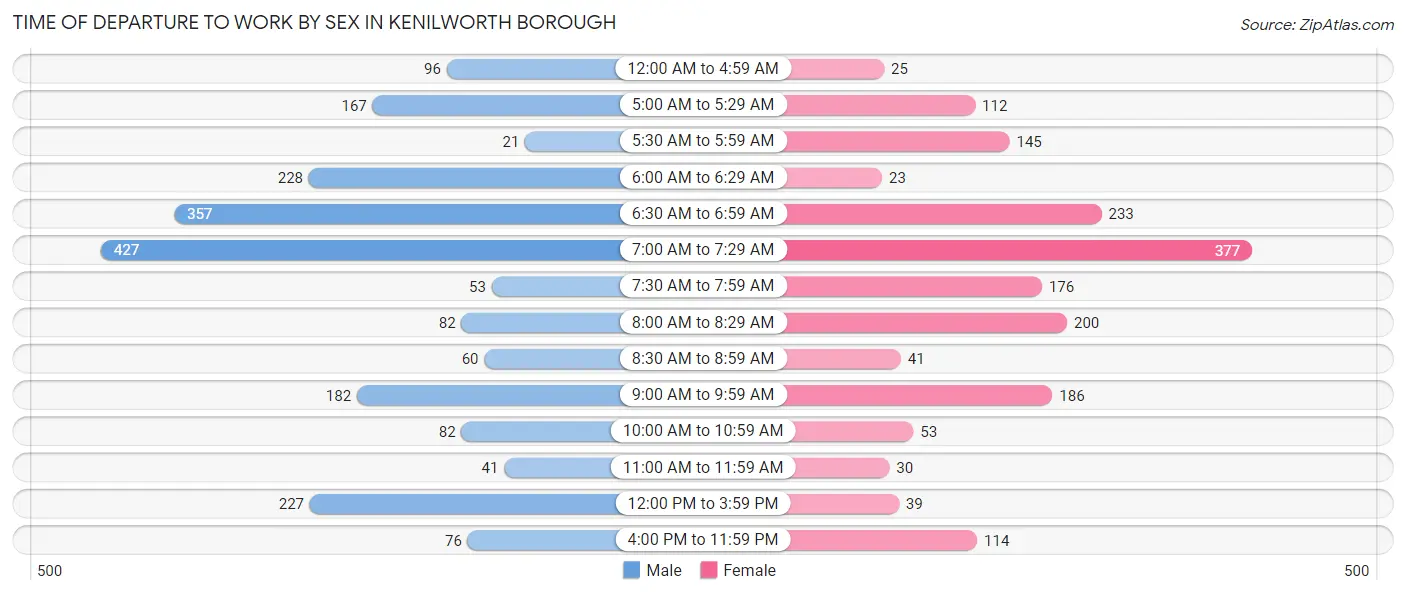
| Time of Departure | Male | Female |
| 12:00 AM to 4:59 AM | 96 (4.6%) | 25 (1.4%) |
| 5:00 AM to 5:29 AM | 167 (8.0%) | 112 (6.4%) |
| 5:30 AM to 5:59 AM | 21 (1.0%) | 145 (8.3%) |
| 6:00 AM to 6:29 AM | 228 (10.9%) | 23 (1.3%) |
| 6:30 AM to 6:59 AM | 357 (17.0%) | 233 (13.3%) |
| 7:00 AM to 7:29 AM | 427 (20.3%) | 377 (21.5%) |
| 7:30 AM to 7:59 AM | 53 (2.5%) | 176 (10.0%) |
| 8:00 AM to 8:29 AM | 82 (3.9%) | 200 (11.4%) |
| 8:30 AM to 8:59 AM | 60 (2.9%) | 41 (2.3%) |
| 9:00 AM to 9:59 AM | 182 (8.7%) | 186 (10.6%) |
| 10:00 AM to 10:59 AM | 82 (3.9%) | 53 (3.0%) |
| 11:00 AM to 11:59 AM | 41 (1.9%) | 30 (1.7%) |
| 12:00 PM to 3:59 PM | 227 (10.8%) | 39 (2.2%) |
| 4:00 PM to 11:59 PM | 76 (3.6%) | 114 (6.5%) |
| Total | 2,099 (100.0%) | 1,754 (100.0%) |
Housing Occupancy in Kenilworth borough
Occupancy by Ownership in Kenilworth borough
Of the total 2,802 dwellings in Kenilworth borough, owner-occupied units account for 1,844 (65.8%), while renter-occupied units make up 958 (34.2%).
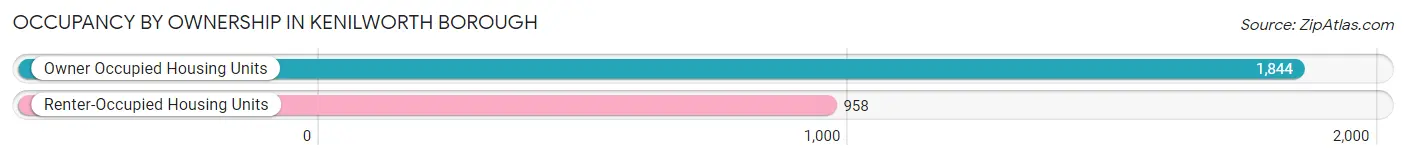
| Occupancy | # Housing Units | % Housing Units |
| Owner Occupied Housing Units | 1,844 | 65.8% |
| Renter-Occupied Housing Units | 958 | 34.2% |
| Total Occupied Housing Units | 2,802 | 100.0% |
Occupancy by Household Size in Kenilworth borough
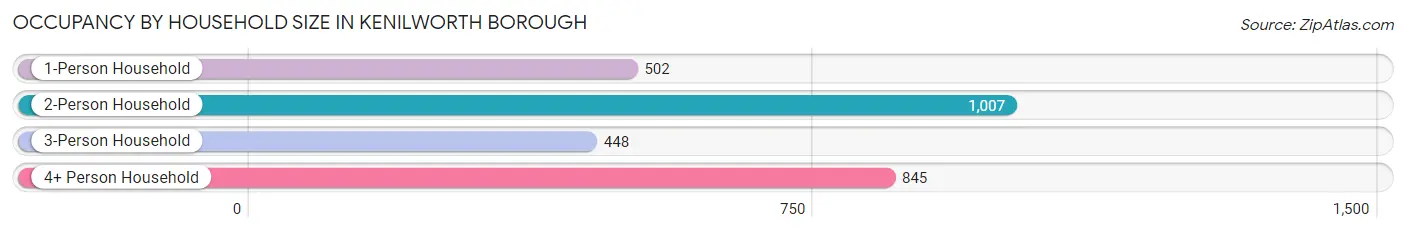
| Household Size | # Housing Units | % Housing Units |
| 1-Person Household | 502 | 17.9% |
| 2-Person Household | 1,007 | 35.9% |
| 3-Person Household | 448 | 16.0% |
| 4+ Person Household | 845 | 30.2% |
| Total Housing Units | 2,802 | 100.0% |
Occupancy by Ownership by Household Size in Kenilworth borough
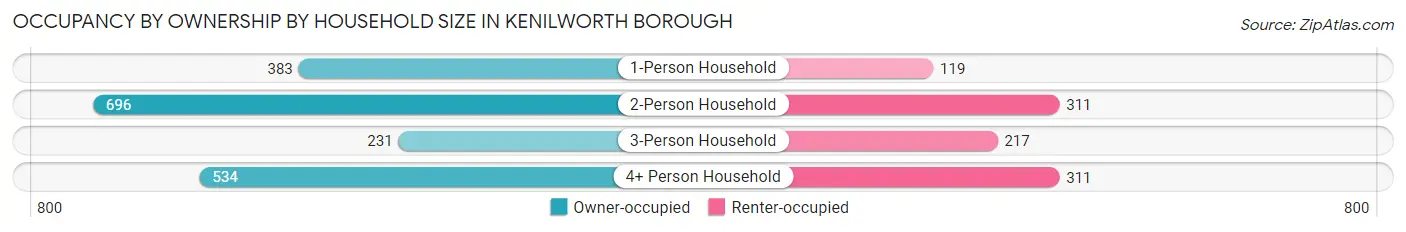
| Household Size | Owner-occupied | Renter-occupied |
| 1-Person Household | 383 (76.3%) | 119 (23.7%) |
| 2-Person Household | 696 (69.1%) | 311 (30.9%) |
| 3-Person Household | 231 (51.6%) | 217 (48.4%) |
| 4+ Person Household | 534 (63.2%) | 311 (36.8%) |
| Total Housing Units | 1,844 (65.8%) | 958 (34.2%) |
Occupancy by Educational Attainment in Kenilworth borough
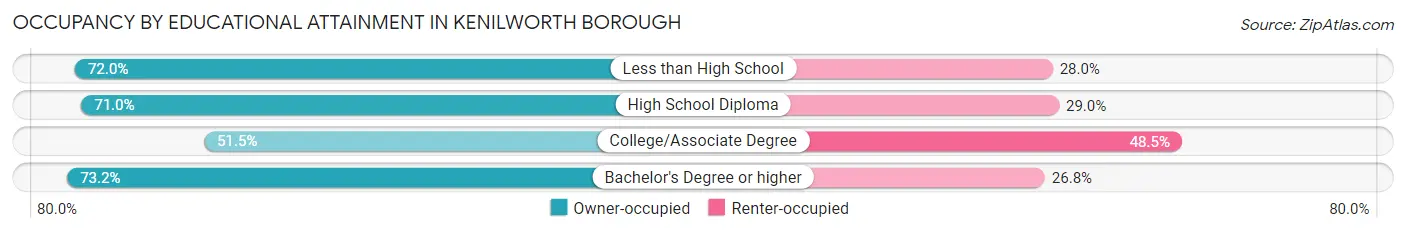
| Household Size | Owner-occupied | Renter-occupied |
| Less than High School | 126 (72.0%) | 49 (28.0%) |
| High School Diploma | 497 (71.0%) | 203 (29.0%) |
| College/Associate Degree | 452 (51.5%) | 425 (48.5%) |
| Bachelor's Degree or higher | 769 (73.2%) | 281 (26.8%) |
Occupancy by Age of Householder in Kenilworth borough
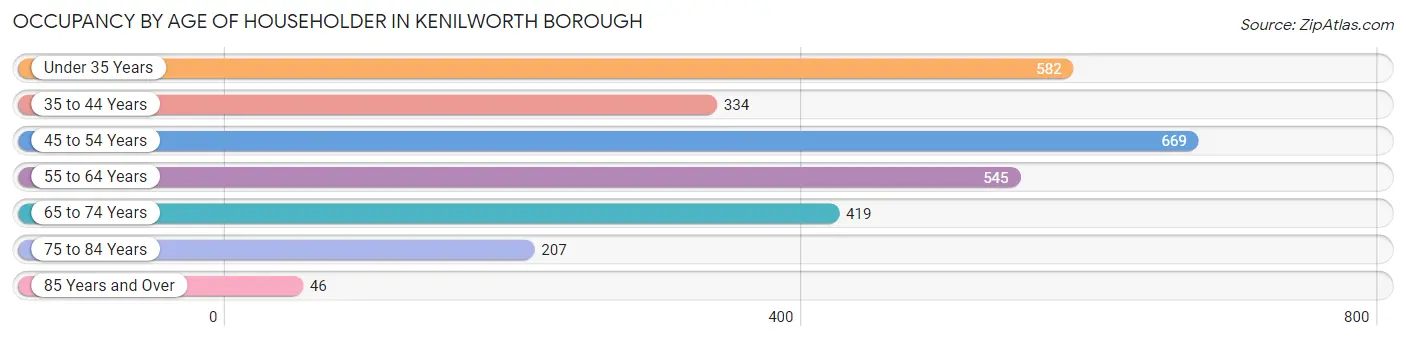
| Age Bracket | # Households | % Households |
| Under 35 Years | 582 | 20.8% |
| 35 to 44 Years | 334 | 11.9% |
| 45 to 54 Years | 669 | 23.9% |
| 55 to 64 Years | 545 | 19.5% |
| 65 to 74 Years | 419 | 14.9% |
| 75 to 84 Years | 207 | 7.4% |
| 85 Years and Over | 46 | 1.6% |
| Total | 2,802 | 100.0% |
Housing Finances in Kenilworth borough
Median Income by Occupancy in Kenilworth borough
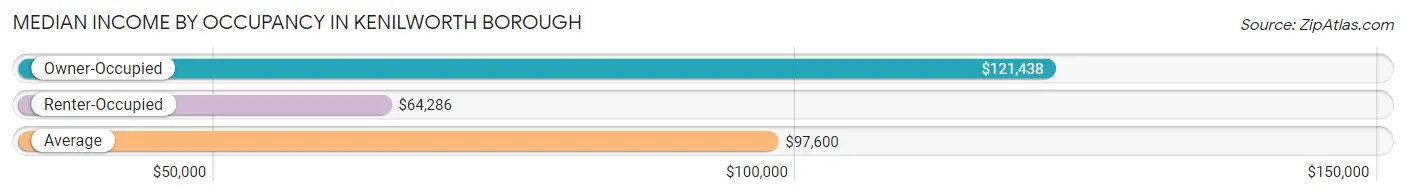
| Occupancy Type | # Households | Median Income |
| Owner-Occupied | 1,844 (65.8%) | $121,438 |
| Renter-Occupied | 958 (34.2%) | $64,286 |
| Average | 2,802 (100.0%) | $97,600 |
Occupancy by Householder Income Bracket in Kenilworth borough
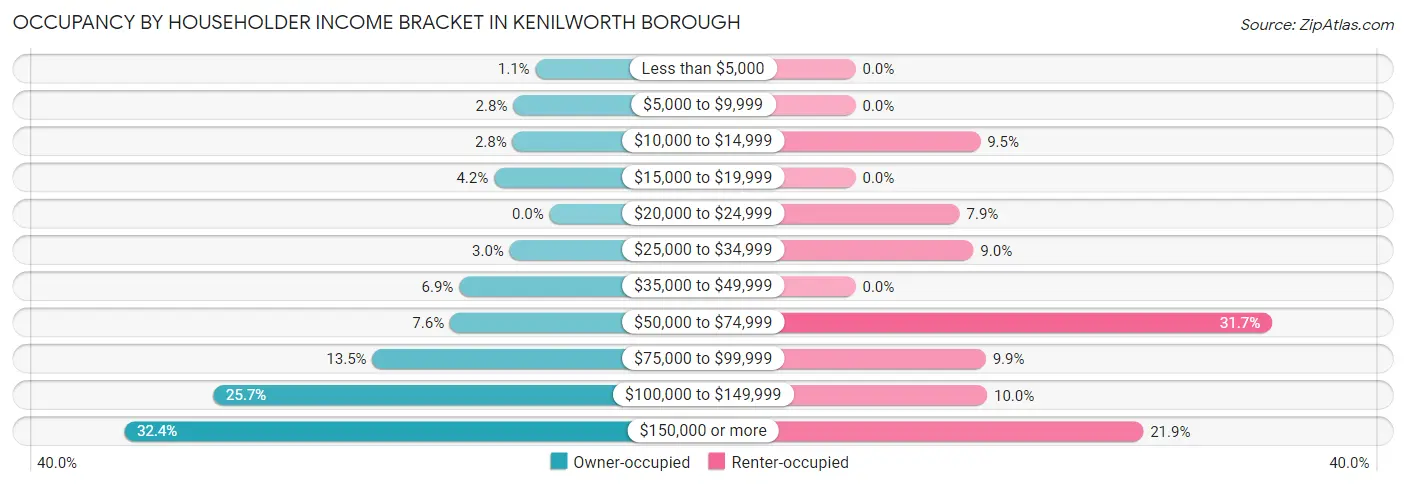
| Income Bracket | Owner-occupied | Renter-occupied |
| Less than $5,000 | 20 (1.1%) | 0 (0.0%) |
| $5,000 to $9,999 | 51 (2.8%) | 0 (0.0%) |
| $10,000 to $14,999 | 52 (2.8%) | 91 (9.5%) |
| $15,000 to $19,999 | 78 (4.2%) | 0 (0.0%) |
| $20,000 to $24,999 | 0 (0.0%) | 76 (7.9%) |
| $25,000 to $34,999 | 56 (3.0%) | 86 (9.0%) |
| $35,000 to $49,999 | 127 (6.9%) | 0 (0.0%) |
| $50,000 to $74,999 | 140 (7.6%) | 304 (31.7%) |
| $75,000 to $99,999 | 249 (13.5%) | 95 (9.9%) |
| $100,000 to $149,999 | 473 (25.7%) | 96 (10.0%) |
| $150,000 or more | 598 (32.4%) | 210 (21.9%) |
| Total | 1,844 (100.0%) | 958 (100.0%) |
Monthly Housing Cost Tiers in Kenilworth borough
| Monthly Cost | Owner-occupied | Renter-occupied |
| Less than $300 | 5 (0.3%) | 0 (0.0%) |
| $300 to $499 | 16 (0.9%) | 0 (0.0%) |
| $500 to $799 | 97 (5.3%) | 13 (1.4%) |
| $800 to $999 | 138 (7.5%) | 0 (0.0%) |
| $1,000 to $1,499 | 230 (12.5%) | 191 (19.9%) |
| $1,500 to $1,999 | 578 (31.3%) | 350 (36.5%) |
| $2,000 to $2,499 | 185 (10.0%) | 237 (24.7%) |
| $2,500 to $2,999 | 164 (8.9%) | 126 (13.2%) |
| $3,000 or more | 431 (23.4%) | 28 (2.9%) |
| Total | 1,844 (100.0%) | 958 (100.0%) |
Physical Housing Characteristics in Kenilworth borough
Housing Structures in Kenilworth borough
| Structure Type | # Housing Units | % Housing Units |
| Single Unit, Detached | 2,023 | 72.2% |
| Single Unit, Attached | 124 | 4.4% |
| 2 Unit Apartments | 592 | 21.1% |
| 3 or 4 Unit Apartments | 37 | 1.3% |
| 5 to 9 Unit Apartments | 10 | 0.4% |
| 10 or more Apartments | 16 | 0.6% |
| Mobile Home / Other | 0 | 0.0% |
| Total | 2,802 | 100.0% |
Housing Structures by Occupancy in Kenilworth borough
| Structure Type | Owner-occupied | Renter-occupied |
| Single Unit, Detached | 1,687 (83.4%) | 336 (16.6%) |
| Single Unit, Attached | 62 (50.0%) | 62 (50.0%) |
| 2 Unit Apartments | 69 (11.7%) | 523 (88.3%) |
| 3 or 4 Unit Apartments | 0 (0.0%) | 37 (100.0%) |
| 5 to 9 Unit Apartments | 10 (100.0%) | 0 (0.0%) |
| 10 or more Apartments | 16 (100.0%) | 0 (0.0%) |
| Mobile Home / Other | 0 (0.0%) | 0 (0.0%) |
| Total | 1,844 (65.8%) | 958 (34.2%) |
Housing Structures by Number of Rooms in Kenilworth borough
| Number of Rooms | Owner-occupied | Renter-occupied |
| 1 Room | 0 (0.0%) | 0 (0.0%) |
| 2 or 3 Rooms | 16 (0.9%) | 78 (8.1%) |
| 4 or 5 Rooms | 213 (11.6%) | 272 (28.4%) |
| 6 or 7 Rooms | 965 (52.3%) | 565 (59.0%) |
| 8 or more Rooms | 650 (35.2%) | 43 (4.5%) |
| Total | 1,844 (100.0%) | 958 (100.0%) |
Housing Structure by Heating Type in Kenilworth borough
| Heating Type | Owner-occupied | Renter-occupied |
| Utility Gas | 1,452 (78.7%) | 796 (83.1%) |
| Bottled, Tank, or LP Gas | 11 (0.6%) | 18 (1.9%) |
| Electricity | 205 (11.1%) | 144 (15.0%) |
| Fuel Oil or Kerosene | 125 (6.8%) | 0 (0.0%) |
| Coal or Coke | 0 (0.0%) | 0 (0.0%) |
| All other Fuels | 0 (0.0%) | 0 (0.0%) |
| No Fuel Used | 51 (2.8%) | 0 (0.0%) |
| Total | 1,844 (100.0%) | 958 (100.0%) |
Household Vehicle Usage in Kenilworth borough
| Vehicles per Household | Owner-occupied | Renter-occupied |
| No Vehicle | 83 (4.5%) | 18 (1.9%) |
| 1 Vehicle | 392 (21.3%) | 399 (41.6%) |
| 2 Vehicles | 943 (51.1%) | 451 (47.1%) |
| 3 or more Vehicles | 426 (23.1%) | 90 (9.4%) |
| Total | 1,844 (100.0%) | 958 (100.0%) |
Real Estate & Mortgages in Kenilworth borough
Real Estate and Mortgage Overview in Kenilworth borough
| Characteristic | Without Mortgage | With Mortgage |
| Housing Units | 569 | 1,275 |
| Median Property Value | $523,500 | $447,800 |
| Median Household Income | $75,508 | $492 |
| Monthly Housing Costs | $1,169 | $431 |
| Real Estate Taxes | $9,898 | $0 |
Property Value by Mortgage Status in Kenilworth borough
| Property Value | Without Mortgage | With Mortgage |
| Less than $50,000 | 0 (0.0%) | 51 (4.0%) |
| $50,000 to $99,999 | 0 (0.0%) | 0 (0.0%) |
| $100,000 to $299,999 | 46 (8.1%) | 177 (13.9%) |
| $300,000 to $499,999 | 211 (37.1%) | 643 (50.4%) |
| $500,000 to $749,999 | 292 (51.3%) | 269 (21.1%) |
| $750,000 to $999,999 | 20 (3.5%) | 135 (10.6%) |
| $1,000,000 or more | 0 (0.0%) | 0 (0.0%) |
| Total | 569 (100.0%) | 1,275 (100.0%) |
Household Income by Mortgage Status in Kenilworth borough
| Household Income | Without Mortgage | With Mortgage |
| Less than $10,000 | 0 (0.0%) | 50 (3.9%) |
| $10,000 to $24,999 | 117 (20.6%) | 71 (5.6%) |
| $25,000 to $34,999 | 56 (9.8%) | 13 (1.0%) |
| $35,000 to $49,999 | 90 (15.8%) | 0 (0.0%) |
| $50,000 to $74,999 | 15 (2.6%) | 37 (2.9%) |
| $75,000 to $99,999 | 108 (19.0%) | 125 (9.8%) |
| $100,000 to $149,999 | 77 (13.5%) | 141 (11.1%) |
| $150,000 or more | 106 (18.6%) | 396 (31.1%) |
| Total | 569 (100.0%) | 1,275 (100.0%) |
Property Value to Household Income Ratio in Kenilworth borough
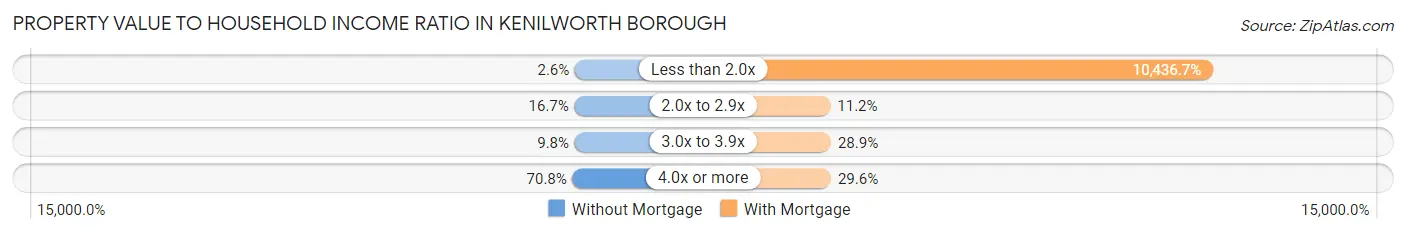
| Value-to-Income Ratio | Without Mortgage | With Mortgage |
| Less than 2.0x | 15 (2.6%) | 133,068 (10,436.7%) |
| 2.0x to 2.9x | 95 (16.7%) | 143 (11.2%) |
| 3.0x to 3.9x | 56 (9.8%) | 369 (28.9%) |
| 4.0x or more | 403 (70.8%) | 377 (29.6%) |
| Total | 569 (100.0%) | 1,275 (100.0%) |
Real Estate Taxes by Mortgage Status in Kenilworth borough
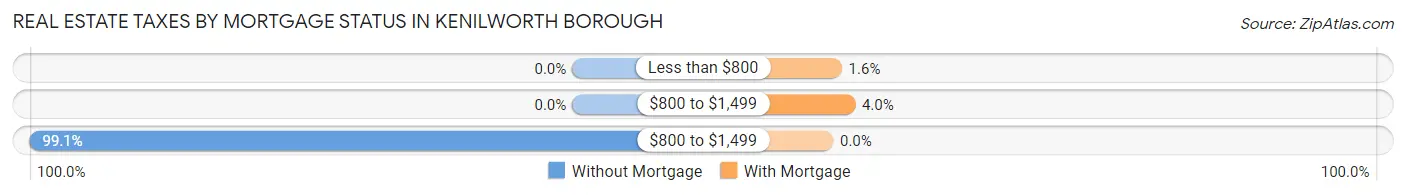
| Property Taxes | Without Mortgage | With Mortgage |
| Less than $800 | 0 (0.0%) | 20 (1.6%) |
| $800 to $1,499 | 0 (0.0%) | 51 (4.0%) |
| $800 to $1,499 | 564 (99.1%) | 0 (0.0%) |
| Total | 569 (100.0%) | 1,275 (100.0%) |
Health & Disability in Kenilworth borough
Health Insurance Coverage by Age in Kenilworth borough
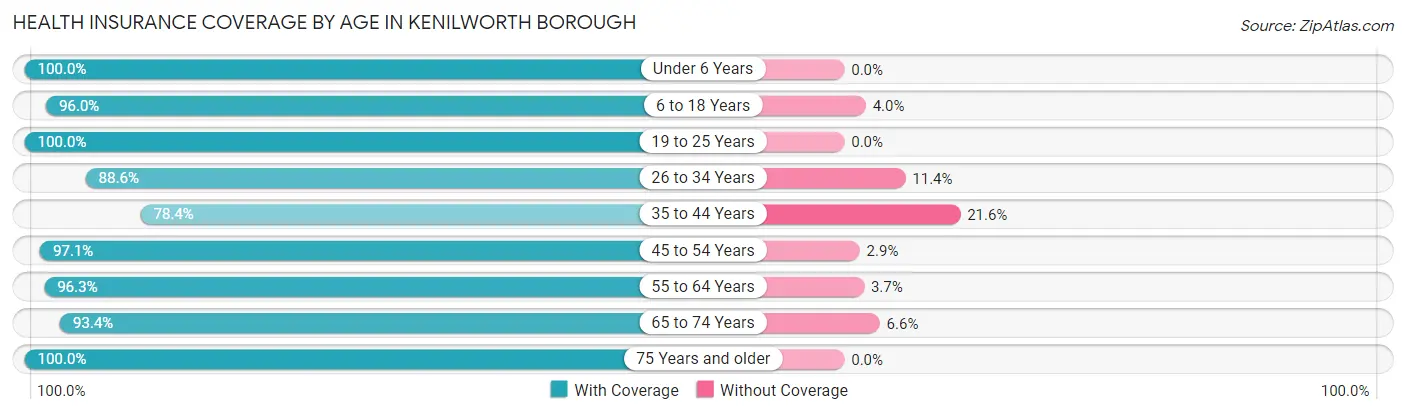
| Age Bracket | With Coverage | Without Coverage |
| Under 6 Years | 375 (100.0%) | 0 (0.0%) |
| 6 to 18 Years | 1,877 (96.0%) | 78 (4.0%) |
| 19 to 25 Years | 622 (100.0%) | 0 (0.0%) |
| 26 to 34 Years | 887 (88.6%) | 114 (11.4%) |
| 35 to 44 Years | 758 (78.4%) | 209 (21.6%) |
| 45 to 54 Years | 1,116 (97.1%) | 33 (2.9%) |
| 55 to 64 Years | 1,024 (96.3%) | 39 (3.7%) |
| 65 to 74 Years | 751 (93.4%) | 53 (6.6%) |
| 75 Years and older | 409 (100.0%) | 0 (0.0%) |
| Total | 7,819 (93.7%) | 526 (6.3%) |
Health Insurance Coverage by Citizenship Status in Kenilworth borough
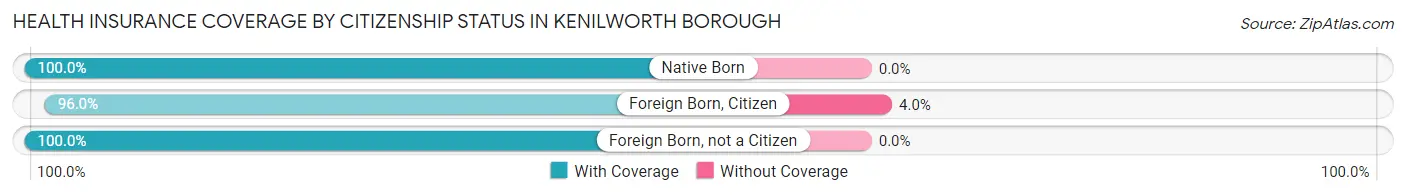
| Citizenship Status | With Coverage | Without Coverage |
| Native Born | 375 (100.0%) | 0 (0.0%) |
| Foreign Born, Citizen | 1,877 (96.0%) | 78 (4.0%) |
| Foreign Born, not a Citizen | 622 (100.0%) | 0 (0.0%) |
Health Insurance Coverage by Household Income in Kenilworth borough
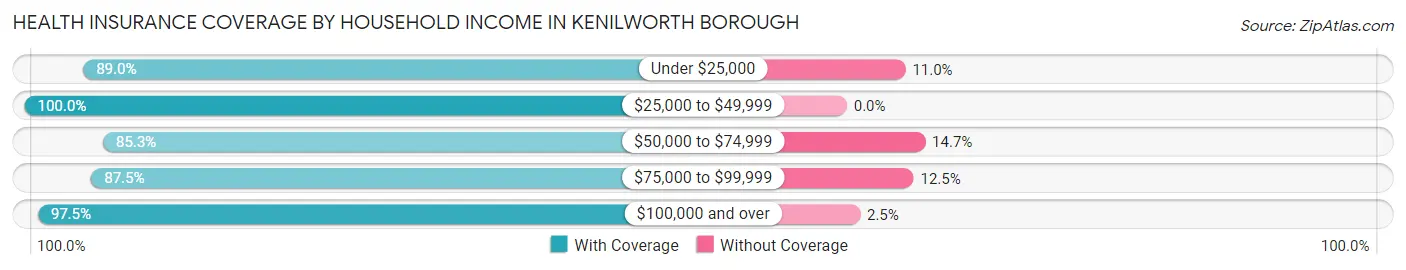
| Household Income | With Coverage | Without Coverage |
| Under $25,000 | 761 (89.0%) | 94 (11.0%) |
| $25,000 to $49,999 | 493 (100.0%) | 0 (0.0%) |
| $50,000 to $74,999 | 1,209 (85.3%) | 208 (14.7%) |
| $75,000 to $99,999 | 749 (87.5%) | 107 (12.5%) |
| $100,000 and over | 4,599 (97.5%) | 117 (2.5%) |
Public vs Private Health Insurance Coverage by Age in Kenilworth borough
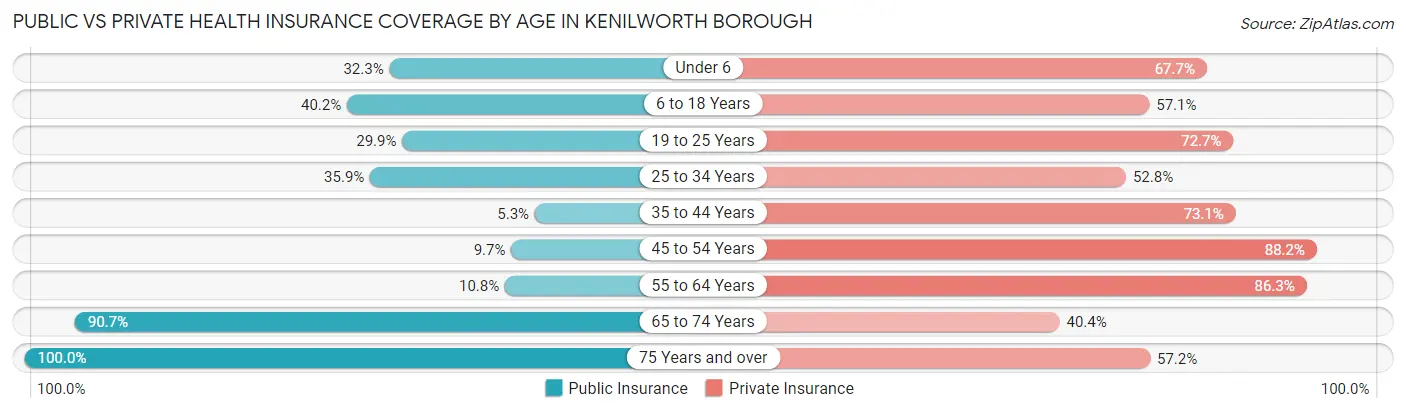
| Age Bracket | Public Insurance | Private Insurance |
| Under 6 | 121 (32.3%) | 254 (67.7%) |
| 6 to 18 Years | 785 (40.2%) | 1,116 (57.1%) |
| 19 to 25 Years | 186 (29.9%) | 452 (72.7%) |
| 25 to 34 Years | 359 (35.9%) | 528 (52.7%) |
| 35 to 44 Years | 51 (5.3%) | 707 (73.1%) |
| 45 to 54 Years | 111 (9.7%) | 1,013 (88.2%) |
| 55 to 64 Years | 115 (10.8%) | 917 (86.3%) |
| 65 to 74 Years | 729 (90.7%) | 325 (40.4%) |
| 75 Years and over | 409 (100.0%) | 234 (57.2%) |
| Total | 2,866 (34.3%) | 5,546 (66.5%) |
Disability Status by Sex by Age in Kenilworth borough
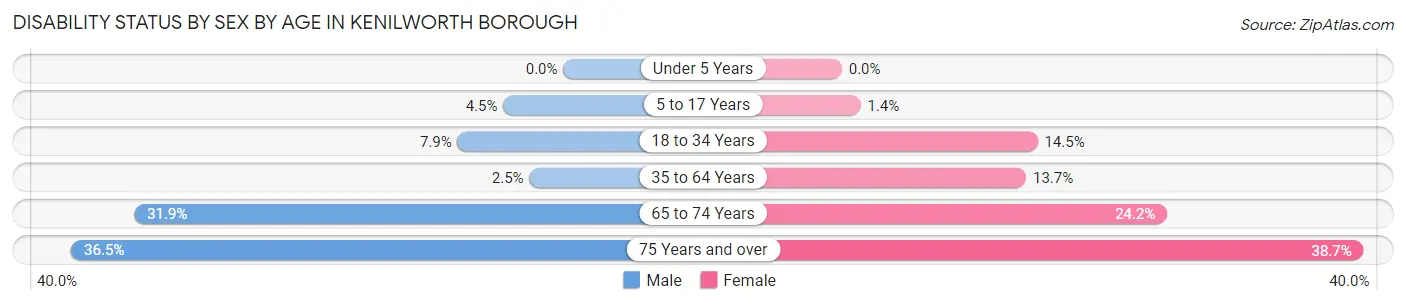
| Age Bracket | Male | Female |
| Under 5 Years | 0 (0.0%) | 0 (0.0%) |
| 5 to 17 Years | 34 (4.5%) | 16 (1.4%) |
| 18 to 34 Years | 75 (7.9%) | 111 (14.5%) |
| 35 to 64 Years | 35 (2.5%) | 245 (13.7%) |
| 65 to 74 Years | 123 (31.9%) | 101 (24.2%) |
| 75 Years and over | 57 (36.5%) | 98 (38.7%) |
Disability Class by Sex by Age in Kenilworth borough
Disability Class: Hearing Difficulty
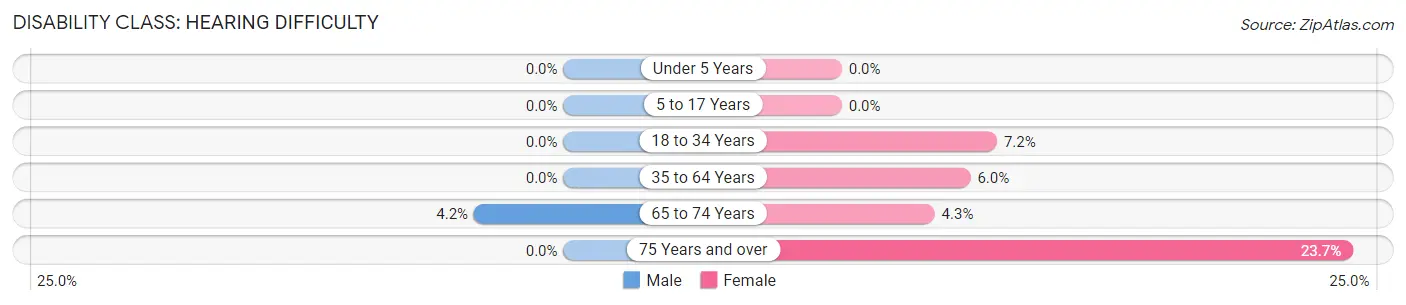
| Age Bracket | Male | Female |
| Under 5 Years | 0 (0.0%) | 0 (0.0%) |
| 5 to 17 Years | 0 (0.0%) | 0 (0.0%) |
| 18 to 34 Years | 0 (0.0%) | 55 (7.2%) |
| 35 to 64 Years | 0 (0.0%) | 107 (6.0%) |
| 65 to 74 Years | 16 (4.2%) | 18 (4.3%) |
| 75 Years and over | 0 (0.0%) | 60 (23.7%) |
Disability Class: Vision Difficulty
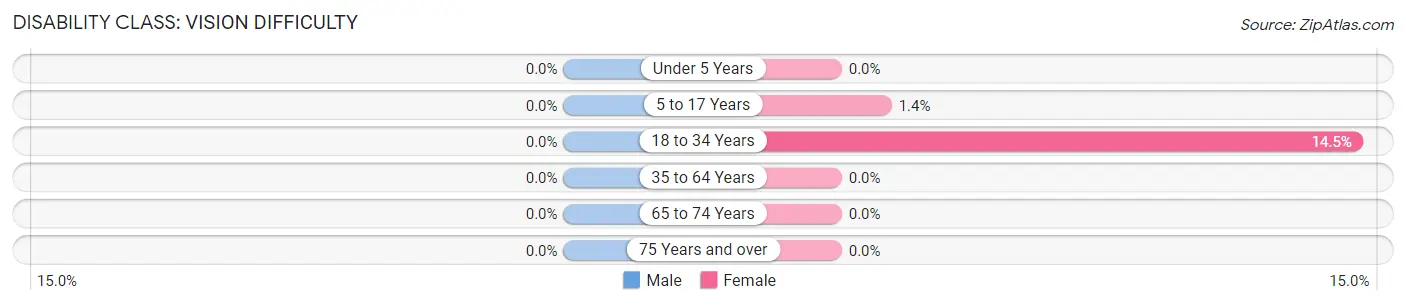
| Age Bracket | Male | Female |
| Under 5 Years | 0 (0.0%) | 0 (0.0%) |
| 5 to 17 Years | 0 (0.0%) | 16 (1.4%) |
| 18 to 34 Years | 0 (0.0%) | 111 (14.5%) |
| 35 to 64 Years | 0 (0.0%) | 0 (0.0%) |
| 65 to 74 Years | 0 (0.0%) | 0 (0.0%) |
| 75 Years and over | 0 (0.0%) | 0 (0.0%) |
Disability Class: Cognitive Difficulty
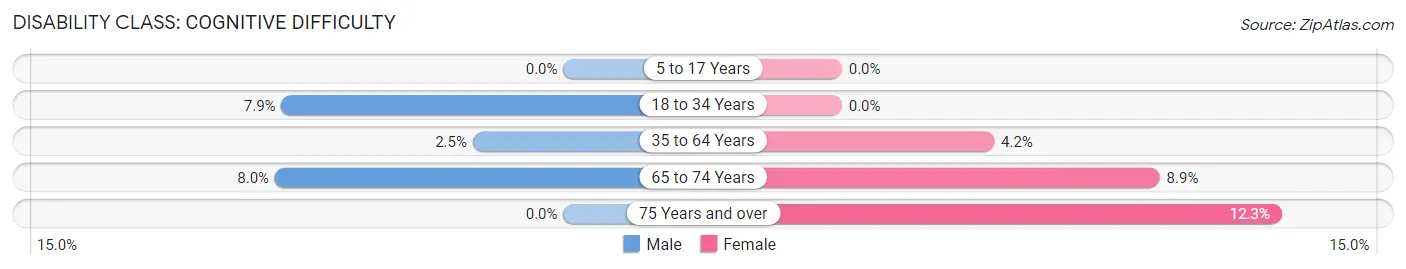
| Age Bracket | Male | Female |
| 5 to 17 Years | 0 (0.0%) | 0 (0.0%) |
| 18 to 34 Years | 75 (7.9%) | 0 (0.0%) |
| 35 to 64 Years | 35 (2.5%) | 76 (4.2%) |
| 65 to 74 Years | 31 (8.0%) | 37 (8.8%) |
| 75 Years and over | 0 (0.0%) | 31 (12.2%) |
Disability Class: Ambulatory Difficulty
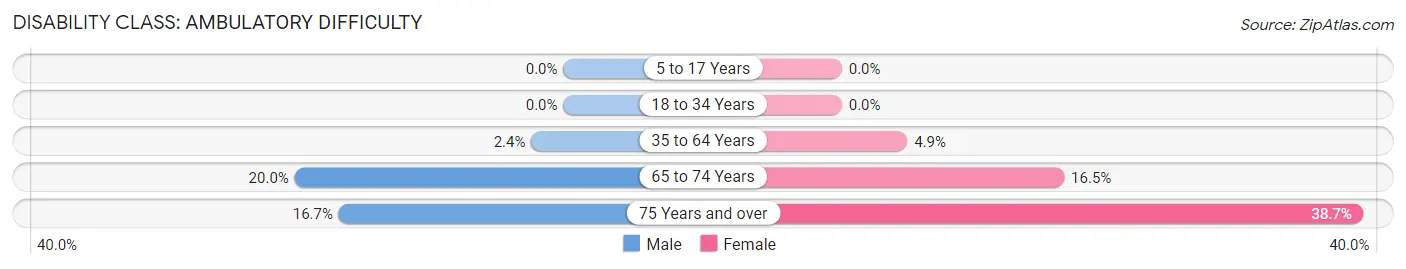
| Age Bracket | Male | Female |
| 5 to 17 Years | 0 (0.0%) | 0 (0.0%) |
| 18 to 34 Years | 0 (0.0%) | 0 (0.0%) |
| 35 to 64 Years | 33 (2.4%) | 87 (4.9%) |
| 65 to 74 Years | 77 (20.0%) | 69 (16.5%) |
| 75 Years and over | 26 (16.7%) | 98 (38.7%) |
Disability Class: Self-Care Difficulty
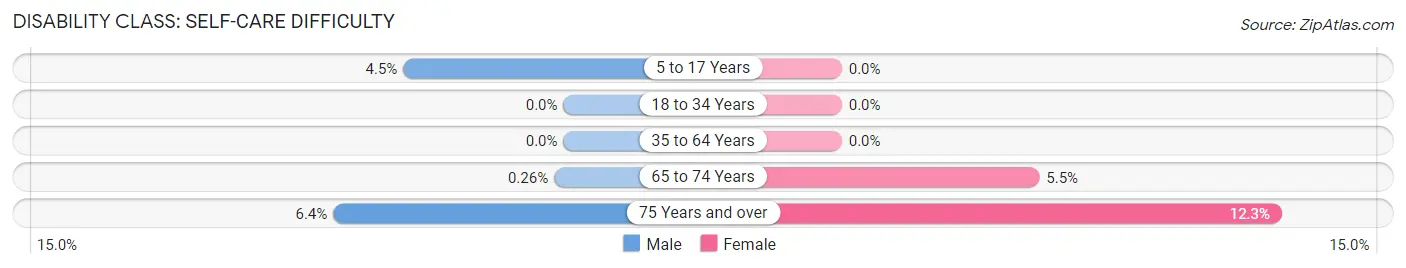
| Age Bracket | Male | Female |
| 5 to 17 Years | 34 (4.5%) | 0 (0.0%) |
| 18 to 34 Years | 0 (0.0%) | 0 (0.0%) |
| 35 to 64 Years | 0 (0.0%) | 0 (0.0%) |
| 65 to 74 Years | 1 (0.3%) | 23 (5.5%) |
| 75 Years and over | 10 (6.4%) | 31 (12.2%) |
Technology Access in Kenilworth borough
Computing Device Access in Kenilworth borough
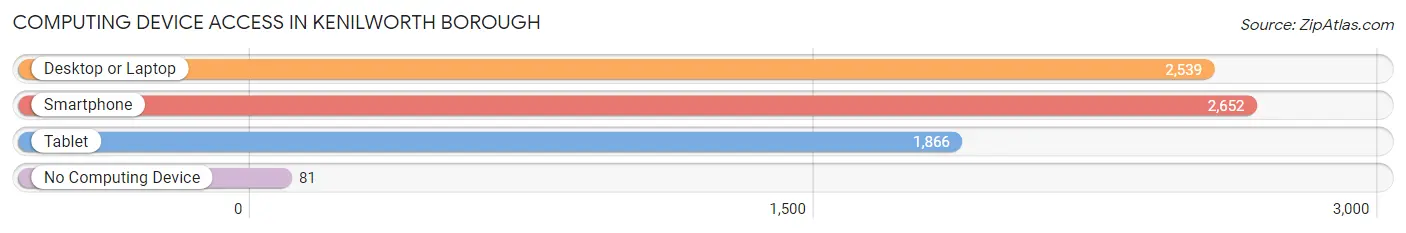
| Device Type | # Households | % Households |
| Desktop or Laptop | 2,539 | 90.6% |
| Smartphone | 2,652 | 94.7% |
| Tablet | 1,866 | 66.6% |
| No Computing Device | 81 | 2.9% |
| Total | 2,802 | 100.0% |
Internet Access in Kenilworth borough
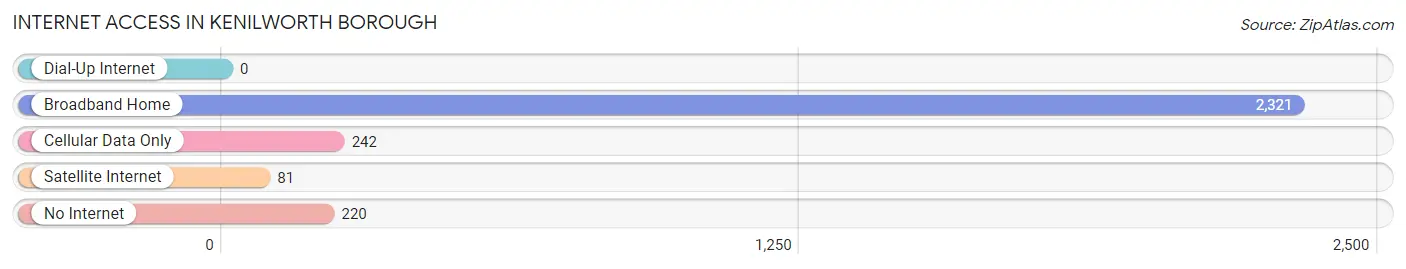
| Internet Type | # Households | % Households |
| Dial-Up Internet | 0 | 0.0% |
| Broadband Home | 2,321 | 82.8% |
| Cellular Data Only | 242 | 8.6% |
| Satellite Internet | 81 | 2.9% |
| No Internet | 220 | 7.9% |
| Total | 2,802 | 100.0% |
Kenilworth borough Summary
Kenilworth Borough is a small borough located in Union County, New Jersey. It is situated on the Rahway River and is bordered by the towns of Union, Roselle Park, and Cranford. The borough was incorporated in 1907 and is home to approximately 8,000 people.
History
The area that is now Kenilworth was originally inhabited by the Lenni Lenape Native Americans. The first European settlers arrived in the area in the early 1700s. The area was originally part of Elizabethtown, which was established in 1664. In 1857, the area was incorporated as the Township of Union. In 1907, the area was incorporated as the Borough of Kenilworth. The name was chosen to honor the town of Kenilworth in England.
Geography
Kenilworth is located at 40°41'25"N 74°17'45"W. It is situated on the Rahway River and is bordered by the towns of Union, Roselle Park, and Cranford. The borough has a total area of 1.2 square miles, all of which is land.
Economy
Kenilworth has a diverse economy. The borough is home to a variety of businesses, including manufacturing, retail, and professional services. The largest employers in the borough are the Kenilworth Public Schools, the Kenilworth Board of Education, and the Kenilworth Police Department.
Demographics
As of the 2010 census, Kenilworth had a population of 8,113 people. The racial makeup of the borough was 79.2% White, 11.2% African American, 0.3% Native American, 4.2% Asian, and 4.9% from other races. Hispanic or Latino of any race were 11.7% of the population.
The median household income in Kenilworth was $76,944 in 2017. The median age of the borough's population was 43.7 years. The median value of owner-occupied housing units was $521,400.
Education
Kenilworth is served by the Kenilworth Public Schools. The district consists of four schools: Harding Elementary School, Roosevelt Elementary School, David Brearley Middle School, and David Brearley High School. The district also operates a preschool program.
In addition to the public schools, Kenilworth is home to several private schools, including St. Theresa's School, St. Theresa's Academy, and St. Theresa's Academy of Kenilworth.
Conclusion
Kenilworth is a small borough located in Union County, New Jersey. It was incorporated in 1907 and is home to approximately 8,000 people. The borough has a diverse economy and is served by the Kenilworth Public Schools. The median household income in Kenilworth was $76,944 in 2017. Kenilworth is a great place to live, work, and raise a family.
Common Questions
What is the Total Population of Kenilworth borough?
Total Population of Kenilworth borough is 8,345.
What is the Total Male Population of Kenilworth borough?
Total Male Population of Kenilworth borough is 3,743.
What is the Total Female Population of Kenilworth borough?
Total Female Population of Kenilworth borough is 4,602.
What is the Ratio of Males per 100 Females in Kenilworth borough?
There are 81.33 Males per 100 Females in Kenilworth borough.
What is the Ratio of Females per 100 Males in Kenilworth borough?
There are 122.95 Females per 100 Males in Kenilworth borough.
What is the Median Population Age in Kenilworth borough?
Median Population Age in Kenilworth borough is 37.0 Years.
What is the Average Family Size in Kenilworth borough
Average Family Size in Kenilworth borough is 3.4 People.
What is the Average Household Size in Kenilworth borough
Average Household Size in Kenilworth borough is 3.0 People.
What is Per Capita Income in Kenilworth borough?
Per Capita income in Kenilworth borough is $49,611.
What is the Median Family Income in Kenilworth borough?
Median Family Income in Kenilworth borough is $116,618.
What is the Median Household income in Kenilworth borough?
Median Household Income in Kenilworth borough is $97,600.
What is Income or Wage Gap in Kenilworth borough?
Income or Wage Gap in Kenilworth borough is 1.4%.
Women in Kenilworth borough earn 98.6 cents for every dollar earned by a man.
What is Inequality or Gini Index in Kenilworth borough?
Inequality or Gini Index in Kenilworth borough is 0.51.
How Large is the Labor Force in Kenilworth borough?
There are 4,500 People in the Labor Forcein in Kenilworth borough.
What is the Percentage of People in the Labor Force in Kenilworth borough?
72.8% of People are in the Labor Force in Kenilworth borough.
What is the Unemployment Rate in Kenilworth borough?
Unemployment Rate in Kenilworth borough is 8.4%.