Ramblewood, NJ
Ramblewood Map
Ramblewood Overview
6,320
TOTAL POPULATION
3,178
MALE POPULATION
3,142
FEMALE POPULATION
101.15
MALES / 100 FEMALES
98.87
FEMALES / 100 MALES
40.3
MEDIAN AGE
3.2
AVG FAMILY SIZE
2.6
AVG HOUSEHOLD SIZE
$51,367
PER CAPITA INCOME
$116,174
AVG FAMILY INCOME
$104,938
AVG HOUSEHOLD INCOME
35.9%
WAGE / INCOME GAP [ % ]
64.1¢/ $1
WAGE / INCOME GAP [ $ ]
0.40
INEQUALITY / GINI INDEX
3,491
LABOR FORCE [ PEOPLE ]
66.8%
PERCENT IN LABOR FORCE
5.8%
UNEMPLOYMENT RATE
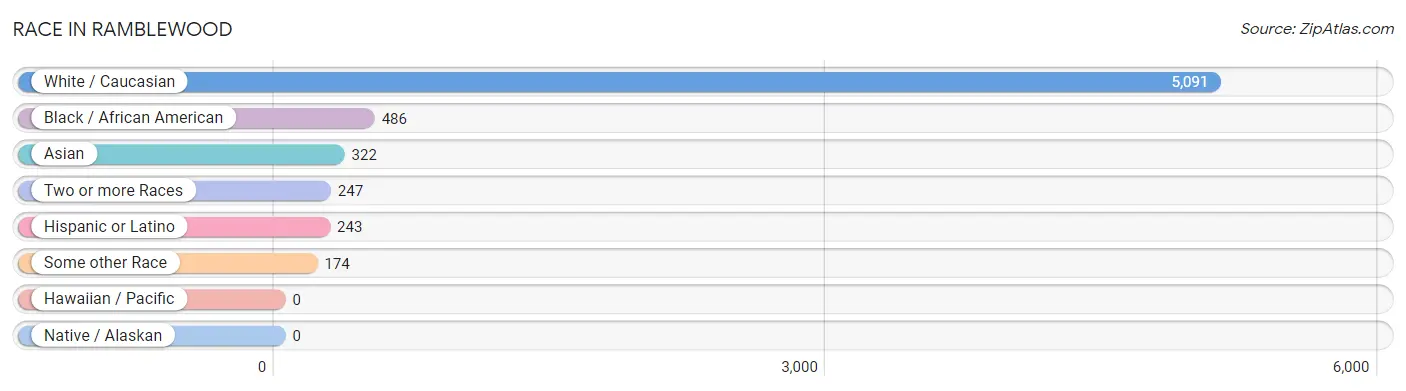
Race in Ramblewood
The most populous races in Ramblewood are White / Caucasian (5,091 | 80.5%), Black / African American (486 | 7.7%), and Asian (322 | 5.1%).
| Race | # Population | % Population |
| Asian | 322 | 5.1% |
| Black / African American | 486 | 7.7% |
| Hawaiian / Pacific | 0 | 0.0% |
| Hispanic or Latino | 243 | 3.8% |
| Native / Alaskan | 0 | 0.0% |
| White / Caucasian | 5,091 | 80.5% |
| Two or more Races | 247 | 3.9% |
| Some other Race | 174 | 2.8% |
| Total | 6,320 | 100.0% |
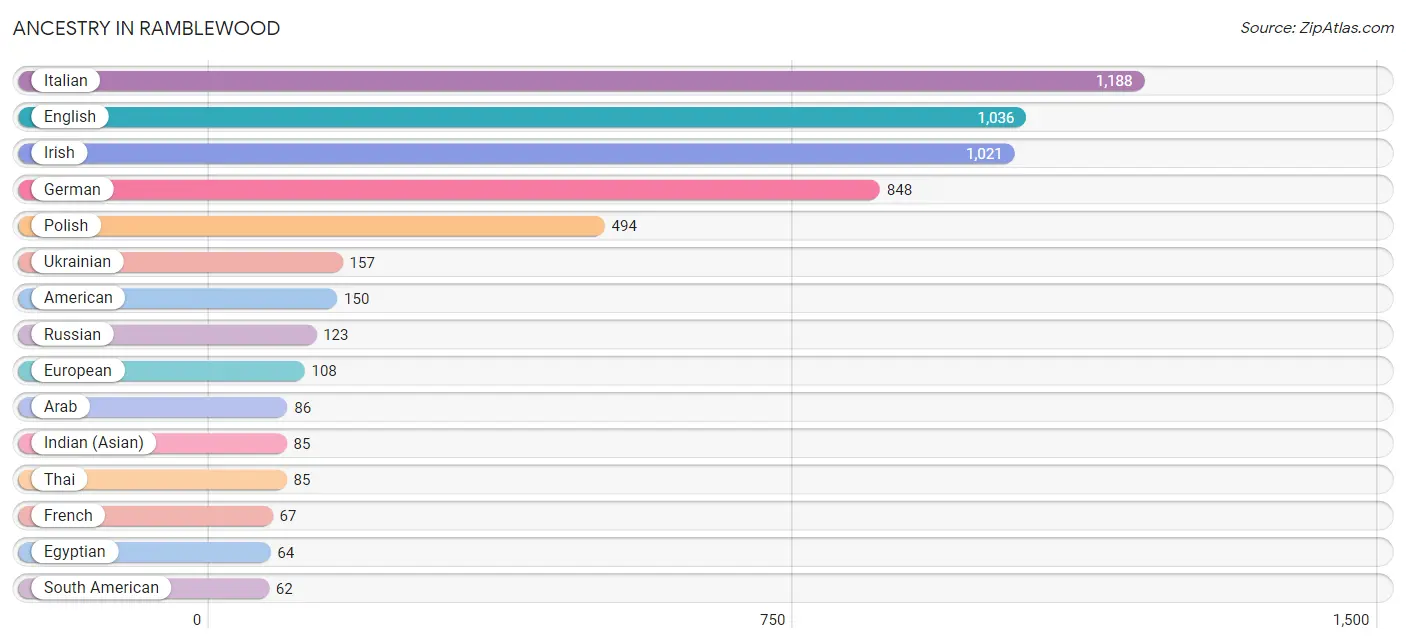
Ancestry in Ramblewood
The most populous ancestries reported in Ramblewood are Italian (1,188 | 18.8%), English (1,036 | 16.4%), Irish (1,021 | 16.2%), German (848 | 13.4%), and Polish (494 | 7.8%), together accounting for 72.6% of all Ramblewood residents.
| Ancestry | # Population | % Population |
| American | 150 | 2.4% |
| Arab | 86 | 1.4% |
| Armenian | 54 | 0.9% |
| Austrian | 15 | 0.2% |
| Bhutanese | 48 | 0.8% |
| Blackfeet | 20 | 0.3% |
| Brazilian | 25 | 0.4% |
| Burmese | 61 | 1.0% |
| Central American | 23 | 0.4% |
| Cherokee | 21 | 0.3% |
| Colombian | 15 | 0.2% |
| Cree | 9 | 0.1% |
| Croatian | 9 | 0.1% |
| Cuban | 23 | 0.4% |
| Czech | 31 | 0.5% |
| Czechoslovakian | 7 | 0.1% |
| Dominican | 48 | 0.8% |
| Dutch | 6 | 0.1% |
| Eastern European | 33 | 0.5% |
| Ecuadorian | 14 | 0.2% |
| Egyptian | 64 | 1.0% |
| English | 1,036 | 16.4% |
| European | 108 | 1.7% |
| French | 67 | 1.1% |
| French Canadian | 5 | 0.1% |
| German | 848 | 13.4% |
| Greek | 17 | 0.3% |
| Guamanian / Chamorro | 5 | 0.1% |
| Guatemalan | 23 | 0.4% |
| Guyanese | 40 | 0.6% |
| Haitian | 42 | 0.7% |
| Hungarian | 10 | 0.2% |
| Indian (Asian) | 85 | 1.3% |
| Irish | 1,021 | 16.2% |
| Israeli | 8 | 0.1% |
| Italian | 1,188 | 18.8% |
| Jamaican | 15 | 0.2% |
| Korean | 32 | 0.5% |
| Latvian | 6 | 0.1% |
| Lebanese | 14 | 0.2% |
| Lithuanian | 23 | 0.4% |
| Mexican | 12 | 0.2% |
| Norwegian | 17 | 0.3% |
| Peruvian | 33 | 0.5% |
| Polish | 494 | 7.8% |
| Portuguese | 35 | 0.5% |
| Puerto Rican | 52 | 0.8% |
| Russian | 123 | 1.9% |
| Scandinavian | 6 | 0.1% |
| Scotch-Irish | 13 | 0.2% |
| Scottish | 39 | 0.6% |
| Slavic | 18 | 0.3% |
| Slovak | 25 | 0.4% |
| Slovene | 8 | 0.1% |
| South African | 13 | 0.2% |
| South American | 62 | 1.0% |
| Sri Lankan | 12 | 0.2% |
| Subsaharan African | 13 | 0.2% |
| Swedish | 10 | 0.2% |
| Syrian | 8 | 0.1% |
| Thai | 85 | 1.3% |
| Ukrainian | 157 | 2.5% | View All 62 Rows |
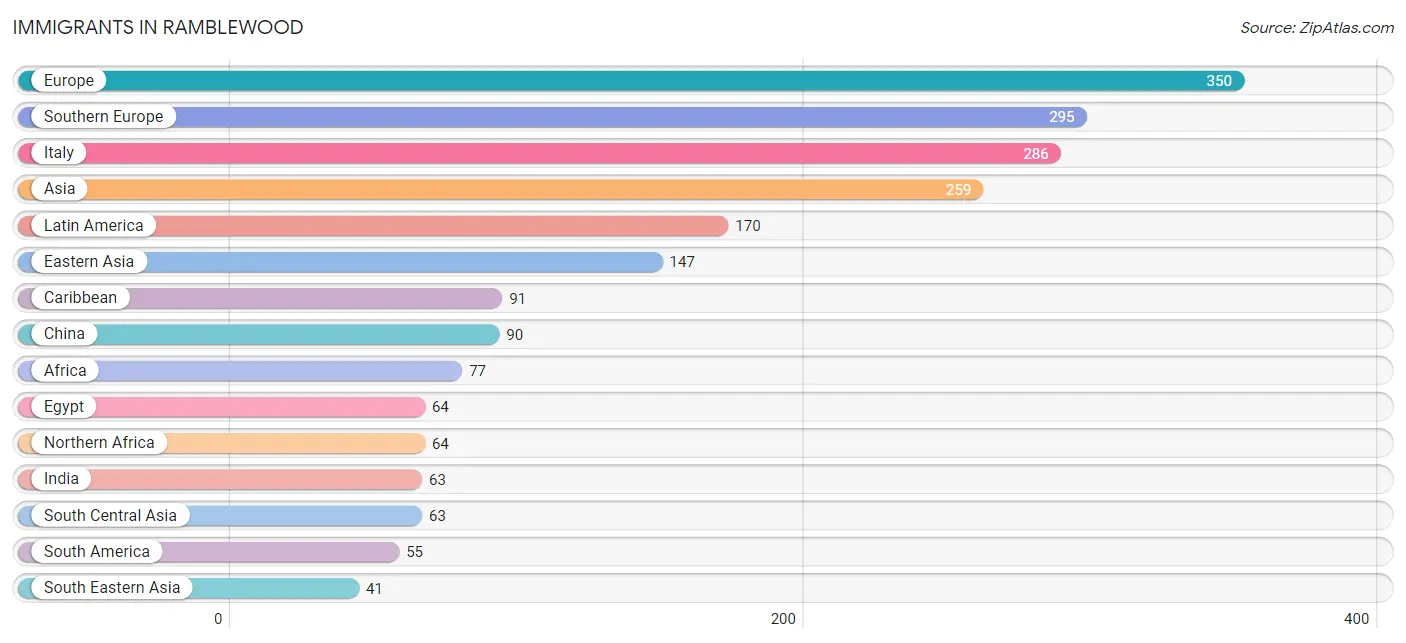
Immigrants in Ramblewood
The most numerous immigrant groups reported in Ramblewood came from Europe (350 | 5.5%), Southern Europe (295 | 4.7%), Italy (286 | 4.5%), Asia (259 | 4.1%), and Latin America (170 | 2.7%), together accounting for 21.5% of all Ramblewood residents.
| Immigration Origin | # Population | % Population |
| Africa | 77 | 1.2% |
| Albania | 11 | 0.2% |
| Asia | 259 | 4.1% |
| Brazil | 28 | 0.4% |
| Canada | 8 | 0.1% |
| Caribbean | 91 | 1.4% |
| Central America | 24 | 0.4% |
| China | 90 | 1.4% |
| Colombia | 15 | 0.2% |
| Cuba | 8 | 0.1% |
| Dominican Republic | 34 | 0.5% |
| Eastern Asia | 147 | 2.3% |
| Eastern Europe | 36 | 0.6% |
| Ecuador | 4 | 0.1% |
| Egypt | 64 | 1.0% |
| England | 19 | 0.3% |
| Europe | 350 | 5.5% |
| Guatemala | 12 | 0.2% |
| Haiti | 21 | 0.3% |
| India | 63 | 1.0% |
| Israel | 8 | 0.1% |
| Italy | 286 | 4.5% |
| Jamaica | 28 | 0.4% |
| Japan | 33 | 0.5% |
| Korea | 24 | 0.4% |
| Latin America | 170 | 2.7% |
| Malaysia | 12 | 0.2% |
| Mexico | 12 | 0.2% |
| Northern Africa | 64 | 1.0% |
| Northern Europe | 19 | 0.3% |
| Peru | 8 | 0.1% |
| Philippines | 29 | 0.5% |
| Poland | 12 | 0.2% |
| Portugal | 9 | 0.1% |
| South Africa | 13 | 0.2% |
| South America | 55 | 0.9% |
| South Central Asia | 63 | 1.0% |
| South Eastern Asia | 41 | 0.6% |
| Southern Europe | 295 | 4.7% |
| Taiwan | 6 | 0.1% |
| Ukraine | 13 | 0.2% |
| Western Asia | 8 | 0.1% | View All 42 Rows |
Sex and Age in Ramblewood
Sex and Age in Ramblewood
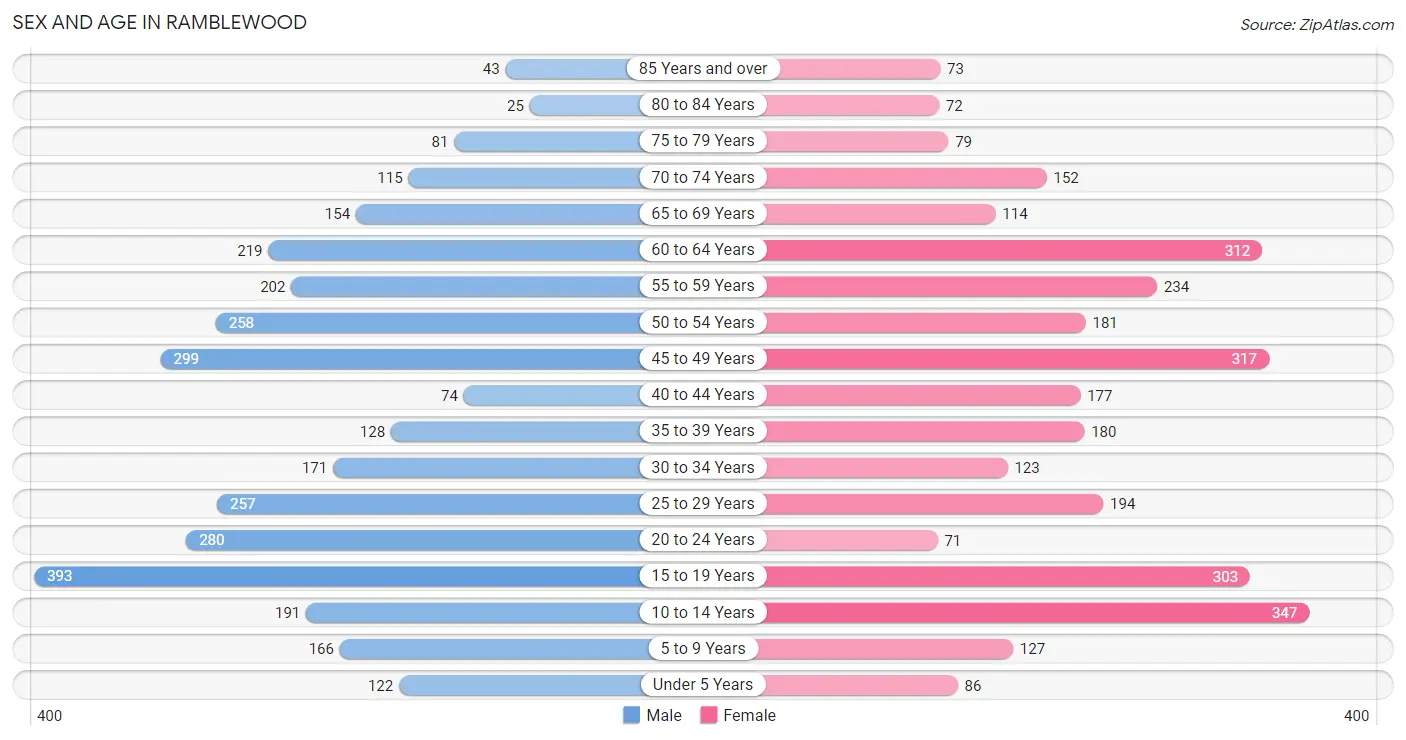
The most populous age groups in Ramblewood are 15 to 19 Years (393 | 12.4%) for men and 10 to 14 Years (347 | 11.0%) for women.
| Age Bracket | Male | Female |
| Under 5 Years | 122 (3.8%) | 86 (2.7%) |
| 5 to 9 Years | 166 (5.2%) | 127 (4.0%) |
| 10 to 14 Years | 191 (6.0%) | 347 (11.0%) |
| 15 to 19 Years | 393 (12.4%) | 303 (9.6%) |
| 20 to 24 Years | 280 (8.8%) | 71 (2.3%) |
| 25 to 29 Years | 257 (8.1%) | 194 (6.2%) |
| 30 to 34 Years | 171 (5.4%) | 123 (3.9%) |
| 35 to 39 Years | 128 (4.0%) | 180 (5.7%) |
| 40 to 44 Years | 74 (2.3%) | 177 (5.6%) |
| 45 to 49 Years | 299 (9.4%) | 317 (10.1%) |
| 50 to 54 Years | 258 (8.1%) | 181 (5.8%) |
| 55 to 59 Years | 202 (6.4%) | 234 (7.4%) |
| 60 to 64 Years | 219 (6.9%) | 312 (9.9%) |
| 65 to 69 Years | 154 (4.9%) | 114 (3.6%) |
| 70 to 74 Years | 115 (3.6%) | 152 (4.8%) |
| 75 to 79 Years | 81 (2.5%) | 79 (2.5%) |
| 80 to 84 Years | 25 (0.8%) | 72 (2.3%) |
| 85 Years and over | 43 (1.3%) | 73 (2.3%) |
| Total | 3,178 (100.0%) | 3,142 (100.0%) |
Families and Households in Ramblewood
Median Family Size in Ramblewood
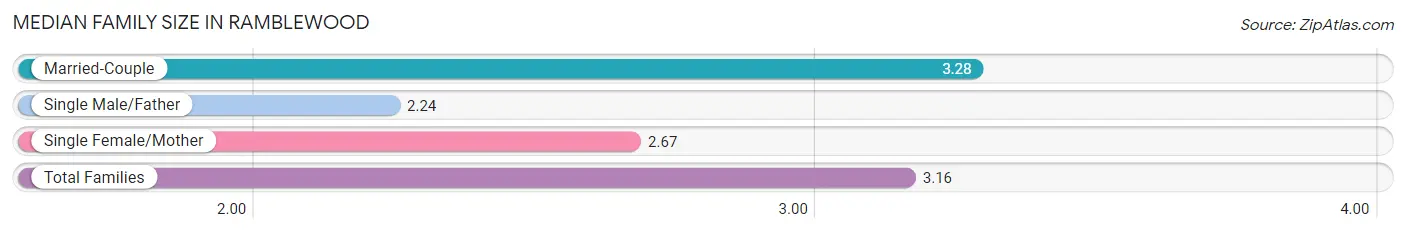
The median family size in Ramblewood is 3.16 persons per family, with married-couple families (1,373 | 83.9%) accounting for the largest median family size of 3.28 persons per family. On the other hand, single male/father families (58 | 3.5%) represent the smallest median family size with 2.24 persons per family.
| Family Type | # Families | Family Size |
| Married-Couple | 1,373 (83.9%) | 3.28 |
| Single Male/Father | 58 (3.5%) | 2.24 |
| Single Female/Mother | 206 (12.6%) | 2.67 |
| Total Families | 1,637 (100.0%) | 3.16 |
Median Household Size in Ramblewood
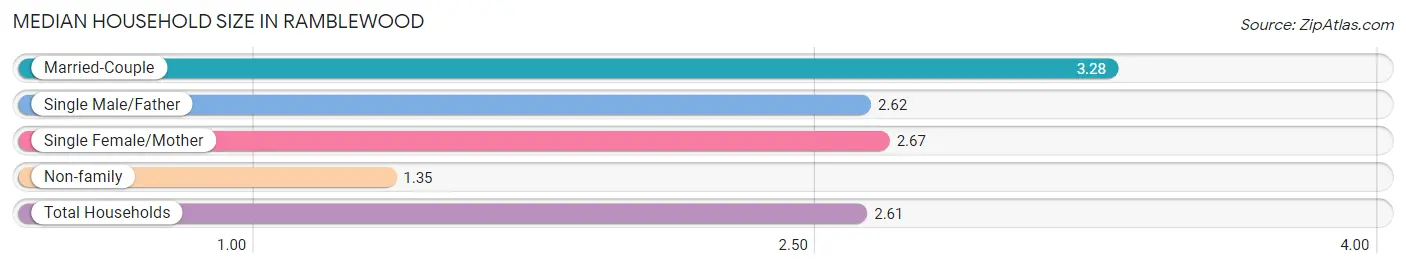
The median household size in Ramblewood is 2.61 persons per household, with married-couple households (1,373 | 57.8%) accounting for the largest median household size of 3.28 persons per household. non-family households (738 | 31.1%) represent the smallest median household size with 1.35 persons per household.
| Household Type | # Households | Household Size |
| Married-Couple | 1,373 (57.8%) | 3.28 |
| Single Male/Father | 58 (2.4%) | 2.62 |
| Single Female/Mother | 206 (8.7%) | 2.67 |
| Non-family | 738 (31.1%) | 1.35 |
| Total Households | 2,375 (100.0%) | 2.61 |
Household Size by Marriage Status in Ramblewood
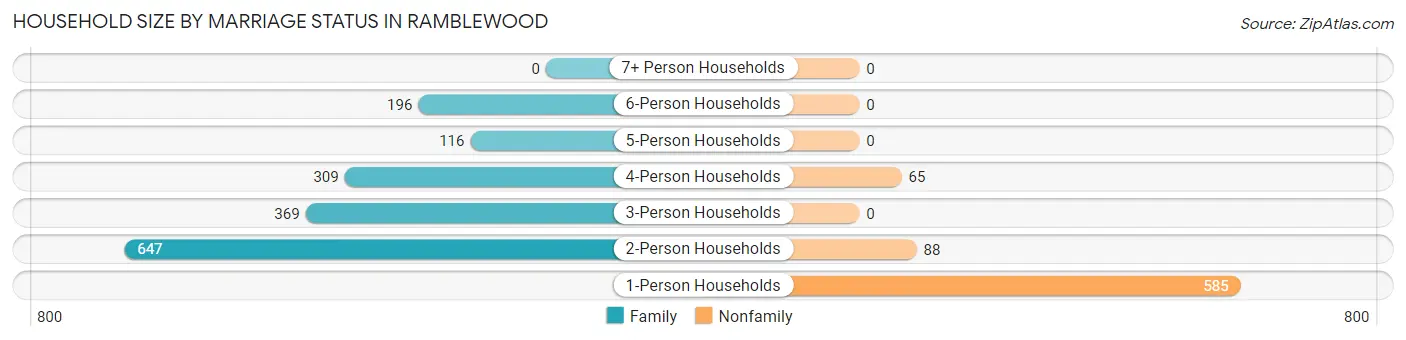
Out of a total of 2,375 households in Ramblewood, 1,637 (68.9%) are family households, while 738 (31.1%) are nonfamily households. The most numerous type of family households are 2-person households, comprising 647, and the most common type of nonfamily households are 1-person households, comprising 585.
| Household Size | Family Households | Nonfamily Households |
| 1-Person Households | - | 585 (24.6%) |
| 2-Person Households | 647 (27.2%) | 88 (3.7%) |
| 3-Person Households | 369 (15.5%) | 0 (0.0%) |
| 4-Person Households | 309 (13.0%) | 65 (2.7%) |
| 5-Person Households | 116 (4.9%) | 0 (0.0%) |
| 6-Person Households | 196 (8.3%) | 0 (0.0%) |
| 7+ Person Households | 0 (0.0%) | 0 (0.0%) |
| Total | 1,637 (68.9%) | 738 (31.1%) |
Female Fertility in Ramblewood
Fertility by Age in Ramblewood
Average fertility rate in Ramblewood is 45.0 births per 1,000 women. Women in the age bracket of 20 to 34 years have the highest fertility rate with 103.0 births per 1,000 women. Women in the age bracket of 20 to 34 years acount for 63.5% of all women with births.
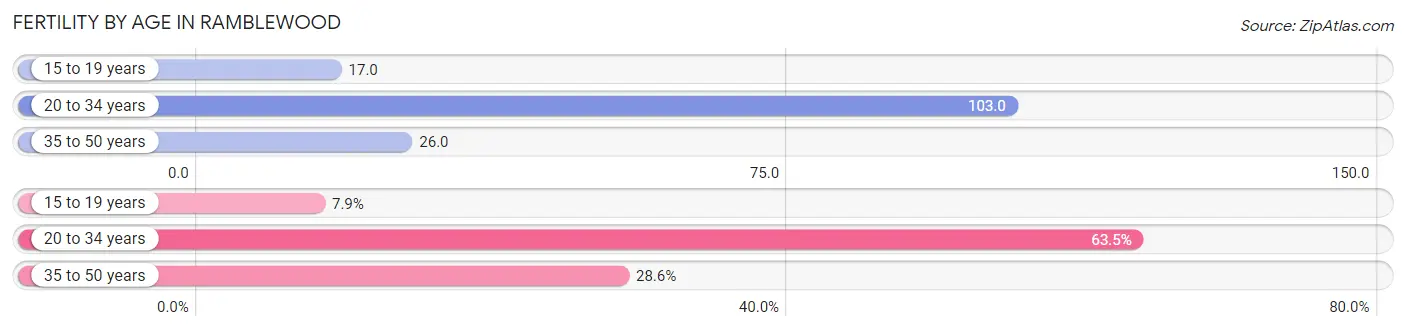
| Age Bracket | Women with Births | Births / 1,000 Women |
| 15 to 19 years | 5 (7.9%) | 17.0 |
| 20 to 34 years | 40 (63.5%) | 103.0 |
| 35 to 50 years | 18 (28.6%) | 26.0 |
| Total | 63 (100.0%) | 45.0 |
Fertility by Age by Marriage Status in Ramblewood
92.1% of women with births (63) in Ramblewood are married. The highest percentage of unmarried women with births falls into 15 to 19 years age bracket with 100.0% of them unmarried at the time of birth, while the lowest percentage of unmarried women with births belong to 20 to 34 years age bracket with 0.0% of them unmarried.
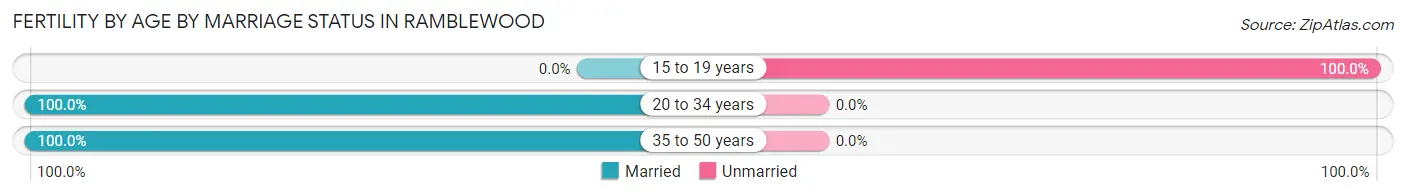
| Age Bracket | Married | Unmarried |
| 15 to 19 years | 0 (0.0%) | 5 (100.0%) |
| 20 to 34 years | 40 (100.0%) | 0 (0.0%) |
| 35 to 50 years | 18 (100.0%) | 0 (0.0%) |
| Total | 58 (92.1%) | 5 (7.9%) |
Fertility by Education in Ramblewood
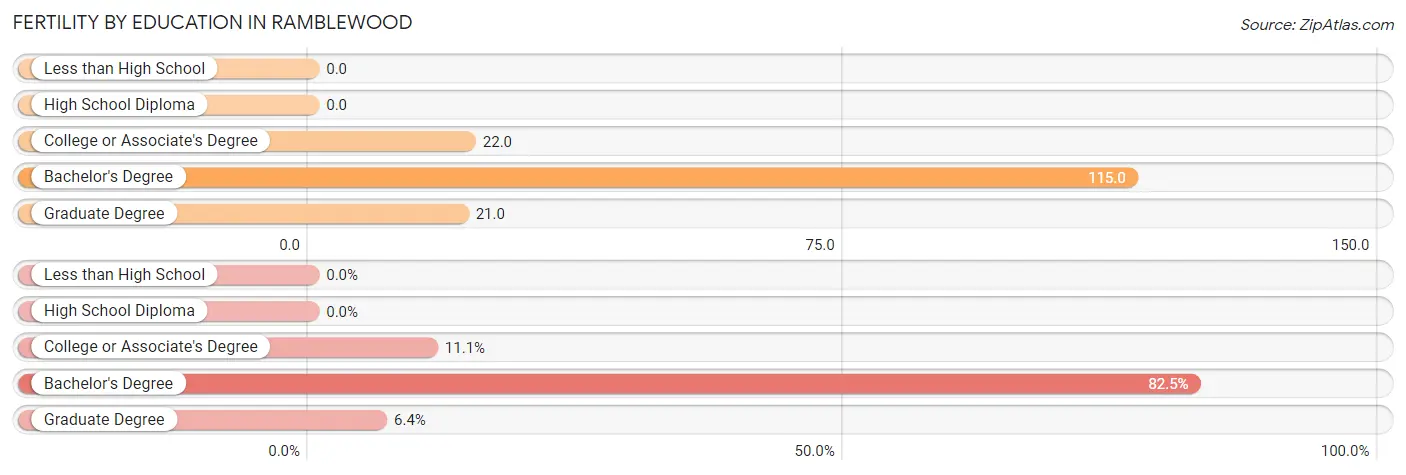
| Educational Attainment | Women with Births | Births / 1,000 Women |
| Less than High School | 0 (0.0%) | 0.0 |
| High School Diploma | 0 (0.0%) | 0.0 |
| College or Associate's Degree | 7 (11.1%) | 22.0 |
| Bachelor's Degree | 52 (82.5%) | 115.0 |
| Graduate Degree | 4 (6.4%) | 21.0 |
| Total | 63 (100.0%) | 45.0 |
Fertility by Education by Marriage Status in Ramblewood
7.9% of women with births in Ramblewood are unmarried. Women with the educational attainment of bachelor's degree are most likely to be married with 100.0% of them married at childbirth, while women with the educational attainment of college or associate's degree are least likely to be married with 71.4% of them unmarried at childbirth.
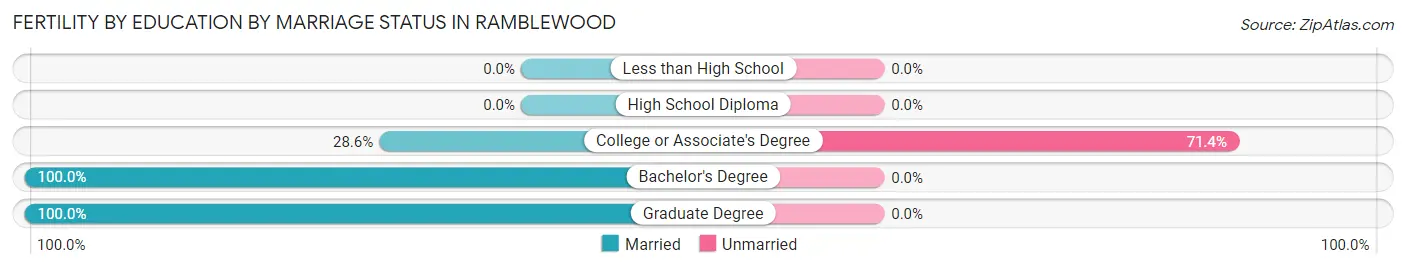
| Educational Attainment | Married | Unmarried |
| Less than High School | 0 (0.0%) | 0 (0.0%) |
| High School Diploma | 0 (0.0%) | 0 (0.0%) |
| College or Associate's Degree | 2 (28.6%) | 5 (71.4%) |
| Bachelor's Degree | 52 (100.0%) | 0 (0.0%) |
| Graduate Degree | 4 (100.0%) | 0 (0.0%) |
| Total | 58 (92.1%) | 5 (7.9%) |
Income in Ramblewood
Income Overview in Ramblewood
Per Capita Income in Ramblewood is $51,367, while median incomes of families and households are $116,174 and $104,938 respectively.
| Characteristic | Number | Measure |
| Per Capita Income | 6,320 | $51,367 |
| Median Family Income | 1,637 | $116,174 |
| Mean Family Income | 1,637 | $137,356 |
| Median Household Income | 2,375 | $104,938 |
| Mean Household Income | 2,375 | $136,493 |
| Income Deficit | 1,637 | $0 |
| Wage / Income Gap (%) | 6,320 | 35.87% |
| Wage / Income Gap ($) | 6,320 | 64.13¢ per $1 |
| Gini / Inequality Index | 6,320 | 0.40 |
Earnings by Sex in Ramblewood
Average Earnings in Ramblewood are $55,994, $66,037 for men and $42,348 for women, a difference of 35.9%.
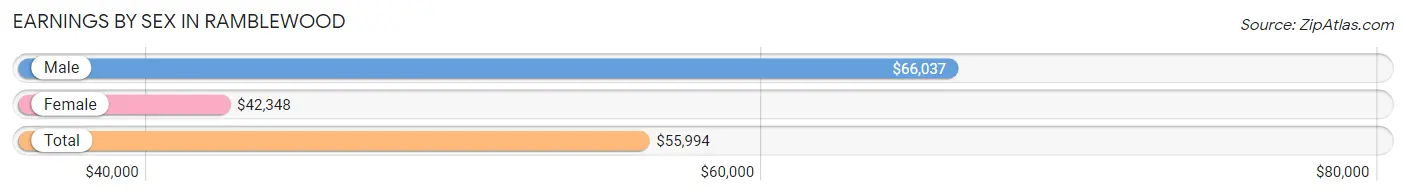
| Sex | Number | Average Earnings |
| Male | 2,079 (56.6%) | $66,037 |
| Female | 1,596 (43.4%) | $42,348 |
| Total | 3,675 (100.0%) | $55,994 |
Earnings by Sex by Income Bracket in Ramblewood
The most common earnings brackets in Ramblewood are $100,000+ for men (552 | 26.6%) and $75,000 to $99,999 for women (230 | 14.4%).

| Income | Male | Female |
| $2,499 or less | 75 (3.6%) | 190 (11.9%) |
| $2,500 to $4,999 | 91 (4.4%) | 25 (1.6%) |
| $5,000 to $7,499 | 161 (7.7%) | 149 (9.3%) |
| $7,500 to $9,999 | 64 (3.1%) | 16 (1.0%) |
| $10,000 to $12,499 | 39 (1.9%) | 15 (0.9%) |
| $12,500 to $14,999 | 20 (1.0%) | 18 (1.1%) |
| $15,000 to $17,499 | 32 (1.5%) | 9 (0.6%) |
| $17,500 to $19,999 | 26 (1.3%) | 29 (1.8%) |
| $20,000 to $22,499 | 0 (0.0%) | 17 (1.1%) |
| $22,500 to $24,999 | 43 (2.1%) | 161 (10.1%) |
| $25,000 to $29,999 | 53 (2.5%) | 22 (1.4%) |
| $30,000 to $34,999 | 61 (2.9%) | 89 (5.6%) |
| $35,000 to $39,999 | 5 (0.2%) | 27 (1.7%) |
| $40,000 to $44,999 | 31 (1.5%) | 61 (3.8%) |
| $45,000 to $49,999 | 34 (1.6%) | 67 (4.2%) |
| $50,000 to $54,999 | 3 (0.1%) | 115 (7.2%) |
| $55,000 to $64,999 | 226 (10.9%) | 77 (4.8%) |
| $65,000 to $74,999 | 225 (10.8%) | 93 (5.8%) |
| $75,000 to $99,999 | 338 (16.3%) | 230 (14.4%) |
| $100,000+ | 552 (26.6%) | 186 (11.7%) |
| Total | 2,079 (100.0%) | 1,596 (100.0%) |
Earnings by Sex by Educational Attainment in Ramblewood
Average earnings in Ramblewood are $84,430 for men and $52,553 for women, a difference of 37.8%. Men with an educational attainment of bachelor's degree enjoy the highest average annual earnings of $105,000, while those with less than high school education earn the least with $65,985. Women with an educational attainment of graduate degree earn the most with the average annual earnings of $82,885, while those with high school diploma education have the smallest earnings of $31,000.
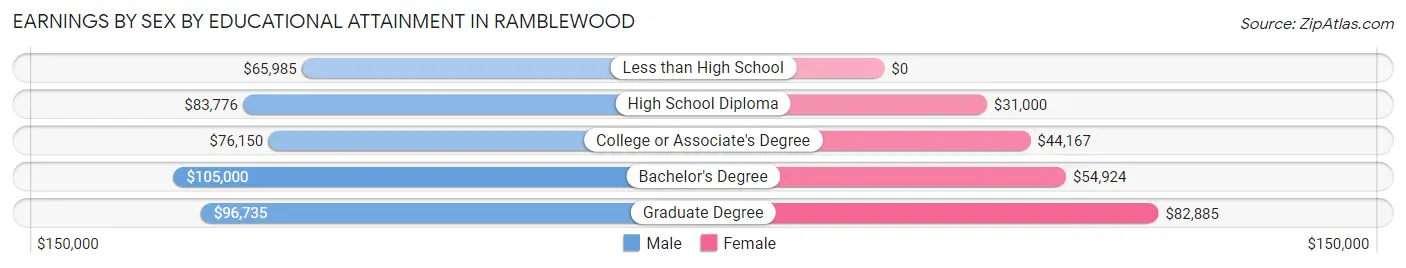
| Educational Attainment | Male Income | Female Income |
| Less than High School | $65,985 | $0 |
| High School Diploma | $83,776 | $31,000 |
| College or Associate's Degree | $76,150 | $44,167 |
| Bachelor's Degree | $105,000 | $54,924 |
| Graduate Degree | $96,735 | $82,885 |
| Total | $84,430 | $52,553 |
Family Income in Ramblewood
Family Income Brackets in Ramblewood
According to the Ramblewood family income data, there are 517 families falling into the $100,000 to $149,999 income range, which is the most common income bracket and makes up 31.6% of all families.
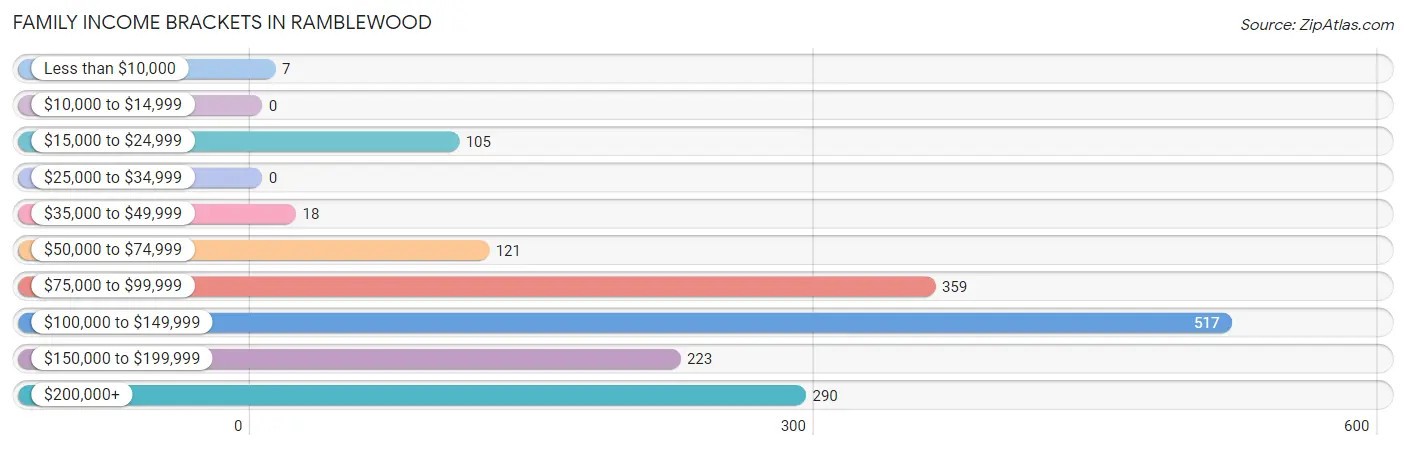
| Income Bracket | # Families | % Families |
| Less than $10,000 | 7 | 0.4% |
| $10,000 to $14,999 | 0 | 0.0% |
| $15,000 to $24,999 | 105 | 6.4% |
| $25,000 to $34,999 | 0 | 0.0% |
| $35,000 to $49,999 | 18 | 1.1% |
| $50,000 to $74,999 | 121 | 7.4% |
| $75,000 to $99,999 | 359 | 21.9% |
| $100,000 to $149,999 | 517 | 31.6% |
| $150,000 to $199,999 | 223 | 13.6% |
| $200,000+ | 290 | 17.7% |
Family Income by Famaliy Size in Ramblewood
5-person families (112 | 6.8%) account for the highest median family income in Ramblewood with $206,136 per family, while 2-person families (659 | 40.3%) have the highest median income of $51,748 per family member.
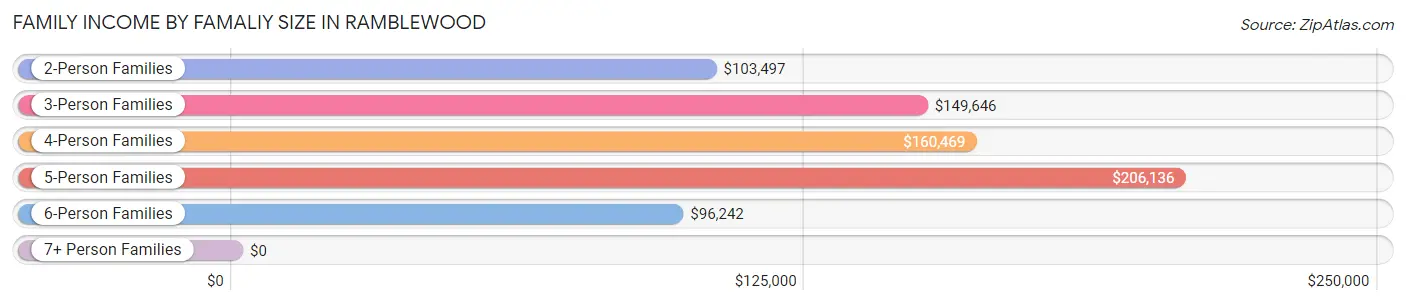
| Income Bracket | # Families | Median Income |
| 2-Person Families | 659 (40.3%) | $103,497 |
| 3-Person Families | 361 (22.1%) | $149,646 |
| 4-Person Families | 309 (18.9%) | $160,469 |
| 5-Person Families | 112 (6.8%) | $206,136 |
| 6-Person Families | 196 (12.0%) | $96,242 |
| 7+ Person Families | 0 (0.0%) | $0 |
| Total | 1,637 (100.0%) | $116,174 |
Family Income by Number of Earners in Ramblewood
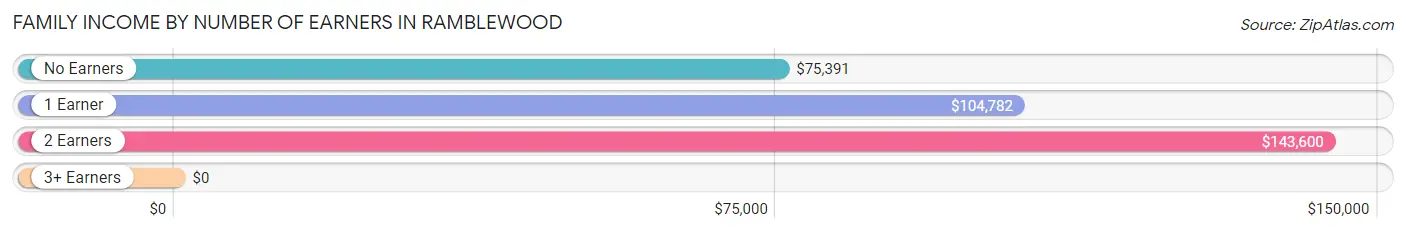
| Number of Earners | # Families | Median Income |
| No Earners | 279 (17.0%) | $75,391 |
| 1 Earner | 313 (19.1%) | $104,782 |
| 2 Earners | 668 (40.8%) | $143,600 |
| 3+ Earners | 377 (23.0%) | $0 |
| Total | 1,637 (100.0%) | $116,174 |
Household Income in Ramblewood
Household Income Brackets in Ramblewood
With 598 households falling in the category, the $100,000 to $149,999 income range is the most frequent in Ramblewood, accounting for 25.2% of all households.
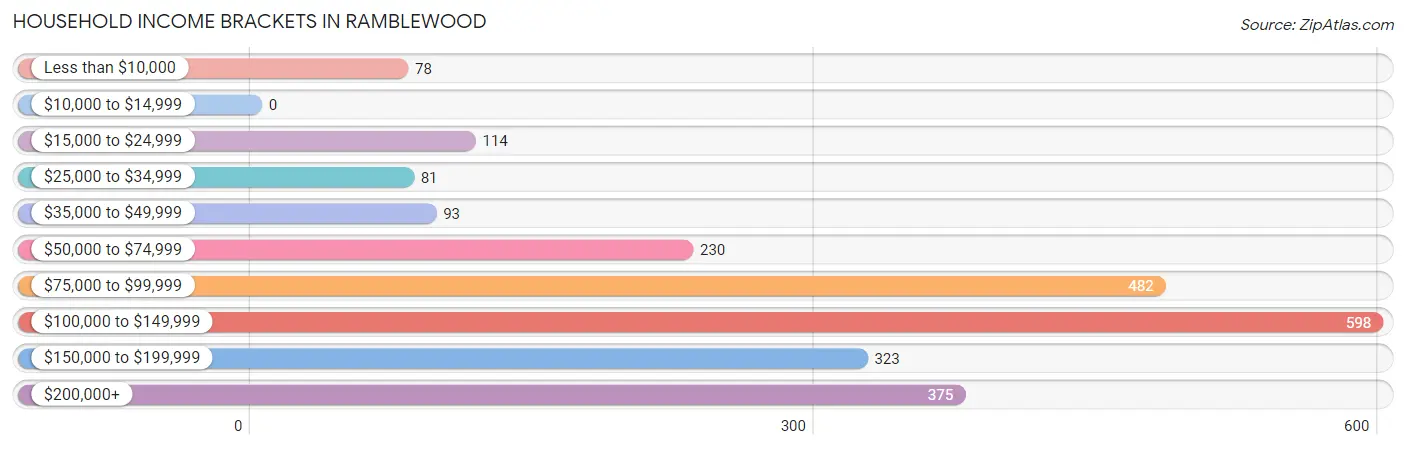
| Income Bracket | # Households | % Households |
| Less than $10,000 | 78 | 3.3% |
| $10,000 to $14,999 | 0 | 0.0% |
| $15,000 to $24,999 | 114 | 4.8% |
| $25,000 to $34,999 | 81 | 3.4% |
| $35,000 to $49,999 | 93 | 3.9% |
| $50,000 to $74,999 | 230 | 9.7% |
| $75,000 to $99,999 | 482 | 20.3% |
| $100,000 to $149,999 | 598 | 25.2% |
| $150,000 to $199,999 | 323 | 13.6% |
| $200,000+ | 375 | 15.8% |
Household Income by Householder Age in Ramblewood
The median household income in Ramblewood is $104,938, with the highest median household income of $190,500 found in the 15 to 24 years age bracket for the primary householder. A total of 88 households (3.7%) fall into this category. Meanwhile, the 65+ years age bracket for the primary householder has the lowest median household income of $87,656, with 511 households (21.5%) in this group.
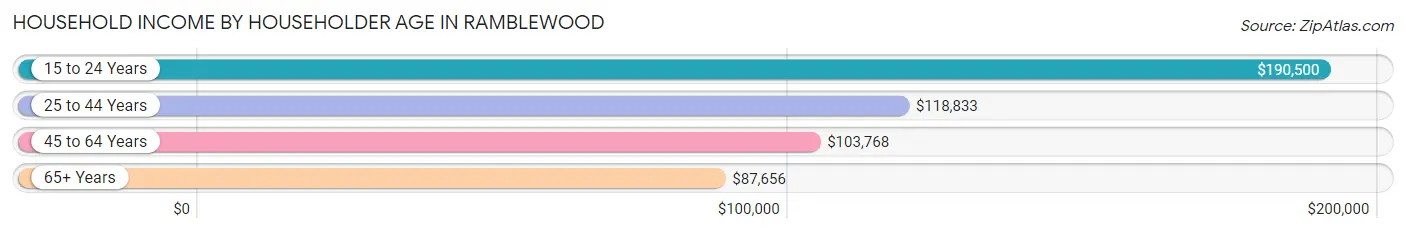
| Income Bracket | # Households | Median Income |
| 15 to 24 Years | 88 (3.7%) | $190,500 |
| 25 to 44 Years | 570 (24.0%) | $118,833 |
| 45 to 64 Years | 1,206 (50.8%) | $103,768 |
| 65+ Years | 511 (21.5%) | $87,656 |
| Total | 2,375 (100.0%) | $104,938 |
Poverty in Ramblewood
Income Below Poverty by Sex and Age in Ramblewood
With 3.0% poverty level for males and 3.5% for females among the residents of Ramblewood, 25 to 34 year old males and under 5 year old females are the most vulnerable to poverty, with 34 males (7.9%) and 12 females (14.0%) in their respective age groups living below the poverty level.
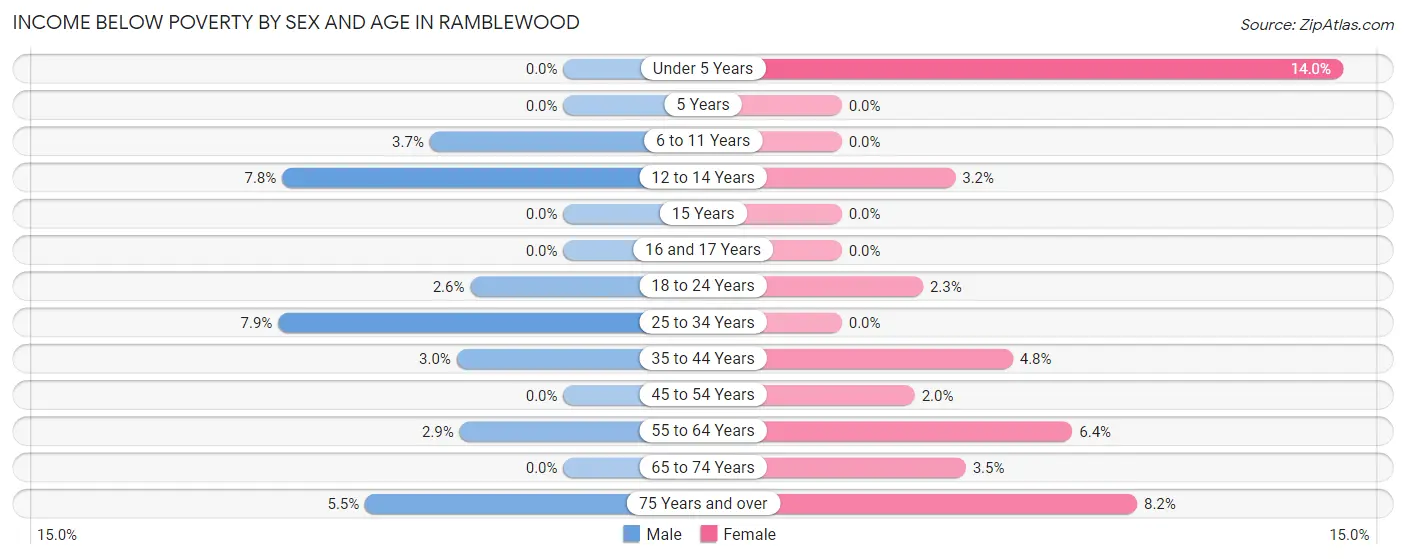
| Age Bracket | Male | Female |
| Under 5 Years | 0 (0.0%) | 12 (14.0%) |
| 5 Years | 0 (0.0%) | 0 (0.0%) |
| 6 to 11 Years | 9 (3.7%) | 0 (0.0%) |
| 12 to 14 Years | 9 (7.8%) | 6 (3.2%) |
| 15 Years | 0 (0.0%) | 0 (0.0%) |
| 16 and 17 Years | 0 (0.0%) | 0 (0.0%) |
| 18 to 24 Years | 16 (2.6%) | 5 (2.3%) |
| 25 to 34 Years | 34 (7.9%) | 0 (0.0%) |
| 35 to 44 Years | 6 (3.0%) | 17 (4.8%) |
| 45 to 54 Years | 0 (0.0%) | 10 (2.0%) |
| 55 to 64 Years | 12 (2.9%) | 34 (6.4%) |
| 65 to 74 Years | 0 (0.0%) | 9 (3.5%) |
| 75 Years and over | 8 (5.5%) | 12 (8.2%) |
| Total | 94 (3.0%) | 105 (3.5%) |
Income Above Poverty by Sex and Age in Ramblewood
According to the poverty statistics in Ramblewood, males aged under 5 years and females aged 5 years are the age groups that are most secure financially, with 100.0% of males and 100.0% of females in these age groups living above the poverty line.
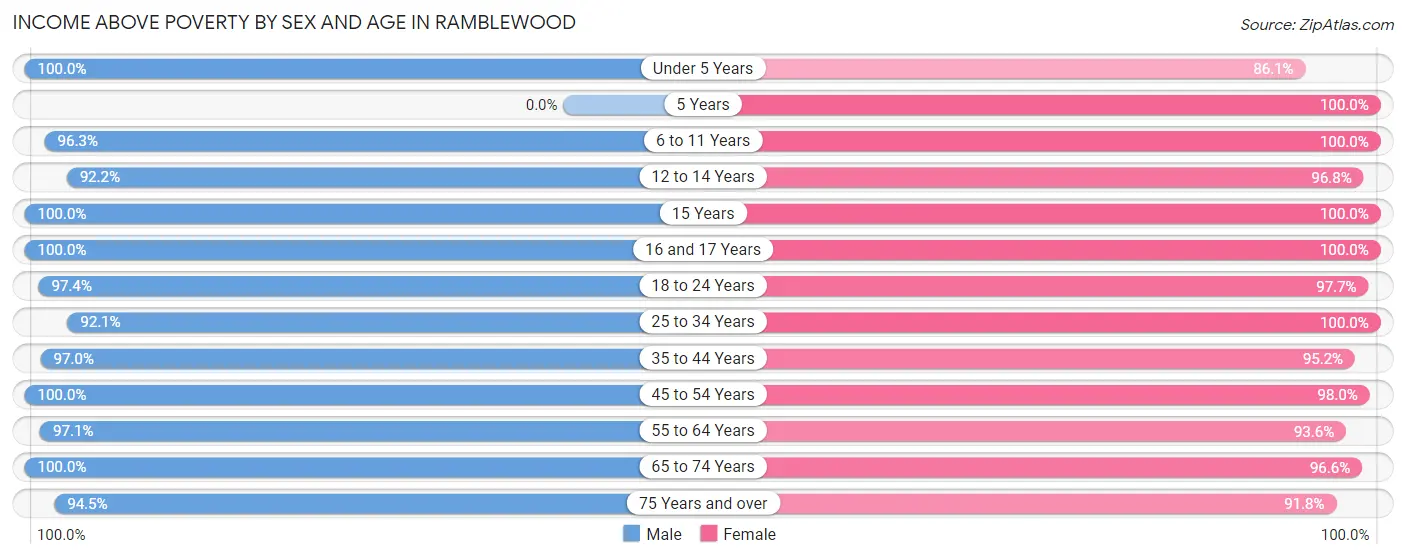
| Age Bracket | Male | Female |
| Under 5 Years | 108 (100.0%) | 74 (86.1%) |
| 5 Years | 0 (0.0%) | 23 (100.0%) |
| 6 to 11 Years | 233 (96.3%) | 251 (100.0%) |
| 12 to 14 Years | 106 (92.2%) | 184 (96.8%) |
| 15 Years | 26 (100.0%) | 29 (100.0%) |
| 16 and 17 Years | 30 (100.0%) | 124 (100.0%) |
| 18 to 24 Years | 601 (97.4%) | 216 (97.7%) |
| 25 to 34 Years | 394 (92.1%) | 317 (100.0%) |
| 35 to 44 Years | 196 (97.0%) | 340 (95.2%) |
| 45 to 54 Years | 557 (100.0%) | 483 (98.0%) |
| 55 to 64 Years | 403 (97.1%) | 496 (93.6%) |
| 65 to 74 Years | 259 (100.0%) | 252 (96.6%) |
| 75 Years and over | 137 (94.5%) | 134 (91.8%) |
| Total | 3,050 (97.0%) | 2,923 (96.5%) |
Income Below Poverty Among Married-Couple Families in Ramblewood
The poverty statistics for married-couple families in Ramblewood show that 1.0% or 14 of the total 1,373 families live below the poverty line. Families with no children have the highest poverty rate of 1.2%, comprising of 8 families. On the other hand, families with 3 or 4 children have the lowest poverty rate of 0.0%, which includes 0 families.
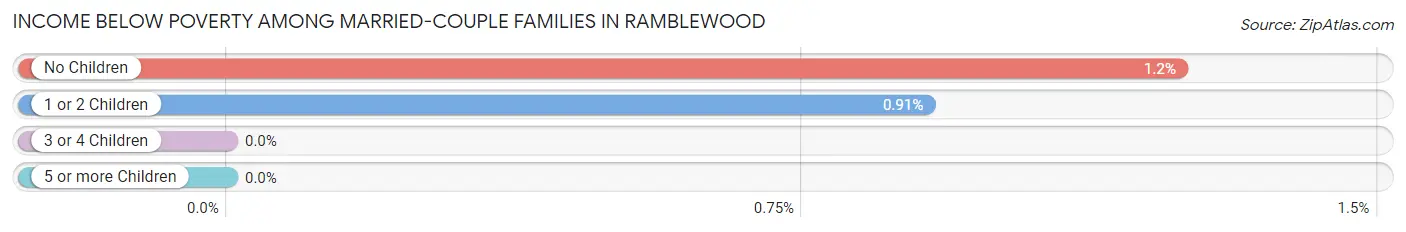
| Children | Above Poverty | Below Poverty |
| No Children | 639 (98.8%) | 8 (1.2%) |
| 1 or 2 Children | 654 (99.1%) | 6 (0.9%) |
| 3 or 4 Children | 66 (100.0%) | 0 (0.0%) |
| 5 or more Children | 0 (0.0%) | 0 (0.0%) |
| Total | 1,359 (99.0%) | 14 (1.0%) |
Income Below Poverty Among Single-Parent Households in Ramblewood
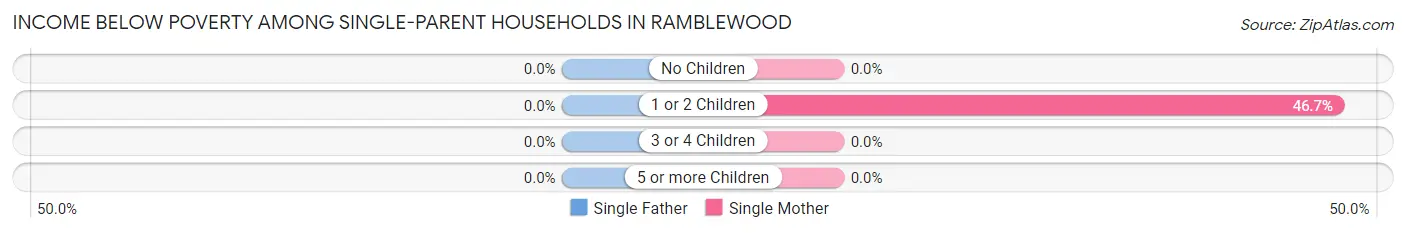
| Children | Single Father | Single Mother |
| No Children | 0 (0.0%) | 0 (0.0%) |
| 1 or 2 Children | 0 (0.0%) | 21 (46.7%) |
| 3 or 4 Children | 0 (0.0%) | 0 (0.0%) |
| 5 or more Children | 0 (0.0%) | 0 (0.0%) |
| Total | 0 (0.0%) | 21 (10.2%) |
Income Below Poverty Among Married-Couple vs Single-Parent Households in Ramblewood
The poverty data for Ramblewood shows that 14 of the married-couple family households (1.0%) and 21 of the single-parent households (8.0%) are living below the poverty level. Within the married-couple family households, those with no children have the highest poverty rate, with 8 households (1.2%) falling below the poverty line. Among the single-parent households, those with 1 or 2 children have the highest poverty rate, with 21 household (42.9%) living below poverty.
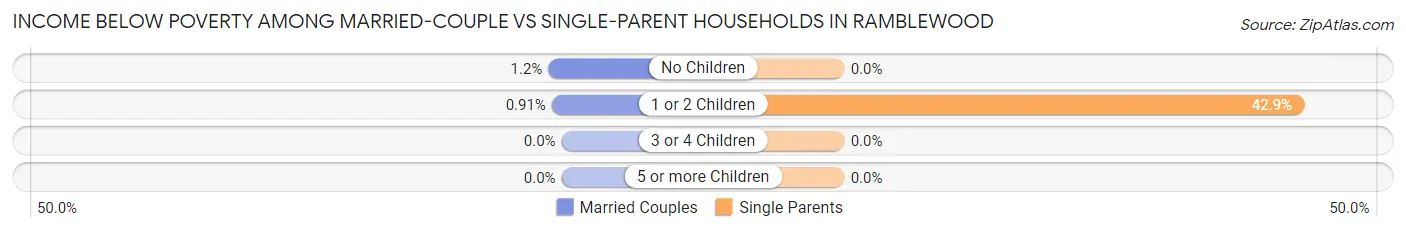
| Children | Married-Couple Families | Single-Parent Households |
| No Children | 8 (1.2%) | 0 (0.0%) |
| 1 or 2 Children | 6 (0.9%) | 21 (42.9%) |
| 3 or 4 Children | 0 (0.0%) | 0 (0.0%) |
| 5 or more Children | 0 (0.0%) | 0 (0.0%) |
| Total | 14 (1.0%) | 21 (8.0%) |
Employment Characteristics in Ramblewood
Employment by Class of Employer in Ramblewood
Among the 3,283 employed individuals in Ramblewood, private company employees (2,083 | 63.4%), self-employed (incorporated) (416 | 12.7%), and not-for-profit organizations (231 | 7.0%) make up the most common classes of employment.
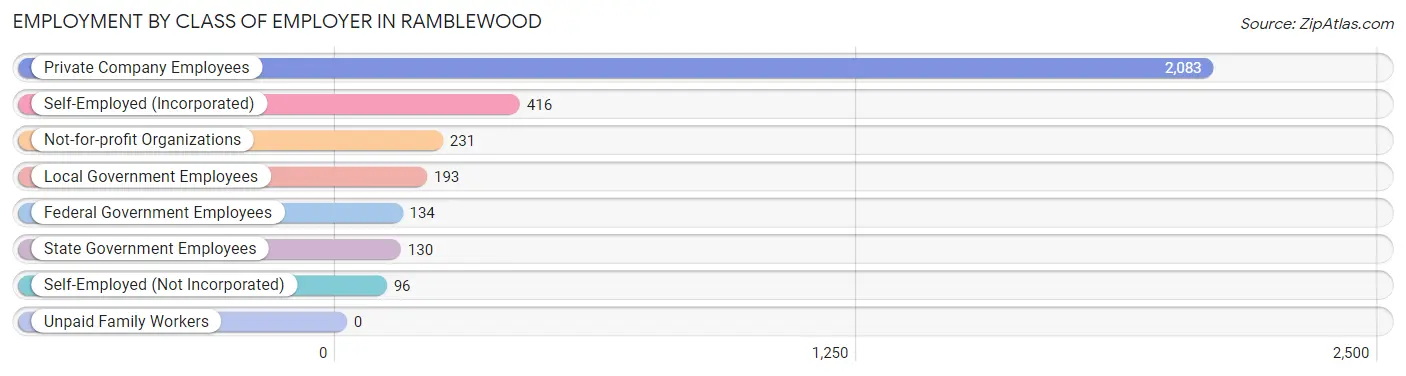
| Employer Class | # Employees | % Employees |
| Private Company Employees | 2,083 | 63.4% |
| Self-Employed (Incorporated) | 416 | 12.7% |
| Self-Employed (Not Incorporated) | 96 | 2.9% |
| Not-for-profit Organizations | 231 | 7.0% |
| Local Government Employees | 193 | 5.9% |
| State Government Employees | 130 | 4.0% |
| Federal Government Employees | 134 | 4.1% |
| Unpaid Family Workers | 0 | 0.0% |
| Total | 3,283 | 100.0% |
Employment Status by Age in Ramblewood
According to the labor force statistics for Ramblewood, out of the total population over 16 years of age (5,226), 66.8% or 3,491 individuals are in the labor force, with 5.8% or 202 of them unemployed. The age group with the highest labor force participation rate is 25 to 29 years, with 95.6% or 431 individuals in the labor force. Within the labor force, the 16 to 19 years age range has the highest percentage of unemployed individuals, with 27.6% or 135 of them being unemployed.
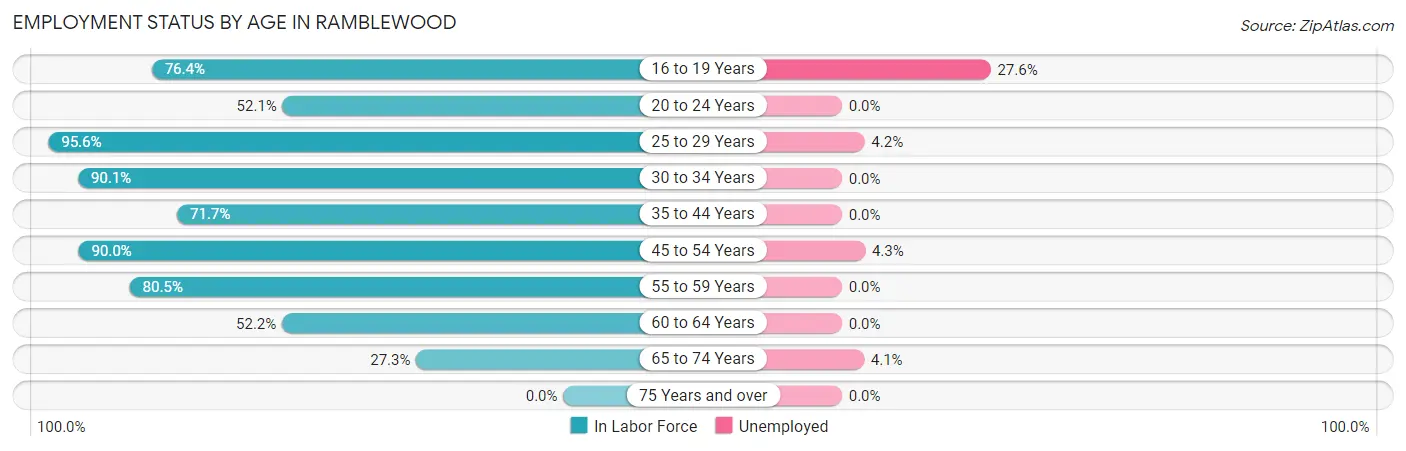
| Age Bracket | In Labor Force | Unemployed |
| 16 to 19 Years | 490 (76.4%) | 135 (27.6%) |
| 20 to 24 Years | 183 (52.1%) | 0 (0.0%) |
| 25 to 29 Years | 431 (95.6%) | 18 (4.2%) |
| 30 to 34 Years | 265 (90.1%) | 0 (0.0%) |
| 35 to 44 Years | 401 (71.7%) | 0 (0.0%) |
| 45 to 54 Years | 950 (90.0%) | 41 (4.3%) |
| 55 to 59 Years | 351 (80.5%) | 0 (0.0%) |
| 60 to 64 Years | 277 (52.2%) | 0 (0.0%) |
| 65 to 74 Years | 146 (27.3%) | 6 (4.1%) |
| 75 Years and over | 0 (0.0%) | 0 (0.0%) |
| Total | 3,491 (66.8%) | 202 (5.8%) |
Employment Status by Educational Attainment in Ramblewood
According to labor force statistics for Ramblewood, 80.4% of individuals (2,674) out of the total population between 25 and 64 years of age (3,326) are in the labor force, with 2.2% or 59 of them being unemployed. The group with the highest labor force participation rate are those with the educational attainment of less than high school, with 87.3% or 322 individuals in the labor force. Within the labor force, individuals with bachelor's degree or higher education have the highest percentage of unemployment, with 3.4% or 46 of them being unemployed.
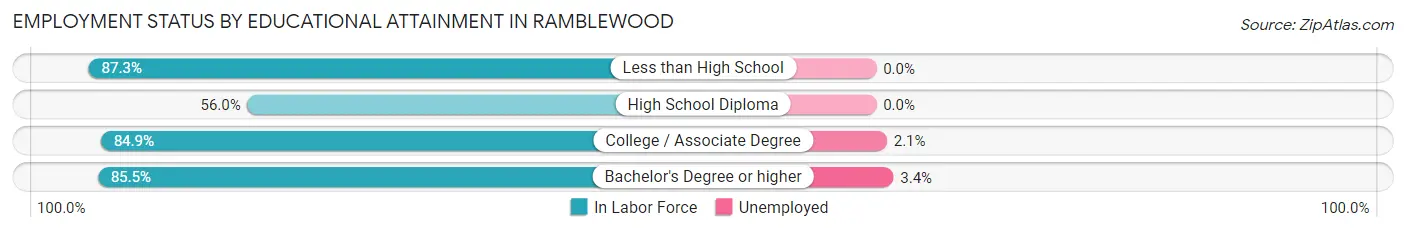
| Educational Attainment | In Labor Force | Unemployed |
| Less than High School | 322 (87.3%) | 0 (0.0%) |
| High School Diploma | 326 (56.0%) | 0 (0.0%) |
| College / Associate Degree | 684 (84.9%) | 17 (2.1%) |
| Bachelor's Degree or higher | 1,341 (85.5%) | 53 (3.4%) |
| Total | 2,674 (80.4%) | 73 (2.2%) |
Employment Occupations by Sex in Ramblewood
Management, Business, Science and Arts Occupations
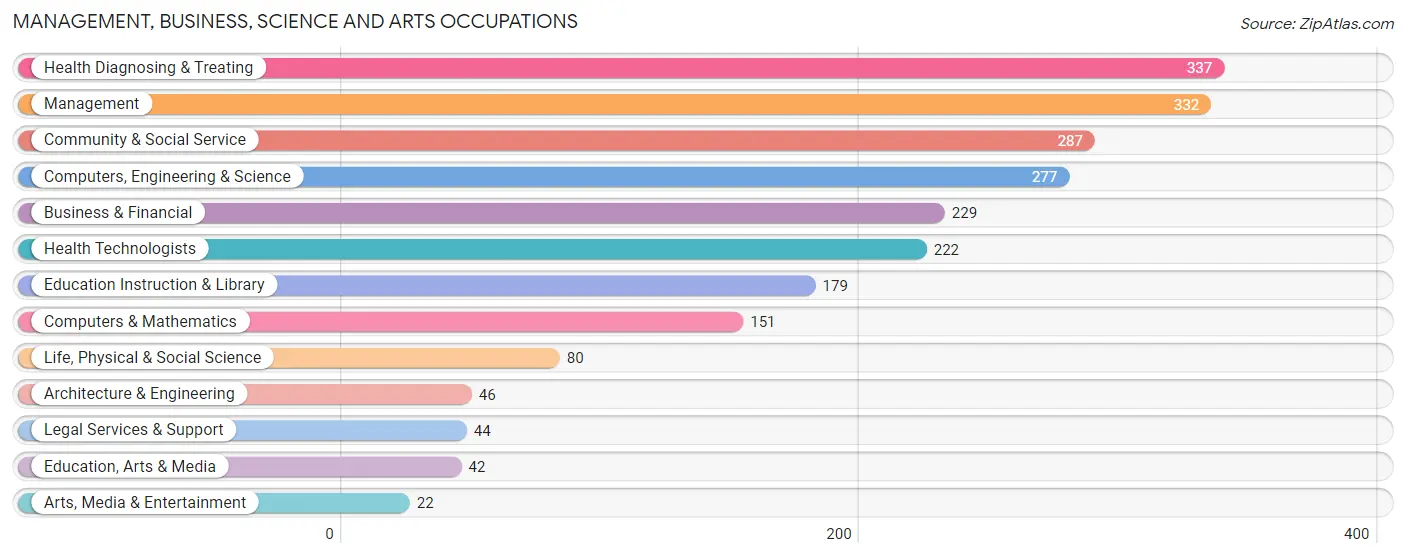
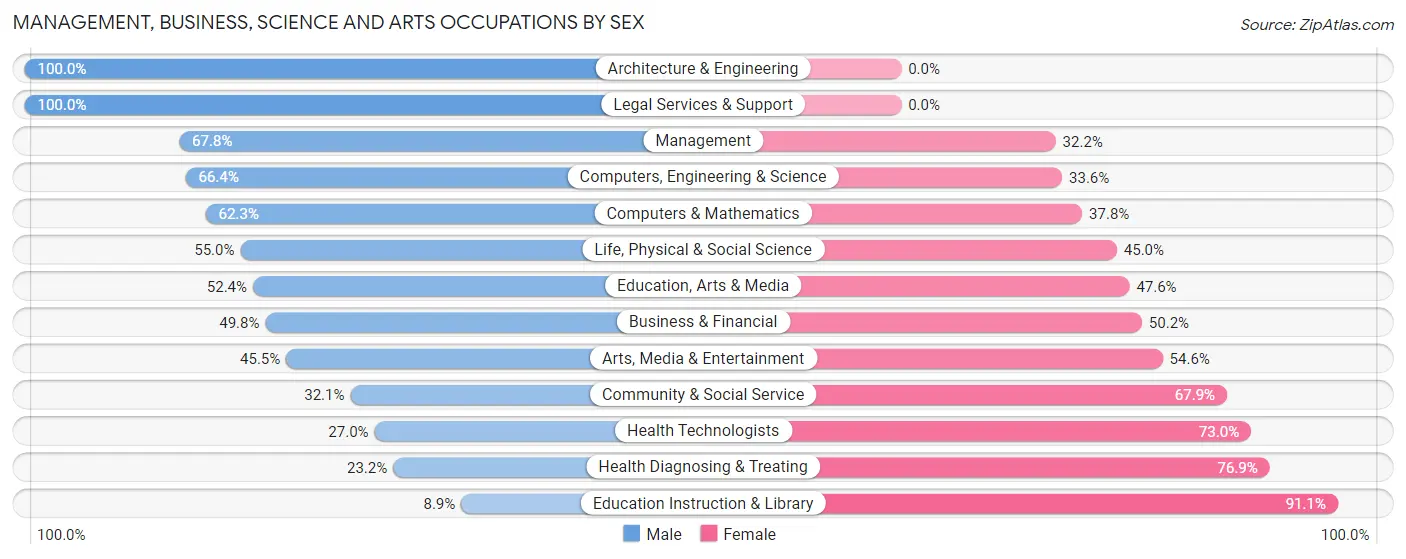
The most common Management, Business, Science and Arts occupations in Ramblewood are Health Diagnosing & Treating (337 | 10.3%), Management (332 | 10.2%), Community & Social Service (287 | 8.8%), Computers, Engineering & Science (277 | 8.5%), and Business & Financial (229 | 7.0%).
Management, Business, Science and Arts Occupations by Sex
Within the Management, Business, Science and Arts occupations in Ramblewood, the most male-oriented occupations are Architecture & Engineering (100.0%), Legal Services & Support (100.0%), and Management (67.8%), while the most female-oriented occupations are Education Instruction & Library (91.1%), Health Diagnosing & Treating (76.8%), and Health Technologists (73.0%).
| Occupation | Male | Female |
| Management | 225 (67.8%) | 107 (32.2%) |
| Business & Financial | 114 (49.8%) | 115 (50.2%) |
| Computers, Engineering & Science | 184 (66.4%) | 93 (33.6%) |
| Computers & Mathematics | 94 (62.3%) | 57 (37.8%) |
| Architecture & Engineering | 46 (100.0%) | 0 (0.0%) |
| Life, Physical & Social Science | 44 (55.0%) | 36 (45.0%) |
| Community & Social Service | 92 (32.1%) | 195 (67.9%) |
| Education, Arts & Media | 22 (52.4%) | 20 (47.6%) |
| Legal Services & Support | 44 (100.0%) | 0 (0.0%) |
| Education Instruction & Library | 16 (8.9%) | 163 (91.1%) |
| Arts, Media & Entertainment | 10 (45.5%) | 12 (54.5%) |
| Health Diagnosing & Treating | 78 (23.2%) | 259 (76.8%) |
| Health Technologists | 60 (27.0%) | 162 (73.0%) |
| Total (Category) | 693 (47.4%) | 769 (52.6%) |
| Total (Overall) | 1,935 (59.3%) | 1,327 (40.7%) |
Services Occupations
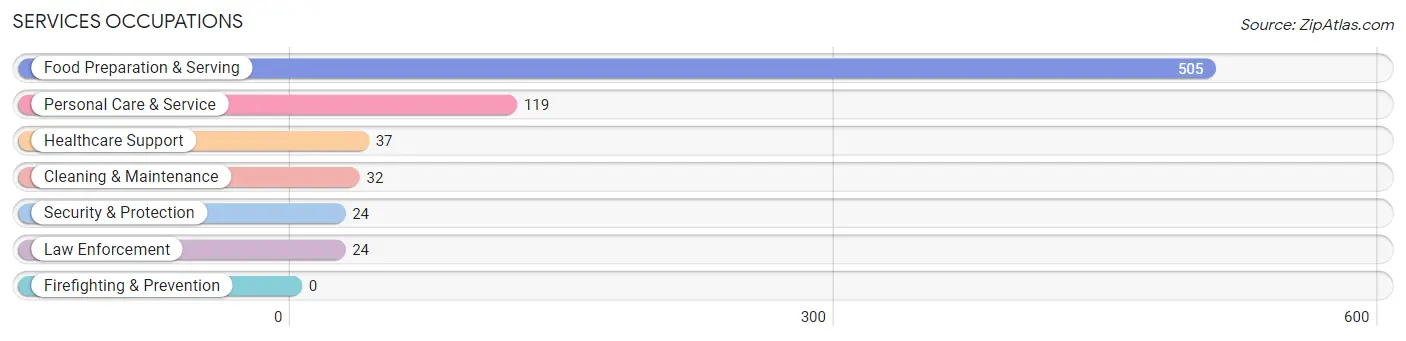
The most common Services occupations in Ramblewood are Food Preparation & Serving (505 | 15.5%), Personal Care & Service (119 | 3.6%), Healthcare Support (37 | 1.1%), Cleaning & Maintenance (32 | 1.0%), and Security & Protection (24 | 0.7%).
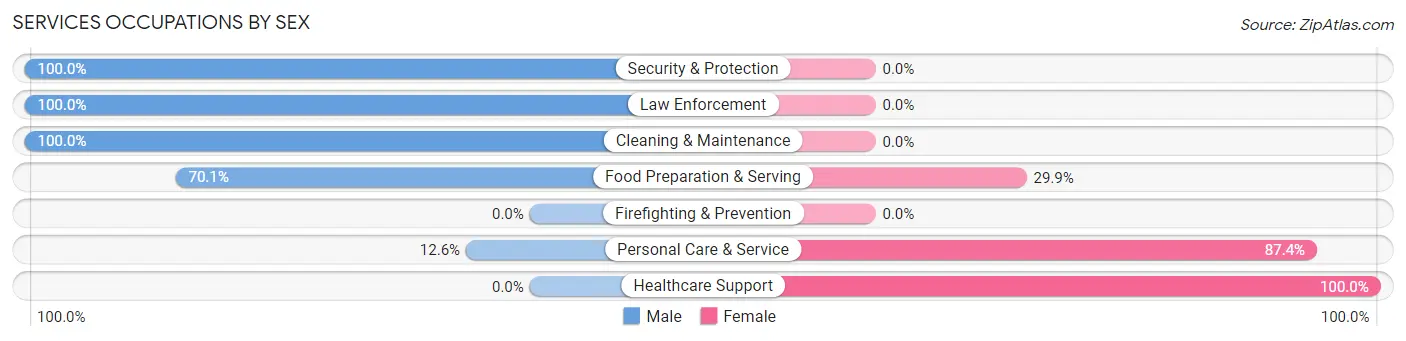
Services Occupations by Sex
Within the Services occupations in Ramblewood, the most male-oriented occupations are Security & Protection (100.0%), Law Enforcement (100.0%), and Cleaning & Maintenance (100.0%), while the most female-oriented occupations are Healthcare Support (100.0%), Personal Care & Service (87.4%), and Food Preparation & Serving (29.9%).
| Occupation | Male | Female |
| Healthcare Support | 0 (0.0%) | 37 (100.0%) |
| Security & Protection | 24 (100.0%) | 0 (0.0%) |
| Firefighting & Prevention | 0 (0.0%) | 0 (0.0%) |
| Law Enforcement | 24 (100.0%) | 0 (0.0%) |
| Food Preparation & Serving | 354 (70.1%) | 151 (29.9%) |
| Cleaning & Maintenance | 32 (100.0%) | 0 (0.0%) |
| Personal Care & Service | 15 (12.6%) | 104 (87.4%) |
| Total (Category) | 425 (59.3%) | 292 (40.7%) |
| Total (Overall) | 1,935 (59.3%) | 1,327 (40.7%) |
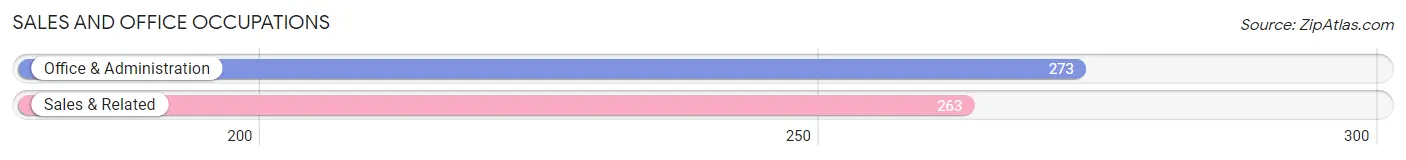
Sales and Office Occupations
The most common Sales and Office occupations in Ramblewood are Office & Administration (273 | 8.4%), and Sales & Related (263 | 8.1%).
Sales and Office Occupations by Sex
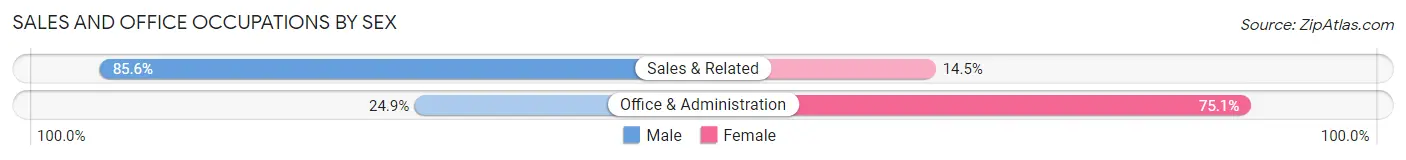
| Occupation | Male | Female |
| Sales & Related | 225 (85.6%) | 38 (14.4%) |
| Office & Administration | 68 (24.9%) | 205 (75.1%) |
| Total (Category) | 293 (54.7%) | 243 (45.3%) |
| Total (Overall) | 1,935 (59.3%) | 1,327 (40.7%) |
Natural Resources, Construction and Maintenance Occupations
The most common Natural Resources, Construction and Maintenance occupations in Ramblewood are Installation, Maintenance & Repair (85 | 2.6%), and Construction & Extraction (72 | 2.2%).
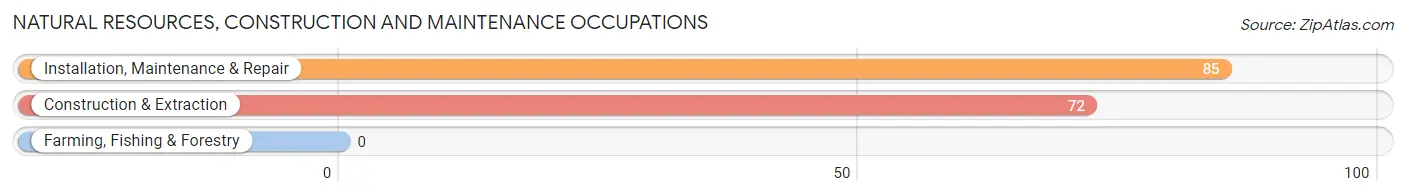
Natural Resources, Construction and Maintenance Occupations by Sex

| Occupation | Male | Female |
| Farming, Fishing & Forestry | 0 (0.0%) | 0 (0.0%) |
| Construction & Extraction | 59 (81.9%) | 13 (18.1%) |
| Installation, Maintenance & Repair | 85 (100.0%) | 0 (0.0%) |
| Total (Category) | 144 (91.7%) | 13 (8.3%) |
| Total (Overall) | 1,935 (59.3%) | 1,327 (40.7%) |
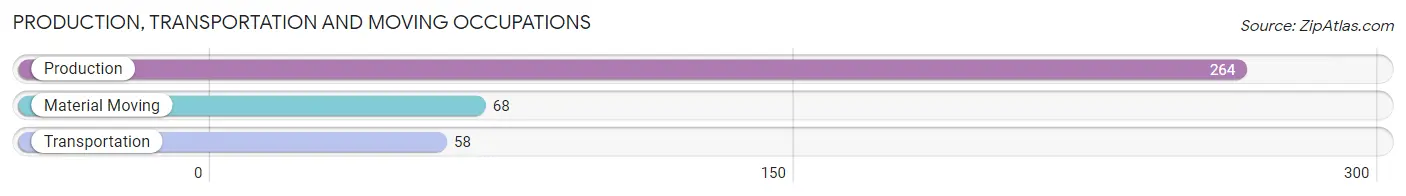
Production, Transportation and Moving Occupations
The most common Production, Transportation and Moving occupations in Ramblewood are Production (264 | 8.1%), Material Moving (68 | 2.1%), and Transportation (58 | 1.8%).
Production, Transportation and Moving Occupations by Sex
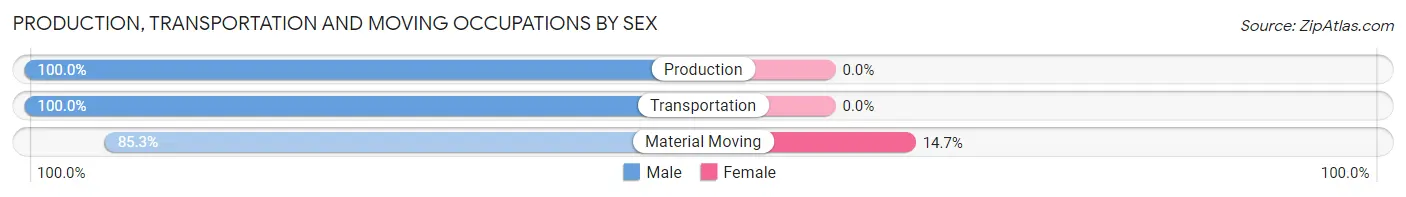
| Occupation | Male | Female |
| Production | 264 (100.0%) | 0 (0.0%) |
| Transportation | 58 (100.0%) | 0 (0.0%) |
| Material Moving | 58 (85.3%) | 10 (14.7%) |
| Total (Category) | 380 (97.4%) | 10 (2.6%) |
| Total (Overall) | 1,935 (59.3%) | 1,327 (40.7%) |
Employment Industries by Sex in Ramblewood
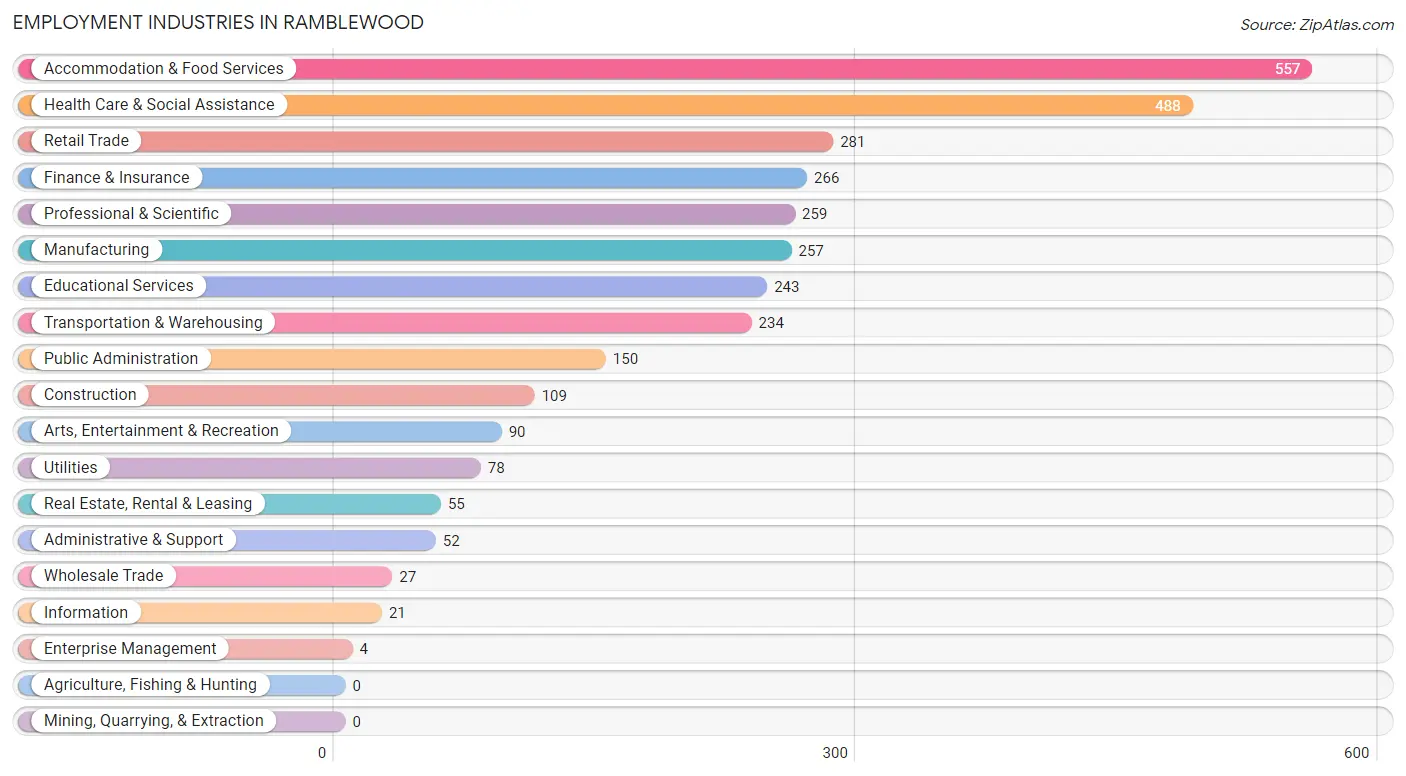
Employment Industries in Ramblewood
The major employment industries in Ramblewood include Accommodation & Food Services (557 | 17.1%), Health Care & Social Assistance (488 | 15.0%), Retail Trade (281 | 8.6%), Finance & Insurance (266 | 8.2%), and Professional & Scientific (259 | 7.9%).
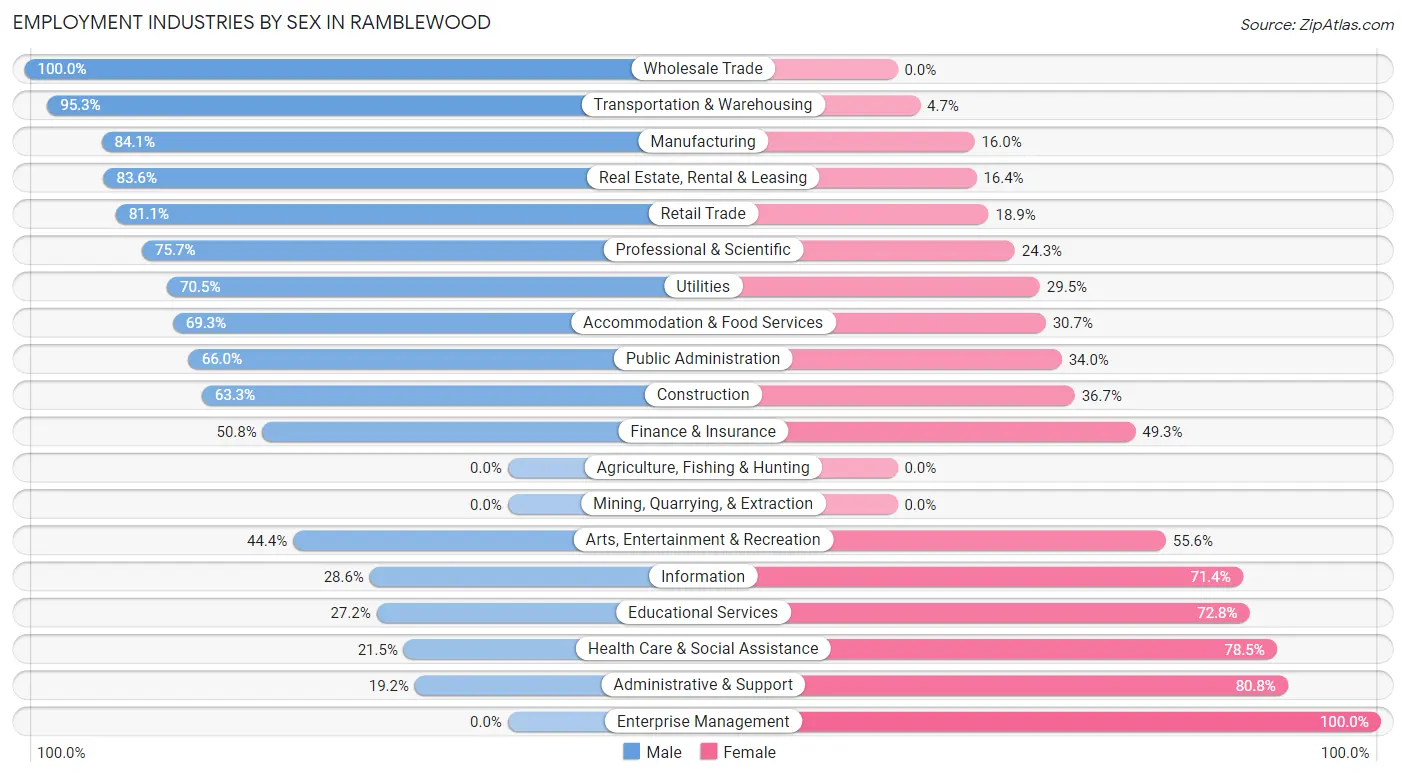
Employment Industries by Sex in Ramblewood
The Ramblewood industries that see more men than women are Wholesale Trade (100.0%), Transportation & Warehousing (95.3%), and Manufacturing (84.1%), whereas the industries that tend to have a higher number of women are Enterprise Management (100.0%), Administrative & Support (80.8%), and Health Care & Social Assistance (78.5%).
| Industry | Male | Female |
| Agriculture, Fishing & Hunting | 0 (0.0%) | 0 (0.0%) |
| Mining, Quarrying, & Extraction | 0 (0.0%) | 0 (0.0%) |
| Construction | 69 (63.3%) | 40 (36.7%) |
| Manufacturing | 216 (84.1%) | 41 (16.0%) |
| Wholesale Trade | 27 (100.0%) | 0 (0.0%) |
| Retail Trade | 228 (81.1%) | 53 (18.9%) |
| Transportation & Warehousing | 223 (95.3%) | 11 (4.7%) |
| Utilities | 55 (70.5%) | 23 (29.5%) |
| Information | 6 (28.6%) | 15 (71.4%) |
| Finance & Insurance | 135 (50.7%) | 131 (49.2%) |
| Real Estate, Rental & Leasing | 46 (83.6%) | 9 (16.4%) |
| Professional & Scientific | 196 (75.7%) | 63 (24.3%) |
| Enterprise Management | 0 (0.0%) | 4 (100.0%) |
| Administrative & Support | 10 (19.2%) | 42 (80.8%) |
| Educational Services | 66 (27.2%) | 177 (72.8%) |
| Health Care & Social Assistance | 105 (21.5%) | 383 (78.5%) |
| Arts, Entertainment & Recreation | 40 (44.4%) | 50 (55.6%) |
| Accommodation & Food Services | 386 (69.3%) | 171 (30.7%) |
| Public Administration | 99 (66.0%) | 51 (34.0%) |
| Total | 1,935 (59.3%) | 1,327 (40.7%) |
Education in Ramblewood
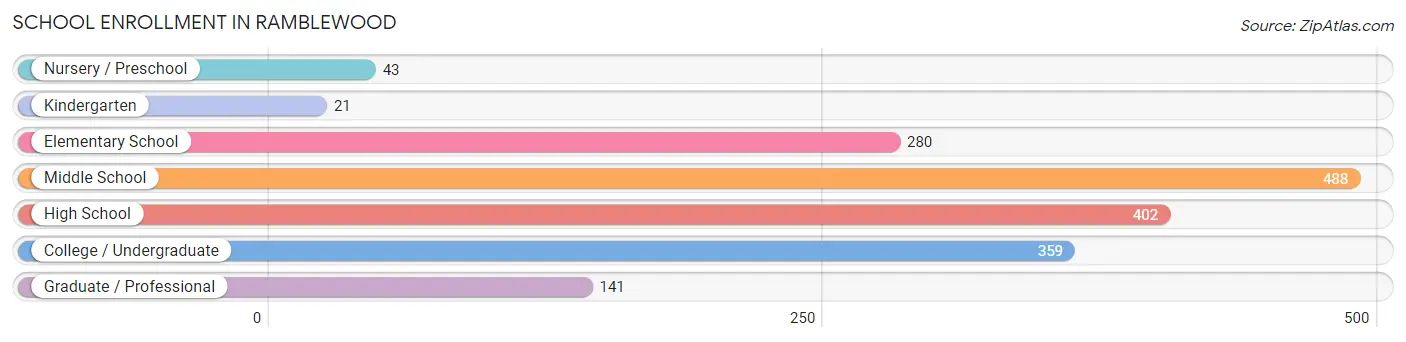
School Enrollment in Ramblewood
The most common levels of schooling among the 1,734 students in Ramblewood are middle school (488 | 28.1%), high school (402 | 23.2%), and college / undergraduate (359 | 20.7%).
| School Level | # Students | % Students |
| Nursery / Preschool | 43 | 2.5% |
| Kindergarten | 21 | 1.2% |
| Elementary School | 280 | 16.2% |
| Middle School | 488 | 28.1% |
| High School | 402 | 23.2% |
| College / Undergraduate | 359 | 20.7% |
| Graduate / Professional | 141 | 8.1% |
| Total | 1,734 | 100.0% |
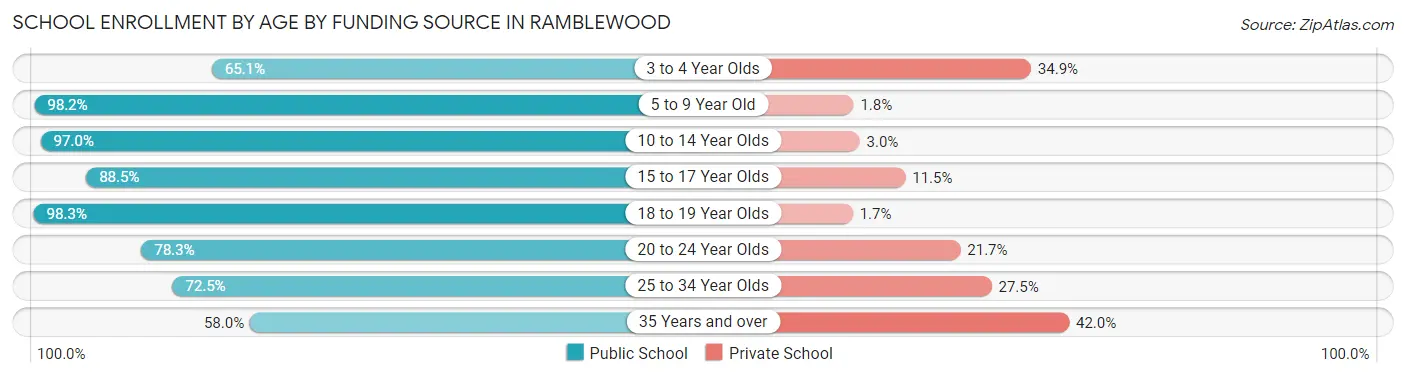
School Enrollment by Age by Funding Source in Ramblewood
Out of a total of 1,734 students who are enrolled in schools in Ramblewood, 154 (8.9%) attend a private institution, while the remaining 1,580 (91.1%) are enrolled in public schools. The age group of 35 years and over has the highest likelihood of being enrolled in private schools, with 34 (42.0% in the age bracket) enrolled. Conversely, the age group of 18 to 19 year olds has the lowest likelihood of being enrolled in a private school, with 352 (98.3% in the age bracket) attending a public institution.
| Age Bracket | Public School | Private School |
| 3 to 4 Year Olds | 28 (65.1%) | 15 (34.9%) |
| 5 to 9 Year Old | 270 (98.2%) | 5 (1.8%) |
| 10 to 14 Year Olds | 522 (97.0%) | 16 (3.0%) |
| 15 to 17 Year Olds | 185 (88.5%) | 24 (11.5%) |
| 18 to 19 Year Olds | 352 (98.3%) | 6 (1.7%) |
| 20 to 24 Year Olds | 126 (78.3%) | 35 (21.7%) |
| 25 to 34 Year Olds | 50 (72.5%) | 19 (27.5%) |
| 35 Years and over | 47 (58.0%) | 34 (42.0%) |
| Total | 1,580 (91.1%) | 154 (8.9%) |
Educational Attainment by Field of Study in Ramblewood
Business (445 | 20.4%), science & technology (299 | 13.7%), education (261 | 12.0%), engineering (214 | 9.8%), and psychology (160 | 7.3%) are the most common fields of study among 2,179 individuals in Ramblewood who have obtained a bachelor's degree or higher.
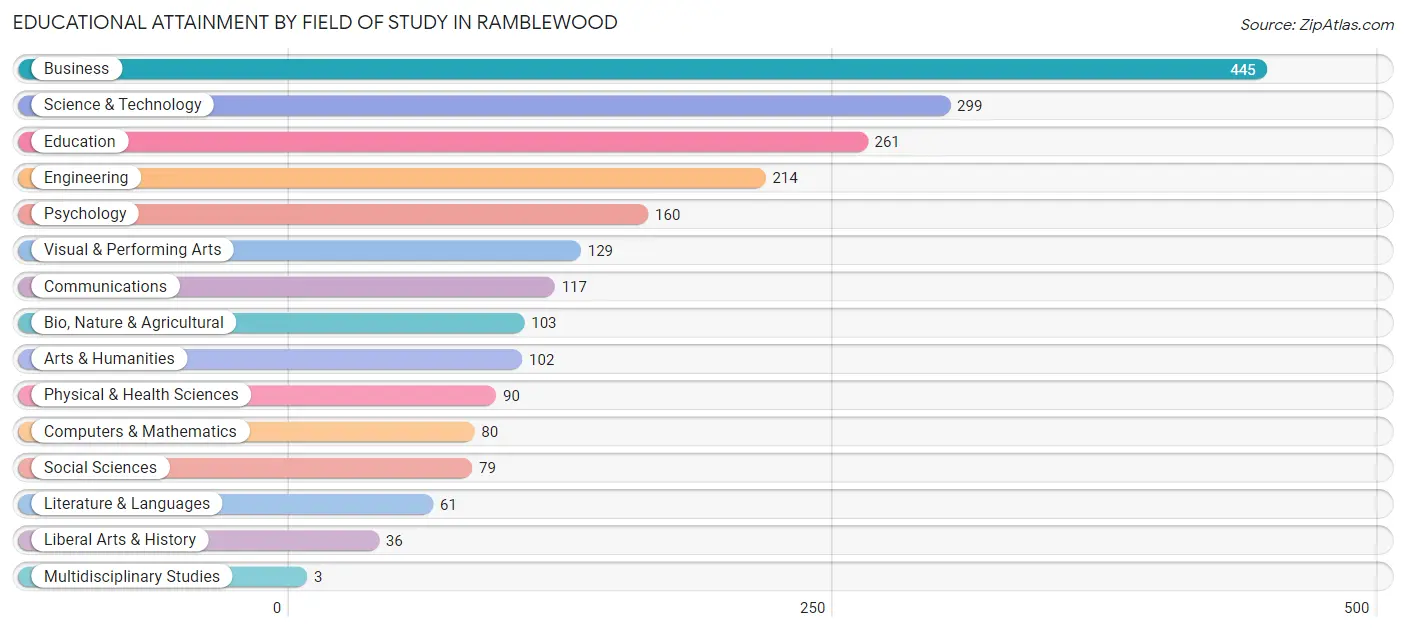
| Field of Study | # Graduates | % Graduates |
| Computers & Mathematics | 80 | 3.7% |
| Bio, Nature & Agricultural | 103 | 4.7% |
| Physical & Health Sciences | 90 | 4.1% |
| Psychology | 160 | 7.3% |
| Social Sciences | 79 | 3.6% |
| Engineering | 214 | 9.8% |
| Multidisciplinary Studies | 3 | 0.1% |
| Science & Technology | 299 | 13.7% |
| Business | 445 | 20.4% |
| Education | 261 | 12.0% |
| Literature & Languages | 61 | 2.8% |
| Liberal Arts & History | 36 | 1.7% |
| Visual & Performing Arts | 129 | 5.9% |
| Communications | 117 | 5.4% |
| Arts & Humanities | 102 | 4.7% |
| Total | 2,179 | 100.0% |
Transportation & Commute in Ramblewood
Vehicle Availability by Sex in Ramblewood
The most prevalent vehicle ownership categories in Ramblewood are males with 2 vehicles (957, accounting for 48.7%) and females with 2 vehicles (598, making up 72.7%).
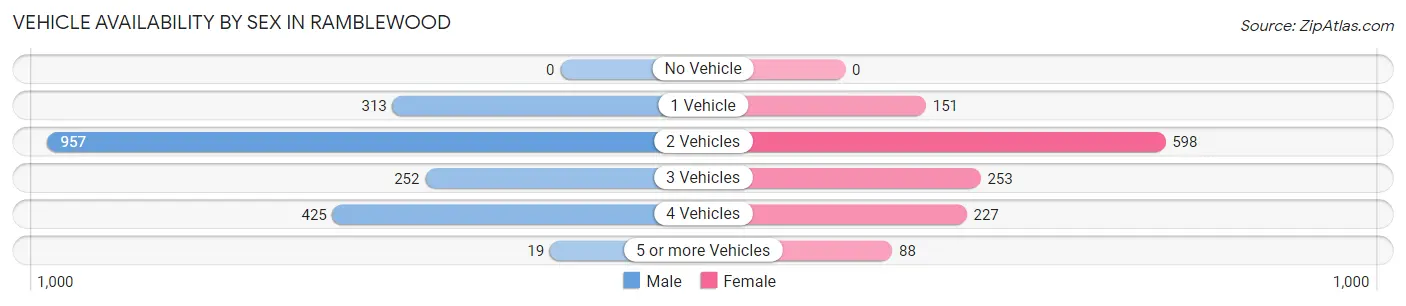
| Vehicles Available | Male | Female |
| No Vehicle | 0 (0.0%) | 0 (0.0%) |
| 1 Vehicle | 313 (15.9%) | 151 (11.5%) |
| 2 Vehicles | 957 (48.7%) | 598 (45.4%) |
| 3 Vehicles | 252 (12.8%) | 253 (19.2%) |
| 4 Vehicles | 425 (21.6%) | 227 (17.2%) |
| 5 or more Vehicles | 19 (1.0%) | 88 (6.7%) |
| Total | 1,966 (100.0%) | 1,317 (100.0%) |
Commute Time in Ramblewood
The most frequently occuring commute durations in Ramblewood are 20 to 24 minutes (742 commuters, 25.0%), 10 to 14 minutes (598 commuters, 20.1%), and 15 to 19 minutes (323 commuters, 10.9%).
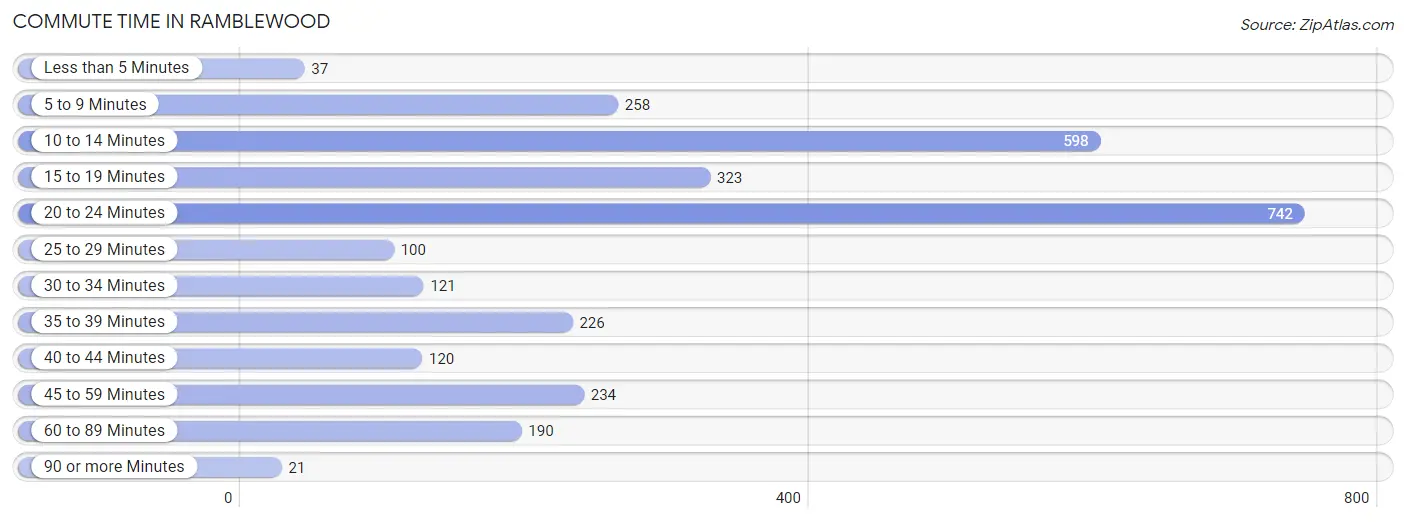
| Commute Time | # Commuters | % Commuters |
| Less than 5 Minutes | 37 | 1.3% |
| 5 to 9 Minutes | 258 | 8.7% |
| 10 to 14 Minutes | 598 | 20.1% |
| 15 to 19 Minutes | 323 | 10.9% |
| 20 to 24 Minutes | 742 | 25.0% |
| 25 to 29 Minutes | 100 | 3.4% |
| 30 to 34 Minutes | 121 | 4.1% |
| 35 to 39 Minutes | 226 | 7.6% |
| 40 to 44 Minutes | 120 | 4.0% |
| 45 to 59 Minutes | 234 | 7.9% |
| 60 to 89 Minutes | 190 | 6.4% |
| 90 or more Minutes | 21 | 0.7% |
Commute Time by Sex in Ramblewood
The most common commute times in Ramblewood are 20 to 24 minutes (493 commuters, 27.8%) for males and 20 to 24 minutes (249 commuters, 20.8%) for females.
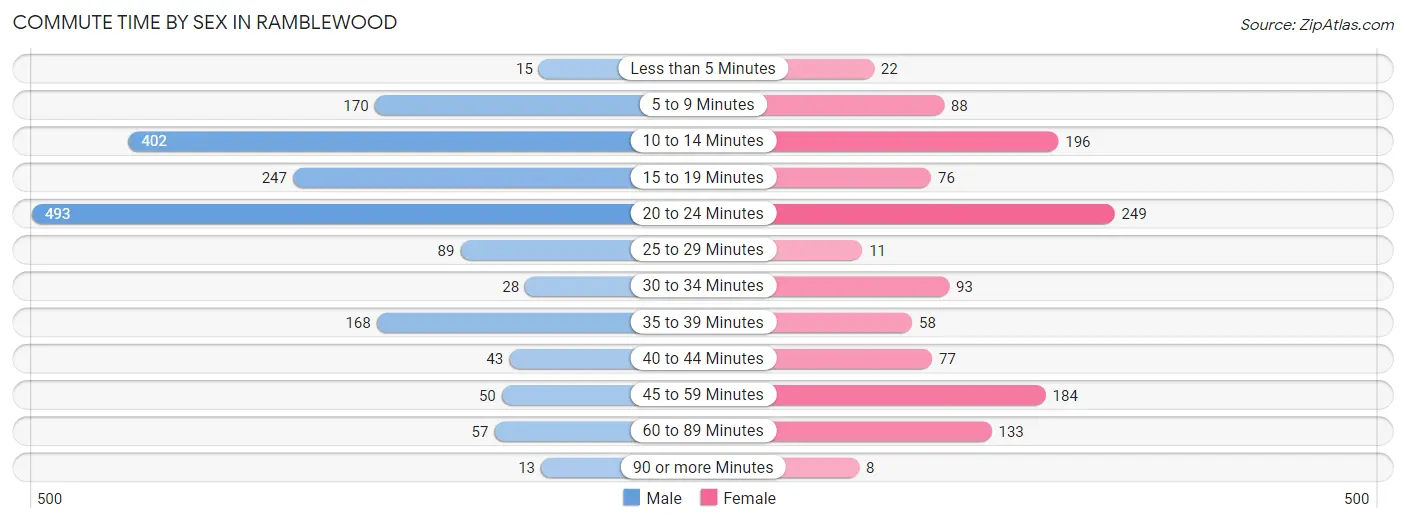
| Commute Time | Male | Female |
| Less than 5 Minutes | 15 (0.9%) | 22 (1.8%) |
| 5 to 9 Minutes | 170 (9.6%) | 88 (7.4%) |
| 10 to 14 Minutes | 402 (22.7%) | 196 (16.4%) |
| 15 to 19 Minutes | 247 (13.9%) | 76 (6.4%) |
| 20 to 24 Minutes | 493 (27.8%) | 249 (20.8%) |
| 25 to 29 Minutes | 89 (5.0%) | 11 (0.9%) |
| 30 to 34 Minutes | 28 (1.6%) | 93 (7.8%) |
| 35 to 39 Minutes | 168 (9.5%) | 58 (4.9%) |
| 40 to 44 Minutes | 43 (2.4%) | 77 (6.4%) |
| 45 to 59 Minutes | 50 (2.8%) | 184 (15.4%) |
| 60 to 89 Minutes | 57 (3.2%) | 133 (11.1%) |
| 90 or more Minutes | 13 (0.7%) | 8 (0.7%) |
Time of Departure to Work by Sex in Ramblewood
The most frequent times of departure to work in Ramblewood are 4:00 PM to 11:59 PM (280, 15.8%) for males and 7:30 AM to 7:59 AM (257, 21.5%) for females.
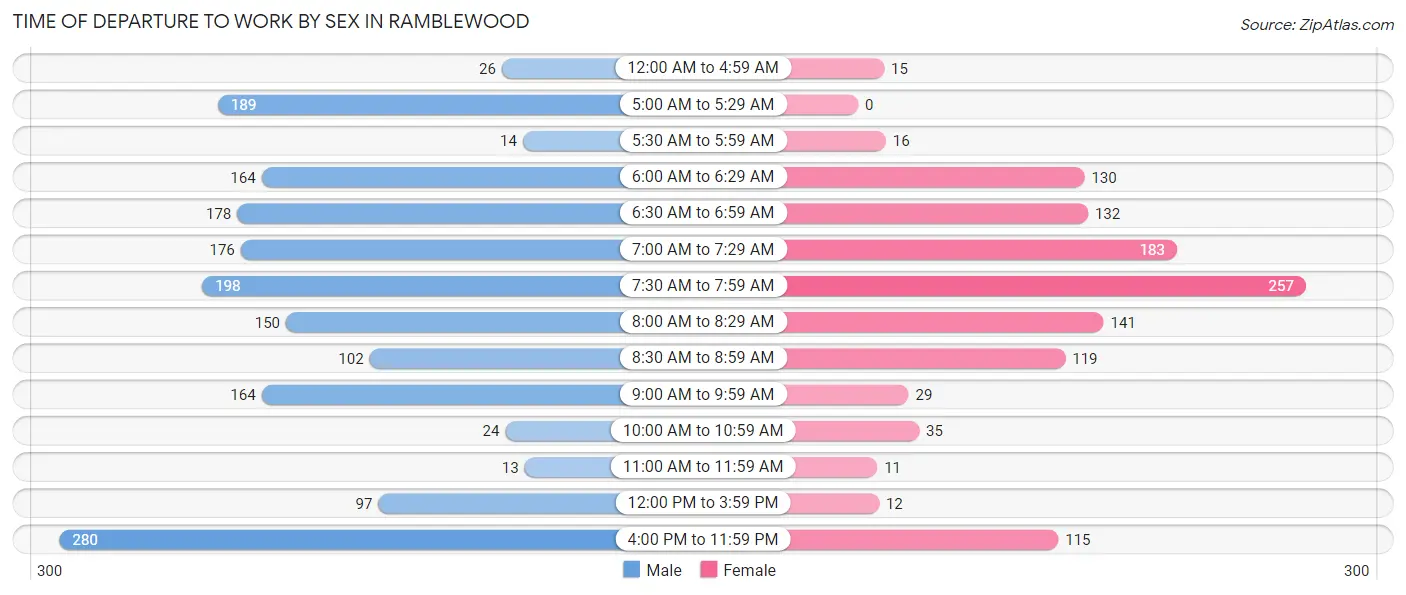
| Time of Departure | Male | Female |
| 12:00 AM to 4:59 AM | 26 (1.5%) | 15 (1.3%) |
| 5:00 AM to 5:29 AM | 189 (10.6%) | 0 (0.0%) |
| 5:30 AM to 5:59 AM | 14 (0.8%) | 16 (1.3%) |
| 6:00 AM to 6:29 AM | 164 (9.2%) | 130 (10.9%) |
| 6:30 AM to 6:59 AM | 178 (10.0%) | 132 (11.1%) |
| 7:00 AM to 7:29 AM | 176 (9.9%) | 183 (15.3%) |
| 7:30 AM to 7:59 AM | 198 (11.2%) | 257 (21.5%) |
| 8:00 AM to 8:29 AM | 150 (8.5%) | 141 (11.8%) |
| 8:30 AM to 8:59 AM | 102 (5.8%) | 119 (10.0%) |
| 9:00 AM to 9:59 AM | 164 (9.2%) | 29 (2.4%) |
| 10:00 AM to 10:59 AM | 24 (1.3%) | 35 (2.9%) |
| 11:00 AM to 11:59 AM | 13 (0.7%) | 11 (0.9%) |
| 12:00 PM to 3:59 PM | 97 (5.5%) | 12 (1.0%) |
| 4:00 PM to 11:59 PM | 280 (15.8%) | 115 (9.6%) |
| Total | 1,775 (100.0%) | 1,195 (100.0%) |
Housing Occupancy in Ramblewood
Occupancy by Ownership in Ramblewood
Of the total 2,375 dwellings in Ramblewood, owner-occupied units account for 1,744 (73.4%), while renter-occupied units make up 631 (26.6%).
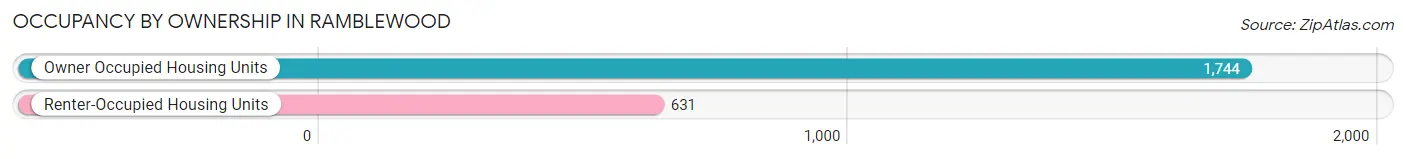
| Occupancy | # Housing Units | % Housing Units |
| Owner Occupied Housing Units | 1,744 | 73.4% |
| Renter-Occupied Housing Units | 631 | 26.6% |
| Total Occupied Housing Units | 2,375 | 100.0% |
Occupancy by Household Size in Ramblewood
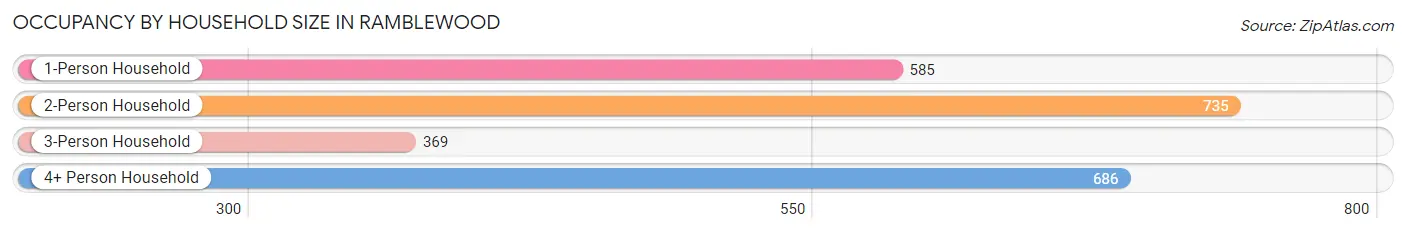
| Household Size | # Housing Units | % Housing Units |
| 1-Person Household | 585 | 24.6% |
| 2-Person Household | 735 | 30.9% |
| 3-Person Household | 369 | 15.5% |
| 4+ Person Household | 686 | 28.9% |
| Total Housing Units | 2,375 | 100.0% |
Occupancy by Ownership by Household Size in Ramblewood
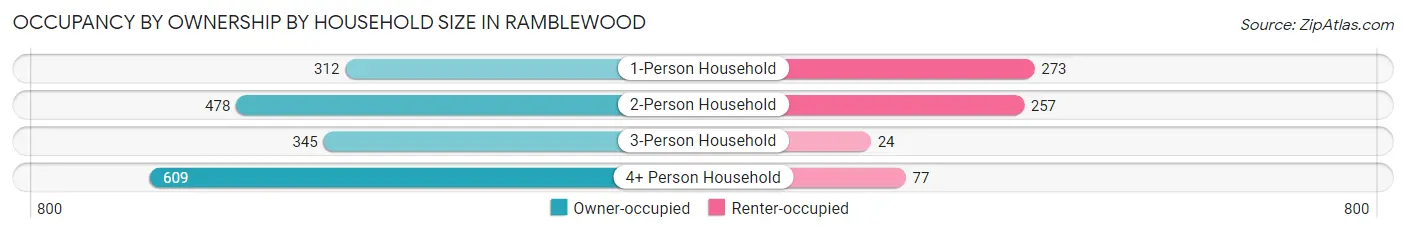
| Household Size | Owner-occupied | Renter-occupied |
| 1-Person Household | 312 (53.3%) | 273 (46.7%) |
| 2-Person Household | 478 (65.0%) | 257 (35.0%) |
| 3-Person Household | 345 (93.5%) | 24 (6.5%) |
| 4+ Person Household | 609 (88.8%) | 77 (11.2%) |
| Total Housing Units | 1,744 (73.4%) | 631 (26.6%) |
Occupancy by Educational Attainment in Ramblewood
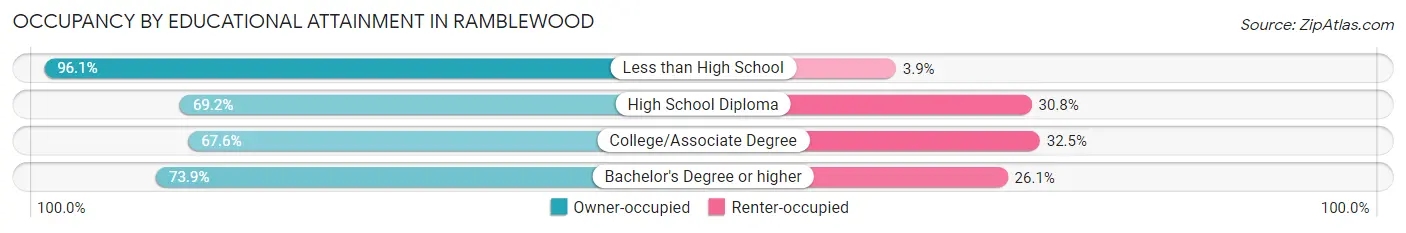
| Household Size | Owner-occupied | Renter-occupied |
| Less than High School | 197 (96.1%) | 8 (3.9%) |
| High School Diploma | 274 (69.2%) | 122 (30.8%) |
| College/Associate Degree | 408 (67.5%) | 196 (32.5%) |
| Bachelor's Degree or higher | 865 (73.9%) | 305 (26.1%) |
Occupancy by Age of Householder in Ramblewood
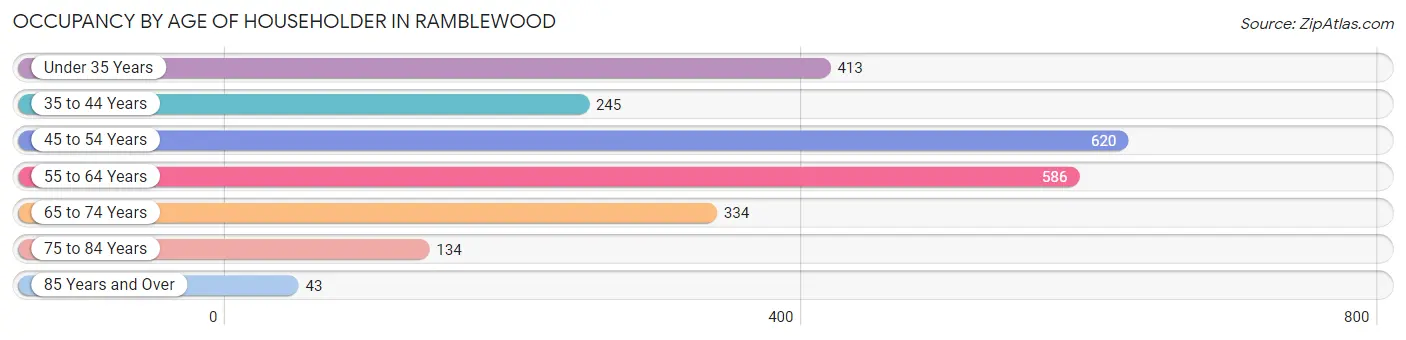
| Age Bracket | # Households | % Households |
| Under 35 Years | 413 | 17.4% |
| 35 to 44 Years | 245 | 10.3% |
| 45 to 54 Years | 620 | 26.1% |
| 55 to 64 Years | 586 | 24.7% |
| 65 to 74 Years | 334 | 14.1% |
| 75 to 84 Years | 134 | 5.6% |
| 85 Years and Over | 43 | 1.8% |
| Total | 2,375 | 100.0% |
Housing Finances in Ramblewood
Median Income by Occupancy in Ramblewood
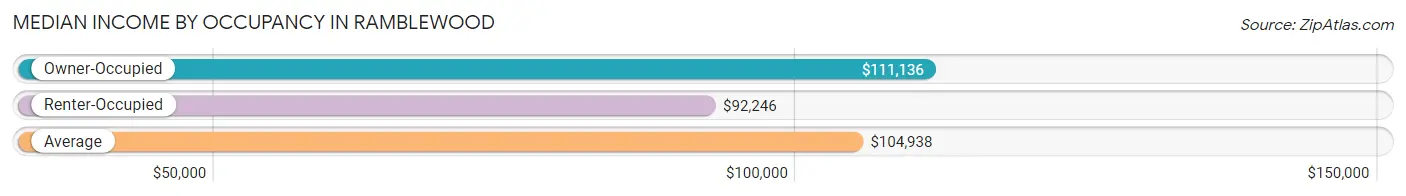
| Occupancy Type | # Households | Median Income |
| Owner-Occupied | 1,744 (73.4%) | $111,136 |
| Renter-Occupied | 631 (26.6%) | $92,246 |
| Average | 2,375 (100.0%) | $104,938 |
Occupancy by Householder Income Bracket in Ramblewood
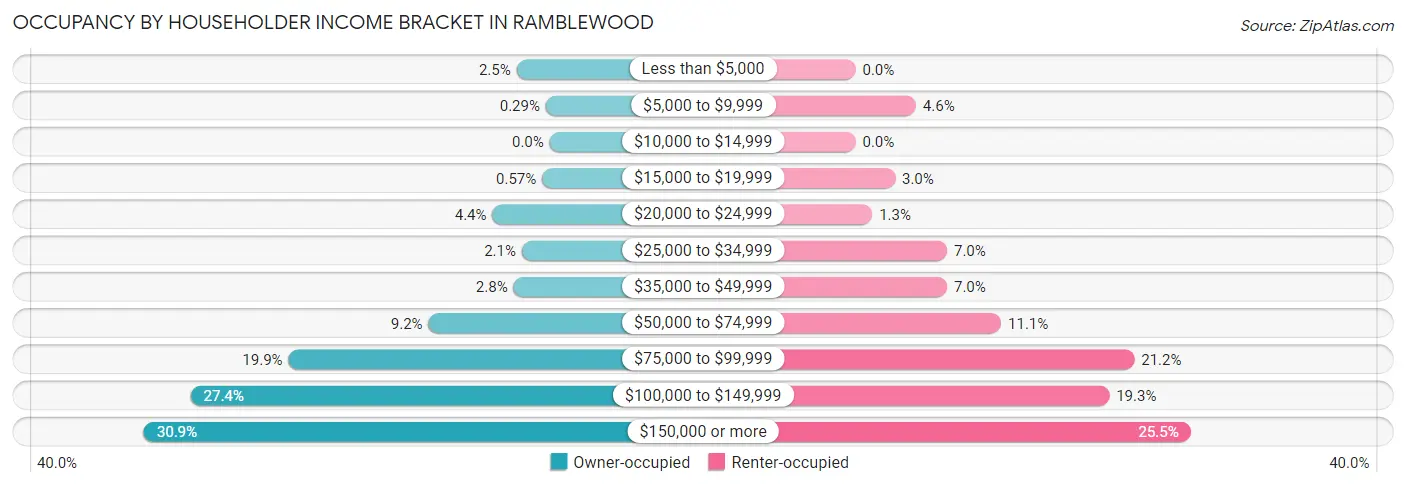
| Income Bracket | Owner-occupied | Renter-occupied |
| Less than $5,000 | 44 (2.5%) | 0 (0.0%) |
| $5,000 to $9,999 | 5 (0.3%) | 29 (4.6%) |
| $10,000 to $14,999 | 0 (0.0%) | 0 (0.0%) |
| $15,000 to $19,999 | 10 (0.6%) | 19 (3.0%) |
| $20,000 to $24,999 | 76 (4.4%) | 8 (1.3%) |
| $25,000 to $34,999 | 37 (2.1%) | 44 (7.0%) |
| $35,000 to $49,999 | 48 (2.8%) | 44 (7.0%) |
| $50,000 to $74,999 | 161 (9.2%) | 70 (11.1%) |
| $75,000 to $99,999 | 347 (19.9%) | 134 (21.2%) |
| $100,000 to $149,999 | 477 (27.4%) | 122 (19.3%) |
| $150,000 or more | 539 (30.9%) | 161 (25.5%) |
| Total | 1,744 (100.0%) | 631 (100.0%) |
Monthly Housing Cost Tiers in Ramblewood
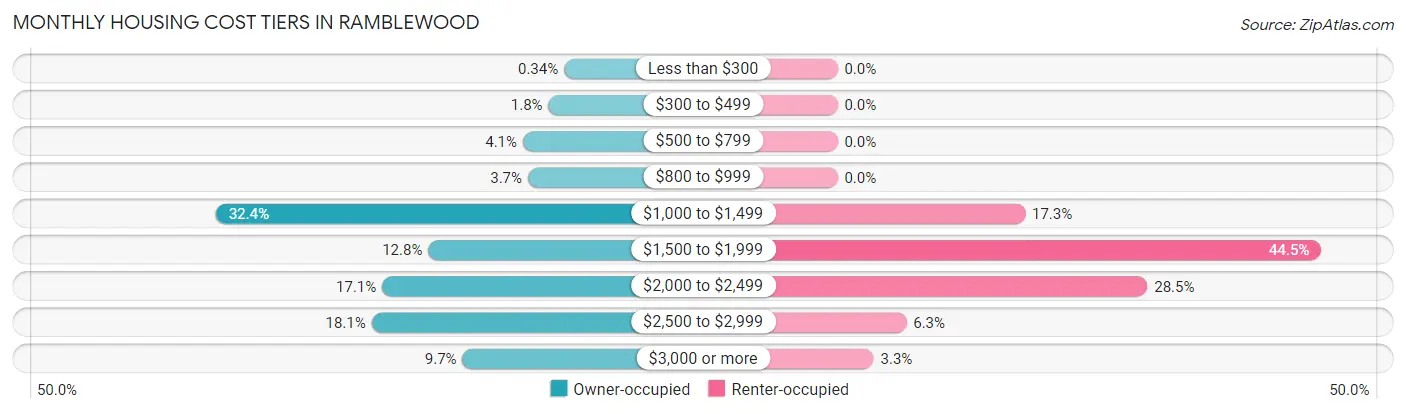
| Monthly Cost | Owner-occupied | Renter-occupied |
| Less than $300 | 6 (0.3%) | 0 (0.0%) |
| $300 to $499 | 31 (1.8%) | 0 (0.0%) |
| $500 to $799 | 72 (4.1%) | 0 (0.0%) |
| $800 to $999 | 64 (3.7%) | 0 (0.0%) |
| $1,000 to $1,499 | 565 (32.4%) | 109 (17.3%) |
| $1,500 to $1,999 | 224 (12.8%) | 281 (44.5%) |
| $2,000 to $2,499 | 298 (17.1%) | 180 (28.5%) |
| $2,500 to $2,999 | 315 (18.1%) | 40 (6.3%) |
| $3,000 or more | 169 (9.7%) | 21 (3.3%) |
| Total | 1,744 (100.0%) | 631 (100.0%) |
Physical Housing Characteristics in Ramblewood
Housing Structures in Ramblewood
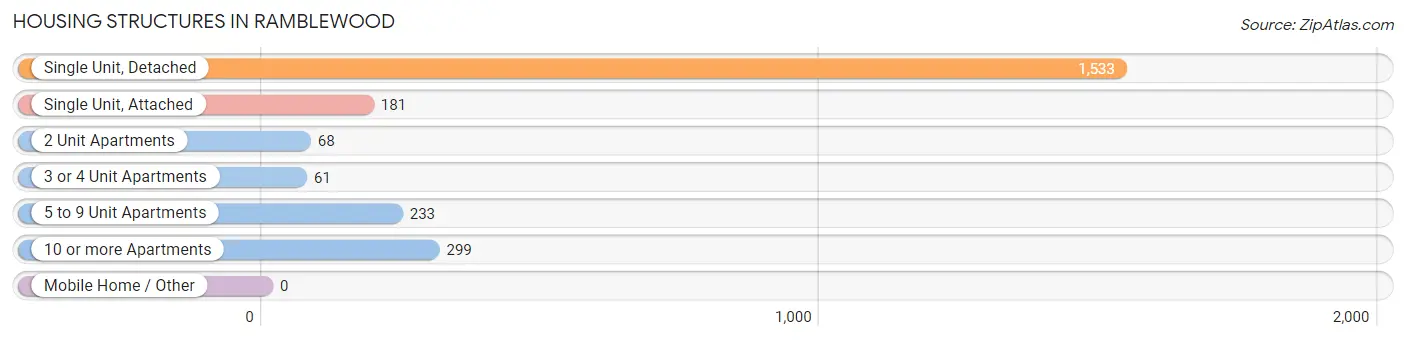
| Structure Type | # Housing Units | % Housing Units |
| Single Unit, Detached | 1,533 | 64.5% |
| Single Unit, Attached | 181 | 7.6% |
| 2 Unit Apartments | 68 | 2.9% |
| 3 or 4 Unit Apartments | 61 | 2.6% |
| 5 to 9 Unit Apartments | 233 | 9.8% |
| 10 or more Apartments | 299 | 12.6% |
| Mobile Home / Other | 0 | 0.0% |
| Total | 2,375 | 100.0% |
Housing Structures by Occupancy in Ramblewood
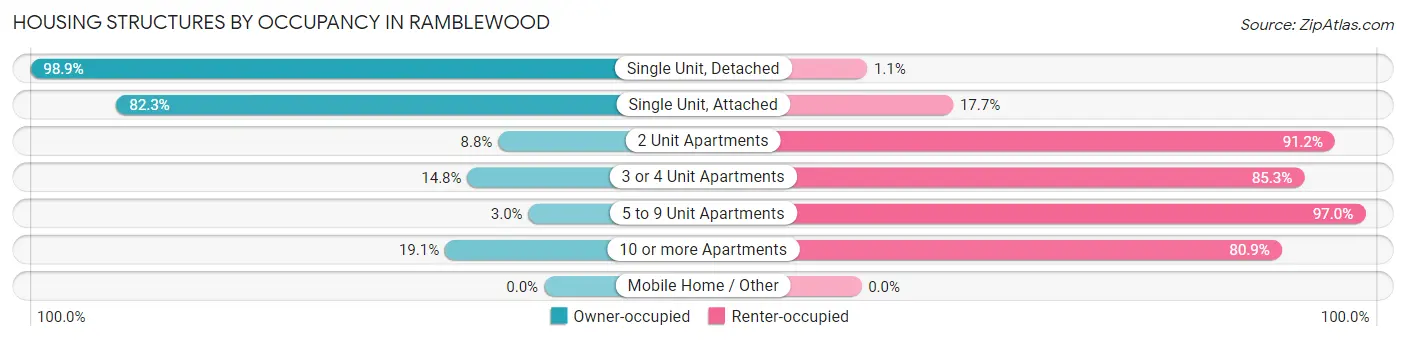
| Structure Type | Owner-occupied | Renter-occupied |
| Single Unit, Detached | 1,516 (98.9%) | 17 (1.1%) |
| Single Unit, Attached | 149 (82.3%) | 32 (17.7%) |
| 2 Unit Apartments | 6 (8.8%) | 62 (91.2%) |
| 3 or 4 Unit Apartments | 9 (14.7%) | 52 (85.3%) |
| 5 to 9 Unit Apartments | 7 (3.0%) | 226 (97.0%) |
| 10 or more Apartments | 57 (19.1%) | 242 (80.9%) |
| Mobile Home / Other | 0 (0.0%) | 0 (0.0%) |
| Total | 1,744 (73.4%) | 631 (26.6%) |
Housing Structures by Number of Rooms in Ramblewood
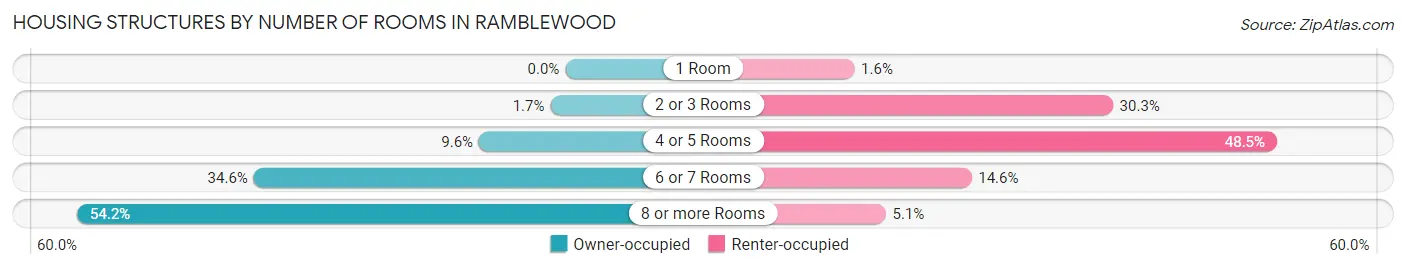
| Number of Rooms | Owner-occupied | Renter-occupied |
| 1 Room | 0 (0.0%) | 10 (1.6%) |
| 2 or 3 Rooms | 29 (1.7%) | 191 (30.3%) |
| 4 or 5 Rooms | 167 (9.6%) | 306 (48.5%) |
| 6 or 7 Rooms | 603 (34.6%) | 92 (14.6%) |
| 8 or more Rooms | 945 (54.2%) | 32 (5.1%) |
| Total | 1,744 (100.0%) | 631 (100.0%) |
Housing Structure by Heating Type in Ramblewood
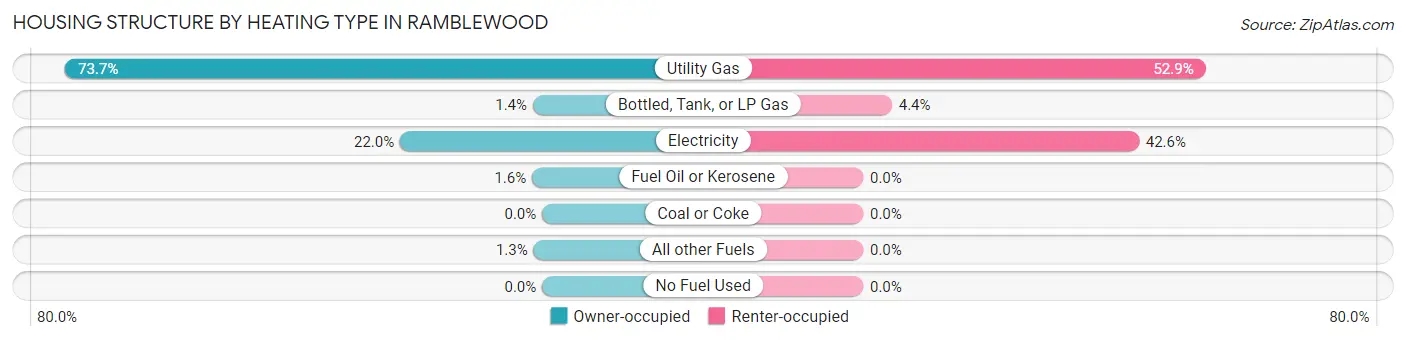
| Heating Type | Owner-occupied | Renter-occupied |
| Utility Gas | 1,286 (73.7%) | 334 (52.9%) |
| Bottled, Tank, or LP Gas | 25 (1.4%) | 28 (4.4%) |
| Electricity | 383 (22.0%) | 269 (42.6%) |
| Fuel Oil or Kerosene | 27 (1.5%) | 0 (0.0%) |
| Coal or Coke | 0 (0.0%) | 0 (0.0%) |
| All other Fuels | 23 (1.3%) | 0 (0.0%) |
| No Fuel Used | 0 (0.0%) | 0 (0.0%) |
| Total | 1,744 (100.0%) | 631 (100.0%) |
Household Vehicle Usage in Ramblewood
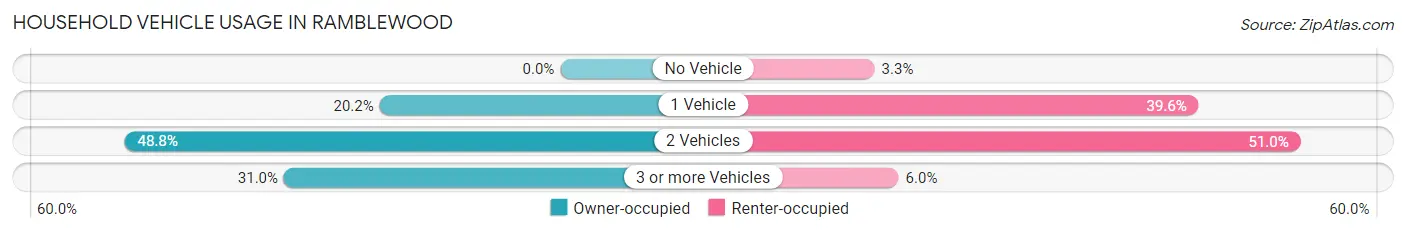
| Vehicles per Household | Owner-occupied | Renter-occupied |
| No Vehicle | 0 (0.0%) | 21 (3.3%) |
| 1 Vehicle | 353 (20.2%) | 250 (39.6%) |
| 2 Vehicles | 851 (48.8%) | 322 (51.0%) |
| 3 or more Vehicles | 540 (31.0%) | 38 (6.0%) |
| Total | 1,744 (100.0%) | 631 (100.0%) |
Real Estate & Mortgages in Ramblewood
Real Estate and Mortgage Overview in Ramblewood
| Characteristic | Without Mortgage | With Mortgage |
| Housing Units | 645 | 1,099 |
| Median Property Value | $377,700 | $336,700 |
| Median Household Income | $96,586 | $490 |
| Monthly Housing Costs | $1,113 | $169 |
| Real Estate Taxes | $8,193 | $9 |
Property Value by Mortgage Status in Ramblewood
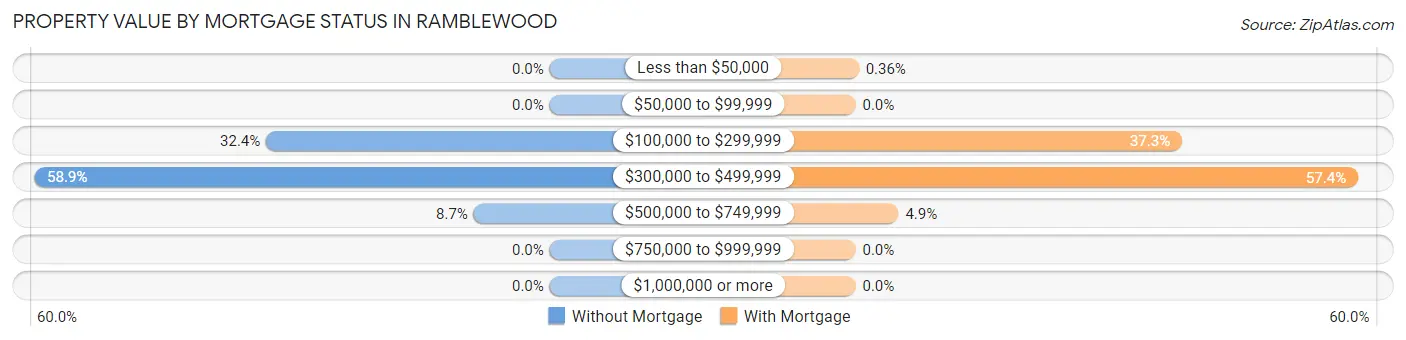
| Property Value | Without Mortgage | With Mortgage |
| Less than $50,000 | 0 (0.0%) | 4 (0.4%) |
| $50,000 to $99,999 | 0 (0.0%) | 0 (0.0%) |
| $100,000 to $299,999 | 209 (32.4%) | 410 (37.3%) |
| $300,000 to $499,999 | 380 (58.9%) | 631 (57.4%) |
| $500,000 to $749,999 | 56 (8.7%) | 54 (4.9%) |
| $750,000 to $999,999 | 0 (0.0%) | 0 (0.0%) |
| $1,000,000 or more | 0 (0.0%) | 0 (0.0%) |
| Total | 645 (100.0%) | 1,099 (100.0%) |
Household Income by Mortgage Status in Ramblewood
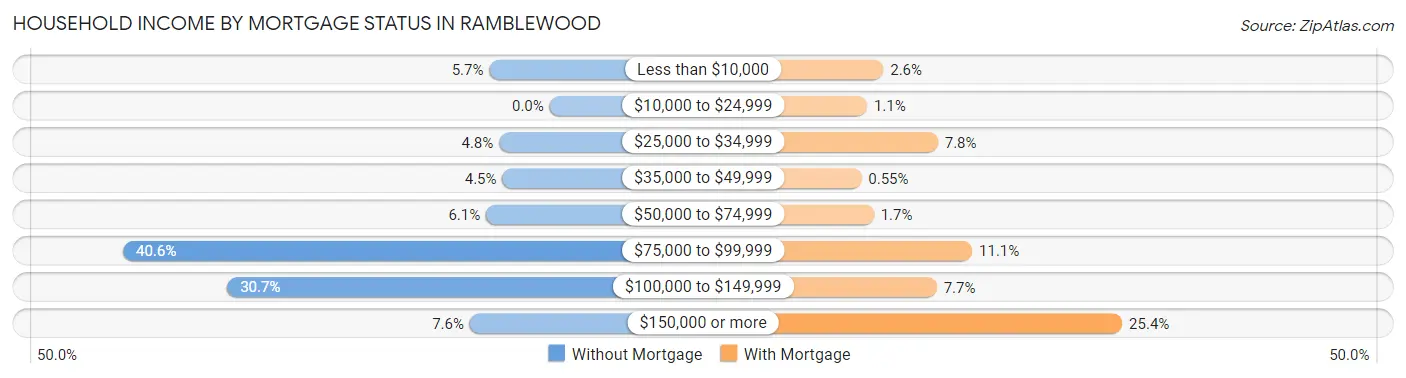
| Household Income | Without Mortgage | With Mortgage |
| Less than $10,000 | 37 (5.7%) | 29 (2.6%) |
| $10,000 to $24,999 | 0 (0.0%) | 12 (1.1%) |
| $25,000 to $34,999 | 31 (4.8%) | 86 (7.8%) |
| $35,000 to $49,999 | 29 (4.5%) | 6 (0.5%) |
| $50,000 to $74,999 | 39 (6.0%) | 19 (1.7%) |
| $75,000 to $99,999 | 262 (40.6%) | 122 (11.1%) |
| $100,000 to $149,999 | 198 (30.7%) | 85 (7.7%) |
| $150,000 or more | 49 (7.6%) | 279 (25.4%) |
| Total | 645 (100.0%) | 1,099 (100.0%) |
Property Value to Household Income Ratio in Ramblewood
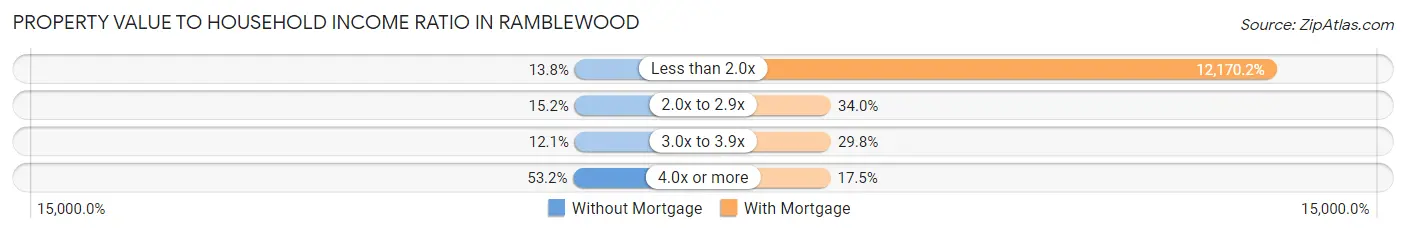
| Value-to-Income Ratio | Without Mortgage | With Mortgage |
| Less than 2.0x | 89 (13.8%) | 133,750 (12,170.1%) |
| 2.0x to 2.9x | 98 (15.2%) | 374 (34.0%) |
| 3.0x to 3.9x | 78 (12.1%) | 327 (29.7%) |
| 4.0x or more | 343 (53.2%) | 192 (17.5%) |
| Total | 645 (100.0%) | 1,099 (100.0%) |
Real Estate Taxes by Mortgage Status in Ramblewood
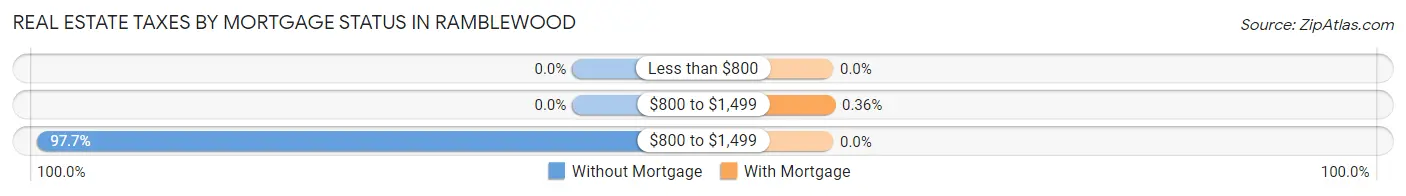
| Property Taxes | Without Mortgage | With Mortgage |
| Less than $800 | 0 (0.0%) | 0 (0.0%) |
| $800 to $1,499 | 0 (0.0%) | 4 (0.4%) |
| $800 to $1,499 | 630 (97.7%) | 0 (0.0%) |
| Total | 645 (100.0%) | 1,099 (100.0%) |
Health & Disability in Ramblewood
Health Insurance Coverage by Age in Ramblewood
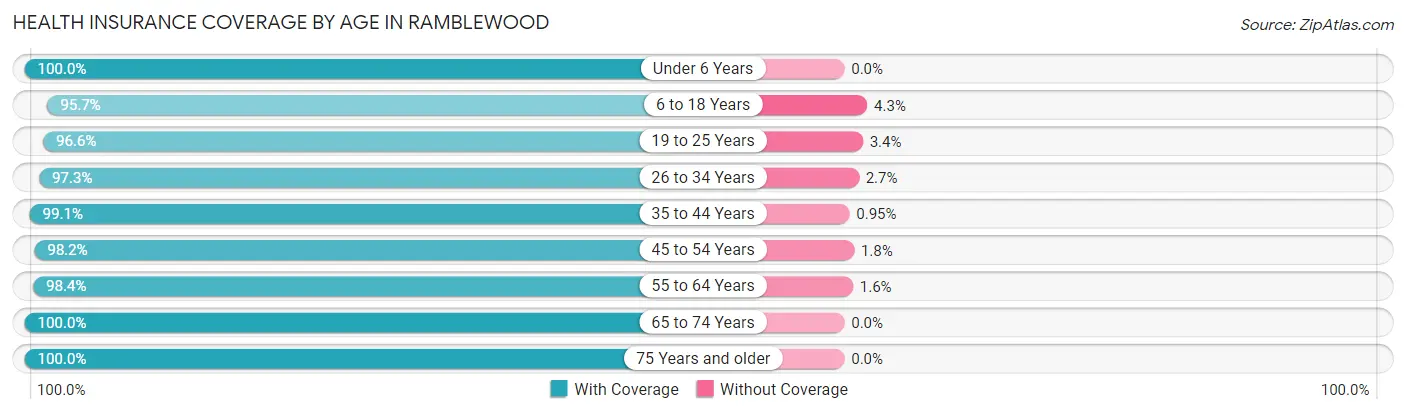
| Age Bracket | With Coverage | Without Coverage |
| Under 6 Years | 231 (100.0%) | 0 (0.0%) |
| 6 to 18 Years | 1,145 (95.7%) | 51 (4.3%) |
| 19 to 25 Years | 674 (96.6%) | 24 (3.4%) |
| 26 to 34 Years | 687 (97.3%) | 19 (2.7%) |
| 35 to 44 Years | 523 (99.1%) | 5 (0.9%) |
| 45 to 54 Years | 1,031 (98.2%) | 19 (1.8%) |
| 55 to 64 Years | 930 (98.4%) | 15 (1.6%) |
| 65 to 74 Years | 520 (100.0%) | 0 (0.0%) |
| 75 Years and older | 291 (100.0%) | 0 (0.0%) |
| Total | 6,032 (97.8%) | 133 (2.2%) |
Health Insurance Coverage by Citizenship Status in Ramblewood
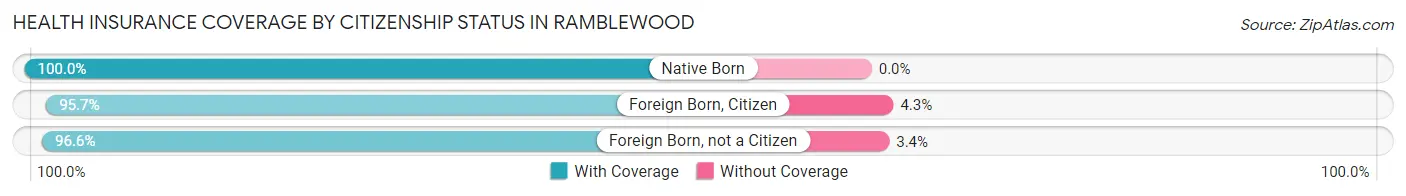
| Citizenship Status | With Coverage | Without Coverage |
| Native Born | 231 (100.0%) | 0 (0.0%) |
| Foreign Born, Citizen | 1,145 (95.7%) | 51 (4.3%) |
| Foreign Born, not a Citizen | 674 (96.6%) | 24 (3.4%) |
Health Insurance Coverage by Household Income in Ramblewood
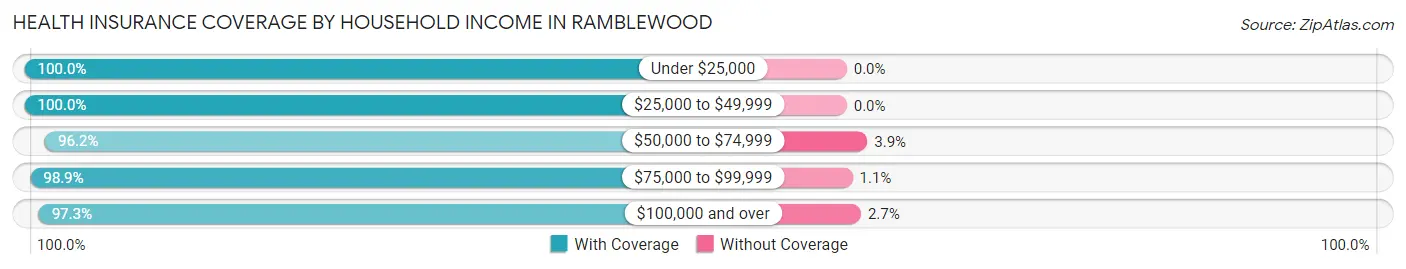
| Household Income | With Coverage | Without Coverage |
| Under $25,000 | 353 (100.0%) | 0 (0.0%) |
| $25,000 to $49,999 | 203 (100.0%) | 0 (0.0%) |
| $50,000 to $74,999 | 474 (96.2%) | 19 (3.8%) |
| $75,000 to $99,999 | 1,373 (98.9%) | 15 (1.1%) |
| $100,000 and over | 3,629 (97.3%) | 99 (2.7%) |
Public vs Private Health Insurance Coverage by Age in Ramblewood
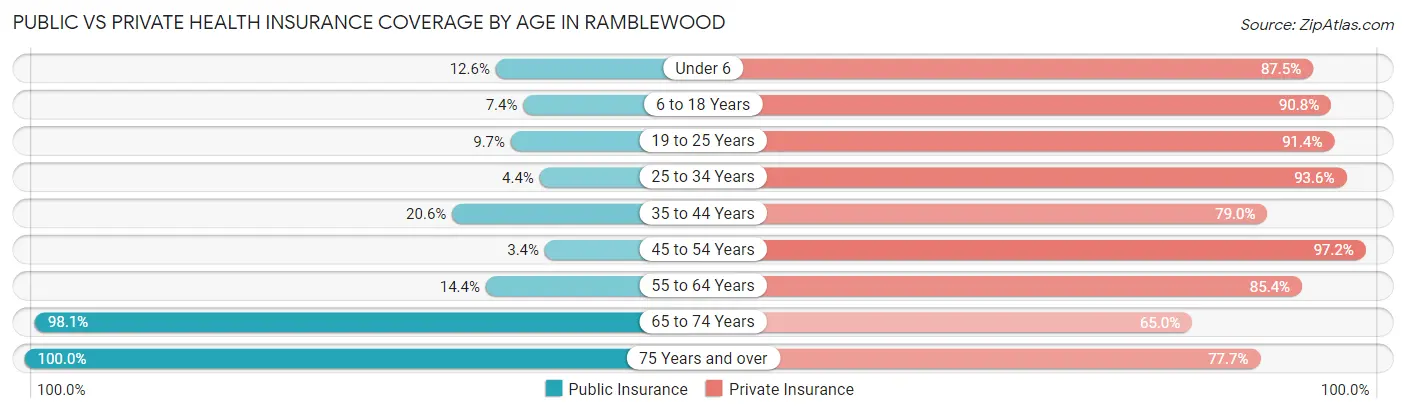
| Age Bracket | Public Insurance | Private Insurance |
| Under 6 | 29 (12.6%) | 202 (87.5%) |
| 6 to 18 Years | 89 (7.4%) | 1,086 (90.8%) |
| 19 to 25 Years | 68 (9.7%) | 638 (91.4%) |
| 25 to 34 Years | 31 (4.4%) | 661 (93.6%) |
| 35 to 44 Years | 109 (20.6%) | 417 (79.0%) |
| 45 to 54 Years | 36 (3.4%) | 1,021 (97.2%) |
| 55 to 64 Years | 136 (14.4%) | 807 (85.4%) |
| 65 to 74 Years | 510 (98.1%) | 338 (65.0%) |
| 75 Years and over | 291 (100.0%) | 226 (77.7%) |
| Total | 1,299 (21.1%) | 5,396 (87.5%) |
Disability Status by Sex by Age in Ramblewood
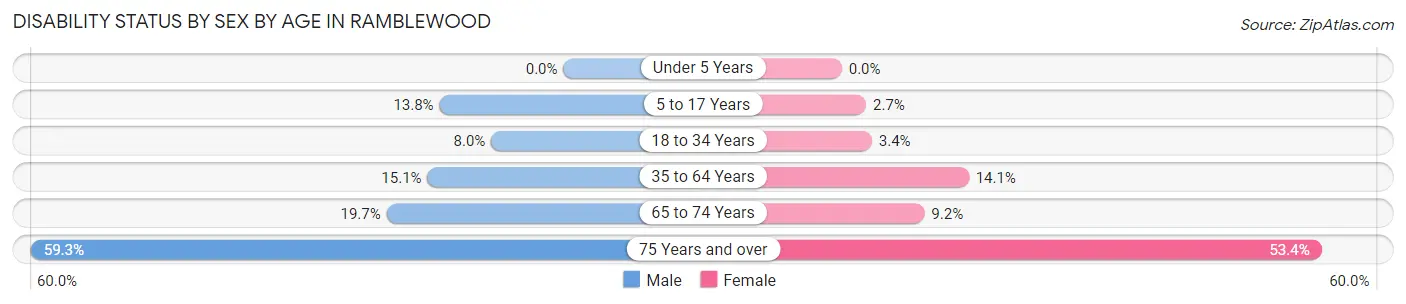
| Age Bracket | Male | Female |
| Under 5 Years | 0 (0.0%) | 0 (0.0%) |
| 5 to 17 Years | 57 (13.8%) | 17 (2.7%) |
| 18 to 34 Years | 84 (8.0%) | 18 (3.4%) |
| 35 to 64 Years | 173 (15.1%) | 195 (14.1%) |
| 65 to 74 Years | 51 (19.7%) | 24 (9.2%) |
| 75 Years and over | 86 (59.3%) | 78 (53.4%) |
Disability Class by Sex by Age in Ramblewood
Disability Class: Hearing Difficulty
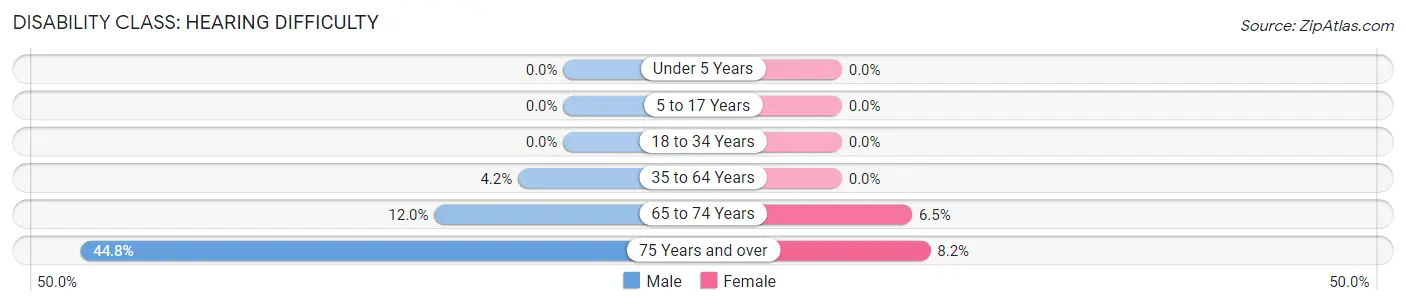
| Age Bracket | Male | Female |
| Under 5 Years | 0 (0.0%) | 0 (0.0%) |
| 5 to 17 Years | 0 (0.0%) | 0 (0.0%) |
| 18 to 34 Years | 0 (0.0%) | 0 (0.0%) |
| 35 to 64 Years | 48 (4.2%) | 0 (0.0%) |
| 65 to 74 Years | 31 (12.0%) | 17 (6.5%) |
| 75 Years and over | 65 (44.8%) | 12 (8.2%) |
Disability Class: Vision Difficulty
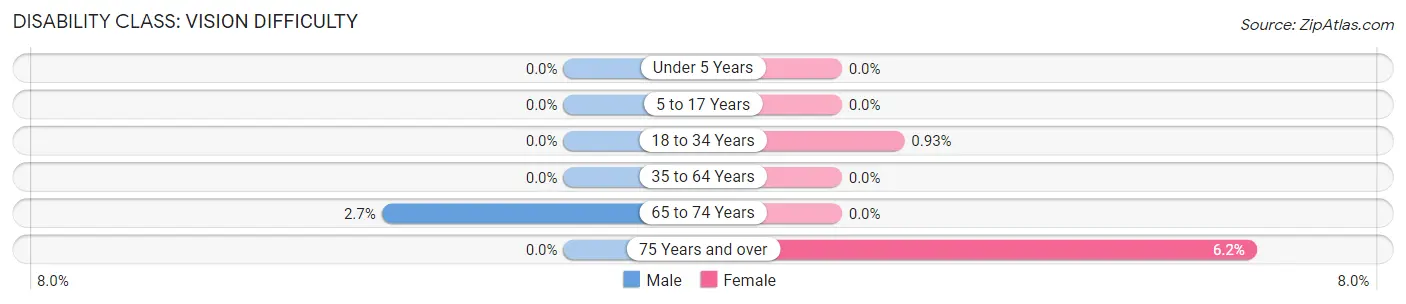
| Age Bracket | Male | Female |
| Under 5 Years | 0 (0.0%) | 0 (0.0%) |
| 5 to 17 Years | 0 (0.0%) | 0 (0.0%) |
| 18 to 34 Years | 0 (0.0%) | 5 (0.9%) |
| 35 to 64 Years | 0 (0.0%) | 0 (0.0%) |
| 65 to 74 Years | 7 (2.7%) | 0 (0.0%) |
| 75 Years and over | 0 (0.0%) | 9 (6.2%) |
Disability Class: Cognitive Difficulty
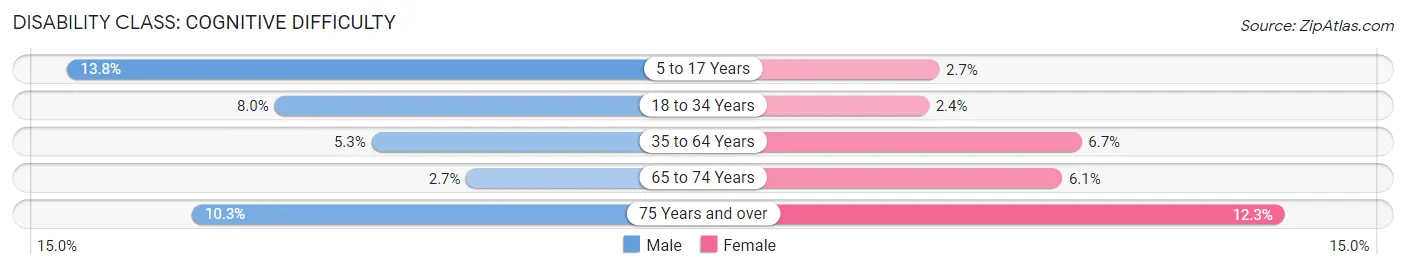
| Age Bracket | Male | Female |
| 5 to 17 Years | 57 (13.8%) | 17 (2.7%) |
| 18 to 34 Years | 84 (8.0%) | 13 (2.4%) |
| 35 to 64 Years | 61 (5.3%) | 92 (6.7%) |
| 65 to 74 Years | 7 (2.7%) | 16 (6.1%) |
| 75 Years and over | 15 (10.3%) | 18 (12.3%) |
Disability Class: Ambulatory Difficulty
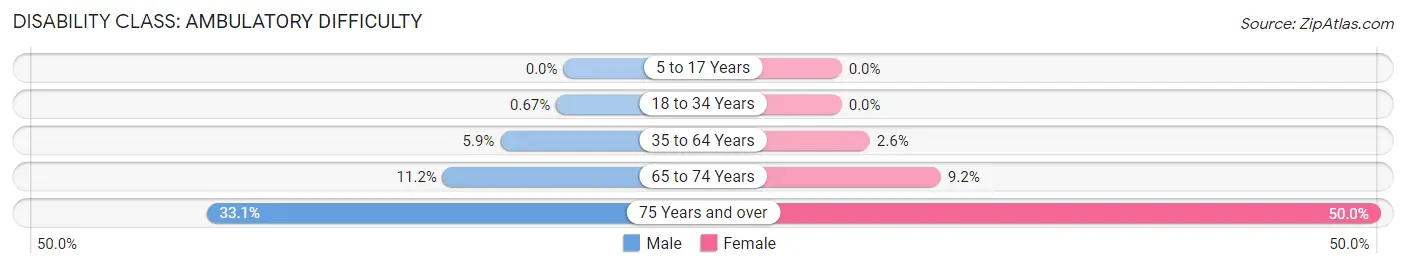
| Age Bracket | Male | Female |
| 5 to 17 Years | 0 (0.0%) | 0 (0.0%) |
| 18 to 34 Years | 7 (0.7%) | 0 (0.0%) |
| 35 to 64 Years | 67 (5.9%) | 36 (2.6%) |
| 65 to 74 Years | 29 (11.2%) | 24 (9.2%) |
| 75 Years and over | 48 (33.1%) | 73 (50.0%) |
Disability Class: Self-Care Difficulty
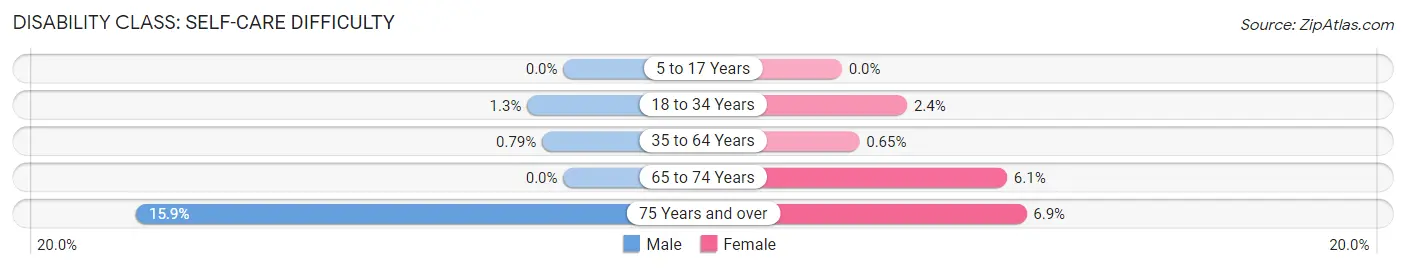
| Age Bracket | Male | Female |
| 5 to 17 Years | 0 (0.0%) | 0 (0.0%) |
| 18 to 34 Years | 14 (1.3%) | 13 (2.4%) |
| 35 to 64 Years | 9 (0.8%) | 9 (0.6%) |
| 65 to 74 Years | 0 (0.0%) | 16 (6.1%) |
| 75 Years and over | 23 (15.9%) | 10 (6.9%) |
Technology Access in Ramblewood
Computing Device Access in Ramblewood
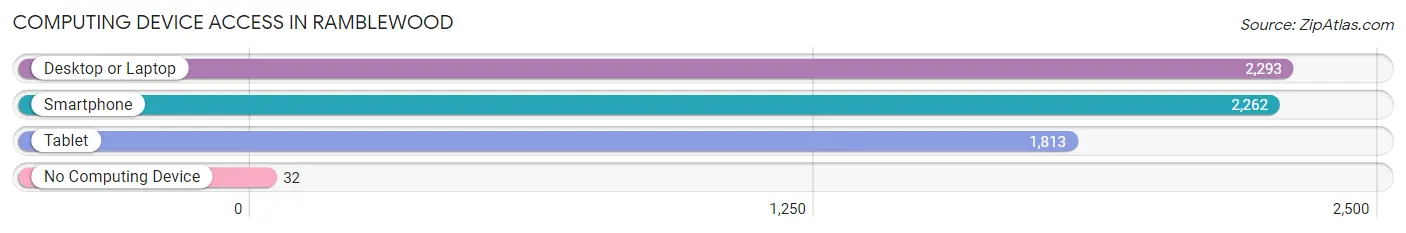
| Device Type | # Households | % Households |
| Desktop or Laptop | 2,293 | 96.6% |
| Smartphone | 2,262 | 95.2% |
| Tablet | 1,813 | 76.3% |
| No Computing Device | 32 | 1.3% |
| Total | 2,375 | 100.0% |
Internet Access in Ramblewood
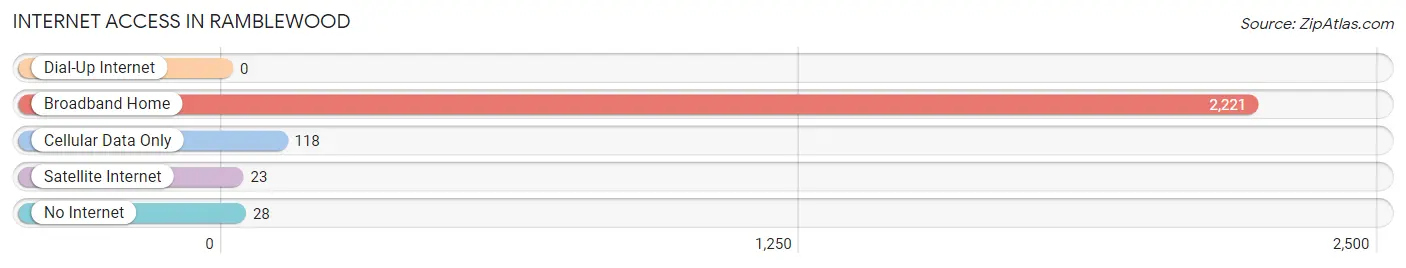
| Internet Type | # Households | % Households |
| Dial-Up Internet | 0 | 0.0% |
| Broadband Home | 2,221 | 93.5% |
| Cellular Data Only | 118 | 5.0% |
| Satellite Internet | 23 | 1.0% |
| No Internet | 28 | 1.2% |
| Total | 2,375 | 100.0% |
Ramblewood Summary
Ramblewood, NJ is a small suburban community located in the northern part of Burlington County, New Jersey. It is situated between the towns of Mount Laurel and Moorestown, and is part of the larger Philadelphia metropolitan area. The population of Ramblewood was estimated to be 8,845 in 2019.
History
Ramblewood was originally part of the Lenape Native American territory. The area was first settled by Europeans in the late 17th century, and the town was officially incorporated in 1891. The town was named after the Ramblewood Inn, which was built in the area in the late 19th century.
The town was largely rural until the 1950s, when the population began to grow rapidly due to the construction of the Garden State Parkway and the expansion of the Philadelphia metropolitan area. The population of Ramblewood increased from 1,000 in 1950 to 8,845 in 2019.
Geography
Ramblewood is located in the northern part of Burlington County, New Jersey. It is situated between the towns of Mount Laurel and Moorestown, and is part of the larger Philadelphia metropolitan area. The town is bordered by the townships of Mount Laurel, Moorestown, and Maple Shade.
The town has a total area of 4.2 square miles, of which 4.1 square miles is land and 0.1 square miles is water. The town is located in the Pine Barrens, a large area of pine forests and wetlands in southern New Jersey.
Economy
Ramblewood is a largely residential community, and the majority of its residents are employed in the nearby cities of Philadelphia and Camden. The town is home to several small businesses, including restaurants, retail stores, and professional services.
The town is also home to several large employers, including Lockheed Martin, which has a facility in the town. The town is also home to the Ramblewood Country Club, which is a popular destination for golfers.
Demographics
As of the 2019 census, the population of Ramblewood was 8,845. The racial makeup of the town was 79.3% White, 11.2% African American, 4.2% Asian, and 5.3% Hispanic or Latino. The median household income was $90,945, and the median age was 43.
Ramblewood is a largely suburban community, and the majority of its residents are homeowners. The town is served by the Moorestown School District, which includes three elementary schools, one middle school, and one high school.
Conclusion
Ramblewood, NJ is a small suburban community located in the northern part of Burlington County, New Jersey. It is situated between the towns of Mount Laurel and Moorestown, and is part of the larger Philadelphia metropolitan area. The town was originally part of the Lenape Native American territory, and was officially incorporated in 1891. The population of Ramblewood was estimated to be 8,845 in 2019. The town is largely residential, and the majority of its residents are employed in the nearby cities of Philadelphia and Camden. The town is also home to several large employers, including Lockheed Martin, and the Ramblewood Country Club. The racial makeup of the town was 79.3% White, 11.2% African American, 4.2% Asian, and 5.3% Hispanic or Latino. The median household income was $90,945, and the median age was 43.
Common Questions
What is the Total Population of Ramblewood?
Total Population of Ramblewood is 6,320.
What is the Total Male Population of Ramblewood?
Total Male Population of Ramblewood is 3,178.
What is the Total Female Population of Ramblewood?
Total Female Population of Ramblewood is 3,142.
What is the Ratio of Males per 100 Females in Ramblewood?
There are 101.15 Males per 100 Females in Ramblewood.
What is the Ratio of Females per 100 Males in Ramblewood?
There are 98.87 Females per 100 Males in Ramblewood.
What is the Median Population Age in Ramblewood?
Median Population Age in Ramblewood is 40.3 Years.
What is the Average Family Size in Ramblewood
Average Family Size in Ramblewood is 3.2 People.
What is the Average Household Size in Ramblewood
Average Household Size in Ramblewood is 2.6 People.
What is Per Capita Income in Ramblewood?
Per Capita income in Ramblewood is $51,367.
What is the Median Family Income in Ramblewood?
Median Family Income in Ramblewood is $116,174.
What is the Median Household income in Ramblewood?
Median Household Income in Ramblewood is $104,938.
What is Income or Wage Gap in Ramblewood?
Income or Wage Gap in Ramblewood is 35.9%.
Women in Ramblewood earn 64.1 cents for every dollar earned by a man.
What is Inequality or Gini Index in Ramblewood?
Inequality or Gini Index in Ramblewood is 0.40.
How Large is the Labor Force in Ramblewood?
There are 3,491 People in the Labor Forcein in Ramblewood.
What is the Percentage of People in the Labor Force in Ramblewood?
66.8% of People are in the Labor Force in Ramblewood.
What is the Unemployment Rate in Ramblewood?
Unemployment Rate in Ramblewood is 5.8%.