Upper Montclair, NJ
Upper Montclair Map
Upper Montclair Overview
12,441
TOTAL POPULATION
6,410
MALE POPULATION
6,031
FEMALE POPULATION
106.28
MALES / 100 FEMALES
94.09
FEMALES / 100 MALES
41.4
MEDIAN AGE
3.3
AVG FAMILY SIZE
3.0
AVG HOUSEHOLD SIZE
$102,287
PER CAPITA INCOME
$250,001
AVG FAMILY INCOME
$234,620
AVG HOUSEHOLD INCOME
39.1%
WAGE / INCOME GAP [ % ]
60.9¢/ $1
WAGE / INCOME GAP [ $ ]
0.44
INEQUALITY / GINI INDEX
6,509
LABOR FORCE [ PEOPLE ]
69.7%
PERCENT IN LABOR FORCE
6.3%
UNEMPLOYMENT RATE
Upper Montclair Area Codes
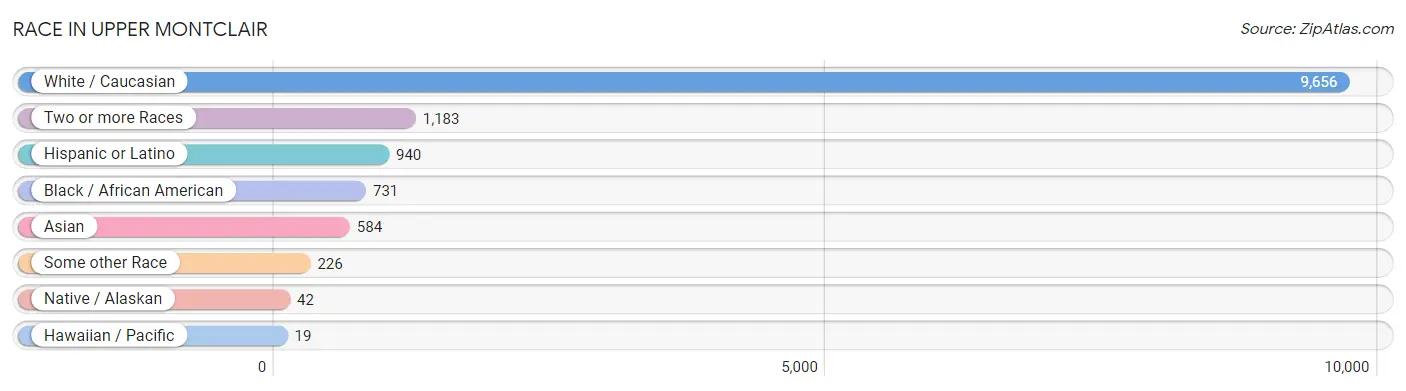
Race in Upper Montclair
The most populous races in Upper Montclair are White / Caucasian (9,656 | 77.6%), Two or more Races (1,183 | 9.5%), and Hispanic or Latino (940 | 7.6%).
| Race | # Population | % Population |
| Asian | 584 | 4.7% |
| Black / African American | 731 | 5.9% |
| Hawaiian / Pacific | 19 | 0.2% |
| Hispanic or Latino | 940 | 7.6% |
| Native / Alaskan | 42 | 0.3% |
| White / Caucasian | 9,656 | 77.6% |
| Two or more Races | 1,183 | 9.5% |
| Some other Race | 226 | 1.8% |
| Total | 12,441 | 100.0% |
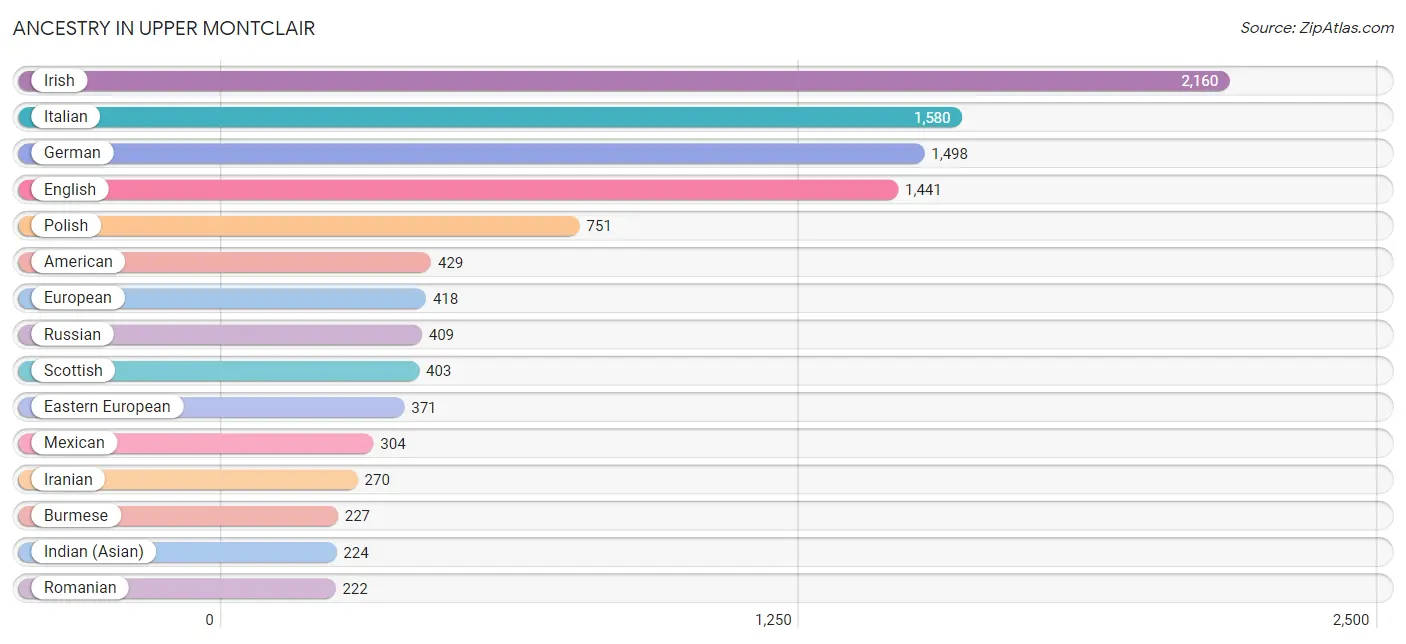
Ancestry in Upper Montclair
The most populous ancestries reported in Upper Montclair are Irish (2,160 | 17.4%), Italian (1,580 | 12.7%), German (1,498 | 12.0%), English (1,441 | 11.6%), and Polish (751 | 6.0%), together accounting for 59.7% of all Upper Montclair residents.
| Ancestry | # Population | % Population |
| African | 24 | 0.2% |
| American | 429 | 3.5% |
| Arab | 122 | 1.0% |
| Argentinean | 63 | 0.5% |
| Armenian | 27 | 0.2% |
| Assyrian / Chaldean / Syriac | 9 | 0.1% |
| Austrian | 50 | 0.4% |
| Belgian | 10 | 0.1% |
| Bhutanese | 117 | 0.9% |
| Brazilian | 134 | 1.1% |
| British | 84 | 0.7% |
| British West Indian | 29 | 0.2% |
| Burmese | 227 | 1.8% |
| Cajun | 17 | 0.1% |
| Canadian | 61 | 0.5% |
| Celtic | 11 | 0.1% |
| Central American | 88 | 0.7% |
| Central American Indian | 25 | 0.2% |
| Colombian | 43 | 0.4% |
| Costa Rican | 20 | 0.2% |
| Croatian | 16 | 0.1% |
| Cuban | 24 | 0.2% |
| Czech | 10 | 0.1% |
| Czechoslovakian | 7 | 0.1% |
| Danish | 24 | 0.2% |
| Dominican | 64 | 0.5% |
| Dutch | 130 | 1.0% |
| Eastern European | 371 | 3.0% |
| Ecuadorian | 18 | 0.1% |
| Egyptian | 42 | 0.3% |
| English | 1,441 | 11.6% |
| Estonian | 10 | 0.1% |
| European | 418 | 3.4% |
| Finnish | 16 | 0.1% |
| French | 103 | 0.8% |
| French Canadian | 50 | 0.4% |
| German | 1,498 | 12.0% |
| Ghanaian | 43 | 0.4% |
| Greek | 129 | 1.0% |
| Guamanian / Chamorro | 64 | 0.5% |
| Guatemalan | 68 | 0.5% |
| Guyanese | 10 | 0.1% |
| Haitian | 55 | 0.4% |
| Hmong | 17 | 0.1% |
| Hungarian | 147 | 1.2% |
| Indian (Asian) | 224 | 1.8% |
| Iranian | 270 | 2.2% |
| Irish | 2,160 | 17.4% |
| Italian | 1,580 | 12.7% |
| Jamaican | 18 | 0.1% |
| Korean | 73 | 0.6% |
| Laotian | 1 | 0.0% |
| Lebanese | 80 | 0.6% |
| Lithuanian | 44 | 0.4% |
| Mexican | 304 | 2.4% |
| Mexican American Indian | 43 | 0.4% |
| Northern European | 10 | 0.1% |
| Norwegian | 44 | 0.4% |
| Pakistani | 11 | 0.1% |
| Palestinian | 5 | 0.0% |
| Peruvian | 38 | 0.3% |
| Polish | 751 | 6.0% |
| Portuguese | 63 | 0.5% |
| Puerto Rican | 205 | 1.7% |
| Romanian | 222 | 1.8% |
| Russian | 409 | 3.3% |
| Scandinavian | 12 | 0.1% |
| Scotch-Irish | 108 | 0.9% |
| Scottish | 403 | 3.2% |
| Serbian | 3 | 0.0% |
| Slovak | 10 | 0.1% |
| Slovene | 19 | 0.2% |
| South American | 187 | 1.5% |
| Spaniard | 25 | 0.2% |
| Spanish | 34 | 0.3% |
| Subsaharan African | 89 | 0.7% |
| Swedish | 108 | 0.9% |
| Swiss | 26 | 0.2% |
| Thai | 217 | 1.7% |
| Trinidadian and Tobagonian | 7 | 0.1% |
| Turkish | 83 | 0.7% |
| Ukrainian | 71 | 0.6% |
| Uruguayan | 10 | 0.1% |
| Venezuelan | 15 | 0.1% |
| Welsh | 151 | 1.2% |
| West Indian | 10 | 0.1% | View All 86 Rows |
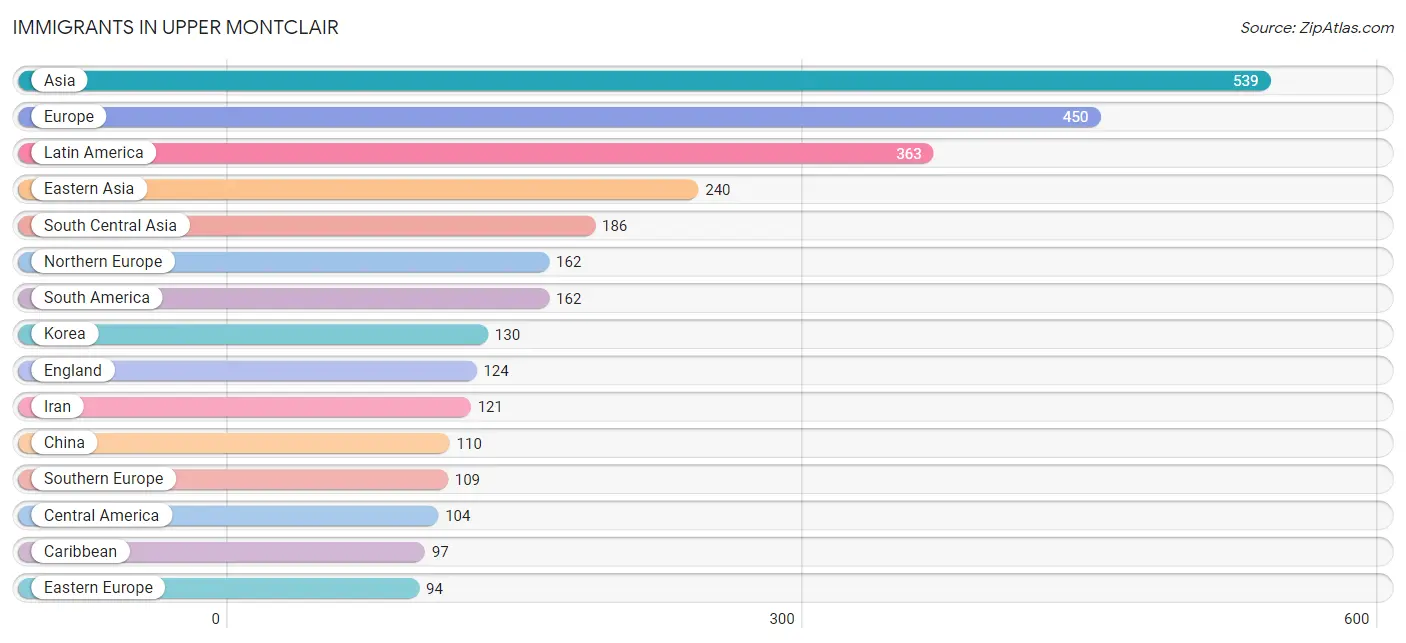
Immigrants in Upper Montclair
The most numerous immigrant groups reported in Upper Montclair came from Asia (539 | 4.3%), Europe (450 | 3.6%), Latin America (363 | 2.9%), Eastern Asia (240 | 1.9%), and South Central Asia (186 | 1.5%), together accounting for 14.3% of all Upper Montclair residents.
| Immigration Origin | # Population | % Population |
| Africa | 81 | 0.6% |
| Argentina | 47 | 0.4% |
| Asia | 539 | 4.3% |
| Brazil | 30 | 0.2% |
| Canada | 38 | 0.3% |
| Caribbean | 97 | 0.8% |
| Central America | 104 | 0.8% |
| China | 110 | 0.9% |
| Colombia | 33 | 0.3% |
| Cuba | 17 | 0.1% |
| Czechoslovakia | 12 | 0.1% |
| Dominican Republic | 39 | 0.3% |
| Eastern Africa | 49 | 0.4% |
| Eastern Asia | 240 | 1.9% |
| Eastern Europe | 94 | 0.8% |
| Ecuador | 18 | 0.1% |
| England | 124 | 1.0% |
| Europe | 450 | 3.6% |
| France | 51 | 0.4% |
| Germany | 16 | 0.1% |
| Ghana | 11 | 0.1% |
| Guatemala | 62 | 0.5% |
| Guyana | 10 | 0.1% |
| Haiti | 25 | 0.2% |
| Hong Kong | 19 | 0.2% |
| India | 65 | 0.5% |
| Indonesia | 1 | 0.0% |
| Iran | 121 | 1.0% |
| Israel | 21 | 0.2% |
| Italy | 64 | 0.5% |
| Kenya | 49 | 0.4% |
| Korea | 130 | 1.0% |
| Kuwait | 5 | 0.0% |
| Latin America | 363 | 2.9% |
| Mexico | 42 | 0.3% |
| Netherlands | 18 | 0.1% |
| Northern Europe | 162 | 1.3% |
| Peru | 9 | 0.1% |
| Philippines | 14 | 0.1% |
| Poland | 15 | 0.1% |
| Portugal | 37 | 0.3% |
| Romania | 28 | 0.2% |
| Russia | 19 | 0.2% |
| South Africa | 21 | 0.2% |
| South America | 162 | 1.3% |
| South Central Asia | 186 | 1.5% |
| South Eastern Asia | 26 | 0.2% |
| Southern Europe | 109 | 0.9% |
| Spain | 8 | 0.1% |
| St. Vincent and the Grenadines | 9 | 0.1% |
| Taiwan | 11 | 0.1% |
| Thailand | 11 | 0.1% |
| Trinidad and Tobago | 7 | 0.1% |
| Turkey | 61 | 0.5% |
| Ukraine | 20 | 0.2% |
| Venezuela | 15 | 0.1% |
| Western Africa | 11 | 0.1% |
| Western Asia | 87 | 0.7% |
| Western Europe | 85 | 0.7% | View All 59 Rows |
Sex and Age in Upper Montclair
Sex and Age in Upper Montclair
The most populous age groups in Upper Montclair are 10 to 14 Years (604 | 9.4%) for men and 60 to 64 Years (595 | 9.9%) for women.
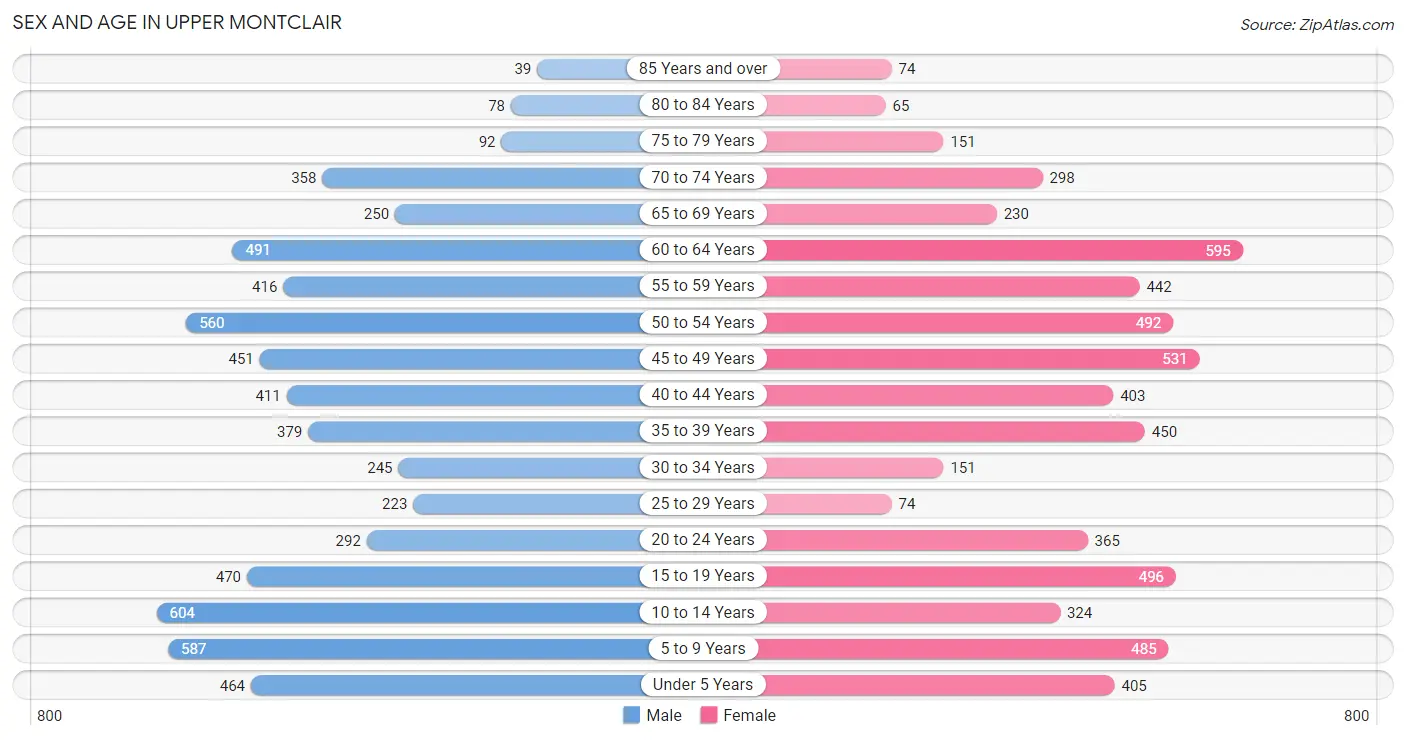
| Age Bracket | Male | Female |
| Under 5 Years | 464 (7.2%) | 405 (6.7%) |
| 5 to 9 Years | 587 (9.2%) | 485 (8.0%) |
| 10 to 14 Years | 604 (9.4%) | 324 (5.4%) |
| 15 to 19 Years | 470 (7.3%) | 496 (8.2%) |
| 20 to 24 Years | 292 (4.6%) | 365 (6.0%) |
| 25 to 29 Years | 223 (3.5%) | 74 (1.2%) |
| 30 to 34 Years | 245 (3.8%) | 151 (2.5%) |
| 35 to 39 Years | 379 (5.9%) | 450 (7.5%) |
| 40 to 44 Years | 411 (6.4%) | 403 (6.7%) |
| 45 to 49 Years | 451 (7.0%) | 531 (8.8%) |
| 50 to 54 Years | 560 (8.7%) | 492 (8.2%) |
| 55 to 59 Years | 416 (6.5%) | 442 (7.3%) |
| 60 to 64 Years | 491 (7.7%) | 595 (9.9%) |
| 65 to 69 Years | 250 (3.9%) | 230 (3.8%) |
| 70 to 74 Years | 358 (5.6%) | 298 (4.9%) |
| 75 to 79 Years | 92 (1.4%) | 151 (2.5%) |
| 80 to 84 Years | 78 (1.2%) | 65 (1.1%) |
| 85 Years and over | 39 (0.6%) | 74 (1.2%) |
| Total | 6,410 (100.0%) | 6,031 (100.0%) |
Families and Households in Upper Montclair
Median Family Size in Upper Montclair
The median family size in Upper Montclair is 3.34 persons per family, with married-couple families (3,040 | 92.1%) accounting for the largest median family size of 3.4 persons per family. On the other hand, single male/father families (80 | 2.4%) represent the smallest median family size with 2.61 persons per family.
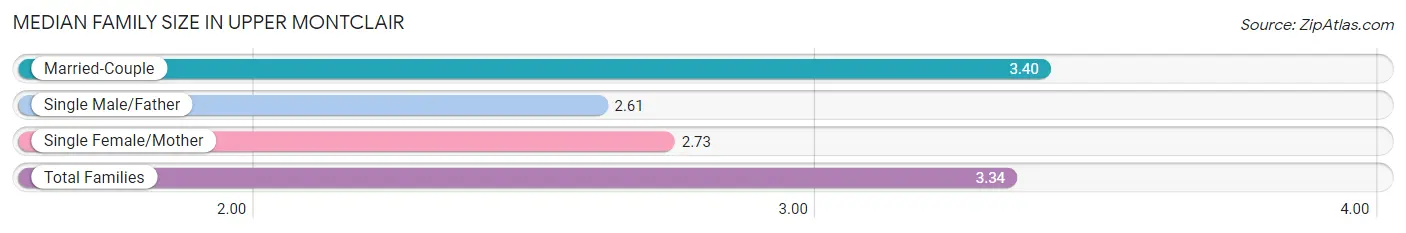
| Family Type | # Families | Family Size |
| Married-Couple | 3,040 (92.1%) | 3.40 |
| Single Male/Father | 80 (2.4%) | 2.61 |
| Single Female/Mother | 180 (5.4%) | 2.73 |
| Total Families | 3,300 (100.0%) | 3.34 |
Median Household Size in Upper Montclair
The median household size in Upper Montclair is 3.04 persons per household, with married-couple households (3,040 | 75.1%) accounting for the largest median household size of 3.47 persons per household. non-family households (747 | 18.5%) represent the smallest median household size with 1.27 persons per household.
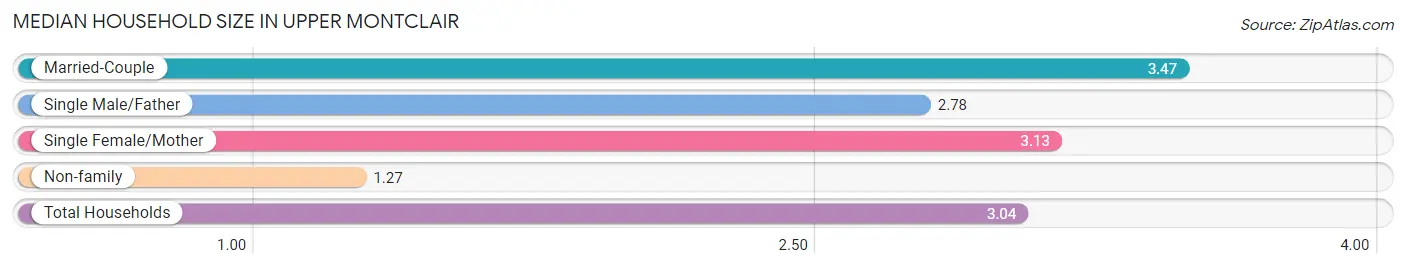
| Household Type | # Households | Household Size |
| Married-Couple | 3,040 (75.1%) | 3.47 |
| Single Male/Father | 80 (2.0%) | 2.78 |
| Single Female/Mother | 180 (4.4%) | 3.13 |
| Non-family | 747 (18.5%) | 1.27 |
| Total Households | 4,047 (100.0%) | 3.04 |
Household Size by Marriage Status in Upper Montclair
Out of a total of 4,047 households in Upper Montclair, 3,300 (81.5%) are family households, while 747 (18.5%) are nonfamily households. The most numerous type of family households are 2-person households, comprising 1,057, and the most common type of nonfamily households are 1-person households, comprising 599.
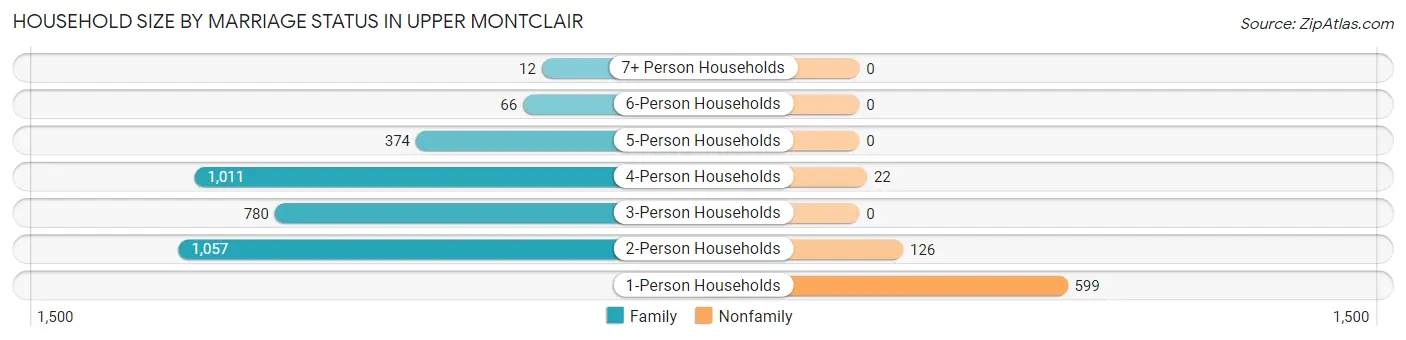
| Household Size | Family Households | Nonfamily Households |
| 1-Person Households | - | 599 (14.8%) |
| 2-Person Households | 1,057 (26.1%) | 126 (3.1%) |
| 3-Person Households | 780 (19.3%) | 0 (0.0%) |
| 4-Person Households | 1,011 (25.0%) | 22 (0.5%) |
| 5-Person Households | 374 (9.2%) | 0 (0.0%) |
| 6-Person Households | 66 (1.6%) | 0 (0.0%) |
| 7+ Person Households | 12 (0.3%) | 0 (0.0%) |
| Total | 3,300 (81.5%) | 747 (18.5%) |
Female Fertility in Upper Montclair
Fertility by Age in Upper Montclair
Average fertility rate in Upper Montclair is 44.0 births per 1,000 women. Women in the age bracket of 35 to 50 years have the highest fertility rate with 60.0 births per 1,000 women. Women in the age bracket of 35 to 50 years acount for 78.3% of all women with births.
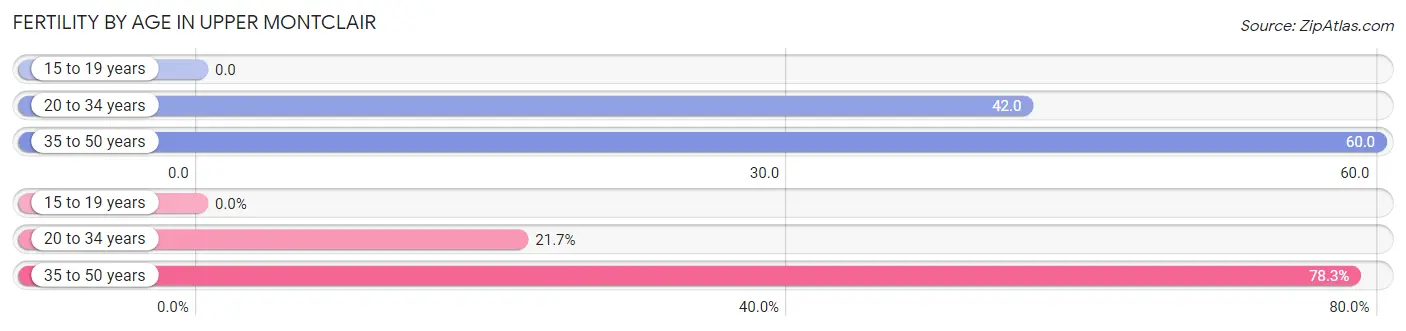
| Age Bracket | Women with Births | Births / 1,000 Women |
| 15 to 19 years | 0 (0.0%) | 0.0 |
| 20 to 34 years | 25 (21.7%) | 42.0 |
| 35 to 50 years | 90 (78.3%) | 60.0 |
| Total | 115 (100.0%) | 44.0 |
Fertility by Age by Marriage Status in Upper Montclair
99.1% of women with births (115) in Upper Montclair are married. The highest percentage of unmarried women with births falls into 20 to 34 years age bracket with 4.0% of them unmarried at the time of birth, while the lowest percentage of unmarried women with births belong to 35 to 50 years age bracket with 0.0% of them unmarried.
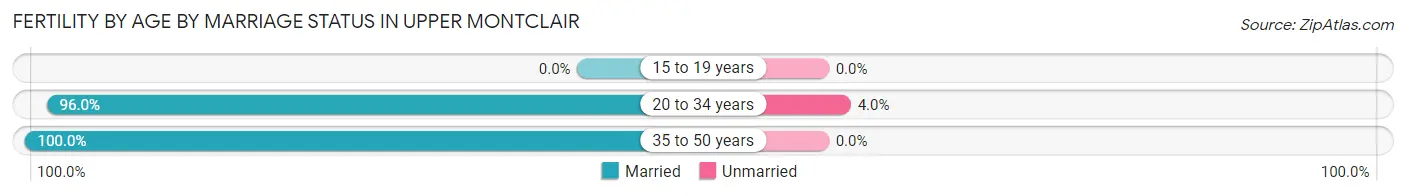
| Age Bracket | Married | Unmarried |
| 15 to 19 years | 0 (0.0%) | 0 (0.0%) |
| 20 to 34 years | 24 (96.0%) | 1 (4.0%) |
| 35 to 50 years | 90 (100.0%) | 0 (0.0%) |
| Total | 114 (99.1%) | 1 (0.9%) |
Fertility by Education in Upper Montclair
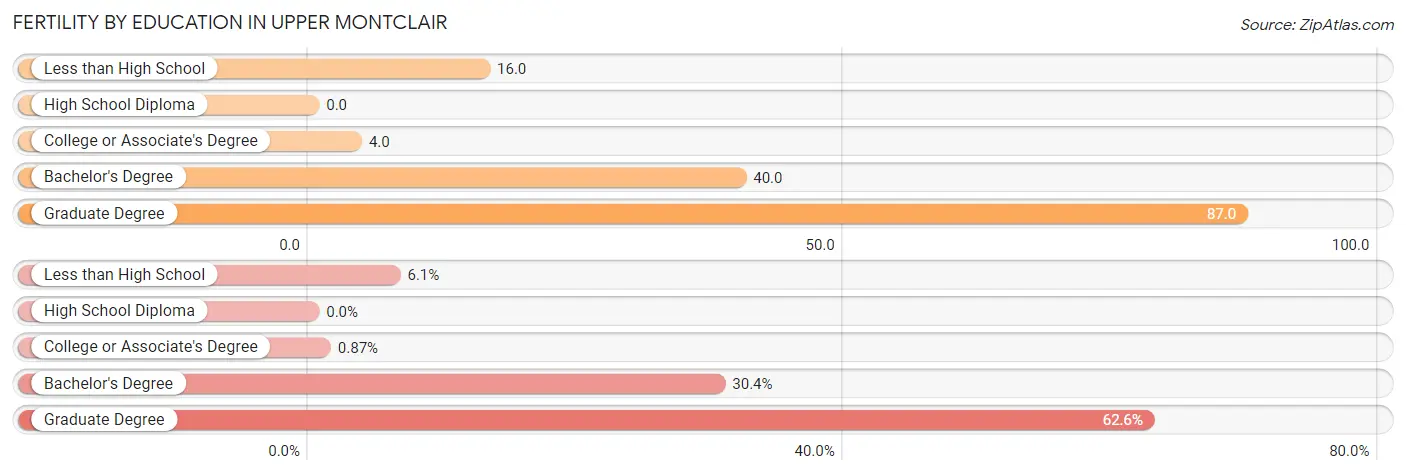
| Educational Attainment | Women with Births | Births / 1,000 Women |
| Less than High School | 7 (6.1%) | 16.0 |
| High School Diploma | 0 (0.0%) | 0.0 |
| College or Associate's Degree | 1 (0.9%) | 4.0 |
| Bachelor's Degree | 35 (30.4%) | 40.0 |
| Graduate Degree | 72 (62.6%) | 87.0 |
| Total | 115 (100.0%) | 44.0 |
Fertility by Education by Marriage Status in Upper Montclair
0.9% of women with births in Upper Montclair are unmarried. Women with the educational attainment of less than high school are most likely to be married with 100.0% of them married at childbirth, while women with the educational attainment of college or associate's degree are least likely to be married with 100.0% of them unmarried at childbirth.
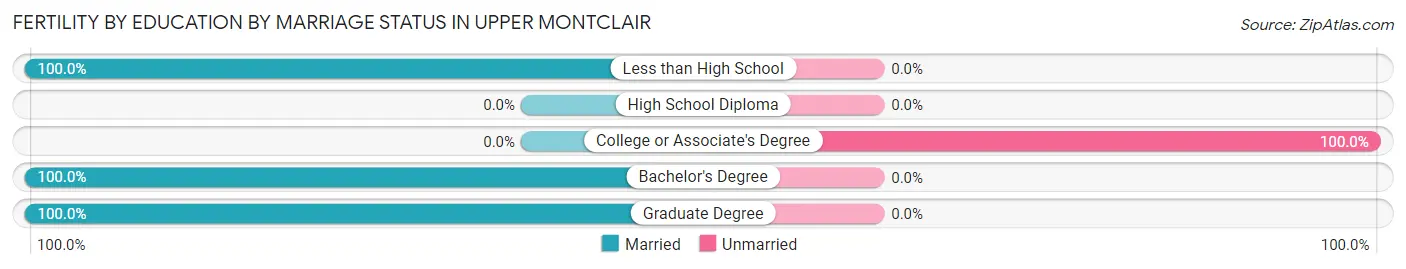
| Educational Attainment | Married | Unmarried |
| Less than High School | 7 (100.0%) | 0 (0.0%) |
| High School Diploma | 0 (0.0%) | 0 (0.0%) |
| College or Associate's Degree | 0 (0.0%) | 1 (100.0%) |
| Bachelor's Degree | 35 (100.0%) | 0 (0.0%) |
| Graduate Degree | 72 (100.0%) | 0 (0.0%) |
| Total | 114 (99.1%) | 1 (0.9%) |
Income in Upper Montclair
Income Overview in Upper Montclair
Per Capita Income in Upper Montclair is $102,287, while median incomes of families and households are $250,001 and $234,620 respectively.
| Characteristic | Number | Measure |
| Per Capita Income | 12,441 | $102,287 |
| Median Family Income | 3,300 | $250,001 |
| Mean Family Income | 3,300 | $350,455 |
| Median Household Income | 4,047 | $234,620 |
| Mean Household Income | 4,047 | $310,147 |
| Income Deficit | 3,300 | $0 |
| Wage / Income Gap (%) | 12,441 | 39.11% |
| Wage / Income Gap ($) | 12,441 | 60.89¢ per $1 |
| Gini / Inequality Index | 12,441 | 0.44 |
Earnings by Sex in Upper Montclair
Average Earnings in Upper Montclair are $91,199, $113,884 for men and $69,341 for women, a difference of 39.1%.
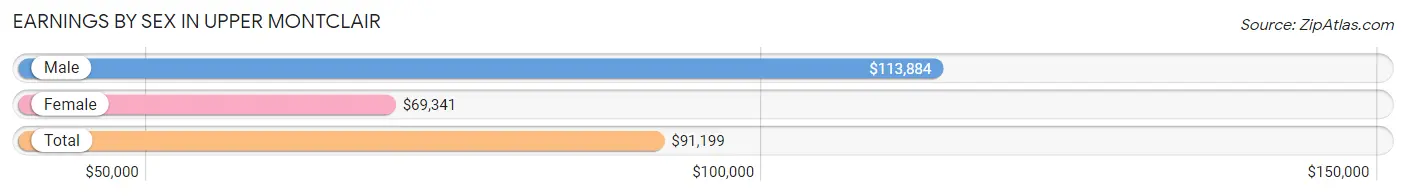
| Sex | Number | Average Earnings |
| Male | 3,901 (54.3%) | $113,884 |
| Female | 3,289 (45.7%) | $69,341 |
| Total | 7,190 (100.0%) | $91,199 |
Earnings by Sex by Income Bracket in Upper Montclair
The most common earnings brackets in Upper Montclair are $100,000+ for men (2,149 | 55.1%) and $100,000+ for women (1,193 | 36.3%).
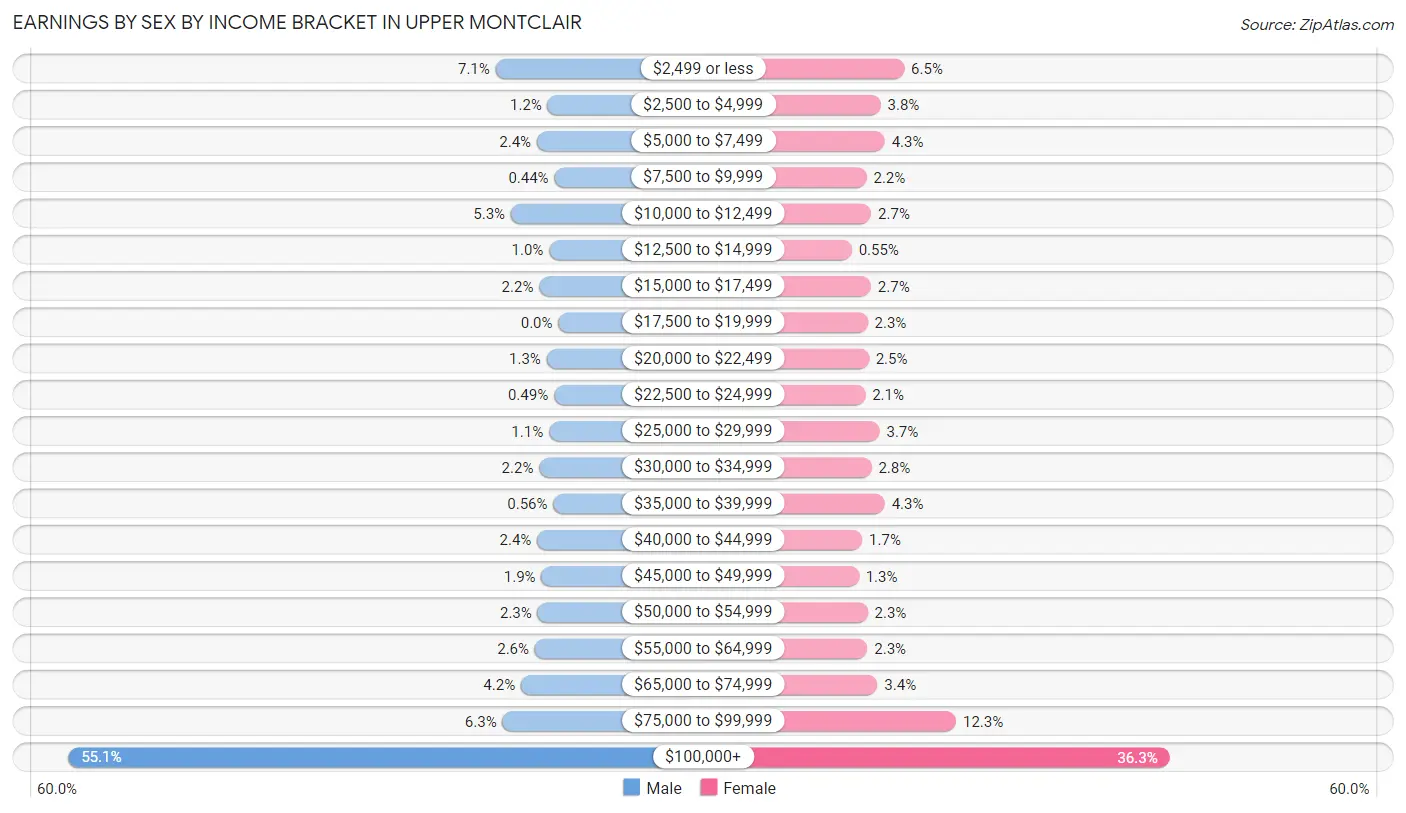
| Income | Male | Female |
| $2,499 or less | 275 (7.0%) | 212 (6.5%) |
| $2,500 to $4,999 | 47 (1.2%) | 125 (3.8%) |
| $5,000 to $7,499 | 94 (2.4%) | 140 (4.3%) |
| $7,500 to $9,999 | 17 (0.4%) | 73 (2.2%) |
| $10,000 to $12,499 | 208 (5.3%) | 90 (2.7%) |
| $12,500 to $14,999 | 40 (1.0%) | 18 (0.5%) |
| $15,000 to $17,499 | 84 (2.1%) | 89 (2.7%) |
| $17,500 to $19,999 | 0 (0.0%) | 77 (2.3%) |
| $20,000 to $22,499 | 51 (1.3%) | 81 (2.5%) |
| $22,500 to $24,999 | 19 (0.5%) | 68 (2.1%) |
| $25,000 to $29,999 | 41 (1.1%) | 121 (3.7%) |
| $30,000 to $34,999 | 84 (2.1%) | 91 (2.8%) |
| $35,000 to $39,999 | 22 (0.6%) | 140 (4.3%) |
| $40,000 to $44,999 | 93 (2.4%) | 57 (1.7%) |
| $45,000 to $49,999 | 74 (1.9%) | 44 (1.3%) |
| $50,000 to $54,999 | 91 (2.3%) | 77 (2.3%) |
| $55,000 to $64,999 | 103 (2.6%) | 76 (2.3%) |
| $65,000 to $74,999 | 164 (4.2%) | 113 (3.4%) |
| $75,000 to $99,999 | 245 (6.3%) | 404 (12.3%) |
| $100,000+ | 2,149 (55.1%) | 1,193 (36.3%) |
| Total | 3,901 (100.0%) | 3,289 (100.0%) |
Earnings by Sex by Educational Attainment in Upper Montclair
Average earnings in Upper Montclair are $136,130 for men and $90,286 for women, a difference of 33.7%. Men with an educational attainment of bachelor's degree enjoy the highest average annual earnings of $151,063, while those with college or associate's degree education earn the least with $46,875. Women with an educational attainment of graduate degree earn the most with the average annual earnings of $104,839, while those with high school diploma education have the smallest earnings of $11,442.
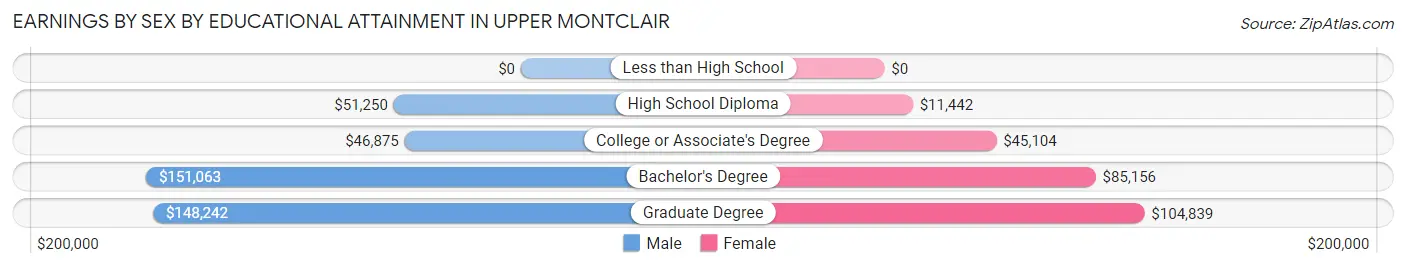
| Educational Attainment | Male Income | Female Income |
| Less than High School | - | - |
| High School Diploma | $51,250 | $11,442 |
| College or Associate's Degree | $46,875 | $45,104 |
| Bachelor's Degree | $151,063 | $85,156 |
| Graduate Degree | $148,242 | $104,839 |
| Total | $136,130 | $90,286 |
Family Income in Upper Montclair
Family Income Brackets in Upper Montclair
According to the Upper Montclair family income data, there are 2,188 families falling into the $200,000+ income range, which is the most common income bracket and makes up 66.3% of all families.
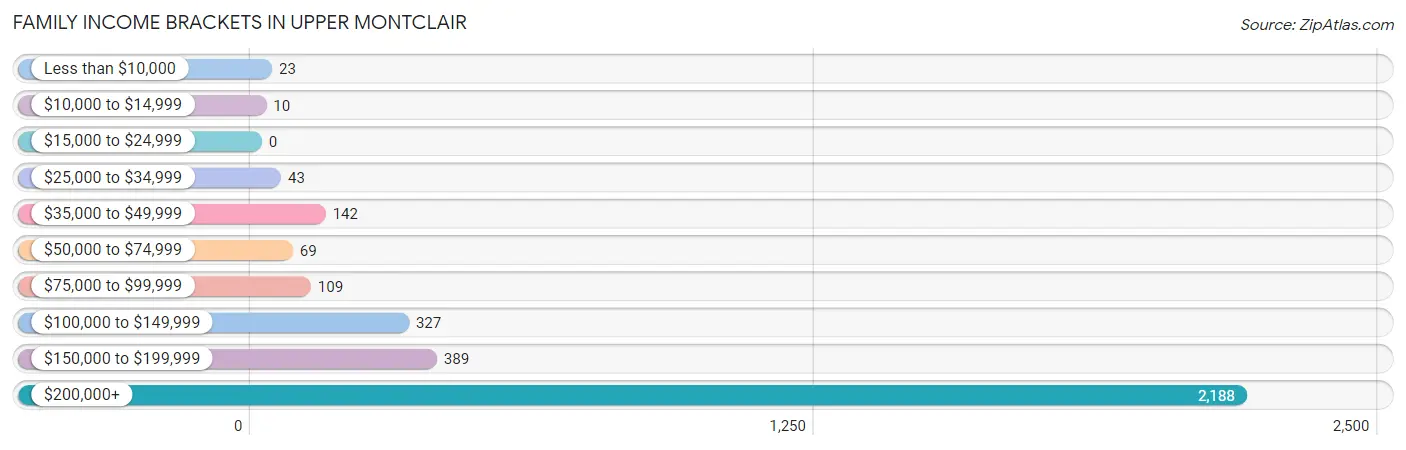
| Income Bracket | # Families | % Families |
| Less than $10,000 | 23 | 0.7% |
| $10,000 to $14,999 | 10 | 0.3% |
| $15,000 to $24,999 | 0 | 0.0% |
| $25,000 to $34,999 | 43 | 1.3% |
| $35,000 to $49,999 | 142 | 4.3% |
| $50,000 to $74,999 | 69 | 2.1% |
| $75,000 to $99,999 | 109 | 3.3% |
| $100,000 to $149,999 | 327 | 9.9% |
| $150,000 to $199,999 | 389 | 11.8% |
| $200,000+ | 2,188 | 66.3% |
Family Income by Famaliy Size in Upper Montclair
2-person families (1,107 | 33.6%) account for the highest median family income in Upper Montclair with $250,001 per family, while 2-person families (1,107 | 33.6%) have the highest median income of $125,000 per family member.
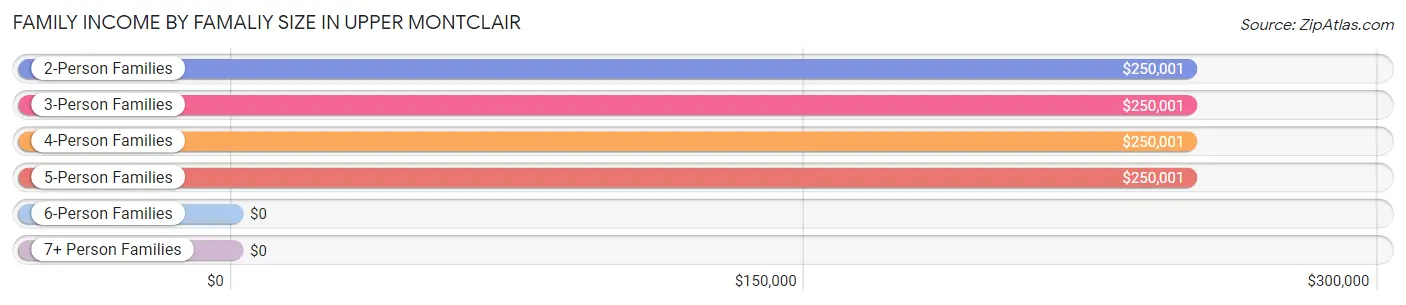
| Income Bracket | # Families | Median Income |
| 2-Person Families | 1,107 (33.6%) | $250,001 |
| 3-Person Families | 872 (26.4%) | $250,001 |
| 4-Person Families | 921 (27.9%) | $250,001 |
| 5-Person Families | 356 (10.8%) | $250,001 |
| 6-Person Families | 44 (1.3%) | $0 |
| 7+ Person Families | 0 (0.0%) | $0 |
| Total | 3,300 (100.0%) | $250,001 |
Family Income by Number of Earners in Upper Montclair
The median family income in Upper Montclair is $250,001, with families comprising 2 earners (1,807) having the highest median family income of $250,001, while families with no earners (172) have the lowest median family income of $87,333, accounting for 54.8% and 5.2% of families, respectively.
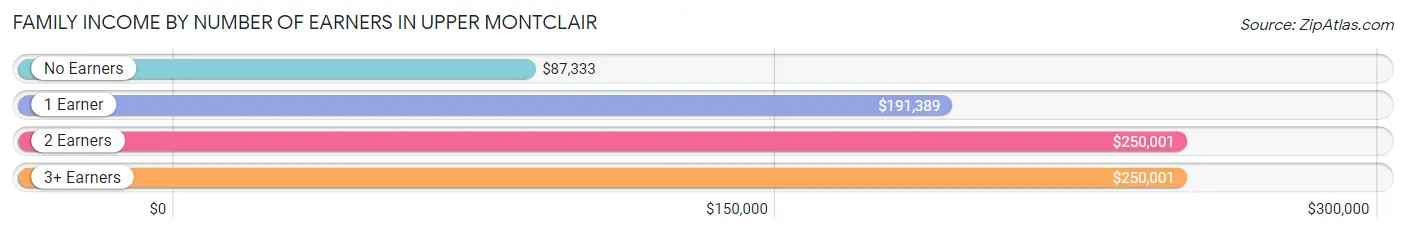
| Number of Earners | # Families | Median Income |
| No Earners | 172 (5.2%) | $87,333 |
| 1 Earner | 744 (22.6%) | $191,389 |
| 2 Earners | 1,807 (54.8%) | $250,001 |
| 3+ Earners | 577 (17.5%) | $250,001 |
| Total | 3,300 (100.0%) | $250,001 |
Household Income in Upper Montclair
Household Income Brackets in Upper Montclair
With 2,315 households falling in the category, the $200,000+ income range is the most frequent in Upper Montclair, accounting for 57.2% of all households. In contrast, only 8 households (0.2%) fall into the $15,000 to $24,999 income bracket, making it the least populous group.
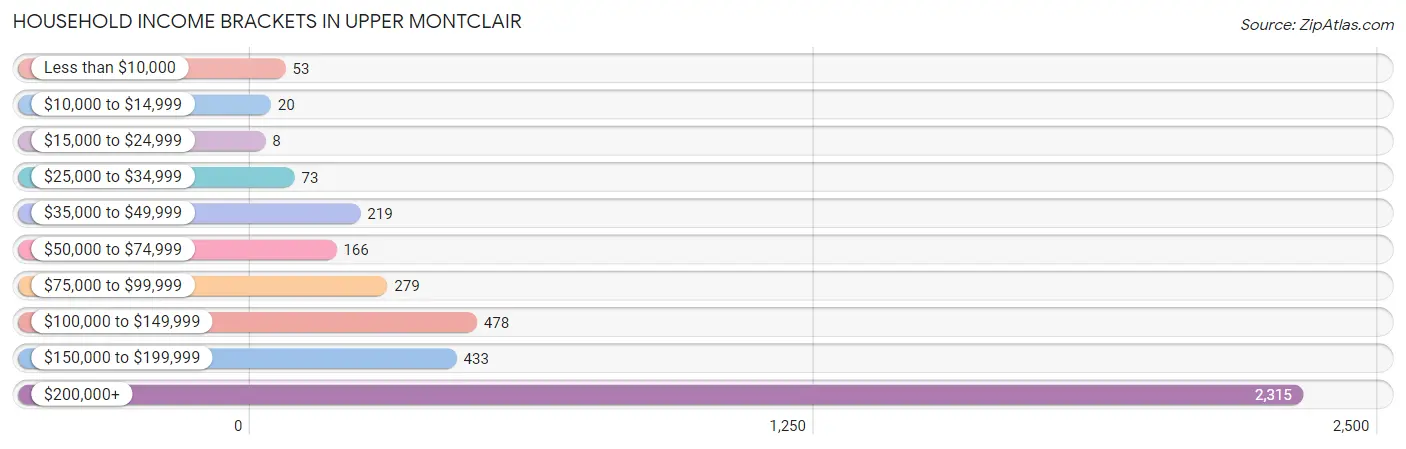
| Income Bracket | # Households | % Households |
| Less than $10,000 | 53 | 1.3% |
| $10,000 to $14,999 | 20 | 0.5% |
| $15,000 to $24,999 | 8 | 0.2% |
| $25,000 to $34,999 | 73 | 1.8% |
| $35,000 to $49,999 | 219 | 5.4% |
| $50,000 to $74,999 | 166 | 4.1% |
| $75,000 to $99,999 | 279 | 6.9% |
| $100,000 to $149,999 | 478 | 11.8% |
| $150,000 to $199,999 | 433 | 10.7% |
| $200,000+ | 2,315 | 57.2% |
Household Income by Householder Age in Upper Montclair
The median household income in Upper Montclair is $234,620, with the highest median household income of $250,001 found in the 25 to 44 years age bracket for the primary householder. A total of 1,016 households (25.1%) fall into this category. Meanwhile, the 15 to 24 years age bracket for the primary householder has the lowest median household income of $0, with 11 households (0.3%) in this group.
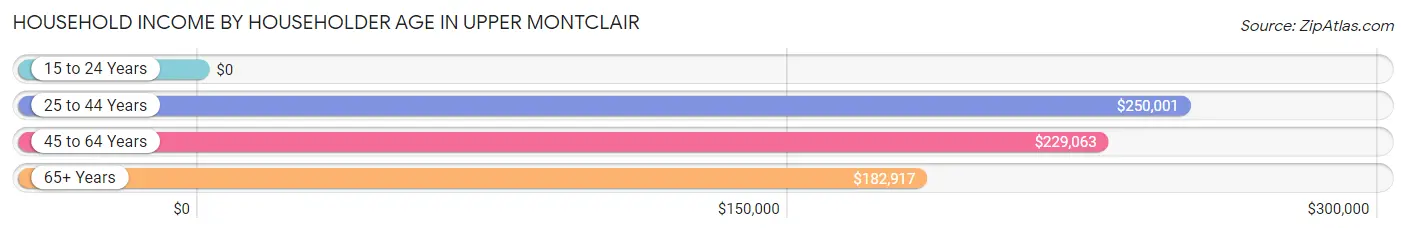
| Income Bracket | # Households | Median Income |
| 15 to 24 Years | 11 (0.3%) | $0 |
| 25 to 44 Years | 1,016 (25.1%) | $250,001 |
| 45 to 64 Years | 2,059 (50.9%) | $229,063 |
| 65+ Years | 961 (23.7%) | $182,917 |
| Total | 4,047 (100.0%) | $234,620 |
Poverty in Upper Montclair
Income Below Poverty by Sex and Age in Upper Montclair
With 1.8% poverty level for males and 2.7% for females among the residents of Upper Montclair, 25 to 34 year old males and 75 year old and over females are the most vulnerable to poverty, with 42 males (9.0%) and 30 females (10.3%) in their respective age groups living below the poverty level.
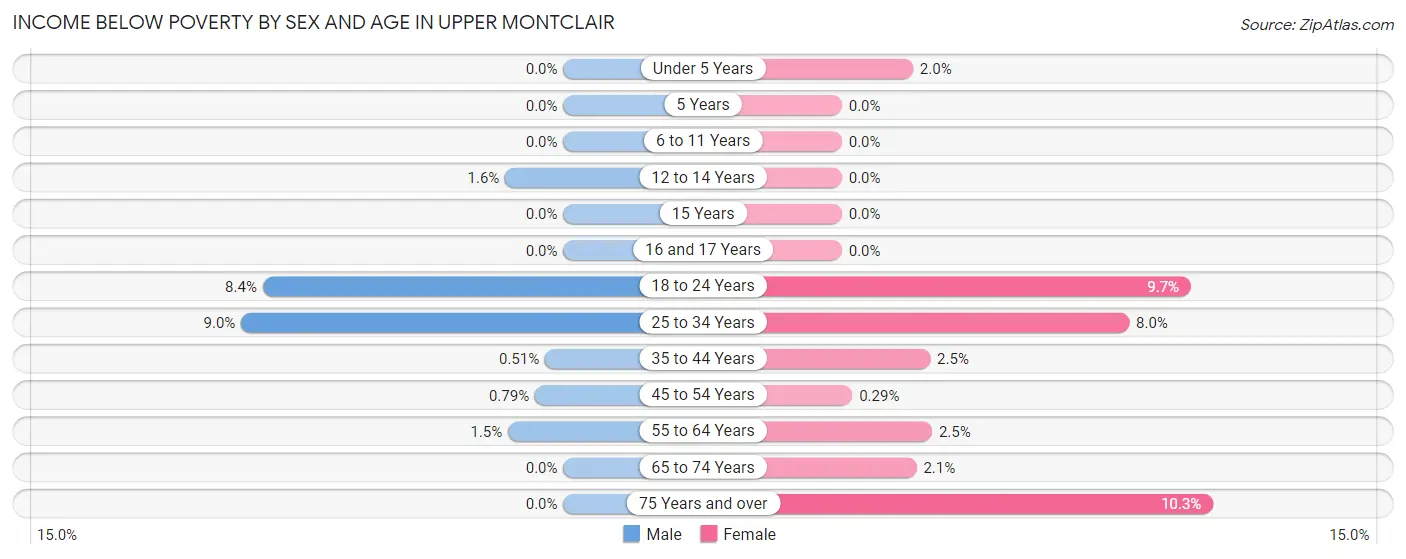
| Age Bracket | Male | Female |
| Under 5 Years | 0 (0.0%) | 8 (2.0%) |
| 5 Years | 0 (0.0%) | 0 (0.0%) |
| 6 to 11 Years | 0 (0.0%) | 0 (0.0%) |
| 12 to 14 Years | 7 (1.6%) | 0 (0.0%) |
| 15 Years | 0 (0.0%) | 0 (0.0%) |
| 16 and 17 Years | 0 (0.0%) | 0 (0.0%) |
| 18 to 24 Years | 36 (8.4%) | 42 (9.7%) |
| 25 to 34 Years | 42 (9.0%) | 18 (8.0%) |
| 35 to 44 Years | 4 (0.5%) | 21 (2.5%) |
| 45 to 54 Years | 8 (0.8%) | 3 (0.3%) |
| 55 to 64 Years | 14 (1.5%) | 26 (2.5%) |
| 65 to 74 Years | 0 (0.0%) | 11 (2.1%) |
| 75 Years and over | 0 (0.0%) | 30 (10.3%) |
| Total | 111 (1.8%) | 159 (2.7%) |
Income Above Poverty by Sex and Age in Upper Montclair
According to the poverty statistics in Upper Montclair, males aged under 5 years and females aged 5 years are the age groups that are most secure financially, with 100.0% of males and 100.0% of females in these age groups living above the poverty line.
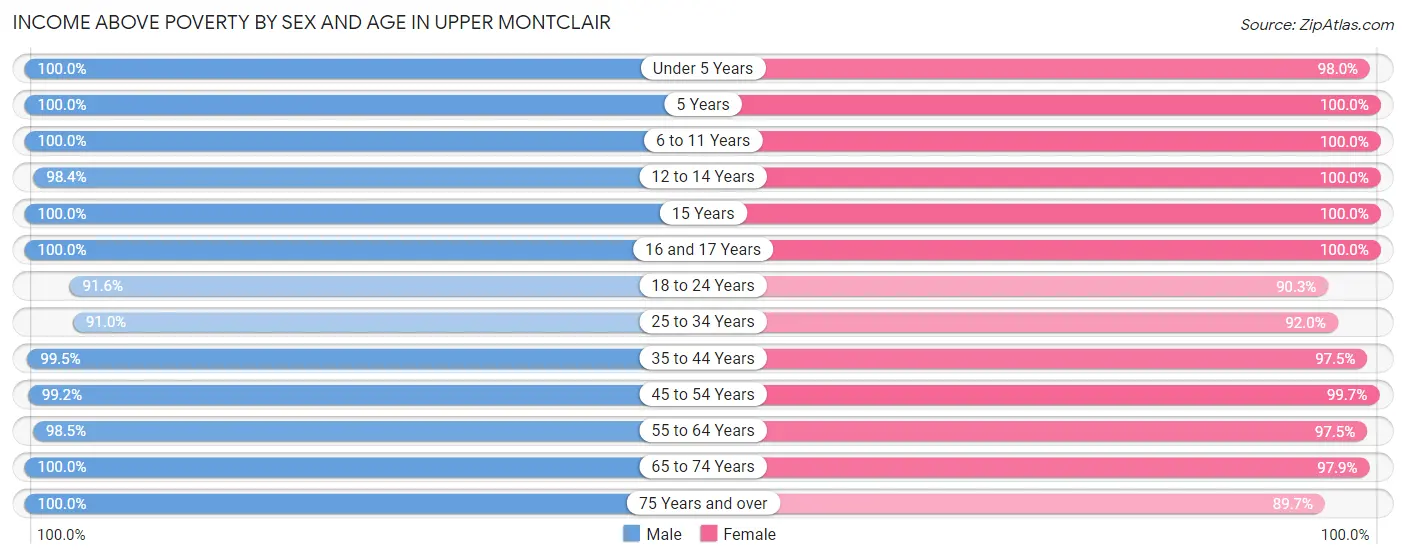
| Age Bracket | Male | Female |
| Under 5 Years | 464 (100.0%) | 397 (98.0%) |
| 5 Years | 135 (100.0%) | 159 (100.0%) |
| 6 to 11 Years | 623 (100.0%) | 404 (100.0%) |
| 12 to 14 Years | 426 (98.4%) | 223 (100.0%) |
| 15 Years | 112 (100.0%) | 121 (100.0%) |
| 16 and 17 Years | 167 (100.0%) | 236 (100.0%) |
| 18 to 24 Years | 394 (91.6%) | 390 (90.3%) |
| 25 to 34 Years | 426 (91.0%) | 207 (92.0%) |
| 35 to 44 Years | 786 (99.5%) | 832 (97.5%) |
| 45 to 54 Years | 1,003 (99.2%) | 1,020 (99.7%) |
| 55 to 64 Years | 893 (98.5%) | 1,011 (97.5%) |
| 65 to 74 Years | 608 (100.0%) | 517 (97.9%) |
| 75 Years and over | 209 (100.0%) | 260 (89.7%) |
| Total | 6,246 (98.3%) | 5,777 (97.3%) |
Income Below Poverty Among Married-Couple Families in Upper Montclair
The poverty statistics for married-couple families in Upper Montclair show that 0.8% or 23 of the total 3,040 families live below the poverty line. Families with no children have the highest poverty rate of 1.1%, comprising of 15 families. On the other hand, families with 3 or 4 children have the lowest poverty rate of 0.0%, which includes 0 families.
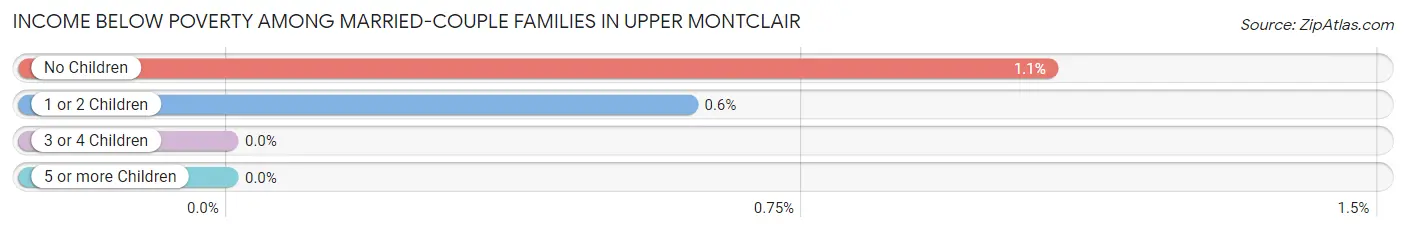
| Children | Above Poverty | Below Poverty |
| No Children | 1,389 (98.9%) | 15 (1.1%) |
| 1 or 2 Children | 1,316 (99.4%) | 8 (0.6%) |
| 3 or 4 Children | 312 (100.0%) | 0 (0.0%) |
| 5 or more Children | 0 (0.0%) | 0 (0.0%) |
| Total | 3,017 (99.2%) | 23 (0.8%) |
Income Below Poverty Among Single-Parent Households in Upper Montclair
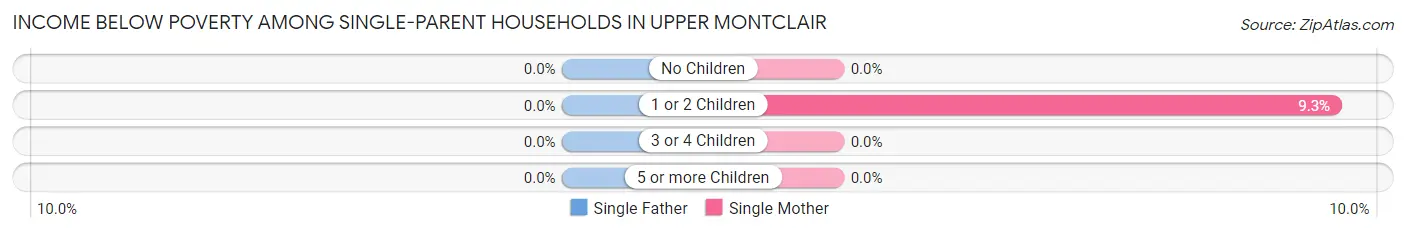
| Children | Single Father | Single Mother |
| No Children | 0 (0.0%) | 0 (0.0%) |
| 1 or 2 Children | 0 (0.0%) | 9 (9.3%) |
| 3 or 4 Children | 0 (0.0%) | 0 (0.0%) |
| 5 or more Children | 0 (0.0%) | 0 (0.0%) |
| Total | 0 (0.0%) | 9 (5.0%) |
Income Below Poverty Among Married-Couple vs Single-Parent Households in Upper Montclair
The poverty data for Upper Montclair shows that 23 of the married-couple family households (0.8%) and 9 of the single-parent households (3.5%) are living below the poverty level. Within the married-couple family households, those with no children have the highest poverty rate, with 15 households (1.1%) falling below the poverty line. Among the single-parent households, those with 1 or 2 children have the highest poverty rate, with 9 household (8.2%) living below poverty.
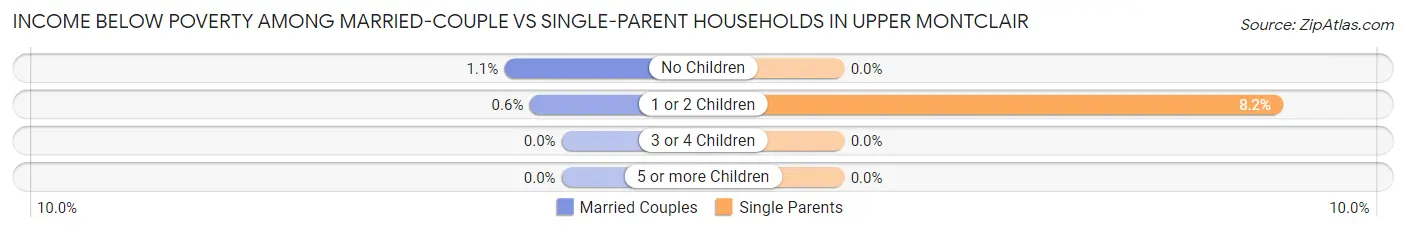
| Children | Married-Couple Families | Single-Parent Households |
| No Children | 15 (1.1%) | 0 (0.0%) |
| 1 or 2 Children | 8 (0.6%) | 9 (8.2%) |
| 3 or 4 Children | 0 (0.0%) | 0 (0.0%) |
| 5 or more Children | 0 (0.0%) | 0 (0.0%) |
| Total | 23 (0.8%) | 9 (3.5%) |
Employment Characteristics in Upper Montclair
Employment by Class of Employer in Upper Montclair
Among the 5,984 employed individuals in Upper Montclair, private company employees (3,477 | 58.1%), not-for-profit organizations (764 | 12.8%), and self-employed (not incorporated) (693 | 11.6%) make up the most common classes of employment.
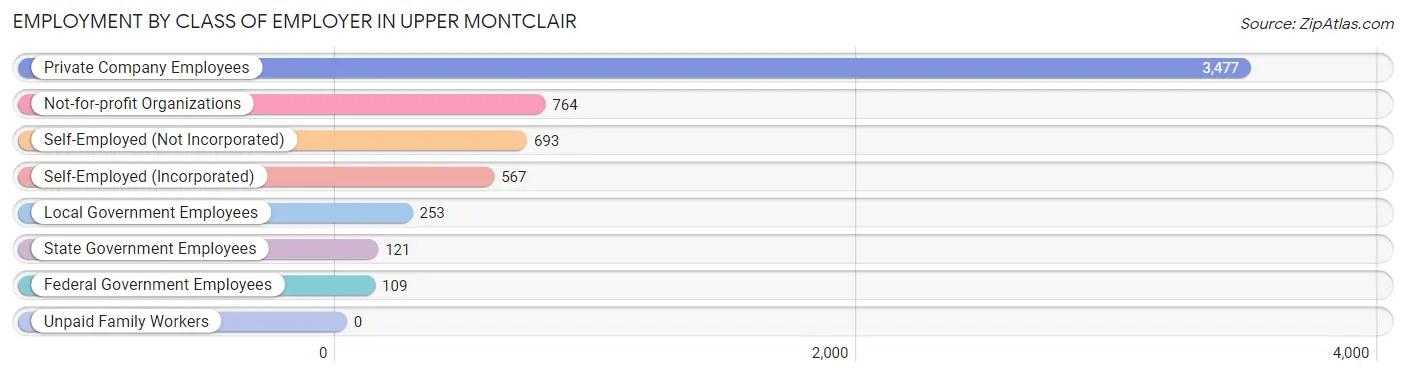
| Employer Class | # Employees | % Employees |
| Private Company Employees | 3,477 | 58.1% |
| Self-Employed (Incorporated) | 567 | 9.5% |
| Self-Employed (Not Incorporated) | 693 | 11.6% |
| Not-for-profit Organizations | 764 | 12.8% |
| Local Government Employees | 253 | 4.2% |
| State Government Employees | 121 | 2.0% |
| Federal Government Employees | 109 | 1.8% |
| Unpaid Family Workers | 0 | 0.0% |
| Total | 5,984 | 100.0% |
Employment Status by Age in Upper Montclair
According to the labor force statistics for Upper Montclair, out of the total population over 16 years of age (9,339), 69.7% or 6,509 individuals are in the labor force, with 6.3% or 410 of them unemployed. The age group with the highest labor force participation rate is 45 to 54 years, with 89.7% or 1,824 individuals in the labor force. Within the labor force, the 25 to 29 years age range has the highest percentage of unemployed individuals, with 40.7% or 59 of them being unemployed.
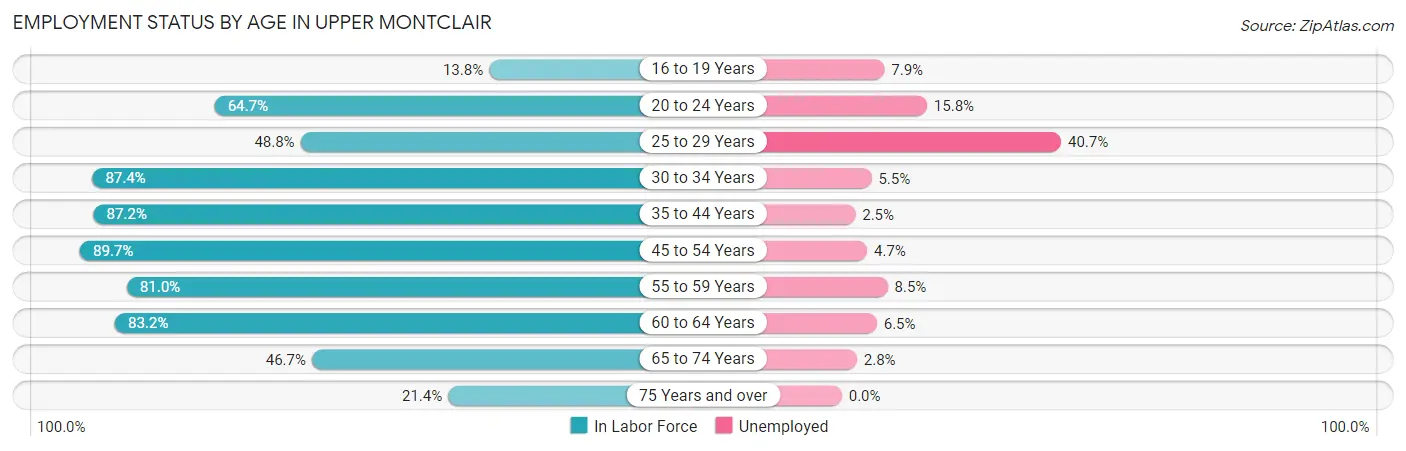
| Age Bracket | In Labor Force | Unemployed |
| 16 to 19 Years | 101 (13.8%) | 8 (7.9%) |
| 20 to 24 Years | 425 (64.7%) | 67 (15.8%) |
| 25 to 29 Years | 145 (48.8%) | 59 (40.7%) |
| 30 to 34 Years | 346 (87.4%) | 19 (5.5%) |
| 35 to 44 Years | 1,433 (87.2%) | 36 (2.5%) |
| 45 to 54 Years | 1,824 (89.7%) | 86 (4.7%) |
| 55 to 59 Years | 695 (81.0%) | 59 (8.5%) |
| 60 to 64 Years | 904 (83.2%) | 59 (6.5%) |
| 65 to 74 Years | 531 (46.7%) | 15 (2.8%) |
| 75 Years and over | 107 (21.4%) | 0 (0.0%) |
| Total | 6,509 (69.7%) | 410 (6.3%) |
Employment Status by Educational Attainment in Upper Montclair
According to labor force statistics for Upper Montclair, 84.7% of individuals (5,348) out of the total population between 25 and 64 years of age (6,314) are in the labor force, with 5.9% or 316 of them being unemployed. The group with the highest labor force participation rate are those with the educational attainment of bachelor's degree or higher, with 87.9% or 4,688 individuals in the labor force. Within the labor force, individuals with college / associate degree education have the highest percentage of unemployment, with 14.5% or 77 of them being unemployed.
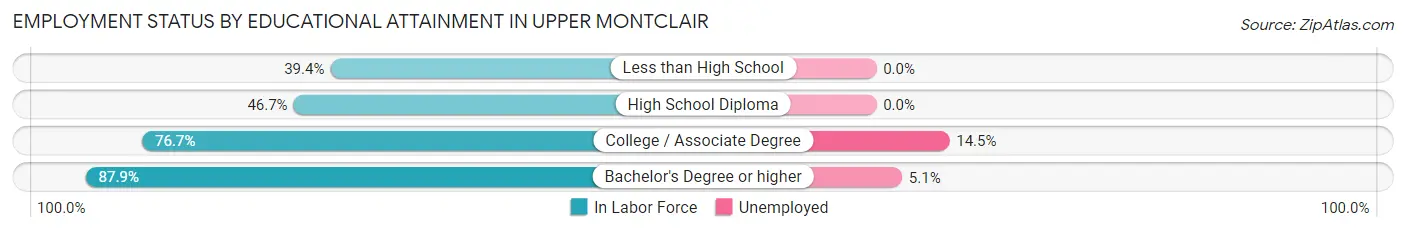
| Educational Attainment | In Labor Force | Unemployed |
| Less than High School | 43 (39.4%) | 0 (0.0%) |
| High School Diploma | 84 (46.7%) | 0 (0.0%) |
| College / Associate Degree | 531 (76.7%) | 100 (14.5%) |
| Bachelor's Degree or higher | 4,688 (87.9%) | 272 (5.1%) |
| Total | 5,348 (84.7%) | 373 (5.9%) |
Employment Occupations by Sex in Upper Montclair
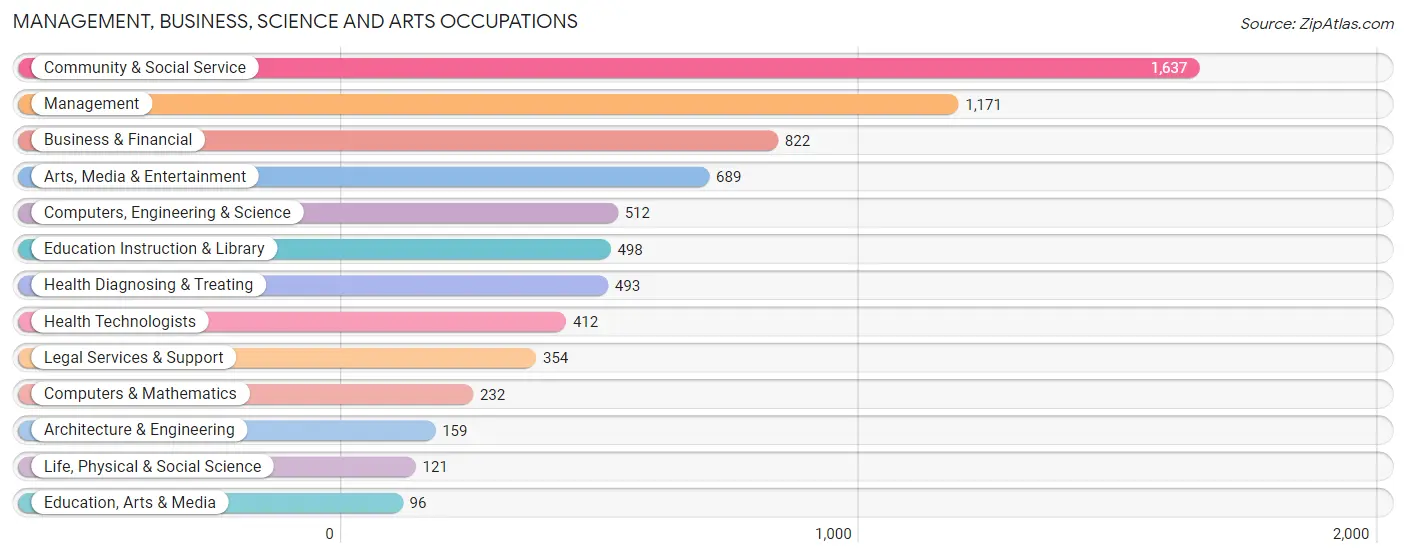
Management, Business, Science and Arts Occupations
The most common Management, Business, Science and Arts occupations in Upper Montclair are Community & Social Service (1,637 | 26.8%), Management (1,171 | 19.2%), Business & Financial (822 | 13.5%), Arts, Media & Entertainment (689 | 11.3%), and Computers, Engineering & Science (512 | 8.4%).
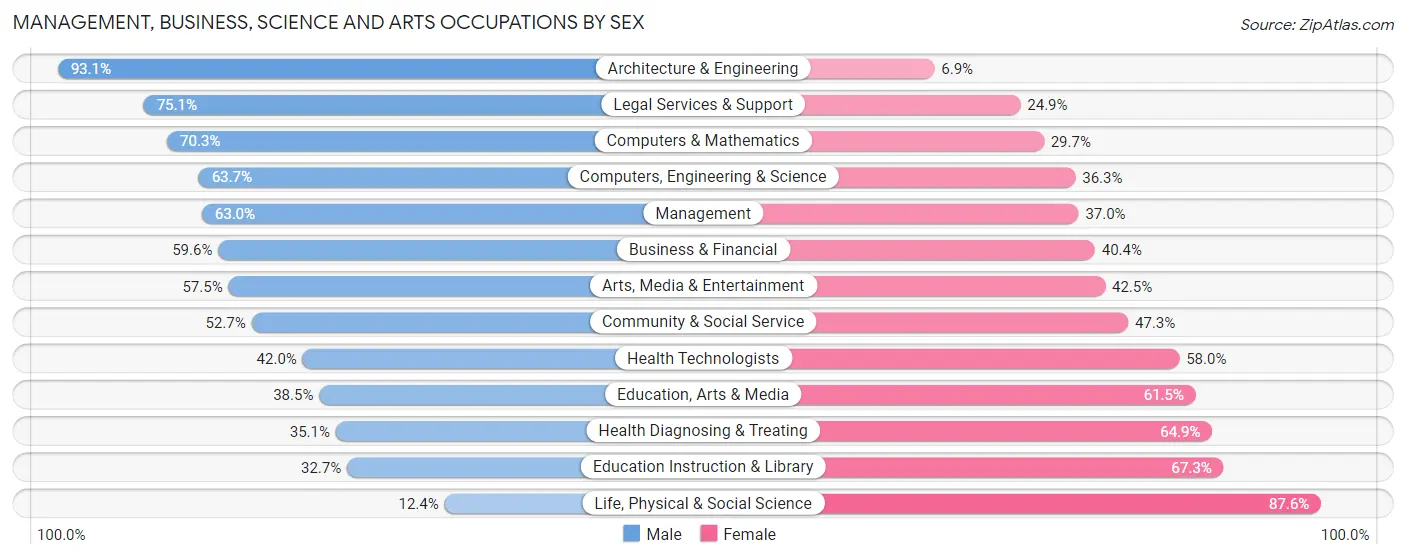
Management, Business, Science and Arts Occupations by Sex
Within the Management, Business, Science and Arts occupations in Upper Montclair, the most male-oriented occupations are Architecture & Engineering (93.1%), Legal Services & Support (75.1%), and Computers & Mathematics (70.3%), while the most female-oriented occupations are Life, Physical & Social Science (87.6%), Education Instruction & Library (67.3%), and Health Diagnosing & Treating (64.9%).
| Occupation | Male | Female |
| Management | 738 (63.0%) | 433 (37.0%) |
| Business & Financial | 490 (59.6%) | 332 (40.4%) |
| Computers, Engineering & Science | 326 (63.7%) | 186 (36.3%) |
| Computers & Mathematics | 163 (70.3%) | 69 (29.7%) |
| Architecture & Engineering | 148 (93.1%) | 11 (6.9%) |
| Life, Physical & Social Science | 15 (12.4%) | 106 (87.6%) |
| Community & Social Service | 862 (52.7%) | 775 (47.3%) |
| Education, Arts & Media | 37 (38.5%) | 59 (61.5%) |
| Legal Services & Support | 266 (75.1%) | 88 (24.9%) |
| Education Instruction & Library | 163 (32.7%) | 335 (67.3%) |
| Arts, Media & Entertainment | 396 (57.5%) | 293 (42.5%) |
| Health Diagnosing & Treating | 173 (35.1%) | 320 (64.9%) |
| Health Technologists | 173 (42.0%) | 239 (58.0%) |
| Total (Category) | 2,589 (55.9%) | 2,046 (44.1%) |
| Total (Overall) | 3,294 (54.0%) | 2,808 (46.0%) |
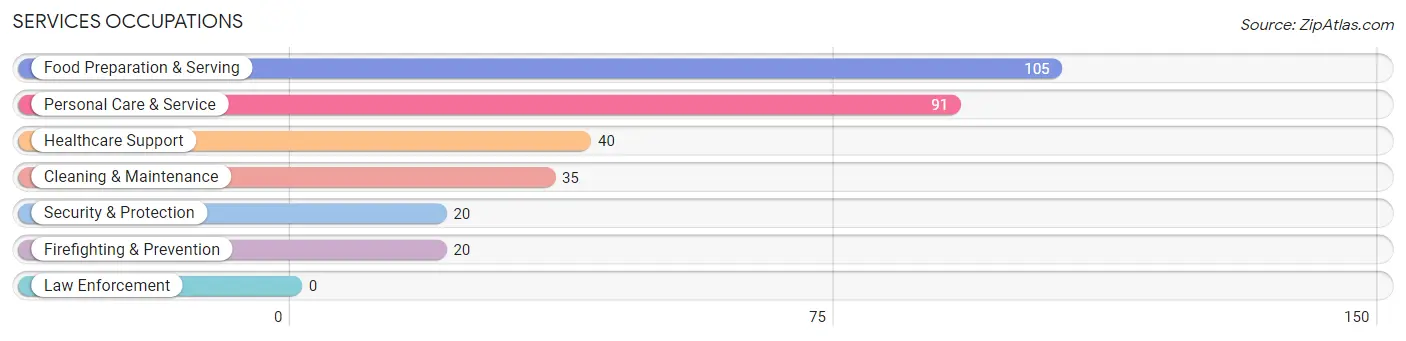
Services Occupations
The most common Services occupations in Upper Montclair are Food Preparation & Serving (105 | 1.7%), Personal Care & Service (91 | 1.5%), Healthcare Support (40 | 0.7%), Cleaning & Maintenance (35 | 0.6%), and Security & Protection (20 | 0.3%).
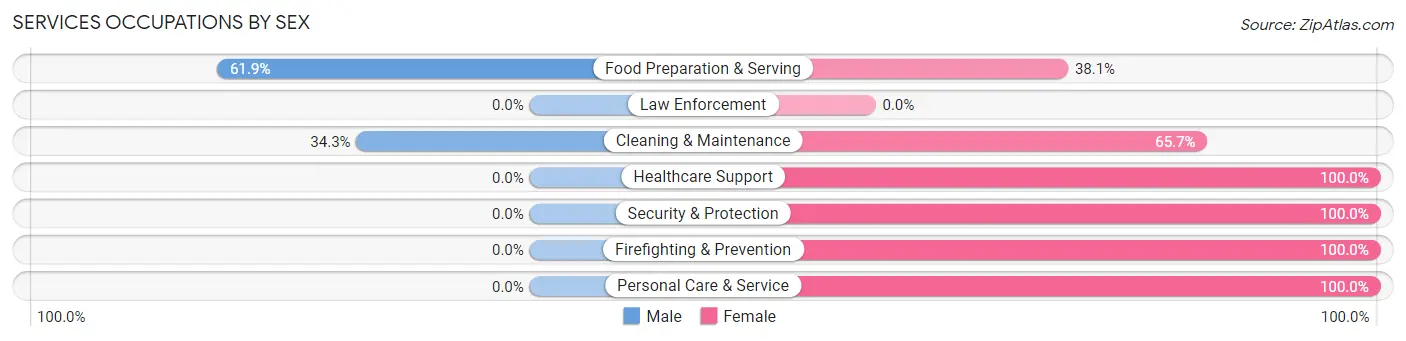
Services Occupations by Sex
Within the Services occupations in Upper Montclair, the most male-oriented occupations are Food Preparation & Serving (61.9%), and Cleaning & Maintenance (34.3%), while the most female-oriented occupations are Healthcare Support (100.0%), Security & Protection (100.0%), and Firefighting & Prevention (100.0%).
| Occupation | Male | Female |
| Healthcare Support | 0 (0.0%) | 40 (100.0%) |
| Security & Protection | 0 (0.0%) | 20 (100.0%) |
| Firefighting & Prevention | 0 (0.0%) | 20 (100.0%) |
| Law Enforcement | 0 (0.0%) | 0 (0.0%) |
| Food Preparation & Serving | 65 (61.9%) | 40 (38.1%) |
| Cleaning & Maintenance | 12 (34.3%) | 23 (65.7%) |
| Personal Care & Service | 0 (0.0%) | 91 (100.0%) |
| Total (Category) | 77 (26.5%) | 214 (73.5%) |
| Total (Overall) | 3,294 (54.0%) | 2,808 (46.0%) |
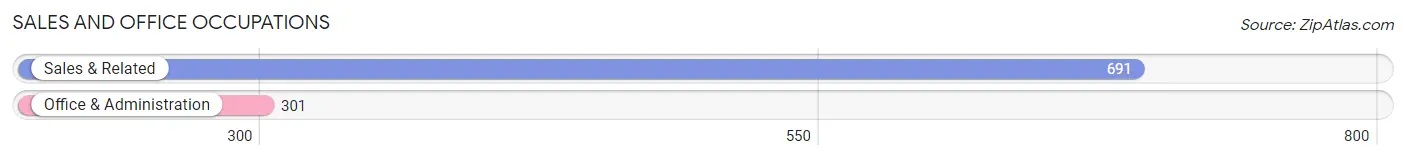
Sales and Office Occupations
The most common Sales and Office occupations in Upper Montclair are Sales & Related (691 | 11.3%), and Office & Administration (301 | 4.9%).
Sales and Office Occupations by Sex
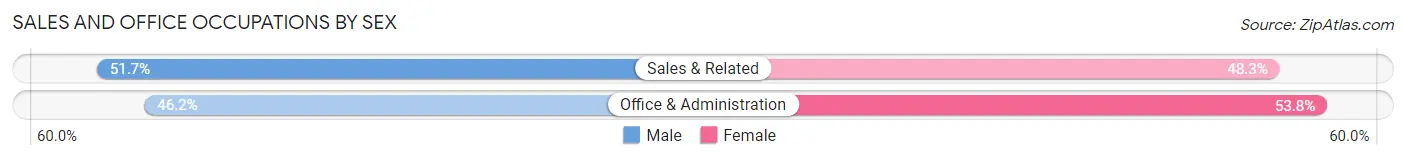
| Occupation | Male | Female |
| Sales & Related | 357 (51.7%) | 334 (48.3%) |
| Office & Administration | 139 (46.2%) | 162 (53.8%) |
| Total (Category) | 496 (50.0%) | 496 (50.0%) |
| Total (Overall) | 3,294 (54.0%) | 2,808 (46.0%) |
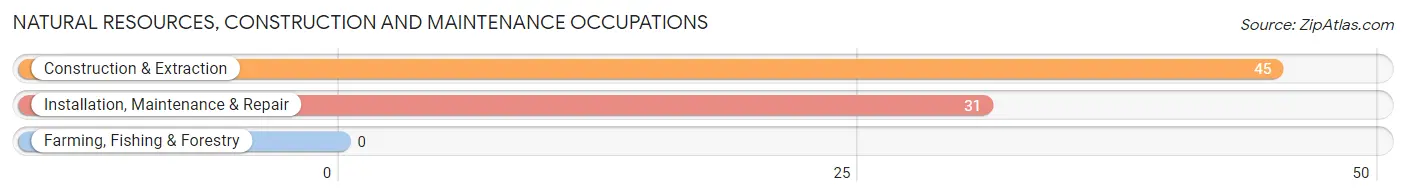
Natural Resources, Construction and Maintenance Occupations
The most common Natural Resources, Construction and Maintenance occupations in Upper Montclair are Construction & Extraction (45 | 0.7%), and Installation, Maintenance & Repair (31 | 0.5%).
Natural Resources, Construction and Maintenance Occupations by Sex
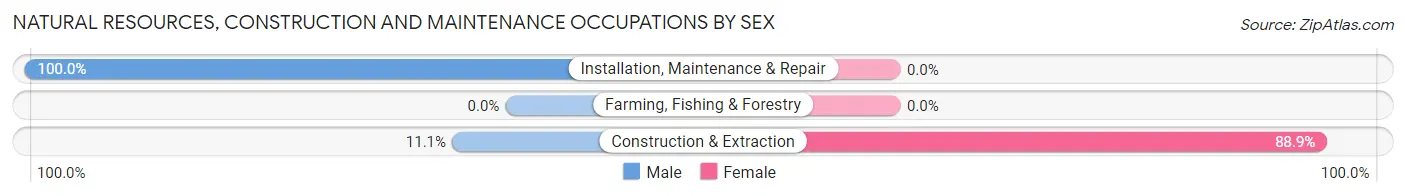
| Occupation | Male | Female |
| Farming, Fishing & Forestry | 0 (0.0%) | 0 (0.0%) |
| Construction & Extraction | 5 (11.1%) | 40 (88.9%) |
| Installation, Maintenance & Repair | 31 (100.0%) | 0 (0.0%) |
| Total (Category) | 36 (47.4%) | 40 (52.6%) |
| Total (Overall) | 3,294 (54.0%) | 2,808 (46.0%) |
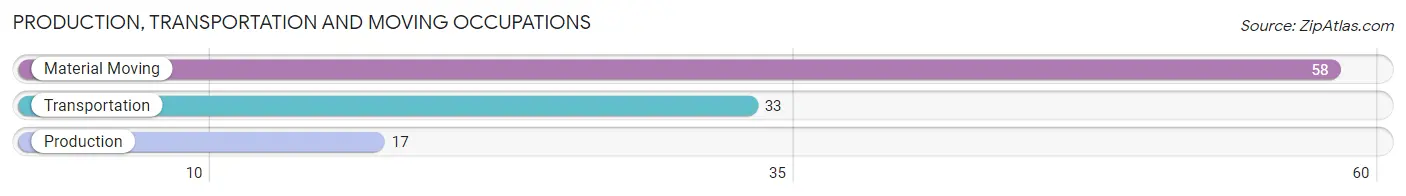
Production, Transportation and Moving Occupations
The most common Production, Transportation and Moving occupations in Upper Montclair are Material Moving (58 | 0.9%), Transportation (33 | 0.5%), and Production (17 | 0.3%).
Production, Transportation and Moving Occupations by Sex
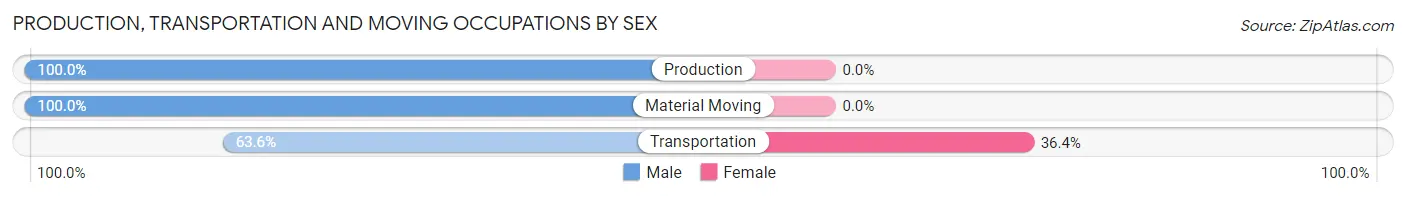
| Occupation | Male | Female |
| Production | 17 (100.0%) | 0 (0.0%) |
| Transportation | 21 (63.6%) | 12 (36.4%) |
| Material Moving | 58 (100.0%) | 0 (0.0%) |
| Total (Category) | 96 (88.9%) | 12 (11.1%) |
| Total (Overall) | 3,294 (54.0%) | 2,808 (46.0%) |
Employment Industries by Sex in Upper Montclair
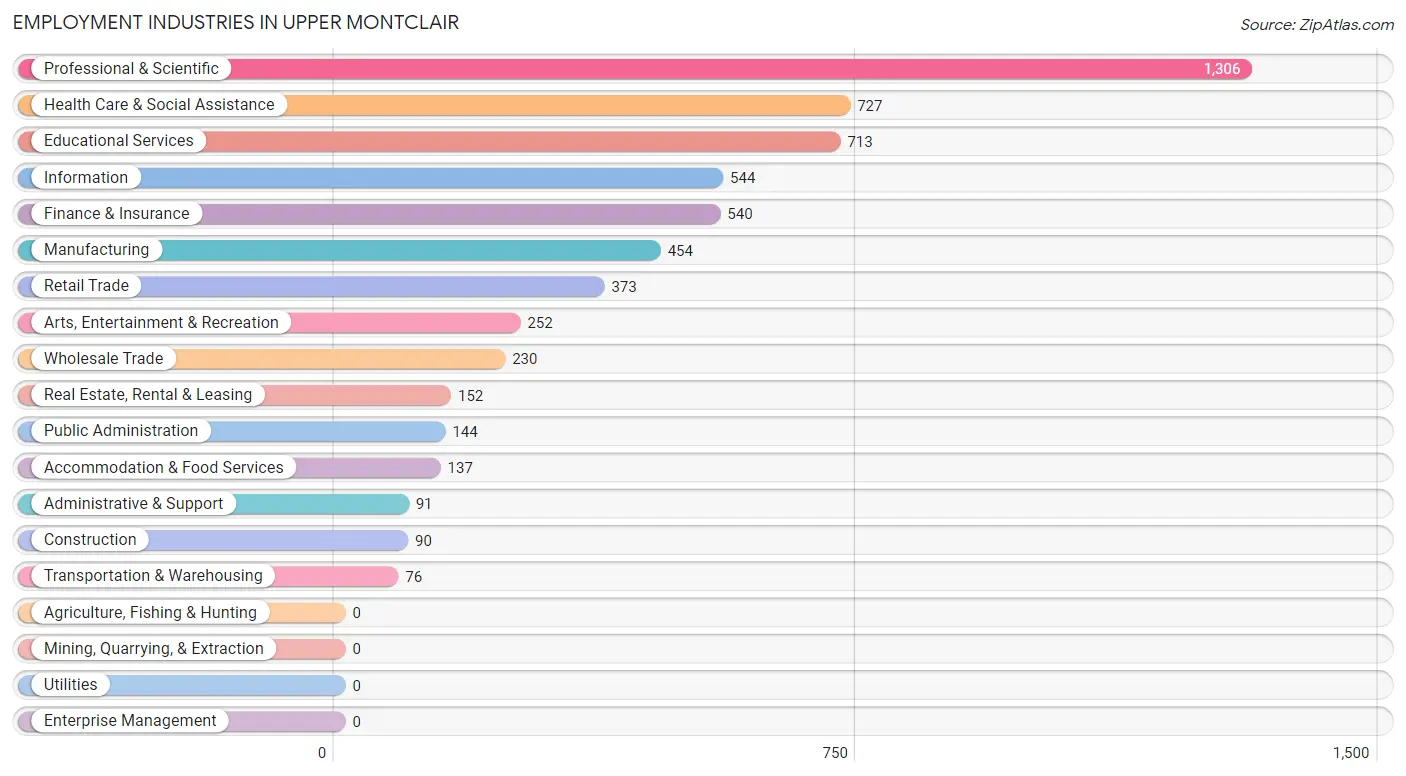
Employment Industries in Upper Montclair
The major employment industries in Upper Montclair include Professional & Scientific (1,306 | 21.4%), Health Care & Social Assistance (727 | 11.9%), Educational Services (713 | 11.7%), Information (544 | 8.9%), and Finance & Insurance (540 | 8.8%).
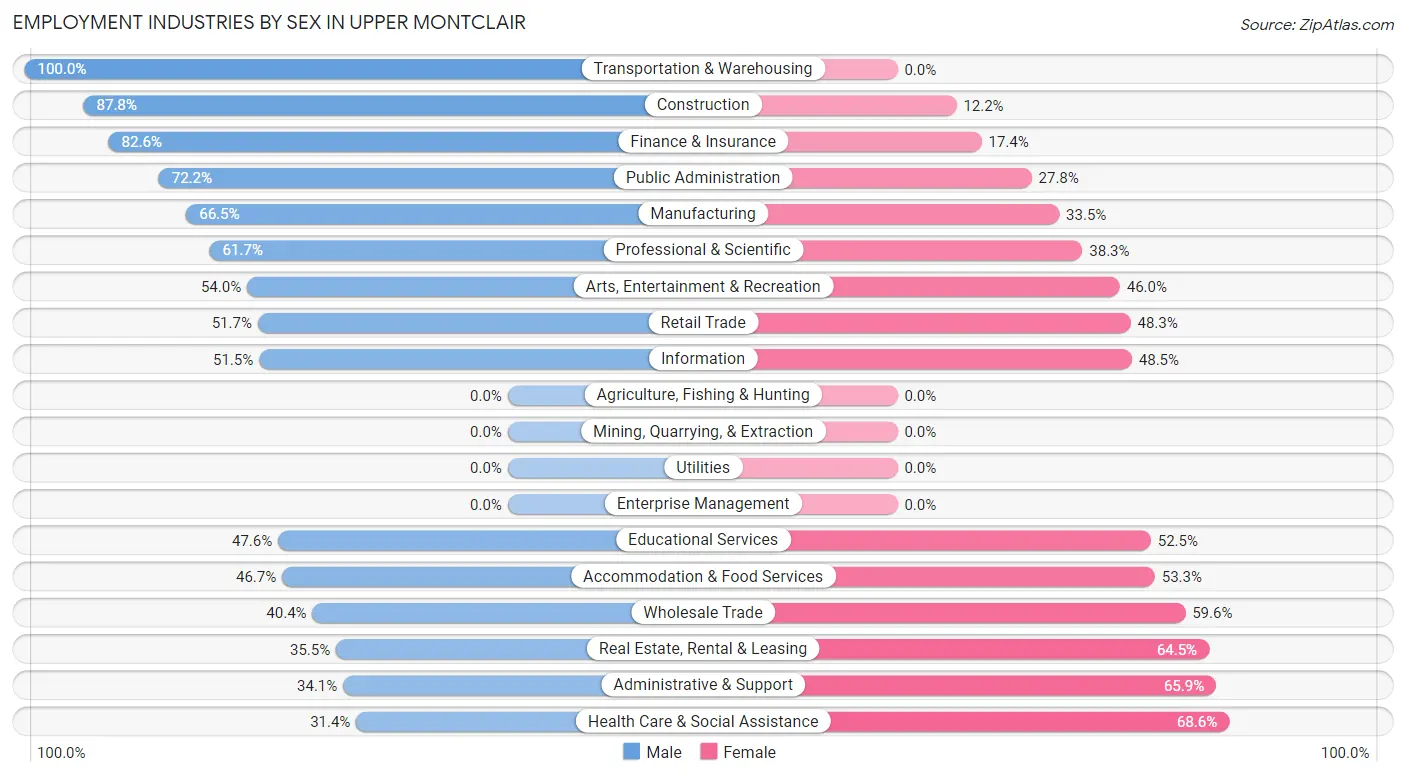
Employment Industries by Sex in Upper Montclair
The Upper Montclair industries that see more men than women are Transportation & Warehousing (100.0%), Construction (87.8%), and Finance & Insurance (82.6%), whereas the industries that tend to have a higher number of women are Health Care & Social Assistance (68.6%), Administrative & Support (65.9%), and Real Estate, Rental & Leasing (64.5%).
| Industry | Male | Female |
| Agriculture, Fishing & Hunting | 0 (0.0%) | 0 (0.0%) |
| Mining, Quarrying, & Extraction | 0 (0.0%) | 0 (0.0%) |
| Construction | 79 (87.8%) | 11 (12.2%) |
| Manufacturing | 302 (66.5%) | 152 (33.5%) |
| Wholesale Trade | 93 (40.4%) | 137 (59.6%) |
| Retail Trade | 193 (51.7%) | 180 (48.3%) |
| Transportation & Warehousing | 76 (100.0%) | 0 (0.0%) |
| Utilities | 0 (0.0%) | 0 (0.0%) |
| Information | 280 (51.5%) | 264 (48.5%) |
| Finance & Insurance | 446 (82.6%) | 94 (17.4%) |
| Real Estate, Rental & Leasing | 54 (35.5%) | 98 (64.5%) |
| Professional & Scientific | 806 (61.7%) | 500 (38.3%) |
| Enterprise Management | 0 (0.0%) | 0 (0.0%) |
| Administrative & Support | 31 (34.1%) | 60 (65.9%) |
| Educational Services | 339 (47.5%) | 374 (52.4%) |
| Health Care & Social Assistance | 228 (31.4%) | 499 (68.6%) |
| Arts, Entertainment & Recreation | 136 (54.0%) | 116 (46.0%) |
| Accommodation & Food Services | 64 (46.7%) | 73 (53.3%) |
| Public Administration | 104 (72.2%) | 40 (27.8%) |
| Total | 3,294 (54.0%) | 2,808 (46.0%) |
Education in Upper Montclair
School Enrollment in Upper Montclair
The most common levels of schooling among the 3,801 students in Upper Montclair are high school (941 | 24.8%), middle school (711 | 18.7%), and elementary school (689 | 18.1%).
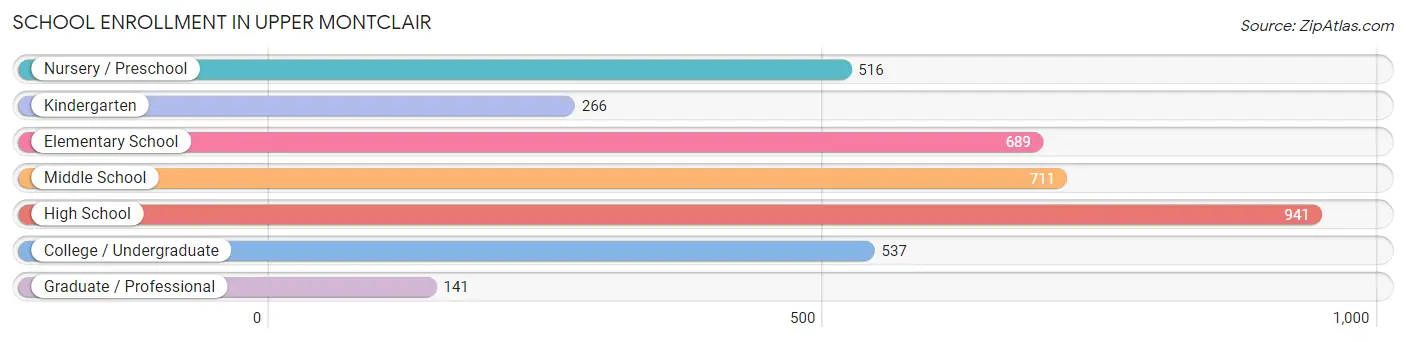
| School Level | # Students | % Students |
| Nursery / Preschool | 516 | 13.6% |
| Kindergarten | 266 | 7.0% |
| Elementary School | 689 | 18.1% |
| Middle School | 711 | 18.7% |
| High School | 941 | 24.8% |
| College / Undergraduate | 537 | 14.1% |
| Graduate / Professional | 141 | 3.7% |
| Total | 3,801 | 100.0% |
School Enrollment by Age by Funding Source in Upper Montclair
Out of a total of 3,801 students who are enrolled in schools in Upper Montclair, 1,186 (31.2%) attend a private institution, while the remaining 2,615 (68.8%) are enrolled in public schools. The age group of 3 to 4 year olds has the highest likelihood of being enrolled in private schools, with 264 (74.2% in the age bracket) enrolled. Conversely, the age group of 10 to 14 year olds has the lowest likelihood of being enrolled in a private school, with 783 (84.4% in the age bracket) attending a public institution.
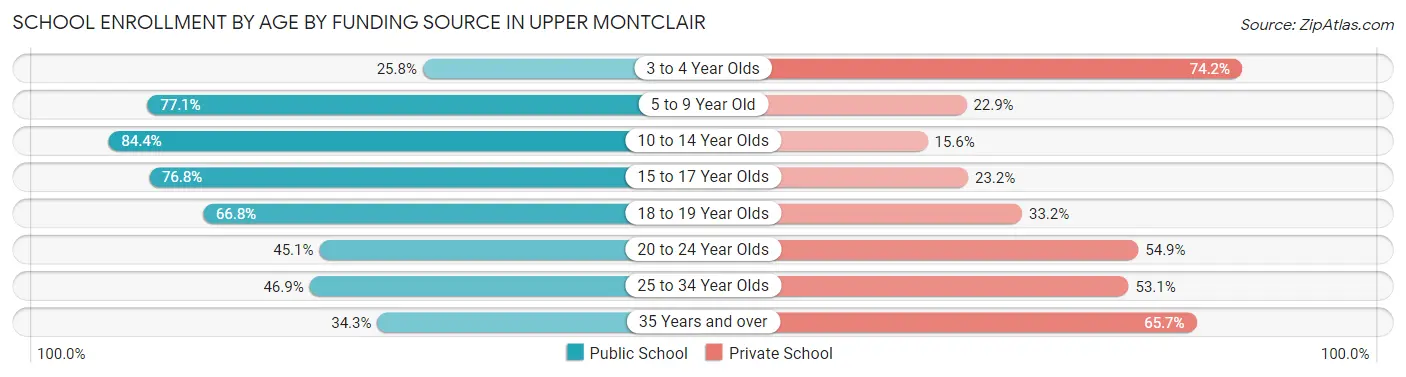
| Age Bracket | Public School | Private School |
| 3 to 4 Year Olds | 92 (25.8%) | 264 (74.2%) |
| 5 to 9 Year Old | 823 (77.1%) | 244 (22.9%) |
| 10 to 14 Year Olds | 783 (84.4%) | 145 (15.6%) |
| 15 to 17 Year Olds | 504 (76.8%) | 152 (23.2%) |
| 18 to 19 Year Olds | 197 (66.8%) | 98 (33.2%) |
| 20 to 24 Year Olds | 157 (45.1%) | 191 (54.9%) |
| 25 to 34 Year Olds | 23 (46.9%) | 26 (53.1%) |
| 35 Years and over | 35 (34.3%) | 67 (65.7%) |
| Total | 2,615 (68.8%) | 1,186 (31.2%) |
Educational Attainment by Field of Study in Upper Montclair
Social sciences (1,464 | 19.9%), literature & languages (1,044 | 14.2%), business (772 | 10.5%), liberal arts & history (588 | 8.0%), and communications (547 | 7.4%) are the most common fields of study among 7,367 individuals in Upper Montclair who have obtained a bachelor's degree or higher.
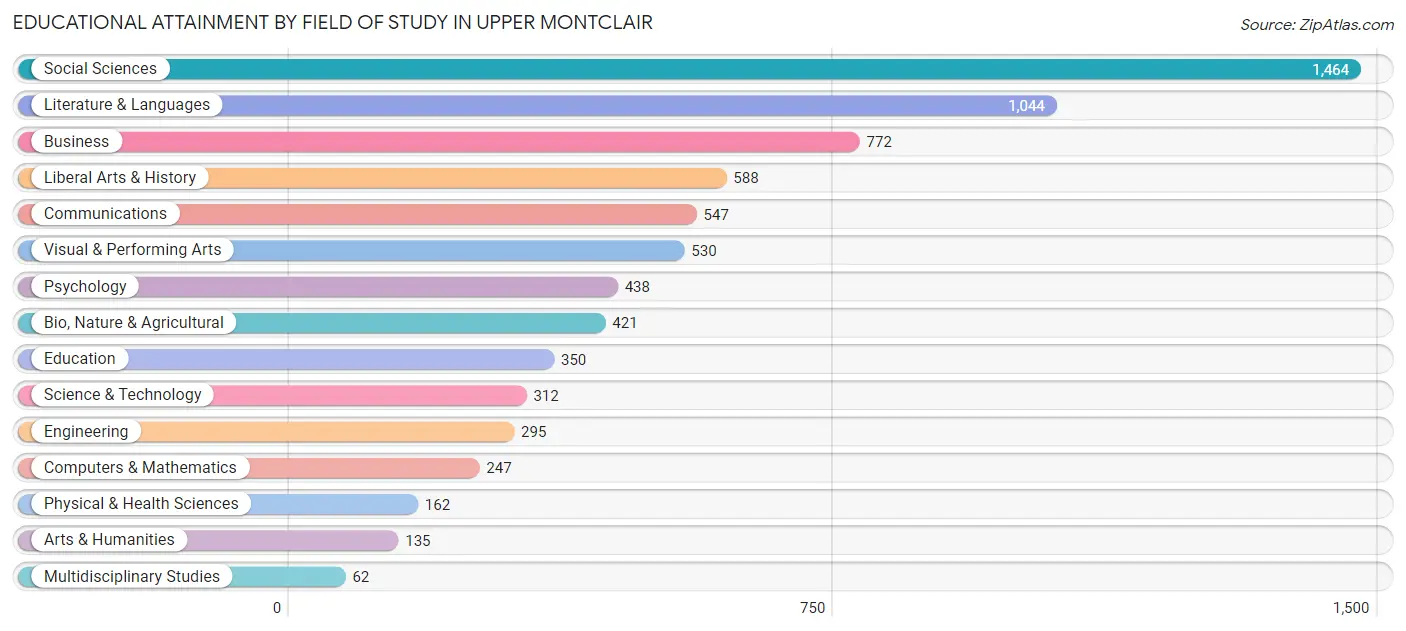
| Field of Study | # Graduates | % Graduates |
| Computers & Mathematics | 247 | 3.4% |
| Bio, Nature & Agricultural | 421 | 5.7% |
| Physical & Health Sciences | 162 | 2.2% |
| Psychology | 438 | 5.9% |
| Social Sciences | 1,464 | 19.9% |
| Engineering | 295 | 4.0% |
| Multidisciplinary Studies | 62 | 0.8% |
| Science & Technology | 312 | 4.2% |
| Business | 772 | 10.5% |
| Education | 350 | 4.8% |
| Literature & Languages | 1,044 | 14.2% |
| Liberal Arts & History | 588 | 8.0% |
| Visual & Performing Arts | 530 | 7.2% |
| Communications | 547 | 7.4% |
| Arts & Humanities | 135 | 1.8% |
| Total | 7,367 | 100.0% |
Transportation & Commute in Upper Montclair
Vehicle Availability by Sex in Upper Montclair
The most prevalent vehicle ownership categories in Upper Montclair are males with 2 vehicles (1,619, accounting for 49.6%) and females with 2 vehicles (1,548, making up 60.1%).
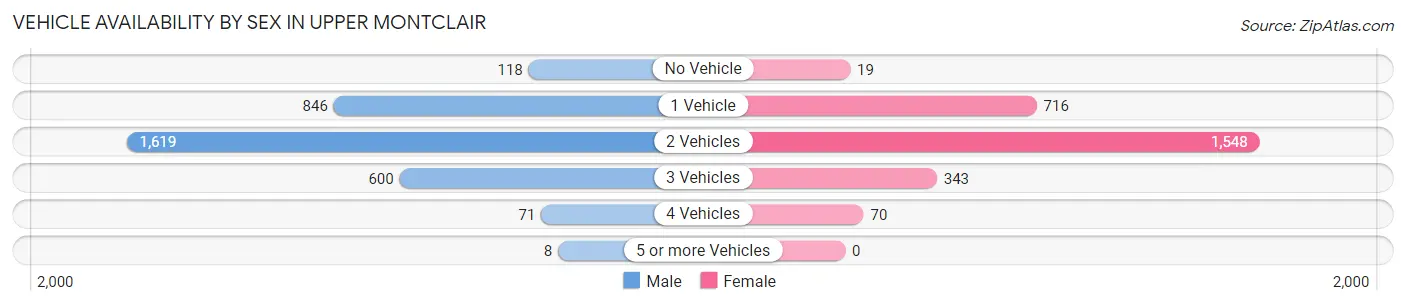
| Vehicles Available | Male | Female |
| No Vehicle | 118 (3.6%) | 19 (0.7%) |
| 1 Vehicle | 846 (25.9%) | 716 (26.6%) |
| 2 Vehicles | 1,619 (49.6%) | 1,548 (57.4%) |
| 3 Vehicles | 600 (18.4%) | 343 (12.7%) |
| 4 Vehicles | 71 (2.2%) | 70 (2.6%) |
| 5 or more Vehicles | 8 (0.3%) | 0 (0.0%) |
| Total | 3,262 (100.0%) | 2,696 (100.0%) |
Commute Time in Upper Montclair
The most frequently occuring commute durations in Upper Montclair are 60 to 89 minutes (1,033 commuters, 28.0%), 45 to 59 minutes (498 commuters, 13.5%), and 5 to 9 minutes (365 commuters, 9.9%).
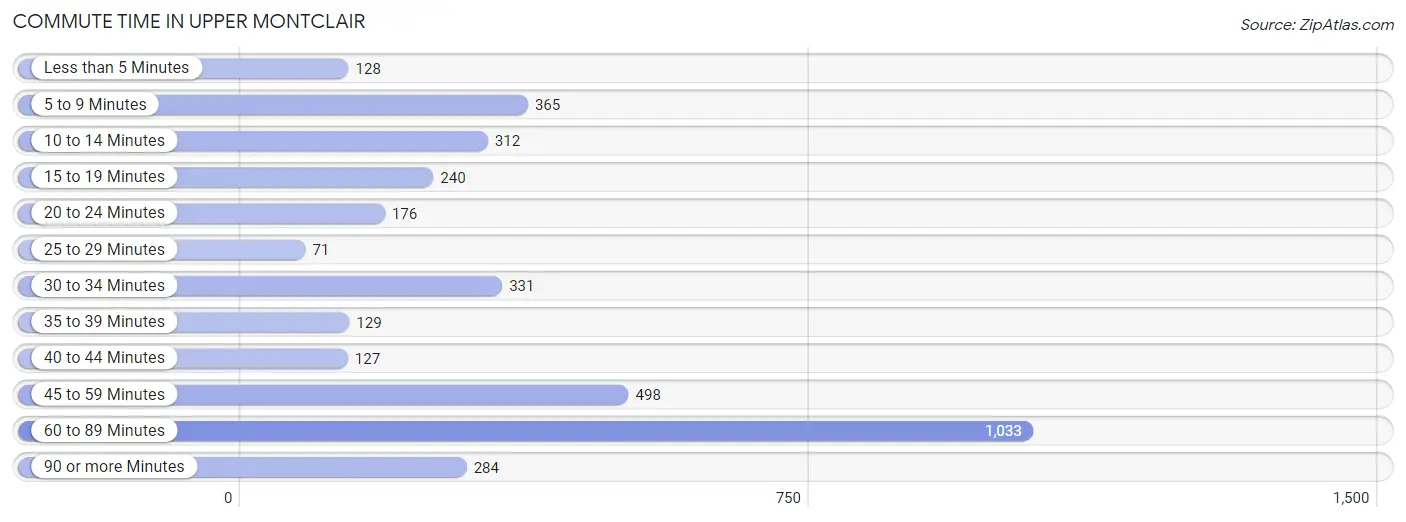
| Commute Time | # Commuters | % Commuters |
| Less than 5 Minutes | 128 | 3.5% |
| 5 to 9 Minutes | 365 | 9.9% |
| 10 to 14 Minutes | 312 | 8.5% |
| 15 to 19 Minutes | 240 | 6.5% |
| 20 to 24 Minutes | 176 | 4.8% |
| 25 to 29 Minutes | 71 | 1.9% |
| 30 to 34 Minutes | 331 | 9.0% |
| 35 to 39 Minutes | 129 | 3.5% |
| 40 to 44 Minutes | 127 | 3.4% |
| 45 to 59 Minutes | 498 | 13.5% |
| 60 to 89 Minutes | 1,033 | 28.0% |
| 90 or more Minutes | 284 | 7.7% |
Commute Time by Sex in Upper Montclair
The most common commute times in Upper Montclair are 60 to 89 minutes (578 commuters, 27.9%) for males and 60 to 89 minutes (455 commuters, 28.1%) for females.
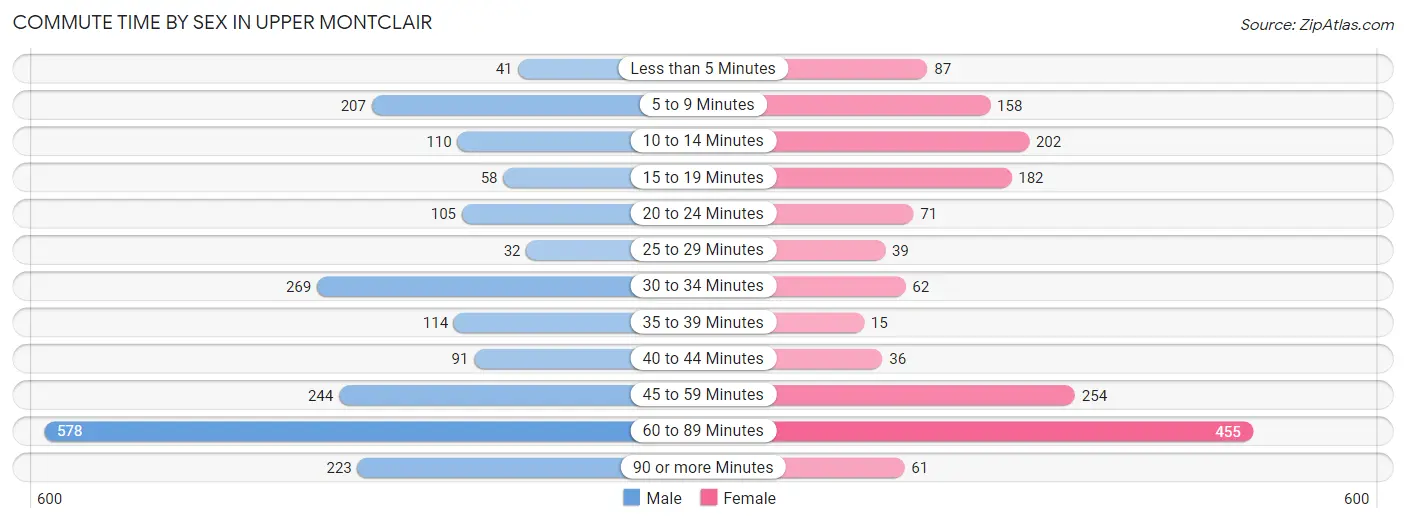
| Commute Time | Male | Female |
| Less than 5 Minutes | 41 (2.0%) | 87 (5.4%) |
| 5 to 9 Minutes | 207 (10.0%) | 158 (9.7%) |
| 10 to 14 Minutes | 110 (5.3%) | 202 (12.4%) |
| 15 to 19 Minutes | 58 (2.8%) | 182 (11.2%) |
| 20 to 24 Minutes | 105 (5.1%) | 71 (4.4%) |
| 25 to 29 Minutes | 32 (1.5%) | 39 (2.4%) |
| 30 to 34 Minutes | 269 (13.0%) | 62 (3.8%) |
| 35 to 39 Minutes | 114 (5.5%) | 15 (0.9%) |
| 40 to 44 Minutes | 91 (4.4%) | 36 (2.2%) |
| 45 to 59 Minutes | 244 (11.8%) | 254 (15.7%) |
| 60 to 89 Minutes | 578 (27.9%) | 455 (28.1%) |
| 90 or more Minutes | 223 (10.8%) | 61 (3.8%) |
Time of Departure to Work by Sex in Upper Montclair
The most frequent times of departure to work in Upper Montclair are 7:30 AM to 7:59 AM (405, 19.6%) for males and 8:00 AM to 8:29 AM (361, 22.3%) for females.
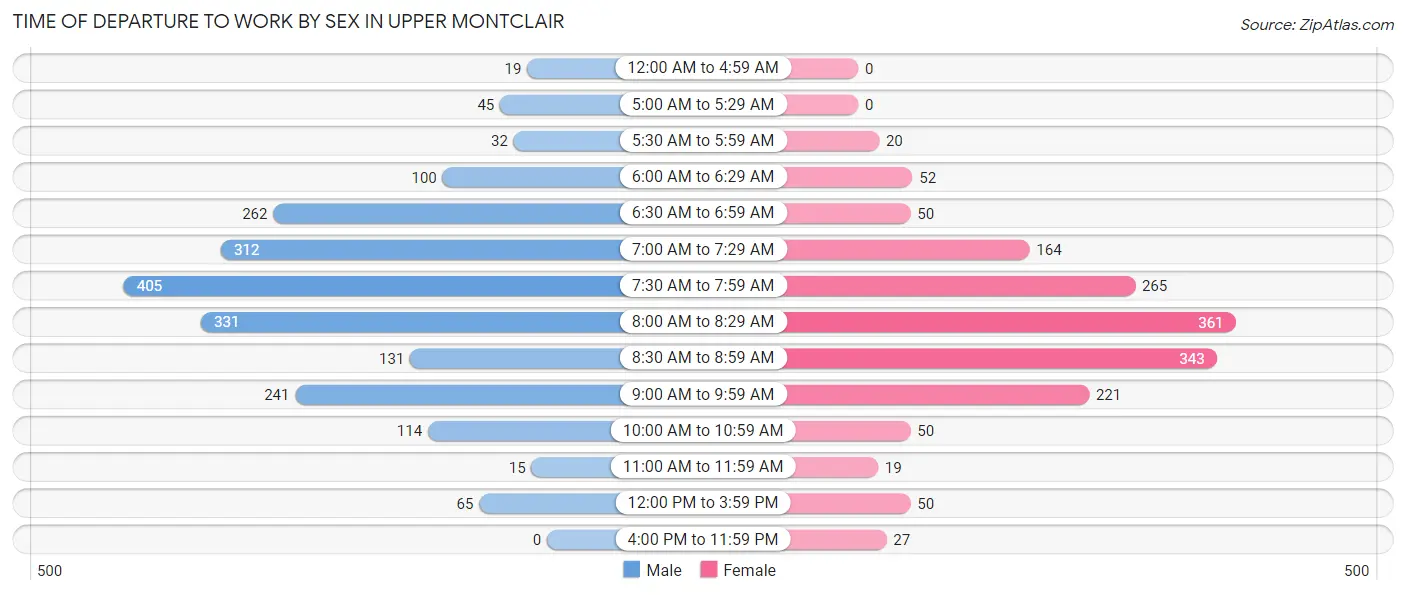
| Time of Departure | Male | Female |
| 12:00 AM to 4:59 AM | 19 (0.9%) | 0 (0.0%) |
| 5:00 AM to 5:29 AM | 45 (2.2%) | 0 (0.0%) |
| 5:30 AM to 5:59 AM | 32 (1.5%) | 20 (1.2%) |
| 6:00 AM to 6:29 AM | 100 (4.8%) | 52 (3.2%) |
| 6:30 AM to 6:59 AM | 262 (12.6%) | 50 (3.1%) |
| 7:00 AM to 7:29 AM | 312 (15.1%) | 164 (10.1%) |
| 7:30 AM to 7:59 AM | 405 (19.6%) | 265 (16.3%) |
| 8:00 AM to 8:29 AM | 331 (16.0%) | 361 (22.3%) |
| 8:30 AM to 8:59 AM | 131 (6.3%) | 343 (21.1%) |
| 9:00 AM to 9:59 AM | 241 (11.6%) | 221 (13.6%) |
| 10:00 AM to 10:59 AM | 114 (5.5%) | 50 (3.1%) |
| 11:00 AM to 11:59 AM | 15 (0.7%) | 19 (1.2%) |
| 12:00 PM to 3:59 PM | 65 (3.1%) | 50 (3.1%) |
| 4:00 PM to 11:59 PM | 0 (0.0%) | 27 (1.7%) |
| Total | 2,072 (100.0%) | 1,622 (100.0%) |
Housing Occupancy in Upper Montclair
Occupancy by Ownership in Upper Montclair
Of the total 4,047 dwellings in Upper Montclair, owner-occupied units account for 3,405 (84.1%), while renter-occupied units make up 642 (15.9%).
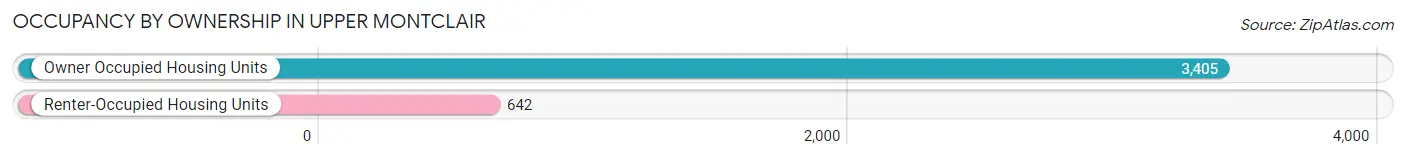
| Occupancy | # Housing Units | % Housing Units |
| Owner Occupied Housing Units | 3,405 | 84.1% |
| Renter-Occupied Housing Units | 642 | 15.9% |
| Total Occupied Housing Units | 4,047 | 100.0% |
Occupancy by Household Size in Upper Montclair
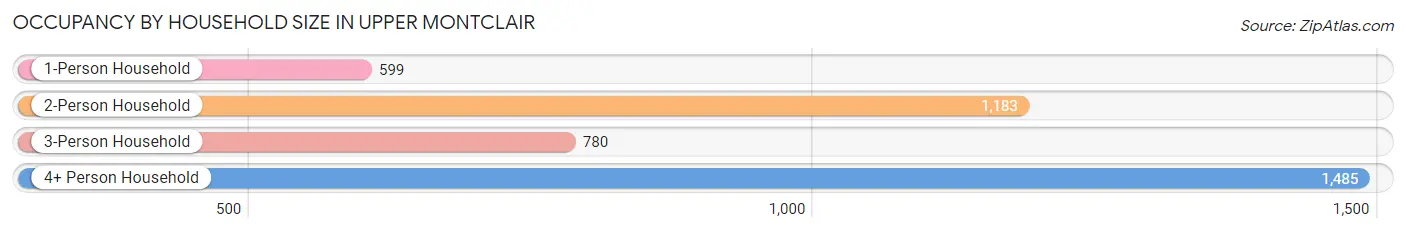
| Household Size | # Housing Units | % Housing Units |
| 1-Person Household | 599 | 14.8% |
| 2-Person Household | 1,183 | 29.2% |
| 3-Person Household | 780 | 19.3% |
| 4+ Person Household | 1,485 | 36.7% |
| Total Housing Units | 4,047 | 100.0% |
Occupancy by Ownership by Household Size in Upper Montclair
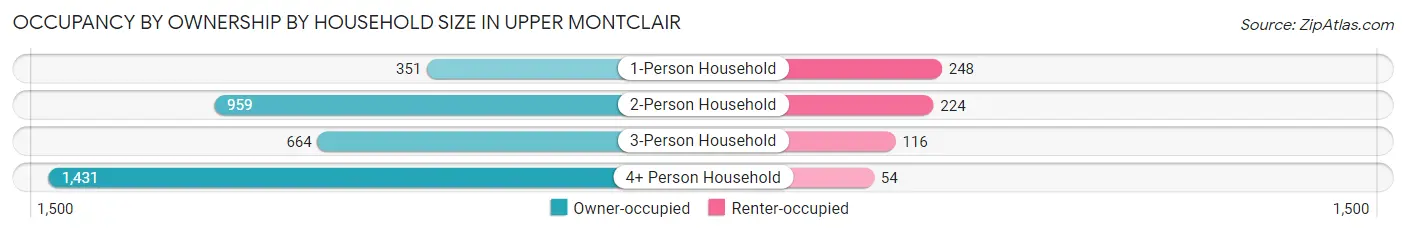
| Household Size | Owner-occupied | Renter-occupied |
| 1-Person Household | 351 (58.6%) | 248 (41.4%) |
| 2-Person Household | 959 (81.1%) | 224 (18.9%) |
| 3-Person Household | 664 (85.1%) | 116 (14.9%) |
| 4+ Person Household | 1,431 (96.4%) | 54 (3.6%) |
| Total Housing Units | 3,405 (84.1%) | 642 (15.9%) |
Occupancy by Educational Attainment in Upper Montclair
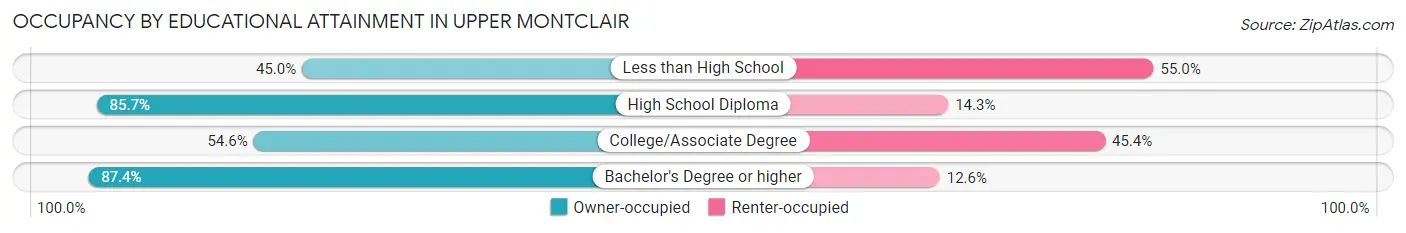
| Household Size | Owner-occupied | Renter-occupied |
| Less than High School | 18 (45.0%) | 22 (55.0%) |
| High School Diploma | 42 (85.7%) | 7 (14.3%) |
| College/Associate Degree | 189 (54.6%) | 157 (45.4%) |
| Bachelor's Degree or higher | 3,156 (87.4%) | 456 (12.6%) |
Occupancy by Age of Householder in Upper Montclair
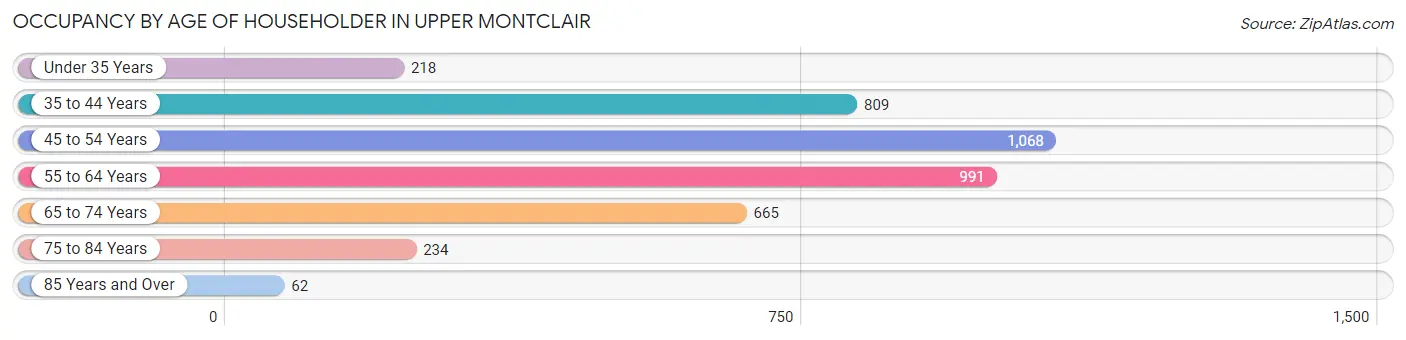
| Age Bracket | # Households | % Households |
| Under 35 Years | 218 | 5.4% |
| 35 to 44 Years | 809 | 20.0% |
| 45 to 54 Years | 1,068 | 26.4% |
| 55 to 64 Years | 991 | 24.5% |
| 65 to 74 Years | 665 | 16.4% |
| 75 to 84 Years | 234 | 5.8% |
| 85 Years and Over | 62 | 1.5% |
| Total | 4,047 | 100.0% |
Housing Finances in Upper Montclair
Median Income by Occupancy in Upper Montclair
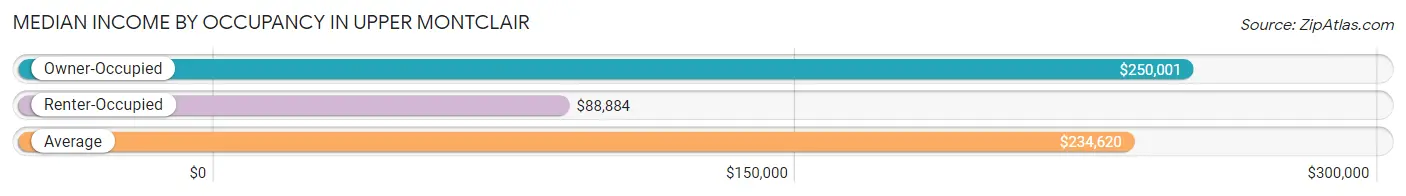
| Occupancy Type | # Households | Median Income |
| Owner-Occupied | 3,405 (84.1%) | $250,001 |
| Renter-Occupied | 642 (15.9%) | $88,884 |
| Average | 4,047 (100.0%) | $234,620 |
Occupancy by Householder Income Bracket in Upper Montclair
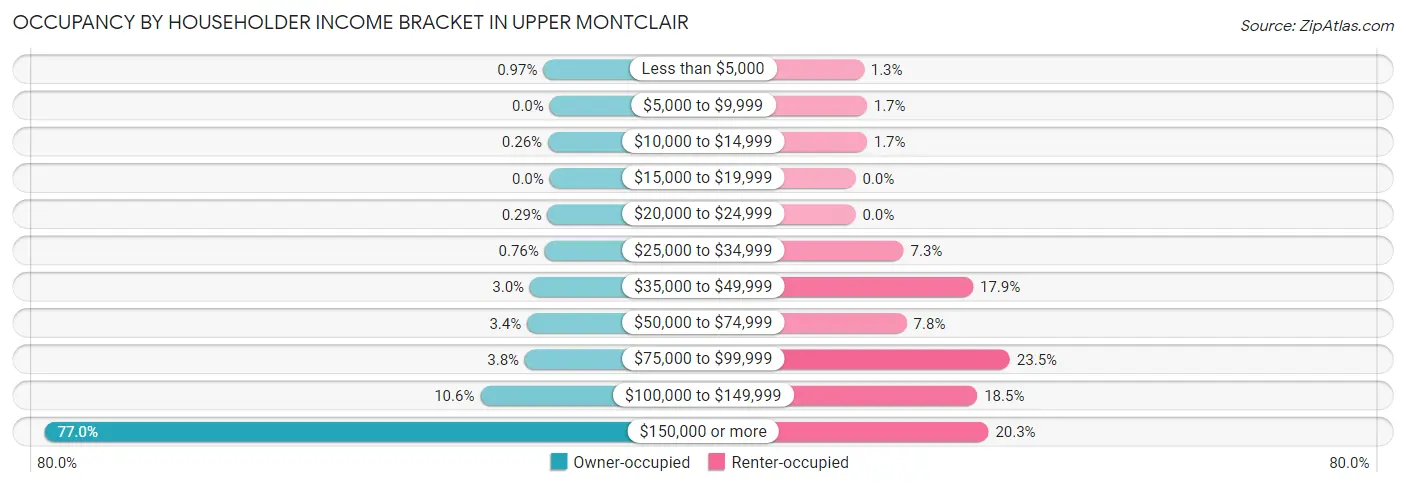
| Income Bracket | Owner-occupied | Renter-occupied |
| Less than $5,000 | 33 (1.0%) | 8 (1.3%) |
| $5,000 to $9,999 | 0 (0.0%) | 11 (1.7%) |
| $10,000 to $14,999 | 9 (0.3%) | 11 (1.7%) |
| $15,000 to $19,999 | 0 (0.0%) | 0 (0.0%) |
| $20,000 to $24,999 | 10 (0.3%) | 0 (0.0%) |
| $25,000 to $34,999 | 26 (0.8%) | 47 (7.3%) |
| $35,000 to $49,999 | 102 (3.0%) | 115 (17.9%) |
| $50,000 to $74,999 | 117 (3.4%) | 50 (7.8%) |
| $75,000 to $99,999 | 128 (3.8%) | 151 (23.5%) |
| $100,000 to $149,999 | 360 (10.6%) | 119 (18.5%) |
| $150,000 or more | 2,620 (76.9%) | 130 (20.3%) |
| Total | 3,405 (100.0%) | 642 (100.0%) |
Monthly Housing Cost Tiers in Upper Montclair
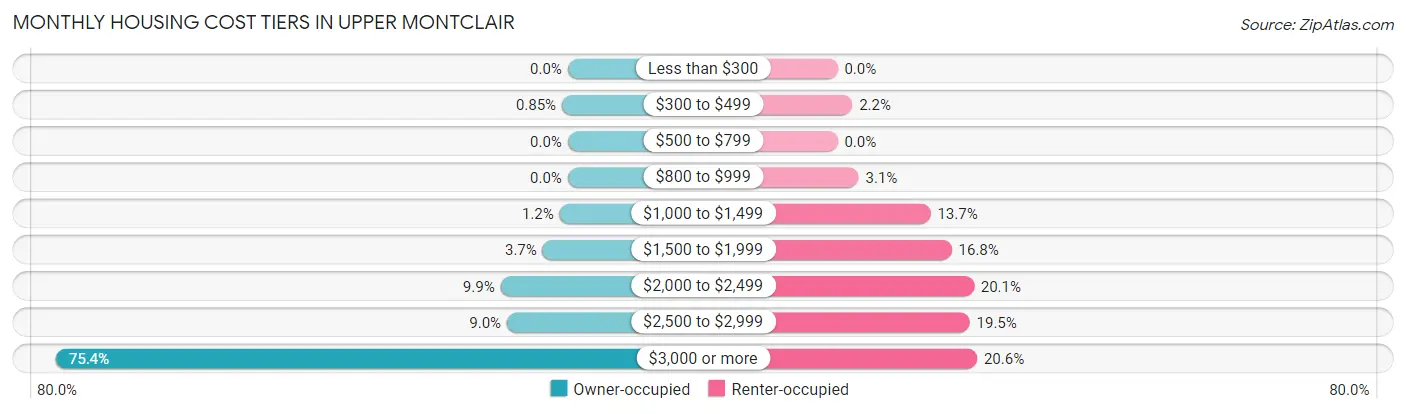
| Monthly Cost | Owner-occupied | Renter-occupied |
| Less than $300 | 0 (0.0%) | 0 (0.0%) |
| $300 to $499 | 29 (0.9%) | 14 (2.2%) |
| $500 to $799 | 0 (0.0%) | 0 (0.0%) |
| $800 to $999 | 0 (0.0%) | 20 (3.1%) |
| $1,000 to $1,499 | 41 (1.2%) | 88 (13.7%) |
| $1,500 to $1,999 | 126 (3.7%) | 108 (16.8%) |
| $2,000 to $2,499 | 337 (9.9%) | 129 (20.1%) |
| $2,500 to $2,999 | 305 (9.0%) | 125 (19.5%) |
| $3,000 or more | 2,567 (75.4%) | 132 (20.6%) |
| Total | 3,405 (100.0%) | 642 (100.0%) |
Physical Housing Characteristics in Upper Montclair
Housing Structures in Upper Montclair
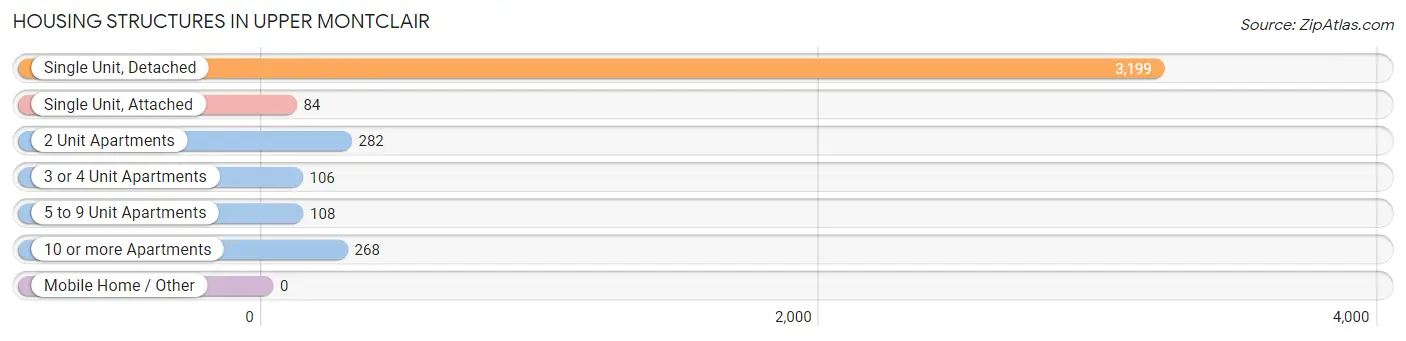
| Structure Type | # Housing Units | % Housing Units |
| Single Unit, Detached | 3,199 | 79.0% |
| Single Unit, Attached | 84 | 2.1% |
| 2 Unit Apartments | 282 | 7.0% |
| 3 or 4 Unit Apartments | 106 | 2.6% |
| 5 to 9 Unit Apartments | 108 | 2.7% |
| 10 or more Apartments | 268 | 6.6% |
| Mobile Home / Other | 0 | 0.0% |
| Total | 4,047 | 100.0% |
Housing Structures by Occupancy in Upper Montclair
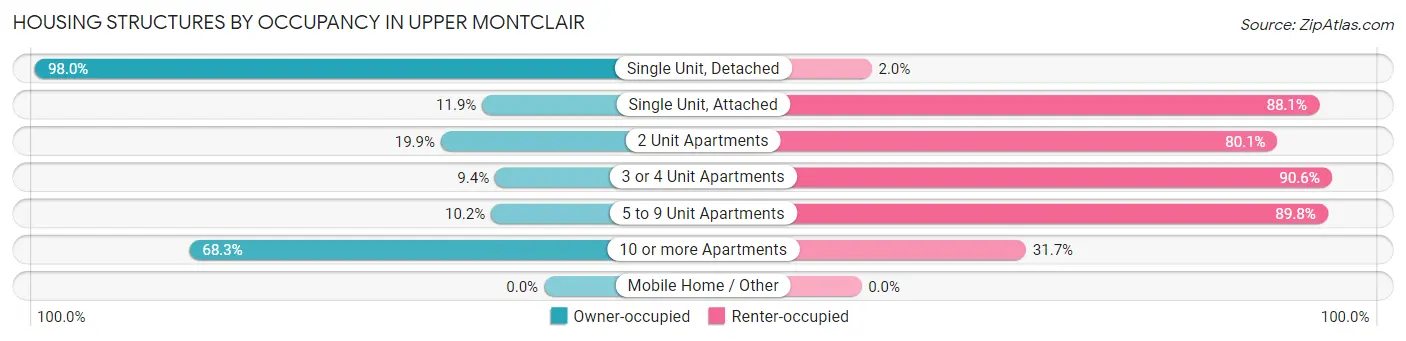
| Structure Type | Owner-occupied | Renter-occupied |
| Single Unit, Detached | 3,135 (98.0%) | 64 (2.0%) |
| Single Unit, Attached | 10 (11.9%) | 74 (88.1%) |
| 2 Unit Apartments | 56 (19.9%) | 226 (80.1%) |
| 3 or 4 Unit Apartments | 10 (9.4%) | 96 (90.6%) |
| 5 to 9 Unit Apartments | 11 (10.2%) | 97 (89.8%) |
| 10 or more Apartments | 183 (68.3%) | 85 (31.7%) |
| Mobile Home / Other | 0 (0.0%) | 0 (0.0%) |
| Total | 3,405 (84.1%) | 642 (15.9%) |
Housing Structures by Number of Rooms in Upper Montclair
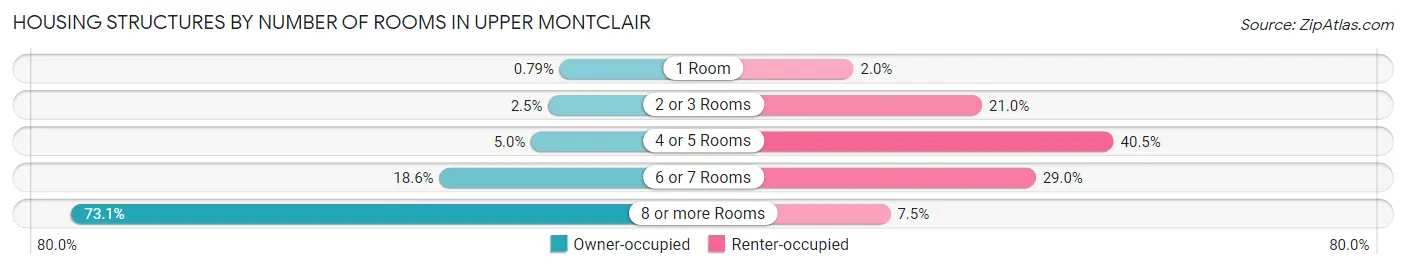
| Number of Rooms | Owner-occupied | Renter-occupied |
| 1 Room | 27 (0.8%) | 13 (2.0%) |
| 2 or 3 Rooms | 85 (2.5%) | 135 (21.0%) |
| 4 or 5 Rooms | 171 (5.0%) | 260 (40.5%) |
| 6 or 7 Rooms | 634 (18.6%) | 186 (29.0%) |
| 8 or more Rooms | 2,488 (73.1%) | 48 (7.5%) |
| Total | 3,405 (100.0%) | 642 (100.0%) |
Housing Structure by Heating Type in Upper Montclair
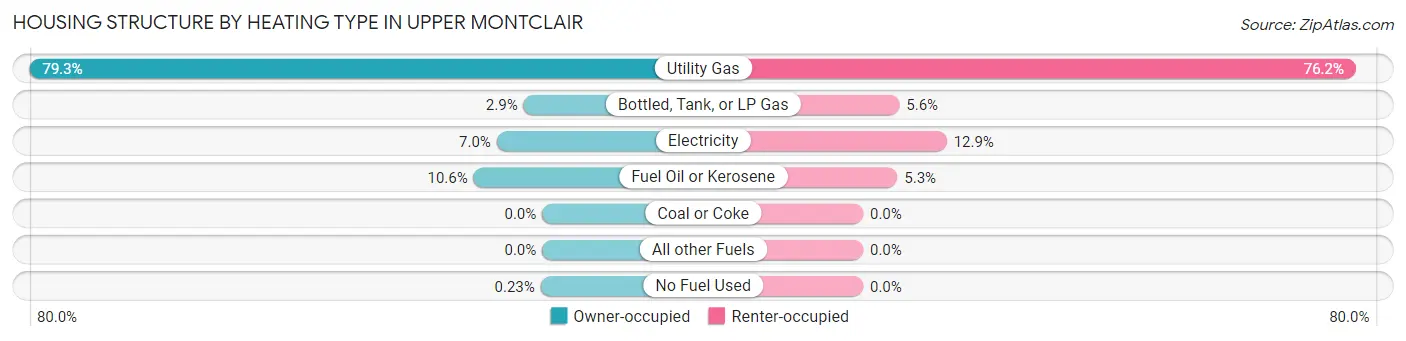
| Heating Type | Owner-occupied | Renter-occupied |
| Utility Gas | 2,699 (79.3%) | 489 (76.2%) |
| Bottled, Tank, or LP Gas | 98 (2.9%) | 36 (5.6%) |
| Electricity | 239 (7.0%) | 83 (12.9%) |
| Fuel Oil or Kerosene | 361 (10.6%) | 34 (5.3%) |
| Coal or Coke | 0 (0.0%) | 0 (0.0%) |
| All other Fuels | 0 (0.0%) | 0 (0.0%) |
| No Fuel Used | 8 (0.2%) | 0 (0.0%) |
| Total | 3,405 (100.0%) | 642 (100.0%) |
Household Vehicle Usage in Upper Montclair
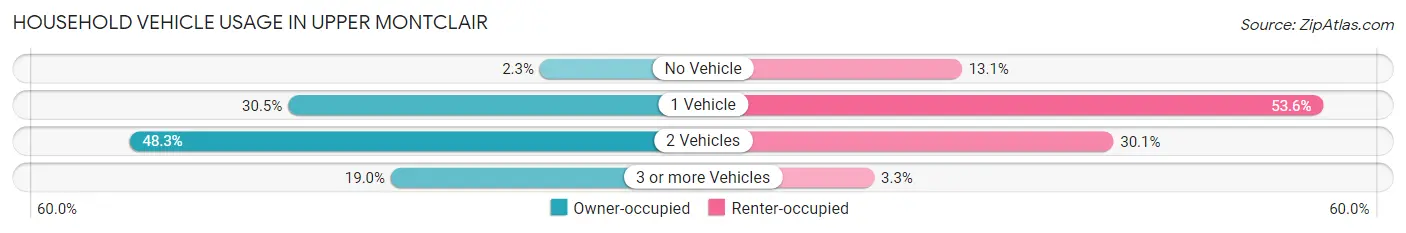
| Vehicles per Household | Owner-occupied | Renter-occupied |
| No Vehicle | 78 (2.3%) | 84 (13.1%) |
| 1 Vehicle | 1,038 (30.5%) | 344 (53.6%) |
| 2 Vehicles | 1,643 (48.2%) | 193 (30.1%) |
| 3 or more Vehicles | 646 (19.0%) | 21 (3.3%) |
| Total | 3,405 (100.0%) | 642 (100.0%) |
Real Estate & Mortgages in Upper Montclair
Real Estate and Mortgage Overview in Upper Montclair
| Characteristic | Without Mortgage | With Mortgage |
| Housing Units | 1,049 | 2,356 |
| Median Property Value | $935,600 | $888,400 |
| Median Household Income | $236,083 | $1,937 |
| Monthly Housing Costs | $1,501 | $2,146 |
| Real Estate Taxes | $10,001 | $32 |
Property Value by Mortgage Status in Upper Montclair
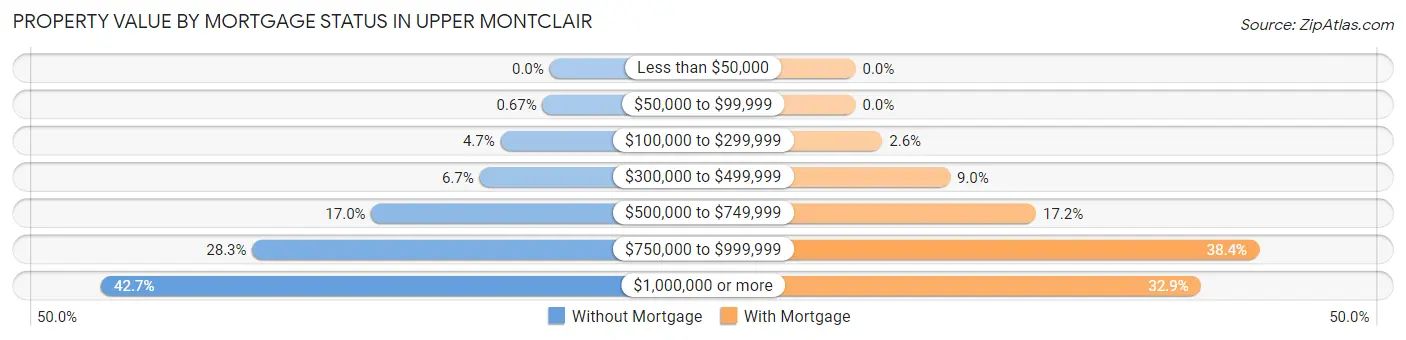
| Property Value | Without Mortgage | With Mortgage |
| Less than $50,000 | 0 (0.0%) | 0 (0.0%) |
| $50,000 to $99,999 | 7 (0.7%) | 0 (0.0%) |
| $100,000 to $299,999 | 49 (4.7%) | 60 (2.5%) |
| $300,000 to $499,999 | 70 (6.7%) | 212 (9.0%) |
| $500,000 to $749,999 | 178 (17.0%) | 405 (17.2%) |
| $750,000 to $999,999 | 297 (28.3%) | 905 (38.4%) |
| $1,000,000 or more | 448 (42.7%) | 774 (32.9%) |
| Total | 1,049 (100.0%) | 2,356 (100.0%) |
Household Income by Mortgage Status in Upper Montclair
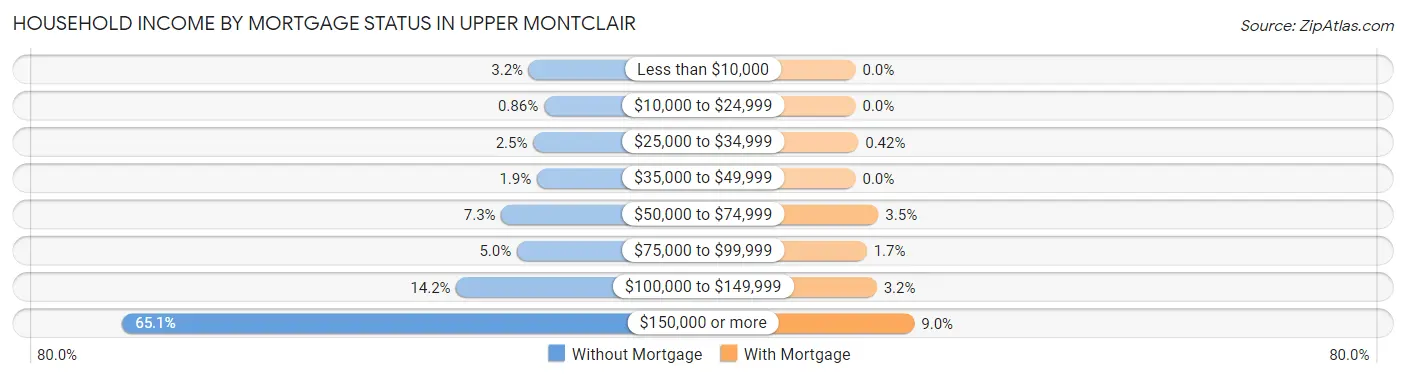
| Household Income | Without Mortgage | With Mortgage |
| Less than $10,000 | 33 (3.2%) | 0 (0.0%) |
| $10,000 to $24,999 | 9 (0.9%) | 0 (0.0%) |
| $25,000 to $34,999 | 26 (2.5%) | 10 (0.4%) |
| $35,000 to $49,999 | 20 (1.9%) | 0 (0.0%) |
| $50,000 to $74,999 | 77 (7.3%) | 82 (3.5%) |
| $75,000 to $99,999 | 52 (5.0%) | 40 (1.7%) |
| $100,000 to $149,999 | 149 (14.2%) | 76 (3.2%) |
| $150,000 or more | 683 (65.1%) | 211 (9.0%) |
| Total | 1,049 (100.0%) | 2,356 (100.0%) |
Property Value to Household Income Ratio in Upper Montclair
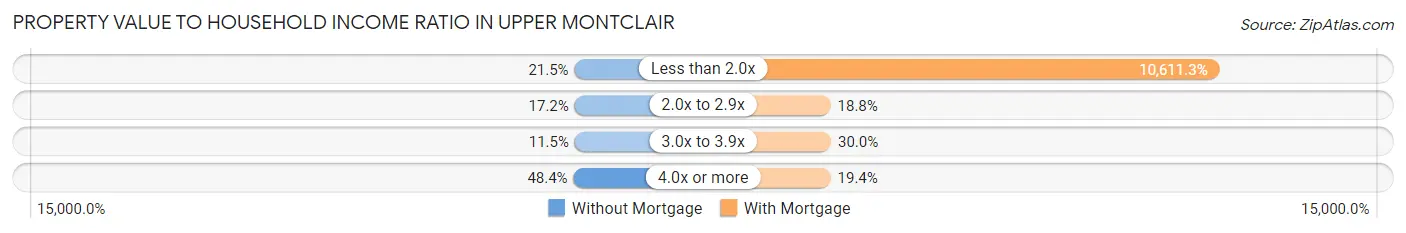
| Value-to-Income Ratio | Without Mortgage | With Mortgage |
| Less than 2.0x | 225 (21.4%) | 250,001 (10,611.2%) |
| 2.0x to 2.9x | 180 (17.2%) | 443 (18.8%) |
| 3.0x to 3.9x | 121 (11.5%) | 707 (30.0%) |
| 4.0x or more | 508 (48.4%) | 458 (19.4%) |
| Total | 1,049 (100.0%) | 2,356 (100.0%) |
Real Estate Taxes by Mortgage Status in Upper Montclair
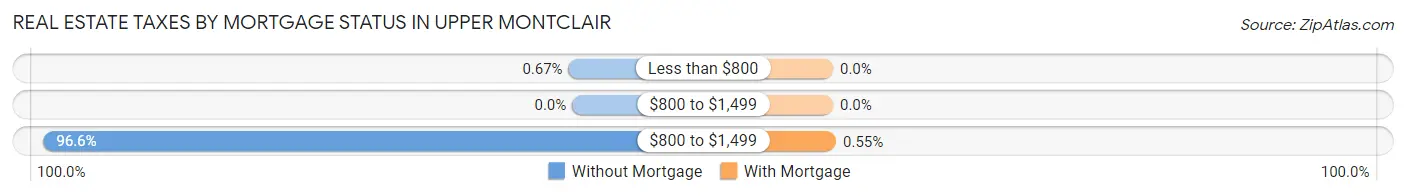
| Property Taxes | Without Mortgage | With Mortgage |
| Less than $800 | 7 (0.7%) | 0 (0.0%) |
| $800 to $1,499 | 0 (0.0%) | 0 (0.0%) |
| $800 to $1,499 | 1,013 (96.6%) | 13 (0.5%) |
| Total | 1,049 (100.0%) | 2,356 (100.0%) |
Health & Disability in Upper Montclair
Health Insurance Coverage by Age in Upper Montclair
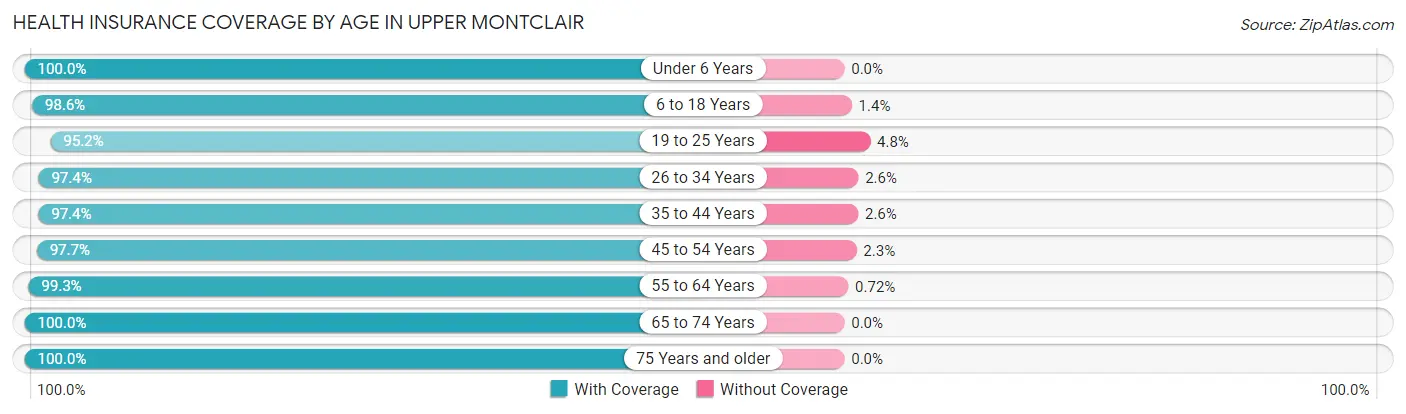
| Age Bracket | With Coverage | Without Coverage |
| Under 6 Years | 1,163 (100.0%) | 0 (0.0%) |
| 6 to 18 Years | 2,525 (98.6%) | 35 (1.4%) |
| 19 to 25 Years | 732 (95.2%) | 37 (4.8%) |
| 26 to 34 Years | 675 (97.4%) | 18 (2.6%) |
| 35 to 44 Years | 1,601 (97.4%) | 42 (2.6%) |
| 45 to 54 Years | 1,988 (97.7%) | 46 (2.3%) |
| 55 to 64 Years | 1,930 (99.3%) | 14 (0.7%) |
| 65 to 74 Years | 1,136 (100.0%) | 0 (0.0%) |
| 75 Years and older | 499 (100.0%) | 0 (0.0%) |
| Total | 12,249 (98.5%) | 192 (1.5%) |
Health Insurance Coverage by Citizenship Status in Upper Montclair
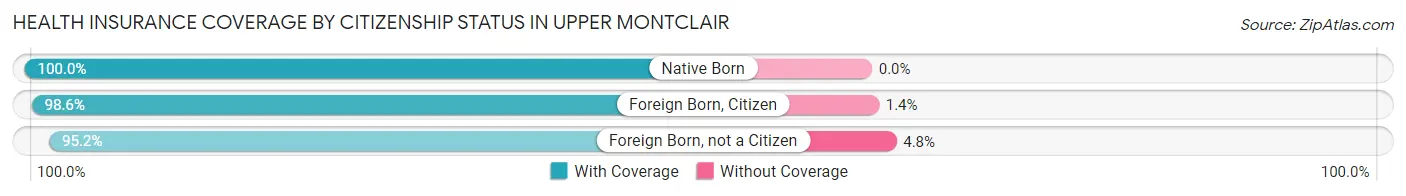
| Citizenship Status | With Coverage | Without Coverage |
| Native Born | 1,163 (100.0%) | 0 (0.0%) |
| Foreign Born, Citizen | 2,525 (98.6%) | 35 (1.4%) |
| Foreign Born, not a Citizen | 732 (95.2%) | 37 (4.8%) |
Health Insurance Coverage by Household Income in Upper Montclair
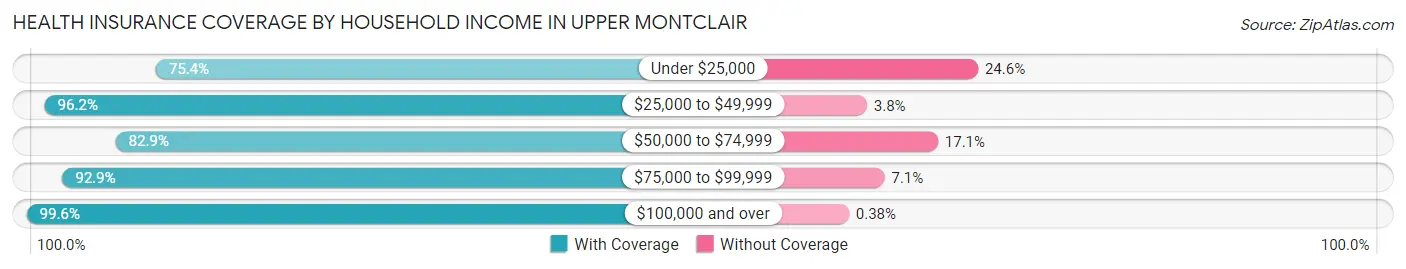
| Household Income | With Coverage | Without Coverage |
| Under $25,000 | 89 (75.4%) | 29 (24.6%) |
| $25,000 to $49,999 | 665 (96.2%) | 26 (3.8%) |
| $50,000 to $74,999 | 282 (82.9%) | 58 (17.1%) |
| $75,000 to $99,999 | 486 (92.9%) | 37 (7.1%) |
| $100,000 and over | 10,575 (99.6%) | 40 (0.4%) |
Public vs Private Health Insurance Coverage by Age in Upper Montclair
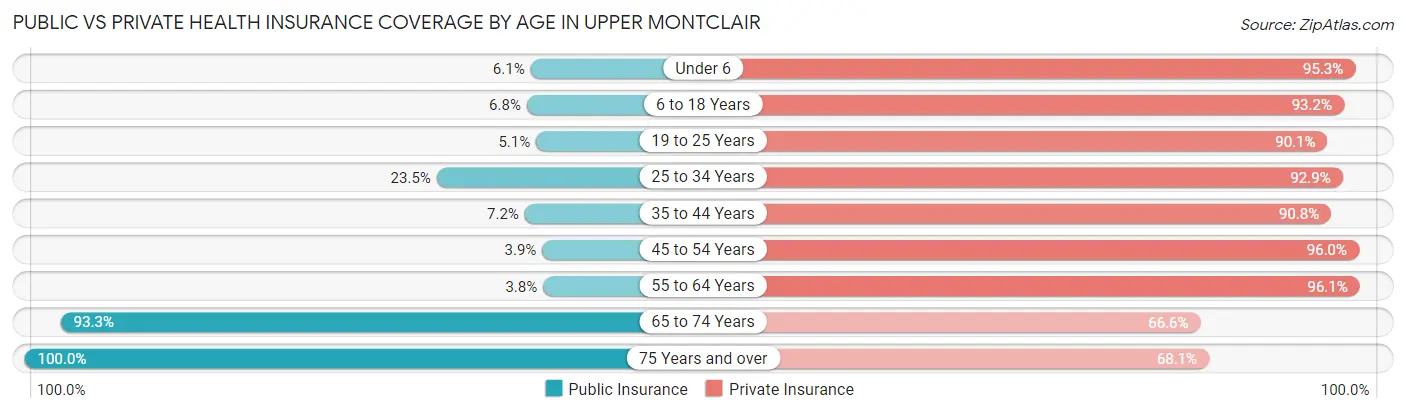
| Age Bracket | Public Insurance | Private Insurance |
| Under 6 | 71 (6.1%) | 1,108 (95.3%) |
| 6 to 18 Years | 174 (6.8%) | 2,385 (93.2%) |
| 19 to 25 Years | 39 (5.1%) | 693 (90.1%) |
| 25 to 34 Years | 163 (23.5%) | 644 (92.9%) |
| 35 to 44 Years | 118 (7.2%) | 1,492 (90.8%) |
| 45 to 54 Years | 80 (3.9%) | 1,952 (96.0%) |
| 55 to 64 Years | 73 (3.8%) | 1,868 (96.1%) |
| 65 to 74 Years | 1,060 (93.3%) | 756 (66.5%) |
| 75 Years and over | 499 (100.0%) | 340 (68.1%) |
| Total | 2,277 (18.3%) | 11,238 (90.3%) |
Disability Status by Sex by Age in Upper Montclair
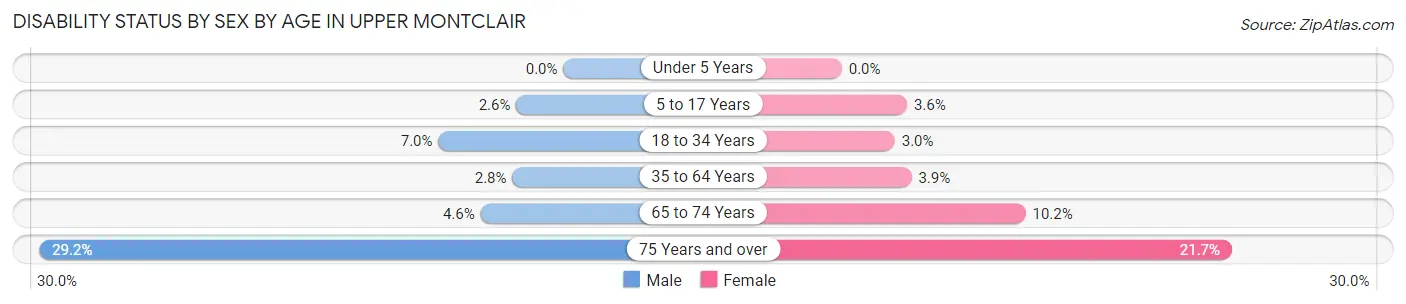
| Age Bracket | Male | Female |
| Under 5 Years | 0 (0.0%) | 0 (0.0%) |
| 5 to 17 Years | 39 (2.6%) | 43 (3.6%) |
| 18 to 34 Years | 65 (7.0%) | 21 (2.9%) |
| 35 to 64 Years | 77 (2.8%) | 113 (3.9%) |
| 65 to 74 Years | 28 (4.6%) | 54 (10.2%) |
| 75 Years and over | 61 (29.2%) | 63 (21.7%) |
Disability Class by Sex by Age in Upper Montclair
Disability Class: Hearing Difficulty
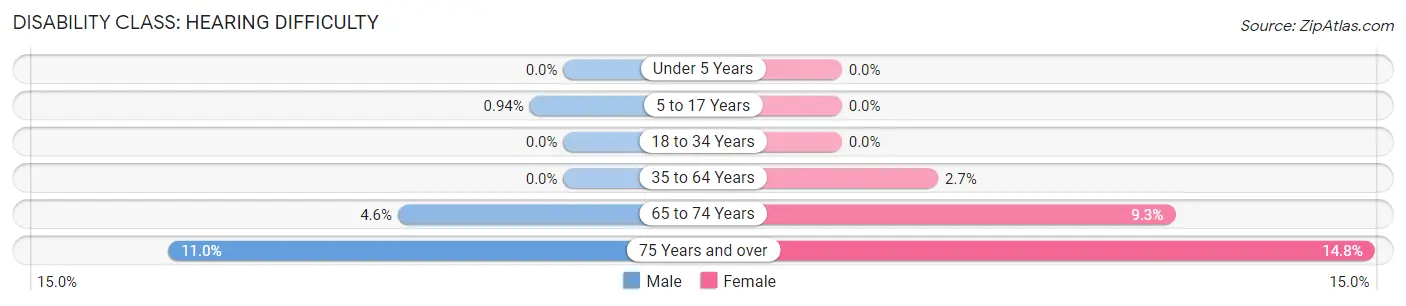
| Age Bracket | Male | Female |
| Under 5 Years | 0 (0.0%) | 0 (0.0%) |
| 5 to 17 Years | 14 (0.9%) | 0 (0.0%) |
| 18 to 34 Years | 0 (0.0%) | 0 (0.0%) |
| 35 to 64 Years | 0 (0.0%) | 78 (2.7%) |
| 65 to 74 Years | 28 (4.6%) | 49 (9.3%) |
| 75 Years and over | 23 (11.0%) | 43 (14.8%) |
Disability Class: Vision Difficulty
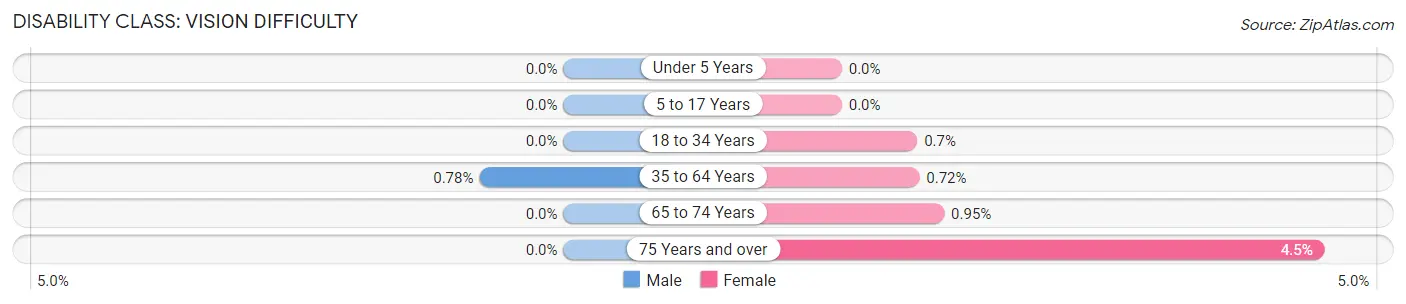
| Age Bracket | Male | Female |
| Under 5 Years | 0 (0.0%) | 0 (0.0%) |
| 5 to 17 Years | 0 (0.0%) | 0 (0.0%) |
| 18 to 34 Years | 0 (0.0%) | 5 (0.7%) |
| 35 to 64 Years | 21 (0.8%) | 21 (0.7%) |
| 65 to 74 Years | 0 (0.0%) | 5 (0.9%) |
| 75 Years and over | 0 (0.0%) | 13 (4.5%) |
Disability Class: Cognitive Difficulty
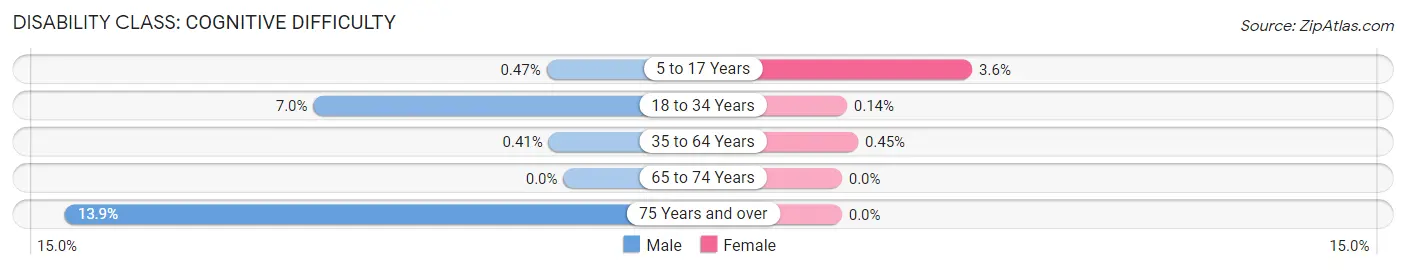
| Age Bracket | Male | Female |
| 5 to 17 Years | 7 (0.5%) | 43 (3.6%) |
| 18 to 34 Years | 65 (7.0%) | 1 (0.1%) |
| 35 to 64 Years | 11 (0.4%) | 13 (0.4%) |
| 65 to 74 Years | 0 (0.0%) | 0 (0.0%) |
| 75 Years and over | 29 (13.9%) | 0 (0.0%) |
Disability Class: Ambulatory Difficulty
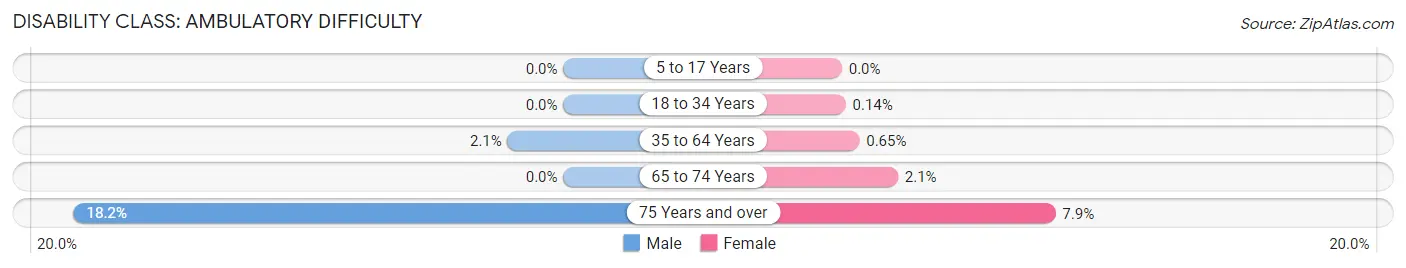
| Age Bracket | Male | Female |
| 5 to 17 Years | 0 (0.0%) | 0 (0.0%) |
| 18 to 34 Years | 0 (0.0%) | 1 (0.1%) |
| 35 to 64 Years | 56 (2.1%) | 19 (0.6%) |
| 65 to 74 Years | 0 (0.0%) | 11 (2.1%) |
| 75 Years and over | 38 (18.2%) | 23 (7.9%) |
Disability Class: Self-Care Difficulty
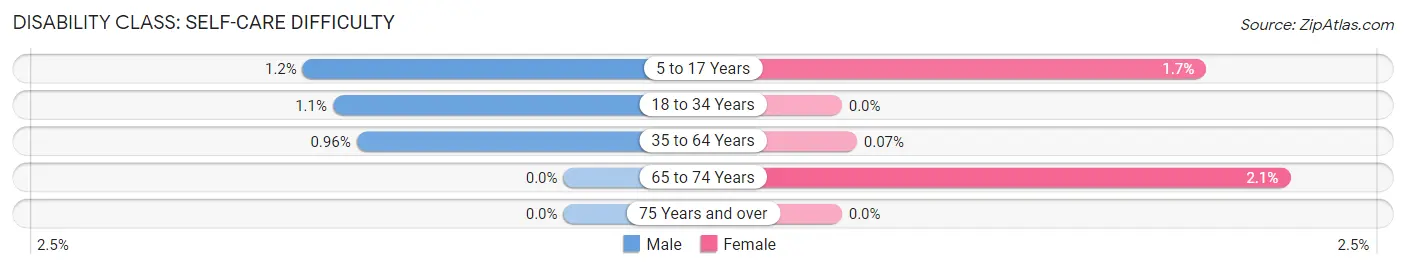
| Age Bracket | Male | Female |
| 5 to 17 Years | 18 (1.2%) | 20 (1.7%) |
| 18 to 34 Years | 10 (1.1%) | 0 (0.0%) |
| 35 to 64 Years | 26 (1.0%) | 2 (0.1%) |
| 65 to 74 Years | 0 (0.0%) | 11 (2.1%) |
| 75 Years and over | 0 (0.0%) | 0 (0.0%) |
Technology Access in Upper Montclair
Computing Device Access in Upper Montclair
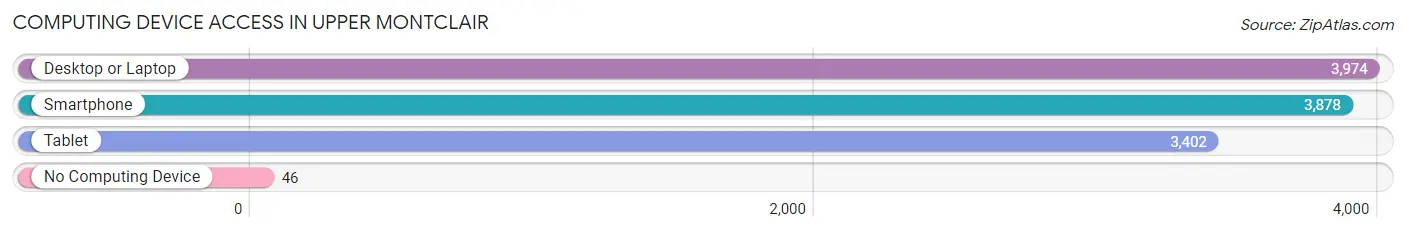
| Device Type | # Households | % Households |
| Desktop or Laptop | 3,974 | 98.2% |
| Smartphone | 3,878 | 95.8% |
| Tablet | 3,402 | 84.1% |
| No Computing Device | 46 | 1.1% |
| Total | 4,047 | 100.0% |
Internet Access in Upper Montclair
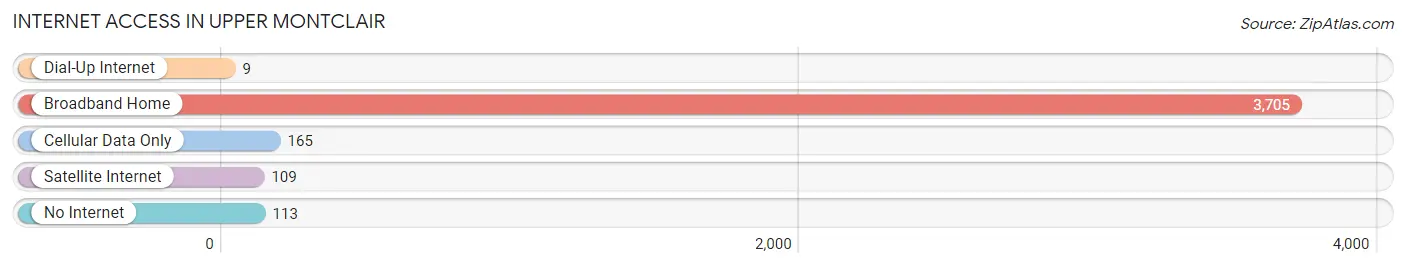
| Internet Type | # Households | % Households |
| Dial-Up Internet | 9 | 0.2% |
| Broadband Home | 3,705 | 91.5% |
| Cellular Data Only | 165 | 4.1% |
| Satellite Internet | 109 | 2.7% |
| No Internet | 113 | 2.8% |
| Total | 4,047 | 100.0% |
Upper Montclair Summary
Upper Montclair is a census-designated place (CDP) located in the township of Montclair, in Essex County, New Jersey. It is a suburban community located approximately 12 miles west of New York City. The population of Upper Montclair was 11,565 at the 2010 United States Census.
History
Upper Montclair was originally part of the township of Bloomfield, which was established in 1812. In 1868, the township of Montclair was created from the northern part of Bloomfield. Upper Montclair was then part of the township of Montclair until it was incorporated as a separate CDP in 1980.
The area was first settled in the late 1700s by Dutch and English settlers. The area was known as Speertown, named after the Speer family who owned much of the land in the area. In the mid-1800s, the area began to be developed as a residential community. The area was known as North Montclair, and was home to many wealthy families.
Geography
Upper Montclair is located at 40°48'17" North, 74°13'45" West (40.804722, -74.229167). It is bordered by the townships of Clifton to the north, Bloomfield to the east, and Verona to the south. The CDP has a total area of 1.7 square miles, all of which is land.
The terrain of Upper Montclair is mostly hilly, with some flat areas. The highest point in the CDP is the summit of Watchung Mountain, which is located in the northern part of the CDP and has an elevation of 590 feet.
Economy
Upper Montclair is a primarily residential community, with no major industries or businesses located within its borders. The majority of the population is employed in the service sector, with many residents commuting to New York City for work.
The median household income in Upper Montclair was $107,917 in 2017, which is significantly higher than the median household income for the state of New Jersey ($76,475) and the United States ($60,336).
Demographics
As of the 2010 United States Census, there were 11,565 people, 4,717 households, and 3,092 families residing in the CDP. The population density was 6,817.3 people per square mile. The racial makeup of the CDP was 79.2% White, 8.2% African American, 0.2% Native American, 8.3% Asian, 0.1% Pacific Islander, 1.3% from other races, and 2.7% from two or more races. Hispanic or Latino of any race were 6.2% of the population.
The median age in Upper Montclair was 43.2 years. About 24.3% of residents were under the age of 18, and 11.2% were 65 years of age or older. The gender makeup of the CDP was 48.2% male and 51.8% female.
Conclusion
Upper Montclair is a suburban community located in the township of Montclair, in Essex County, New Jersey. It has a population of 11,565 and is primarily a residential community, with no major industries or businesses located within its borders. The median household income in Upper Montclair is significantly higher than the median household income for the state of New Jersey and the United States. The racial makeup of the CDP is mostly White, with a significant Asian population. The median age in Upper Montclair is 43.2 years, and the gender makeup of the CDP is 48.2% male and 51.8% female.
Common Questions
What is the Total Population of Upper Montclair?
Total Population of Upper Montclair is 12,441.
What is the Total Male Population of Upper Montclair?
Total Male Population of Upper Montclair is 6,410.
What is the Total Female Population of Upper Montclair?
Total Female Population of Upper Montclair is 6,031.
What is the Ratio of Males per 100 Females in Upper Montclair?
There are 106.28 Males per 100 Females in Upper Montclair.
What is the Ratio of Females per 100 Males in Upper Montclair?
There are 94.09 Females per 100 Males in Upper Montclair.
What is the Median Population Age in Upper Montclair?
Median Population Age in Upper Montclair is 41.4 Years.
What is the Average Family Size in Upper Montclair
Average Family Size in Upper Montclair is 3.3 People.
What is the Average Household Size in Upper Montclair
Average Household Size in Upper Montclair is 3.0 People.
What is Per Capita Income in Upper Montclair?
Per Capita income in Upper Montclair is $102,287.
What is the Median Family Income in Upper Montclair?
Median Family Income in Upper Montclair is $250,001.
What is the Median Household income in Upper Montclair?
Median Household Income in Upper Montclair is $234,620.
What is Income or Wage Gap in Upper Montclair?
Income or Wage Gap in Upper Montclair is 39.1%.
Women in Upper Montclair earn 60.9 cents for every dollar earned by a man.
What is Inequality or Gini Index in Upper Montclair?
Inequality or Gini Index in Upper Montclair is 0.44.
How Large is the Labor Force in Upper Montclair?
There are 6,509 People in the Labor Forcein in Upper Montclair.
What is the Percentage of People in the Labor Force in Upper Montclair?
69.7% of People are in the Labor Force in Upper Montclair.
What is the Unemployment Rate in Upper Montclair?
Unemployment Rate in Upper Montclair is 6.3%.