White House Station, NJ
White House Station Map
White House Station Overview
3,788
TOTAL POPULATION
1,793
MALE POPULATION
1,995
FEMALE POPULATION
89.87
MALES / 100 FEMALES
111.27
FEMALES / 100 MALES
53.3
MEDIAN AGE
2.8
AVG FAMILY SIZE
2.3
AVG HOUSEHOLD SIZE
$60,291
PER CAPITA INCOME
$146,776
AVG FAMILY INCOME
$104,155
AVG HOUSEHOLD INCOME
49.6%
WAGE / INCOME GAP [ % ]
50.4¢/ $1
WAGE / INCOME GAP [ $ ]
0.42
INEQUALITY / GINI INDEX
1,860
LABOR FORCE [ PEOPLE ]
55.8%
PERCENT IN LABOR FORCE
10.4%
UNEMPLOYMENT RATE
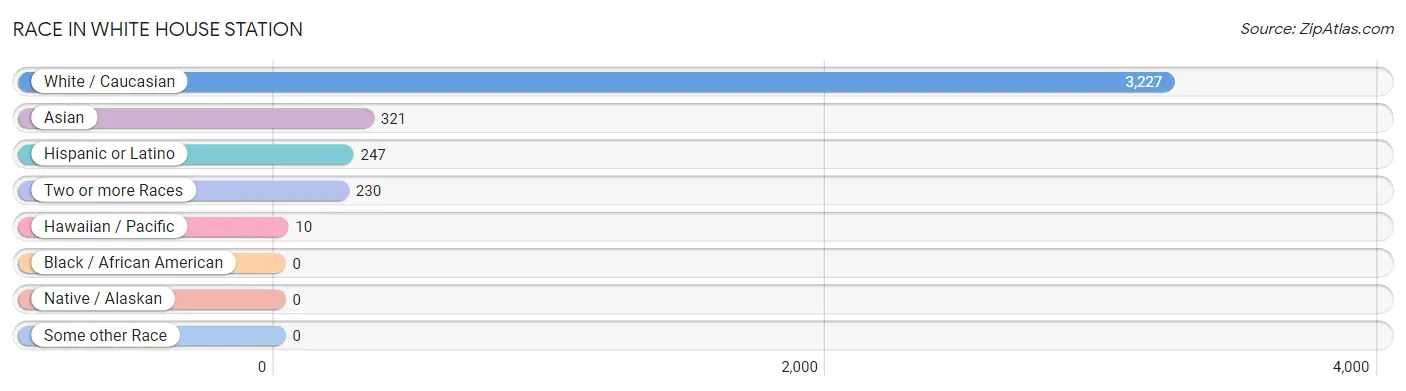
Race in White House Station
The most populous races in White House Station are White / Caucasian (3,227 | 85.2%), Asian (321 | 8.5%), and Hispanic or Latino (247 | 6.5%).
| Race | # Population | % Population |
| Asian | 321 | 8.5% |
| Black / African American | 0 | 0.0% |
| Hawaiian / Pacific | 10 | 0.3% |
| Hispanic or Latino | 247 | 6.5% |
| Native / Alaskan | 0 | 0.0% |
| White / Caucasian | 3,227 | 85.2% |
| Two or more Races | 230 | 6.1% |
| Some other Race | 0 | 0.0% |
| Total | 3,788 | 100.0% |
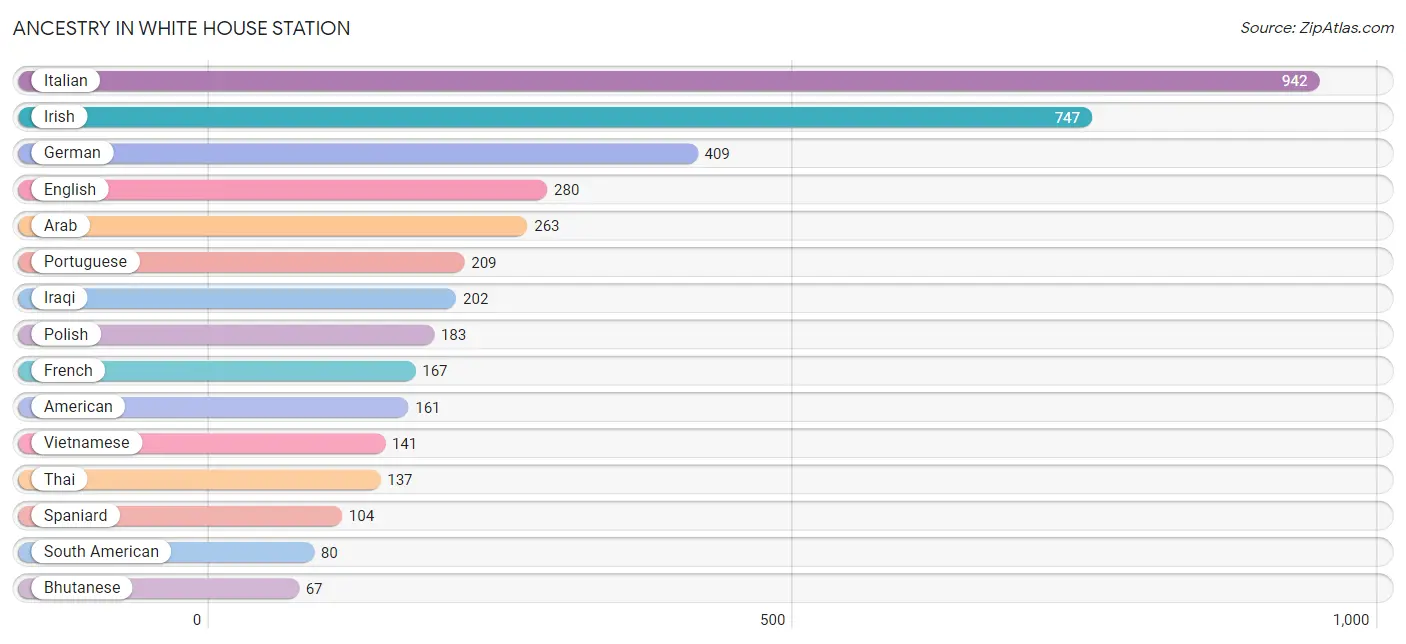
Ancestry in White House Station
The most populous ancestries reported in White House Station are Italian (942 | 24.9%), Irish (747 | 19.7%), German (409 | 10.8%), English (280 | 7.4%), and Arab (263 | 6.9%), together accounting for 69.7% of all White House Station residents.
| Ancestry | # Population | % Population |
| American | 161 | 4.3% |
| Arab | 263 | 6.9% |
| Argentinean | 60 | 1.6% |
| Austrian | 46 | 1.2% |
| Bhutanese | 67 | 1.8% |
| Bolivian | 20 | 0.5% |
| Brazilian | 58 | 1.5% |
| Croatian | 9 | 0.2% |
| Cuban | 10 | 0.3% |
| Czech | 33 | 0.9% |
| Dutch | 23 | 0.6% |
| Eastern European | 53 | 1.4% |
| English | 280 | 7.4% |
| European | 16 | 0.4% |
| French | 167 | 4.4% |
| French Canadian | 8 | 0.2% |
| German | 409 | 10.8% |
| Indian (Asian) | 7 | 0.2% |
| Iraqi | 202 | 5.3% |
| Irish | 747 | 19.7% |
| Italian | 942 | 24.9% |
| Lithuanian | 27 | 0.7% |
| Mexican | 32 | 0.8% |
| Norwegian | 12 | 0.3% |
| Palestinian | 61 | 1.6% |
| Polish | 183 | 4.8% |
| Portuguese | 209 | 5.5% |
| Puerto Rican | 21 | 0.5% |
| Russian | 9 | 0.2% |
| Scotch-Irish | 39 | 1.0% |
| Scottish | 21 | 0.5% |
| Slovak | 25 | 0.7% |
| South American | 80 | 2.1% |
| Spaniard | 104 | 2.8% |
| Swedish | 30 | 0.8% |
| Thai | 137 | 3.6% |
| Ukrainian | 8 | 0.2% |
| Vietnamese | 141 | 3.7% | View All 38 Rows |
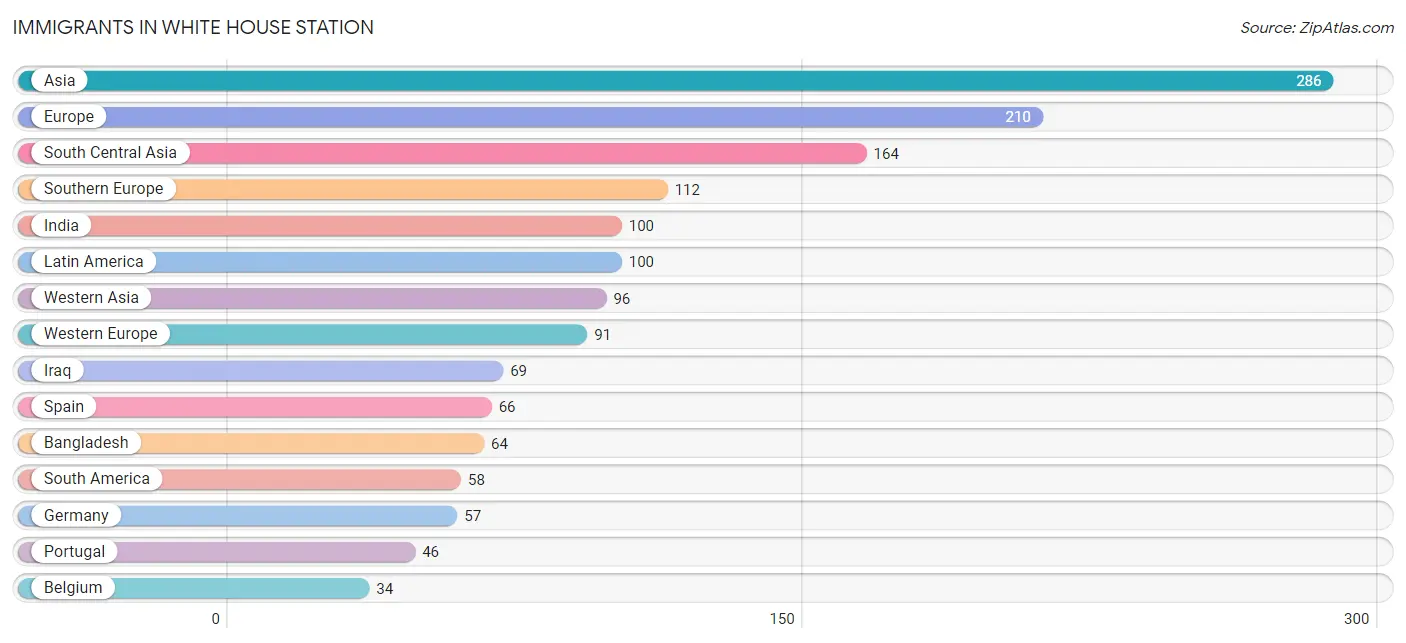
Immigrants in White House Station
The most numerous immigrant groups reported in White House Station came from Asia (286 | 7.5%), Europe (210 | 5.5%), South Central Asia (164 | 4.3%), Southern Europe (112 | 3.0%), and India (100 | 2.6%), together accounting for 23.0% of all White House Station residents.
| Immigration Origin | # Population | % Population |
| Argentina | 25 | 0.7% |
| Asia | 286 | 7.5% |
| Bangladesh | 64 | 1.7% |
| Belgium | 34 | 0.9% |
| Bolivia | 33 | 0.9% |
| Canada | 10 | 0.3% |
| Caribbean | 10 | 0.3% |
| Central America | 32 | 0.8% |
| Cuba | 10 | 0.3% |
| Eastern Asia | 26 | 0.7% |
| Europe | 210 | 5.5% |
| Fiji | 10 | 0.3% |
| Germany | 57 | 1.5% |
| India | 100 | 2.6% |
| Iraq | 69 | 1.8% |
| Israel | 27 | 0.7% |
| Japan | 26 | 0.7% |
| Latin America | 100 | 2.6% |
| Mexico | 32 | 0.8% |
| Northern Europe | 7 | 0.2% |
| Oceania | 10 | 0.3% |
| Portugal | 46 | 1.2% |
| South America | 58 | 1.5% |
| South Central Asia | 164 | 4.3% |
| Southern Europe | 112 | 3.0% |
| Spain | 66 | 1.7% |
| Western Asia | 96 | 2.5% |
| Western Europe | 91 | 2.4% | View All 28 Rows |
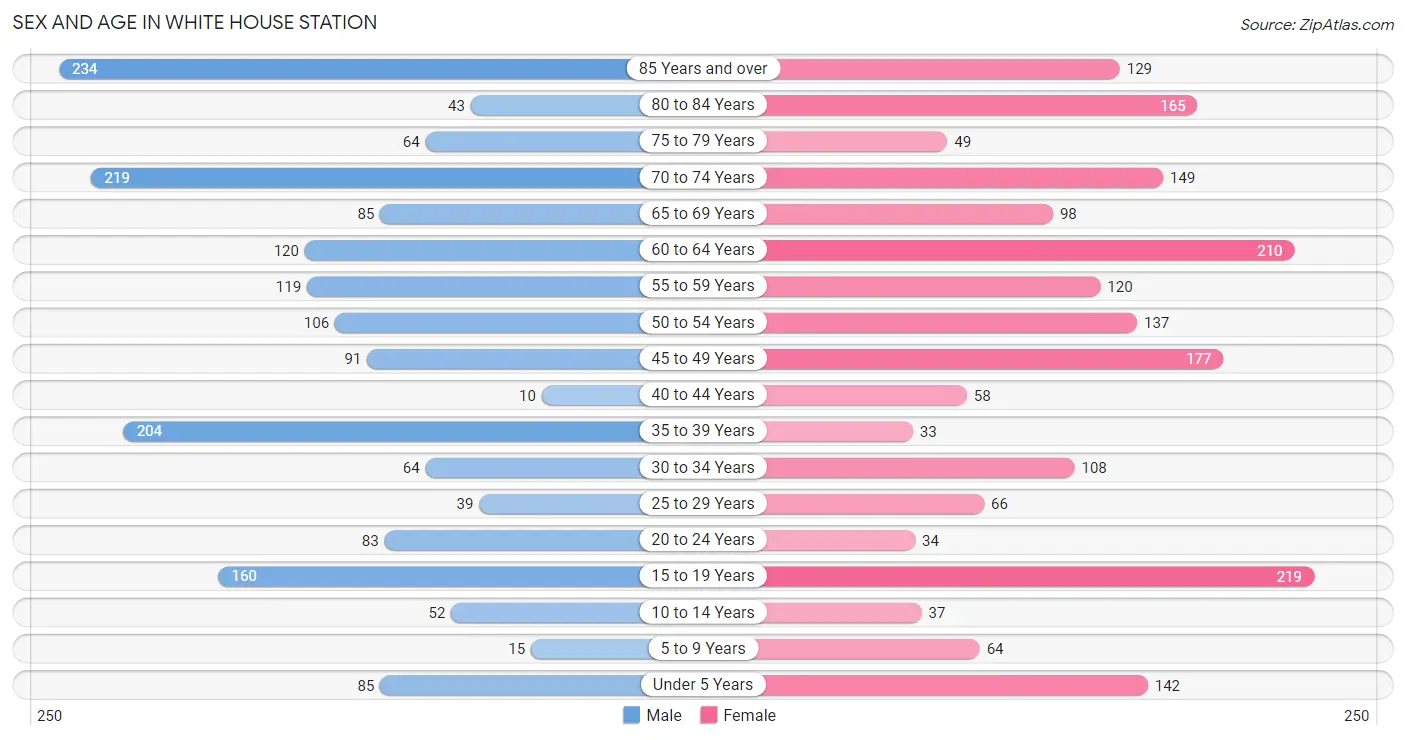
Sex and Age in White House Station
Sex and Age in White House Station
The most populous age groups in White House Station are 85 Years and over (234 | 13.1%) for men and 15 to 19 Years (219 | 11.0%) for women.
| Age Bracket | Male | Female |
| Under 5 Years | 85 (4.7%) | 142 (7.1%) |
| 5 to 9 Years | 15 (0.8%) | 64 (3.2%) |
| 10 to 14 Years | 52 (2.9%) | 37 (1.8%) |
| 15 to 19 Years | 160 (8.9%) | 219 (11.0%) |
| 20 to 24 Years | 83 (4.6%) | 34 (1.7%) |
| 25 to 29 Years | 39 (2.2%) | 66 (3.3%) |
| 30 to 34 Years | 64 (3.6%) | 108 (5.4%) |
| 35 to 39 Years | 204 (11.4%) | 33 (1.7%) |
| 40 to 44 Years | 10 (0.6%) | 58 (2.9%) |
| 45 to 49 Years | 91 (5.1%) | 177 (8.9%) |
| 50 to 54 Years | 106 (5.9%) | 137 (6.9%) |
| 55 to 59 Years | 119 (6.6%) | 120 (6.0%) |
| 60 to 64 Years | 120 (6.7%) | 210 (10.5%) |
| 65 to 69 Years | 85 (4.7%) | 98 (4.9%) |
| 70 to 74 Years | 219 (12.2%) | 149 (7.5%) |
| 75 to 79 Years | 64 (3.6%) | 49 (2.5%) |
| 80 to 84 Years | 43 (2.4%) | 165 (8.3%) |
| 85 Years and over | 234 (13.1%) | 129 (6.5%) |
| Total | 1,793 (100.0%) | 1,995 (100.0%) |
Families and Households in White House Station
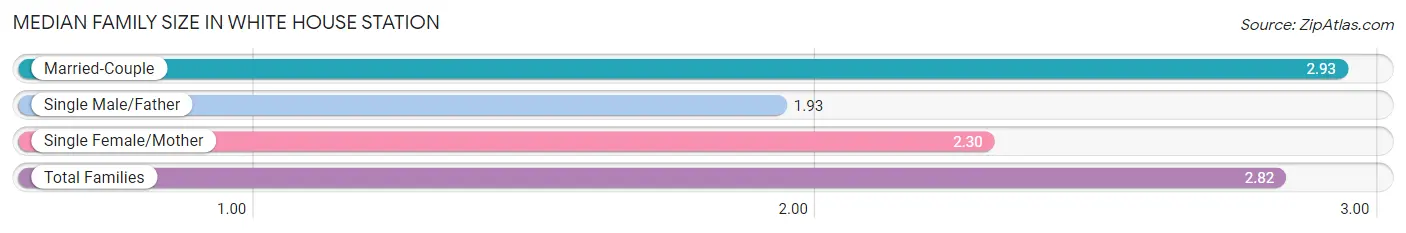
Median Family Size in White House Station
The median family size in White House Station is 2.82 persons per family, with married-couple families (937 | 84.9%) accounting for the largest median family size of 2.93 persons per family. On the other hand, single male/father families (55 | 5.0%) represent the smallest median family size with 1.93 persons per family.
| Family Type | # Families | Family Size |
| Married-Couple | 937 (84.9%) | 2.93 |
| Single Male/Father | 55 (5.0%) | 1.93 |
| Single Female/Mother | 112 (10.1%) | 2.30 |
| Total Families | 1,104 (100.0%) | 2.82 |
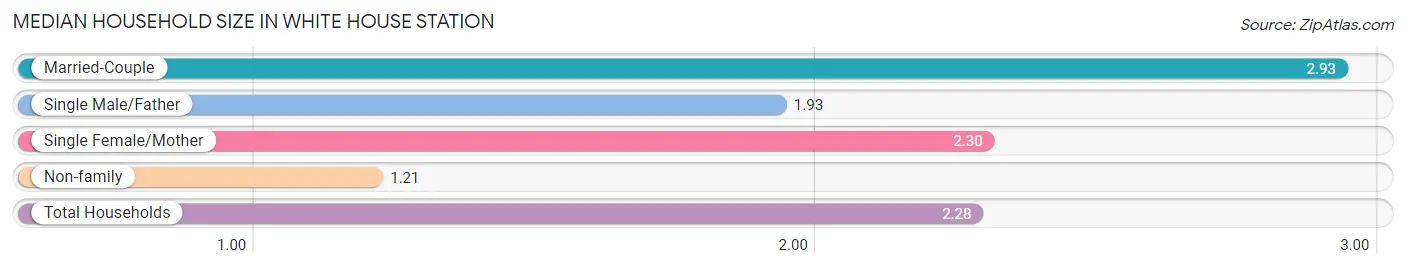
Median Household Size in White House Station
The median household size in White House Station is 2.28 persons per household, with married-couple households (937 | 56.4%) accounting for the largest median household size of 2.93 persons per household. non-family households (557 | 33.5%) represent the smallest median household size with 1.21 persons per household.
| Household Type | # Households | Household Size |
| Married-Couple | 937 (56.4%) | 2.93 |
| Single Male/Father | 55 (3.3%) | 1.93 |
| Single Female/Mother | 112 (6.7%) | 2.30 |
| Non-family | 557 (33.5%) | 1.21 |
| Total Households | 1,661 (100.0%) | 2.28 |
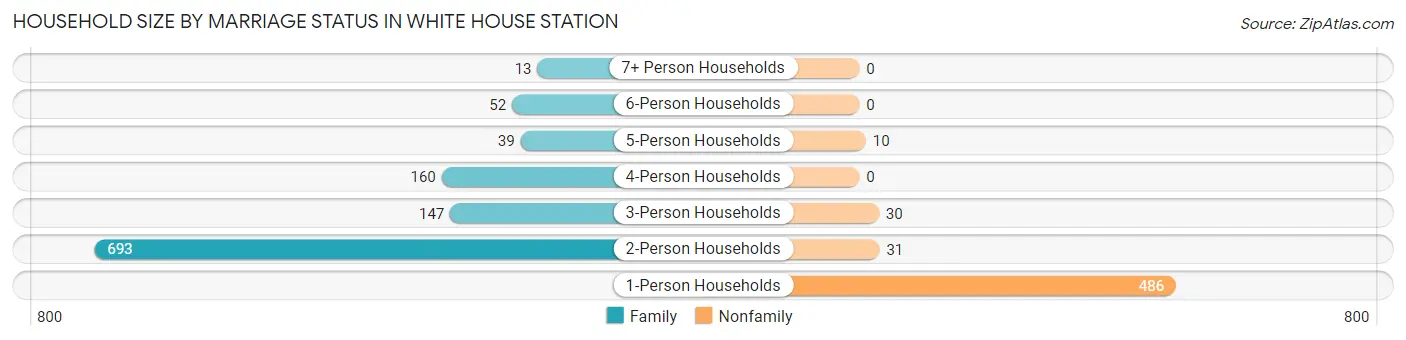
Household Size by Marriage Status in White House Station
Out of a total of 1,661 households in White House Station, 1,104 (66.5%) are family households, while 557 (33.5%) are nonfamily households. The most numerous type of family households are 2-person households, comprising 693, and the most common type of nonfamily households are 1-person households, comprising 486.
| Household Size | Family Households | Nonfamily Households |
| 1-Person Households | - | 486 (29.3%) |
| 2-Person Households | 693 (41.7%) | 31 (1.9%) |
| 3-Person Households | 147 (8.8%) | 30 (1.8%) |
| 4-Person Households | 160 (9.6%) | 0 (0.0%) |
| 5-Person Households | 39 (2.4%) | 10 (0.6%) |
| 6-Person Households | 52 (3.1%) | 0 (0.0%) |
| 7+ Person Households | 13 (0.8%) | 0 (0.0%) |
| Total | 1,104 (66.5%) | 557 (33.5%) |
Female Fertility in White House Station
Fertility by Age in White House Station
| Age Bracket | Women with Births | Births / 1,000 Women |
| 15 to 19 years | 0 (0.0%) | 0.0 |
| 20 to 34 years | 0 (0.0%) | 0.0 |
| 35 to 50 years | 0 (0.0%) | 0.0 |
| Total | 0 (0.0%) | 0.0 |
Fertility by Age by Marriage Status in White House Station
| Age Bracket | Married | Unmarried |
| 15 to 19 years | 0 (0.0%) | 0 (0.0%) |
| 20 to 34 years | 0 (0.0%) | 0 (0.0%) |
| 35 to 50 years | 0 (0.0%) | 0 (0.0%) |
| Total | 0 (0.0%) | 0 (0.0%) |
Fertility by Education in White House Station
| Educational Attainment | Women with Births | Births / 1,000 Women |
| Less than High School | 0 (0.0%) | 0.0 |
| High School Diploma | 0 (0.0%) | 0.0 |
| College or Associate's Degree | 0 (0.0%) | 0.0 |
| Bachelor's Degree | 0 (0.0%) | 0.0 |
| Graduate Degree | 0 (0.0%) | 0.0 |
| Total | 0 (0.0%) | 0.0 |
Fertility by Education by Marriage Status in White House Station
| Educational Attainment | Married | Unmarried |
| Less than High School | 0 (0.0%) | 0 (0.0%) |
| High School Diploma | 0 (0.0%) | 0 (0.0%) |
| College or Associate's Degree | 0 (0.0%) | 0 (0.0%) |
| Bachelor's Degree | 0 (0.0%) | 0 (0.0%) |
| Graduate Degree | 0 (0.0%) | 0 (0.0%) |
| Total | 0 (0.0%) | 0 (0.0%) |
Income in White House Station
Income Overview in White House Station
Per Capita Income in White House Station is $60,291, while median incomes of families and households are $146,776 and $104,155 respectively.
| Characteristic | Number | Measure |
| Per Capita Income | 3,788 | $60,291 |
| Median Family Income | 1,104 | $146,776 |
| Mean Family Income | 1,104 | $169,022 |
| Median Household Income | 1,661 | $104,155 |
| Mean Household Income | 1,661 | $138,735 |
| Income Deficit | 1,104 | $0 |
| Wage / Income Gap (%) | 3,788 | 49.59% |
| Wage / Income Gap ($) | 3,788 | 50.41¢ per $1 |
| Gini / Inequality Index | 3,788 | 0.42 |
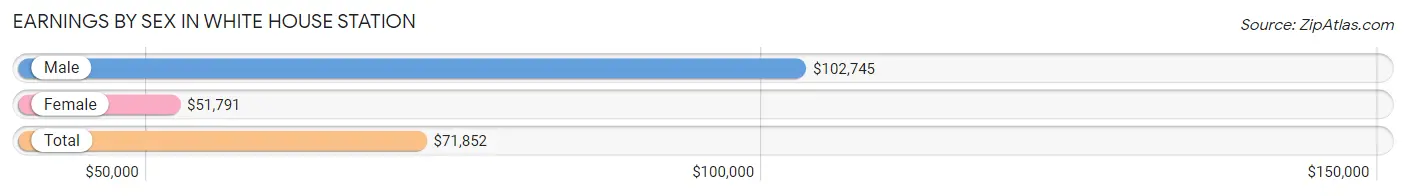
Earnings by Sex in White House Station
Average Earnings in White House Station are $71,852, $102,745 for men and $51,791 for women, a difference of 49.6%.
| Sex | Number | Average Earnings |
| Male | 847 (46.7%) | $102,745 |
| Female | 967 (53.3%) | $51,791 |
| Total | 1,814 (100.0%) | $71,852 |
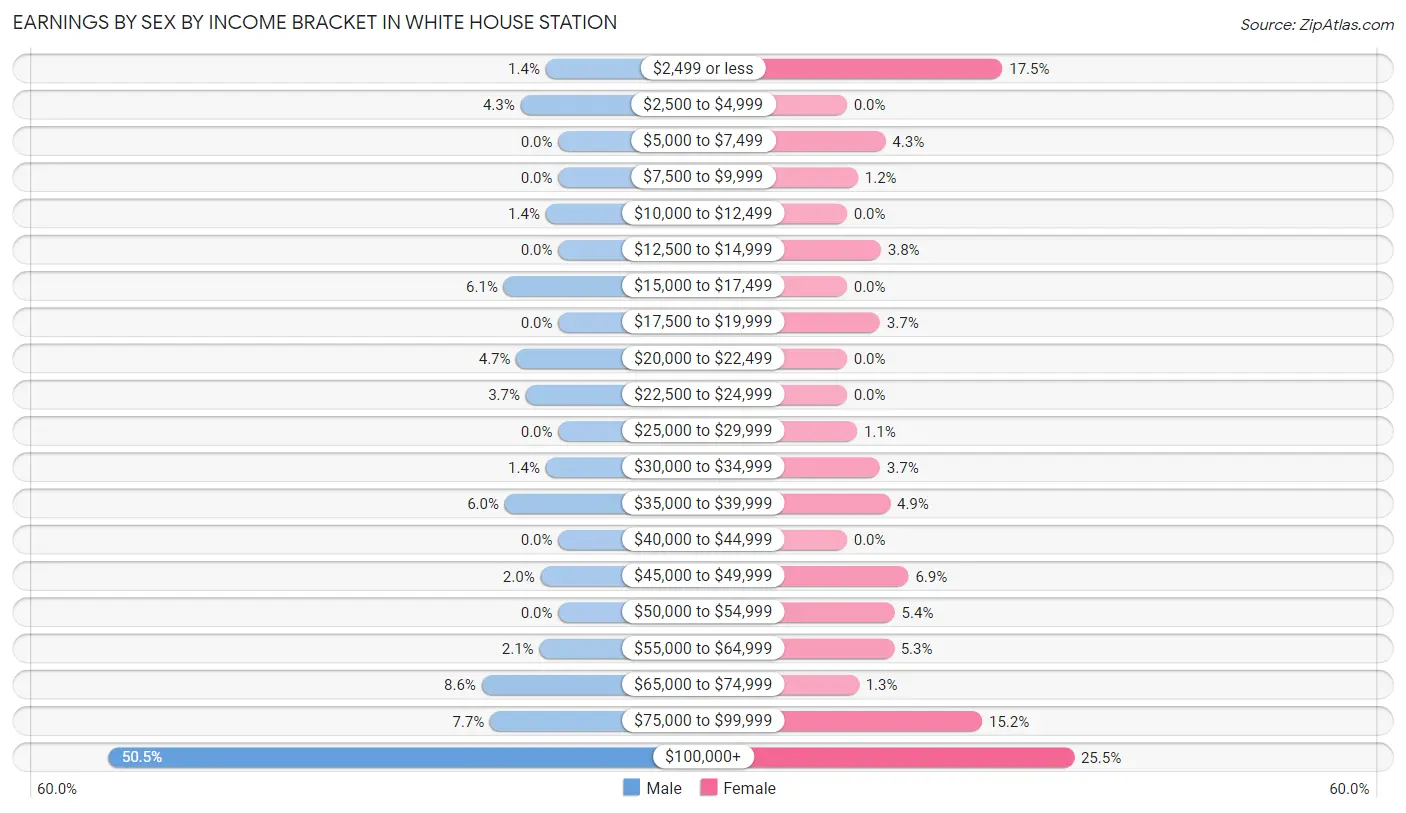
Earnings by Sex by Income Bracket in White House Station
The most common earnings brackets in White House Station are $100,000+ for men (428 | 50.5%) and $100,000+ for women (247 | 25.5%).
| Income | Male | Female |
| $2,499 or less | 12 (1.4%) | 169 (17.5%) |
| $2,500 to $4,999 | 36 (4.3%) | 0 (0.0%) |
| $5,000 to $7,499 | 0 (0.0%) | 42 (4.3%) |
| $7,500 to $9,999 | 0 (0.0%) | 12 (1.2%) |
| $10,000 to $12,499 | 12 (1.4%) | 0 (0.0%) |
| $12,500 to $14,999 | 0 (0.0%) | 37 (3.8%) |
| $15,000 to $17,499 | 52 (6.1%) | 0 (0.0%) |
| $17,500 to $19,999 | 0 (0.0%) | 36 (3.7%) |
| $20,000 to $22,499 | 40 (4.7%) | 0 (0.0%) |
| $22,500 to $24,999 | 31 (3.7%) | 0 (0.0%) |
| $25,000 to $29,999 | 0 (0.0%) | 11 (1.1%) |
| $30,000 to $34,999 | 12 (1.4%) | 36 (3.7%) |
| $35,000 to $39,999 | 51 (6.0%) | 47 (4.9%) |
| $40,000 to $44,999 | 0 (0.0%) | 0 (0.0%) |
| $45,000 to $49,999 | 17 (2.0%) | 67 (6.9%) |
| $50,000 to $54,999 | 0 (0.0%) | 52 (5.4%) |
| $55,000 to $64,999 | 18 (2.1%) | 51 (5.3%) |
| $65,000 to $74,999 | 73 (8.6%) | 13 (1.3%) |
| $75,000 to $99,999 | 65 (7.7%) | 147 (15.2%) |
| $100,000+ | 428 (50.5%) | 247 (25.5%) |
| Total | 847 (100.0%) | 967 (100.0%) |
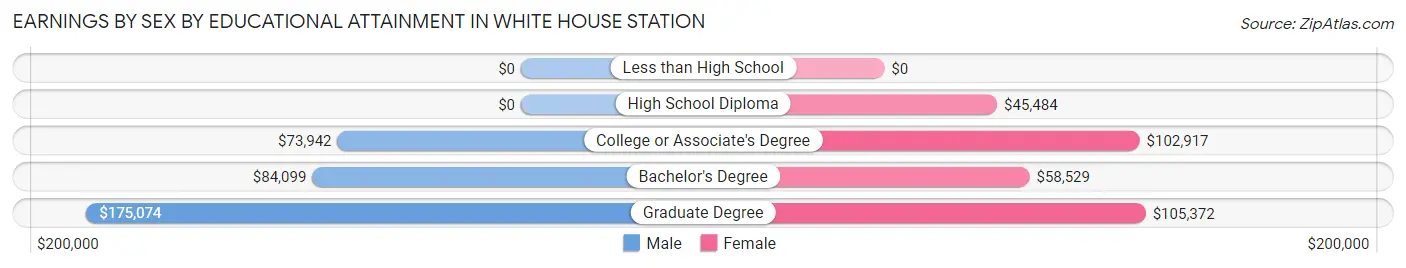
Earnings by Sex by Educational Attainment in White House Station
Average earnings in White House Station are $104,239 for men and $59,154 for women, a difference of 43.2%. Men with an educational attainment of graduate degree enjoy the highest average annual earnings of $175,074, while those with college or associate's degree education earn the least with $73,942. Women with an educational attainment of graduate degree earn the most with the average annual earnings of $105,372, while those with high school diploma education have the smallest earnings of $45,484.
| Educational Attainment | Male Income | Female Income |
| Less than High School | - | - |
| High School Diploma | - | - |
| College or Associate's Degree | $73,942 | $102,917 |
| Bachelor's Degree | $84,099 | $58,529 |
| Graduate Degree | $175,074 | $105,372 |
| Total | $104,239 | $59,154 |
Family Income in White House Station
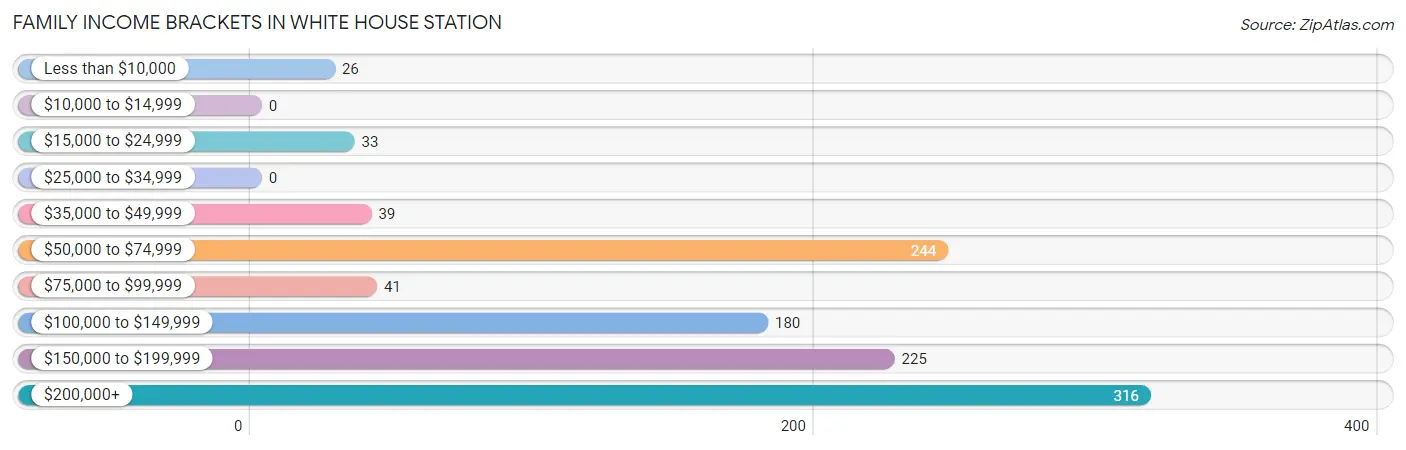
Family Income Brackets in White House Station
According to the White House Station family income data, there are 316 families falling into the $200,000+ income range, which is the most common income bracket and makes up 28.6% of all families.
| Income Bracket | # Families | % Families |
| Less than $10,000 | 26 | 2.4% |
| $10,000 to $14,999 | 0 | 0.0% |
| $15,000 to $24,999 | 33 | 3.0% |
| $25,000 to $34,999 | 0 | 0.0% |
| $35,000 to $49,999 | 39 | 3.5% |
| $50,000 to $74,999 | 244 | 22.1% |
| $75,000 to $99,999 | 41 | 3.7% |
| $100,000 to $149,999 | 180 | 16.3% |
| $150,000 to $199,999 | 225 | 20.4% |
| $200,000+ | 316 | 28.6% |
Family Income by Famaliy Size in White House Station
4-person families (160 | 14.5%) account for the highest median family income in White House Station with $193,698 per family, while 2-person families (693 | 62.8%) have the highest median income of $62,232 per family member.
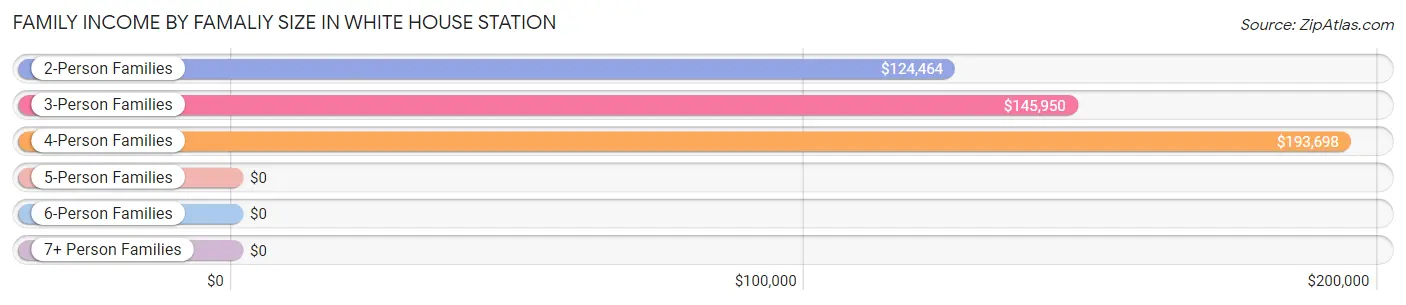
| Income Bracket | # Families | Median Income |
| 2-Person Families | 693 (62.8%) | $124,464 |
| 3-Person Families | 147 (13.3%) | $145,950 |
| 4-Person Families | 160 (14.5%) | $193,698 |
| 5-Person Families | 39 (3.5%) | $0 |
| 6-Person Families | 52 (4.7%) | $0 |
| 7+ Person Families | 13 (1.2%) | $0 |
| Total | 1,104 (100.0%) | $146,776 |
Family Income by Number of Earners in White House Station
The median family income in White House Station is $146,776, with families comprising 3+ earners (67) having the highest median family income of $250,001, while families with no earners (370) have the lowest median family income of $62,069, accounting for 6.1% and 33.5% of families, respectively.
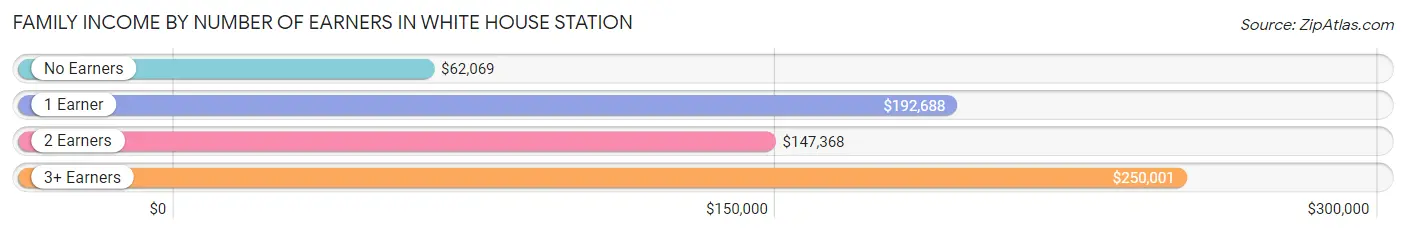
| Number of Earners | # Families | Median Income |
| No Earners | 370 (33.5%) | $62,069 |
| 1 Earner | 201 (18.2%) | $192,688 |
| 2 Earners | 466 (42.2%) | $147,368 |
| 3+ Earners | 67 (6.1%) | $250,001 |
| Total | 1,104 (100.0%) | $146,776 |
Household Income in White House Station
Household Income Brackets in White House Station
With 410 households falling in the category, the $50,000 to $74,999 income range is the most frequent in White House Station, accounting for 24.7% of all households. In contrast, only 8 households (0.5%) fall into the $10,000 to $14,999 income bracket, making it the least populous group.
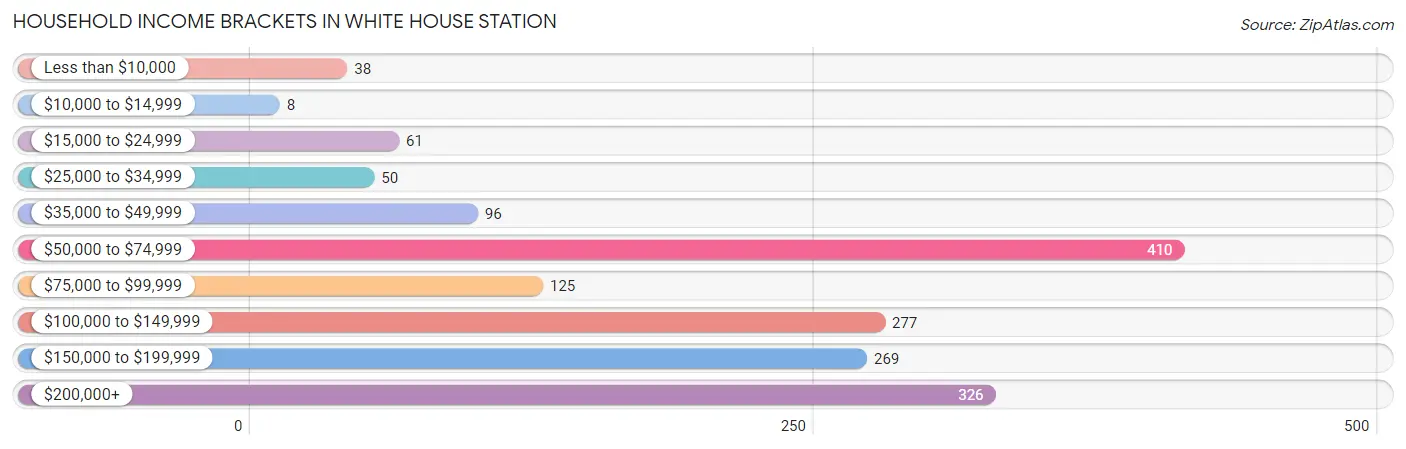
| Income Bracket | # Households | % Households |
| Less than $10,000 | 38 | 2.3% |
| $10,000 to $14,999 | 8 | 0.5% |
| $15,000 to $24,999 | 61 | 3.7% |
| $25,000 to $34,999 | 50 | 3.0% |
| $35,000 to $49,999 | 96 | 5.8% |
| $50,000 to $74,999 | 410 | 24.7% |
| $75,000 to $99,999 | 125 | 7.5% |
| $100,000 to $149,999 | 277 | 16.7% |
| $150,000 to $199,999 | 269 | 16.2% |
| $200,000+ | 326 | 19.6% |
Household Income by Householder Age in White House Station
The median household income in White House Station is $104,155, with the highest median household income of $141,287 found in the 45 to 64 years age bracket for the primary householder. A total of 669 households (40.3%) fall into this category.
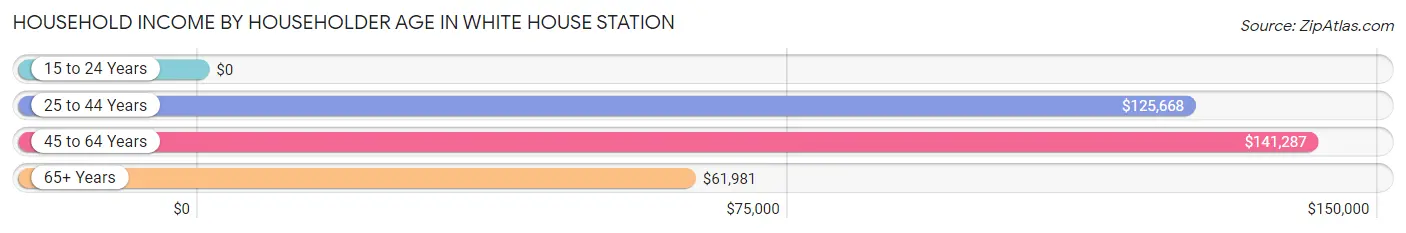
| Income Bracket | # Households | Median Income |
| 15 to 24 Years | 0 (0.0%) | $0 |
| 25 to 44 Years | 269 (16.2%) | $125,668 |
| 45 to 64 Years | 669 (40.3%) | $141,287 |
| 65+ Years | 723 (43.5%) | $61,981 |
| Total | 1,661 (100.0%) | $104,155 |
Poverty in White House Station
Income Below Poverty by Sex and Age in White House Station
With 2.1% poverty level for males and 4.0% for females among the residents of White House Station, 65 to 74 year old males and 25 to 34 year old females are the most vulnerable to poverty, with 26 males (8.6%) and 24 females (13.8%) in their respective age groups living below the poverty level.
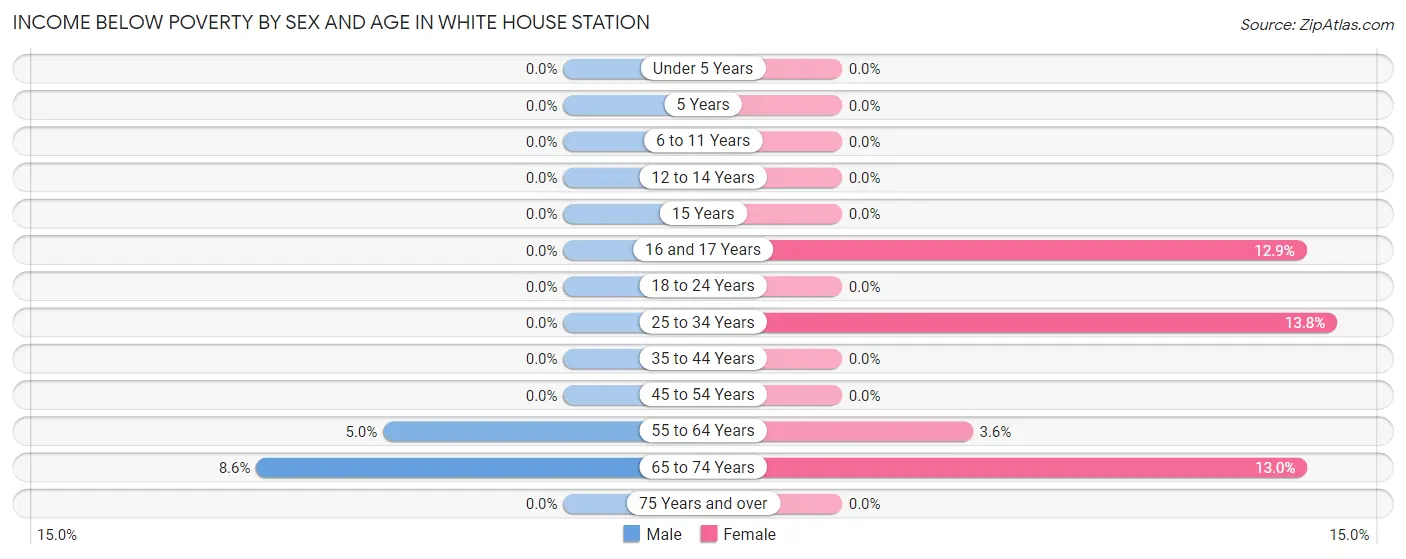
| Age Bracket | Male | Female |
| Under 5 Years | 0 (0.0%) | 0 (0.0%) |
| 5 Years | 0 (0.0%) | 0 (0.0%) |
| 6 to 11 Years | 0 (0.0%) | 0 (0.0%) |
| 12 to 14 Years | 0 (0.0%) | 0 (0.0%) |
| 15 Years | 0 (0.0%) | 0 (0.0%) |
| 16 and 17 Years | 0 (0.0%) | 11 (12.9%) |
| 18 to 24 Years | 0 (0.0%) | 0 (0.0%) |
| 25 to 34 Years | 0 (0.0%) | 24 (13.8%) |
| 35 to 44 Years | 0 (0.0%) | 0 (0.0%) |
| 45 to 54 Years | 0 (0.0%) | 0 (0.0%) |
| 55 to 64 Years | 12 (5.0%) | 12 (3.6%) |
| 65 to 74 Years | 26 (8.6%) | 32 (13.0%) |
| 75 Years and over | 0 (0.0%) | 0 (0.0%) |
| Total | 38 (2.1%) | 79 (4.0%) |
Income Above Poverty by Sex and Age in White House Station
According to the poverty statistics in White House Station, males aged under 5 years and females aged under 5 years are the age groups that are most secure financially, with 100.0% of males and 100.0% of females in these age groups living above the poverty line.
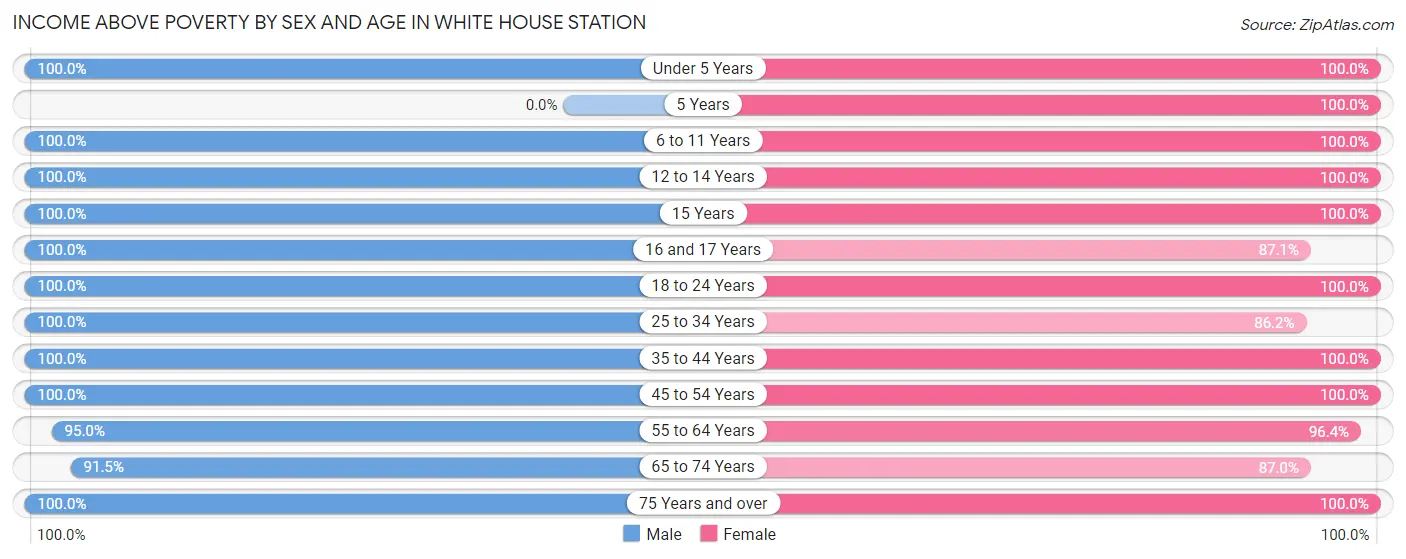
| Age Bracket | Male | Female |
| Under 5 Years | 85 (100.0%) | 142 (100.0%) |
| 5 Years | 0 (0.0%) | 14 (100.0%) |
| 6 to 11 Years | 44 (100.0%) | 50 (100.0%) |
| 12 to 14 Years | 23 (100.0%) | 37 (100.0%) |
| 15 Years | 46 (100.0%) | 13 (100.0%) |
| 16 and 17 Years | 114 (100.0%) | 74 (87.1%) |
| 18 to 24 Years | 83 (100.0%) | 155 (100.0%) |
| 25 to 34 Years | 103 (100.0%) | 150 (86.2%) |
| 35 to 44 Years | 214 (100.0%) | 91 (100.0%) |
| 45 to 54 Years | 197 (100.0%) | 314 (100.0%) |
| 55 to 64 Years | 227 (95.0%) | 318 (96.4%) |
| 65 to 74 Years | 278 (91.4%) | 215 (87.0%) |
| 75 Years and over | 341 (100.0%) | 343 (100.0%) |
| Total | 1,755 (97.9%) | 1,916 (96.0%) |
Income Below Poverty Among Married-Couple Families in White House Station
The poverty statistics for married-couple families in White House Station show that 2.8% or 26 of the total 937 families live below the poverty line. Families with no children have the highest poverty rate of 3.9%, comprising of 26 families. On the other hand, families with 1 or 2 children have the lowest poverty rate of 0.0%, which includes 0 families.
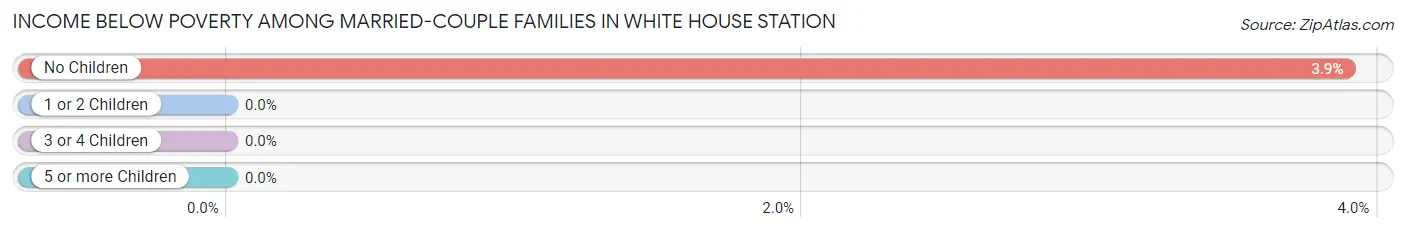
| Children | Above Poverty | Below Poverty |
| No Children | 643 (96.1%) | 26 (3.9%) |
| 1 or 2 Children | 199 (100.0%) | 0 (0.0%) |
| 3 or 4 Children | 69 (100.0%) | 0 (0.0%) |
| 5 or more Children | 0 (0.0%) | 0 (0.0%) |
| Total | 911 (97.2%) | 26 (2.8%) |
Income Below Poverty Among Single-Parent Households in White House Station
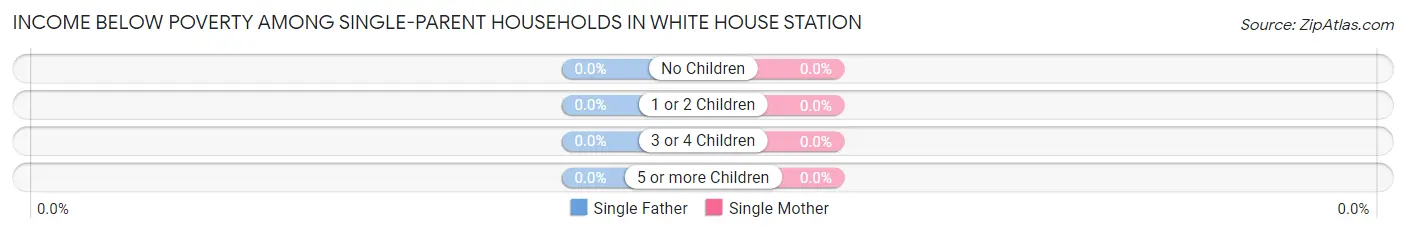
| Children | Single Father | Single Mother |
| No Children | 0 (0.0%) | 0 (0.0%) |
| 1 or 2 Children | 0 (0.0%) | 0 (0.0%) |
| 3 or 4 Children | 0 (0.0%) | 0 (0.0%) |
| 5 or more Children | 0 (0.0%) | 0 (0.0%) |
| Total | 0 (0.0%) | 0 (0.0%) |
Income Below Poverty Among Married-Couple vs Single-Parent Households in White House Station
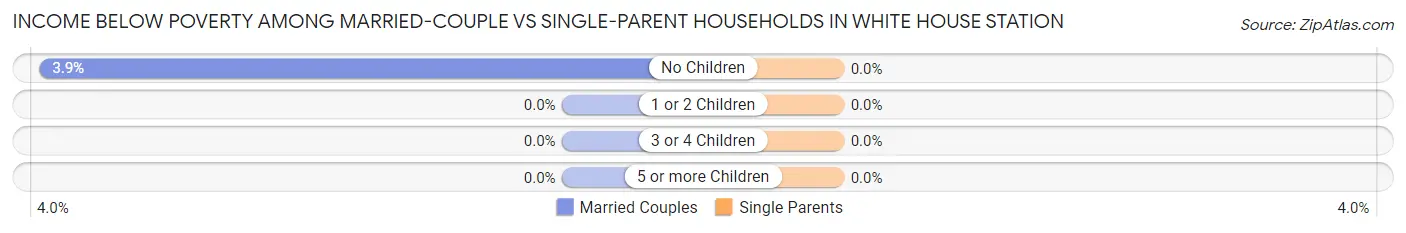
| Children | Married-Couple Families | Single-Parent Households |
| No Children | 26 (3.9%) | 0 (0.0%) |
| 1 or 2 Children | 0 (0.0%) | 0 (0.0%) |
| 3 or 4 Children | 0 (0.0%) | 0 (0.0%) |
| 5 or more Children | 0 (0.0%) | 0 (0.0%) |
| Total | 26 (2.8%) | 0 (0.0%) |
Employment Characteristics in White House Station
Employment by Class of Employer in White House Station
Among the 1,517 employed individuals in White House Station, private company employees (1,055 | 69.6%), local government employees (220 | 14.5%), and not-for-profit organizations (123 | 8.1%) make up the most common classes of employment.
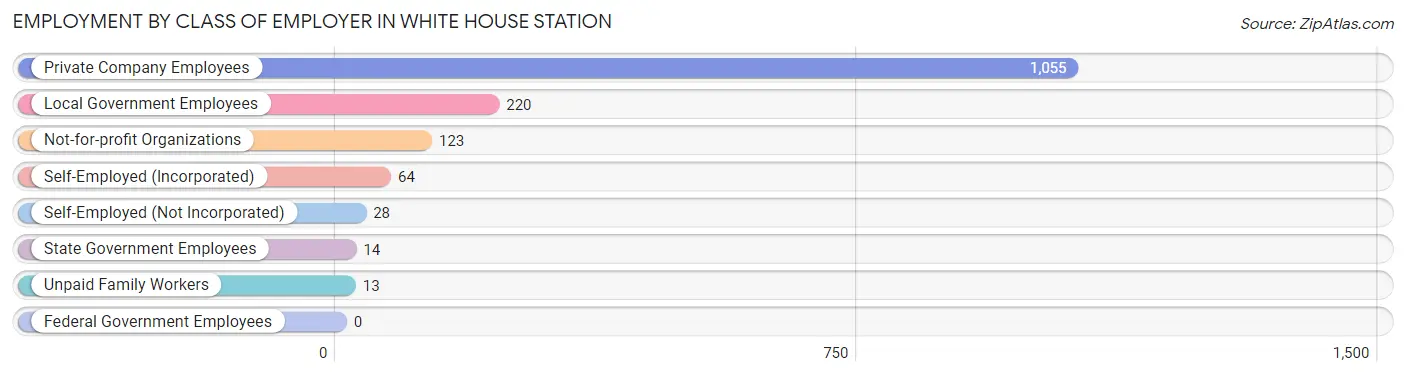
| Employer Class | # Employees | % Employees |
| Private Company Employees | 1,055 | 69.6% |
| Self-Employed (Incorporated) | 64 | 4.2% |
| Self-Employed (Not Incorporated) | 28 | 1.8% |
| Not-for-profit Organizations | 123 | 8.1% |
| Local Government Employees | 220 | 14.5% |
| State Government Employees | 14 | 0.9% |
| Federal Government Employees | 0 | 0.0% |
| Unpaid Family Workers | 13 | 0.9% |
| Total | 1,517 | 100.0% |
Employment Status by Age in White House Station
According to the labor force statistics for White House Station, out of the total population over 16 years of age (3,334), 55.8% or 1,860 individuals are in the labor force, with 10.4% or 193 of them unemployed. The age group with the highest labor force participation rate is 25 to 29 years, with 100.0% or 105 individuals in the labor force. Within the labor force, the 16 to 19 years age range has the highest percentage of unemployed individuals, with 60.2% or 103 of them being unemployed.
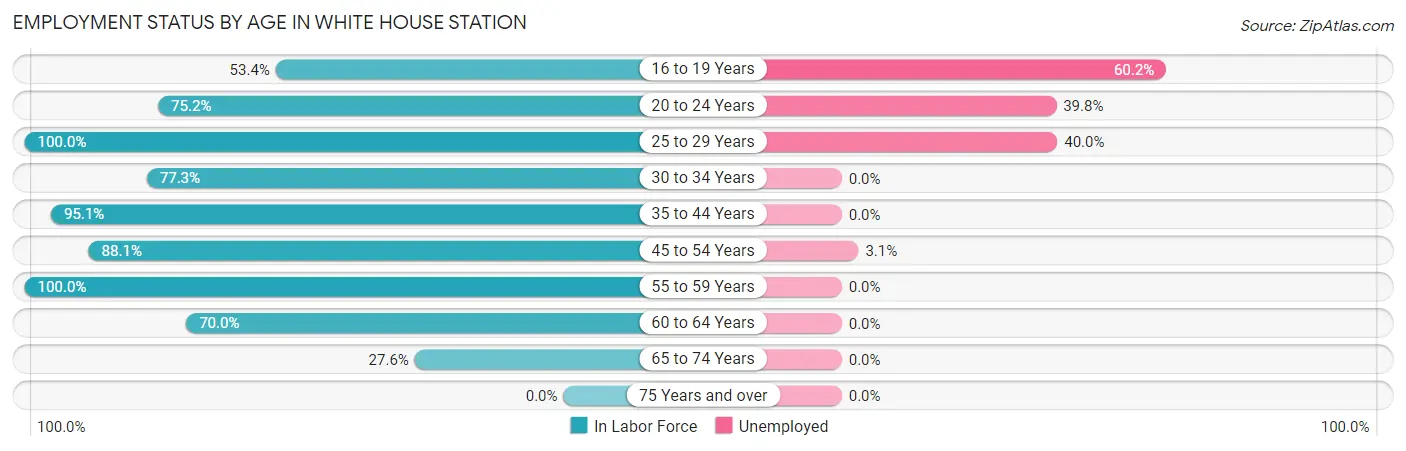
| Age Bracket | In Labor Force | Unemployed |
| 16 to 19 Years | 171 (53.4%) | 103 (60.2%) |
| 20 to 24 Years | 88 (75.2%) | 35 (39.8%) |
| 25 to 29 Years | 105 (100.0%) | 42 (40.0%) |
| 30 to 34 Years | 133 (77.3%) | 0 (0.0%) |
| 35 to 44 Years | 290 (95.1%) | 0 (0.0%) |
| 45 to 54 Years | 450 (88.1%) | 14 (3.1%) |
| 55 to 59 Years | 239 (100.0%) | 0 (0.0%) |
| 60 to 64 Years | 231 (70.0%) | 0 (0.0%) |
| 65 to 74 Years | 152 (27.6%) | 0 (0.0%) |
| 75 Years and over | 0 (0.0%) | 0 (0.0%) |
| Total | 1,860 (55.8%) | 193 (10.4%) |
Employment Status by Educational Attainment in White House Station
According to labor force statistics for White House Station, 87.1% of individuals (1,448) out of the total population between 25 and 64 years of age (1,662) are in the labor force, with 3.9% or 56 of them being unemployed. The group with the highest labor force participation rate are those with the educational attainment of bachelor's degree or higher, with 88.8% or 1,043 individuals in the labor force. Within the labor force, individuals with high school diploma education have the highest percentage of unemployment, with 5.6% or 14 of them being unemployed.
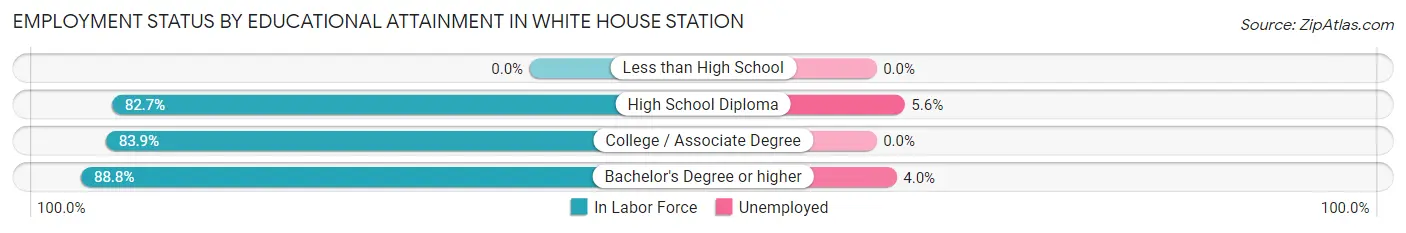
| Educational Attainment | In Labor Force | Unemployed |
| Less than High School | 0 (0.0%) | 0 (0.0%) |
| High School Diploma | 249 (82.7%) | 17 (5.6%) |
| College / Associate Degree | 156 (83.9%) | 0 (0.0%) |
| Bachelor's Degree or higher | 1,043 (88.8%) | 47 (4.0%) |
| Total | 1,448 (87.1%) | 65 (3.9%) |
Employment Occupations by Sex in White House Station
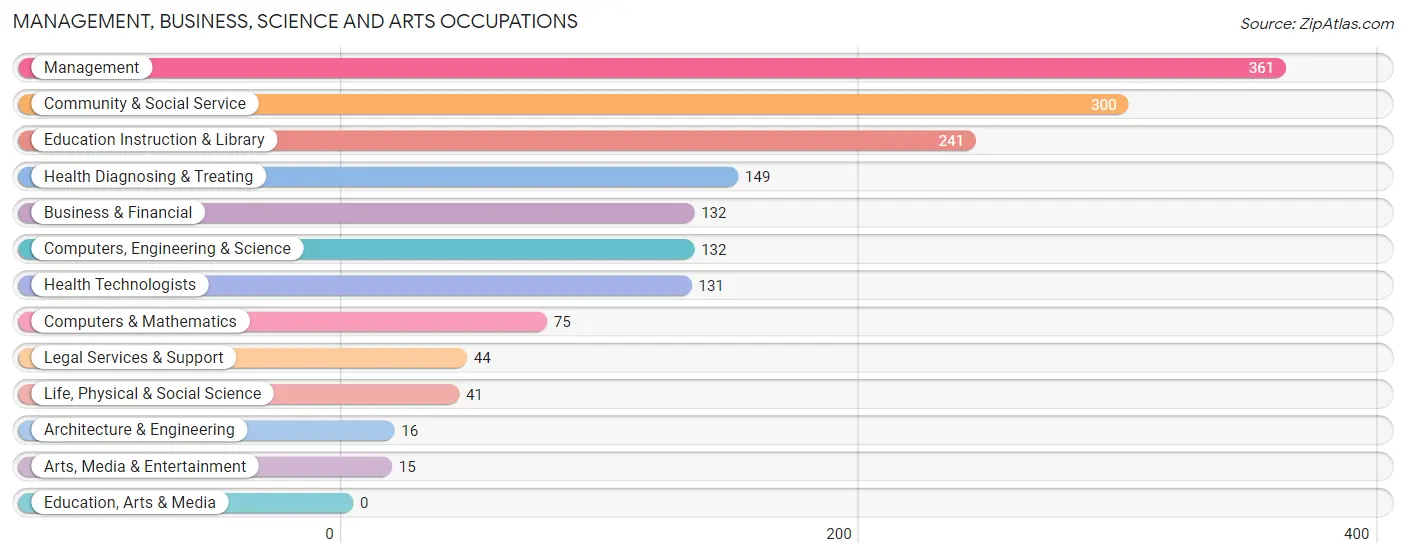
Management, Business, Science and Arts Occupations
The most common Management, Business, Science and Arts occupations in White House Station are Management (361 | 21.7%), Community & Social Service (300 | 18.0%), Education Instruction & Library (241 | 14.5%), Health Diagnosing & Treating (149 | 8.9%), and Business & Financial (132 | 7.9%).
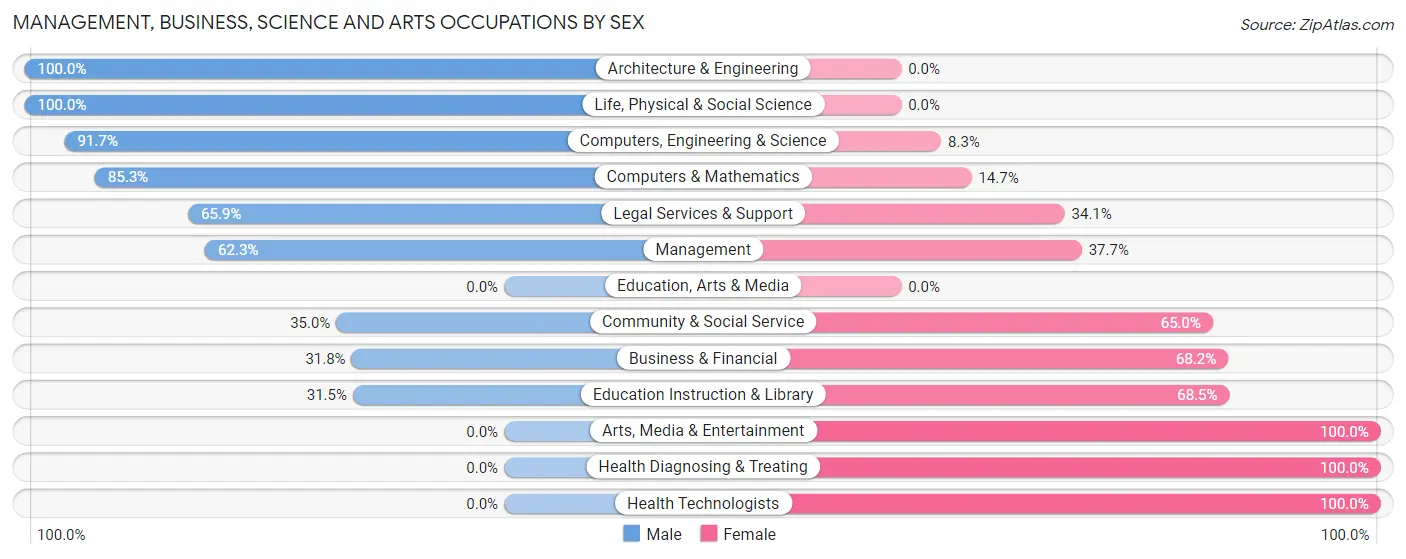
Management, Business, Science and Arts Occupations by Sex
Within the Management, Business, Science and Arts occupations in White House Station, the most male-oriented occupations are Architecture & Engineering (100.0%), Life, Physical & Social Science (100.0%), and Computers, Engineering & Science (91.7%), while the most female-oriented occupations are Arts, Media & Entertainment (100.0%), Health Diagnosing & Treating (100.0%), and Health Technologists (100.0%).
| Occupation | Male | Female |
| Management | 225 (62.3%) | 136 (37.7%) |
| Business & Financial | 42 (31.8%) | 90 (68.2%) |
| Computers, Engineering & Science | 121 (91.7%) | 11 (8.3%) |
| Computers & Mathematics | 64 (85.3%) | 11 (14.7%) |
| Architecture & Engineering | 16 (100.0%) | 0 (0.0%) |
| Life, Physical & Social Science | 41 (100.0%) | 0 (0.0%) |
| Community & Social Service | 105 (35.0%) | 195 (65.0%) |
| Education, Arts & Media | 0 (0.0%) | 0 (0.0%) |
| Legal Services & Support | 29 (65.9%) | 15 (34.1%) |
| Education Instruction & Library | 76 (31.5%) | 165 (68.5%) |
| Arts, Media & Entertainment | 0 (0.0%) | 15 (100.0%) |
| Health Diagnosing & Treating | 0 (0.0%) | 149 (100.0%) |
| Health Technologists | 0 (0.0%) | 131 (100.0%) |
| Total (Category) | 493 (45.9%) | 581 (54.1%) |
| Total (Overall) | 826 (49.6%) | 839 (50.4%) |
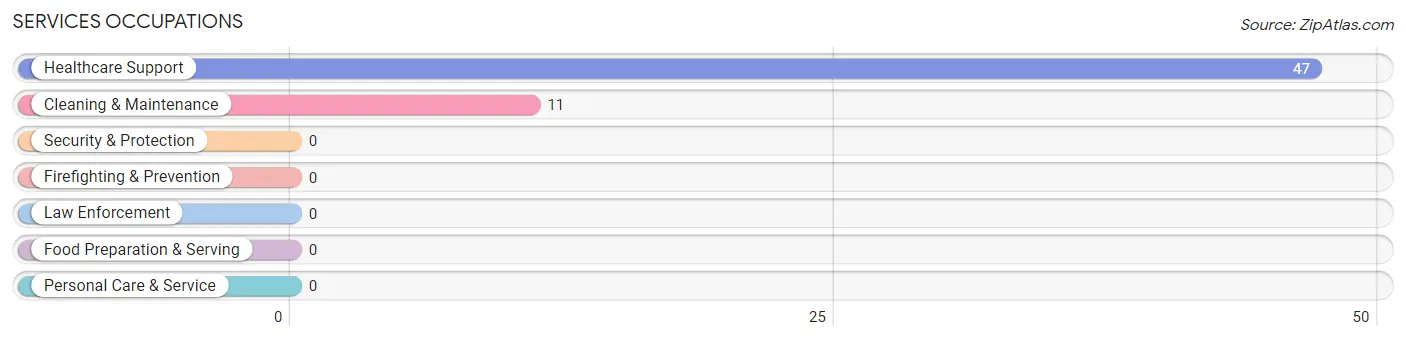
Services Occupations
The most common Services occupations in White House Station are Healthcare Support (47 | 2.8%), and Cleaning & Maintenance (11 | 0.7%).
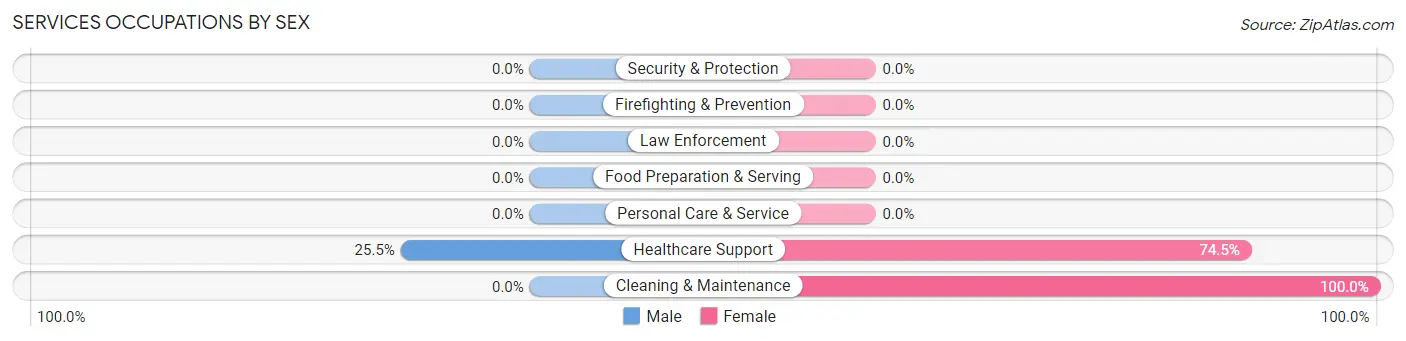
Services Occupations by Sex
| Occupation | Male | Female |
| Healthcare Support | 12 (25.5%) | 35 (74.5%) |
| Security & Protection | 0 (0.0%) | 0 (0.0%) |
| Firefighting & Prevention | 0 (0.0%) | 0 (0.0%) |
| Law Enforcement | 0 (0.0%) | 0 (0.0%) |
| Food Preparation & Serving | 0 (0.0%) | 0 (0.0%) |
| Cleaning & Maintenance | 0 (0.0%) | 11 (100.0%) |
| Personal Care & Service | 0 (0.0%) | 0 (0.0%) |
| Total (Category) | 12 (20.7%) | 46 (79.3%) |
| Total (Overall) | 826 (49.6%) | 839 (50.4%) |
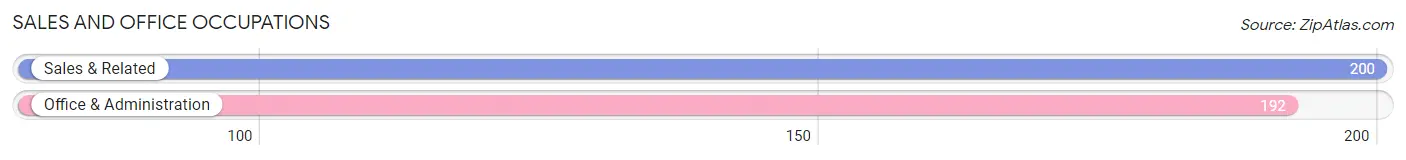
Sales and Office Occupations
The most common Sales and Office occupations in White House Station are Sales & Related (200 | 12.0%), and Office & Administration (192 | 11.5%).
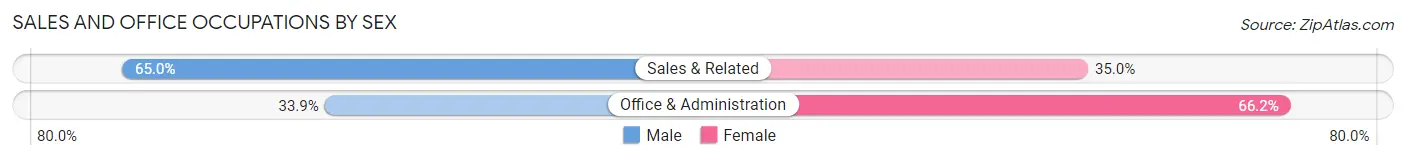
Sales and Office Occupations by Sex
| Occupation | Male | Female |
| Sales & Related | 130 (65.0%) | 70 (35.0%) |
| Office & Administration | 65 (33.9%) | 127 (66.1%) |
| Total (Category) | 195 (49.7%) | 197 (50.3%) |
| Total (Overall) | 826 (49.6%) | 839 (50.4%) |
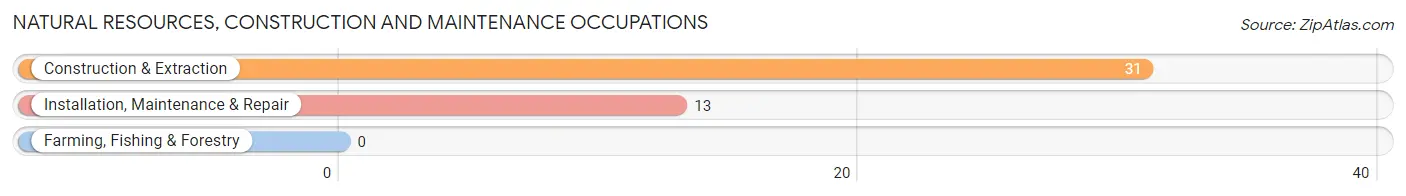
Natural Resources, Construction and Maintenance Occupations
The most common Natural Resources, Construction and Maintenance occupations in White House Station are Construction & Extraction (31 | 1.9%), and Installation, Maintenance & Repair (13 | 0.8%).
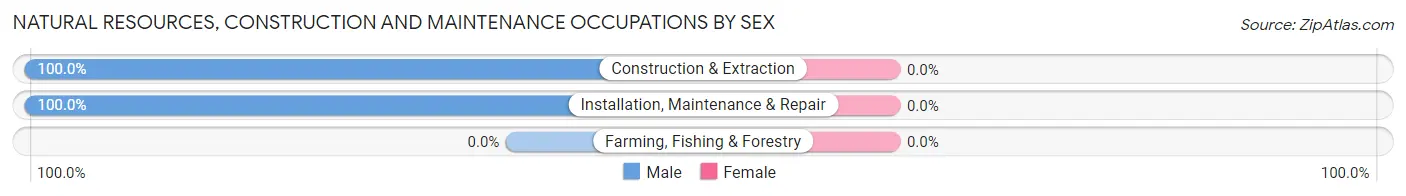
Natural Resources, Construction and Maintenance Occupations by Sex
| Occupation | Male | Female |
| Farming, Fishing & Forestry | 0 (0.0%) | 0 (0.0%) |
| Construction & Extraction | 31 (100.0%) | 0 (0.0%) |
| Installation, Maintenance & Repair | 13 (100.0%) | 0 (0.0%) |
| Total (Category) | 44 (100.0%) | 0 (0.0%) |
| Total (Overall) | 826 (49.6%) | 839 (50.4%) |
Production, Transportation and Moving Occupations
The most common Production, Transportation and Moving occupations in White House Station are Material Moving (70 | 4.2%), and Transportation (27 | 1.6%).
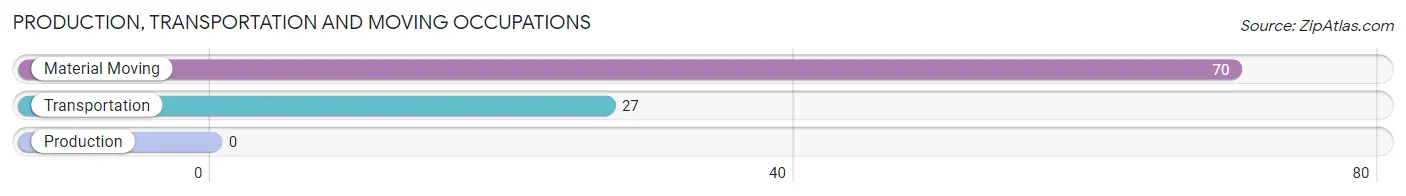
Production, Transportation and Moving Occupations by Sex
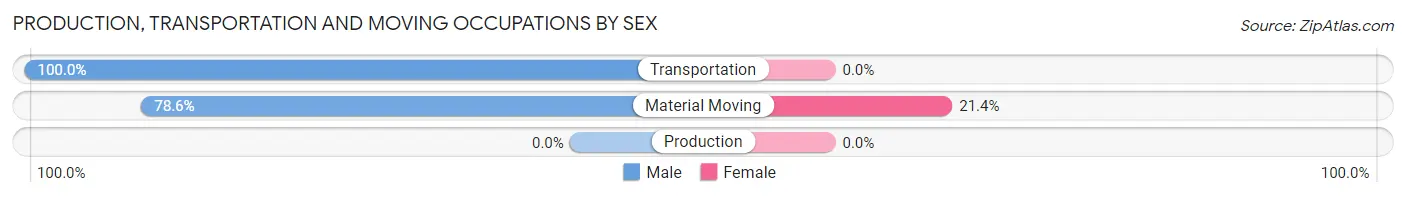
| Occupation | Male | Female |
| Production | 0 (0.0%) | 0 (0.0%) |
| Transportation | 27 (100.0%) | 0 (0.0%) |
| Material Moving | 55 (78.6%) | 15 (21.4%) |
| Total (Category) | 82 (84.5%) | 15 (15.5%) |
| Total (Overall) | 826 (49.6%) | 839 (50.4%) |
Employment Industries by Sex in White House Station
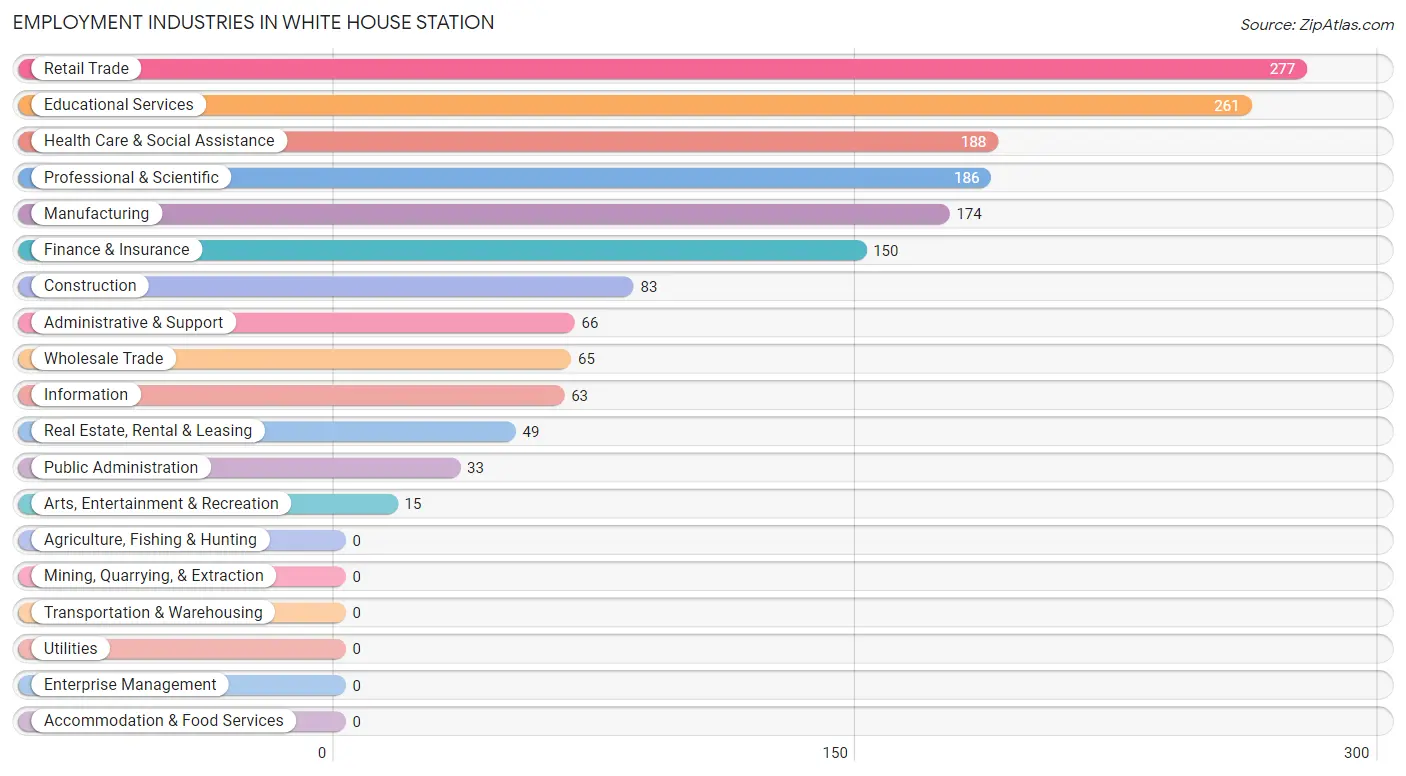
Employment Industries in White House Station
The major employment industries in White House Station include Retail Trade (277 | 16.6%), Educational Services (261 | 15.7%), Health Care & Social Assistance (188 | 11.3%), Professional & Scientific (186 | 11.2%), and Manufacturing (174 | 10.4%).
Employment Industries by Sex in White House Station
The White House Station industries that see more men than women are Administrative & Support (100.0%), Construction (86.8%), and Information (76.2%), whereas the industries that tend to have a higher number of women are Arts, Entertainment & Recreation (100.0%), Health Care & Social Assistance (93.6%), and Public Administration (72.7%).
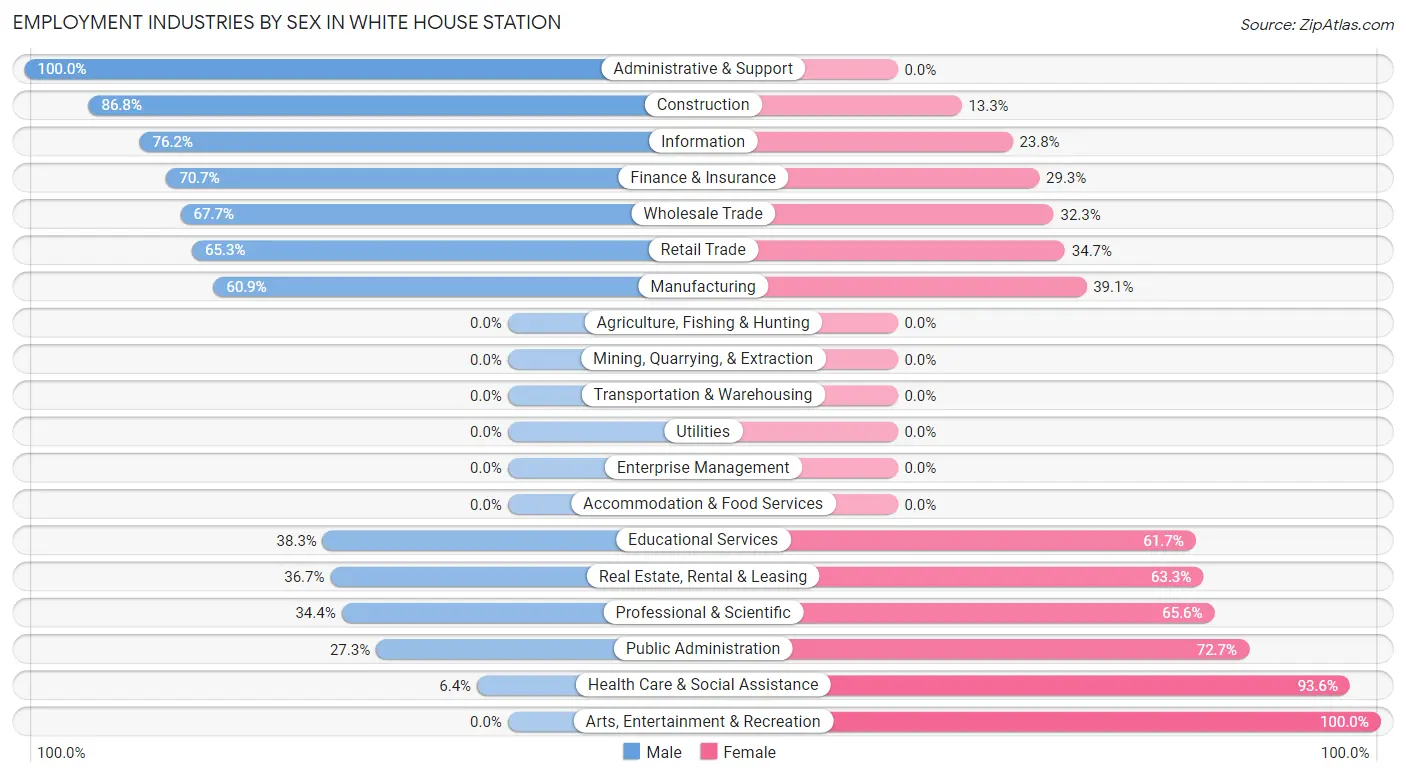
| Industry | Male | Female |
| Agriculture, Fishing & Hunting | 0 (0.0%) | 0 (0.0%) |
| Mining, Quarrying, & Extraction | 0 (0.0%) | 0 (0.0%) |
| Construction | 72 (86.8%) | 11 (13.3%) |
| Manufacturing | 106 (60.9%) | 68 (39.1%) |
| Wholesale Trade | 44 (67.7%) | 21 (32.3%) |
| Retail Trade | 181 (65.3%) | 96 (34.7%) |
| Transportation & Warehousing | 0 (0.0%) | 0 (0.0%) |
| Utilities | 0 (0.0%) | 0 (0.0%) |
| Information | 48 (76.2%) | 15 (23.8%) |
| Finance & Insurance | 106 (70.7%) | 44 (29.3%) |
| Real Estate, Rental & Leasing | 18 (36.7%) | 31 (63.3%) |
| Professional & Scientific | 64 (34.4%) | 122 (65.6%) |
| Enterprise Management | 0 (0.0%) | 0 (0.0%) |
| Administrative & Support | 66 (100.0%) | 0 (0.0%) |
| Educational Services | 100 (38.3%) | 161 (61.7%) |
| Health Care & Social Assistance | 12 (6.4%) | 176 (93.6%) |
| Arts, Entertainment & Recreation | 0 (0.0%) | 15 (100.0%) |
| Accommodation & Food Services | 0 (0.0%) | 0 (0.0%) |
| Public Administration | 9 (27.3%) | 24 (72.7%) |
| Total | 826 (49.6%) | 839 (50.4%) |
Education in White House Station
School Enrollment in White House Station
The most common levels of schooling among the 755 students in White House Station are high school (398 | 52.7%), nursery / preschool (93 | 12.3%), and college / undergraduate (81 | 10.7%).
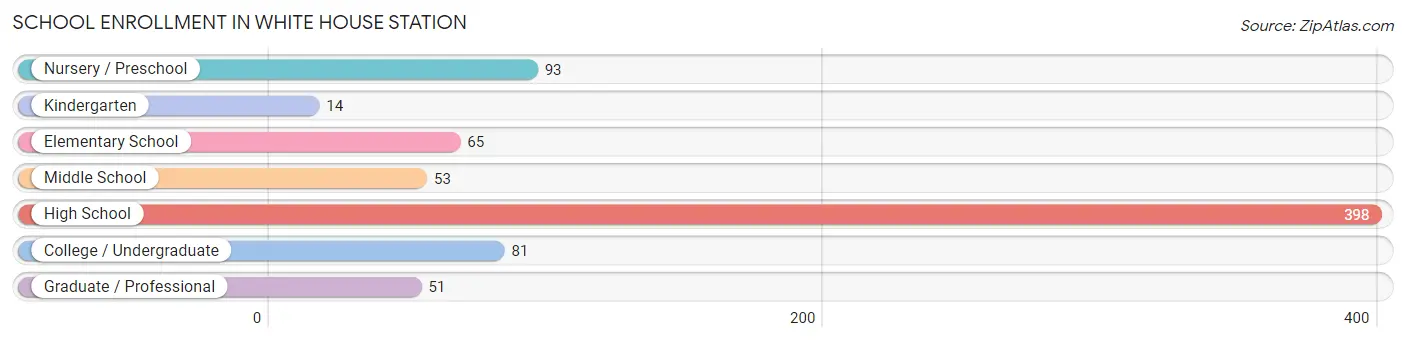
| School Level | # Students | % Students |
| Nursery / Preschool | 93 | 12.3% |
| Kindergarten | 14 | 1.8% |
| Elementary School | 65 | 8.6% |
| Middle School | 53 | 7.0% |
| High School | 398 | 52.7% |
| College / Undergraduate | 81 | 10.7% |
| Graduate / Professional | 51 | 6.8% |
| Total | 755 | 100.0% |
School Enrollment by Age by Funding Source in White House Station
Out of a total of 755 students who are enrolled in schools in White House Station, 163 (21.6%) attend a private institution, while the remaining 592 (78.4%) are enrolled in public schools. The age group of 3 to 4 year olds has the highest likelihood of being enrolled in private schools, with 93 (100.0% in the age bracket) enrolled. Conversely, the age group of 5 to 9 year old has the lowest likelihood of being enrolled in a private school, with 79 (100.0% in the age bracket) attending a public institution.
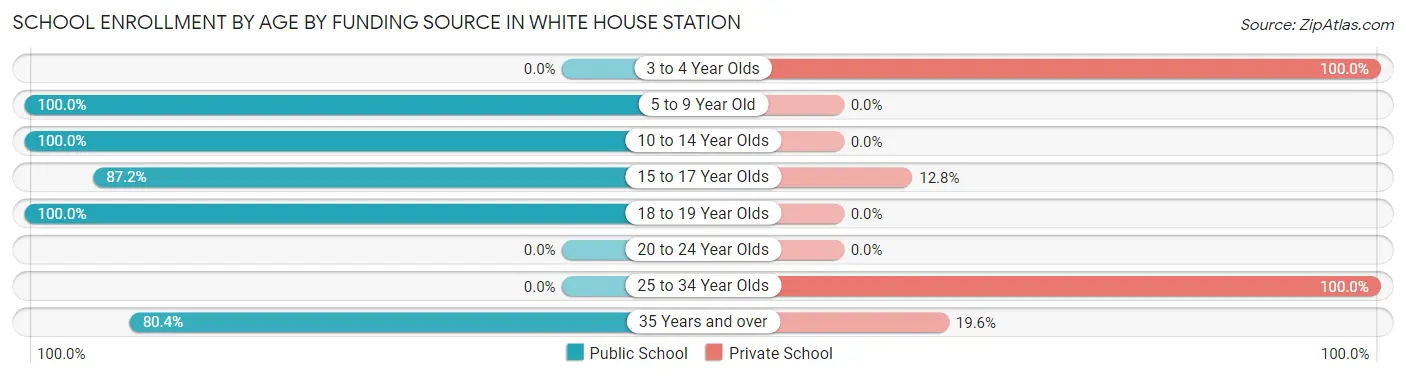
| Age Bracket | Public School | Private School |
| 3 to 4 Year Olds | 0 (0.0%) | 93 (100.0%) |
| 5 to 9 Year Old | 79 (100.0%) | 0 (0.0%) |
| 10 to 14 Year Olds | 89 (100.0%) | 0 (0.0%) |
| 15 to 17 Year Olds | 225 (87.2%) | 33 (12.8%) |
| 18 to 19 Year Olds | 121 (100.0%) | 0 (0.0%) |
| 20 to 24 Year Olds | 0 (0.0%) | 0 (0.0%) |
| 25 to 34 Year Olds | 0 (0.0%) | 18 (100.0%) |
| 35 Years and over | 78 (80.4%) | 19 (19.6%) |
| Total | 592 (78.4%) | 163 (21.6%) |
Educational Attainment by Field of Study in White House Station
Education (317 | 20.3%), business (275 | 17.6%), science & technology (231 | 14.8%), engineering (188 | 12.0%), and social sciences (128 | 8.2%) are the most common fields of study among 1,565 individuals in White House Station who have obtained a bachelor's degree or higher.
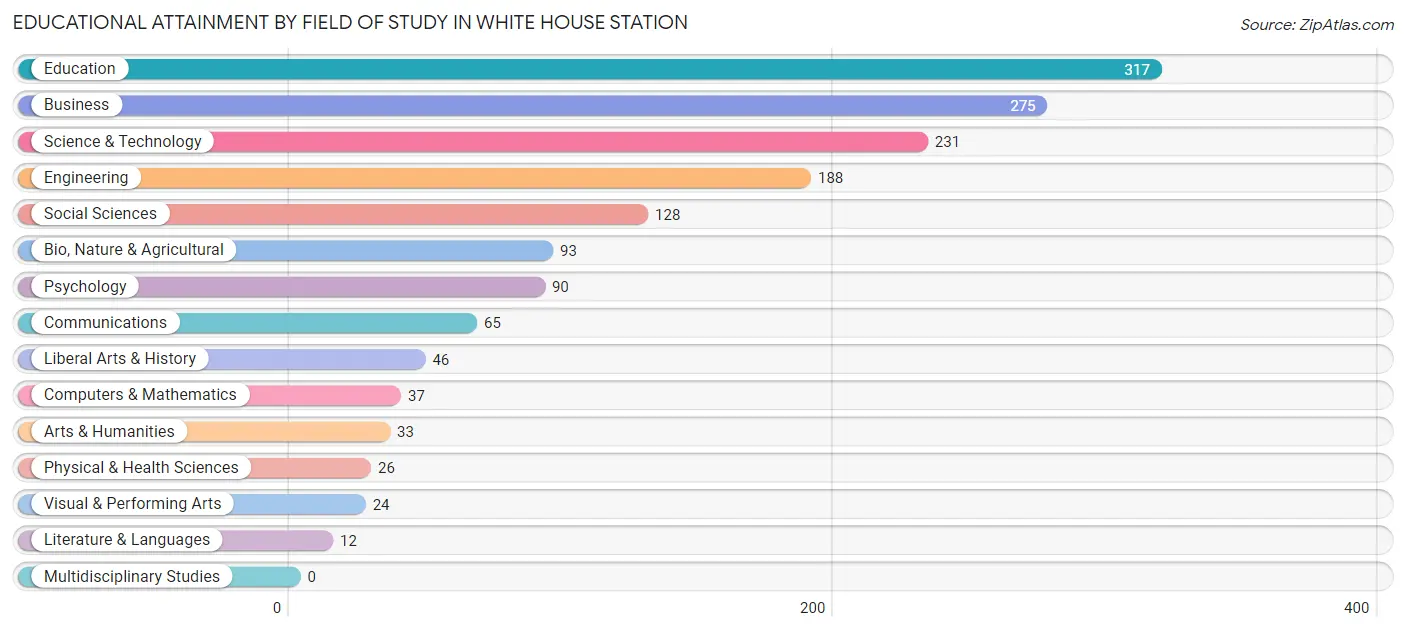
| Field of Study | # Graduates | % Graduates |
| Computers & Mathematics | 37 | 2.4% |
| Bio, Nature & Agricultural | 93 | 5.9% |
| Physical & Health Sciences | 26 | 1.7% |
| Psychology | 90 | 5.8% |
| Social Sciences | 128 | 8.2% |
| Engineering | 188 | 12.0% |
| Multidisciplinary Studies | 0 | 0.0% |
| Science & Technology | 231 | 14.8% |
| Business | 275 | 17.6% |
| Education | 317 | 20.3% |
| Literature & Languages | 12 | 0.8% |
| Liberal Arts & History | 46 | 2.9% |
| Visual & Performing Arts | 24 | 1.5% |
| Communications | 65 | 4.2% |
| Arts & Humanities | 33 | 2.1% |
| Total | 1,565 | 100.0% |
Transportation & Commute in White House Station
Vehicle Availability by Sex in White House Station
The most prevalent vehicle ownership categories in White House Station are males with 2 vehicles (401, accounting for 50.4%) and females with 2 vehicles (239, making up 55.6%).
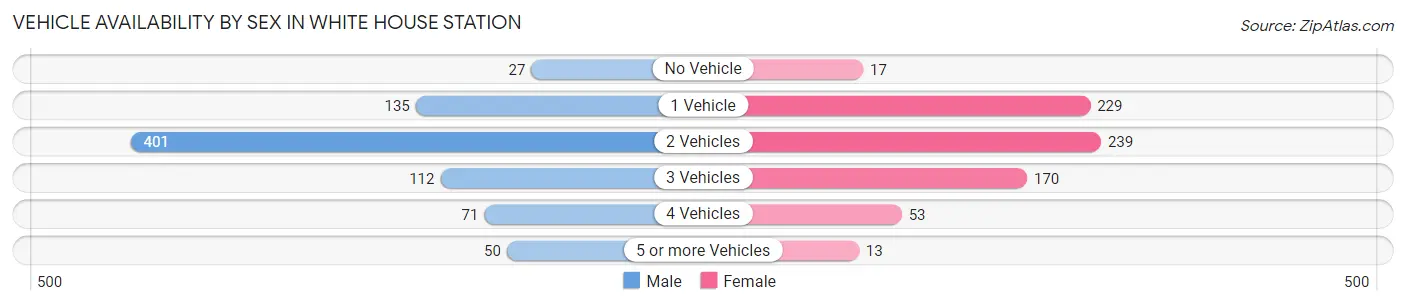
| Vehicles Available | Male | Female |
| No Vehicle | 27 (3.4%) | 17 (2.4%) |
| 1 Vehicle | 135 (17.0%) | 229 (31.8%) |
| 2 Vehicles | 401 (50.4%) | 239 (33.2%) |
| 3 Vehicles | 112 (14.1%) | 170 (23.6%) |
| 4 Vehicles | 71 (8.9%) | 53 (7.3%) |
| 5 or more Vehicles | 50 (6.3%) | 13 (1.8%) |
| Total | 796 (100.0%) | 721 (100.0%) |
Commute Time in White House Station
The most frequently occuring commute durations in White House Station are 20 to 24 minutes (210 commuters, 15.6%), 30 to 34 minutes (158 commuters, 11.7%), and 5 to 9 minutes (153 commuters, 11.4%).
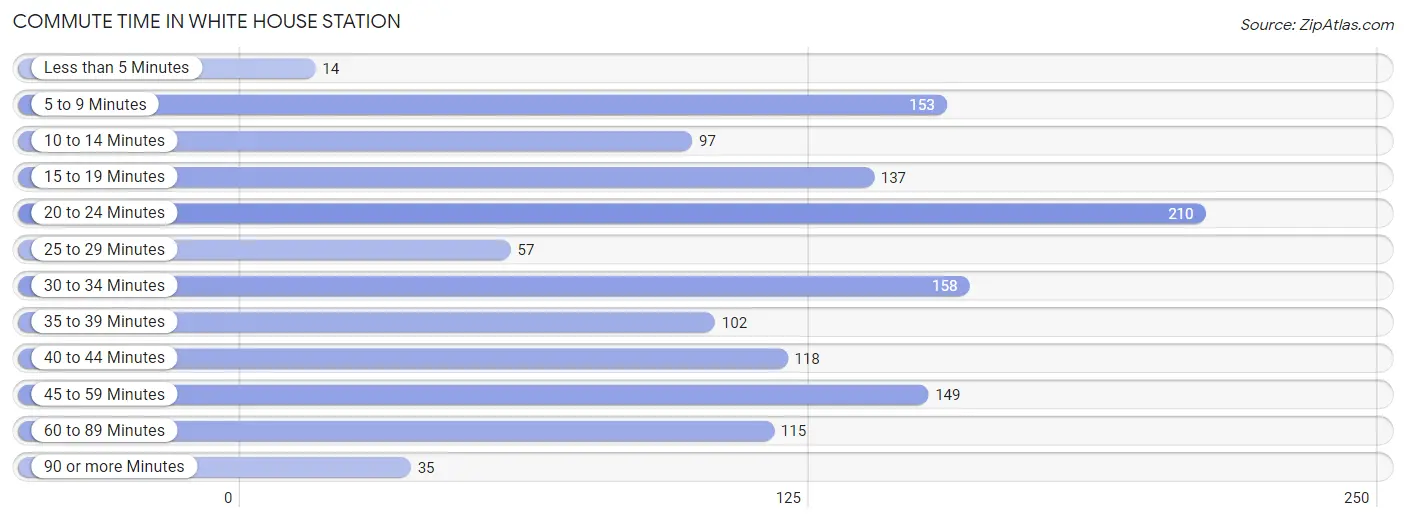
| Commute Time | # Commuters | % Commuters |
| Less than 5 Minutes | 14 | 1.0% |
| 5 to 9 Minutes | 153 | 11.4% |
| 10 to 14 Minutes | 97 | 7.2% |
| 15 to 19 Minutes | 137 | 10.2% |
| 20 to 24 Minutes | 210 | 15.6% |
| 25 to 29 Minutes | 57 | 4.2% |
| 30 to 34 Minutes | 158 | 11.7% |
| 35 to 39 Minutes | 102 | 7.6% |
| 40 to 44 Minutes | 118 | 8.8% |
| 45 to 59 Minutes | 149 | 11.1% |
| 60 to 89 Minutes | 115 | 8.6% |
| 90 or more Minutes | 35 | 2.6% |
Commute Time by Sex in White House Station
The most common commute times in White House Station are 20 to 24 minutes (114 commuters, 16.7%) for males and 15 to 19 minutes (111 commuters, 16.7%) for females.
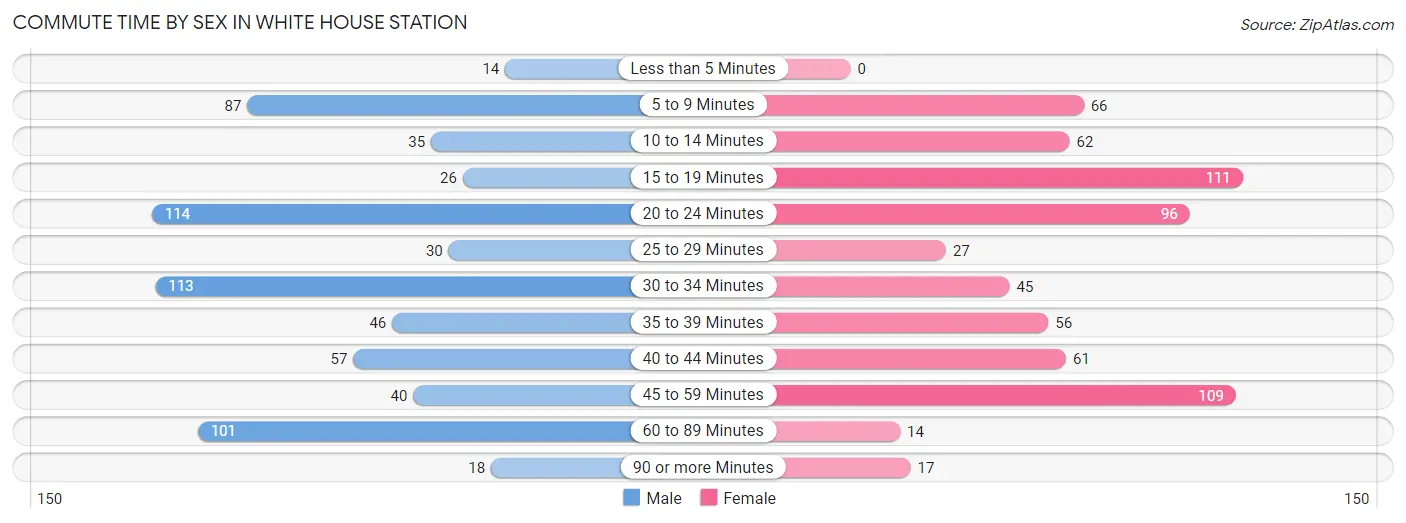
| Commute Time | Male | Female |
| Less than 5 Minutes | 14 (2.1%) | 0 (0.0%) |
| 5 to 9 Minutes | 87 (12.8%) | 66 (9.9%) |
| 10 to 14 Minutes | 35 (5.1%) | 62 (9.3%) |
| 15 to 19 Minutes | 26 (3.8%) | 111 (16.7%) |
| 20 to 24 Minutes | 114 (16.7%) | 96 (14.5%) |
| 25 to 29 Minutes | 30 (4.4%) | 27 (4.1%) |
| 30 to 34 Minutes | 113 (16.6%) | 45 (6.8%) |
| 35 to 39 Minutes | 46 (6.8%) | 56 (8.4%) |
| 40 to 44 Minutes | 57 (8.4%) | 61 (9.2%) |
| 45 to 59 Minutes | 40 (5.9%) | 109 (16.4%) |
| 60 to 89 Minutes | 101 (14.8%) | 14 (2.1%) |
| 90 or more Minutes | 18 (2.6%) | 17 (2.6%) |
Time of Departure to Work by Sex in White House Station
The most frequent times of departure to work in White House Station are 8:00 AM to 8:29 AM (193, 28.3%) for males and 7:30 AM to 7:59 AM (184, 27.7%) for females.
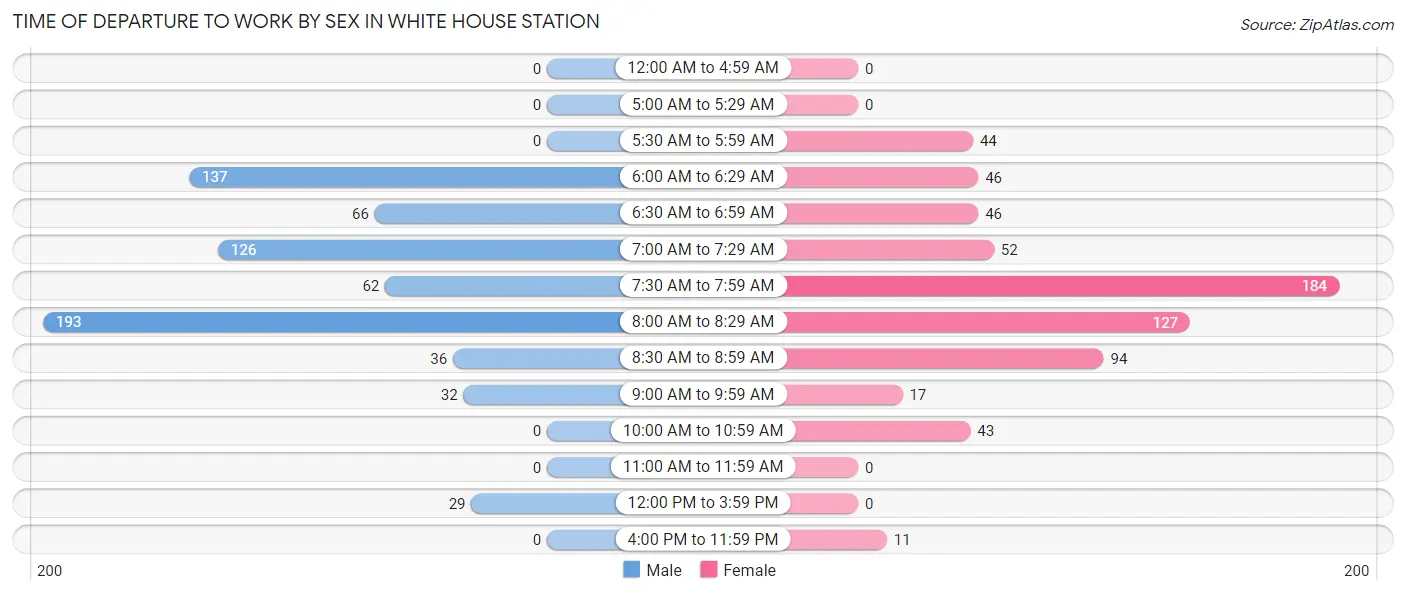
| Time of Departure | Male | Female |
| 12:00 AM to 4:59 AM | 0 (0.0%) | 0 (0.0%) |
| 5:00 AM to 5:29 AM | 0 (0.0%) | 0 (0.0%) |
| 5:30 AM to 5:59 AM | 0 (0.0%) | 44 (6.6%) |
| 6:00 AM to 6:29 AM | 137 (20.1%) | 46 (6.9%) |
| 6:30 AM to 6:59 AM | 66 (9.7%) | 46 (6.9%) |
| 7:00 AM to 7:29 AM | 126 (18.5%) | 52 (7.8%) |
| 7:30 AM to 7:59 AM | 62 (9.1%) | 184 (27.7%) |
| 8:00 AM to 8:29 AM | 193 (28.3%) | 127 (19.1%) |
| 8:30 AM to 8:59 AM | 36 (5.3%) | 94 (14.2%) |
| 9:00 AM to 9:59 AM | 32 (4.7%) | 17 (2.6%) |
| 10:00 AM to 10:59 AM | 0 (0.0%) | 43 (6.5%) |
| 11:00 AM to 11:59 AM | 0 (0.0%) | 0 (0.0%) |
| 12:00 PM to 3:59 PM | 29 (4.3%) | 0 (0.0%) |
| 4:00 PM to 11:59 PM | 0 (0.0%) | 11 (1.7%) |
| Total | 681 (100.0%) | 664 (100.0%) |
Housing Occupancy in White House Station
Occupancy by Ownership in White House Station
Of the total 1,661 dwellings in White House Station, owner-occupied units account for 1,460 (87.9%), while renter-occupied units make up 201 (12.1%).
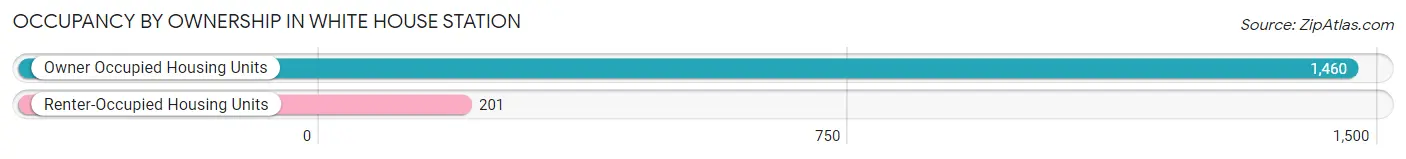
| Occupancy | # Housing Units | % Housing Units |
| Owner Occupied Housing Units | 1,460 | 87.9% |
| Renter-Occupied Housing Units | 201 | 12.1% |
| Total Occupied Housing Units | 1,661 | 100.0% |
Occupancy by Household Size in White House Station
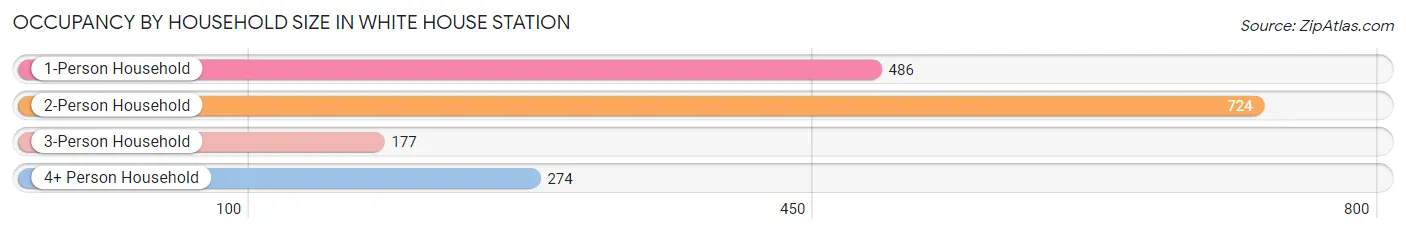
| Household Size | # Housing Units | % Housing Units |
| 1-Person Household | 486 | 29.3% |
| 2-Person Household | 724 | 43.6% |
| 3-Person Household | 177 | 10.7% |
| 4+ Person Household | 274 | 16.5% |
| Total Housing Units | 1,661 | 100.0% |
Occupancy by Ownership by Household Size in White House Station
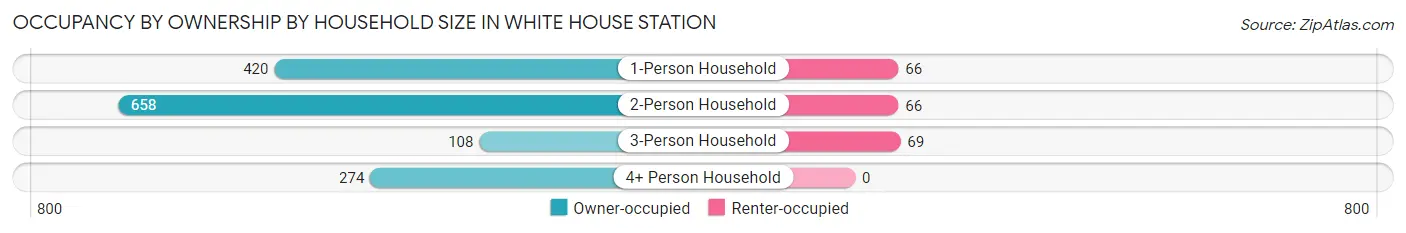
| Household Size | Owner-occupied | Renter-occupied |
| 1-Person Household | 420 (86.4%) | 66 (13.6%) |
| 2-Person Household | 658 (90.9%) | 66 (9.1%) |
| 3-Person Household | 108 (61.0%) | 69 (39.0%) |
| 4+ Person Household | 274 (100.0%) | 0 (0.0%) |
| Total Housing Units | 1,460 (87.9%) | 201 (12.1%) |
Occupancy by Educational Attainment in White House Station
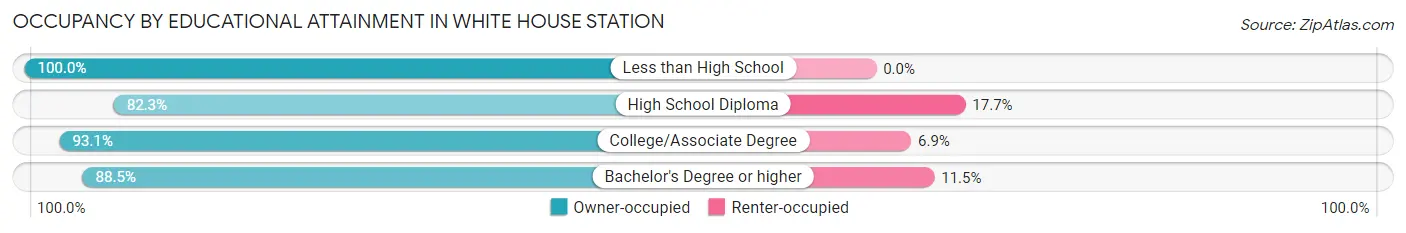
| Household Size | Owner-occupied | Renter-occupied |
| Less than High School | 28 (100.0%) | 0 (0.0%) |
| High School Diploma | 349 (82.3%) | 75 (17.7%) |
| College/Associate Degree | 269 (93.1%) | 20 (6.9%) |
| Bachelor's Degree or higher | 814 (88.5%) | 106 (11.5%) |
Occupancy by Age of Householder in White House Station
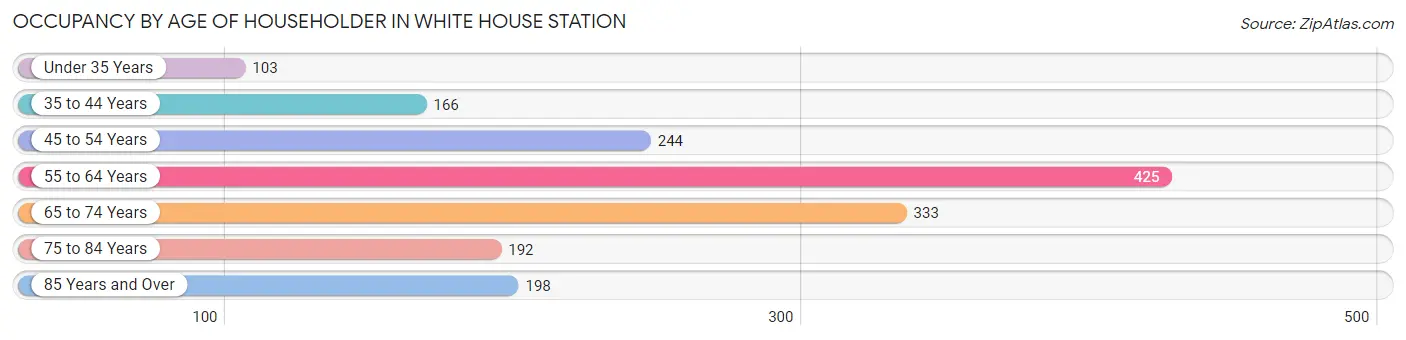
| Age Bracket | # Households | % Households |
| Under 35 Years | 103 | 6.2% |
| 35 to 44 Years | 166 | 10.0% |
| 45 to 54 Years | 244 | 14.7% |
| 55 to 64 Years | 425 | 25.6% |
| 65 to 74 Years | 333 | 20.1% |
| 75 to 84 Years | 192 | 11.6% |
| 85 Years and Over | 198 | 11.9% |
| Total | 1,661 | 100.0% |
Housing Finances in White House Station
Median Income by Occupancy in White House Station
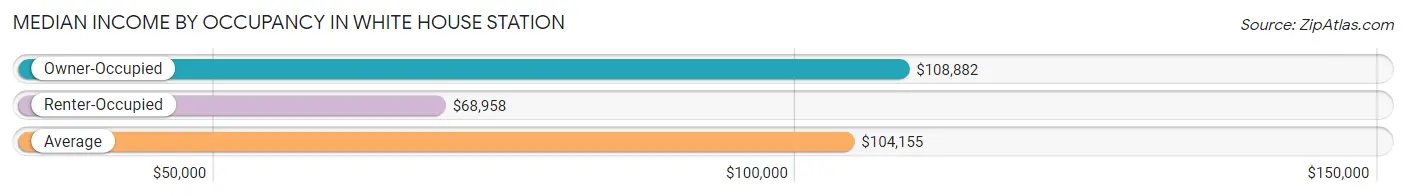
| Occupancy Type | # Households | Median Income |
| Owner-Occupied | 1,460 (87.9%) | $108,882 |
| Renter-Occupied | 201 (12.1%) | $68,958 |
| Average | 1,661 (100.0%) | $104,155 |
Occupancy by Householder Income Bracket in White House Station
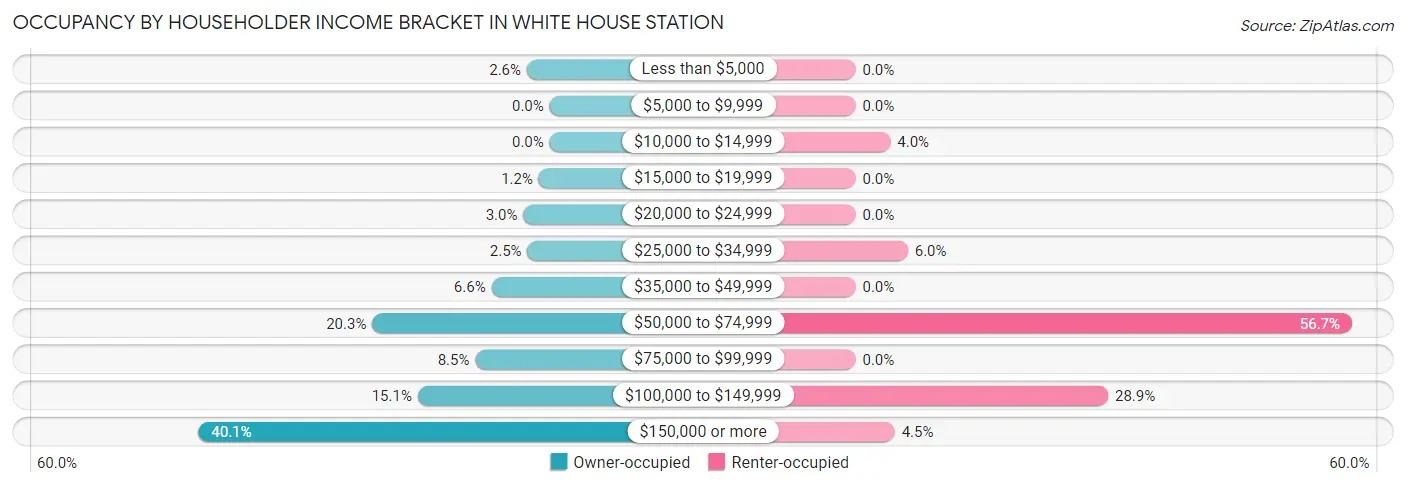
| Income Bracket | Owner-occupied | Renter-occupied |
| Less than $5,000 | 38 (2.6%) | 0 (0.0%) |
| $5,000 to $9,999 | 0 (0.0%) | 0 (0.0%) |
| $10,000 to $14,999 | 0 (0.0%) | 8 (4.0%) |
| $15,000 to $19,999 | 18 (1.2%) | 0 (0.0%) |
| $20,000 to $24,999 | 44 (3.0%) | 0 (0.0%) |
| $25,000 to $34,999 | 37 (2.5%) | 12 (6.0%) |
| $35,000 to $49,999 | 97 (6.6%) | 0 (0.0%) |
| $50,000 to $74,999 | 296 (20.3%) | 114 (56.7%) |
| $75,000 to $99,999 | 124 (8.5%) | 0 (0.0%) |
| $100,000 to $149,999 | 220 (15.1%) | 58 (28.9%) |
| $150,000 or more | 586 (40.1%) | 9 (4.5%) |
| Total | 1,460 (100.0%) | 201 (100.0%) |
Monthly Housing Cost Tiers in White House Station
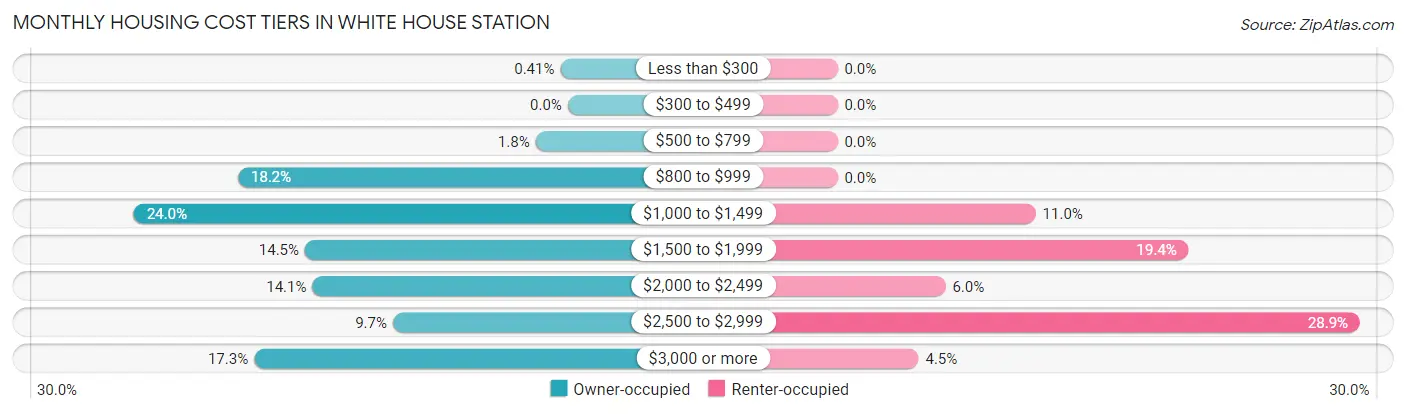
| Monthly Cost | Owner-occupied | Renter-occupied |
| Less than $300 | 6 (0.4%) | 0 (0.0%) |
| $300 to $499 | 0 (0.0%) | 0 (0.0%) |
| $500 to $799 | 26 (1.8%) | 0 (0.0%) |
| $800 to $999 | 266 (18.2%) | 0 (0.0%) |
| $1,000 to $1,499 | 350 (24.0%) | 22 (11.0%) |
| $1,500 to $1,999 | 212 (14.5%) | 39 (19.4%) |
| $2,000 to $2,499 | 206 (14.1%) | 12 (6.0%) |
| $2,500 to $2,999 | 141 (9.7%) | 58 (28.9%) |
| $3,000 or more | 253 (17.3%) | 9 (4.5%) |
| Total | 1,460 (100.0%) | 201 (100.0%) |
Physical Housing Characteristics in White House Station
Housing Structures in White House Station
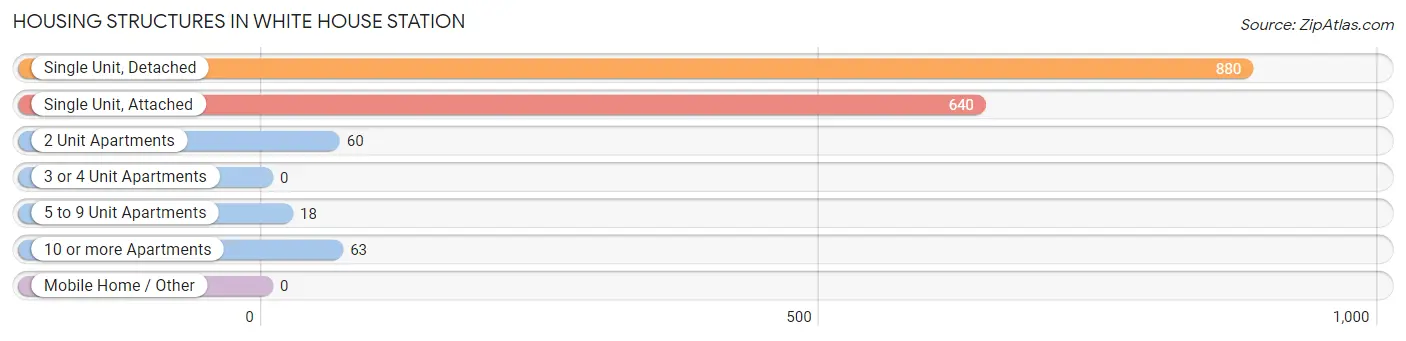
| Structure Type | # Housing Units | % Housing Units |
| Single Unit, Detached | 880 | 53.0% |
| Single Unit, Attached | 640 | 38.5% |
| 2 Unit Apartments | 60 | 3.6% |
| 3 or 4 Unit Apartments | 0 | 0.0% |
| 5 to 9 Unit Apartments | 18 | 1.1% |
| 10 or more Apartments | 63 | 3.8% |
| Mobile Home / Other | 0 | 0.0% |
| Total | 1,661 | 100.0% |
Housing Structures by Occupancy in White House Station
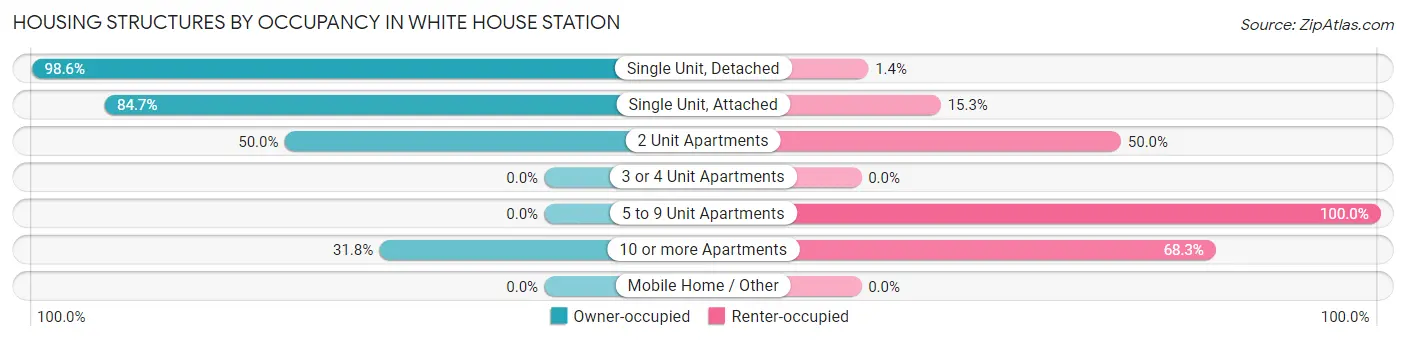
| Structure Type | Owner-occupied | Renter-occupied |
| Single Unit, Detached | 868 (98.6%) | 12 (1.4%) |
| Single Unit, Attached | 542 (84.7%) | 98 (15.3%) |
| 2 Unit Apartments | 30 (50.0%) | 30 (50.0%) |
| 3 or 4 Unit Apartments | 0 (0.0%) | 0 (0.0%) |
| 5 to 9 Unit Apartments | 0 (0.0%) | 18 (100.0%) |
| 10 or more Apartments | 20 (31.8%) | 43 (68.2%) |
| Mobile Home / Other | 0 (0.0%) | 0 (0.0%) |
| Total | 1,460 (87.9%) | 201 (12.1%) |
Housing Structures by Number of Rooms in White House Station
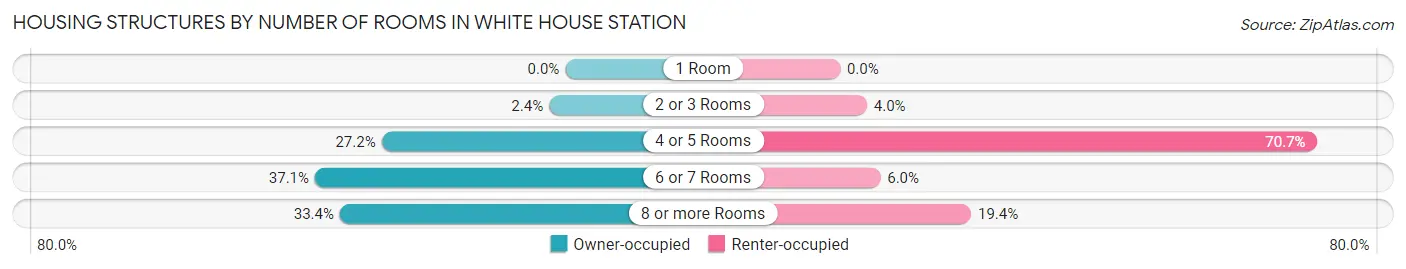
| Number of Rooms | Owner-occupied | Renter-occupied |
| 1 Room | 0 (0.0%) | 0 (0.0%) |
| 2 or 3 Rooms | 35 (2.4%) | 8 (4.0%) |
| 4 or 5 Rooms | 397 (27.2%) | 142 (70.7%) |
| 6 or 7 Rooms | 541 (37.0%) | 12 (6.0%) |
| 8 or more Rooms | 487 (33.4%) | 39 (19.4%) |
| Total | 1,460 (100.0%) | 201 (100.0%) |
Housing Structure by Heating Type in White House Station
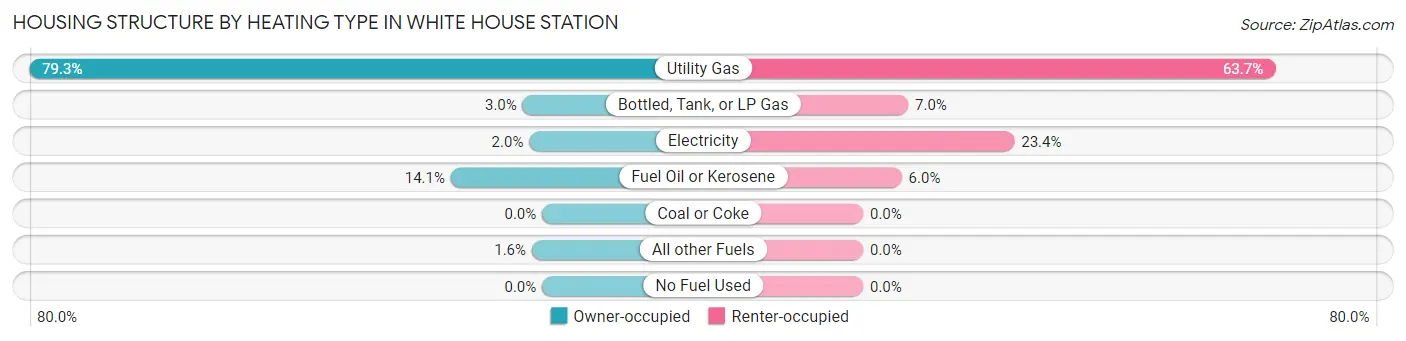
| Heating Type | Owner-occupied | Renter-occupied |
| Utility Gas | 1,158 (79.3%) | 128 (63.7%) |
| Bottled, Tank, or LP Gas | 44 (3.0%) | 14 (7.0%) |
| Electricity | 29 (2.0%) | 47 (23.4%) |
| Fuel Oil or Kerosene | 206 (14.1%) | 12 (6.0%) |
| Coal or Coke | 0 (0.0%) | 0 (0.0%) |
| All other Fuels | 23 (1.6%) | 0 (0.0%) |
| No Fuel Used | 0 (0.0%) | 0 (0.0%) |
| Total | 1,460 (100.0%) | 201 (100.0%) |
Household Vehicle Usage in White House Station
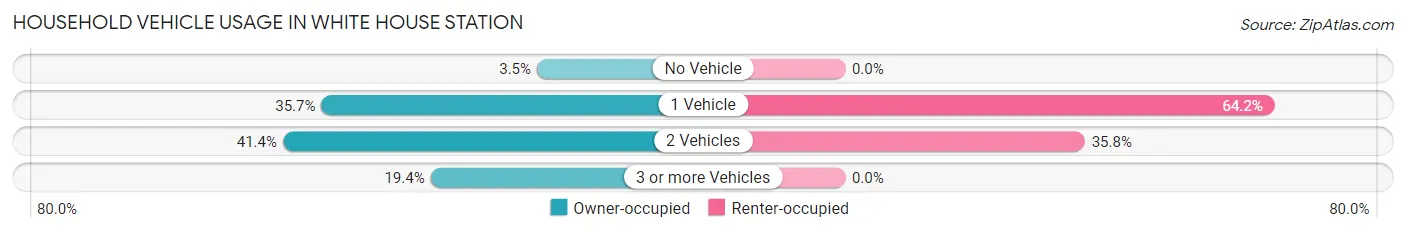
| Vehicles per Household | Owner-occupied | Renter-occupied |
| No Vehicle | 51 (3.5%) | 0 (0.0%) |
| 1 Vehicle | 521 (35.7%) | 129 (64.2%) |
| 2 Vehicles | 605 (41.4%) | 72 (35.8%) |
| 3 or more Vehicles | 283 (19.4%) | 0 (0.0%) |
| Total | 1,460 (100.0%) | 201 (100.0%) |
Real Estate & Mortgages in White House Station
Real Estate and Mortgage Overview in White House Station
| Characteristic | Without Mortgage | With Mortgage |
| Housing Units | 686 | 774 |
| Median Property Value | $366,800 | $467,700 |
| Median Household Income | $72,727 | $381 |
| Monthly Housing Costs | $1,092 | $253 |
| Real Estate Taxes | $8,811 | $0 |
Property Value by Mortgage Status in White House Station
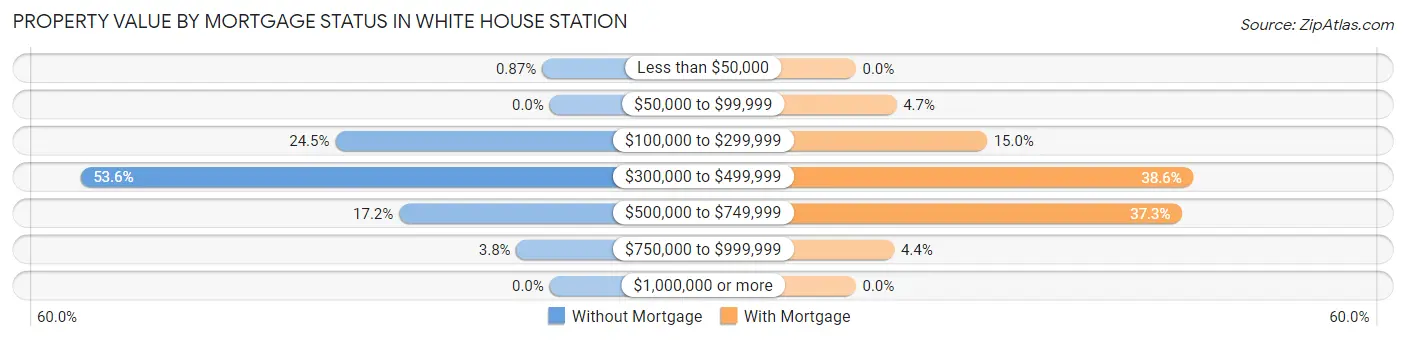
| Property Value | Without Mortgage | With Mortgage |
| Less than $50,000 | 6 (0.9%) | 0 (0.0%) |
| $50,000 to $99,999 | 0 (0.0%) | 36 (4.6%) |
| $100,000 to $299,999 | 168 (24.5%) | 116 (15.0%) |
| $300,000 to $499,999 | 368 (53.6%) | 299 (38.6%) |
| $500,000 to $749,999 | 118 (17.2%) | 289 (37.3%) |
| $750,000 to $999,999 | 26 (3.8%) | 34 (4.4%) |
| $1,000,000 or more | 0 (0.0%) | 0 (0.0%) |
| Total | 686 (100.0%) | 774 (100.0%) |
Household Income by Mortgage Status in White House Station
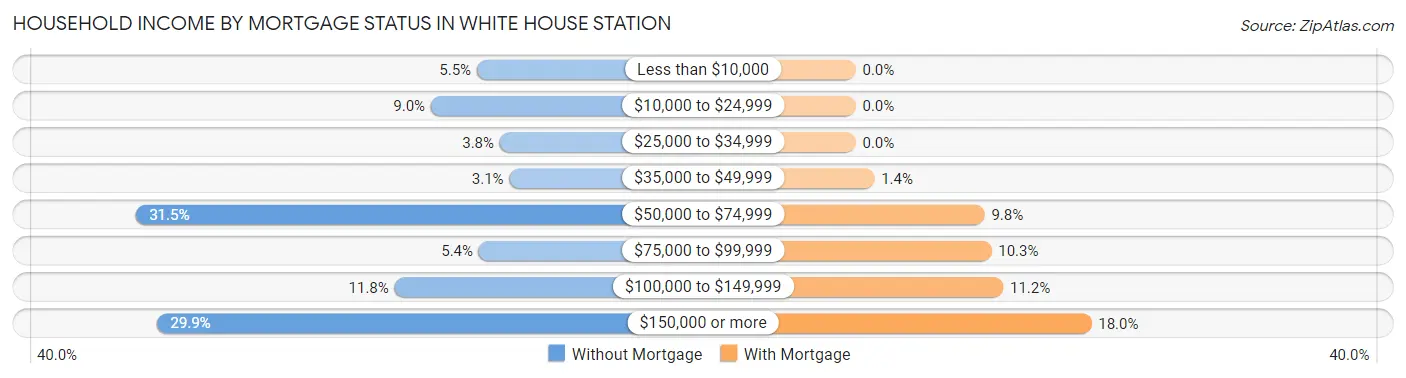
| Household Income | Without Mortgage | With Mortgage |
| Less than $10,000 | 38 (5.5%) | 0 (0.0%) |
| $10,000 to $24,999 | 62 (9.0%) | 0 (0.0%) |
| $25,000 to $34,999 | 26 (3.8%) | 0 (0.0%) |
| $35,000 to $49,999 | 21 (3.1%) | 11 (1.4%) |
| $50,000 to $74,999 | 216 (31.5%) | 76 (9.8%) |
| $75,000 to $99,999 | 37 (5.4%) | 80 (10.3%) |
| $100,000 to $149,999 | 81 (11.8%) | 87 (11.2%) |
| $150,000 or more | 205 (29.9%) | 139 (18.0%) |
| Total | 686 (100.0%) | 774 (100.0%) |
Property Value to Household Income Ratio in White House Station
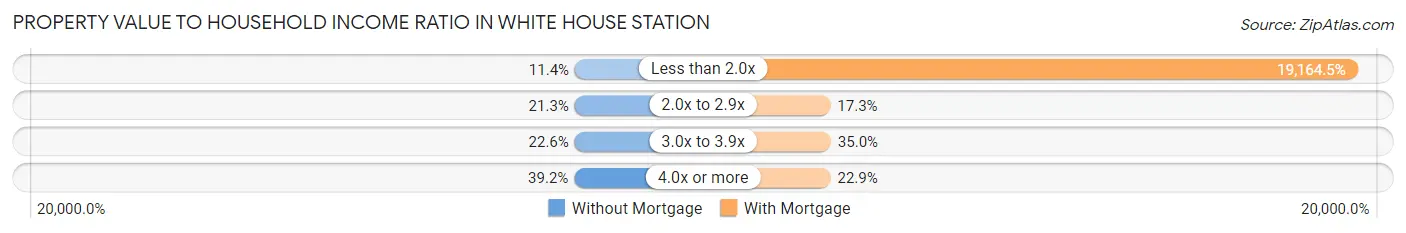
| Value-to-Income Ratio | Without Mortgage | With Mortgage |
| Less than 2.0x | 78 (11.4%) | 148,333 (19,164.5%) |
| 2.0x to 2.9x | 146 (21.3%) | 134 (17.3%) |
| 3.0x to 3.9x | 155 (22.6%) | 271 (35.0%) |
| 4.0x or more | 269 (39.2%) | 177 (22.9%) |
| Total | 686 (100.0%) | 774 (100.0%) |
Real Estate Taxes by Mortgage Status in White House Station
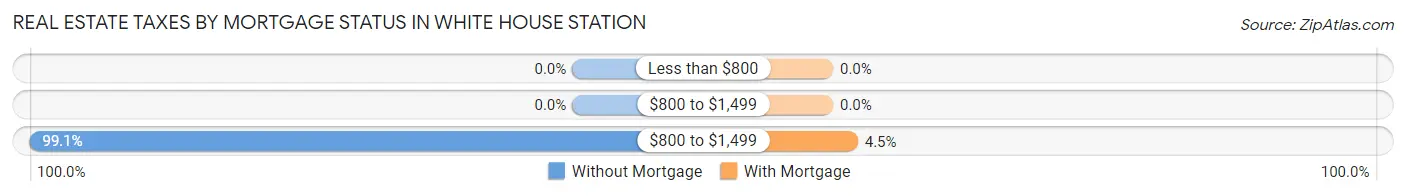
| Property Taxes | Without Mortgage | With Mortgage |
| Less than $800 | 0 (0.0%) | 0 (0.0%) |
| $800 to $1,499 | 0 (0.0%) | 0 (0.0%) |
| $800 to $1,499 | 680 (99.1%) | 35 (4.5%) |
| Total | 686 (100.0%) | 774 (100.0%) |
Health & Disability in White House Station
Health Insurance Coverage by Age in White House Station
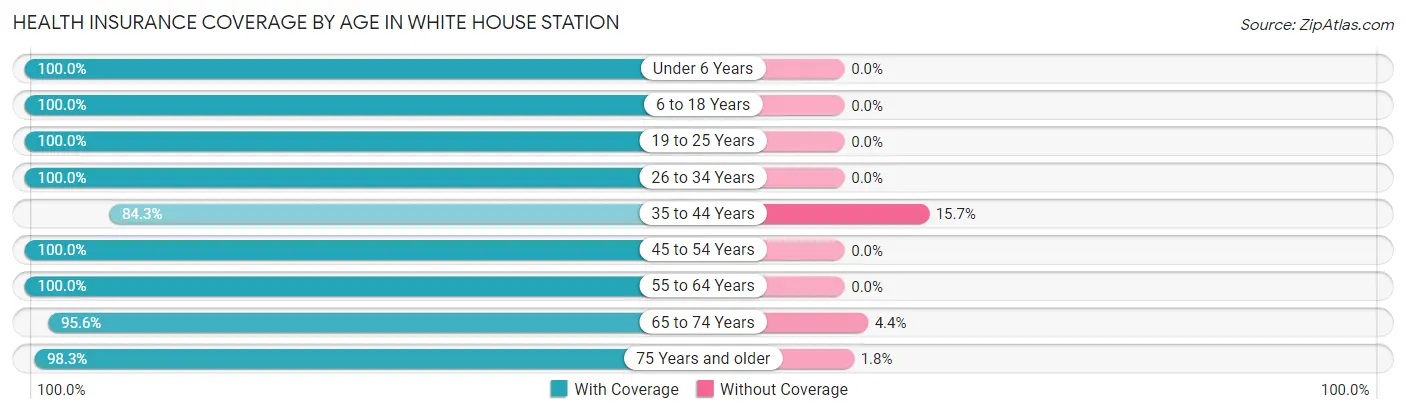
| Age Bracket | With Coverage | Without Coverage |
| Under 6 Years | 241 (100.0%) | 0 (0.0%) |
| 6 to 18 Years | 533 (100.0%) | 0 (0.0%) |
| 19 to 25 Years | 162 (100.0%) | 0 (0.0%) |
| 26 to 34 Years | 232 (100.0%) | 0 (0.0%) |
| 35 to 44 Years | 257 (84.3%) | 48 (15.7%) |
| 45 to 54 Years | 511 (100.0%) | 0 (0.0%) |
| 55 to 64 Years | 569 (100.0%) | 0 (0.0%) |
| 65 to 74 Years | 527 (95.6%) | 24 (4.4%) |
| 75 Years and older | 672 (98.3%) | 12 (1.8%) |
| Total | 3,704 (97.8%) | 84 (2.2%) |
Health Insurance Coverage by Citizenship Status in White House Station
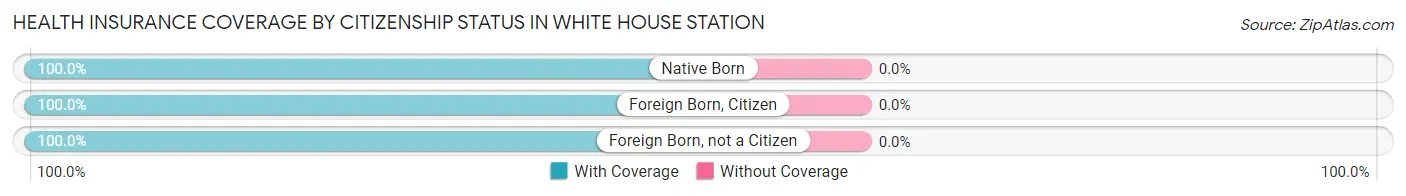
| Citizenship Status | With Coverage | Without Coverage |
| Native Born | 241 (100.0%) | 0 (0.0%) |
| Foreign Born, Citizen | 533 (100.0%) | 0 (0.0%) |
| Foreign Born, not a Citizen | 162 (100.0%) | 0 (0.0%) |
Health Insurance Coverage by Household Income in White House Station
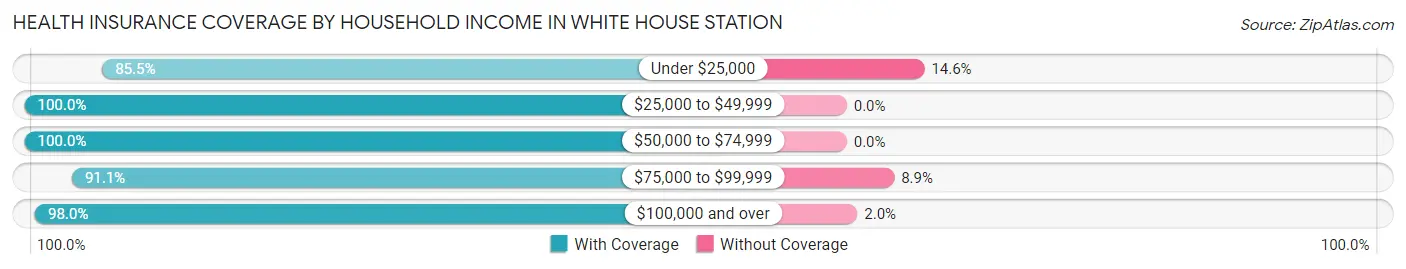
| Household Income | With Coverage | Without Coverage |
| Under $25,000 | 141 (85.5%) | 24 (14.5%) |
| $25,000 to $49,999 | 341 (100.0%) | 0 (0.0%) |
| $50,000 to $74,999 | 830 (100.0%) | 0 (0.0%) |
| $75,000 to $99,999 | 154 (91.1%) | 15 (8.9%) |
| $100,000 and over | 2,238 (98.0%) | 45 (2.0%) |
Public vs Private Health Insurance Coverage by Age in White House Station
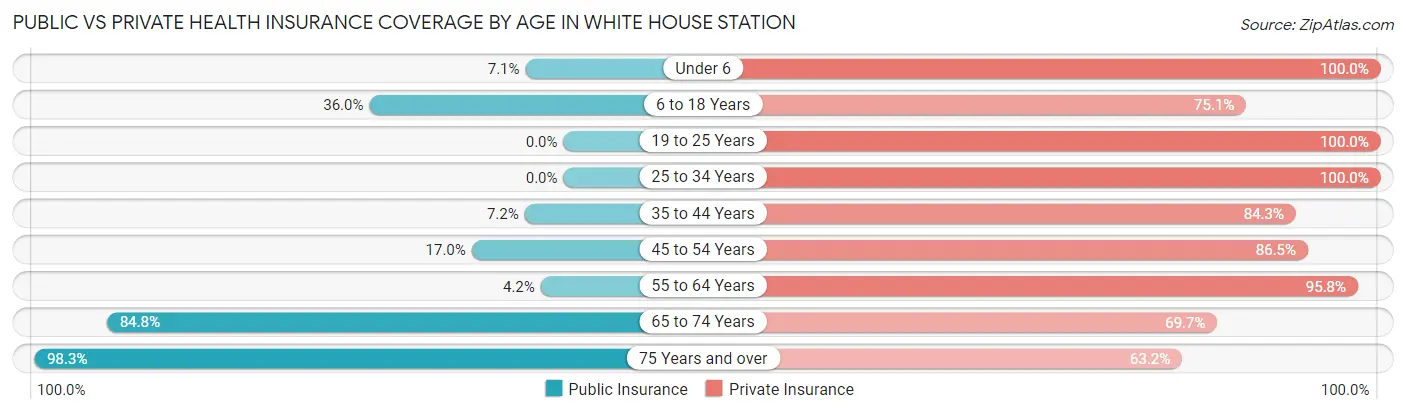
| Age Bracket | Public Insurance | Private Insurance |
| Under 6 | 17 (7.0%) | 241 (100.0%) |
| 6 to 18 Years | 192 (36.0%) | 400 (75.0%) |
| 19 to 25 Years | 0 (0.0%) | 162 (100.0%) |
| 25 to 34 Years | 0 (0.0%) | 232 (100.0%) |
| 35 to 44 Years | 22 (7.2%) | 257 (84.3%) |
| 45 to 54 Years | 87 (17.0%) | 442 (86.5%) |
| 55 to 64 Years | 24 (4.2%) | 545 (95.8%) |
| 65 to 74 Years | 467 (84.8%) | 384 (69.7%) |
| 75 Years and over | 672 (98.3%) | 432 (63.2%) |
| Total | 1,481 (39.1%) | 3,095 (81.7%) |
Disability Status by Sex by Age in White House Station
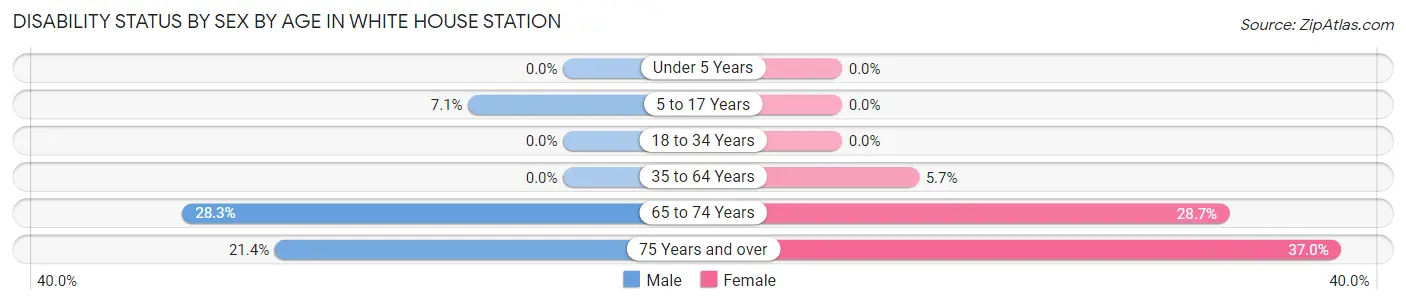
| Age Bracket | Male | Female |
| Under 5 Years | 0 (0.0%) | 0 (0.0%) |
| 5 to 17 Years | 16 (7.0%) | 0 (0.0%) |
| 18 to 34 Years | 0 (0.0%) | 0 (0.0%) |
| 35 to 64 Years | 0 (0.0%) | 42 (5.7%) |
| 65 to 74 Years | 86 (28.3%) | 71 (28.7%) |
| 75 Years and over | 73 (21.4%) | 127 (37.0%) |
Disability Class by Sex by Age in White House Station
Disability Class: Hearing Difficulty
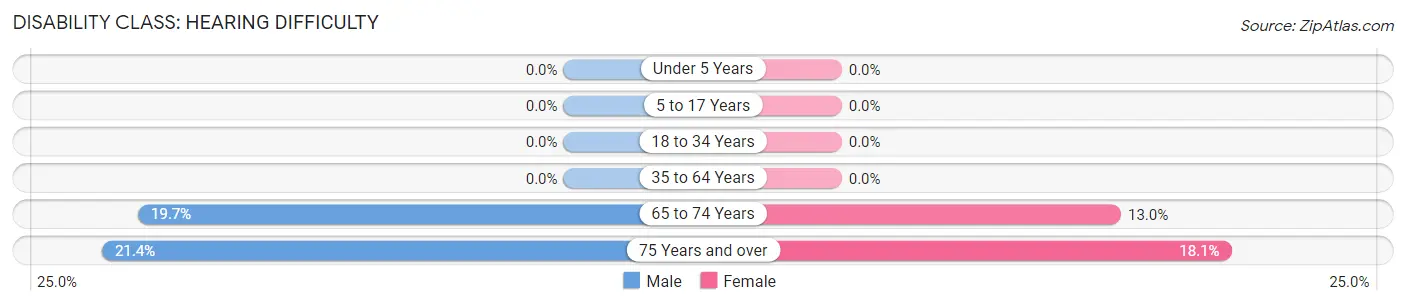
| Age Bracket | Male | Female |
| Under 5 Years | 0 (0.0%) | 0 (0.0%) |
| 5 to 17 Years | 0 (0.0%) | 0 (0.0%) |
| 18 to 34 Years | 0 (0.0%) | 0 (0.0%) |
| 35 to 64 Years | 0 (0.0%) | 0 (0.0%) |
| 65 to 74 Years | 60 (19.7%) | 32 (13.0%) |
| 75 Years and over | 73 (21.4%) | 62 (18.1%) |
Disability Class: Vision Difficulty
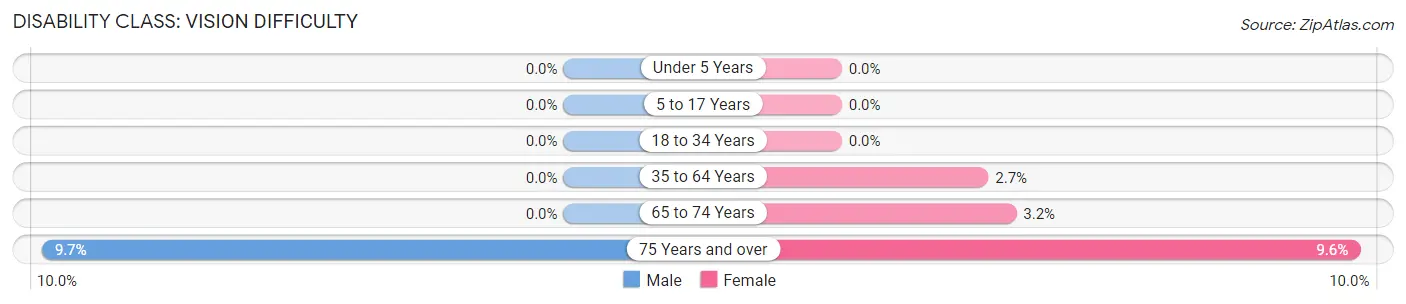
| Age Bracket | Male | Female |
| Under 5 Years | 0 (0.0%) | 0 (0.0%) |
| 5 to 17 Years | 0 (0.0%) | 0 (0.0%) |
| 18 to 34 Years | 0 (0.0%) | 0 (0.0%) |
| 35 to 64 Years | 0 (0.0%) | 20 (2.7%) |
| 65 to 74 Years | 0 (0.0%) | 8 (3.2%) |
| 75 Years and over | 33 (9.7%) | 33 (9.6%) |
Disability Class: Cognitive Difficulty
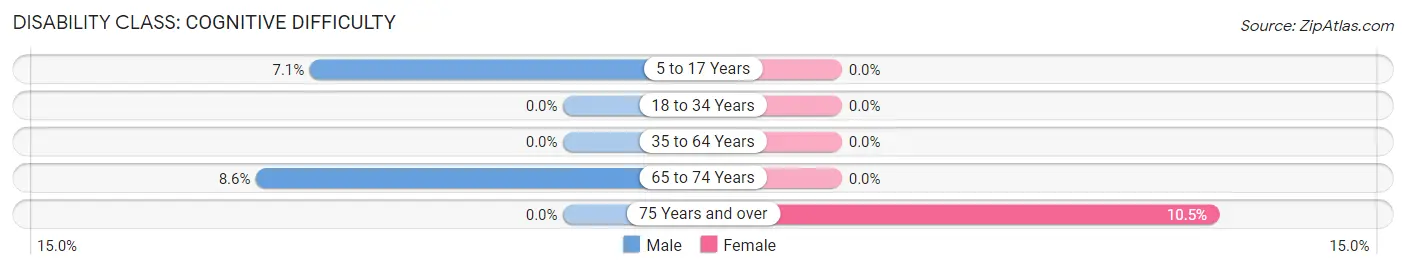
| Age Bracket | Male | Female |
| 5 to 17 Years | 16 (7.0%) | 0 (0.0%) |
| 18 to 34 Years | 0 (0.0%) | 0 (0.0%) |
| 35 to 64 Years | 0 (0.0%) | 0 (0.0%) |
| 65 to 74 Years | 26 (8.6%) | 0 (0.0%) |
| 75 Years and over | 0 (0.0%) | 36 (10.5%) |
Disability Class: Ambulatory Difficulty
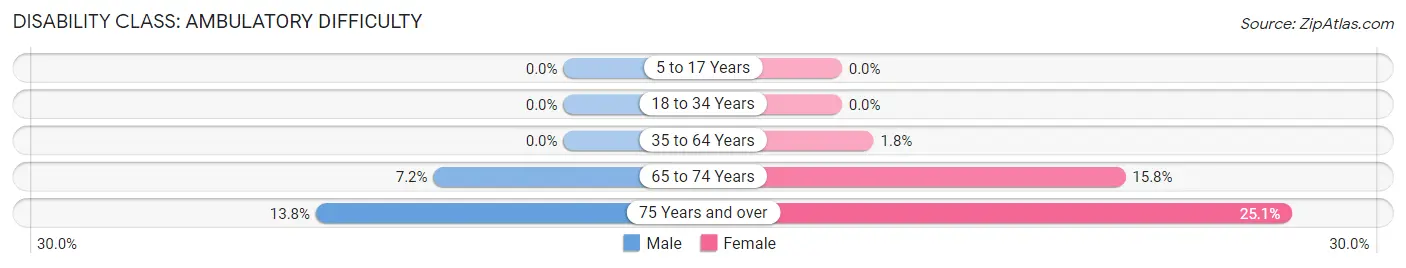
| Age Bracket | Male | Female |
| 5 to 17 Years | 0 (0.0%) | 0 (0.0%) |
| 18 to 34 Years | 0 (0.0%) | 0 (0.0%) |
| 35 to 64 Years | 0 (0.0%) | 13 (1.8%) |
| 65 to 74 Years | 22 (7.2%) | 39 (15.8%) |
| 75 Years and over | 47 (13.8%) | 86 (25.1%) |
Disability Class: Self-Care Difficulty
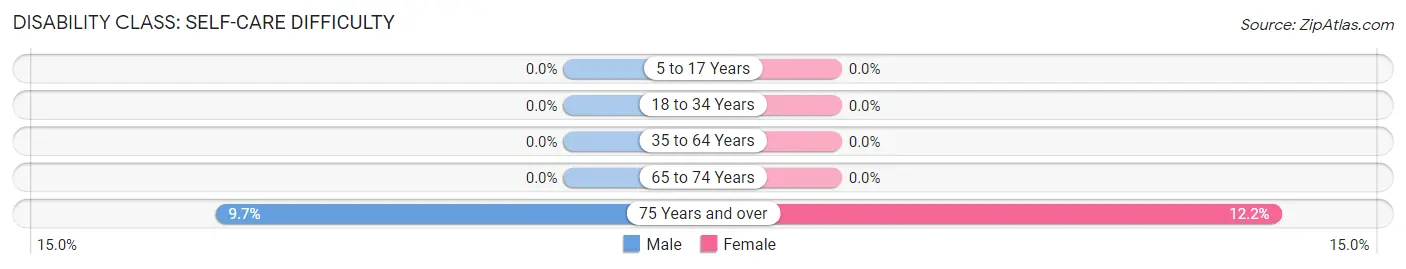
| Age Bracket | Male | Female |
| 5 to 17 Years | 0 (0.0%) | 0 (0.0%) |
| 18 to 34 Years | 0 (0.0%) | 0 (0.0%) |
| 35 to 64 Years | 0 (0.0%) | 0 (0.0%) |
| 65 to 74 Years | 0 (0.0%) | 0 (0.0%) |
| 75 Years and over | 33 (9.7%) | 42 (12.2%) |
Technology Access in White House Station
Computing Device Access in White House Station
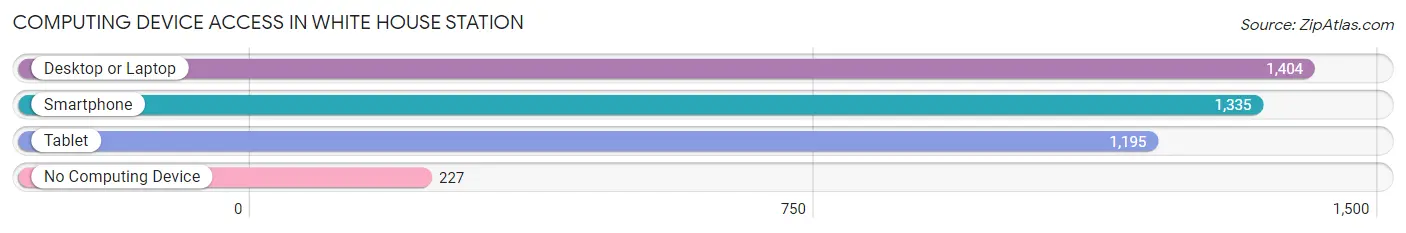
| Device Type | # Households | % Households |
| Desktop or Laptop | 1,404 | 84.5% |
| Smartphone | 1,335 | 80.4% |
| Tablet | 1,195 | 71.9% |
| No Computing Device | 227 | 13.7% |
| Total | 1,661 | 100.0% |
Internet Access in White House Station
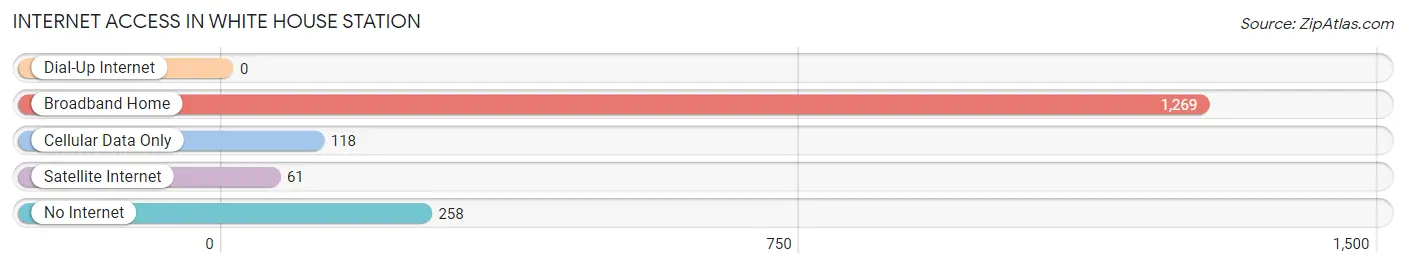
| Internet Type | # Households | % Households |
| Dial-Up Internet | 0 | 0.0% |
| Broadband Home | 1,269 | 76.4% |
| Cellular Data Only | 118 | 7.1% |
| Satellite Internet | 61 | 3.7% |
| No Internet | 258 | 15.5% |
| Total | 1,661 | 100.0% |
White House Station Summary
White House Station is an unincorporated community located in Readington Township, Hunterdon County, New Jersey. It is situated along the banks of the Whitehouse Brook, a tributary of the South Branch of the Raritan River. The area is known for its rural character and is home to a variety of businesses, including a winery, a farm, and a golf course.
History
White House Station was first settled in the late 1700s by Dutch and German immigrants. The area was originally known as "Whitehouse" and was named after the Whitehouse family, who owned a large tract of land in the area. The name was later changed to White House Station when a post office was established in the area in 1851.
The area was primarily agricultural until the late 19th century, when the Central Railroad of New Jersey built a station in the area. This allowed for the development of a small commercial district, which included a general store, a blacksmith shop, and a hotel. The area also became a popular destination for summer vacationers, who would come to enjoy the rural atmosphere and the nearby Raritan River.
Geography
White House Station is located in Readington Township, Hunterdon County, New Jersey. It is situated along the banks of the Whitehouse Brook, a tributary of the South Branch of the Raritan River. The area is characterized by rolling hills and open fields, with the Whitehouse Brook running through the center of the community.
The area is located approximately 25 miles west of New York City and is easily accessible via Interstate 78 and Route 22. The nearest major airport is Newark Liberty International Airport, which is located approximately 40 miles away.
Economy
White House Station is primarily a residential community, but it is also home to a variety of businesses, including a winery, a farm, and a golf course. The area is also home to a number of small businesses, including restaurants, retail stores, and professional services.
Demographics
As of the 2010 census, White House Station had a population of 1,845. The racial makeup of the area was 94.3% White, 1.2% African American, 0.2% Native American, 1.7% Asian, 0.1% Pacific Islander, and 2.5% from other races. Hispanic or Latino of any race were 5.2% of the population.
The median household income in White House Station was $90,917, and the median family income was $103,917. The per capita income was $41,917. About 2.3% of families and 3.2% of the population were below the poverty line.
Common Questions
What is the Total Population of White House Station?
Total Population of White House Station is 3,788.
What is the Total Male Population of White House Station?
Total Male Population of White House Station is 1,793.
What is the Total Female Population of White House Station?
Total Female Population of White House Station is 1,995.
What is the Ratio of Males per 100 Females in White House Station?
There are 89.87 Males per 100 Females in White House Station.
What is the Ratio of Females per 100 Males in White House Station?
There are 111.27 Females per 100 Males in White House Station.
What is the Median Population Age in White House Station?
Median Population Age in White House Station is 53.3 Years.
What is the Average Family Size in White House Station
Average Family Size in White House Station is 2.8 People.
What is the Average Household Size in White House Station
Average Household Size in White House Station is 2.3 People.
What is Per Capita Income in White House Station?
Per Capita income in White House Station is $60,291.
What is the Median Family Income in White House Station?
Median Family Income in White House Station is $146,776.
What is the Median Household income in White House Station?
Median Household Income in White House Station is $104,155.
What is Income or Wage Gap in White House Station?
Income or Wage Gap in White House Station is 49.6%.
Women in White House Station earn 50.4 cents for every dollar earned by a man.
What is Inequality or Gini Index in White House Station?
Inequality or Gini Index in White House Station is 0.42.
How Large is the Labor Force in White House Station?
There are 1,860 People in the Labor Forcein in White House Station.
What is the Percentage of People in the Labor Force in White House Station?
55.8% of People are in the Labor Force in White House Station.
What is the Unemployment Rate in White House Station?
Unemployment Rate in White House Station is 10.4%.